highway wildlife mitigation opportunities
TRANSCRIPT
Highway Wildlife Mitigation Opportunities
for the Trans-Canada Highway in the Bow River Valley
by
Tracy Lee1, Anthony P. Clevenger
2 and Robert J. Ament
2
1Miistakis Institute
2500 University Drive NW Calgary, AB. T2N 1N4
and
2Western Transportation Institute
College of Engineering, Montana State University
P.O. Box 174250, Bozeman, MT 59717-4250
December 12, 2012

Highway Mitigation Opportunities in the Bow Valley
DISCLAIMER
The contents of this report reflect the views of the authors, who are responsible for the facts and
accuracy of the data presented herein. The contents do not necessarily reflect the official policies
of the Western Transportation Institute (WTI), Montana State University (MSU) or the Miistakis
Institute, University of Calgary.
This report does not constitute a standard, specification, or regulation.
ACKNOWLEDGEMENTS
The authors of this report would like to thank Alberta Ecotrust Foundation for its trust
responsibilities for the G8 Funds and their disbursement. In addition, we would like to thank Jon
Jorgenson and Scott Jevons from Alberta Environment and Sustainable Resource Development
and Melanie Percy from Alberta Parks for providing wildlife-vehicle collision data from 1998-
2010.
Cover photo credit: Rob Ament/WTI
This document should be cited as:
[Lee T, Clevenger, AP and RJ Ament. 2012. Highway wildlife mitigation opportunities for the
TransCanada Highway in the Bow Valley. Report to Alberta Ecotrust Foundation, Calgary,
Alberta.]
Highway Mitigation Opportunities in the Bow Valley
TECHNICAL DOCUMENTATION
1. Report No.
N/A
2. Government Accession No.
N/A
3. Recipient's Catalog No.
N/A
4. Title and Subtitle
Highway Wildlife Mitigation Opportunities for the Trans-Canada Highway in
the Bow River Valley
5. Report Date
August 2012
6. Performing Organization Code
7. Author(s)
Tracy Lee, Anthony P. Clevenger and Robert J. Ament
8. Performing Organization Report No.
N/A
9. Performing Organization Name and Address
Western Transportation Institute
Montana State University
P.O. Box 174250
Bozeman, MT 59717-4250
10. Work Unit No. (TRAIS)
N/A
11. Contract or Grant No.
12. Sponsoring Agency Name and Address
Alberta Ecotrust – G8 Legacy Grant
13. Type of Report and Period Covered
Research report, April 2011 – August 2012
14. Sponsoring Agency Code
N/A
15. Supplementary Notes
A PDF version of this report is available from WTI's website at www.westerntransportationinstitute.org
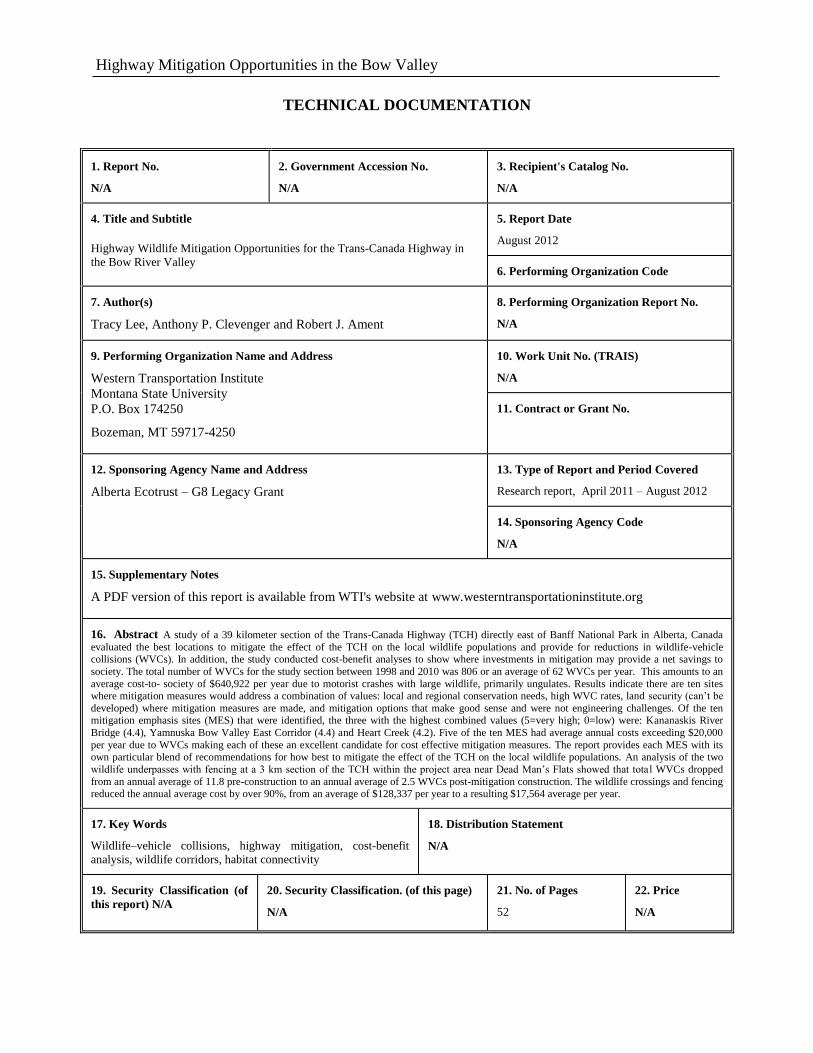
16. Abstract A study of a 39 kilometer section of the Trans-Canada Highway (TCH) directly east of Banff National Park in Alberta, Canada
evaluated the best locations to mitigate the effect of the TCH on the local wildlife populations and provide for reductions in wildlife-vehicle collisions (WVCs). In addition, the study conducted cost-benefit analyses to show where investments in mitigation may provide a net savings to
society. The total number of WVCs for the study section between 1998 and 2010 was 806 or an average of 62 WVCs per year. This amounts to an
average cost-to- society of $640,922 per year due to motorist crashes with large wildlife, primarily ungulates. Results indicate there are ten sites where mitigation measures would address a combination of values: local and regional conservation needs, high WVC rates, land security (can’t be
developed) where mitigation measures are made, and mitigation options that make good sense and were not engineering challenges. Of the ten mitigation emphasis sites (MES) that were identified, the three with the highest combined values (5=very high; 0=low) were: Kananaskis River
Bridge (4.4), Yamnuska Bow Valley East Corridor (4.4) and Heart Creek (4.2). Five of the ten MES had average annual costs exceeding $20,000
per year due to WVCs making each of these an excellent candidate for cost effective mitigation measures. The report provides each MES with its own particular blend of recommendations for how best to mitigate the effect of the TCH on the local wildlife populations. An analysis of the two
wildlife underpasses with fencing at a 3 km section of the TCH within the project area near Dead Man’s Flats showed that tota l WVCs dropped
from an annual average of 11.8 pre-construction to an annual average of 2.5 WVCs post-mitigation construction. The wildlife crossings and fencing reduced the annual average cost by over 90%, from an average of $128,337 per year to a resulting $17,564 average per year.
17. Key Words
Wildlife–vehicle collisions, highway mitigation, cost-benefit
analysis, wildlife corridors, habitat connectivity
18. Distribution Statement
N/A
19. Security Classification (of
this report) N/A
20. Security Classification. (of this page)
N/A
21. No. of Pages
52
22. Price
N/A

Highway Mitigation Opportunities in the Bow Valley
TABLE OF CONTENTS
1. Introduction ..............................................................................................................................9
2. Study Area ..............................................................................................................................10
3. Wildlife Corridors and Ecological Connectivity ....................................................................11
3.1. Ecological Effects of Roads ........................................................................................... 11
3.2. Ecological Connectivity ................................................................................................. 12
3.3. Climate Change .............................................................................................................. 12
3.4. New Direction and Emphases for Highway Mitigation ................................................. 13
4. Wildlife-Vehicle Collision Assessment ..................................................................................15
4.1. Data Analysis Methodologies ........................................................................................ 17
4.1.1. Mortality Clusters ................................................................................................... 17
4.2. Results ............................................................................................................................ 17
4.2.1. Annual Rate of WVCs Along the TCH .................................................................. 17
4.2.2. High Collision Zones Along the TCH .................................................................... 18
5. Mitigation Emphasis Sites ......................................................................................................19
5.1. Locations of Mitigation Emphasis Sites......................................................................... 19
5.2. Prioritizing Mitigation Emphasis Sites .......................................................................... 22
5.2.1. Results ..................................................................................................................... 23
6. Costs of Wildlife-Vehicle Collisions with Large Ungulates ..................................................25
6.1. Costs of Wildlife Vehicle Collisions for the Ten Mitigation Emphasis Sites ................ 25
6.2. Costs of Wildlife-Vehicle Collisions for the Project Area ............................................. 27
7. Mitigation Success Story: The Dead Man’s Flats Underpass ................................................28
7.1.1. WVCs Pre- and Post-construction around the Dead Man’s Flats Wildlife Underpass
Structure and Fencing ........................................................................................................... 28
7.1.2. Results ..................................................................................................................... 29
8. Cost Effectiveness of Mitigation Measures ............................................................................31
9. Recommendations for the Ten Mitigation Emphasis Sites ....................................................32
9.1. Mitigation Measures ....................................................................................................... 32
9.2. Recommended Mitigation Measures .............................................................................. 34
10. References ..............................................................................................................................39
11. Appendix A: Wildlife Vehicle Collision Data Clean Up Documentation ..............................42
12. Appendix B: Mitigation Emphasis Site Summaries ................................................................44

Highway Mitigation Opportunities in the Bow Valley
LIST OF TABLES
Table 1: Sources of wildlife-vehicle collision data for the project area. ...................................... 16
Table 2: Relative values of each mitigation emphasis site in the project area, between 0 (low) and
5 (high). ................................................................................................................................. 24
Table 3: Average costs of wildlife-vehicle collisions for 3 common ungulates (from Huijser et al.
2009). .................................................................................................................................... 25
Table 4: Average annual wildlife-vehicle collision rates for each kilometer of the TransCanada
Highway within the project area (each mitigation emphasis site is highlighted in yellow). 26
Table 5: Average annual costs of ungulate-vehicle collisions at the ten mitigation emphasis sites
on the TransCanada Highway within the project area. ......................................................... 27
Table 6: Annual rates of wildlife-vehicle collisions by species and costs of ungulate-vehicle
collisions on thirty-nine kilometers of the TransCanada Highway within the project area.. 28
Table 7: Costs of ungulate-vehicle collisions (UVCs) before and after construction of a wildlife
underpass and fencing of the TransCanada Highway at Dead Man’s Flats. ........................ 31
Table 8: Effectiveness, cost threshold values, and deer-vehicle collision rates to meet or exceed
those cost effectiveness thresholds (adapted from Huijser et al. 2009). ............................... 32
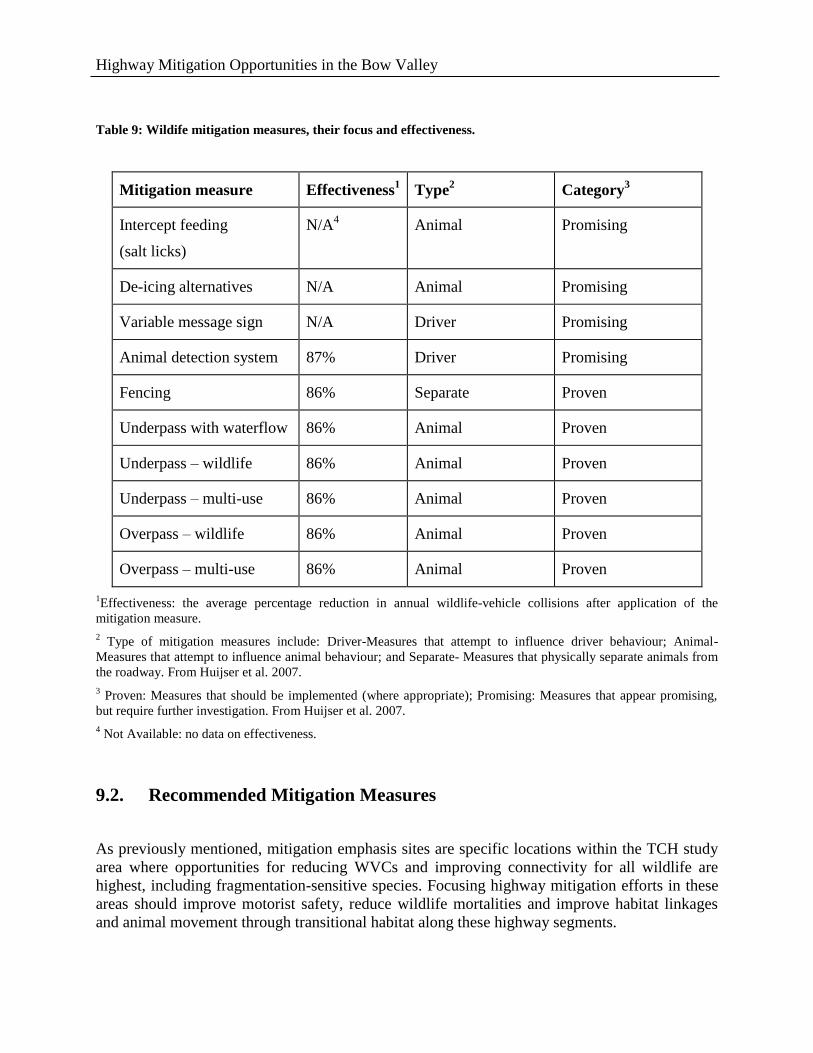
Table 9: Wildife mitigation measures, their focus and effectiveness. .......................................... 34
Highway Mitigation Opportunities in the Bow Valley Executive Summary
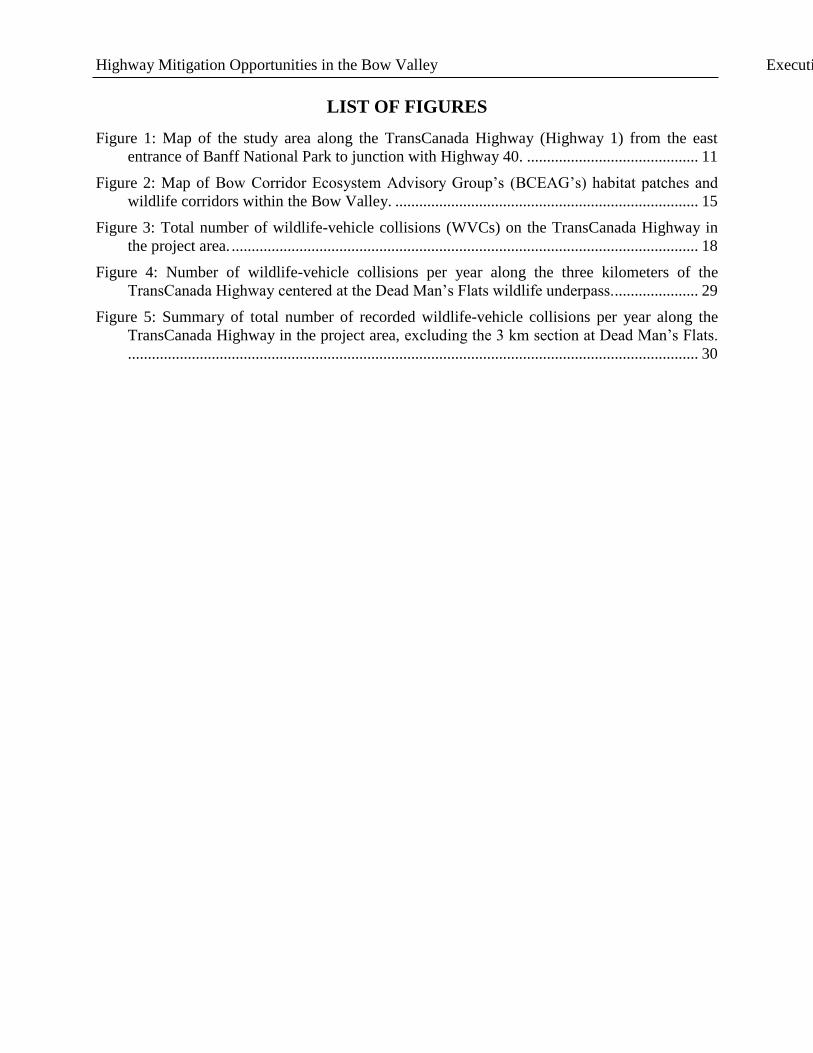
LIST OF FIGURES
Figure 1: Map of the study area along the TransCanada Highway (Highway 1) from the east
entrance of Banff National Park to junction with Highway 40. ........................................... 11
Figure 2: Map of Bow Corridor Ecosystem Advisory Group’s (BCEAG’s) habitat patches and
wildlife corridors within the Bow Valley. ............................................................................ 15
Figure 3: Total number of wildlife-vehicle collisions (WVCs) on the TransCanada Highway in
the project area. ..................................................................................................................... 18
Figure 4: Number of wildlife-vehicle collisions per year along the three kilometers of the
TransCanada Highway centered at the Dead Man’s Flats wildlife underpass. ..................... 29
Figure 5: Summary of total number of recorded wildlife-vehicle collisions per year along the
TransCanada Highway in the project area, excluding the 3 km section at Dead Man’s Flats.
............................................................................................................................................... 30

Highway Mitigation Opportunities in the Bow Valley Executive Summary
EXECUTIVE SUMMARY
The portion of the Trans-Canada Highway (TCH) east of Banff National Park in the Bow River
Valley of Alberta is a key access point to the mountain parks of the Canadian Rockies. It also
connects Calgary to the various local communities and the Stoney Indian Reserve situated in the
surrounding foothills and mountains of this part of the province. The area is rich in wildlife, from
carnivores such as black and grizzly bears to a wide variety of ungulates – bighorn sheep, elk,
deer and moose – as well as many other smaller mammals. The exurban growth of residences
and businesses in the Bow Valley, increased tourism, and the shipping of goods and services
over the TCH combine to create high traffic volumes, noise, artificial lighting and other man-
made factors that may make it a deadly gauntlet for wildlife to cross and a potential barrier for
their movement. This project sought to evaluate the study area’s wildlife needs: wildlife
corridors, high wildlife-vehicle collision (WVC) zones, and the best locations to place highway
mitigation measures. In addition, the study conducted a cost-benefit analysis to show where
investments in mitigation may provide a net savings to society.
Within the study area, the 39 kilometer (km) section directly east of the Park, only two
underpasses with wildlife fencing have been constructed to mitigate 3 km of the TCH in the
Dead Man’s Flats area. Thus, most of the study area has not been mitigated for wildlife. Lessons
from the TCH within Banff National Park which has received extensive wildlife mitigation
measures - overpasses, underpasses, connecting wildlife proof fencing, and escape ramps (jump
outs) for wildlife trapped on the highway side of the fence – has demonstrated it is possible to
reduce annual WVC rates by over 80 percent while at the same time providing safe passage for
all large and medium-sized wildlife species for their migration and movement needs. This
provides local information on the types and effectiveness of wildlife mitigation measures for the
project area.
Within the 39 km project area, results indicate there are 10 sites where mitigation measures
would address a combination of values: local and regional conservation needs, high WVC rates,
land security (can’t be developed) where mitigation measures are made, and highway mitigation
options make good sense and were not engineering challenges. Of the 10 mitigation emphasis
sites (MES) that were identified and assessed the three with the highest combined values (5=
very high; 0=low) were: Kananaskis River Bridge (4.4), Yamnuska Bow Valley East Corridor
(4.4) and Heart Creek (4.2).
The total number of WVCs for the 39 km study section between 1998 and 2010 were 806 or 62
WVCs per year. This amounts to an average cost of $640,922 per year for this segment of the
TCH due to motorist crashes with wildlife. Of the ten MES, average annual WVCs varied from a
low of 0.31 per year on the kilometer of road surrounding the Kananaskis River Bridge MES to a
high of 4.62 WVCs per year on the kilometer of road at the Yamnuska Bow Valley East Corridor
MES. These annual average WVC rates equate to annual costs to society between a low of
$2,051 to a high of $48,118. Five of the ten MES had average annual costs exceeding $20,000
per year making each of these an excellent candidate for cost effective mitigation measures.

Highway Mitigation Opportunities in the Bow Valley Executive Summary
An analysis was possible to evaluate the effectiveness and costs savings of the two underpasses
with fencing at Dead Man’s Flats that have been constructed within the project area. WVC data
was available at the location for six years, both pre- and post-construction. Total WVCs dropped
from an annual average of 11.8 pre-construction to a six year annual average of 2.5 WVCs post-
mitigation construction. From a cost-to-society perspective, mitigation reduced the annual
average cost by over 90%, from an $128,337 average per year to a resulting $17,564 average per
year. This 3 km section of the highway within the project area provides local evidence of the
effectiveness and cost benefit potential for the ten MES in this study. Last, this report provides
for each MES its own particular blend of recommendations for how best to mitigate the effect of
the TCH on local wildlife populations.
Highway Mitigation Opportunities in the Bow Valley
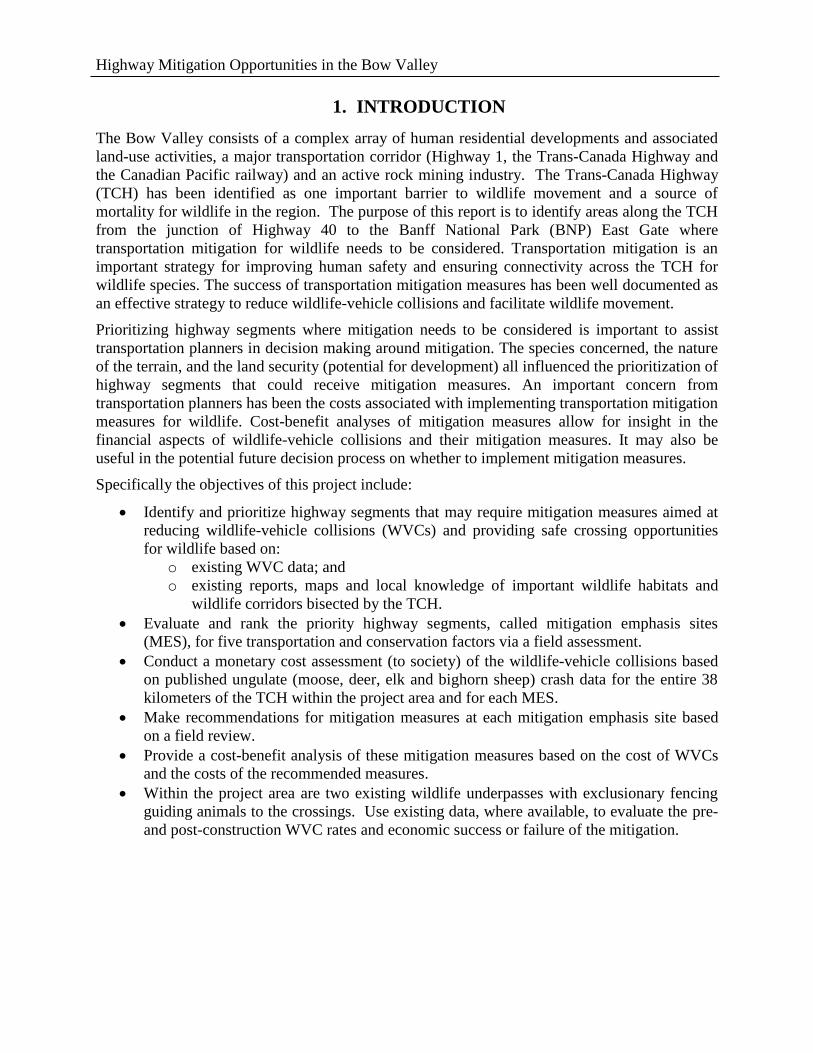
1. INTRODUCTION
The Bow Valley consists of a complex array of human residential developments and associated
land-use activities, a major transportation corridor (Highway 1, the Trans-Canada Highway and
the Canadian Pacific railway) and an active rock mining industry. The Trans-Canada Highway
(TCH) has been identified as one important barrier to wildlife movement and a source of
mortality for wildlife in the region. The purpose of this report is to identify areas along the TCH
from the junction of Highway 40 to the Banff National Park (BNP) East Gate where
transportation mitigation for wildlife needs to be considered. Transportation mitigation is an
important strategy for improving human safety and ensuring connectivity across the TCH for
wildlife species. The success of transportation mitigation measures has been well documented as
an effective strategy to reduce wildlife-vehicle collisions and facilitate wildlife movement.
Prioritizing highway segments where mitigation needs to be considered is important to assist
transportation planners in decision making around mitigation. The species concerned, the nature
of the terrain, and the land security (potential for development) all influenced the prioritization of
highway segments that could receive mitigation measures. An important concern from
transportation planners has been the costs associated with implementing transportation mitigation
measures for wildlife. Cost-benefit analyses of mitigation measures allow for insight in the
financial aspects of wildlife-vehicle collisions and their mitigation measures. It may also be
useful in the potential future decision process on whether to implement mitigation measures.
Specifically the objectives of this project include:
Identify and prioritize highway segments that may require mitigation measures aimed at
reducing wildlife-vehicle collisions (WVCs) and providing safe crossing opportunities
for wildlife based on:
o existing WVC data; and
o existing reports, maps and local knowledge of important wildlife habitats and
wildlife corridors bisected by the TCH.
Evaluate and rank the priority highway segments, called mitigation emphasis sites
(MES), for five transportation and conservation factors via a field assessment.
Conduct a monetary cost assessment (to society) of the wildlife-vehicle collisions based
on published ungulate (moose, deer, elk and bighorn sheep) crash data for the entire 38
kilometers of the TCH within the project area and for each MES.
Make recommendations for mitigation measures at each mitigation emphasis site based
on a field review.
Provide a cost-benefit analysis of these mitigation measures based on the cost of WVCs
and the costs of the recommended measures.
Within the project area are two existing wildlife underpasses with exclusionary fencing
guiding animals to the crossings. Use existing data, where available, to evaluate the pre-
and post-construction WVC rates and economic success or failure of the mitigation.
Highway Mitigation Opportunities in the Bow Valley
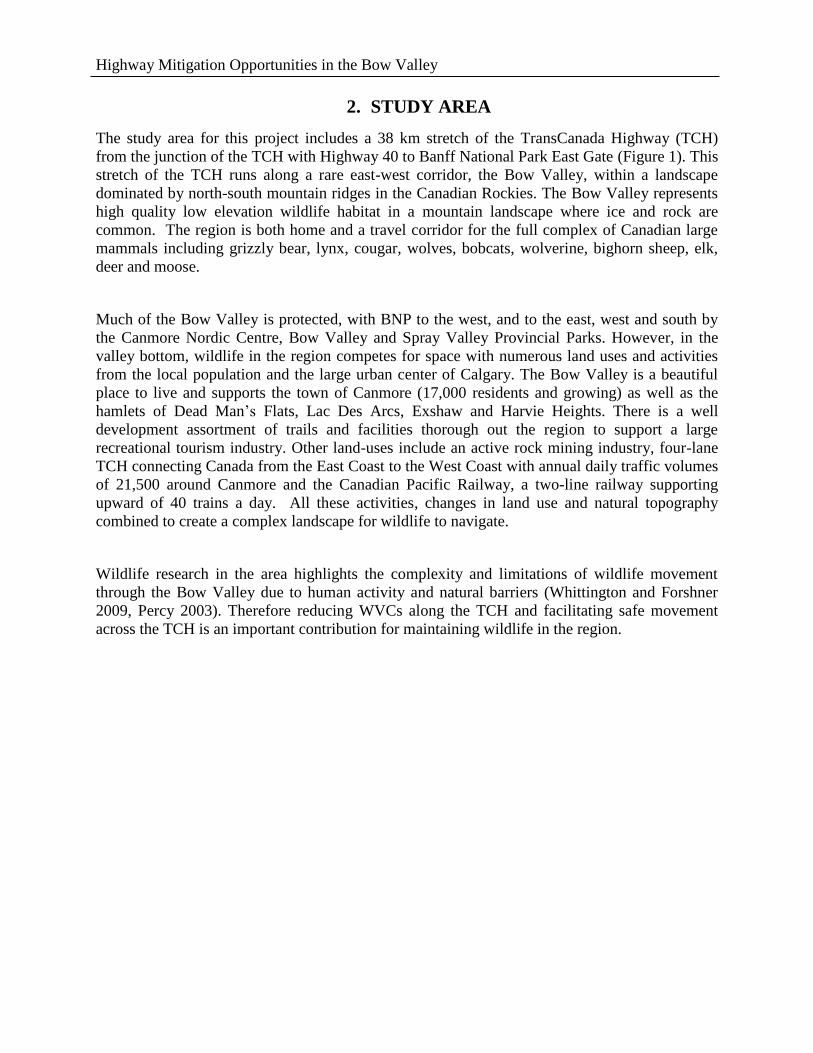
2. STUDY AREA
The study area for this project includes a 38 km stretch of the TransCanada Highway (TCH)
from the junction of the TCH with Highway 40 to Banff National Park East Gate (Figure 1). This
stretch of the TCH runs along a rare east-west corridor, the Bow Valley, within a landscape
dominated by north-south mountain ridges in the Canadian Rockies. The Bow Valley represents
high quality low elevation wildlife habitat in a mountain landscape where ice and rock are
common. The region is both home and a travel corridor for the full complex of Canadian large
mammals including grizzly bear, lynx, cougar, wolves, bobcats, wolverine, bighorn sheep, elk,
deer and moose.
Much of the Bow Valley is protected, with BNP to the west, and to the east, west and south by
the Canmore Nordic Centre, Bow Valley and Spray Valley Provincial Parks. However, in the
valley bottom, wildlife in the region competes for space with numerous land uses and activities
from the local population and the large urban center of Calgary. The Bow Valley is a beautiful
place to live and supports the town of Canmore (17,000 residents and growing) as well as the
hamlets of Dead Man’s Flats, Lac Des Arcs, Exshaw and Harvie Heights. There is a well
development assortment of trails and facilities thorough out the region to support a large
recreational tourism industry. Other land-uses include an active rock mining industry, four-lane
TCH connecting Canada from the East Coast to the West Coast with annual daily traffic volumes
of 21,500 around Canmore and the Canadian Pacific Railway, a two-line railway supporting
upward of 40 trains a day. All these activities, changes in land use and natural topography
combined to create a complex landscape for wildlife to navigate.
Wildlife research in the area highlights the complexity and limitations of wildlife movement
through the Bow Valley due to human activity and natural barriers (Whittington and Forshner
2009, Percy 2003). Therefore reducing WVCs along the TCH and facilitating safe movement
across the TCH is an important contribution for maintaining wildlife in the region.
Highway Mitigation Opportunities in the Bow Valley
Figure 1: Map of the study area along the TransCanada Highway (Highway 1) from the east entrance of
Banff National Park to junction with Highway 40.
3. WILDLIFE CORRIDORS AND ECOLOGICAL CONNECTIVITY
3.1. Ecological Effects of Roads
Roads have increasingly fragmented North America’s landscapes over the last 100 years (Ritters
and Wickham 2003) and constitute one of the greatest threats to maintaining landscape
connectivity and conservation of biodiversity. The primary effects of roads on wildlife include
habitat loss, degradation and fragmentation; direct mortality; and road avoidance behaviors
(Forman and Alexander 1998). Further, wildlife-vehicle collisions affect the safety of drivers and
are costly to society (Huijser et al. 2007, Huijser et al. 2009).
Wildlife populations using areas adjacent to roads face increased mortality risk due to collisions
with vehicles (Mumme et al. 2000). A national study identified 21 federally listed threatened or
endangered animals in the U.S. for which road mortality is among the major threats to the
survival of the species (Huijser et al. 2007).
Adverse road effects are amplified with increasing road size (Fahrig et al. 1995, Lovallo and
Anderson 1996), speed limits (Gunther 2000), and traffic volume (Seiler 2003, Waller and
Servheen 2005). For every kilometer of highway construction, an estimated 644 hectares of land
Highway Mitigation Opportunities in the Bow Valley
is converted from its original vegetative cover or made available for further development,
resulting in a significant loss of habitat to wildlife (Wolf 1981).
3.2. Ecological Connectivity
There is increasing concern about the reduction in connectivity for wildlife across roads.
Ecological connectivity is a fundamental principle in the conservation of wildlife, ecosystems,
and the native biodiversity they comprise (Crooks and Sanjayan 2006). In a general sense, all
animal and plant populations are shaped by, exist and persist because of spatial connections.
Habitat connections are needed for mobile animals to move through and survive within resident
home ranges. At broader scales, landscape linkages allow individuals to move among core
habitat areas, providing stability to regional populations and allowing range peripheries to be
occupied through periodic or continual augmentation. The resulting genetic flow across large
connected populations also contributes to localized adaptability to a changing environment and
helps to ensure that only genes beneficial to individual fitness are expressed. Although
ecological connectivity is nebulous without definition as pertaining to species, habitats, spatial
and temporal scales, thresholds and risk, the notion of connectivity is nonetheless central to
effective conservation planning.
In some parts of North America, roads are an obstacle to maintaining ecological connectivity and
may pose a threat to the long-term persistence of key wildlife populations (Noss et al. 1996,
Sweanor et al. 2000, Gibbs and Shriver 2002, Epps et al. 2005), and may significantly affect
wildlife population demographics (Gibbs and Steen 2005). The habitat fragmentation effects of
roads can isolate wildlife populations unwilling or unable to cross roads (Gerlach et al. 2000). It
comes as little surprise that the ecological effects of roads are gaining more attention among
transportation agencies, land managers, local decision makers and the general public. Today road
networks continue to expand and there are increasing public and political concerns regarding
transport, ecology, quality of life, and local communities.
Ecological connectivity at a landscape scale is becoming increasingly important in the face of a
changing climate (da Fonseca et al. 2005, Heller and Zavaleta 2009). Local-scale corridors such
as wildlife crossing structures may play an important role in allowing animals to adapt and
respond to a warming climate. Highway mitigation measures that facilitate connectivity and
dispersal for fragmentation-sensitive species is needed to ensure local-scale habitat linkages will
be able to mitigate continental-scale bottlenecks (Crooks and Sanjayan 2006, Hilty et al. 2006).
3.3. Climate Change
Climate change adds to the cumulative impacts on natural systems and wildlife populations by
exacerbating the negative effects of habitat loss, degradation, and fragmentation. Local climate
disruptions are changing long-term patterns of fire, drought, and flood, as well as seasonal
patterns of precipitation and temperature. To adapt and survive, many wildlife species will need
to adjust their home ranges and movement patterns. In many cases, fragmentation will impede
such adaptation, potentially resulting in isolated wildlife populations that will be highly
vulnerable to extirpation or extinction.
Highway Mitigation Opportunities in the Bow Valley
Scientific reviews of the best strategies to protect biodiversity highlight the importance of
maintaining landscape connectivity to assure species can move in reaction to climate induced
changes (Mawdsley et al. 2009). Another review of 25 years of published literature points out
that the most common recommendation to protect biodiversity in the face of climate change was
to increase connectivity (Heller and Zavaleta 2009). Lastly, in their review of wildlife corridor
studies, Gilbert-Norton et al. (2010) found that corridors increase movement between habitat
patches by approximately 50% compared to patches that are not connected with corridors.
Maintaining permeable highways will support animal movement as species seek locales that
contain the conditions for which they are adapted. Conserving corridors and maintaining safe
wildlife movement is not only strategic and climate smart, but a proven method of allowing
wildlife to respond to environmental challenges. Since highway mitigation infrastructure is
designed to exist for 50 to 75 years, mitigation measures that are implemented today increase
the probability for animals to successfully adjust to changing environmental conditions far in to
the future.
A better understanding is needed to properly mitigate the adverse effects that busy roads exert
upon local wildlife populations. This information is important for planning and designing
wildlife mitigation measures for specific locations to reduce mortality. Equally important is for
highways to maintain their permeability for wildlife to facilitate a species’ and a population’s
ability to move and adapt to changing environmental or climatic conditions.
3.4. New Direction and Emphases for Highway Mitigation
Most highway wildlife mitigation is focused on providing for the safety of motorists, i.e.,
addressing problematic wildlife-vehicle collisions areas along highways. As a result, most data
collected by transportation agencies are reports on collisions with large mammals, primarily
ungulates – deer, Odocoileus sp.; elk, Cervus elaphus; moose, Alces alces and Rocky Mountain
bighorn sheep, Ovis canadensis. Since the mission of federal and provincial highway agencies
focuses on speed, safety and efficiency; the need to provide for the conservation of wildlife is
often an ancillary focus to their primary mission.
However, much progress has been made in the past decade as federal and provincial agencies
incorporate ecological connectivity into highway projects. The most famous example is
immediately west of the project area in BNP. Over 30 years ago, safety and logistical
considerations compelled planners to upgrade the TCH within BNP from 2 to 4 lanes (i.e.,
twinning), beginning from the eastern boundary of the park and working west (Clevenger and
Waltho 2000; McGuire and Morrall 2000).
In each phase, large mammals were excluded from the road with a 2.4-m-high fence erected on
both sides of the highway. Underpasses were also built to allow wildlife to cross the road. The
first 27 km of highway twinning included 11 wildlife underpasses and was completed by 1988.
The next 18 km section was completed in late 1997 with 10 additional wildlife underpasses and
Highway Mitigation Opportunities in the Bow Valley
two wildlife overpasses (Ford et al. 2010). The final 38 km of twinning to the western park
boundary at the Continental Divide and British Columbia-Alberta border will be completed in
2013 and consist of 21 additional wildlife crossing structures, including four 60-m wide wildlife
overpasses.
Mitigation efforts during the last 25 years have helped restore habitat connectivity across large
sections of this major transportation corridor. The measures have been effective at reducing
highway-related mortality of large mammals (Clevenger et al. 2001), contributing to dispersal
and gene flow among grizzly (Ursus arctos) and black bears (U. americanus; Sawaya 2012) and
provided evidence-based guidelines for future crossing structure designs in BNP and elsewhere
(Clevenger and Waltho 2000, 2005; Clevenger and Huijser 2011).
Another example, the I-90 Snoqualmie Pass East Project, an expansion of an interstate highway
in the Cascade Mountains by the Washington State Department of Transportation, has included a
desired ecological condition that “requires reducing risks of road-related mortality of wildlife,
improving the permeability of the highway for all organisms, and providing for the long-term
sustainability of populations in the area” (Clevenger et al. 2008).
This project focused on the provincial section of the TCH east of Banff National Park’s
boundary. It used wildlife-vehicle collision data as a chief consideration to select mitigation
emphasis sites. However, it also used data and maps of wildlife movement across the TCH and
other wildlife information to aid in the selection of wildlife mitigation emphasis sites (MESs).
Thus, this project has evaluated both wildlife conservation needs and motorist safety needs.to
select where mitigation measures should be considered.
3.5 Connectivity in the Bow Valley
To determine where wildlife connectivity is important along the TCH, we used the existing
wildlife corridors and habitat patches developed by the Bow Corridor Ecosystem Advisory
Group (BCEAG) (Figure 2) (BCEAG 1998). In addition, the following reports were considered
when identifying the location of MES;
Whittington, J. and A. Forshner. 2009. An analysis of wildlife snow tracking, winter
transect, and highway underpass data in the eastern Bow Valley. 27pp.
Heuer K. and T. Lee. 2010. Private land conservation opportunities in the Bow Valley.
Prepared for the Yellowstone to Yukon Conservation Initiative (Y2Y), Bow Valley Land
Conservancy and Nature Conservancy of Canada. Y2Y offices, Canmore, AB.
Golder Associates. 2002. Final report: assessment of wildlife corridors within in DC site
1, DC site 3, and District R. Prepared for Three Sisters Resort, Inc. and the Town of
Canmore.
Lee, T., Managh, S. and N. Darlow 2010. Spatial-temporal patterns of wildlife
distribution and movement in Canmore’s benchland corridor. Prepared for Alberta
Tourism, Parks and Recreation, Canmore, Alberta.

Highway Mitigation Opportunities in the Bow Valley
Figure 2: Map of Bow Corridor Ecosystem Advisory Group’s (BCEAG’s) habitat patches and wildlife
corridors within the Bow Valley.
4. WILDLIFE-VEHICLE COLLISION ASSESSMENT
In this section we highlight the current state of knowledge of wildlife-vehicle collisions (WVCs)
along the TCH from the junction with Highway 40 to BNP’s East Gate. We identify highway
segments (units are in one kilometer sections) where there are high numbers of WVCs. This
information was one aspect that was used to help select the highway segments where mitigation
should be considered, the project uses the term mitigation emphasis site (MES) for these ten
areas.
One of the complexities of quantifying the rate of wildlife mortality from collisions with vehicles
along the TCH is the lack of a systematic and standardized data collection system. The data used
in this analysis is from 1998-2010, and was acquired from four sources; Table 1 describes the
different data collection systems and the years in which the data was collected using these
different systems. Each dataset is described in more detail in Appendix A. In addition many of
the records where not confirmed by Alberta Environment and Sustainable Resource
Development (AESRD) staff and the accuracy of the location is therefore unknown.
Highway Mitigation Opportunities in the Bow Valley
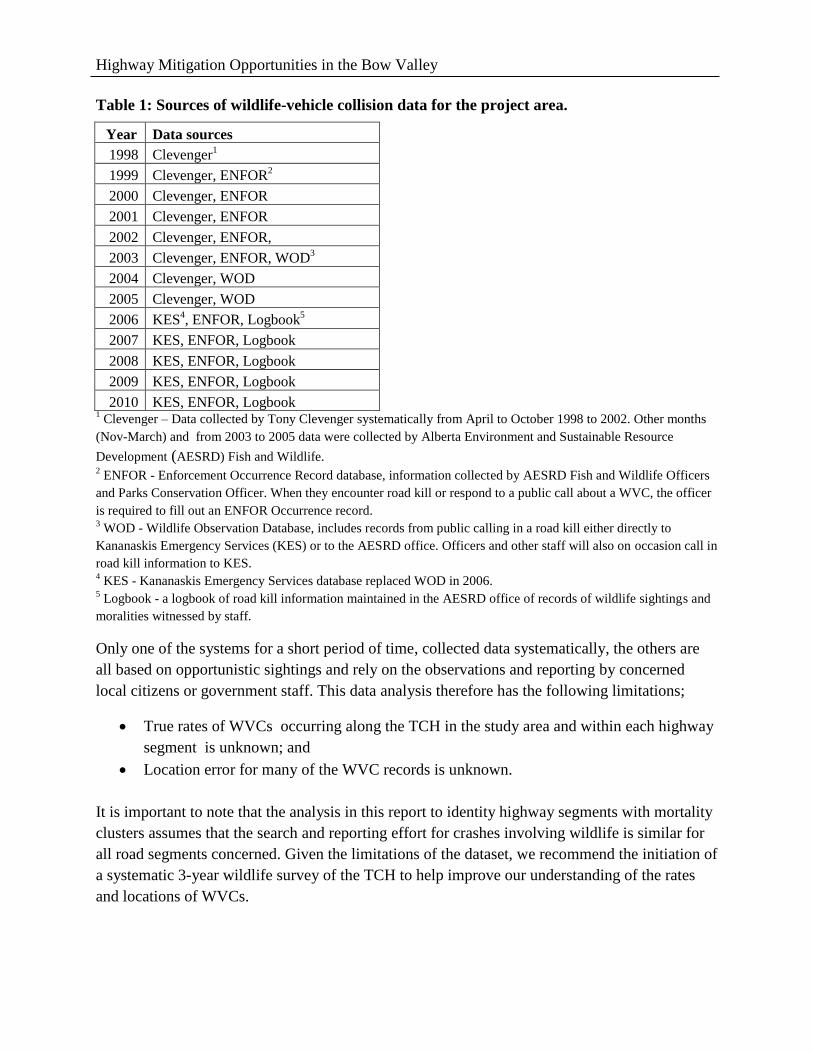
Table 1: Sources of wildlife-vehicle collision data for the project area.
Year Data sources
1998 Clevenger1
1999 Clevenger, ENFOR2
2000 Clevenger, ENFOR
2001 Clevenger, ENFOR
2002 Clevenger, ENFOR,
2003 Clevenger, ENFOR, WOD3
2004 Clevenger, WOD
2005 Clevenger, WOD
2006 KES4, ENFOR, Logbook
5
2007 KES, ENFOR, Logbook
2008 KES, ENFOR, Logbook
2009 KES, ENFOR, Logbook
2010 KES, ENFOR, Logbook 1 Clevenger – Data collected by Tony Clevenger systematically from April to October 1998 to 2002. Other months
(Nov-March) and from 2003 to 2005 data were collected by Alberta Environment and Sustainable Resource
Development (AESRD) Fish and Wildlife. 2 ENFOR - Enforcement Occurrence Record database, information collected by AESRD Fish and Wildlife Officers
and Parks Conservation Officer. When they encounter road kill or respond to a public call about a WVC, the officer
is required to fill out an ENFOR Occurrence record. 3 WOD - Wildlife Observation Database, includes records from public calling in a road kill either directly to
Kananaskis Emergency Services (KES) or to the AESRD office. Officers and other staff will also on occasion call in
road kill information to KES. 4 KES - Kananaskis Emergency Services database replaced WOD in 2006.
5 Logbook - a logbook of road kill information maintained in the AESRD office of records of wildlife sightings and
moralities witnessed by staff.
Only one of the systems for a short period of time, collected data systematically, the others are
all based on opportunistic sightings and rely on the observations and reporting by concerned
local citizens or government staff. This data analysis therefore has the following limitations;
True rates of WVCs occurring along the TCH in the study area and within each highway
segment is unknown; and
Location error for many of the WVC records is unknown.
It is important to note that the analysis in this report to identity highway segments with mortality
clusters assumes that the search and reporting effort for crashes involving wildlife is similar for
all road segments concerned. Given the limitations of the dataset, we recommend the initiation of
a systematic 3-year wildlife survey of the TCH to help improve our understanding of the rates
and locations of WVCs.
Highway Mitigation Opportunities in the Bow Valley
4.1. Data Analysis Methodologies
Data was provided by Alberta Environment and Sustainable Resource Development (AESRD),
Fish and Wildlife and Alberta Parks in 2 datasets; 1998-2005 and 2006-2010. The data sets were
cleaned (duplicates removed and locations added) by AESRD or Alberta Parks personal. Further
cleaning and merging of the datasets for this project are described in Appendix A.
Data was processed to generate the average number of WVCs for this 38 km stretch of TCH, as
well for each species including both known and unknown locations. These numbers (known and
unknown) were used to calculate an annual rate of WVCs, species involved in WVCs and a
conservative estimate of the total costs of ungulate vehicle collisions for this the section of the
TCH in the project area.
4.1.1. Mortality Clusters
To identify highway segments where WVCs mortality clusters occur, the TCH was divided into
one kilometer (km) segments. Known WVC location data was enumerated to each km section
along TCH. A moving window approach was used to calculate a mortality value for each
segment, where by each segment was equated to a sum of itself and its two neighbouring
segments. Therefore, the wildlife mortality value was representative of a 3-km long section
“moving window”.
Mortality values were classified using a quintile approach, whereby segments with zero were
removed from the analysis and segments with mortality values were categorized into percentiles
where “very high” represents the 81-100 percentile (top 20% of WVCs), “high” represents the
61-80 percentile and “medium” are WVC annual rates within the 41-60 percentile.
The method to identify mortality clusters is simply based on identifying the highway segments
that have the highest frequency of wildlife-vehicle crashes. The mortality clusters that are
identified do not necessarily meet a national standard or provincial norm. The procedure
described above only identifies the road sections with most wildlife vehicle collisions for the
highway segments along the TCH included in the analysis. Wildlife-vehicle collisions also occur
outside of the mortality clusters, but less frequently.
4.2. Results
4.2.1. Annual Rate of WVCs Along the TCH
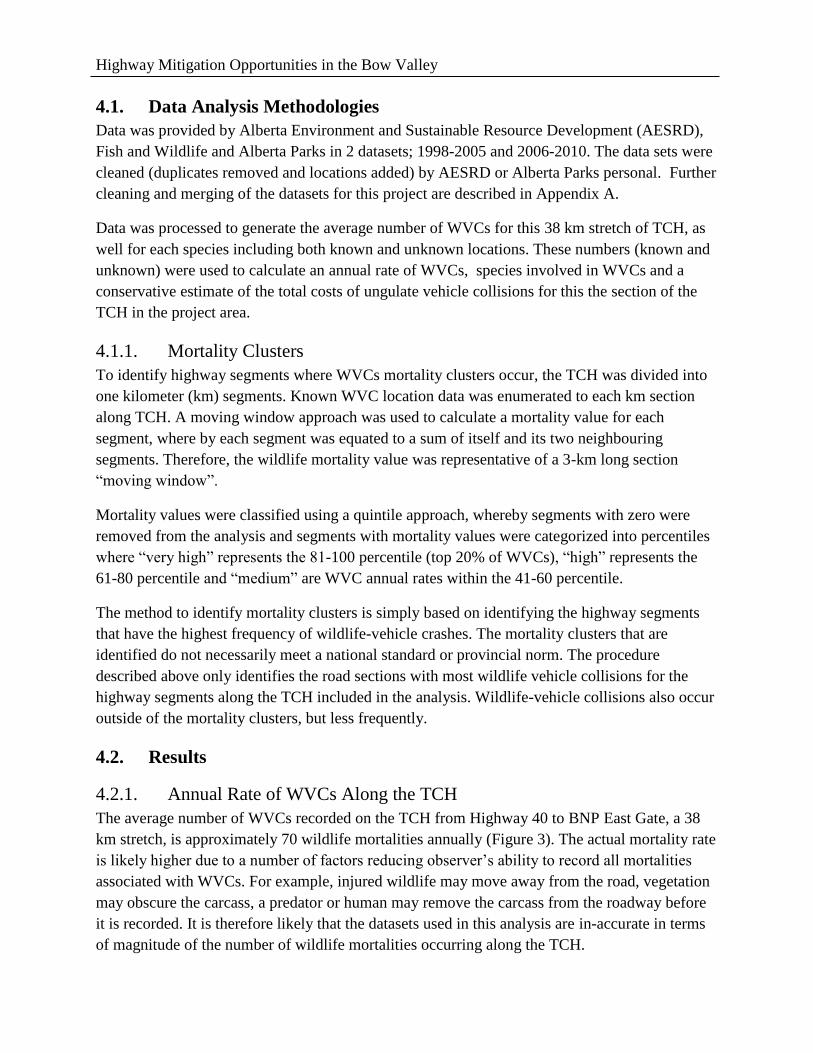
The average number of WVCs recorded on the TCH from Highway 40 to BNP East Gate, a 38
km stretch, is approximately 70 wildlife mortalities annually (Figure 3). The actual mortality rate
is likely higher due to a number of factors reducing observer’s ability to record all mortalities
associated with WVCs. For example, injured wildlife may move away from the road, vegetation
may obscure the carcass, a predator or human may remove the carcass from the roadway before
it is recorded. It is therefore likely that the datasets used in this analysis are in-accurate in terms
of magnitude of the number of wildlife mortalities occurring along the TCH.
Highway Mitigation Opportunities in the Bow Valley
Figure 3: Total number of wildlife-vehicle collisions (WVCs) on the TransCanada Highway in the project
area.
Wildlife vehicle collisions with large mammals predominately involve deer (58%) and elk (33%)
and to a lesser extent moose (2%), bighorn sheep (2%), black bear (4%) and cougars (1%).
4.2.2. High Collision Zones Along the TCH
The identification of highway segments (1-km in length) classified into percentiles of very high,
high and medium wildlife mortality rates are displayed in Figure 4. Along the TCH, seven
kilometers of the highway were classified as very high mortality clusters, representing 18% of
the study area, while 15 km of the highway were classified as high mortality clusters and
represented 22% of the Highway in the study area (Figure 4).
It is difficult to compare the rates of WVCs along this section of the TCH with other areas in the
province of Alberta’s transportation system due to inconsistencies in data collection across the
province. Alberta Transportation may want to consider developing a consistent data collection
methodology for the province that would enable a review of the very high to medium wildlife
vehicle collision zones from a provincial perspective and enable planners and decision makers to
better prioritize transportation mitigation strategies across the province. Only highway segments
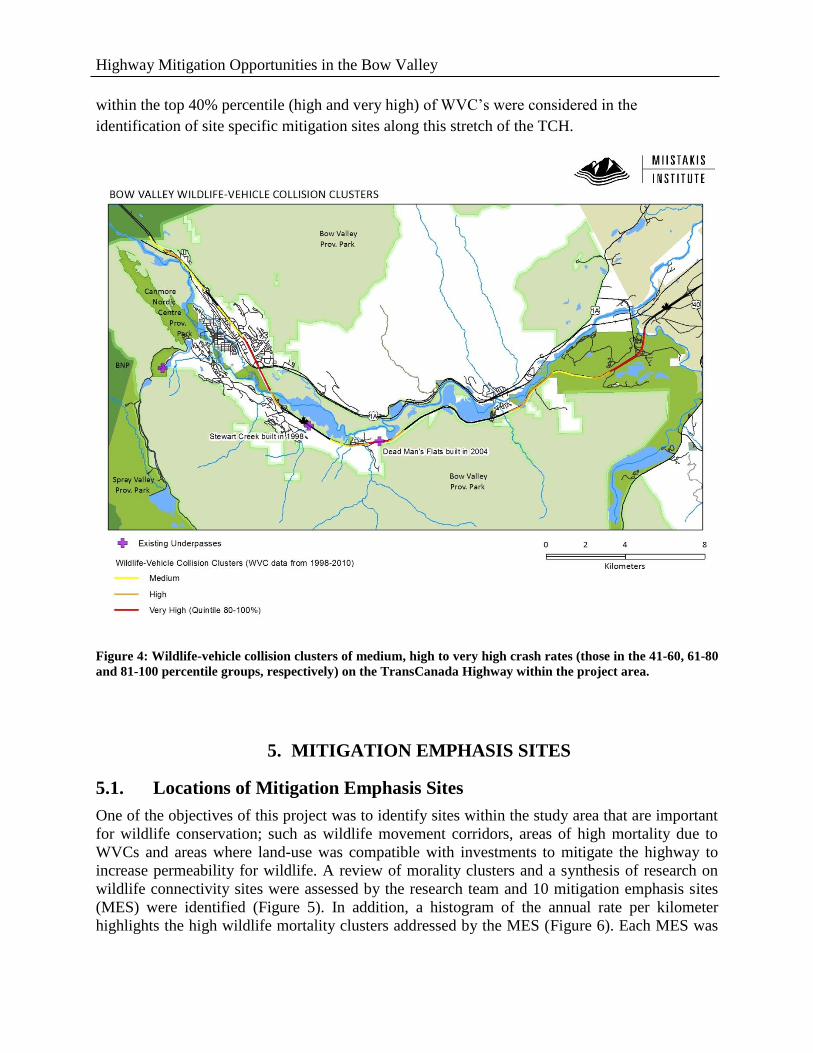
Highway Mitigation Opportunities in the Bow Valley
within the top 40% percentile (high and very high) of WVC’s were considered in the
identification of site specific mitigation sites along this stretch of the TCH.
Figure 4: Wildlife-vehicle collision clusters of medium, high to very high crash rates (those in the 41-60, 61-80
and 81-100 percentile groups, respectively) on the TransCanada Highway within the project area.
5. MITIGATION EMPHASIS SITES
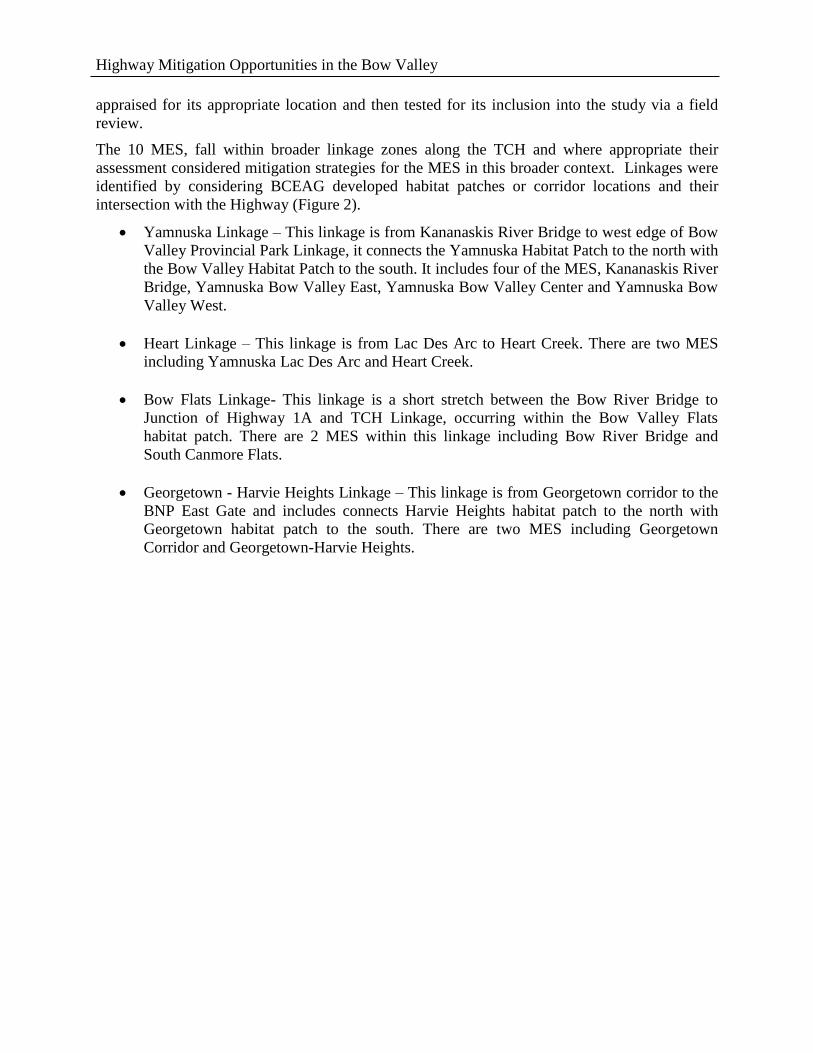
5.1. Locations of Mitigation Emphasis Sites
One of the objectives of this project was to identify sites within the study area that are important
for wildlife conservation; such as wildlife movement corridors, areas of high mortality due to
WVCs and areas where land-use was compatible with investments to mitigate the highway to
increase permeability for wildlife. A review of morality clusters and a synthesis of research on
wildlife connectivity sites were assessed by the research team and 10 mitigation emphasis sites
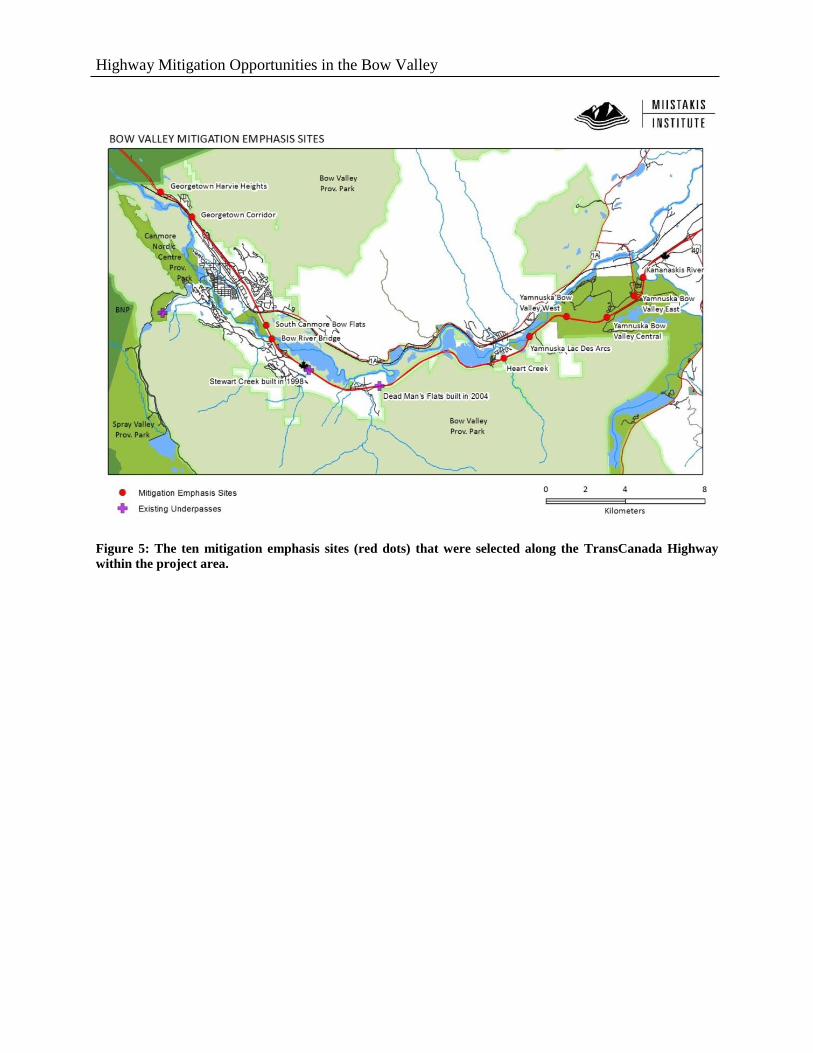
(MES) were identified (Figure 5). In addition, a histogram of the annual rate per kilometer
highlights the high wildlife mortality clusters addressed by the MES (Figure 6). Each MES was
Highway Mitigation Opportunities in the Bow Valley
appraised for its appropriate location and then tested for its inclusion into the study via a field
review.
The 10 MES, fall within broader linkage zones along the TCH and where appropriate their
assessment considered mitigation strategies for the MES in this broader context. Linkages were
identified by considering BCEAG developed habitat patches or corridor locations and their
intersection with the Highway (Figure 2).
Yamnuska Linkage – This linkage is from Kananaskis River Bridge to west edge of Bow
Valley Provincial Park Linkage, it connects the Yamnuska Habitat Patch to the north with
the Bow Valley Habitat Patch to the south. It includes four of the MES, Kananaskis River
Bridge, Yamnuska Bow Valley East, Yamnuska Bow Valley Center and Yamnuska Bow
Valley West.
Heart Linkage – This linkage is from Lac Des Arc to Heart Creek. There are two MES
including Yamnuska Lac Des Arc and Heart Creek.
Bow Flats Linkage- This linkage is a short stretch between the Bow River Bridge to
Junction of Highway 1A and TCH Linkage, occurring within the Bow Valley Flats
habitat patch. There are 2 MES within this linkage including Bow River Bridge and
South Canmore Flats.
Georgetown - Harvie Heights Linkage – This linkage is from Georgetown corridor to the
BNP East Gate and includes connects Harvie Heights habitat patch to the north with
Georgetown habitat patch to the south. There are two MES including Georgetown
Corridor and Georgetown-Harvie Heights.
Highway Mitigation Opportunities in the Bow Valley
Figure 5: The ten mitigation emphasis sites (red dots) that were selected along the TransCanada Highway
within the project area.
Highway Mitigation Opportunities in the Bow Valley
Figure 6: Annual rate of wildlife-vehicle collisions per one kilometer segments on the TransCanada Highway
(TCH), from its junction with Highway 40 to Banff National Park’s (BNP) East Gate (right edge is the
junction of Highway 40 with the TCH and the left edge is BNP East Gate). The underpasses already
developed along the TCH are depicted in light grey. 1MES: mitigation emphasis site;
2km: kilometer;
3TCH:
TransCanada Highway; 4WVCs: wildlife-vehicle collisions
5.2. Prioritizing Mitigation Emphasis Sites
A ranking system was developed to help prioritize MES locations with the most importance and
potential for wildlife mitigation. We assigned each MES with a subjective score from 1 (low) to
5 (high) based on five criteria at the site: local and regional conservation values, ease of
implementing effective mitigation measures, the WVC rates at and adjacent to the site and
whether highway mitigation investments were wise based on whether land on both sides of the
MES was vulnerable to commercial or residential development.
1. Local Conservation Value - captures the importance of maintaining connectivity for the
seasonal movement of local herds of ungulates, carnivores or other related fine scale
opportunities for wildlife. For example, elk herds move in the autumn from their summer range
at higher elevations in the adjacent mountains down into the valley where the TCH is located for
winter.
2. Regional Conservation Significance - captures the importance of the site in maintaining
connectivity at a regional scale. This relates especially to large mammals that have low
population density (e.g. grizzly bears, wolverines [Gulo gulo]), but it could also relate to the

Highway Mitigation Opportunities in the Bow Valley
importance of corridors for more common species. Success for some of these species may be
measured by safe passage at highway crossings at very low rates; since effective population
levels are so low.
3. Transportation Mitigation Opportunity - considers the ease of implementing mitigation
measures, including consideration of geographical setting and features (i.e, stream crossing,
terrain, slope stability), the difficulty or ease for the placement and design of infrastructure (i.e.,
underpass, overpass), the age, condition and appropriate size of existing infrastructure (i.e.,
culverts, bridges) and other physical, biological and social (i.e., recreational trails) features.
Geotechnical information and other engineering studies were not available during the
development of these values in the field.
4. Highway Mortality - the relative rate of WVCs at each site was scaled as a proxy for safety
risks to motorists and wildlife. A review for each MES based on annual WVC rates is shown in
Figure 4.
5. Land Security - evaluates the condition of the lands directly adjacent to the MES. Investing in
highway infrastructure that provides safe passage for wildlife is often an expensive undertaking,
costing a million dollars or more. Therefore, land security (protection from development or land
uses not conducive to wildlife movement) around the structure is an important consideration.
Values for land security were developed based on land ownership, existing conservation
easement information, and land development attributes on both sides of the highway at each
MES. The highest value (5) was very secure and the lowest value (1) had development on lands
on both sides of the highway at the MES location:
5 - public lands (federal, provincial, municipal) or private lands with a
conservation easement on both sides of MES
4 - public lands or conservation easement on one side of MES, open space on the
other (with unsecured easements)
3 - open space lands on both sides, but unsecured conservation easements for
these private lands
2 - housing development or industrial/commercial site on one side, open space on
other side (with unsecured easements)
1 - housing development or industrial/commercial sites on both sides of highway
at MES
5.2.1. Results
All 10 mitigation emphasis sites were visited by the project team on 12 April 2012. Table 1
summarizes the values for each site and allows comparison of values between the 10 MES. Two
sites tied for the highest rating (4.4) – Kananaskis River Bridge and Yamnuska Bow Valley East
Corridor, both these MES occur in the Yamnuska Linkage and are the two most eastern MES in
the study area and closest to the junction between Highway 40 and the TCH. Two MES tied for
the lowest average value at 3.2: a) Heart Creek primarily due to low land use security adjacent to
Highway Mitigation Opportunities in the Bow Valley
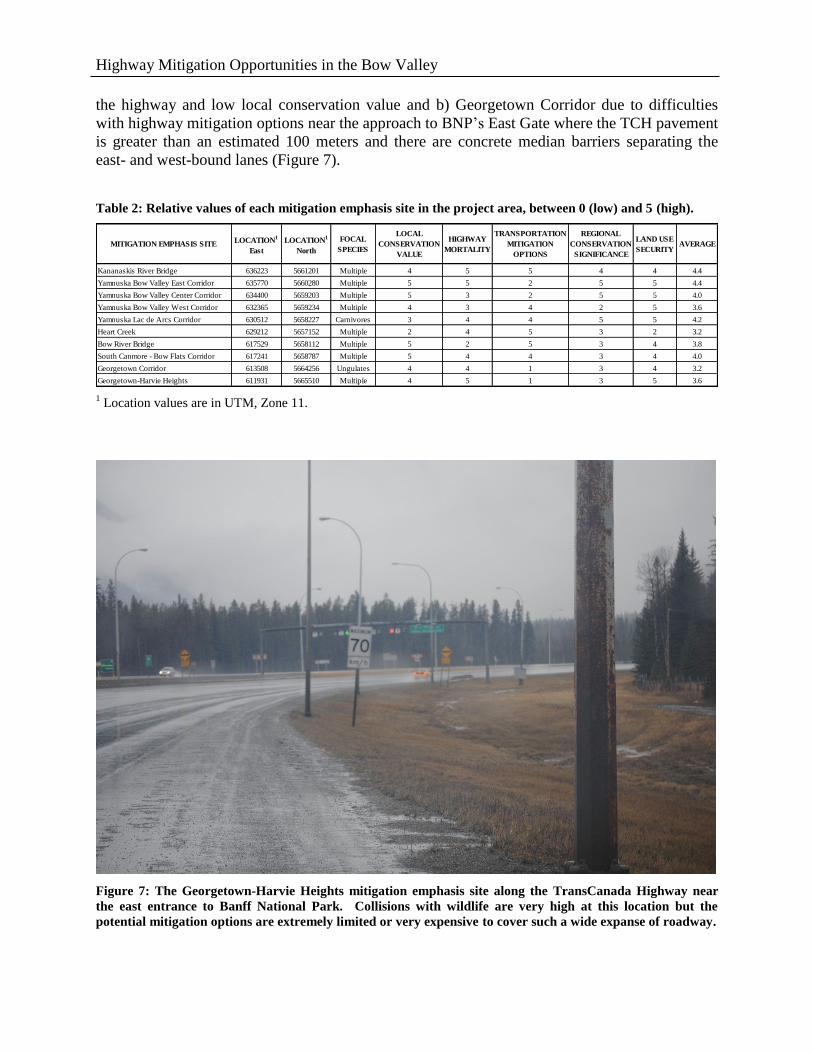
the highway and low local conservation value and b) Georgetown Corridor due to difficulties
with highway mitigation options near the approach to BNP’s East Gate where the TCH pavement
is greater than an estimated 100 meters and there are concrete median barriers separating the
east- and west-bound lanes (Figure 7).
Table 2: Relative values of each mitigation emphasis site in the project area, between 0 (low) and 5 (high).
1 Location values are in UTM, Zone 11.
Figure 7: The Georgetown-Harvie Heights mitigation emphasis site along the TransCanada Highway near
the east entrance to Banff National Park. Collisions with wildlife are very high at this location but the
potential mitigation options are extremely limited or very expensive to cover such a wide expanse of roadway.
MITIGATION EMPHASIS SITE LOCATION
1
East
LOCATION1
North
FOCAL
SPECIES
LOCAL
CONSERVATION
VALUE
HIGHWAY
MORTALITY
TRANSPORTATION
MITIGATION
OPTIONS
REGIONAL
CONSERVATION
SIGNIFICANCE
LAND USE
SECURITYAVERAGE
Kananaskis River Bridge 636223 5661201 Multiple 4 5 5 4 4 4.4
Yamnuska Bow Valley East Corridor 635770 5660280 Multiple 5 5 2 5 5 4.4
Yamnuska Bow Valley Center Corridor 634400 5659203 Multiple 5 3 2 5 5 4.0
Yamnuska Bow Valley West Corridor 632365 5659234 Multiple 4 3 4 2 5 3.6
Yamnuska Lac de Arcs Corridor 630512 5658227 Carnivores 3 4 4 5 5 4.2
Heart Creek 629212 5657152 Multiple 2 4 5 3 2 3.2
Bow River Bridge 617529 5658112 Multiple 5 2 5 3 4 3.8
South Canmore - Bow Flats Corridor 617241 5658787 Multiple 5 4 4 3 4 4.0
Georgetown Corridor 613508 5664256 Ungulates 4 4 1 3 4 3.2
Georgetown-Harvie Heights 611931 5665510 Multiple 4 5 1 3 5 3.6
Highway Mitigation Opportunities in the Bow Valley
6. COSTS OF WILDLIFE-VEHICLE COLLISIONS WITH LARGE
UNGULATES
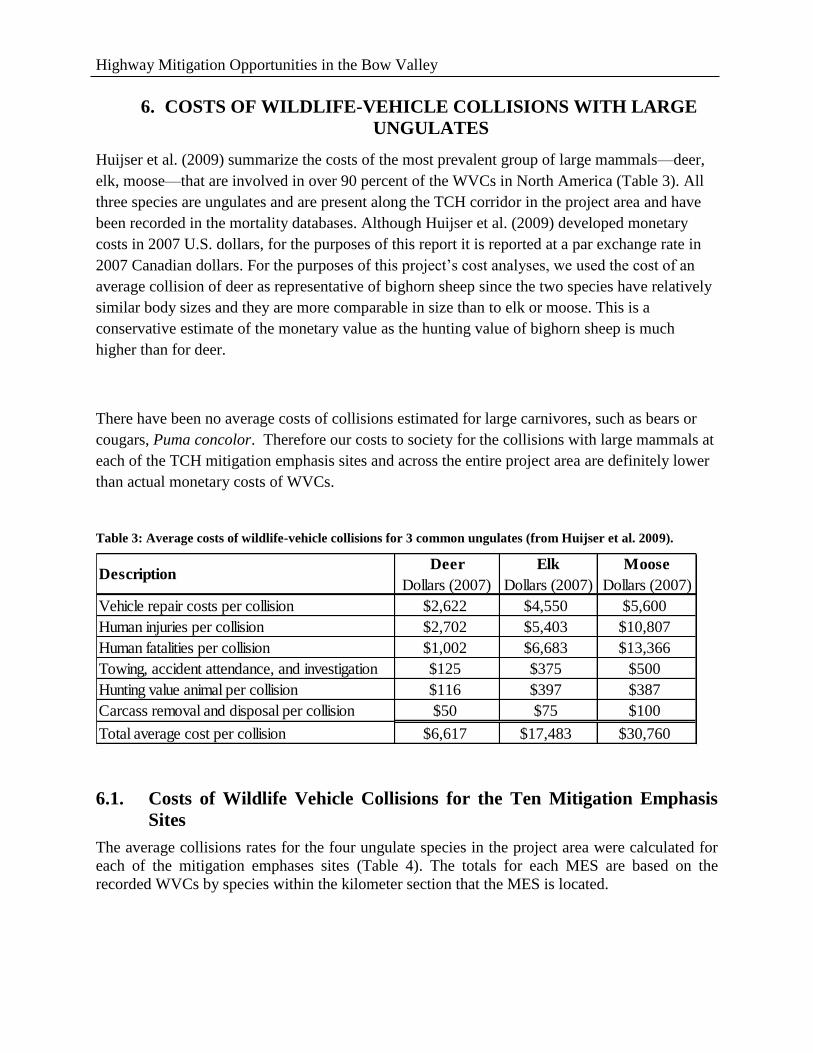
Huijser et al. (2009) summarize the costs of the most prevalent group of large mammals—deer,
elk, moose—that are involved in over 90 percent of the WVCs in North America (Table 3). All
three species are ungulates and are present along the TCH corridor in the project area and have
been recorded in the mortality databases. Although Huijser et al. (2009) developed monetary
costs in 2007 U.S. dollars, for the purposes of this report it is reported at a par exchange rate in
2007 Canadian dollars. For the purposes of this project’s cost analyses, we used the cost of an
average collision of deer as representative of bighorn sheep since the two species have relatively
similar body sizes and they are more comparable in size than to elk or moose. This is a
conservative estimate of the monetary value as the hunting value of bighorn sheep is much
higher than for deer.
There have been no average costs of collisions estimated for large carnivores, such as bears or
cougars, Puma concolor. Therefore our costs to society for the collisions with large mammals at
each of the TCH mitigation emphasis sites and across the entire project area are definitely lower
than actual monetary costs of WVCs.
Table 3: Average costs of wildlife-vehicle collisions for 3 common ungulates (from Huijser et al. 2009).
6.1. Costs of Wildlife Vehicle Collisions for the Ten Mitigation Emphasis
Sites
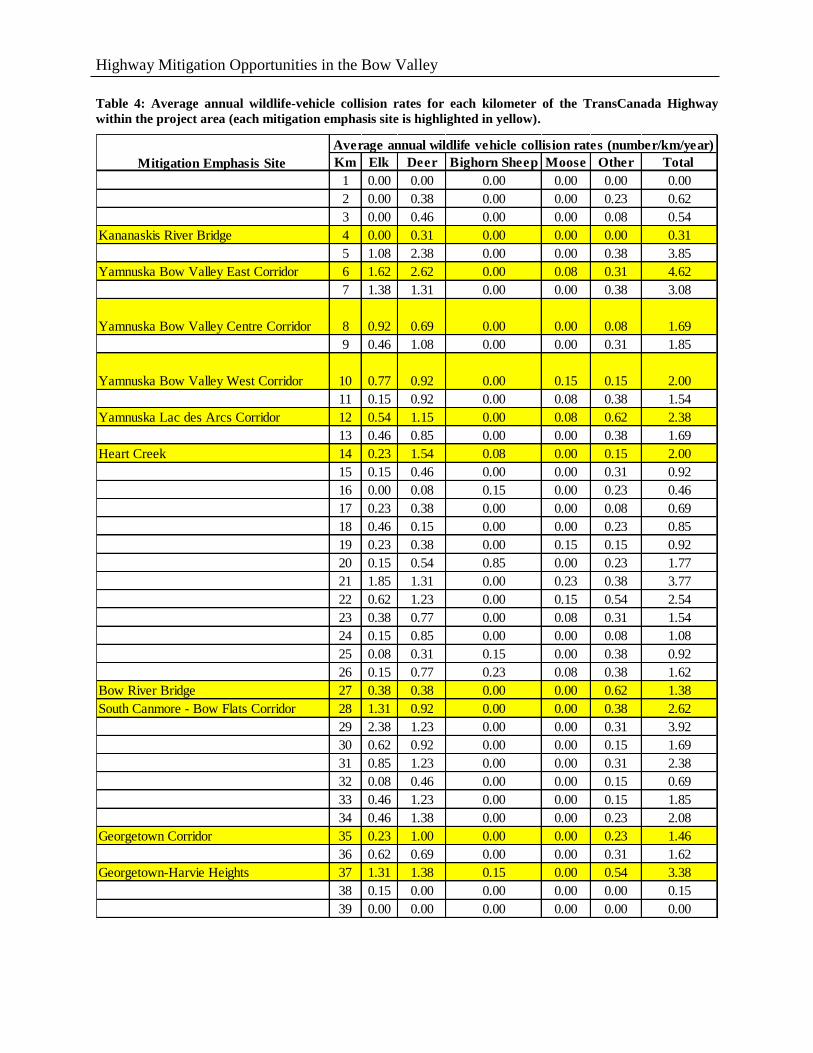
The average collisions rates for the four ungulate species in the project area were calculated for
each of the mitigation emphases sites (Table 4). The totals for each MES are based on the
recorded WVCs by species within the kilometer section that the MES is located.
Vehicle repair costs per collision $2,622 $4,550 $5,600
Human injuries per collision $2,702 $5,403 $10,807
Human fatalities per collision $1,002 $6,683 $13,366
Towing, accident attendance, and investigation $125 $375 $500
Hunting value animal per collision $116 $397 $387
Carcass removal and disposal per collision $50 $75 $100
Total average cost per collision $6,617 $17,483 $30,760
DescriptionDeer
Dollars (2007)
Elk
Dollars (2007)
Moose
Dollars (2007)
Highway Mitigation Opportunities in the Bow Valley
Table 4: Average annual wildlife-vehicle collision rates for each kilometer of the TransCanada Highway
within the project area (each mitigation emphasis site is highlighted in yellow).
Km Elk Deer Bighorn Sheep Moose Other Total
1 0.00 0.00 0.00 0.00 0.00 0.00
2 0.00 0.38 0.00 0.00 0.23 0.62
3 0.00 0.46 0.00 0.00 0.08 0.54
Kananaskis River Bridge 4 0.00 0.31 0.00 0.00 0.00 0.31
5 1.08 2.38 0.00 0.00 0.38 3.85
Yamnuska Bow Valley East Corridor 6 1.62 2.62 0.00 0.08 0.31 4.62
7 1.38 1.31 0.00 0.00 0.38 3.08
Yamnuska Bow Valley Centre Corridor 8 0.92 0.69 0.00 0.00 0.08 1.69
9 0.46 1.08 0.00 0.00 0.31 1.85
Yamnuska Bow Valley West Corridor 10 0.77 0.92 0.00 0.15 0.15 2.00
11 0.15 0.92 0.00 0.08 0.38 1.54
Yamnuska Lac des Arcs Corridor 12 0.54 1.15 0.00 0.08 0.62 2.38
13 0.46 0.85 0.00 0.00 0.38 1.69
Heart Creek 14 0.23 1.54 0.08 0.00 0.15 2.00
15 0.15 0.46 0.00 0.00 0.31 0.92
16 0.00 0.08 0.15 0.00 0.23 0.46
17 0.23 0.38 0.00 0.00 0.08 0.69
18 0.46 0.15 0.00 0.00 0.23 0.85
19 0.23 0.38 0.00 0.15 0.15 0.92
20 0.15 0.54 0.85 0.00 0.23 1.77
21 1.85 1.31 0.00 0.23 0.38 3.77
22 0.62 1.23 0.00 0.15 0.54 2.54
23 0.38 0.77 0.00 0.08 0.31 1.54
24 0.15 0.85 0.00 0.00 0.08 1.08
25 0.08 0.31 0.15 0.00 0.38 0.92
26 0.15 0.77 0.23 0.08 0.38 1.62
Bow River Bridge 27 0.38 0.38 0.00 0.00 0.62 1.38
South Canmore - Bow Flats Corridor 28 1.31 0.92 0.00 0.00 0.38 2.62
29 2.38 1.23 0.00 0.00 0.31 3.92
30 0.62 0.92 0.00 0.00 0.15 1.69
31 0.85 1.23 0.00 0.00 0.31 2.38
32 0.08 0.46 0.00 0.00 0.15 0.69
33 0.46 1.23 0.00 0.00 0.15 1.85
34 0.46 1.38 0.00 0.00 0.23 2.08
Georgetown Corridor 35 0.23 1.00 0.00 0.00 0.23 1.46
36 0.62 0.69 0.00 0.00 0.31 1.62
Georgetown-Harvie Heights 37 1.31 1.38 0.15 0.00 0.54 3.38
38 0.15 0.00 0.00 0.00 0.00 0.15
39 0.00 0.00 0.00 0.00 0.00 0.00
Average annual wildlife vehicle collision rates (number/km/year)
Mitigation Emphasis Site
Highway Mitigation Opportunities in the Bow Valley
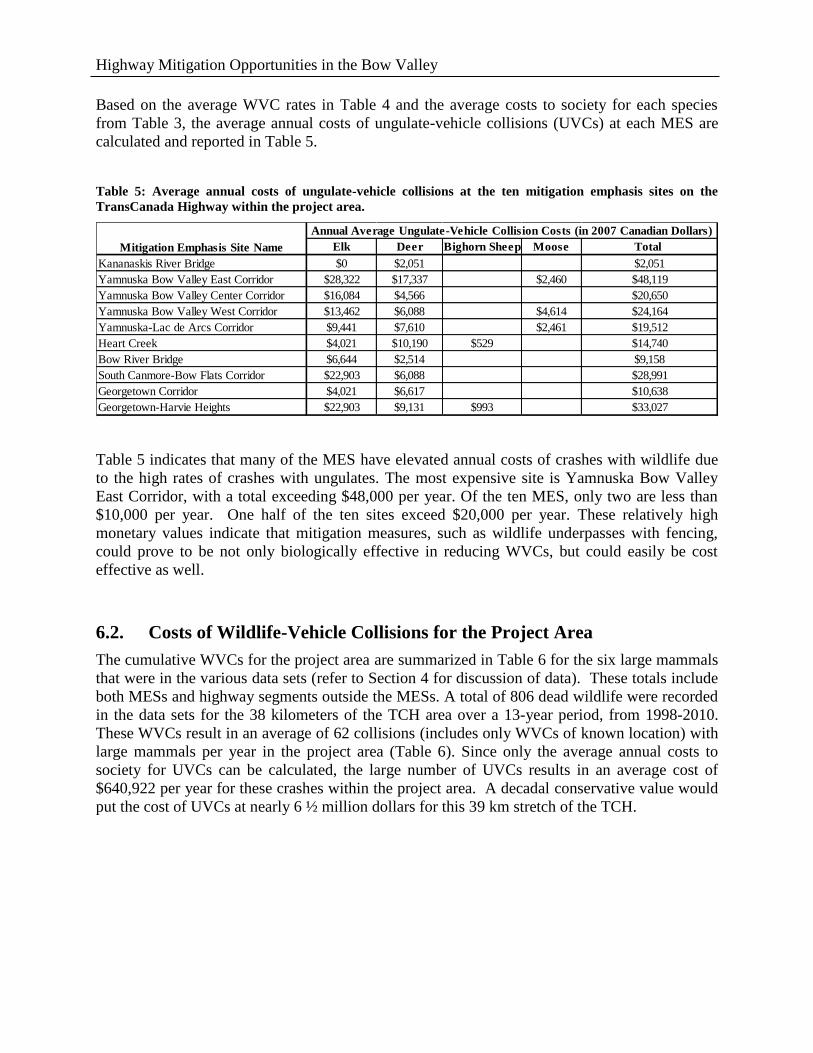
Based on the average WVC rates in Table 4 and the average costs to society for each species
from Table 3, the average annual costs of ungulate-vehicle collisions (UVCs) at each MES are
calculated and reported in Table 5.
Table 5: Average annual costs of ungulate-vehicle collisions at the ten mitigation emphasis sites on the
TransCanada Highway within the project area.
Table 5 indicates that many of the MES have elevated annual costs of crashes with wildlife due
to the high rates of crashes with ungulates. The most expensive site is Yamnuska Bow Valley
East Corridor, with a total exceeding $48,000 per year. Of the ten MES, only two are less than
$10,000 per year. One half of the ten sites exceed $20,000 per year. These relatively high
monetary values indicate that mitigation measures, such as wildlife underpasses with fencing,
could prove to be not only biologically effective in reducing WVCs, but could easily be cost
effective as well.
6.2. Costs of Wildlife-Vehicle Collisions for the Project Area
The cumulative WVCs for the project area are summarized in Table 6 for the six large mammals
that were in the various data sets (refer to Section 4 for discussion of data). These totals include
both MESs and highway segments outside the MESs. A total of 806 dead wildlife were recorded
in the data sets for the 38 kilometers of the TCH area over a 13-year period, from 1998-2010.
These WVCs result in an average of 62 collisions (includes only WVCs of known location) with
large mammals per year in the project area (Table 6). Since only the average annual costs to
society for UVCs can be calculated, the large number of UVCs results in an average cost of
$640,922 per year for these crashes within the project area. A decadal conservative value would
put the cost of UVCs at nearly 6 ½ million dollars for this 39 km stretch of the TCH.
Elk Deer Bighorn Sheep Moose Total
Kananaskis River Bridge $0 $2,051 $2,051
Yamnuska Bow Valley East Corridor $28,322 $17,337 $2,460 $48,119
Yamnuska Bow Valley Center Corridor $16,084 $4,566 $20,650
Yamnuska Bow Valley West Corridor $13,462 $6,088 $4,614 $24,164
Yamnuska-Lac de Arcs Corridor $9,441 $7,610 $2,461 $19,512
Heart Creek $4,021 $10,190 $529 $14,740
Bow River Bridge $6,644 $2,514 $9,158
South Canmore-Bow Flats Corridor $22,903 $6,088 $28,991
Georgetown Corridor $4,021 $6,617 $10,638
Georgetown-Harvie Heights $22,903 $9,131 $993 $33,027
Mitigation Emphasis Site Name
Annual Average Ungulate-Vehicle Collision Costs (in 2007 Canadian Dollars)
Highway Mitigation Opportunities in the Bow Valley
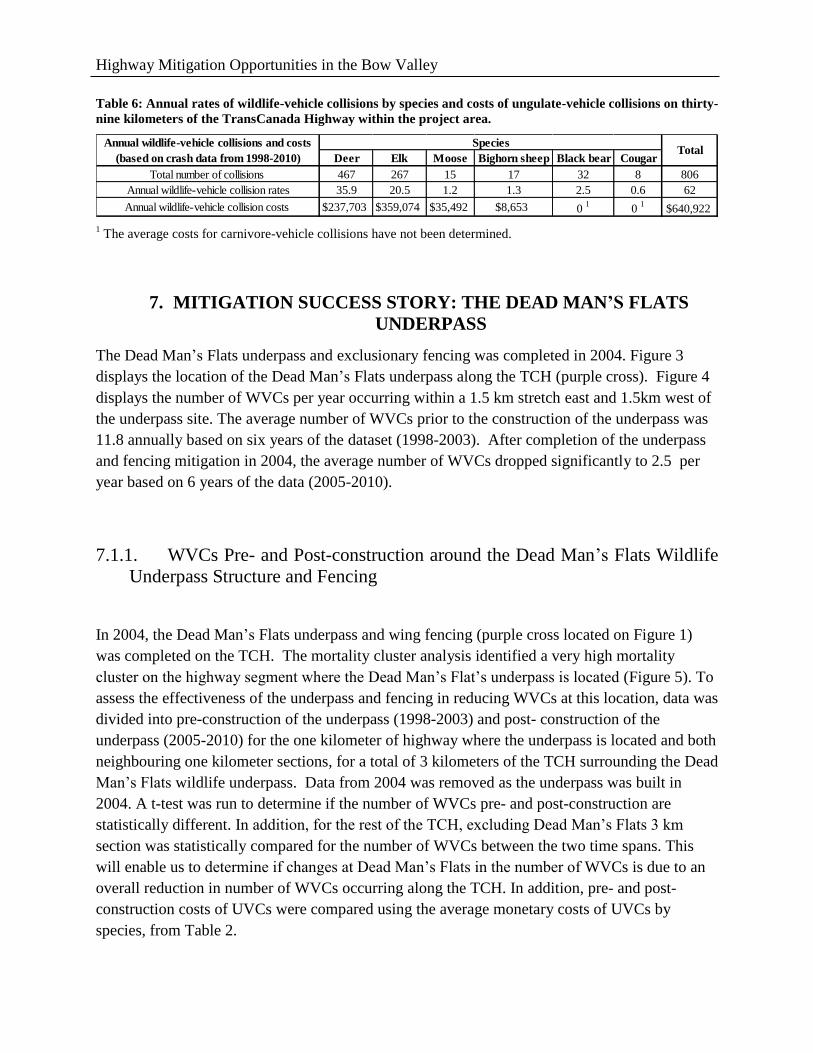
Table 6: Annual rates of wildlife-vehicle collisions by species and costs of ungulate-vehicle collisions on thirty-
nine kilometers of the TransCanada Highway within the project area.
1 The average costs for carnivore-vehicle collisions have not been determined.
7. MITIGATION SUCCESS STORY: THE DEAD MAN’S FLATS
UNDERPASS
The Dead Man’s Flats underpass and exclusionary fencing was completed in 2004. Figure 3
displays the location of the Dead Man’s Flats underpass along the TCH (purple cross). Figure 4
displays the number of WVCs per year occurring within a 1.5 km stretch east and 1.5km west of
the underpass site. The average number of WVCs prior to the construction of the underpass was
11.8 annually based on six years of the dataset (1998-2003). After completion of the underpass
and fencing mitigation in 2004, the average number of WVCs dropped significantly to 2.5 per
year based on 6 years of the data (2005-2010).
7.1.1. WVCs Pre- and Post-construction around the Dead Man’s Flats Wildlife
Underpass Structure and Fencing
In 2004, the Dead Man’s Flats underpass and wing fencing (purple cross located on Figure 1)
was completed on the TCH. The mortality cluster analysis identified a very high mortality
cluster on the highway segment where the Dead Man’s Flat’s underpass is located (Figure 5). To
assess the effectiveness of the underpass and fencing in reducing WVCs at this location, data was
divided into pre-construction of the underpass (1998-2003) and post- construction of the
underpass (2005-2010) for the one kilometer of highway where the underpass is located and both
neighbouring one kilometer sections, for a total of 3 kilometers of the TCH surrounding the Dead
Man’s Flats wildlife underpass. Data from 2004 was removed as the underpass was built in
2004. A t-test was run to determine if the number of WVCs pre- and post-construction are
statistically different. In addition, for the rest of the TCH, excluding Dead Man’s Flats 3 km
section was statistically compared for the number of WVCs between the two time spans. This
will enable us to determine if changes at Dead Man’s Flats in the number of WVCs is due to an
overall reduction in number of WVCs occurring along the TCH. In addition, pre- and post-
construction costs of UVCs were compared using the average monetary costs of UVCs by
species, from Table 2.
Deer Elk Moose Bighorn sheep Black bear Cougar
Total number of collisions 467 267 15 17 32 8 806
Annual wildlife-vehicle collision rates 35.9 20.5 1.2 1.3 2.5 0.6 62
Annual wildlife-vehicle collision costs $237,703 $359,074 $35,492 $8,653 0 1
0 1
$640,922
SpeciesAnnual wildlife-vehicle collisions and costs
(based on crash data from 1998-2010)Total

Highway Mitigation Opportunities in the Bow Valley
7.1.2. Results
Figure 6 summarizes the total number of WVCs per year for the 3 kilometer section of the TCH
surrounding the Dead Man’s Flats underpass, from a high of 19 WVCs in 2002 to a low of zero
WVCs in 2005.
Figure 4: Number of wildlife-vehicle collisions per year along the three kilometers of the TransCanada
Highway centered at the Dead Man’s Flats wildlife underpass.
7.1.2.1. Statistically Significant Reduction in WVCs
The WVC numbers are very stark at Dead Man’s Flats before the underpass was built and after
the underpass was constructed with fencing. No single year previous to the mitigation had less
than five WVCs, while after the mitigation was implemented, no single year exceeded five
WVCs (Figure 4). This represents a 78.8% reduction in WVCs in the TCH segment with the
underpass and fencing installed at Dead Man’s Flats. A t-test of the pre- and post-construction
data confirmed that the WVCs post-construction were significantly less statistically (results of
two-tailed t-test, P value= 0.0075) than the pre-construction WVCs.
The rest of the TCH study area where there was not mitigation (excluding three km at Dead
Man’s Flats) was analysed. There was no statistical difference in the number of WVCs (results of
two-tailed t-test, P value = 0.2540) between the 1998-2003 and 2005-2010 time spans.
Therefore, statistical results highlight the reduction in WVCs at Dead Man’s Flats underpass is
the highly probable result of the construction of the underpass with wildlife fencing.
Highway Mitigation Opportunities in the Bow Valley
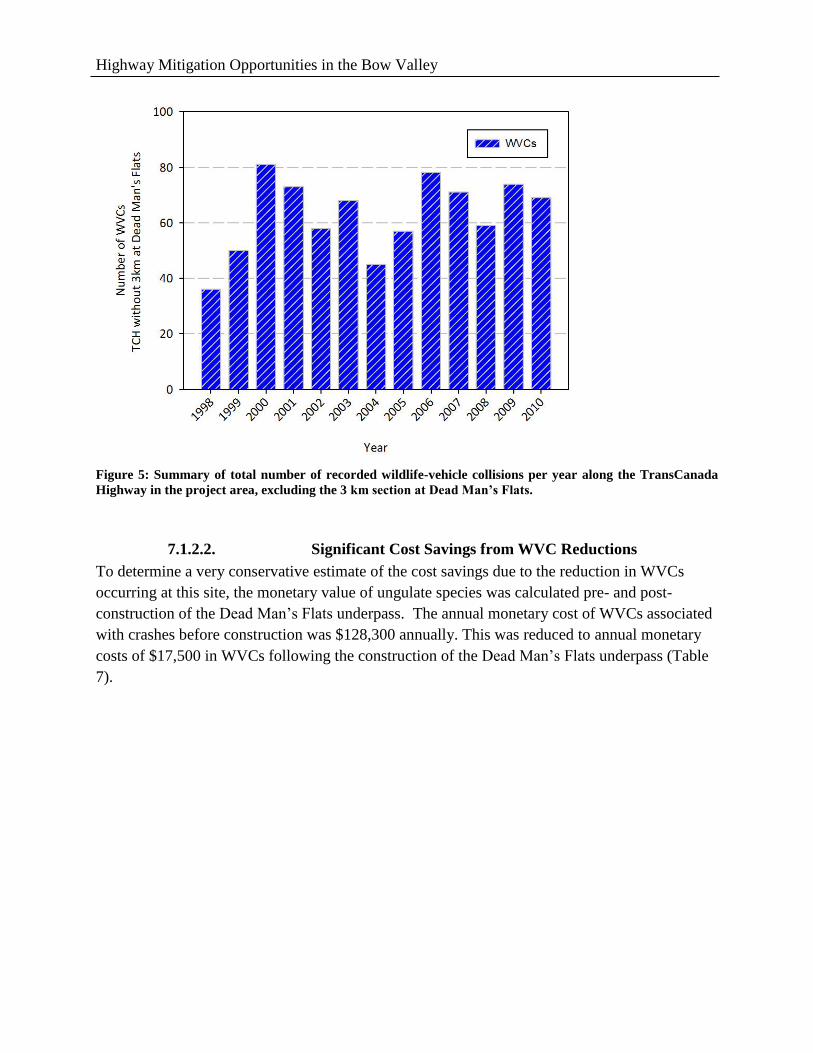
Figure 5: Summary of total number of recorded wildlife-vehicle collisions per year along the TransCanada
Highway in the project area, excluding the 3 km section at Dead Man’s Flats.
7.1.2.2. Significant Cost Savings from WVC Reductions
To determine a very conservative estimate of the cost savings due to the reduction in WVCs
occurring at this site, the monetary value of ungulate species was calculated pre- and post-
construction of the Dead Man’s Flats underpass. The annual monetary cost of WVCs associated
with crashes before construction was $128,300 annually. This was reduced to annual monetary
costs of $17,500 in WVCs following the construction of the Dead Man’s Flats underpass (Table
7).
Highway Mitigation Opportunities in the Bow Valley
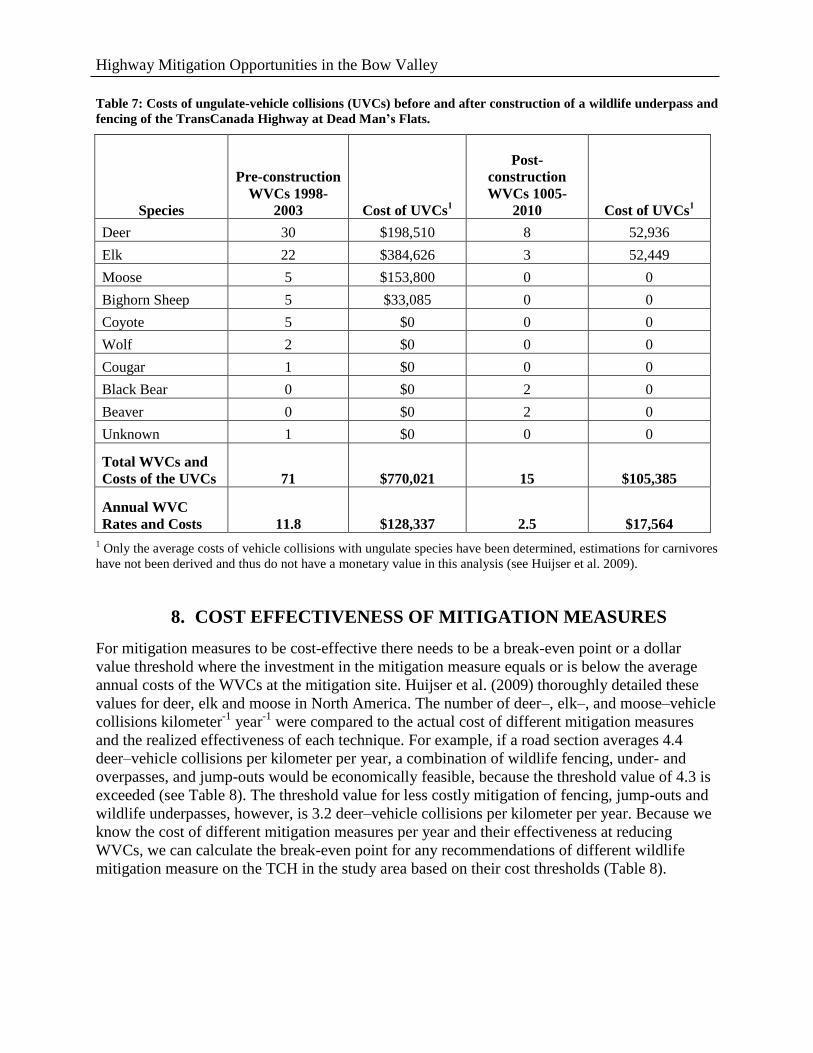
Table 7: Costs of ungulate-vehicle collisions (UVCs) before and after construction of a wildlife underpass and
fencing of the TransCanada Highway at Dead Man’s Flats.
Species
Pre-construction
WVCs 1998-
2003 Cost of UVCs1
Post-
construction
WVCs 1005-
2010 Cost of UVCs1
Deer 30 $198,510 8 52,936
Elk 22 $384,626 3 52,449
Moose 5 $153,800 0 0
Bighorn Sheep 5 $33,085 0 0
Coyote 5 $0 0 0
Wolf 2 $0 0 0
Cougar 1 $0 0 0
Black Bear 0 $0 2 0
Beaver 0 $0 2 0
Unknown 1 $0 0 0
Total WVCs and
Costs of the UVCs 71 $770,021 15 $105,385
Annual WVC
Rates and Costs 11.8 $128,337 2.5 $17,564
1 Only the average costs of vehicle collisions with ungulate species have been determined, estimations for carnivores
have not been derived and thus do not have a monetary value in this analysis (see Huijser et al. 2009).
8. COST EFFECTIVENESS OF MITIGATION MEASURES
For mitigation measures to be cost-effective there needs to be a break-even point or a dollar
value threshold where the investment in the mitigation measure equals or is below the average
annual costs of the WVCs at the mitigation site. Huijser et al. (2009) thoroughly detailed these
values for deer, elk and moose in North America. The number of deer–, elk–, and moose–vehicle
collisions kilometer-1
year-1
were compared to the actual cost of different mitigation measures
and the realized effectiveness of each technique. For example, if a road section averages 4.4
deer–vehicle collisions per kilometer per year, a combination of wildlife fencing, under- and
overpasses, and jump-outs would be economically feasible, because the threshold value of 4.3 is
exceeded (see Table 8). The threshold value for less costly mitigation of fencing, jump-outs and
wildlife underpasses, however, is 3.2 deer–vehicle collisions per kilometer per year. Because we
know the cost of different mitigation measures per year and their effectiveness at reducing
WVCs, we can calculate the break-even point for any recommendations of different wildlife
mitigation measure on the TCH in the study area based on their cost thresholds (Table 8).

Highway Mitigation Opportunities in the Bow Valley
Table 8: Effectiveness, cost threshold values, and deer-vehicle collision rates to meet or exceed those cost
effectiveness thresholds (adapted from Huijser et al. 2009).
1 Jump-outs are “escape ramps” that let wildlife inadvertently trapped on the highway side of the fencing to jump out
to safety.
There are other wildlife mitigation measures but most are far less effective in reducing WVCs
than the ones listed in Table 8. For example, seasonal wildlife warning signs for motorists only
reduce WVCs by an average of 26% or relocating wildlife reduces WVCs by an average of 50
percent (Huijser et al. 2009). Thus Table 8 only lists those wildlife mitigation measures that are
proven to reduce WVCs by greater than 80 percent.
Based on the calculated annual average costs of ungulate-vehicle collisions for each mitigation
emphasis site (Table 5) it appears that 6 of the 10 MES exceed $19,500. Therefore, due to the
effectiveness of fencing and underpasses with jump-outs, any MES that exceeds $18,123 (Table
8) would be able to reduce WVCs at the site by over 85% and still be cost effective using that
mitigation measure. MES that exceed average annual costs of $24,230 would most likely be able
to justify an overpass with fencing and jump-outs (Table 8). There are three MES that have the
highest costs in the study area and exceed this annual average cost – Yamnuska Bow Valley East
Corridor ($48,119), South Canmore-Bow Flats Corridor ($28,991) and Georgetown-Harvie
Heights MES ($33,027).
9. RECOMMENDATIONS FOR THE TEN MITIGATION EMPHASIS
SITES
9.1. Mitigation Measures
Although there have been many mitigation measures suggested to reduce WVCs, only a few of
measures have the potential to substantially reduce WVCs (Huijser et al. 2008, Clevenger &
Huijser 2011). Only wildlife fencing and animal detection systems have shown to be able to
reduce WVCs with large mammals substantially (>80%). It is important to note however, that
animal detection systems should still be considered experimental whereas the estimate for the
effectiveness of wildlife fencing in combination with wildlife underpasses and overpasses is
much more robust. Electrified mats used in place of Texas gates or cattle guards have been
shown to be effective in keeping ungulates from accessing highway rights-of-way or entering in
Wildlife Mitigation Measure
Effectiveness of Measure
(average percent reduction in
wildlife-vehicle collisions)
Cost Threshold
(2007 Dollars)
Annual Deer-Vehicle Collision Rate:
to meet or exceed cost threshold
(deer/kilometer/year)
Fencing 86 $6,304 1.1
Fencing, underpass, jump outs1
86 $18,123 3.2
Fencing, over- and underpass, jump outs 86 $24,230 4.3
Animal detection system (ADS) 87 $37,014 6.4
Fencing, gap, ADS, jumpouts 87 $28,150 4.9
Elevated roadway 100 $3,109,422 470
Submerged roadway (underground tunnel) 100 $4,981,333 753
Highway Mitigation Opportunities in the Bow Valley
fenced areas (Seamans and Helon 2008). The development and testing of “electro-mats” in the
next few years will help determine the efficacy of these measures in dealing with problems with
animal movement at the ends of fences.
In a recent report to the U.S. Congress, commissioned by the Federal Highway Administration,
Huijser et al. (2007) summarized 36 different animal-vehicle collision mitigation measures
currently in use throughout the world. The mitigation measures were grouped into four types:
1. Measures that attempt to influence driver behaviour (18)
2. Measures that attempt to influence animal behaviour (10)
3. Measures that seek to reduce wildlife population size (4)
4. Measures that seek to physically separate animals from the roadway (4)
As part of the 2007 report, a Technical Working Group was convened which included seven
national experts in the area of animal-vehicle collisions. One of their tasks was to rank the
current animal-vehicle collision mitigation measures into three categories:
1. Measures that should be implemented (where appropriate),
2. Measures that appear promising, but require further investigation, and
3. Measures or practices that are proven ineffective.
Our recommendations for improving motorist safety and wildlife connectivity for the TCH
include a total of five different mitigation measures. Table 9 includes a list of most of the
measures available today, their effectiveness in reducing WVCs (if data are available), the target
of the measure (type) and the ranking category as presented in the Huijser et al. (2007) report.
Highway Mitigation Opportunities in the Bow Valley
Table 9: Wildife mitigation measures, their focus and effectiveness.
Mitigation measure Effectiveness1 Type
2 Category
3
Intercept feeding
(salt licks)
N/A4 Animal Promising
De-icing alternatives N/A Animal Promising
Variable message sign N/A Driver Promising
Animal detection system 87% Driver Promising
Fencing 86% Separate Proven
Underpass with waterflow 86% Animal Proven
Underpass – wildlife 86% Animal Proven
Underpass – multi-use 86% Animal Proven
Overpass – wildlife 86% Animal Proven
Overpass – multi-use 86% Animal Proven
1Effectiveness: the average percentage reduction in annual wildlife-vehicle collisions after application of the
mitigation measure.
2 Type of mitigation measures include: Driver-Measures that attempt to influence driver behaviour; Animal-
Measures that attempt to influence animal behaviour; and Separate- Measures that physically separate animals from
the roadway. From Huijser et al. 2007.
3 Proven: Measures that should be implemented (where appropriate); Promising: Measures that appear promising,
but require further investigation. From Huijser et al. 2007.
4 Not Available: no data on effectiveness.
9.2. Recommended Mitigation Measures
As previously mentioned, mitigation emphasis sites are specific locations within the TCH study
area where opportunities for reducing WVCs and improving connectivity for all wildlife are
highest, including fragmentation-sensitive species. Focusing highway mitigation efforts in these
areas should improve motorist safety, reduce wildlife mortalities and improve habitat linkages
and animal movement through transitional habitat along these highway segments.
Highway Mitigation Opportunities in the Bow Valley
From the field evaluation of the 10 mitigation emphasis sites, recommendations were grouped
into actions that can be carried out, from simple landscaping and earth moving work, to more
costly installation of fencing or below-grade passage structures. For some of the sites mitigation
makes more sense (from a cost and ecological perspective) if combined with a neighbouring
MES.
We developed recommendations for mitigation opportunities at each mitigation emphasis site
along the TCH. The relative importance of each site varies by species and local landscape
attributes across the 39 kilometer TCH study area. Each MES and its conservation ranking
(Table 2) was informed by field data on wildlife movement, wildlife mortality, expert opinion,
and opportunities and limitations with respect to adjacent land use (see “Prioritizing Mitigation
Emphasis Sites”, Section 5.2, p. 20). A variety of mitigation measures are recommended; from
simple to complex, some requiring minor earthmoving and landscaping, while others necessitate
structural work (e.g., fencing, Jersey barrier replacement).
1. Kananaskis River Bridge
The area has high WVC rates, is of high local and regional conservation significance, and
excellent options for mitigating the effects of the TCH. Land use security is relatively high, but
mitigation alternatives should continue to focus on managing adjacent lands in a way that
ensures regional wildlife habitat conservation and population connectivity across the TCH.
Given the local conservation value, it will be critical to maintain vegetative cover and riparian
habitat along the Kananaskis River. Wildlife passage appears possible and likely to be occurring
within the span bridge on the West side of the river.
Recommendations to reduce WVCs and improve wildlife passage in the area include:
(1) On East side of river, do earthwork underneath and adjacent to span bridge that will better
adapt the area for wildlife movement. Earthwork would consist of removing fill in some areas
and landscape a more suitable wildlife path under the bridge span. Landscaping and vegetating
the immediate area conducive to wildlife use (cover) will be needed.
(2) In addition to (1), install 2.4 m high wing-fencing, particularly on the East side of bridge to
funnel movement of wildlife to bridge. Install animal-detection system (with motorist warning
signage) at fence end and/or boulder field to minimize animal intrusions to the right-of-way.
Jump-outs or escape ramps should be located appropriately to allow animals to escape the right-
of-way should they gain access.
2. Yamnuska Bow Valley East Corridor
Mitigation alternatives should focus on reducing WVCs in this highly problematic area, the
highest rate of WVC in the entire study area. The site is has high local and regional conservation
significance and highway mortality Transportation mitigation options are few. It will be difficult
to install below-grade passage at this site, therefore above-grade mitigation is required.
Highway Mitigation Opportunities in the Bow Valley
Recommendations to reduce collisions and improve wildlife passage in the area include:
(1) Install animal-detection systems with our without fencing to warn motorists of wildlife on or
near the TCH. Fenced systems will have animal-detection system and/or boulder fields at fence
ends to minimize animal intrusions into the right-of-way. Jump-outs should be located
appropriately to allow animals to escape the right-of-way should they gain access.
(2) Fence entire section encompassing this MES with Kananaskis River Bridge MES to the east.
Electro-mats would be situated where fence crosses the Hwy 1X/Seebe interchange roads (n=4
sites). Animal-detection system and/or boulder fields should be placed at east and west fence
ends and associated jump-outs located within the fenced area to allow animal escape.
3. Yamnuska Bow Valley Central Corridor
Mitigation alternatives should focus on reducing WVCs in this problematic area.
Recommendations to reduce collisions and improve wildlife passage in the area include the same
as for site 2: Yamnuska-Bow Valley East Corridor MES to the east. Difficult to install below-
grade passage at this site, therefore above-grade mitigation is required.
This site could be part of sectional mitigation scheme, with continuous fencing encompassing
this MES with the Yamnuska Bow Valley East Corridor). Animal-detection system and/or
boulder fields would be situated at east and west fence ends and associated jump-outs located
within the fenced area to allow animal escape.
4. Yamnuska Bow Valley West Corridor
Not an area of high regional conservation significance or highway mortality. Nonetheless,
mitigation alternatives should focus primarily on reducing WVCs in this area. This site would
easily accommodate a below-grade passage structure (underpass) given the amount of fill and
raised highway profile.
Mitigation would create highest value at site if part of a sectional mitigation scheme that
mitigates more than the specific site, but a larger stretch of TCH to the east and includes fencing
and animal-detection systems at ends of fences.
5. Yamnuska-Lac des Arcs Corridor
This is an area of high regional conservation significance for carnivores and wildlife mortality.
Mitigation alternatives should focus on continuing to manage adjacent lands in a way that
ensures regional wildlife habitat conservation and population connectivity across the TCH.
Mitigation should focus primarily on reducing WVCs in this area. This site can accommodate a
below-grade passage structure (underpass) given the raised highway profile, particularly on the
North side. There is a drainage culvert in place that could be retrofitted as an underpass.
Highway Mitigation Opportunities in the Bow Valley
This site is best suitable as a stand-alone, site-specific mitigation or combined with the Heart
Creek MES (see below). Recommended dimension for wildlife underpass is minimum 2.2 m
high x 3 m wide, e.g., prefabricated concrete box culvert. Wing fencing (ca. >200 m) should be
used with animal detection system at fence ends or boulder field with nearby jump-outs.
6. Heart Creek
An area of relatively low local and regional conservation significance for wildlife, but with
elevated wildlife mortality rates in area. Mitigation alternatives should focus on managing the
adjacent lands in a way that ensures regional wildlife habitat conservation and population
connectivity across the TCH. The hamlet of Lac des Arcs on north side likely deflects most
wildlife movement around the community. Mitigation should focus primarily on reducing WVCs
in this area and ensuring greater movement of wildlife through the existing Heart Creek bridge
structure. Most wildlife in area are likely able to pass below-grade using the creek underpass.
This site is best suitable as a stand-alone, site-specific mitigation measure or combined with the
Yamnuska-Lac des Arcs Corridor MES (see above). Fencing could tie the two MES together,
funneling animal movement to a concrete box culvert and the Heart Creek underpass,
respectively. Wing fencing (ca. >200 m) should be used with animal detection system at fence
ends or boulder field with nearby jump-outs.
7 Bow River Bridge
This is an area of relatively low highway mortality, but high local conservation significance for
wildlife. Mitigation alternatives therefore should focus on (1) managing the adjacent lands (near
Town of Canmore) south of the highway in a way that ensures regional wildlife habitat
conservation and population connectivity across the TCH and (2) reducing WVCs on the TCH.
WVC reduction measures should be part of a combined strategy with the South Canmore-Bow
Flats Corridor MES, given their proximity and similar highway impact issues. Combining
mitigation work at both MES and linking it to the Stewart Creek-Dead Man’s Flats section will
have an important mitigation effect on WVCs and wildlife movement in a critical part of the
Bow Valley corridor.
There is travel space on the East side of the Bow River Bridge. Adapting the West side of the
bridge for wildlife passage should be part of a combined MES strategy (see below). Fencing
continues as part of the South Canmore-Bow Flats Corridor.
8 South Canmore-Bow Flats Corridor
This site is closely associated with the Bow River Bridge MES (above) and therefore any
mitigation should be planned for both sites. The site has a relatively high local and regional
conservation value and is an area of high WVCs.
Highway Mitigation Opportunities in the Bow Valley
Lands on either side are protected by the Canmore Nordic Centre Provincial Park and Bow
Valley Provincial Park but this site is close to the Town of Canmore and wildlife movement has
the potential to be threatened by development. It will therefore be critical to ensure the
preservation of the adjacent wildlife corridor and other natural habitats that move wildlife near
the TCH. Mitigation alternatives therefore should focus on (1) strict management of the adjacent
lands in a way that ensures regional wildlife habitat conservation and population connectivity
across the TCH and (2) reducing WVCs on the TCH.
Recommendations to reduce collisions and improve wildlife passage at this site include one
wildlife underpass and fencing that encompasses the two MES. Fencing ties into Bow River
Bridge to the east and CPR bridge to the west. Recommended dimension for wildlife underpass
is minimum 4 m high x 7 m wide, e.g., corrugated steel elliptical culvert. Boulder fields are not
needed since the fence ties into the two bridges.
9. Georgetown Corridor
The area is of moderate importance for local conservation and can be problematic for WVCs.
The transportation mitigation options are few given the location surrounded by highway
interchange and residential/commercial development. There are multiple lanes of traffic on the
TCH (off/on ramps plus 4 lanes). Recommendations to reduce collisions and improve wildlife
passage in the area include replacing Jersey barriers (precast concrete modular barriers) in
central median with a cable barrier system which would allow easier movement of wildlife
across the TCH.
10. Georgetown-Harvie Heights
This site is second to the Yamnuska Bow Valley East Corridor in terms of high WVC frequency.
Local conservation value is high given its proximity to Banff National Park and habitat on
periphery of Town of Canmore. Land use security is high as Crown lands are located on both
sides of the highway. Like the Georgetown Corridor, there are few mitigation options other than
replacing Jersey barriers with cable barriers. There are as many as 8 lanes of traffic (6 lanes on
TCH, 2 lanes on Harvie Heights road) on this section of TCH near the park entrance. An existing
culvert could be retrofitted for wildlife passage, but would require raising the highway profile
0.5-1.0 m.
Highway Mitigation Opportunities in the Bow Valley
10. REFERENCES
Bow Corridor Ecosystem Advisory Group (BCEAG). 1998. Wildlife Corridor and Habitat
Patches Guidelines for the Bow Valley. 27pp.
Clevenger, A.P. & Waltho, N. 2000 Factors influencing the effectiveness of wildlife underpasses
in Banff National Park, Alberta, Canada. Conservation Biology, 14, 47-56.
Clevenger, A.P., B. Chruszcz & K. Gunson. 2001. Highway mitigation fencing reduces wildlife–
vehicle collisions. Wildlife Society Bulletin 29: 646–653.
Clevenger, A.P. & N. Waltho. 2005. Performance indices to identify attributes of highway
crossing structures facilitating movement of large mammals. Biological Conservation 121:453-
464.
Clevenger, A.P., Long, R. and R. Ament. 2008. I-90 Snoqualmie Pass East Wildlife Monitoring
Plan. Prepared for the Washington Department of Transportation, Yakima, Washington. 47 pp.
Clevenger, T. & M.P. Huijser. 2011. Handbook for Design and Evaluation of Wildlife Crossing
Structures in North America. Department of Transportation, Federal Highway Administration,
Washington D.C., USA. Available from the internet:
http://www.westerntransportationinstitute.org/documents/reports/425259_Final_Report.pdf
Crooks, K.R. and Sanjayan, M. 2006. Connectivity conservation. Cambridge University Press,
Cambridge, UK.
da Fonseca, G. A. B., W. Sechrest, and J. Ogelthorpe. 2005. Managing the matrix. Pages 346–
358 in T. E. Lovejoy and L. Hannah, editors. Climate change and biodiversity. Yale University
Press, New Haven, Connecticut.
Epps, C.W., P.J. Palsbøll, J.D. Weyhausen, G.K. Roderick, R.R. Ramey, D.R. McCullough.
2005. Highways block gene flow and cause a rapid decline in genetic diversity of desert bighorn
sheep. Ecology Letters 8: 1029-1038.
Fahrig, L., J.H. Pedlar, S.E.Pope, P.D. Taylor, and J.F. Wegner. 1995. Effect of road traffic on
amphibian density. Biological Conservation 74:177-182.
Ford, AT, AP Clevenger, K Rettie. 2010. Banff Wildlife Crossings, TransCanada Highway,
Alberta – An international public-private partnership. Pages 157-172 in Safe passages:
highways, wildlife and habitat connectivity. J Beckmann, AP Clevenger, M Huijser, J Hilty
(eds.). Island Press, Washington DC
Forman, R.T.T., L. Alexander. 1998. Roads and their major ecological effects. Annual Review
of Ecology and Systematics 29:207-31.
Gerlach, G., K. Musolf. 2000. Fragmentation of landscape as a cause for genetic subdivision in
bank voles. Conservation Biology 14:1066-1074.
Highway Mitigation Opportunities in the Bow Valley
Gibbs, J.P., D.A. Steen. 2005. Trends in Sex Ratios of Turtles in the United States: Implications
of Road Mortality. Conservation Biology 19: 552–556.
Gibbs, J.P., G.Shriver. 2002. Estimating the effects of road mortality on turtle populations.
Conservation Biology 16:1647-1652.
Gilbert-Norton, L., Wilson, R., Stevens, J.R. and Beard, K.H. 2010. A meta-analytic review of
corridor effectiveness. Conservation Biology, 24 (3), 660–668.
Golder Associates. 2002. Final Report: Assessment of Wildlife Corridors within in DC site 1,
DC site 3, and District R. Prepared for Three Sisters Resort Inc. and Town of Canmore.
Gunther, K.A., Biel, M.J. and H.L. Robinson. 2000. Influence of vehicle speed and vegetation
cover-type on road-killed wildlife in Yellowstone National Park. In: Messmer TA, West B,
editors. Wildlife and highways: seeking solutions to an ecological and socio-economic dilemma.
2000 September 12-16: Nashville, TN. 169pp.
Heller, N.E. and E.S. Zavelata. 2009. Biodiversity management in the face of climate change: a
review of 22 years of recommendations. Biological Conservation, 142(2009), 14-32.Heuer K.
and T. Lee 2010. Private Land Conservation Opportunities in the Bow Valley. Prepared for the
Yellowstone to Yukon Conservation Initiative, the Bow valley Land Conservnacy and the Nature
Conservancy of Canada. Calgary, AB.
Hilty, J., W. Lidicker, and A. Merenlender. 2006. Corridor ecology: the science and practice of
linking landscapes for biodiversity conservation. Island Press, Washington, DC.
Huijser, M.P., P.T. McGowen, W. Camel, A. Hardy, P. Wright, A.P. Clevenger, L. Salsman & T.
Wilson. 2006. Animal vehicle crash mitigation using advanced technology. Phase I: review,
design and implementation. SPR 3(076). FHWA-OR-TPF-07-01, Western Transportation
Institute – Montana State University, Bozeman, Montana, USA.
Huijser, M.P., J. Fuller, M.E. Wagner, A. Hardy & A.P. Clevenger. 2007a. Animal–vehicle
collision data collection. A synthesis of highway practice. NCHRP Synthesis 370. Project 20-
05/Topic 37-12. Transportation Research Board of the National Academies, Washington, D.C.,
USA.
Huijser, M.P., P. McGowen, J. Fuller, A. Hardy, A. Kociolek, A.P. Clevenger, D. Smith & R.
Ament. 2008. Wildlife-vehicle collision reduction study. Report to Congress. U.S. Department of
Transportation, Federal Highway Administration, Washington D.C., USA. Available from the
internet: http://www.tfhrc.gov/safety/pubs/08034/index.htm
Huijser, M.P., J.W. Duffield, A.P. Clevenger, R.J. Ament & P.T. McGowen. 2009. Cost–benefit
analyses of mitigation measures aimed at reducing collisions with large ungulates in the United
States and Canada; a decision support tool. Ecology and Society 14(2): 15. [online] URL:
http://www.ecologyandsociety.org/viewissue.php?sf=41
Lee, T., Managh, S. and N. Darlow. 2010. Spatial-temporal patterns of wildlife distribution and
movement in Canmore’s benchland corridor. Prepared for Alberta Tourism, Parks and
Recreation, Canmore, Alberta.
Lovallo, M.J., E.M. Anderson. 1996. Bobcat movements and home ranges relative to roads in
Wisconsin. Wildlife Society Bulletin 24 71-76.
Highway Mitigation Opportunities in the Bow Valley
Mawdsley, J.R., O’Malley, R., Ojima, D.S. 2009. A review of climate-change adaptation
strategies for wildlife management and biodiversity conservation. Conservation Biology, 23 (5),
1080–1089.
McGuire, T.M. and Morrall, J.F. 2000. Strategic highway improvements to minimize
environmental impacts within the Canadian Rocky Mountain national parks. Canadian Journal of
Civil Engineering 27, 523-32
Mumme, R.L., S.J. Schoech, G.E. Woolfenden, J.W. Fitzpatrick. 2000. Life and death in the fast
lane: demographic consequences of road mortality in the Florida scrub-jay. Conservation
Biology, 14:501-12.
Noss, R.F., H.B. Quigley, M.G. Hornocker, T. Merrill, P.C. Paquet. 1996. Conservation biology
and carnivore conservation in the Rocky Mountains. Conservation Biology 10:949-963.
Percy, M. 2003. Temporal and spatial activity patterns of large carnivores in the Bow Valley of
Banff National Park. M.Sc. thesis. University of Alberta. Edmonton, Alberta.
Ritters, K.H. and J.D. Wickham. 2003. How far to the nearest road? Frontiers in Ecology and
Environment 1:125-129. Sawaya, M. 2012. Using noninvasive genetic sampling methods to
estimate demographic and genetic parameters for large carnivore populations in the Rocky
Mountains. PhD thesis, Montana State University, Bozeman, Montana USA.
Seamans, T., D. Helon. 2008. Comparison of electrified mats and cattle guards to control white-
tailed deer access through fences. USDA National Wildlife Research Center, Staff Publications.
Paper 798.
Seiler, A. 2003. The toll of the automobile: Wildlife and roads in Sweden. Doctoral dissertation.
Swedish University of Agricultural Sciences.
Sweanor, L.L., K.A. Logan, M.G. Hornocker. 2000: Cougar dispersal patterns, metapopulation
dynamics, and conservation. Conservation Biology 14:798-808.
Waller, J., C. Servheen. 2005. Effects of transportation infrastructure on grizzly bears in
northwestern Montana. Journal of Wildlife Management, 69:985-1000.
Whittington, J. and A. Forshner. 2009. An Analysis of wildlife snow tracking, winter transect,
and highway underpass data in the Eastern Bow Valley.
Wolf, P. 1981. Land in America: its value, use and control. New York: Pantheon Books.

Highway Mitigation Opportunities in the Bow Valley
11. APPENDIX A: WILDLIFE VEHICLE COLLISION DATA CLEAN
UP DOCUMENTATION
Process for pulling out road kill data for TCH WVC data from 2006-2010, acquired from the
AESRD ENFOR database.
1. Sorted database on Cause of Death Field: Highways – removed records into new
spreadsheet
2. Reviewed Cause of Death “pending” records and pulled TCH road kill possibilities into
new spreadsheet
3. Sorted Highways on Occurrence Types: found the following:
a. Wildlife dead
b. Wildlife complaint road kill injured
c. WC: Sightings
d. WC: Injured
e. No occurrence type – reviewed record notes for road kill.
4. Resulted in 372 records from 2006-2010 (5 years)
5. Sorted by location and removed records without a location (unknown), 77 records, of
which 22 were for the TCH (the unknown location records were included in total annual
rate calculations for TCH)
6. Removed WMU, descriptive fields, separate date into month and year, removed occnum
7. Cleaned titles (removed hyphens and shortened)
8. Saved as CVS file to import into GIS, displayed using easting and northing
9. Extracted TCH records (total 350), cleaned by:
a. Selected only records on TCH from Banff Park Gate to Hwy 40
b. Cleaned TCH record locations by buffering TCH by 1km and removing records
beyond this buffer, 5 records were outside of buffer and were counted as location
unknown as they were identified as road kill.
c. Reviewed other records within buffer but with different highway label, added 16
records (labeled as Canmore, Harvey Heights, Hwy 40 , but attributed as road-kill
from Hwy and located within 1km buffer of Hwy)
10. Resulting in 344 location known records of road kills associated with the TCH from
2006-2010
11. Snapped remaining records to TCH
12. Export from ARCGIS to excel
13. In excel calculated the number of mortality records per year and average rate over the
five year period. Pulled out rate for each species on known locations.
14. For average annual wildlife mortality add in the unknown location records, these were
identified as being associated with TCH but did not include enough detail to be added
into spatial file.
Highway Mitigation Opportunities in the Bow Valley
1997 to 2005- Acquired from Scott Jevons cleaned database
1. Important WVC mortality data into GIS
2. Selected TCH records, removed 8 records to the east of Hwy 40 or any records over 1km
away from the TCH
3. There are 570 records, 65 with an unknown location, leaving 505 for a spatial analysis
where locations were needed.
4. Removed 1997 data – 27 records and one record from 1993.
5. There were 481 records used in spatial analysis from 1998-2010.
Merging datasets 1998-2010
1. Snapped both datasets to Highway 1 – converted to one line.
2. Segmented into 1 km sections from Banff park gate to Hwy 40.
3. Merged datasets from 1998-2010, cleaned names species for consistency.
4. Enumerated the data per species per 1 km segment and exported data. Deer, Elk, Moose,
BHS, Other.
Highway Mitigation Opportunities in the Bow Valley
12. APPENDIX B: MITIGATION EMPHASIS SITE SUMMARIES
Informational summary sheets were prepared for each Mitigation Emphasis Site (MES) and
describe all site-specific information with regard to mitigation importance, target species,
wildlife objectives, and transportation mitigation recommendations. These Summary Information
Sheets are a quick and easy reference that summarizes mitigation opportunities at each MES.
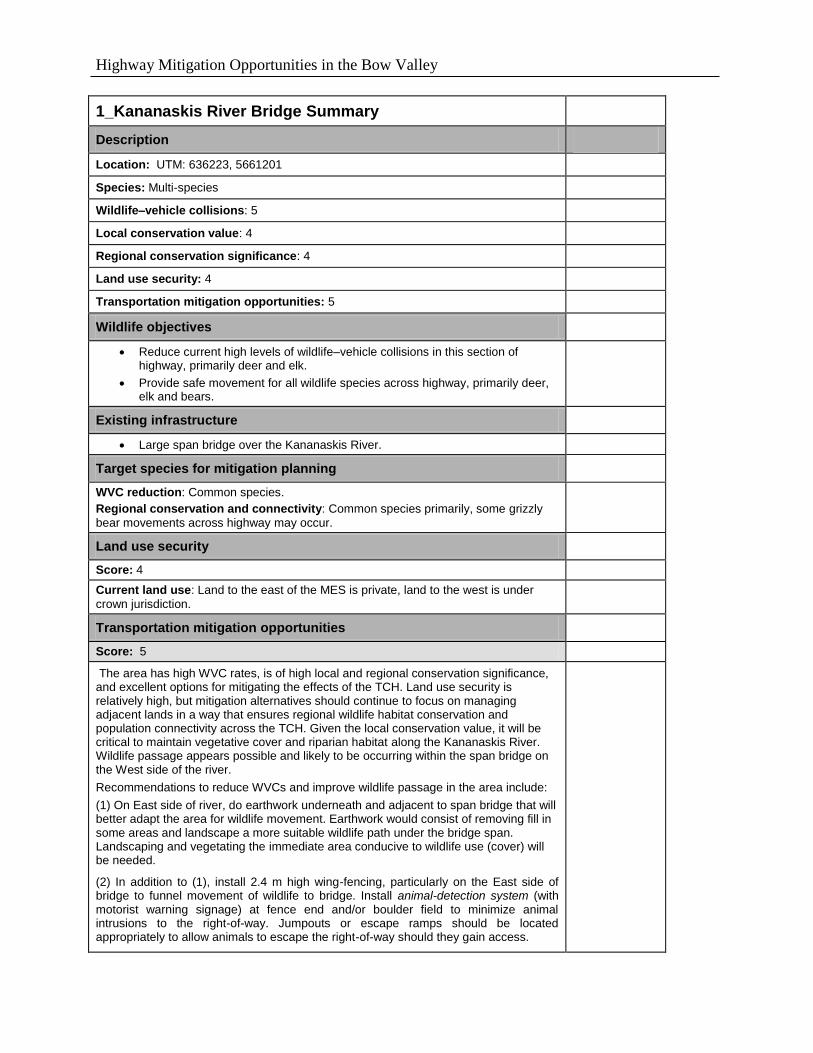
Highway Mitigation Opportunities in the Bow Valley
1_Kananaskis River Bridge Summary
Description
Location: UTM: 636223, 5661201
Species: Multi-species
Wildlife–vehicle collisions: 5
Local conservation value: 4
Regional conservation significance: 4
Land use security: 4
Transportation mitigation opportunities: 5
Wildlife objectives
Reduce current high levels of wildlife–vehicle collisions in this section of highway, primarily deer and elk.
Provide safe movement for all wildlife species across highway, primarily deer, elk and bears.
Existing infrastructure
Large span bridge over the Kananaskis River.
Target species for mitigation planning
WVC reduction: Common species.
Regional conservation and connectivity: Common species primarily, some grizzly
bear movements across highway may occur.
Land use security
Score: 4
Current land use: Land to the east of the MES is private, land to the west is under
crown jurisdiction.
Transportation mitigation opportunities
Score: 5
The area has high WVC rates, is of high local and regional conservation significance, and excellent options for mitigating the effects of the TCH. Land use security is relatively high, but mitigation alternatives should continue to focus on managing adjacent lands in a way that ensures regional wildlife habitat conservation and population connectivity across the TCH. Given the local conservation value, it will be critical to maintain vegetative cover and riparian habitat along the Kananaskis River. Wildlife passage appears possible and likely to be occurring within the span bridge on the West side of the river.
Recommendations to reduce WVCs and improve wildlife passage in the area include:
(1) On East side of river, do earthwork underneath and adjacent to span bridge that will better adapt the area for wildlife movement. Earthwork would consist of removing fill in some areas and landscape a more suitable wildlife path under the bridge span. Landscaping and vegetating the immediate area conducive to wildlife use (cover) will be needed.
(2) In addition to (1), install 2.4 m high wing-fencing, particularly on the East side of bridge to funnel movement of wildlife to bridge. Install animal-detection system (with motorist warning signage) at fence end and/or boulder field to minimize animal intrusions to the right-of-way. Jumpouts or escape ramps should be located appropriately to allow animals to escape the right-of-way should they gain access.

Highway Mitigation Opportunities in the Bow Valley
2_Yamnuska Bow Valley East Corridor Summary
Description
Location: UTM: 635770, 5660280
Species: Multi-species
Wildlife–vehicle collisions: 5
Local conservation value: 5
Regional conservation significance: 5
Land use security: 5
Transportation mitigation opportunities: 2
Wildlife objectives
Reduce current high levels of wildlife–vehicle collisions in this section of highway, primarily deer and elk.
Provide safe movement for all wildlife species across highway, primarily deer, elk and bears.
Existing infrastructure
None.
Target species for mitigation planning
WVC reduction: Common species.
Regional conservation and connectivity: Common species primarily, some black bear
and cougar movements across highway may occur.
Land use security
Score: 5
Current land use: Land on both sides of highway is under provincial crown jurisdiction.
Transportation mitigation opportunities
Score: 2
Mitigation alternatives should focus on reducing WVCs in this highly problematic area, the highest rate of WVC in the entire study area. The site is has high local and regional conservation significance and highway mortality Transportation mitigation options are few. It will be difficult to install below-grade passage at this site, therefore above-grade mitigation is required.
Recommendations to reduce collisions and improve wildlife passage in the area include:
(1) Install animal-detection systems with our without fencing to warn motorists of wildlife on or near the TCH. Fenced systems will have animal-detection system and/or boulder
fields at fence ends to minimize animal intrusions into the right-of-way. Jump-outs should be located appropriately to allow animals to escape the right-of-way should they gain access.
(2) Fence entire section encompassing this MES with Kananaskis River Bridge MES to the east. Electro-mats would be situated where fence crosses the Hwy 1X/Seebe interchange roads (n=4 sites). Animal-detection system and/or boulder fields should be placed at east and west fence ends and associated jumpouts located within the fenced area to allow animal escape.
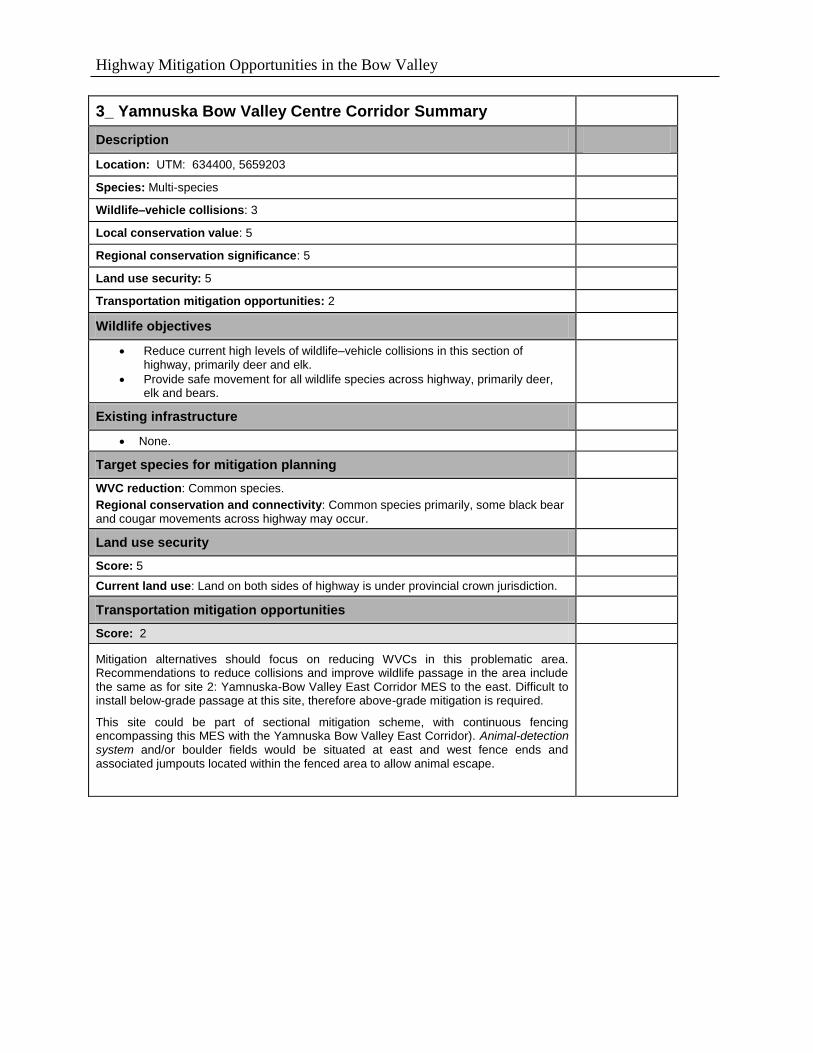
Highway Mitigation Opportunities in the Bow Valley
3_ Yamnuska Bow Valley Centre Corridor Summary
Description
Location: UTM: 634400, 5659203
Species: Multi-species
Wildlife–vehicle collisions: 3
Local conservation value: 5
Regional conservation significance: 5
Land use security: 5
Transportation mitigation opportunities: 2
Wildlife objectives
Reduce current high levels of wildlife–vehicle collisions in this section of highway, primarily deer and elk.
Provide safe movement for all wildlife species across highway, primarily deer, elk and bears.
Existing infrastructure
None.
Target species for mitigation planning
WVC reduction: Common species.
Regional conservation and connectivity: Common species primarily, some black bear and cougar movements across highway may occur.
Land use security
Score: 5
Current land use: Land on both sides of highway is under provincial crown jurisdiction.
Transportation mitigation opportunities
Score: 2
Mitigation alternatives should focus on reducing WVCs in this problematic area. Recommendations to reduce collisions and improve wildlife passage in the area include the same as for site 2: Yamnuska-Bow Valley East Corridor MES to the east. Difficult to install below-grade passage at this site, therefore above-grade mitigation is required.
This site could be part of sectional mitigation scheme, with continuous fencing encompassing this MES with the Yamnuska Bow Valley East Corridor). Animal-detection system and/or boulder fields would be situated at east and west fence ends and associated jumpouts located within the fenced area to allow animal escape.

Highway Mitigation Opportunities in the Bow Valley
4_ Yamnuska Bow Valley West Corridor Summary
Description
Location: UTM: 632365, 5659234
Species: Multi-species
Wildlife–vehicle collisions: 3
Local conservation value: 4
Regional conservation significance: 2
Land use security: 5
Transportation mitigation opportunities: 4
Wildlife objectives
Reduce current high levels of wildlife–vehicle collisions in this section of highway, primarily deer and elk.
Provide safe movement for all wildlife species across highway, primarily deer, elk and bears.
Existing infrastructure
None
Target species for mitigation planning
WVC reduction: Common species.
Regional conservation and connectivity: Common species primarily, some black bear
and cougar movements across highway may occur.
Land use security
Score: 5
Current land use: Land on both sides of highway is under provincial crown jurisdiction.
Transportation mitigation opportunities
Score: 4
Not an area of high regional conservation significance or highway mortality. Nonetheless, mitigation alternatives should focus primarily on reducing WVCs in this area. This site would easily accommodate a below-grade passage structure (underpass) given the amount of fill and raised highway profile.
Mitigation would create highest value at site if part of a sectional mitigation scheme that mitigates more than the specific site, but a larger stretch of TCH to the east and includes fencing and animal-detection systems at ends of fences. At least one jump-out (escape ramp) should be installed on each side of highway to allow wildlife to escape fenced area.

Highway Mitigation Opportunities in the Bow Valley
5_ Yamnuska Lac des Arcs Corridor Summary
Description
Location: UTM: 630512, 5658227
Species: Carnivores
Wildlife–vehicle collisions: 4
Local conservation value: 3
Regional conservation significance: 5
Land use security: 5
Transportation mitigation opportunities: 4
Wildlife objectives
Reduce current high levels of wildlife–vehicle collisions in this section of highway, primarily deer and elk, but also bears and other carnivores.
Provide safe movement for all wildlife species across highway, primarily carnivore and ungulate species.
Existing infrastructure
None
Target species for mitigation planning
WVC reduction: Common species, predominantly deer.
Regional conservation and connectivity: Common species are a priority, however
area is believed to be corridor for movement of grizzly bears and other carnivores.
Land use security
Score: 5
Current land use: Land on both sides of highway is under provincial crown jurisdiction.
Transportation mitigation opportunities
Score: 4
An area of high regional conservation significance for carnivores and wildlife mortality in general. Mitigation alternatives should focus on continuing to manage adjacent lands in a way that ensures regional wildlife habitat conservation and population connectivity across the TCH. Mitigation should focus primarily on reducing WVCs in this area. This site can accommodate a below-grade passage structure (underpass) given the raised highway profile, particularly on the North side. There is a drainage culvert in place that could be retrofitted as a wildlife underpass.
This site is best suitable as a stand-alone, site-specific mitigation or combined with the Heart Creek MES (see below). Recommended dimension for wildlife underpass is minimum 2.2 m high x 3 m wide, e.g., prefabricated concrete box culvert. Wing fencing (ca. >200 m) should be used with animal detection system and’or boulder field at fence ends. At least one jump-out (escape ramp) should be installed on each side of highway to allow wildlife to escape fenced area.
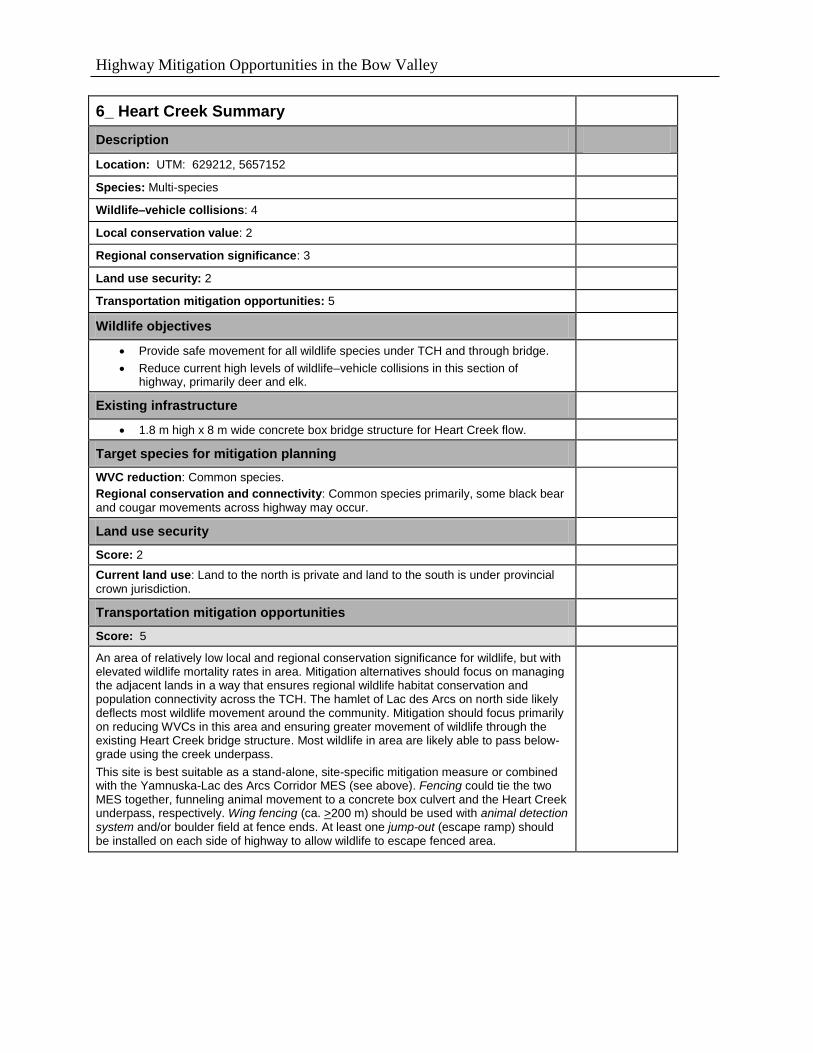
Highway Mitigation Opportunities in the Bow Valley
6_ Heart Creek Summary
Description
Location: UTM: 629212, 5657152
Species: Multi-species
Wildlife–vehicle collisions: 4
Local conservation value: 2
Regional conservation significance: 3
Land use security: 2
Transportation mitigation opportunities: 5
Wildlife objectives
Provide safe movement for all wildlife species under TCH and through bridge.
Reduce current high levels of wildlife–vehicle collisions in this section of highway, primarily deer and elk.
Existing infrastructure
1.8 m high x 8 m wide concrete box bridge structure for Heart Creek flow.
Target species for mitigation planning
WVC reduction: Common species.
Regional conservation and connectivity: Common species primarily, some black bear and cougar movements across highway may occur.
Land use security
Score: 2
Current land use: Land to the north is private and land to the south is under provincial crown jurisdiction.
Transportation mitigation opportunities
Score: 5
An area of relatively low local and regional conservation significance for wildlife, but with elevated wildlife mortality rates in area. Mitigation alternatives should focus on managing the adjacent lands in a way that ensures regional wildlife habitat conservation and population connectivity across the TCH. The hamlet of Lac des Arcs on north side likely deflects most wildlife movement around the community. Mitigation should focus primarily on reducing WVCs in this area and ensuring greater movement of wildlife through the existing Heart Creek bridge structure. Most wildlife in area are likely able to pass below-grade using the creek underpass.
This site is best suitable as a stand-alone, site-specific mitigation measure or combined with the Yamnuska-Lac des Arcs Corridor MES (see above). Fencing could tie the two MES together, funneling animal movement to a concrete box culvert and the Heart Creek underpass, respectively. Wing fencing (ca. >200 m) should be used with animal detection system and/or boulder field at fence ends. At least one jump-out (escape ramp) should be installed on each side of highway to allow wildlife to escape fenced area.

Highway Mitigation Opportunities in the Bow Valley
7_ Bow River Bridge Summary
Description
Location: UTM: 617529, 5658112
Species: Multi-species
Wildlife–vehicle collisions: 2
Local conservation value: 5
Regional conservation significance: 3
Land use security: 4
Transportation mitigation opportunities: 5
Wildlife objectives
Reduce current high levels of wildlife–vehicle collisions in this section of highway, primarily deer and elk, but also wolves, bears and other carnivores.
Provide safe movement for all wildlife species across highway, primarily carnivore and ungulate species.
Existing infrastructure
Open-span bridge over Bow River.
Target species for mitigation planning
WVC reduction: Common species, but primarily deer, elk, wolves and bears.
Regional conservation and connectivity: Common species primarily, some black bear, wolf and cougar movements across highway may occur.
Land use security
Score: 4
Current land use: Land to the East of the MES is private, land to the West is under
crown jurisdiction.
Transportation mitigation opportunities
Score: 5
This is an area of relatively low highway mortality, but high local conservation significance for wildlife. Mitigation alternatives therefore should focus on (1) managing the adjacent lands (near Town of Canmore) south of the highway in a way that ensures regional wildlife habitat conservation and population connectivity across the TCH and (2) reducing WVCs on the TCH. WVC reduction measures should be part of a combined strategy with the South Canmore-Bow Flats Corridor MES, given their proximity and similar highway impact issues. Combining mitigation work at both MES and linking it to the Stewart Creek-Dead Man’s Flats section will have an important mitigation effect on WVCs and wildlife movement in a critical part of the Bow Valley corridor.
There is travel space on the East side of the Bow River Bridge. Adapting the West side of the bridge for wildlife passage should be part of a combined MES strategy (see below). Fencing continues as part of the South Canmore-Bow Flats Corridor.
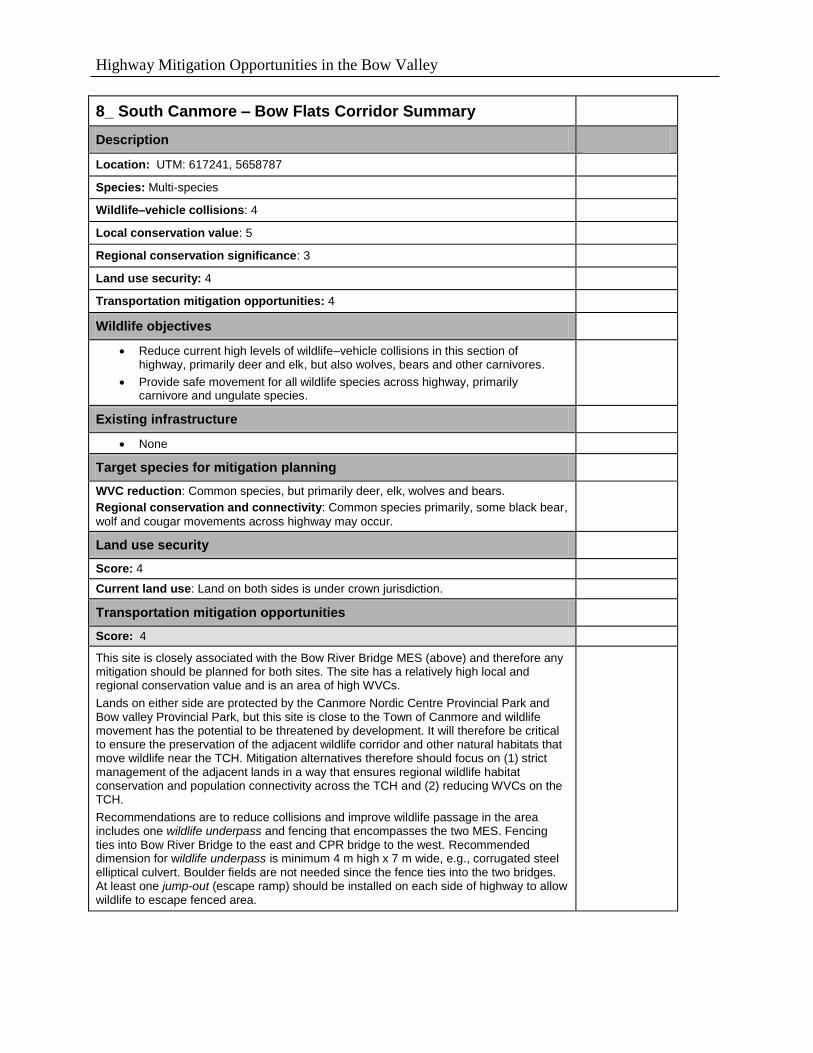
Highway Mitigation Opportunities in the Bow Valley
8_ South Canmore – Bow Flats Corridor Summary
Description
Location: UTM: 617241, 5658787
Species: Multi-species
Wildlife–vehicle collisions: 4
Local conservation value: 5
Regional conservation significance: 3
Land use security: 4
Transportation mitigation opportunities: 4
Wildlife objectives
Reduce current high levels of wildlife–vehicle collisions in this section of highway, primarily deer and elk, but also wolves, bears and other carnivores.
Provide safe movement for all wildlife species across highway, primarily carnivore and ungulate species.
Existing infrastructure
None
Target species for mitigation planning
WVC reduction: Common species, but primarily deer, elk, wolves and bears.
Regional conservation and connectivity: Common species primarily, some black bear,
wolf and cougar movements across highway may occur.
Land use security
Score: 4
Current land use: Land on both sides is under crown jurisdiction.
Transportation mitigation opportunities
Score: 4
This site is closely associated with the Bow River Bridge MES (above) and therefore any mitigation should be planned for both sites. The site has a relatively high local and regional conservation value and is an area of high WVCs.
Lands on either side are protected by the Canmore Nordic Centre Provincial Park and Bow valley Provincial Park, but this site is close to the Town of Canmore and wildlife movement has the potential to be threatened by development. It will therefore be critical to ensure the preservation of the adjacent wildlife corridor and other natural habitats that move wildlife near the TCH. Mitigation alternatives therefore should focus on (1) strict management of the adjacent lands in a way that ensures regional wildlife habitat conservation and population connectivity across the TCH and (2) reducing WVCs on the TCH.
Recommendations are to reduce collisions and improve wildlife passage in the area includes one wildlife underpass and fencing that encompasses the two MES. Fencing ties into Bow River Bridge to the east and CPR bridge to the west. Recommended dimension for wildlife underpass is minimum 4 m high x 7 m wide, e.g., corrugated steel elliptical culvert. Boulder fields are not needed since the fence ties into the two bridges. At least one jump-out (escape ramp) should be installed on each side of highway to allow wildlife to escape fenced area.

Highway Mitigation Opportunities in the Bow Valley
9_ Georgetown Corridor Summary
Description
Location: UTM: 613508, 5664256
Species: Ungulates
Wildlife–vehicle collisions: 4
Local conservation value: 3
Regional conservation significance: 3
Land use security: 4
Transportation mitigation opportunities: 1
Wildlife objectives
Reduce wildlife–vehicle collisions in this section of highway.
Existing infrastructure
None
Target species for mitigation planning
WVC reduction: Common species, primarily deer and elk.
Regional conservation and connectivity: Common species primarily, deer and elk; some black bear and cougar movements across highway may occur.
Land use security
Score: 4
Current land use: Land on both sides of highway is under provincial crown jurisdiction.
Transportation mitigation opportunities
Score: 1
The area is of moderate importance for local conservation and can be problematic for WVCs. The transportation mitigation options are few given the location surrounded by highway interchange and residential/commercial development. There are multiple lanes of traffic on the TCH (off/on ramps plus 4 lanes). Recommendations to reduce collisions and improve wildlife passage in the area include replacing Jersey barriers in central median with guard rail or cable barrier system which would allow easier movement of
wildlife across the TCH.
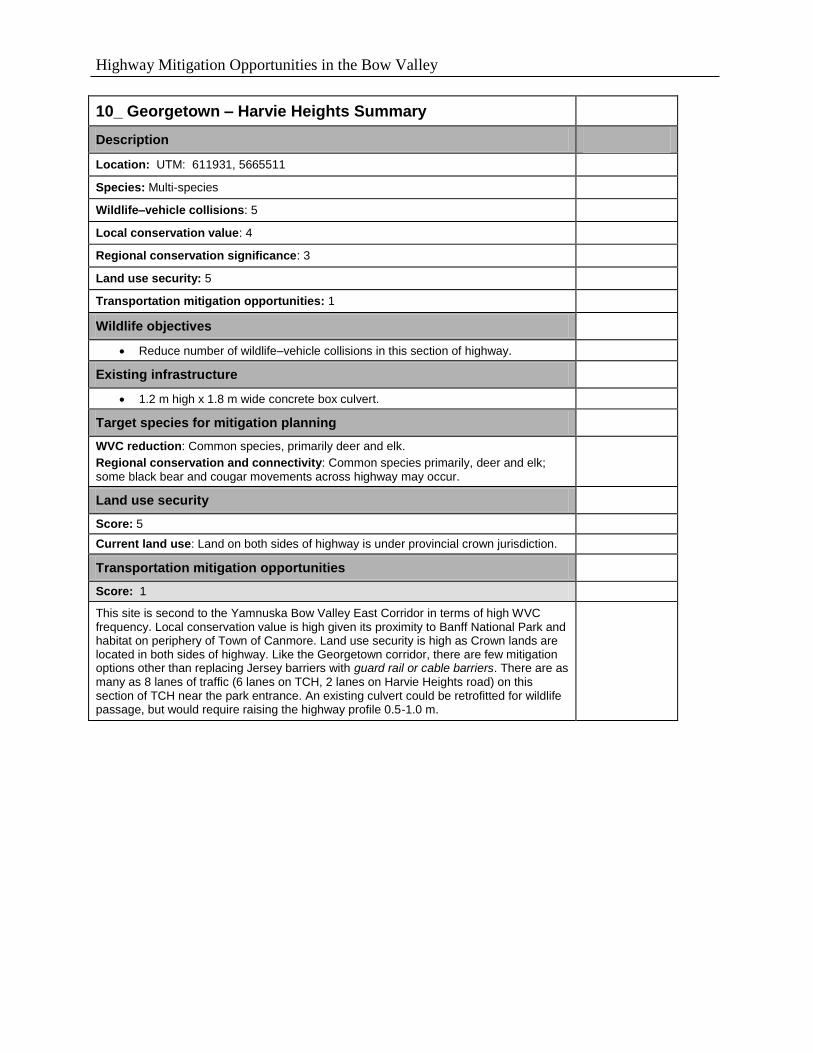
Highway Mitigation Opportunities in the Bow Valley
10_ Georgetown – Harvie Heights Summary
Description
Location: UTM: 611931, 5665511
Species: Multi-species
Wildlife–vehicle collisions: 5
Local conservation value: 4
Regional conservation significance: 3
Land use security: 5
Transportation mitigation opportunities: 1
Wildlife objectives
Reduce number of wildlife–vehicle collisions in this section of highway.
Existing infrastructure
1.2 m high x 1.8 m wide concrete box culvert.
Target species for mitigation planning
WVC reduction: Common species, primarily deer and elk.
Regional conservation and connectivity: Common species primarily, deer and elk; some black bear and cougar movements across highway may occur.
Land use security
Score: 5
Current land use: Land on both sides of highway is under provincial crown jurisdiction.
Transportation mitigation opportunities
Score: 1
This site is second to the Yamnuska Bow Valley East Corridor in terms of high WVC frequency. Local conservation value is high given its proximity to Banff National Park and habitat on periphery of Town of Canmore. Land use security is high as Crown lands are located in both sides of highway. Like the Georgetown corridor, there are few mitigation options other than replacing Jersey barriers with guard rail or cable barriers. There are as many as 8 lanes of traffic (6 lanes on TCH, 2 lanes on Harvie Heights road) on this section of TCH near the park entrance. An existing culvert could be retrofitted for wildlife passage, but would require raising the highway profile 0.5-1.0 m.