hill, j.g., mitrushchenkov, a.o., and peterson, k.a. … · 1 ab initio ro-vibrational spectroscopy...
TRANSCRIPT
Hill, J.G., Mitrushchenkov, A.O., and Peterson, K.A. (2013) Ab initio ro-vibrational spectroscopy of the group 11 cyanides: CuCN, AgCN, and AuCN. Journal of Chemical Physics, 138 (13). 134314. ISSN 0021-9606
A copy can be downloaded for personal non-commercial research or study, without prior permission or charge Content must not be changed in any way or reproduced in any format or medium without the formal permission of the copyright holder(s)
When referring to this work, full bibliographic details must be given
http://eprints.gla.ac.uk/76832/
Deposited on: 11 April 2013
Enlighten – Research publications by members of the University of Glasgow
http://eprints.gla.ac.uk

1
Ab initio ro-vibrational spectroscopy of the group 11 cyanides: CuCN, AgCN, and AuCN J. Grant Hill† School of Chemistry, Joseph Black Building, University of Glasgow, Glasgow G12 8QQ,
U.K.
Alexander O. Mitrushchenkov Université Paris-Est, Laboratoire Modélisation et Simulation Multi Echelle, MSME UMR
8208 CNRS, 5 bd Descartes, 77454 Marne-la-Vallée, France
Kirk A. Peterson Department of Chemistry, Washington State University, Pullman, Washington 99164
Abstract Accurate near-equilibrium potential energy and dipole moment functions have been
calculated for the linear coinage-metal cyanides CuCN, AgCN, and AuCN using coupled
cluster methods and sequences of correlation consistent basis sets. The explicitly
correlated CCSD(T)-F12b method is used for the potential energy surfaces (PESs) with
inclusion of core correlation, and is combined with contributions from molecular spin-
orbit coupling, scalar relativity, and effects due to higher order electron correlation. The
resulting composite PESs are used in both perturbative and variational calculations of the
ro-vibrational spectra. In addition to accurate equilibrium geometries, the ro-vibrational
spectra are predicted, which are found to be relatively intense in the 200 - 600 cm-1 range
due to the bending and metal-carbon stretching modes. The CN stretch near 2165 cm-1 is
also predicted to carry enough intensity to allow its observation by experiment. A strong
Fermi-resonance is predicted between the first overtone of the bend and the fundamental
of the metal-carbon stretch for both CuCN and AgCN. The heats of formation at 0 K are
predicted from their calculated atomization energies to be 89.8, 88.6, and 104.5 kcal
mol-1 for CuCN, AgCN, and AuCN, respectively.
† email addresses: [email protected], [email protected],
2
I. INTRODUCTION
The group 11 metal cyanides have a number of chemical uses, including the role
of CuCN as a reagent in the selective formation of C–C and C–Si bonds (see Ref. 1), as
intermediates in the MacArthur-Forrest process of mining (see Ref. 2 and references
therein), and the relation of AuCN to [Au(CN)2]–, which is used in gold production.
There is also interest in the qualitative description of the nature of the M–CN bond. Both
experimental and theoretical studies agree that the Au–C bond is shorter and stronger
than Ag–C, with photoelectron velocity map imaging studies3 indicating that the Cu–C
bond is slightly weaker than that in Au–C. While the work of Frenking and co-workers4
have interpreted the bonding as being predominately ionic (M+-CN-) with only small
contributions from π bonding, some debate still remains as to the bonding character,
particularly in AuCN. Zaleski-Ejgierd et al.5 reasoned that as the theoretical Au–C bond
distance is only slightly larger than the sum of the triple-bond covalent radii, this bond
should be classified as a multiple-bond, whilst Wu et al.3 used a frontier orbital analysis
to show that there is little back donation from the metal and argue that the Au–C bond is
simply a short single bond. Wu et al.3 also carried out a natural bond orbital analysis that
indicated Cu–CN and Ag–CN can be described as ionic bonding, whilst Au–CN is
covalently bound, in line with their experimental electron affinities.
Experimental data on the monomeric gas-phase group 11 cyanides have been
produced using microwave spectroscopy,6,7 photoelectron spectroscopy,8 and
photoelectron velocity-map imaging3 as mentioned above. These experiments have
yielded accurate rotational constants, estimates of some of the vibrational frequencies,
and their electron affinities. The highest level theoretical study reported in the literature
to date on all three molecules utilized the coupled cluster with singles, doubles and
perturbative triples [CCSD(T)] method, along with quadruple-zeta quality basis sets and a
correction for spin-orbit (SO) effects.5 CuCN was also compared to the CuNC isomer at
the CCSD(T) level using scalar relativistic effects, with the former found to be 11.5 kcal
mol-1 lower in energy.9 These studies have superseded a number of earlier, somewhat
lower-level calculations,4,10-12 although all are in agreement that these molecules are
linear with 1Σ+ electronic ground states.

3
High-accuracy theoretical calculations on transition metal containing species have
traditionally been regarded as significantly more demanding than those on equivalently
sized molecules made up of main group elements. This is due to a number of factors,
including the number of electrons present, the greater likelihood of multireference
character, the importance of relativistic effects, and the observed slower convergence
with respect to basis set size. The development of systematically convergent, correlation
consistent basis sets paired with relativistic pseudopotentials (PPs) has gone some way to
remedying these problems for single reference cases, but until recently slow convergence
has restricted the ultimate accuracy of wavefunction-based calculations on transition
metals. The advent of explicitly correlated methods (for recent reviews of explicitly
correlated methods, see Ref. 13), particularly the CCSD(T)-F12b method,14,15 where the
basis set size required to reach a desired accuracy is greatly reduced, has the implication
that high-accuracy investigations of ab initio spectroscopy and thermochemistry can now
be carried out on a significantly wider range of systems. By utilizing compact auxiliary
basis sets specifically designed to produce well-controlled errors in F12 calculations, the
present work demonstrates that CCSD(T)-F12b calculations, as part of a composite
protocol, can be used on transition metal containing species to produce high accuracy
potential energy surfaces (PESs) and spectroscopic properties that are in excellent
agreement with published experimental data. Composite PESs calculated for CuCN,
AgCN, and AuCN, combined with dipole moment functions, have been employed in this
work in vibrational perturbation theory and variational nuclear motion calculations to
produce ro-vibrational spectroscopic constants. Accurate thermodynamic properties of
these molecules, namely atomization and formation enthalpies, have also been calculated.
II. METHODOLOGY
Near-equilibrium potential energy surfaces (PESs) were calculated using a
composite approach for a total of 50 symmetry unique points on the PES of each
molecule in the internal coordinates r1 (metal to carbon distance), r2 (C-N distance), and
θ (bond angle). These geometries approximately covered the ranges -0.3 ao ≤ r1–r1e, r2-r2e
≤ +0.5 ao and 140º ≤ θ ≤ 180º. For CuCN and AgCN each point on the PES was
evaluated as:
4
E(r1,r2 ,θ) = CCSD(T) + ΔCV + ΔDK + ΔHC + ΔSO , (1)
where ΔCV is a correction for the correlation of outer-core electrons, ΔDK accounts for
the residual scalar relativistic effects using the Douglas-Kroll-Hess (DKH)
Hamiltonian,16 ΔHC is a correction for higher level electron correlation effects beyond
CCSD(T), and ΔSO accounts for molecular spin-orbit coupling. The composite energy
for AuCN was slightly modified to be:
E(r1,r2 ,θ) = CCSD(T) + ΔCV + ΔDK + Δ4 f + ΔHC + ΔSO , (2)
where Δ4f is the effect of correlating the 4f electrons on Au.
The CCSD(T) energies were calculated using the explicitly correlated CCSD(T)-
F12b method,14,15 with the cc-pVnZ-F12 (n = D, T, Q) series of basis sets for C and N,17
and the aug-cc-pVnZ-PP (n = D, T, Q, 5) series of basis sets18 and small-core relativistic
pseudopotentials19 for the transition metal elements. In the following, combinations of
basis sets with the same cardinal number n will be referred to simply as aVnZ, while the
mixed basis of cc-pVQZ-F12 and aug-cc-pV5Z-PP will be denoted aV5Z*. Density
fitting (DF) within the correlation treatment used the aug-cc-pVnZ(-PP)/MP2Fit20,21
auxiliary basis sets (ABSs), with the Fock matrix fit using the def2-QZVPP/JKFit22 ABS
for transition metals and cc-pVnZ/JKFit23 sets for lighter elements. The exact
combinations of orbital basis sets (OBS) and ABSs are the same as those recommended
elsewhere.24 The CABS approach25 for the resolution of the identity (RI) employed the
compact OptRI ABSs matched to the corresponding OBS.26,27 A value of 1.4 a0−1 was
utilized for the geminal Slater exponent, as this has been shown to provide good results
for other transition metal containing systems.27 As existing basis set extrapolation
schemes for F12 methods have not been calibrated for transition metal elements,
extrapolation of correlation energies was not carried out in this investigation, but previous
experience suggests that the largest basis set combinations of this work should provide
results very close to the true complete basis set (CBS) limit. The total electronic energy
included the contribution from CABS singles relaxation.14,28 In the few atomic
calculations that were carried out, the CCSD(T)-F12b calculations utilized restricted
open-shell Hartree-Fock orbitals but with some spin contamination allowed in the CCSD
calculations,29,30 i.e., R/UCCSD(T)-F12b.
5
The ΔCV correction was obtained as Ecore+val − Eval , where Ecore+val correlated the
1s electrons on C and N, the 3s3p electrons on Cu, 4s4p on Ag, and 5s5p on Au (the
‘outer-core’ electrons for the transition metal elements). Both of the required energy
evaluations were performed at the CCSD(T)-F12b level using the cc-pCVTZ-F1231 OBS
for C and N, and the aug-cc-pwCVTZ-PP OBS for the transition metal elements.18 DF of
the Fock matrix used the same ABSs as in the valence-only calculations, with all other
two-electron integral densities fitted with the aug-cc-pwCVTZ(-PP)/MP2Fit21 ABSs.
OptRI ABSs27,31 were once again employed in the CABS approach, as was a geminal
Slater exponent of 1.4 a0−1 .
The ΔDK term provides corrections for two components, firstly the scalar
relativistic effects of C and N, and secondly an estimate of errors due to the PP
approximation. This term was evaluated as ΔDK = EDK − EPP , where EDK is the total
DKH CCSD(T) energy. Two different values were calculated, a frozen-core result using
the cc-pVTZ-DK18,32 basis sets and a correction that used valence and outer-core
correlation (as in ΔCV above) with the cc-pwCVTZ-DK18,32,33 basis sets. For CuCN and
AgCN EDK is computed using the second-order DKH Hamiltonian,16 with third-order
DKH34 and the corresponding DKH3 contracted basis sets for Au employed for AuCN.18
EPP was computed using cc-pVTZ35 and cc-pVTZ-PP18 basis sets in the valence case,
where the valence and outer-core calculations employed the cc-pwCVTZ33 and cc-
pwCVTZ-PP18 sets. Care was taken to ensure the 4f orbitals were rotated below the 5s
and 5p orbitals in the AuCN case for these calculations.
For AuCN the Δ4f correction was evaluated at the CCSD(T) level as
Δ4 f = EDKH-CV4f 5s5p − EDKH-CV5s5p , with a second-order DKH Hamiltonian used throughout.
Both sets of calculations correlated the 1s electrons on C and N and the 5s5p orbitals on
Au. The EDKH-CV4f 5s5p energies also correlated the 4f electrons on Au, which required a
specific OBS to be developed (denoted cc-pwCVTZ-DK+4f) in the same manner as those
reported previously for the other 5d elements Hf–Pt.36 These basis sets are based on the
cc-pwCVTZ-DK all-electron sets,18 augmented with additional tight 2f2g1h functions
optimized for 4f correlation. The resulting exponents and contraction coefficients for this
basis set, together with the analogous set for Hg, are included as supporting information.
6
The cc-pwCVTZ-DK basis set was utilized for all other elements in the calculation of this
term.
The effects of higher order electron correlation beyond CCSD(T), ΔHC, were
evaluated using high order coupled cluster theory within the frozen core approximation:
ΔHC = ΔT+ Δ(Q) (3)
ΔT corrects for the effects of iterative triple excitations30,37 as ΔT = ECCSDT − ECCSD(T) ,
where both energies were computed using the cc-pVTZ35 and cc-pVTZ-PP18 basis sets.
The effects of the noniterative quadruple excitations,38 Δ(Q), is determined by
Δ(Q) = ECCSDT(Q) − ECCSDT , using the cc-pVDZ35 and cc-pVDZ-PP18 basis sets. As an
alternative to Δ(Q), the effects of quadruple excitations were also approximated using the
CCSDT(Q)Λ method39 with a resulting correction Δ(Q)Λ = ECCSDT(Q)Λ − ECCSDT .
In order to determine the effects of molecular spin-orbit (SO) coupling on the
PESs, two relativistic CCSD(T) calculations40 were carried out at each geometry defining
the surfaces. The first utilized the molecular-mean-field Hamiltonian approach within the
Exact 2-component Dirac-Coulomb Hamiltonian, X2Cmmf-DC-CCSD(T).41 The second
calculation was nearly identical but utilized the spin-free Hamiltonian of Dyall.42 The
total SO effect at each geometry was obtained as the difference in these two energies. In
both cases standard uncontracted cc-pVTZ basis sets35,43 were used for C, N, and Cu
while the relativistic cc-pVTZ sets (uncontracted) of Dyall44 were used for Ag and Au.
For the calculation of atomization energies, which required open-shell atomic
calculations, the X2Cmmf approach could not be used. In these cases the molecular mean
field 4DC** Hamiltonian as described in Ref. 41 was used for both the metal atoms and
the required molecular calculations at the equilibrium geometries. Atomic spin-orbit
corrections for C and N were derived from their experimental spin-orbit energy levels.45
Except for the spin-orbit calculations, which were carried out with the DIRAC
program,46 all other ab initio calculations were performed with the MOLPRO47 package
of ab initio programs and the MRCC48 program (for high order coupled cluster)
interfaced to MOLPRO.
The grids of 50 energies at the various stages of the composite protocol detailed in
Eqs. (1) and (2) were fit to polynomial functions of the form:

7
V (Q1,Q2 ,Q3) = Cijk (Q1)i (Q2 ) j (Q3)k
ijk∑ (4)
Where the coordinates Q1 = r1 – r1e, , Q2 = r2 – r2e, and Q3 = θ – θe. A full set of quartic
coefficients were employed, along with diagonal quintic and sextic. The root-mean-
square errors of the fits were 0.07, 0.04 and 0.17 cm-1 for CuCN, AgCN and AuCN,
respectively, with respective maximum errors of 0.24, 0.09 and 0.40 cm-1. The surface
fitting and determination of spectroscopic constants via second-order perturbation
theory49 was carried out using the SURFIT50 program. The resulting coefficients from Eq.
(4) are provided as supplementary material.51
Electric dipole moments were calculated at the same 50 points as the PESs using
the CCSD(T) method with the aug-cc-pVTZ basis sets for C and N35,55 and the aug-cc-
pVTZ-PP basis sets and pseudopotentials for the group 11 elements. Finite electric fields
of ±0.002 a.u. were applied to the one-electron Hamiltonian, and the resulting y and z
components of the dipoles were separately fit to quartic polynomials of the same form as
Eq. (4). The expansion coefficients of the fitted functions are provided in Table SII in the
supplementary material. As shown there, the equilibrium dipole moments are all quite
large, being -7.21 D for CuCN, -7.70 D for AgCN, and -6.01 D for AuCN with the
negative sign indicating the negative end of the dipole is towards N.
Calculations of the ro-vibrational spectra were performed with the EVEREST
code,52 which employed the composite potential energy surfaces described above and 3-
dimensional electric dipole moment functions. A similar approach has also recently been
used to investigate both the CCN and HS2 radicals.53,54 EVEREST uses the exact kinetic
energy operator in internal coordinates and a DVR approach. Jacobi coordinates were
used, and it was verified that the results fully agree with valence bond-length, bond-angle
(BLBA) coordinates. The basis sets utilized for the CN bond and Jacobi angle were 40
Sinc-DVR functions56 on a 1.85–2.75 bohr interval, and 180 associated Legendre
functions, respectively. Forty Sinc-DVR functions were used for the coinage metal to CN
center-of-mass distance, built on the 3.8–6.4 bohr interval for CuCN and AgCN, and a
4.2–6.0 bohr interval for AuCN. In all cases, full 3D (without contractions) DVR
diagonalization was performed for rotation-free wave functions up to 3000 cm-1 (3800
cm-1 for CuCN) above the ground vibrational level, and for = 0 – 6 (vibrational angular

8
momentum quantum number). The iterative Jacobi-Davidson algorithm was used for the
diagonalization. These vibrational functions were further used to build and diagonalize
the full ro-vibrational Hamiltonian for J = 0 – 3, and to evaluate vibrational transition
dipole moments in the Eckart frame. The transition dipole moments, which were
calculated using the partition function-based formula of Ref. 53, were used to simulate
vibrational spectra at T = 5 K and T = 300 K.
III. RESULTS AND DISCUSSION
A. The X 1Σ+ states
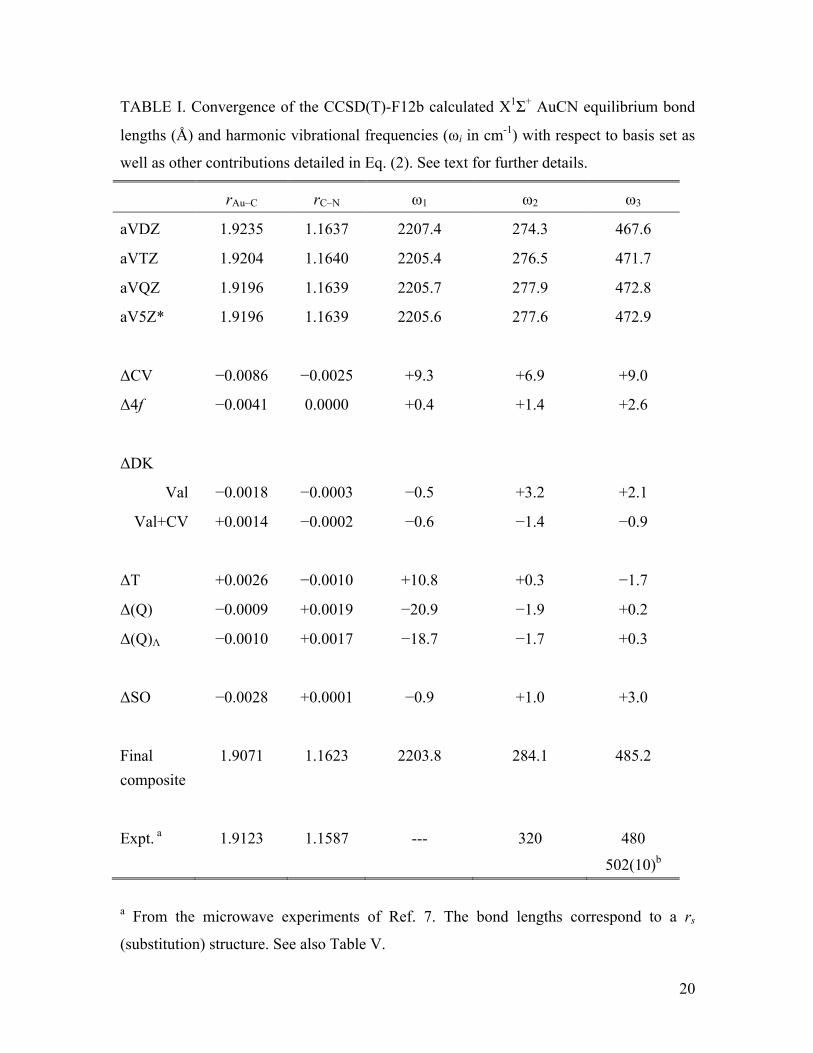
The dependence of the equilibrium bond lengths and harmonic frequencies with
respect to basis set size and the various contributions in Eq. (2) are presented in Table I
for AuCN. Note that throughout this text, ω1 corresponds principally to the CN stretch,
ω2 to the bend, and ω3 to the M-CN stretch. It can be seen in Table I that the convergence
of the CCSD(T)-F12b results with respect to basis set size is very rapid; the aVDZ basis
provides reasonable results and beyond aVTZ only minimal changes of less than one
thousandth of an angstrom and around one wavenumber are observed. The effect of
increasing the basis set on Au from aug-cc-pVQZ-PP to aug-cc-pV5Z-PP is practically
negligible. Although this suggests that using the aVQZ basis with the F12b method is
likely to be sufficient in most cases, the aV5Z* basis is used as the CCSD(T) energy in
Eqs. (1) and (2) for the rest of this investigation. Upon comparison with previous
conventional CCSD(T) calculations,5,10 it can be seen that the present results demonstrate
significantly longer bond lengths (by 0.0084 Å for Au–C and 0.0016 Å for C–N
compared to the cc-pVQZ work of Ref. 5) and correspondingly red-shifted vibrational
frequencies (–9.8 cm-1 for ω1, –11.3 cm-1 for ω2, and –9.4 cm-1 for ω3 upon comparison to
Ref. 5). This is an indication that the previous investigations did not reach the same level
of convergence with respect to the basis set as afforded by explicitly correlated
wavefunctions, or that the additional diffuse functions in the current investigation had a
larger effect than might have been anticipated.
The effect of correlating the 1s electrons on C and N and the outer core electrons
on Au contracts the Au–C and C–N bond lengths by 0.0086 and 0.0025 Å, respectively. It

9
also blue shifts the harmonic frequencies by 9.3, 6.9 and 9.0 cm-1. This effect is roughly
equivalent to that observed previously at the CCSD(T)/cc-pVQZ level.5 A comparison of
correlating only the valence electrons in the ΔDK correction (Val in Table I) and
correlating valence and outer-core (Val + CV in Table I) indicates that while this
correction is small in magnitude, these two choices can lead to contributions of opposite
sign. For example, correlating only the valence electrons reduces the Au–C bond length
by –0.0018 Å, yet correlating both the valence and outer core increases the bond length
by 0.0014 Å. Overall the effect of the ΔDK correction is small, especially when both the
valence and outer core are correlated, and the latter choice will be employed in the
composite scheme herein.
The Au 4f electrons are typically replaced by the PP, yet their correlation can lead
to non-negligible effects in some properties of 5d transition metal elements.36 The results
of the Δ4f correction for AuCN in Table I show that the biggest effect is on the Au–C
bond length, which is contracted by 0.0041 Å. The effect on the vibrational frequencies
reaches a maximum of +2.6 cm-1 for ω3, indicating that when high accuracy is the goal, 4f
correlation should be accounted for. In terms of the higher order correlation corrections,
ΔHC, it can be seen that the ΔT and Δ(Q) components move the bond lengths and
harmonic frequencies in opposite directions. The overall effect is to increase the Au–C
and C–N bond lengths by 0.0017 and 0.0009 Å, respectively, and red shift the
frequencies by –10.1, –1.6 and –1.4 cm-1. The differences between the (Q) and (Q)Λ bond
lengths and harmonic frequencies are small, with the largest difference being a 2.2 cm-1
change in ω1. The precision of the experimental results currently available is not
sufficient to establish which of these approaches produces the more accurate results, but
CCSDT(Q) was chosen for the production of the PESs simply because it is more
commonly used. Whilst checking the convergence with respect to even higher order
correlation or using larger basis sets than cc-pVDZ(-PP) for Δ(Q) is desirable, the steep
scaling (recalling that each PES requires 50 points) of these methods ensures that such
calculations are beyond the computational resources available at the time of this
investigation.
The inclusion of molecular SO effects reduces the Au–C bond length by 0.0028 Å,
but they have a smaller influence on the remaining properties in Table I, increasing the
10
C–N bond length by a negligible 0.0001 Å, decreasing ω1 by 0.9 cm-1, and increasing ω2
and ω3 by 1.0 and 3.0 cm-1, respectively. On the whole, as expected for this closed shell
molecule, the SO effects are small compared to the majority of the other corrections to
the composite energy, but are essential for an accurate description of the bond lengths and
vibrational frequencies. The change in bond lengths obtained from these coupled cluster
SO calculations is of the same order as those observed previously at the DFT zeroth-order
relativistic approximation (ZORA) level.5 The experimental gas-phase data is derived
from rotational spectroscopy and due to the indirect nature in which vibrational data is
produced from such studies, the harmonic vibrational frequencies should be treated as
rough estimates. Still, agreement between the best theoretical results from Table I and
experimental data is good, especially for ω3, where the difference is only 5.2 cm-1. The
experimental bond lengths reported in Table I correspond to a rm(2) structure and hence
are not directly comparable to the calculated re values. Nevertheless, the agreement
between experiment and theory is reasonably good at around 0.005 Å. A more detailed
comparison of molecular structures can be found below.
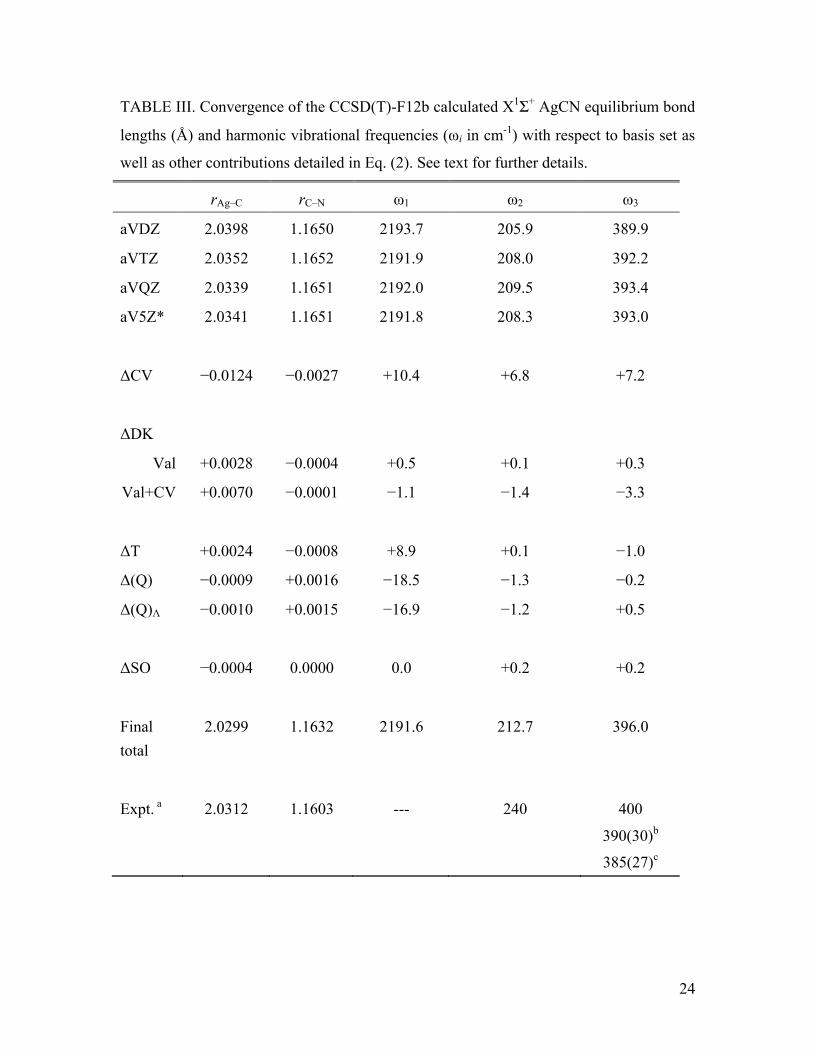
Convergence data analogous to Table I for CuCN and AgCN are detailed in
Tables II and III, respectively, where it can be seen that, given a few small differences,
generally the trends are the same. One notable exception are the SO effects, which are
essentially negligible for both CuCN and AgCN. The significant effects of scalar
relativity can be observed by comparing the bond lengths and harmonic frequencies of
the three species. As detailed previously by Schwerdtfeger et al.11 for several Au(I)
molecules, relativity leads to a shortening of the metal-ligand bond length and this is
clearly observed in the present case where the M-C distance in AuCN is intermediate in
length between that of CuCN and AgCN. Also in agreement with Ref. 11, the stretching
force constants are even more sensitive to this relativistic bond contraction, whereby the
M-C stretching frequency for AuCN is larger than in AgCN and CuCN by 89 and 7 cm-1,
respectively. As noted above, the equilibrium dipole moment of AuCN is more than 1 D
smaller in magnitude then either CuCN or AgCN. This is also consistent with an
increased negative charge at the Au atom due to the relativistic enhancement of its
electronegativity.11
11
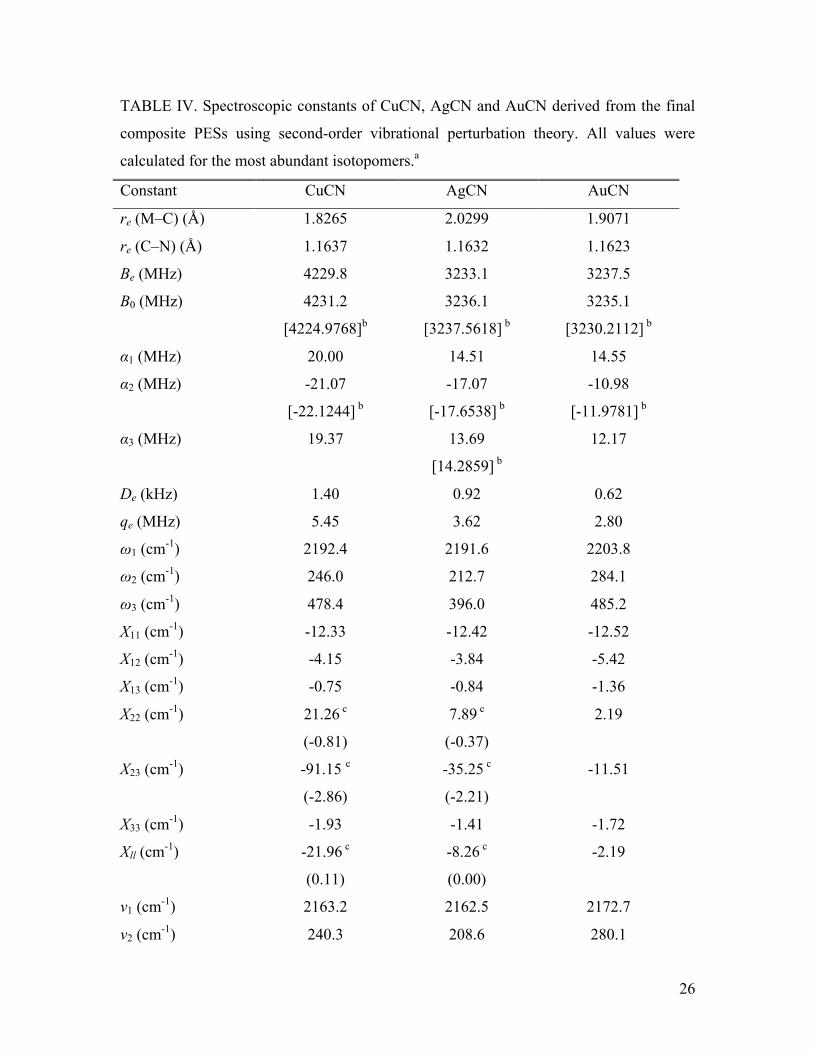
Spectroscopic constants from second-order vibrational perturbation theory based
on the final composite PESs for CuCN, AgCN and AuCN are given in Table IV.
Comparison with previous theoretical work indicates that the M–C bond distance is much
more sensitive to level of theory than r(C–N); the CCSD(T)/cc-pVQZ + SO results of
Zaleski-Ejgierd agree with the present C–N bond lengths to within 0.0008 Å. while the
M-C bond distances only agree to around 0.0060 Å, although this is improved to 0.0029
Å in the case of Cu–C. The experimental values of B0 are also given in Table IV for
CuCN,6 AgCN7 and AuCN.7 The theoretical results in Table IV agree to within 6.2, 1.5
and 4.9 MHz, respectively, representing very good agreement. Likewise the ab initio
values for the vibration-rotation interaction constants are in excellent agreement with
those values available from experimental work, agreeing to within about 1 MHz in all
cases. The trend of the M–CN stretching vibrational frequencies (ω3) matches those from
experimental data, with Ag < Cu < Au, although a quantitative comparison is difficult
due to the approximate nature of the vibrational frequencies obtained from rotational
spectroscopy experiments and the large error bars for the frequencies determined from
photoelectron experiments.3,8
For both CuCN and AgCN a strong Fermi resonance is predicted between 2ω2
(bend) and ω3 (M-C stretch), with the strength of the interaction slightly decreasing from
Cu to Ag. This resonance strongly affects the calculated values of the X22, X23, and Xll
anharmonicity constants, which is easily observed by comparison with the analogous
AuCN values in Table IV. Of course the resulting anharmonic frequencies computed with
these anharmonicities are also significantly affected. While this resonance is naturally
accounted for in the variational calculations discussed below, Table IV also shows results
obtained by employing the deperturbation procedure of Allen et al. 57 This involved
factoring the perturbation theory equations for the anharmonicity constants and deleting
those terms that involve the (2ω2-ω3) resonant denominators. The resulting deperturbed
values are also shown in Table IV. The fundamental frequencies can then be obtained by
diagonalization of the matrix58
E(001) K223 2
K223 2 E(020)
⎡
⎣
⎢⎢
⎤
⎦
⎥⎥
(5)
12
where E(001) and E(020) are the deperturbed energy levels calculated from the
deperturbed anharmonicity constants and the Fermi resonance constant K223 = −φ223 2 ,
where φ223 is the cubic force constant in normal coordinates (K223 = 48.82 cm-1 and 44.06
cm-1 for CuCN and AgCN, respectively). The final eigenstates are strongly mixed,
55%:45% in CuCN and 69%:31% in AgCN, but the resulting eigenvalues are now in
excellent agreement with the variational results discussed below.
B. Variational calculation of the ro-vibrational spectra
Selected vibrational band origins, together with their calculated integrated
intensities, are shown in Table V. A larger set of vibrational levels are given in Table
SIV of the Supplemental Information. Upon comparing to the fundamental frequencies of
Table IV calculated via vibrational perturbation theory, the variational results agree to
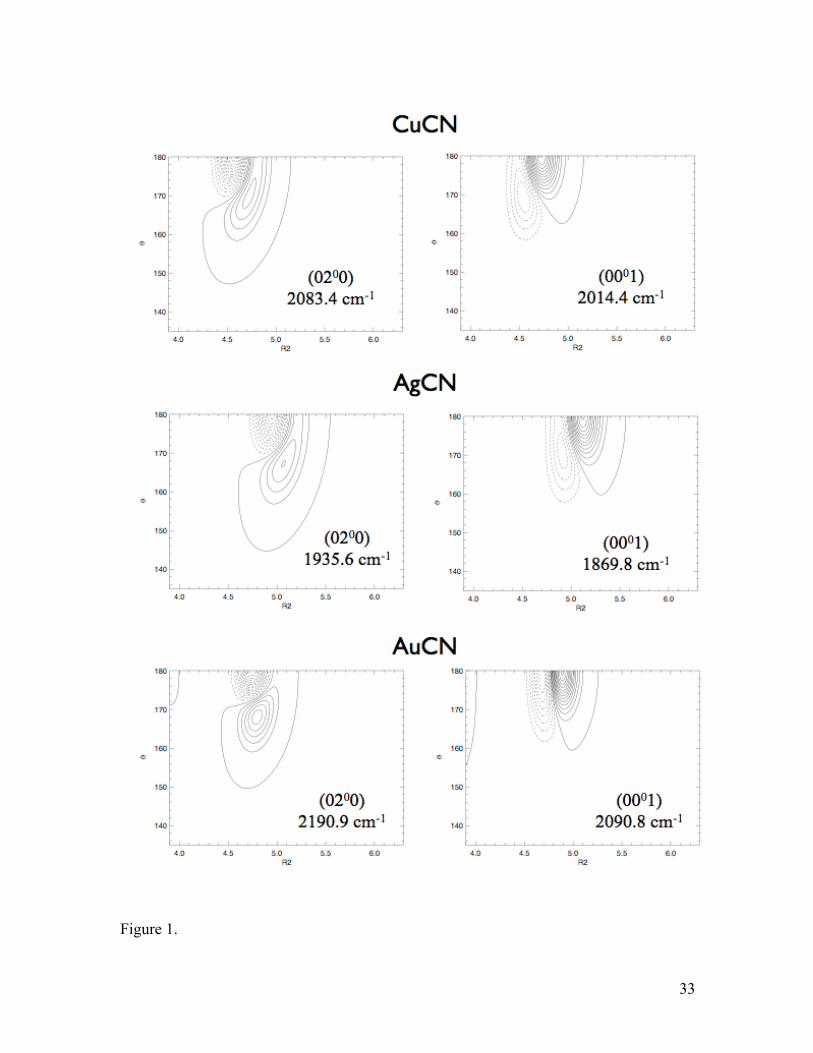
better than 1 cm-1. Of course of particular interest is the Fermi resonance interaction
between the first overtone of the bend, (0200), with the M-C stretching mode, (0001), for
M = Cu and Ag. Comparison of the variationally calculated band origins and the
eigenvalues of Eq. (5) also agree to within 1 cm-1. The assignment of these bands was
difficult due to the heavy mixing of the vibrational wavefunctions. The vibrational
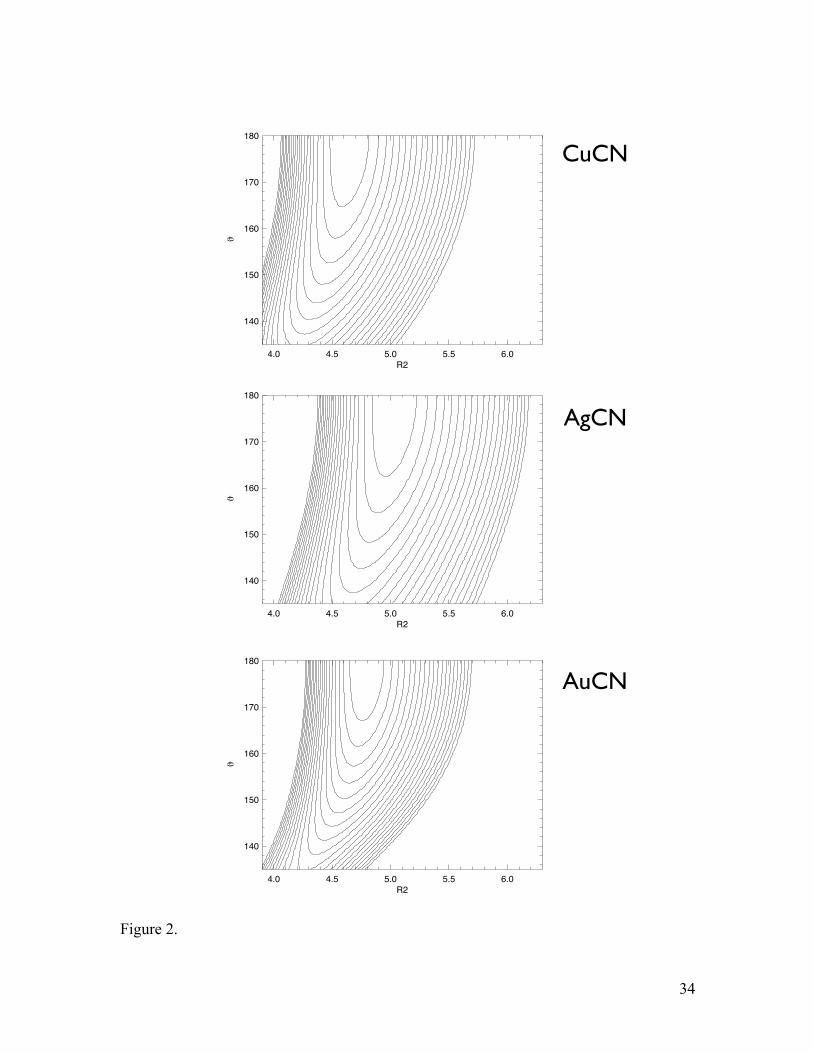
wavefunctions for these two modes are shown in Figure 1 for all three molecules as a
function of the bending angle θ and the M-C distance (labelled R2 in these figures). The
curvatures of these wavefunctions closely follow those of the PESs, which are shown in
Figure 2. Clearly noticeable is how the wavefunctions evolve from CuCN to AuCN,
where in the latter case the wavefunctions are nearly pure bending and stretching. The
assignments for CuCN and AgCN were facilitated by inspecting the wavefunctions in the
R1, R2 plane where the bending mode should be nodeless but also by the perturbation
analysis via Eq. (5) above. Related to this strong Fermi resonance in CuCN and AgCN, as
well as the lack of it in AuCN, is the magnitude of the -type vibrational anharmonicity in
the (020) band. As seen in Table SIV, the (0200) level lies above the (0220) by about 40
cm-1 in CuCN, by about 20 cm-1 in AgCN, and less than 10 cm-1 in AuCN. Similar trends
are observed in the higher bending overtones, as well as the stretch-bend combination
bands with v2 > 1.
13
In all three molecules the most intense vibrational band is calculated to be the
metal-C stretching fundamental, (0001), which lies between 370 and 470 cm-1. In all three
molecules the CN stretching fundamental near 2165 cm-1 also carries significant
intensity. In regards to the bending modes, the fundamental band is fairly intense in all
three cases, and due to the Fermi interaction with the intense (0001) fundamental (CuCN
and AgCN), the first overtone of the bending mode is also relatively intense - even
slightly more than its fundamental in the case of AgCN. In regards to the combination
bands, the (1110) carries some intensity but in general those are weak due to relatively
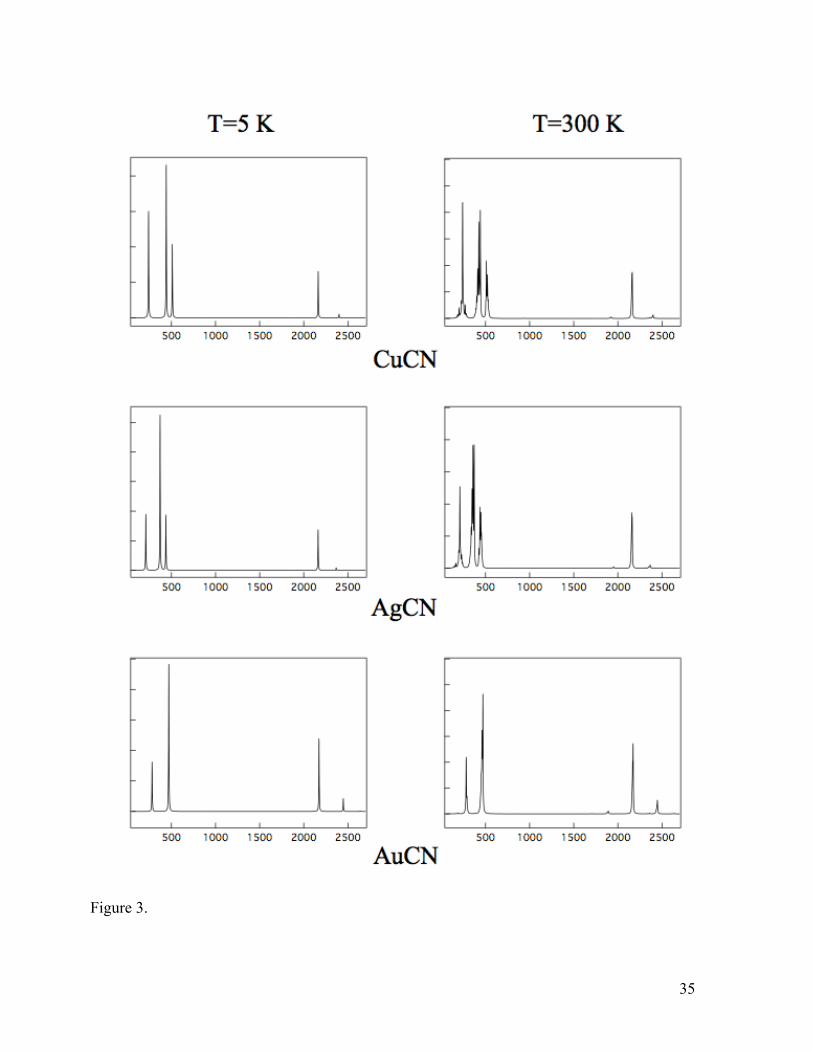
small anharmonic couplings. Due to the low-lying bending mode, hot bands associated
with this level are predicted to have significant intensity at 300 K, particularly the (0111)
← (0110) band that lies near the (0001) fundamental. Together with the hot bands arising
from the first overtone of the bend, this leads to a complicated band structure at and
below 500 cm-1 as shown in the simulated vibrational spectra at temperatures of 5 and
300 K in Figure 3, particularly for CuCN and AgCN.
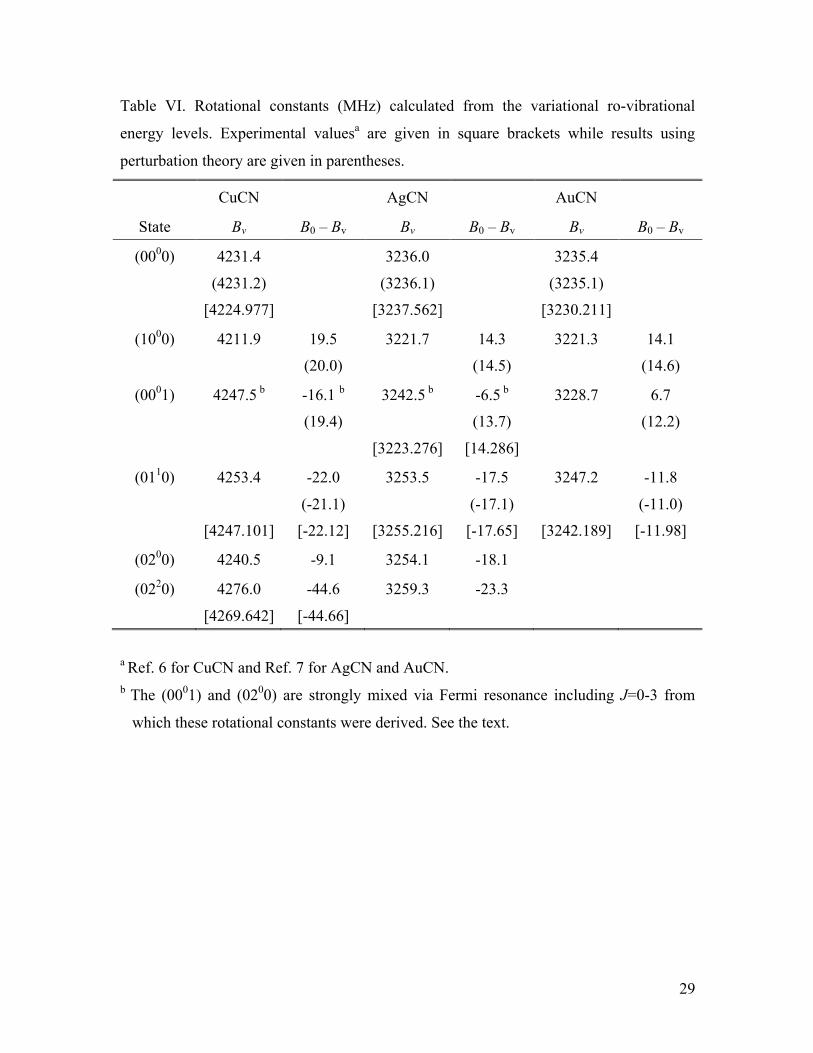
In order to obtain vibration-rotation interaction constants that could be compared
to the perturbation theory results of Table IV, rotational constants were calculated from
the variational ro-vibrational energies in a few cases. These involved additional
calculations for J=0–3 in a vibrational basis that included states up to 7000 cm-1 in order
to obtained converged results for the (1000) state. The results are shown in Table VI and
compared to the available experimental values. For the most part the agreement with
experiment is excellent for the rotational constants, within 6 MHz in all cases, just as in
the perturbation theory results of Table IV. In particular the ground state rotational
constants from the variational calculations agree with the perturbation theory results to
within 0.3 MHz. The variationally calculated value for B(0001), however, is strongly
affected by the Fermi resonance of this level with the bending overtone as discussed
above, which yields a (0001) rotational constant larger than the ground state value. In the
case of AgCN, the rotational constant in ν3=1 was obtained from the microwave
spectroscopy experiments of Okabayashi et al.,7 and as shown in Table VI it is smaller
than the ground state value as is typically the case for a stretching fundamental. This
yields a B0–Bv value that is in good agreement with the value of α3 obtained from
vibrational perturbation theory (Table IV). The reason for the poor comparison with the
14
variationally calculated result is presumably due to the present calculations being
restricted to very low values of J, i.e., J=0 – 3, while the experimental work observed
transitions involving J from 29 to 49 where evidently the Fermi resonance is no longer
very active.
In order to further examine the accuracy of the equilibrium structures produced by
the composite method, semi-experimental equilibrium geometries (reSE) were calculated
by combining the ab initio rotation-vibration interaction constants (αi) of Table IV with
experimental values59 of the ground state rotational constants B0 via the Kraitchman
equations.60 The resulting bond distances are shown in Table VII, along with some of the
experimental effective structures (r0, rs, and rm(2) ) and the purely theoretical equilibrium
values produced in this investigation (re). Excellent agreement is observed between re and
reSE C–N bond distances, with the largest deviation being just 0.0003 Å. The agreement
for the M–C bond distances is still very good, but nearly an order of magnitude greater
deviations, 0.001 to 0.0023 Å. While it is well known that reaching high accuracy is
considerably more difficult for transition metals than lighter elements, Table I suggests
that the bond distances are well converged with respect to basis set at the CCSD(T)-F12b
level. A likely source of error in the current ab initio values could be found in the higher
order electron correlation terms, as the ΔT and Δ(Q) components lengthen and contract
the Au-C bond distance by +0.0026 and -0.0009 Å, respectively. It is possible that even
higher level electron correlation, e.g., CCSDTQP, may increase agreement with the semi-
experimental data, or particularly that larger basis sets for the ΔT and Δ(Q) corrections
may also have an effect. However, increasing the correlation level or basis set(s) is
currently out of reach for this MCN series of molecules.
C. Thermochemistry
Atomization energies for the X1Σ+ states of the coinage metal cyanides were
computed from the composite potentials using Eqs. 1 and 2, where now the ΔSO term
also included atomic SO contributions. All of the individual contributions entering into
the ΣDe values are shown in Table VIII. Including the zero-point corrections obtained
from the final composite potential energy surfaces (Table SIV) produces ΣD0 values of
15
273.08, 261.84, and 265.45 (all in kcal mol-1). Enthalpies of formation at 0 K, ΔHf(0 K),
were then calculated using reference ΔHf(0 K) values for the atoms (170.024 kcal mol-1
for C,61 112.469 kcal mol-1 for N,61 80.36 kcal mol-1 for Cu,62 67.98 kcal mol-1 for Ag,62
and 87.46 kcal mol-1 for Au63). The resulting ΔHf(0 K) values are 89.8 kcal mol-1, 88.6
kcal mol-1, and 104.5 kcal mol-1 for CuCN, AgCN, and AuCN, respectively. Based
primarily on the results for the higher order correlation contributions, where the ΔT and
Δ(Q) contributions are opposite in sign and Δ(Q) and Δ(Q)Λ have comparable
magnitudes, these molecules appear well-behaved in regards to the present composite
methodology. Hence the final predicted atomization energies and formation enthalpies
are expected to be accurate to at least 1 kcal mol-1.
IV. CONCLUSIONS
In the present work accurate near-equilibrium potential energy and dipole moment
surfaces have been calculated for the closed-shell, linear, coinage-metal cyanides. The
PESs were determined using a composite approach utilizing the explicitly correlated
CCSD(T)-F12b method with corrections for core correlation, molecular spin-orbit
coupling, scalar relativity, and electron correlation beyond CCSD(T). Ro-vibrational
spectroscopic properties have been calculated from the fitted PESs using both 2nd-order
vibrational perturbation theory and variational methods. Where available the agreement
with experiment is excellent and numerous predictions have been made, especially for the
ro-vibrational spectra. In particular a strong Fermi resonance between the first overtone
of the bending mode and the fundamental of the metal-C stretch is predicted for both
CuCN and AgCN. Semi-experimental equilibrium structures are also reported that utilize
the ab initio vibration-rotation interaction constants and the accurate experimental ground
state rotational constants. The same composite approach has been used to determine
accurate enthalpies of formation for each species.
ACKNOWLEDGMENTS
J.G.H. is grateful to the Royal Society of Edinburgh and Scottish Government for a
personal research fellowship. K.A.P. acknowledges the support of the U.S. DOE
16
BES/HEC through grant DE-FG02-12ER16329. The authors are particularly indebted to
the critical reading of the manuscript by the referees. The authors would like to thank
Prof. Pekka Pyykkö for bringing these interesting molecules to our attention. K.A.P.
thanks Dr. Stefan Knecht for his help with the spin-orbit calculations.
REFERENCES
1 S. H. Bertz and E. H. Fairchild, in Encyclopedia of Reagents for Organic Synthesis,
edited by L. Paquette (Wiley, New York, 1995), pp. 1341. 2 J. Gómez-Díaz, K. Honkala, and N. López, Surf. Sci. 604, 1552 (2010). 3 X. Wu, Z. Qin, H. Xie, R. Cong, X. Wu, Z. Tang, and H. Fan, J. Phys. Chem. A 114,
12839 (2010). 4 O. Dietz, V. Rayon, and G. Frenking, Inorg. Chem. 42, 4977 (2003); A. Veldkamp and
G. Frenking, Organomet. 12, 4613 (1993). 5 P. Zaleski-Ejgierd, M. Patzschke, and P. Pyykkö, J. Chem. Phys. 128, 224303 (2008). 6 D. B. Grotjahn, M. Brewster, and L. M. Ziurys, J. Am. Chem. Soc. 124, 5895 (2002). 7 T. Okabayashi, E. Y. Okabayashi, F. Koto, T. Ishida, and M. Tanimoto, J. Am. Chem.
Soc. 131, 11712 (2009). 8 A. Boldyrev, X. Li, and L. Wang, J. Chem. Phys. 112, 3627 (2000). 9 A. Paul, Y. Yamaguchi, and H. F. Schaefer, J. Chem. Phys. 127, 154324 (2007). 10 P. Schwerdtfeger and M. Lein, in Gold Chemistry, edited by F. Mohr (Wiley,
Weinheim, 2009), pp. 183. 11 P. Schwerdtfeger, P. D. W. Boyd, A. K. Burrell, W. T. Robinson, and M. J. Taylor,
Inorg. Chem. 29, 3593 (1990). 12 D.-K. Lee, I. S. Lim, Y. S. Lee, D. Hagebaum-Reignier, and G.-H. Jeung, J. Chem.
Phys. 126, 244313 (2007); J. Seminario, A. Zacarias, and J. Tour, J. Am. Chem. Soc.
121, 411 (1999). 13 H.-J. Werner, T. B. Adler, G. Knizia, and F. R. Manby, in Recent Progress in Coupled
Cluster Methods: Theory and Applications, edited by P. Čársky, J. Paldus, and J.
Pittner (Springer, Berlin, 2010), pp. 573; D. Tew, C. Hättig, R. Bachorz, and W.
17
Klopper, in Recent Progress in Coupled Cluster Methods: Theory and Applications,
edited by P. Čársky, J. Paldus, and J. Pittner (Springer, Berlin, 2010), pp. 535. 14 T. B. Adler, G. Knizia, and H.-J. Werner, J. Chem. Phys. 127, 221106 (2007). 15 G. Knizia, T. B. Adler, and H.-J. Werner, J. Chem. Phys. 130, 054104 (2009). 16 M. Douglas and N. M. Kroll, Ann. Phys. (N.Y.) 82, 89 (1974); G. Jansen and B. A.
Hess, Phys. Rev. A 39, 6016 (1989). 17 K. A. Peterson, T. B. Adler, and H.-J. Werner, J. Chem. Phys. 128, 084102 (2008). 18 K. A. Peterson and C. Puzzarini, Theor. Chem. Acc. 114, 283 (2005). 19 D. Figgen, G. Rauhut, M. Dolg, and H. Stoll, Chem. Phys. 311, 227 (2005). 20 F. Weigend, A. Köhn, and C. Hättig, J. Chem. Phys. 116, 3175 (2002). 21 C. Hättig, Phys. Chem. Chem. Phys. 7, 59 (2005); C. Hättig, Unpublished results,
available from the Turbomole library. 22 F. Weigend, J. Comput. Chem. 29, 167 (2008). 23 F. Weigend, Phys. Chem. Chem. Phys. 4, 4285 (2002). 24 J. G. Hill, K. A. Peterson, G. Knizia, and H.-J. Werner, J. Chem. Phys. 131, 194105
(2009). 25 E. F. Valeev, Chem. Phys. Lett. 395, 190 (2004). 26 K. E. Yousaf and K. A. Peterson, J. Chem. Phys. 129, 184108 (2008); K. E. Yousaf
and K. A. Peterson, Chem. Phys. Lett. 476, 303 (2009). 27 J. G. Hill and K. A. Peterson, J Chem Theory Comput 8, 518 (2012). 28 G. Knizia and H.-J. Werner, J. Chem. Phys. 128, 154103 (2008). 29 P. J. Knowles, C. Hampel, and H.-J. Werner, J. Chem. Phys. 99, 5219 (1993). 30 G. E. Scuseria and H. F. Schaefer, Chem. Phys. Lett. 152, 382 (1988). 31 J. G. Hill, S. Mazumder, and K. A. Peterson, J. Chem. Phys. 132, 054108 (2010). 32 W. de Jong, R. Harrison, and D. Dixon, J. Chem. Phys. 114, 48 (2001). 33 K. A. Peterson and T. Dunning Jr, J. Chem. Phys. 117, 10548 (2002). 34 M. Reiher and A. Wolf, J. Chem. Phys. 121, 2037 (2004); M. Reiher and A. Wolf, J.
Chem. Phys. 121, 10945 (2004). 35 T. H. Dunning Jr, J. Chem. Phys. 90, 1007 (1989). 36 D. Figgen, K. A. Peterson, M. Dolg, and H. Stoll, J. Chem. Phys. 130, 164108 (2009). 37 J. Noga and R. J. Bartlett, J. Chem. Phys. 86, 7041 (1987).
18
38 Y. J. Bomble, J. F. Stanton, M. Kallay, and J. Gauss, J. Chem. Phys. 123, 054101
(2005). 39 M. Kallay and J. Gauss, J. Chem. Phys. 123, 214105 (2005). 40 L. Visscher, T. J. Lee, and K. Dyall, J. Chem. Phys. 105, 8769 (1996). 41 J. Sikkema, L. Visscher, T. Saue, and M. Ilias, J. Chem. Phys. 131, 124116 (2009). 42 K. Dyall, J. Chem. Phys. 100, 2118 (1994). 43 N. B. Balabanov and K. A. Peterson, J. Chem. Phys. 123, 064107 (2005). 44 K. Dyall, Theor. Chem. Acc. 112, 403 (2004); K. Dyall, Theor. Chem. Acc. 117, 483
(2007). 45 C. E. Moore, Atomic Energy Levels. (NSRDS-NBS 35; Office of Standard Reference
Data, National Bureau of Standards, Washington DC, 1971). 46 DIRAC, a relativistic ab initio electronic structure program, Release DIRAC11 (2011),
written by R. Bast, H. J. Aa. Jensen, T. Saue, and L. Visscher, with contributions
from V. Bakken, K. G. Dyall, S. Dubillard, U. Ekström, E. Eliav, T. Enevoldsen, T.
Fleig, O. Fossgaard, A. S. P. Gomes, T. Helgaker, J. K. Lærdahl, J. Henriksson, M.
Iliaš, Ch. R. Jacob, S. Knecht, C. V. Larsen, H. S. Nataraj, P. Norman, G. Olejniczak,
J. Olsen, J. K. Pedersen, M. Pernpointner, K. Ruud, P. Sałek, B. Schimmelpfennig, J.
Sikkema, A. J. Thorvaldsen, J. Thyssen, J. van Stralen, S. Villaume, O. Visser, T.
Winther, and S. Yamamoto (see http://dirac.chem.vu.nl). 47 MOLPRO, version 2010.1, a package of ab initio programs, H.-J. Werner, P. J.
Knowles, G. Knizia, F. R. Manby, M. Schütz and others, see http://www.molpro.net;
H.-J. Werner, P. J. Knowles, G. Knizia, F. R. Manby, and M. Schütz, WIREs Comput
Mol Sci 00, 1 (2011). 48 MRCC, a string-based quantum chemical program suite, Budapest University of
Technology and Economics, 2001; M. Kállay and P. R. Surján, J. Chem. Phys. 115,
2945 (2001). 49 A. R. Hoy, I. M. Mills, and G. Strey, Mol. Phys. 24, 1265 (1972); I. M. Mills, in
Molecular Spectroscopy: Modern Research, edited by K. N. Rao and C. W. Mathews
(Academic, New York, 1972), Vol. 1. 50 J. Senekowitsch, Ph.D. thesis, Universität Frankfurt, Frankfurt, Germany, 1988.

19
51 See Supplementary Material Document No._________ for Tables SI-SIII and the cc-
pwCVTZ-DK+4f basis sets. For information on Supplementary Material, see
http://www.aip.org/pubservs/epaps.html. 52 A. O. Mitrushchenkov, J. Chem. Phys. 136, 024108 (2012). 53 J. G. Hill, A. O. Mitrushchenkov, K. E. Yousaf, and K. A. Peterson, J. Chem. Phys.
135, 144309 (2011). 54 K. A. Peterson, A. O. Mitrushchenkov, and J. S. Francisco, Chem. Phys. 346, 34
(2008). 55 R. A. Kendall, T. H. Dunning Jr, and R. J. Harrison, J. Chem. Phys. 96, 6796 (1992). 56 D. T. Colbert and W. H. Miller, J. Chem. Phys. 96, 1982 (1991). 57 W. D. Allen, Y. Yamaguchi, A. G. Csaszar, D. A. Clabo Jr., R. B. Remington, and H.
F. Schaefer III, Chem. Phys. 145, 427 (1990). 58 G. Amat and M. Pimbert, J. Mol. Spectrosc. 16, 278 (1965); D. M. Papousek and M.
R. Aliev, Molecular Rotation-Vibration Spectra. (North-Holland, Amsterdam, 1982). 59 M. D. Harmony, in Vibrational Spectra and Structure (Elsevier, 1999), Vol. 24, pp. 1. 60 J. Kraitchman, Am. J. Phys. 21, 17 (1953). 61 W. R. Stevens, B. Ruscic, and T. Baer, J. Phys. Chem. A 114, 13134 (2010). 62 J. D. Cox, D. D. Wagman, and V. A. Medvedev, CODATA Key Values for
Thermodynamics. (Hemisphere Publishing Corp., New York, 1989). 63 D. D. Wagman, W. H. Evans, V. B. Parker, R. H. Schumm, I. Halow, S. M. Bailey, K.
L. Churney, and R. L. Nuttall, J. Phys. Chem. Ref. Data 11, Supplement 2 (1982). 64 J. Senekowitsch, S. Carter, A. Zilch, H.-J. Werner, N. C. Handy, and P. Rosmus, J.
Chem. Phys. 90, 783 (1989).
20
TABLE I. Convergence of the CCSD(T)-F12b calculated X1Σ+ AuCN equilibrium bond
lengths (Å) and harmonic vibrational frequencies (ωi in cm-1) with respect to basis set as
well as other contributions detailed in Eq. (2). See text for further details.
rAu–C rC–N ω1 ω2 ω3
aVDZ 1.9235 1.1637 2207.4 274.3 467.6
aVTZ 1.9204 1.1640 2205.4 276.5 471.7
aVQZ 1.9196 1.1639 2205.7 277.9 472.8
aV5Z* 1.9196 1.1639 2205.6 277.6 472.9
ΔCV −0.0086 −0.0025 +9.3 +6.9 +9.0
Δ4f −0.0041 0.0000 +0.4 +1.4 +2.6
ΔDK
Val −0.0018 −0.0003 −0.5 +3.2 +2.1
Val+CV +0.0014 −0.0002 −0.6 −1.4 −0.9
ΔT +0.0026 −0.0010 +10.8 +0.3 −1.7
Δ(Q) −0.0009 +0.0019 −20.9 −1.9 +0.2
Δ(Q)Λ −0.0010 +0.0017 −18.7 −1.7 +0.3
ΔSO −0.0028 +0.0001 −0.9 +1.0 +3.0
Final composite
1.9071 1.1623 2203.8 284.1 485.2
Expt. a 1.9123 1.1587 --- 320 480
502(10)b
a From the microwave experiments of Ref. 7. The bond lengths correspond to a rs
(substitution) structure. See also Table V.

21
b Photoelectron imaging result of Ref. 3.

22
TABLE II. Convergence of the CCSD(T)-F12b calculated X1Σ+ CuCN equilibrium bond
lengths (Å) and harmonic vibrational frequencies (ωi in cm-1) with respect to basis set as
well as other contributions detailed in Eq. (2). See text for further details.
rCu–C rC–N ω1 ω2 ω3
aVDZ 1.8257 1.1654 2195.4 242.2 474.6
aVTZ 1.8238 1.1657 2193.6 242.8 476.6
aVQZ 1.8233 1.1656 2193.7 243.9 477.9
aV5Z* 1.8234 1.1656 2193.6 243.5 477.8
ΔCV −0.0004 −0.0026 +10.0 +2.8 +1.0
ΔDK
Val +0.0019 −0.0003 +0.1 +0.9 0.0
Val+CV +0.0023 −0.0002 −0.3 +0.3 −0.1
ΔT +0.0026 −0.0009 +10.2 +0.3 −0.5
Δ(Q) −0.0014 +0.0018 −21.1 −1.0 +0.2
Δ(Q)Λ −0.0016 +0.0017 −19.1 −1.0 −0.2
ΔSO −0.0001 0.0000 −0.1 +0.1 +0.1
Final composite
1.8265 1.1637 2192.4 246.0 478.4
Expt.a 1.8296 1.1621 --- 270 478
480(30)b
460(50)c

23
a From the microwave experiments of Ref. 6. The bond lengths correspond to a rm(2)
structure. See also Table V. b From the photoelectron experiments of Ref. 8. c Photoelectron imaging results of Ref. 3.
24
TABLE III. Convergence of the CCSD(T)-F12b calculated X1Σ+ AgCN equilibrium bond
lengths (Å) and harmonic vibrational frequencies (ωi in cm-1) with respect to basis set as
well as other contributions detailed in Eq. (2). See text for further details.
rAg–C rC–N ω1 ω2 ω3
aVDZ 2.0398 1.1650 2193.7 205.9 389.9
aVTZ 2.0352 1.1652 2191.9 208.0 392.2
aVQZ 2.0339 1.1651 2192.0 209.5 393.4
aV5Z* 2.0341 1.1651 2191.8 208.3 393.0
ΔCV −0.0124 −0.0027 +10.4 +6.8 +7.2
ΔDK
Val +0.0028 −0.0004 +0.5 +0.1 +0.3
Val+CV +0.0070 −0.0001 −1.1 −1.4 −3.3
ΔT +0.0024 −0.0008 +8.9 +0.1 −1.0
Δ(Q) −0.0009 +0.0016 −18.5 −1.3 −0.2
Δ(Q)Λ −0.0010 +0.0015 −16.9 −1.2 +0.5
ΔSO −0.0004 0.0000 0.0 +0.2 +0.2
Final total
2.0299 1.1632 2191.6 212.7 396.0
Expt. a 2.0312 1.1603 --- 240 400
390(30)b
385(27)c
25
a From the microwave experiments of Ref. 7. The bond lengths correspond to a rm(2)
structure. See also Table V. b From the photoelectron experiments of Ref. 8. c Photoelectron imaging results of Ref. 3.
26
TABLE IV. Spectroscopic constants of CuCN, AgCN and AuCN derived from the final
composite PESs using second-order vibrational perturbation theory. All values were
calculated for the most abundant isotopomers.a
Constant CuCN AgCN AuCN
re (M–C) (Å) 1.8265 2.0299 1.9071
re (C–N) (Å) 1.1637 1.1632 1.1623
Be (MHz) 4229.8 3233.1 3237.5
B0 (MHz) 4231.2
[4224.9768]b
3236.1
[3237.5618] b
3235.1
[3230.2112] b
α1 (MHz) 20.00 14.51 14.55
α2 (MHz) -21.07
[-22.1244] b
-17.07
[-17.6538] b
-10.98
[-11.9781] b
α3 (MHz) 19.37
13.69
[14.2859] b
12.17
De (kHz) 1.40 0.92 0.62
qe (MHz) 5.45 3.62 2.80
ω1 (cm-1) 2192.4 2191.6 2203.8
ω2 (cm-1) 246.0 212.7 284.1
ω3 (cm-1) 478.4 396.0 485.2
X11 (cm-1) -12.33 -12.42 -12.52
X12 (cm-1) -4.15 -3.84 -5.42
X13 (cm-1) -0.75 -0.84 -1.36
X22 (cm-1) 21.26 c
(-0.81)
7.89 c
(-0.37)
2.19
X23 (cm-1) -91.15 c
(-2.86)
-35.25 c
(-2.21)
-11.51
X33 (cm-1) -1.93 -1.41 -1.72
Xll (cm-1) -21.96 c
(0.11)
-8.26 c
(0.00)
-2.19
ν1 (cm-1) 2163.2 2162.5 2172.7
ν2 (cm-1) 240.3 208.6 280.1

27
ν3 (cm-1) 383.0 c
(440.1)
357.5 c
(369.7)
469.5
a Note that the labels of the vibrational modes predominately correspond to 1 = CN
stretch, 2 = bend, 3 = MC stretch. b Experimental values from the microwave spectroscopy experiments of Grotjahn et al.6
(CuCN) and Okabayashi et al.7 (AgCN and AuCN). The experimental αi values were
estimated from the experimental B0–Bv differences. c Perturbed by a 2ω2: ω 3 Fermi resonance. The Xij values here in parentheses correspond
to deperturbed values using the scheme of Ref. 57. The fundamental frequencies here in
parentheses have been calculated via diagonalization of a 2×2 Fermi resonance matrix
using the deperturbed energy levels and calculated Fermi resonance constants. See the
text.

28
Table V. Selected fundamental, overtone, combination, and hot band origins (in cm-1)
determined in variational nuclear motion calculations together with their integrated absorption
intensities (in cm-2 atm-1 at 300 K).a
CuCN AgCN AuCN
Band Freq. Intensity Freq. Intensity Freq. Intensity (0110) ← (0000) 240.61 8.32 208.61 3.88 280.50 2.27 (0001) 440.97 15.20 370.34 14.10 469.89 8.16 (0200) 509.93 7.57 436.12 5.27 570.00 0.13 x10⁻³ (0111) 664.87 0.30x10⁻² 565.18 0.22 x10⁻² 740.51 0.11 x10⁻² (0002) 864.18 0.49 x10⁻² 729.85 0.011 935.39 0.18 x10⁻³ (1000) 2163.09 5.27 2162.38 4.42 2172.39 4.51 (1110) 2399.60 0.44 2367.15 0.29 2447.45 0.81 (0220) ← (0110) 239.82 5.26 208.11 2.87 280.97 1.19 (0111) 424.26 10.20 356.57 9.88 460.00 4.72 (0310) 521.77 4.54 445.92 4.42 578.51 0.28 x10⁻² (1110) 2158.99 3.42 2158.54 3.29 2166.95 2.49 (1220) 2394.73 0.27 2362.80 0.21 2442.47 0.41 (0330) ← (0220) 239.17 2.51 207.64 1.60 281.47 0.47 (0221) 411.06 3.39 345.45 3.59 450.91 1.34 (1330) 2390.02 0.12 2358.46 0.11 2437.53 0.15 (0112) ← (0111) 410.82 2.46 347.78 3.21 455.42 1.05 (0002) ← (0001) 423.20 3.18 359.51 4.01 465.49 1.73
a The theoretical values correspond to pure vibrational transition energies without rotation. The
integrated intensities were calculated using the Eckart frame, pure vibrational dipole moment
expression (see Ref. 64). The calculated zero-point levels are given in Table SIV in the
Supplemental Information.
29
Table VI. Rotational constants (MHz) calculated from the variational ro-vibrational
energy levels. Experimental valuesa are given in square brackets while results using
perturbation theory are given in parentheses.
CuCN AgCN AuCN
State Bv B0 – Bv Bv B0 – Bv Bv B0 – Bv
(0000) 4231.4
(4231.2)
[4224.977]
3236.0
(3236.1)
[3237.562]
3235.4
(3235.1)
[3230.211]
(1000) 4211.9
19.5
(20.0)
3221.7
14.3
(14.5)
3221.3
14.1
(14.6)
(0001) 4247.5 b
-16.1 b
(19.4)
3242.5 b
[3223.276]
-6.5 b
(13.7)
[14.286]
3228.7
6.7
(12.2)
(0110) 4253.4
[4247.101]
-22.0
(-21.1)
[-22.12]
3253.5
[3255.216]
-17.5
(-17.1)
[-17.65]
3247.2
[3242.189]
-11.8
(-11.0)
[-11.98]
(0200) 4240.5 -9.1 3254.1 -18.1
(0220) 4276.0
[4269.642]
-44.6
[-44.66]
3259.3
-23.3
a Ref. 6 for CuCN and Ref. 7 for AgCN and AuCN. b The (0001) and (0200) are strongly mixed via Fermi resonance including J=0-3 from
which these rotational constants were derived. See the text.

30
TABLE VII. Molecular structures (in Å) of CuCN, AgCN and AuCN.
Molecule Structure type r (M–C) r (C–N)
CuCN r0 a 1.8323 1.1576
rm(2) 1.8296 1.1621
re (this work)c 1.8265 1.1637
reSE (this work)d 1.8287 1.1636
AgCN r0 b 2.0332 1.1553
rm(2) b 2.0312 1.1603
re (this work) c 2.0299 1.1632
reSE (this work) d 2.0289 1.1632
AuCN r0 b 1.9125 1.1586
rs b 1.9123 1.1587
re (this work) c 1.9071 1.1623
reSE (this work) d 1.9094 1.1620
a Experimental values from Ref. 6. b Experimental values from Ref. 7. c Best ab initio values from the composite PES. d Semi-experimental value obtained by combing the ab initio vibration-rotation
interaction constants (Table IV) from the composite PESs with the experimental ground
state rotational constants.

31
Tables VIII. Calculated contributions (in kcal mol-1) to the 0 K atomization energies of
CuCN, AgCN, and AuCN. See the text for the definitions of the various terms.
CuCN AgCN AuCN
CCSD(T)-F12b/
aVDZ
276.86
262.00
265.96
aVTZ 279.26 264.90 268.97
aVQZ 279.76 265.60 269.74
aV5Z* 279.67 265.53 269.75
ΔCV –2.20 +1.47 +2.46
ΔDK3, Val+CV –0.37 –1.05 –0.43
Δ(4f) --- --- –2.90
ΔT –0.76 –0.85 –1.05
Δ(Q) +1.31 +1.08 +1.24
Δ(Q)Λa +1.08 +1.01 +1.15
ΔSO –0.07 –0.04 +1.01
ΔZPE –4.50 –4.29 –4.63
Final Composite 273.08 261.84 265.45
a Not used in the final composite result.

32
Figure Captions
Figure 1. Vibrational wavefunctions for the (020) and (001) states, θ vs. R2 (M-C
distance in bohr). R(C-N) is fixed to its equilibrium value in each case.
Figure 2. Bending PESs, θ (deg.) vs. R2 (M-C distance in bohr), of CuCN, AgCN, and
AuCN from the final composite PESs with the R(C-N) distances fixed at their equilibrium
values. The contours are drawn with a spacing of 500 cm-1.
Figure 3. Simulated vibrational spectra (in cm-1) for CuCN, AgCN, and AuCN at
temperatures of 5 and 300 K. A Lorentzian line profile was used with a half-width of 5
cm-1.
33
Figure 1.
34
CuCN
AgCN
AuCN
4.0 4.5 5.0 5.5 6.0
140
150
160
170
180
4.0 4.5 5.0 5.5 6.0
140
150
160
170
180Surface 1 Shift Energy 24125.561
R2
�
4.0 4.5 5.0 5.5 6.0
140
150
160
170
180
4.0 4.5 5.0 5.5 6.0
140
150
160
170
180Surface 1 Shift Energy 12443.050
R2
�
4.0 4.5 5.0 5.5 6.0
140
150
160
170
180
4.0 4.5 5.0 5.5 6.0
140
150
160
170
180Surface 1 Shift Energy 37556.831
R2
�
Figure 2.
35
Figure 3.