hindustan lever ltd - hindustan unilever · •skin care leads the growth , +22% • fal sales...
TRANSCRIPT

HINDUSTAN LEVER LTD
REVIEW OF RESULTS
Analysts Meet Mumbai

Presentation Sequence
• Economic environment
• Financial results - JQ/ FH’01
• Interim dividend
• Results analysis
• Performance review

Economic Environment

The Economy …. (1)
• GDP growth down from 6.5% to 5.2% largely contributed by rural sector
• Fiscal deficit continues to be under pressure; money supply growth up by 16%; inflation 7.1%
• Rupee depreciation 0.84% in FH ’01

The Economy …. (2)
• Markets remain sluggish
• Decline witnessed in demand in several FMCG categories
• Economic outlook for SH’01 evolving – Monsoon progress positive
– Poor realisation cause for concern

Market GrowthValue
Growth % Year2000
Jan-May
2001Toilet soaps 5.9 (4.0)
Detergentscake/bars
2.5 (4.4)
Washing powder 8.1 3.4
Toothpaste 10.0 6.5
Shampoo 12.5 2.0
Skin cream 12.9 8.7
Tea 0.4 (14.3)
Source : ORG

Financial Results : JQ/ FH 2001

HLL Results - JQ 2001 … (1)
Rs.Crores JQ 2000 JQ 2001 Growth %
Net Sales 2880 2931 1.8
Other Income 77 91 17.9
Operating Costs 2534 2539 0.2
PBIDT 423 483 14.4
Interest Expense 2 2 1.9
Depreciation 33 33 (0.8)
PBT 388 449 15.7

HLL Results - JQ 2001 …(2)
Rs.Crores JQ 2000 JQ 2001 Growth %
PBT 388 449 15.7
Tax 101 102 1.0
PAT 287 347 20.9
ExceptionalItem
120
Net Profit 287 467 62.7

HLL Results - FH 2001 … (1)
Rs.Crores FH 2000 FH 2001 Growth %
Net Sales 5494 5574 1.5
Other Income 167 193 15.5
Operating Costs 4858 4843 (0.3)
PBIDT 803 924 15.1
Interest Expense 5 3 (41.7)
Depreciation 67 66 (0.9)
PBT 731 855 17.0

HLL Results - FH 2001 …(2)
Rs.Crores FH 2000 FH 2001 Growth %
PBT 731 855 17.0
Tax 181 191 5.4
PAT 549 664 20.8
Exceptional Item 0 142
Net Profit 549 806 46.7

Sales Growth - JQ’01
Rs. Crores JQ’00 JQ’01 Grth%
Total 2880 2931 1.8
HPCFoodsPower Brands
1598625
1737556
8.7(10.9)
5.7Exports
- FMCG- Non-FMCG
158376
178328
12.8(12.8)
Others 98 132 35.0
Disposals 25
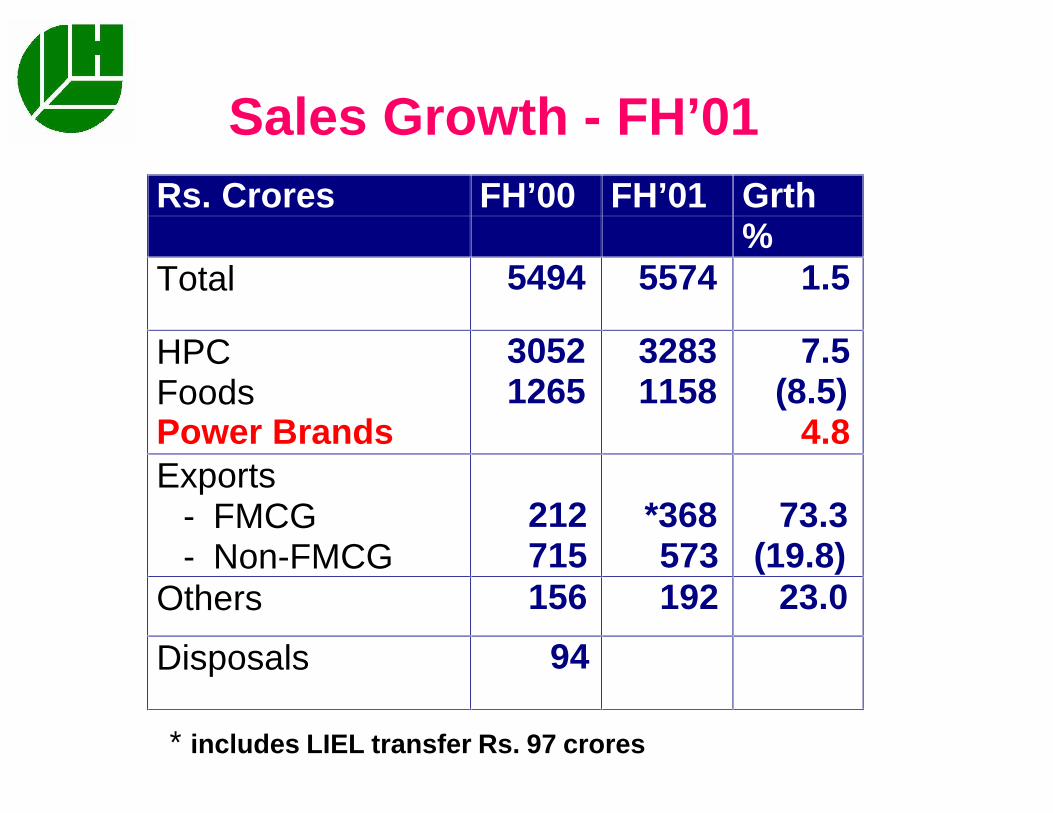
Sales Growth - FH’01
Rs. Crores FH’00 FH’01 Grth%
Total 5494 5574 1.5
HPCFoodsPower Brands
30521265
32831158
7.5(8.5)
4.8Exports
- FMCG- Non-FMCG
212715
*368573
73.3(19.8)
Others 156 192 23.0
Disposals 94
* includes LIEL transfer Rs. 97 crores

• Margin improves by 1 % through portfolio balancing and cost focus
• Improving trend in Home and Personal Care categories market shares
• Prices maintained
HLL Results - FH 2001Highlights … (1)

• Three pronged strategy for profitable growth
– Focus on 30 power brands in FMCG; early resultsencouraging
– Foods profitability improving
– Good progress in securing the future of non-FMCG businesses
HLL Results - FH 2001Highlights … (2)
Progress in all areas

Dividend Recommendation

Dividend Recommendation
Rs.per equity share of Re 1 2000 2001
Interim 1.50 2.50
Final 2.00
Total 3.50
Dividend includes distribution out of exceptional profits from Quest and AFS businesses disposed

Dividend Payout
Rs.Crores FH 2000 FH 2001 Growth %
Dividend 330.1 550.2 66.7
Tax on Dividend 72.6 56.1 (22.7)
TOTAL 402.7 606.3 50.6
PAY OUT (%)(incl. tax on dividend)
73.3 75.0

Key Indicators
Rs FH 2000 FH 2001 Growth %
Earnings per share 2.50 3.66 46.7
Interim dividend pershare
1.50 2.50 66.7

Results Analysis
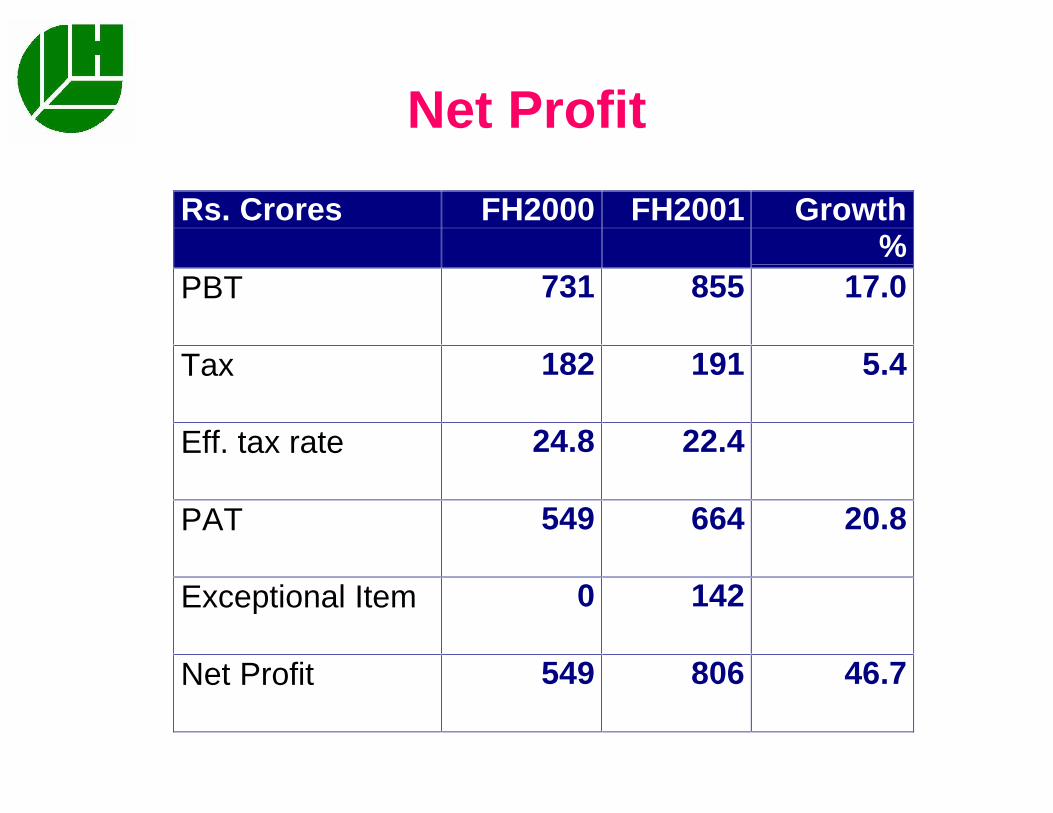
Net Profit
Rs. Crores FH2000 FH2001 Growth%
PBT 731 855 17.0
Tax 182 191 5.4
Eff. tax rate 24.8 22.4
PAT 549 664 20.8
Exceptional Item 0 142
Net Profit 549 806 46.7

Impact Of Business Transfers
• In
– Lakme lever
– LIEL
• Out
– Quest
– Animal Feeds
Sales growth : 2.2% instead of 1.8 % in JQ’011.2% instead of 1.5 % in FH’01
PAT growth : 21.5 % instead of 21% in JQ’0119.2% instead of 21% in FH’01

Cash Flow - FH 2001
Rs. Crores
Cash Generated from :
Business Operations 771.2
Disposal of business 177.6
Working Capital reduction 23.7
Treasury Income 101.3
Total 1073.8
Cash Deployed :
Capital Expenditure 163.9
Dividend Payment 440.1
Surplus invested 469.8
Total 1073.8

Performance ReviewJQ/ FH 2001
HPC Business


Market Shares
% Dec. 2000 May 2001
Toilet Soaps 59.2 59.9
Detergents(Pwdrs & Bars)
41.5 41.7
Toothpaste 35.4 36.0
Dish Wash 62.9 62.2
Shampoo 65.9 65.0
Skin( excl. Talc)
56.0 54.1
Note: ORG Urban + Rural - Value shares
HPC

Category Wise Sales Growth
% MQ2001
JQ2001
FH2001
Personal Wash (6.4) (2.8) (4.4)
Fabric Wash 6.6 3.9 5.2
Household care 18.2 12.4 15.3
Skin 10.7 34.1 22.1
Shampoo (0.6) 15.4 7.5
Oral (7.8) 0.6 (3.7)
HPC

Focussing on Power Brands
Growth Overall%
Power Brands%
Group Sales JQ 01
FH01
5.3
3.8
9.0
7.0
A & P Support JQ 01
FH 01
24.8
19.6
43.3
32.6
HPC

• Fabric Wash Sales growth 5.2% ; share gain in Detergent Bars
• Personal wash sales decline in a depressed market ; declining share trend reversed
• Dishwash bar Wheel Jugmug launched in record time
• FAL soap launched, LUX relaunched ; Variants added to Breeze ( 2 in 1, Sandal ) and Lifebuoy ( Activ)
SOAPS & DETERGENTSHPC

• Skin Care leads the growth , +22%
• FAL sales driven by improved consumer value offering in sachet pack
• Ponds talcum relaunched with addition of ‘Light N Fresh’ variant
• Oral care decline arrested in the second quarter ; Pepsodent relaunched
• Shampoo growth 15.0% in JQ’01 ; led by relaunched Sunsilk
• Low unit price packs added to Lux shampoo range
PERSONAL PRODUCTS HPC

Foods Business


Note: ORG Urban + Rural - Value shares *Urban
Market Shares - Foods
% Dec 2000 May 2001
Packet tea 36.4 35.8
Coffee 38.2 44.9
Culinary Products- Jams *- Ketchups *
76.541.1
75.141.3
Branded Atta * 20.4 18.7
Branded Salt 15.3 15.6
FOODS

Improving Foods Profitability
• Overall Foods Gross margins up 500 basis points
• Beverages Gross margins up 750 basis points
• Other Foods Gross margins up 350 basis points
FOODS

Category Wise Sales Growth
% MQ2001
JQ2001
FH2001
Tea (13.9) (15.3) (14.5)
Coffee 9.5 10.8 10.1
Oils and Fats 18.5 13.7 16.1
Culinary (12.3) (2.4) (7.1)
Branded Staples (13.5) (12.6) (13.0)
Ice cream (0.7) (6.4) (3.9)
FOODS

Focussing on Power Brands
Growth Overall % Power Brands %
Group Sales JQ 01
FH01
(7.3)
(3.3)
(3.3)
(0.9)
A & P Support JQ 01
FH 01
19.7
8.9
30.1
14.0
FOODS

• Focus on profitability ; Gross margins up by 750 basis points
• Tea market remains bearish ; sales down by 15% due to continuing impact of portfolio restructuring & sharp decline in market.
• Substantial volume growth in coffee ; sales upby 10% despite a sharp fall in commodity prices
BEVERAGESFOODS

• Measures to improve profitability in place ; Gross margins up 350 basis points
• Overall sales growth 2.1% in FH ’01. Oils and Fats sales up by 16% despite lower prices
• An integrated Foods Field Distribution System set up to harness synergy benefits of IBL merger.
FOODSFOODS

• Measures to improve profitability under execution
• Ice cream sales impacted by early monsoon arrival particularly in North India
• Retail market share improved in Delhi and Mumbai in JQ’01.
ICE CREAMSFOODS

• Sales up 58 % in FH ’01• Bread - 78 %• SNF - 35 %
• Business restructuring critical for viability ; VRS offered to employees of closed units
• Significant synergy potential in supply chain
MODERN FOODSFOODS

• Merger of International Best Foods Ltd. approved by shareholders wef 01/07/2001. Pending court approval.
• Sales of Knorr up 76 % in FH ’01
• Restructuring of field and offices sharply reduces fixed costs. Cash breakeven in Q2 ’01
BEST FOODSFOODS
Other Businesses

• Exports of HPC categories up 58% in FH’ 01
• Tea exports up 7.3% despite a significant drop in commodity prices and downturn in Russian business
FMCG EXPORTSOTHERS

• Traded marine exports scaled down in view of poor viability
• Proposal to transfer Leather and Mushroom businesses to subsidiary approved by
shareholders
NON FMCG EXPORTSOTHERS

• JV with ICI group for Quest division of Flavours and Fragrances
• Agri seeds sales grow 39%.
CHEMICALS & AGRIOTHERS

• Test marketing in confectionery started in Tamil Nadu , initial response encouraging
• Project Sangam experiment in e-tailing launched near Mumbai
• Accelerated progress in B2B connectivity initiatives
• Several other Project Millennium initiatives in evaluation phase
NEW VENTURESOTHERS

New Channel Initiatives
• Increased focus on :
• Wholesale
• Rural
• Modern trade ; key retail accounts
• Out-of-home opportunities in foods
• New channels - direct marketing, beautyservices and laundry services

In Summary
% Growth JQ 2001 FH 2001
Sales- Reported- FMCG- Power Brands
1.83.25.7
1.52.84.8
PAT 20.9 21.0
EPS 62.7 46.7
Interim Dividend (including distribution out of exceptional items) Rs.2.50 per share

THANK YOU