hindustan petroleum corporation...
TRANSCRIPT

Questions
1
Hindustan Petroleum Corporation Limited
MumbaiAugust 30, 2016
- M K Surana
Questions
2
Disclaimer
The information contained in this material have been obtained from sources believed to be reliable, but norepresentation or warranty express or implied, is made that such information is accurate or complete and itshould not be relied upon as such. The information contained in this material may not be perfect and somepart of the information may be left out.
While the Company will use reasonable efforts to provide reliable information through this presentation, norepresentation or warranty (express or implied) of any nature is made nor is any responsibility or liability ofany kind accepted by the Company or its directors or employees, with respect to the truthfulness,completeness, accuracy or reliability or otherwise whatsoever of any information, projection, representation orwarranty (expressed or implied) or omissions in this presentation. Neither the Company nor anyone elseaccepts any liability whatsoever for any loss, howsoever, arising from use or reliance on this presentation orits contents or otherwise arising in connection therewith.
This presentation may not be used, reproduced, copied, published, distributed, shared, transmitted ordisseminated in any manner. This presentation is for information purposes only and does not constitute anoffer, invitation, solicitation or advertisement in any jurisdiction with respect to the purchase or sale of anysecurity of HPCL and no part or all of it shall form the basis of or be relied upon in connection with anycontract, investment decision or commitment whatsoever.
All estimates and opinions included in this material constitute our judgment as of the date of this material andis subject to change without notice and its accuracy is not guaranteed, it may be incomplete or condensedand it may not contain all material information concerning the Company. We do not have any obligation to,and do not intend to, update or otherwise revise any statements reflecting circumstances arising after the dateof this presentation or to reflect the occurrence of underlying events, even if the underlying assumptions donot come to fruition.
Questions
3
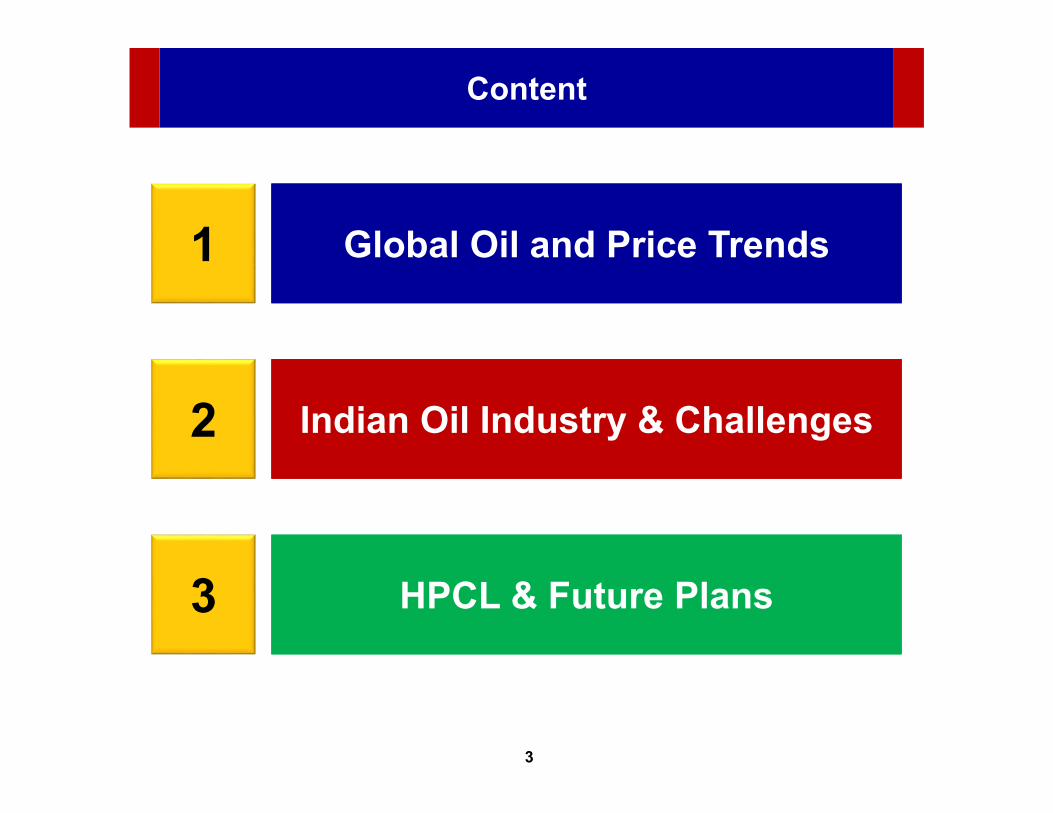
Content
1 Global Oil and Price Trends
2 Indian Oil Industry & Challenges
3 HPCL & Future Plans

Questions
4
Global Energy Mix : 2015
Coal; 3840; 29%
Oil, 4331, 33%
Gas, 3135, 24%
Hydro; 893; 7%
Renewables; 365; 2.8%
Nuclear; 583; 4%
Oil is the world’s leading fuel, contributing to ~ 33% of global energy consumption of 13,147 mtoe
Units in mtoeSource : BP Statistical Review 2016
Globally, energy consumption has grown at 2.3% p.a. during the last 15 years
Questions
5
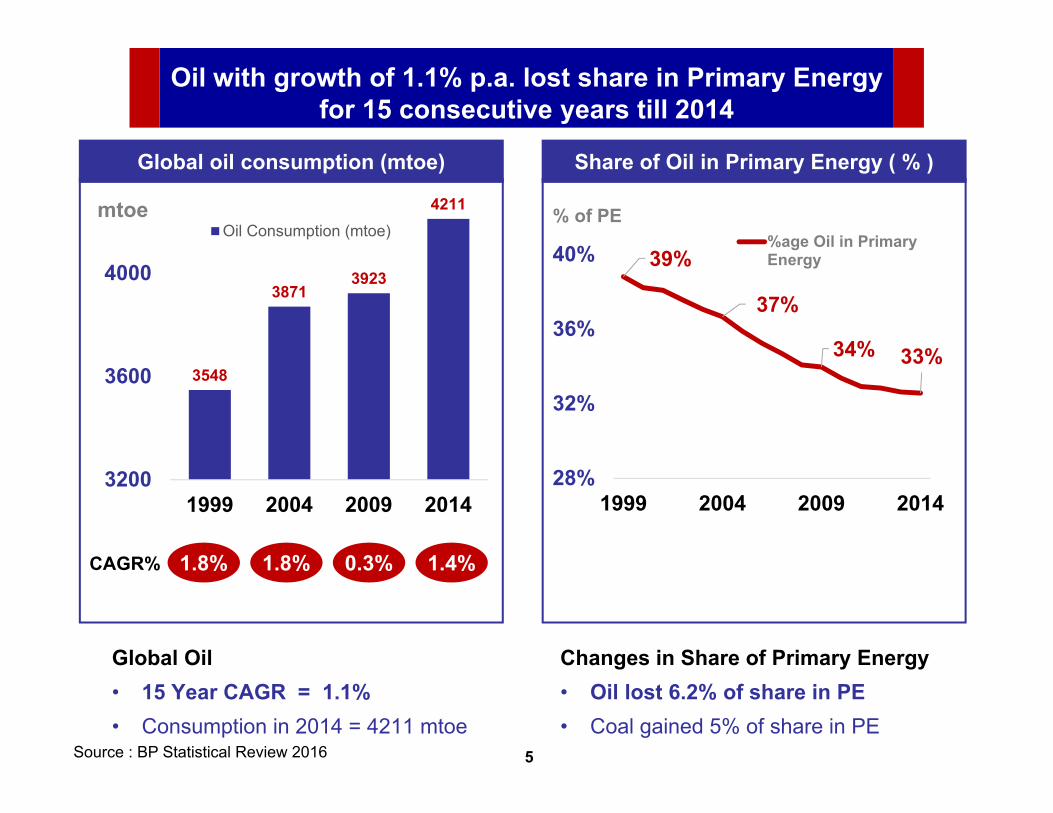
3548
38713923
4211
3200
3600
4000
4400
1999 2004 2009 2014
Oil Consumption (mtoe)
1.8% 1.8% 0.3% 1.4%CAGR%
Global Oil• 15 Year CAGR = 1.1% • Consumption in 2014 = 4211 mtoe
39%
37%
34% 33%
28%
32%
36%
40%
1999 2004 2009 2014
%age Oil in PrimaryEnergy
Global oil consumption (mtoe) Share of Oil in Primary Energy ( % )
mtoe % of PE
Changes in Share of Primary Energy• Oil lost 6.2% of share in PE• Coal gained 5% of share in PE
Oil with growth of 1.1% p.a. lost share in Primary Energy for 15 consecutive years till 2014
Source : BP Statistical Review 2016
Questions
6
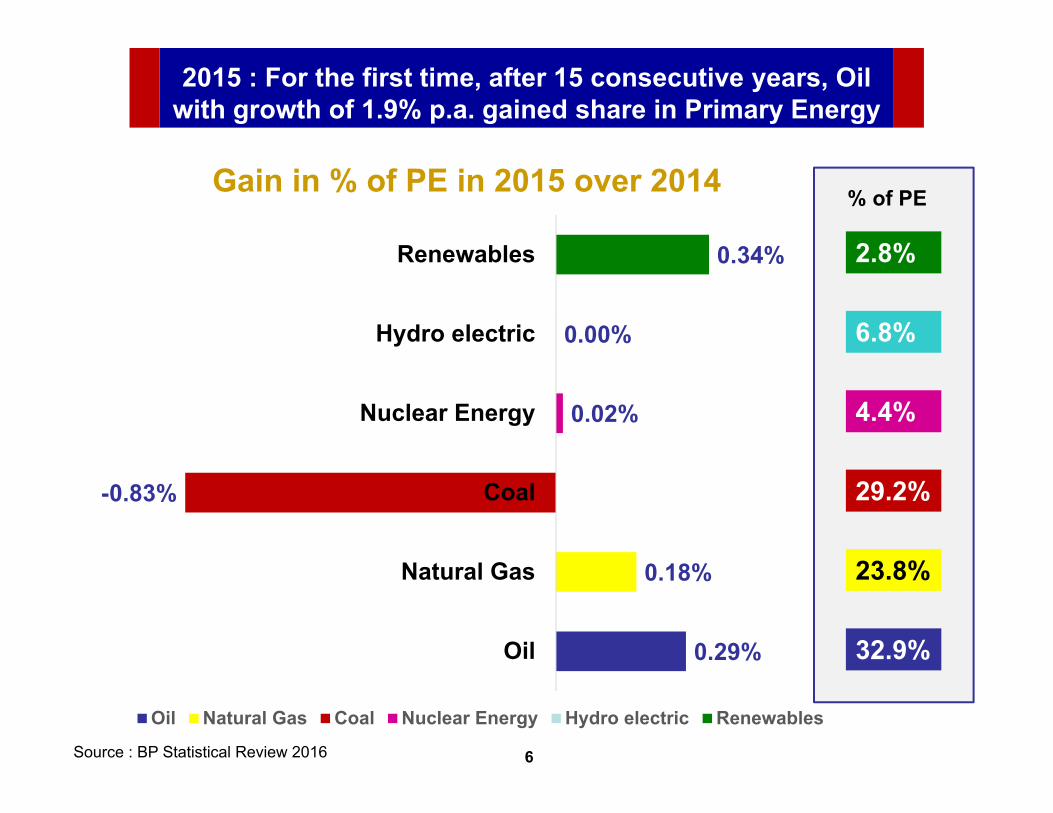
2015 : For the first time, after 15 consecutive years, Oil with growth of 1.9% p.a. gained share in Primary Energy
0.29%
0.18%
-0.83%
0.02%
0.00%
0.34%
Oil
Natural Gas
Coal
Nuclear Energy
Hydro electric
Renewables
Gain in % of PE in 2015 over 2014
Oil Natural Gas Coal Nuclear Energy Hydro electric Renewables
32.9%
23.8%
29.2%
4.4%
6.8%
2.8%
% of PE
Source : BP Statistical Review 2016
Questions
7
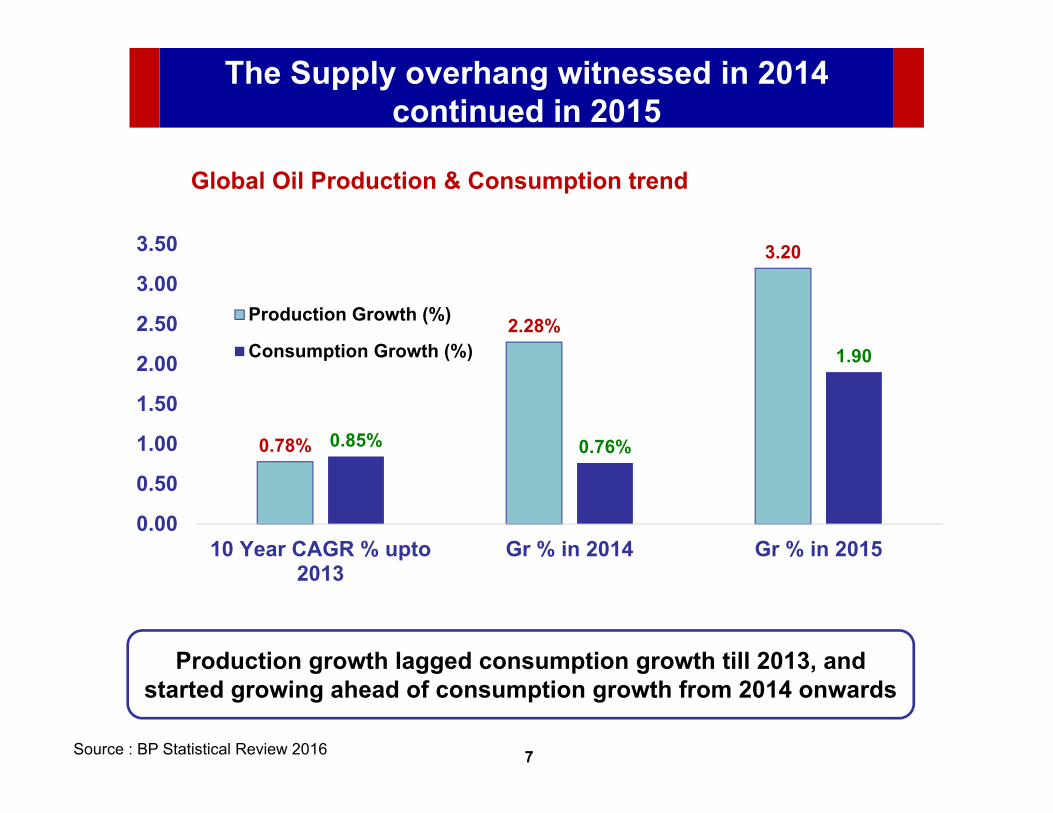
The Supply overhang witnessed in 2014 continued in 2015
0.78%
2.28%
3.20
0.85% 0.76%
1.90
0.00
0.50
1.00
1.50
2.00
2.50
3.00
3.50
10 Year CAGR % upto2013
Gr % in 2014 Gr % in 2015
Production Growth (%)
Consumption Growth (%)
Global Oil Production & Consumption trend
Production growth lagged consumption growth till 2013, and started growing ahead of consumption growth from 2014 onwards
Source : BP Statistical Review 2016

Questions
8
Crude Oil Price Trend & Events
0
20
40
60
80
100
120
140
160
180
May
20,
198
7M
ay 2
0, 1
988
May
20,
198
9M
ay 2
0, 1
990
May
20,
199
1M
ay 2
0, 1
992
May
20,
199
3M
ay 2
0, 1
994
May
20,
199
5M
ay 2
0, 1
996
May
20,
199
7M
ay 2
0, 1
998
May
20,
199
9M
ay 2
0, 2
000
May
20,
200
1M
ay 2
0, 2
002
May
20,
200
3M
ay 2
0, 2
004
May
20,
200
5M
ay 2
0, 2
006
May
20,
200
7M
ay 2
0, 2
008
May
20,
200
9M
ay 2
0, 2
010
May
20,
201
1M
ay 2
0, 2
012
May
20,
201
3M
ay 2
0, 2
014
May
20,
201
5M
ay 2
0, 2
016
Europe Brent Spot Price FOB (US $/bbl.)
Europe Brent Spot Price FOB (US $/bbl.)
Source : EIA
Gulf War
OPEC 10% Quota Increase,
Series of OPEC Production cuts ~ 4.2 mbpd
9/11 Attack
Iraq war, Asia Demand Increase,Weak Dollar
Recession
Libyan Uprising
Low Spare Production capacity
Questions
9
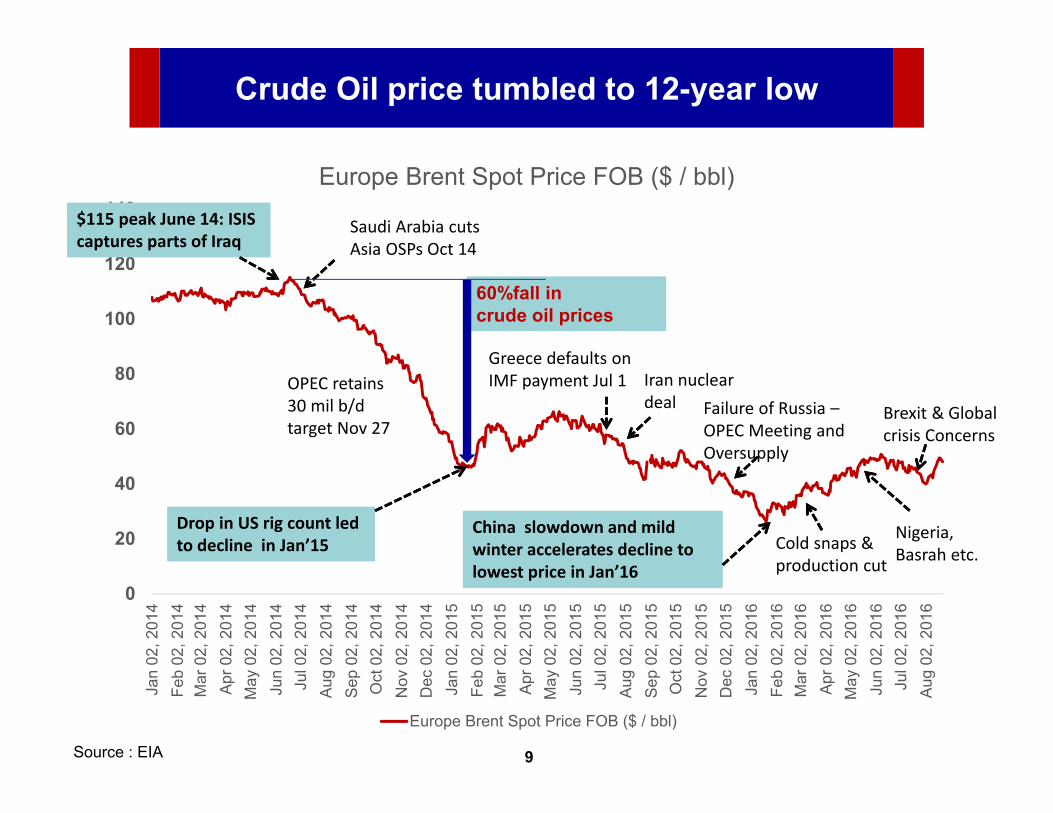
Crude Oil price tumbled to 12-year low
0
20
40
60
80
100
120
140
Jan
02, 2
014
Feb
02, 2
014
Mar
02,
201
4Ap
r 02,
201
4M
ay 0
2, 2
014
Jun
02, 2
014
Jul 0
2, 2
014
Aug
02, 2
014
Sep
02, 2
014
Oct
02,
201
4N
ov 0
2, 2
014
Dec
02,
201
4Ja
n 02
, 201
5Fe
b 02
, 201
5M
ar 0
2, 2
015
Apr 0
2, 2
015
May
02,
201
5Ju
n 02
, 201
5Ju
l 02,
201
5Au
g 02
, 201
5Se
p 02
, 201
5O
ct 0
2, 2
015
Nov
02,
201
5D
ec 0
2, 2
015
Jan
02, 2
016
Feb
02, 2
016
Mar
02,
201
6Ap
r 02,
201
6M
ay 0
2, 2
016
Jun
02, 2
016
Jul 0
2, 2
016
Aug
02, 2
016
Europe Brent Spot Price FOB ($ / bbl)
Europe Brent Spot Price FOB ($ / bbl)
$115 peak June 14: ISIS captures parts of Iraq
OPEC retains 30 mil b/d target Nov 27
Drop in US rig count led to decline in Jan’15
60%fall incrude oil prices
Saudi Arabia cuts Asia OSPs Oct 14
Greece defaults on IMF payment Jul 1 Iran nuclear
deal
China slowdown and mild winter accelerates decline to lowest price in Jan’16
Failure of Russia –OPEC Meeting and Oversupply
Brexit & Global crisis Concerns
Cold snaps & production cut
Nigeria, Basrah etc.
Source : EIA

Questions
10
Why the crude price crashed
• US production rocketed by 4.8 mbpd between 2011 and 2015.
• OPEC continued to leave output targets unchanged rather increased its output to all time high levels
• Weakening global oil demand growth due to decline in China growth and slow recovery in Europe
• Supply glut and Rising inventories globally
Source: Bloomberg, Platts, Team Analysis

Questions
11
Three scenarios projected for future crude prices
SOURCE: McKinsey;
▪ Low oil prices does not slow down oil production
▪ Limited demand response
Crude Oil Price outlook
▪ Market has demand and supply response to low prices. Eg.– Demand goes up– North American production
reduces
▪ Sustained drop in oil price as production stays high.
▪ Will drive significant (offshore) project deferrals resulting in supply shortage which drives a sharp price spike
0
50
100
150
13 14 15 16 17 18 19 20
0
50
100
150
13 14 15 16 17 18 19 20
0
50
100
150
13 14 15 16 17 18 19 20
New era of low prices
Medium term Recovery
Long-term swings
Scenario
1
2
3
Events
Questions
12
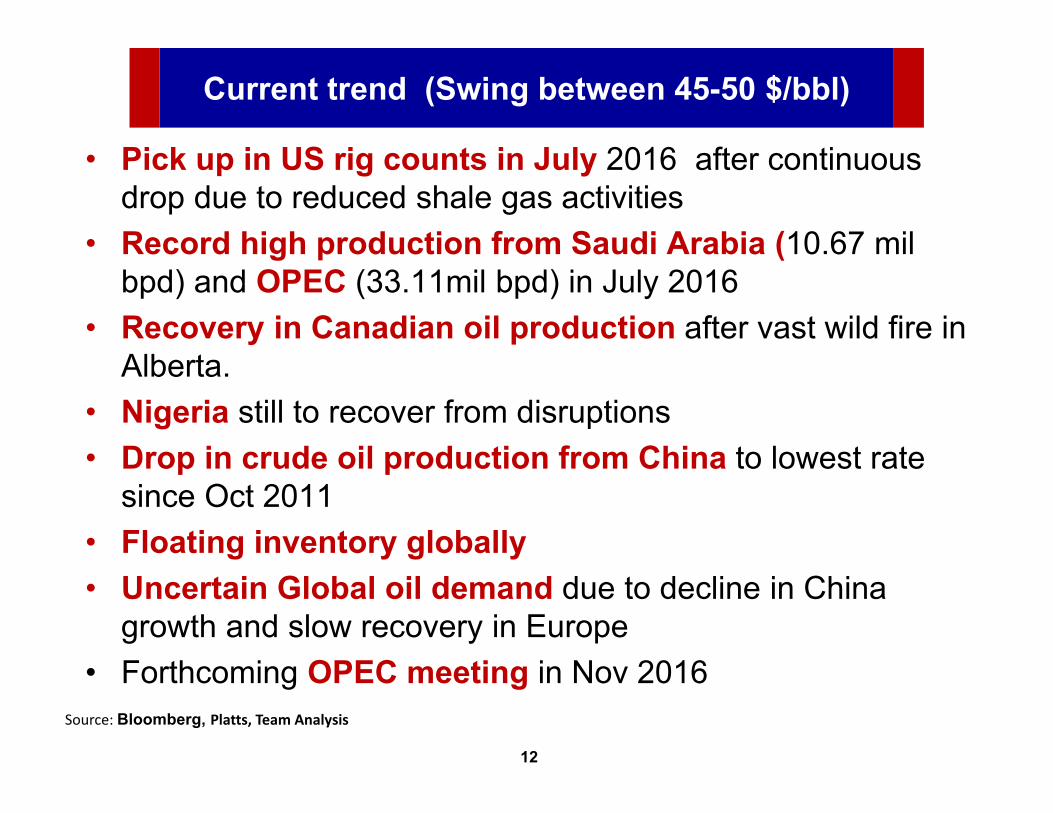
Current trend (Swing between 45-50 $/bbl)
• Pick up in US rig counts in July 2016 after continuous drop due to reduced shale gas activities
• Record high production from Saudi Arabia (10.67 mil bpd) and OPEC (33.11mil bpd) in July 2016
• Recovery in Canadian oil production after vast wild fire in Alberta.
• Nigeria still to recover from disruptions• Drop in crude oil production from China to lowest rate
since Oct 2011• Floating inventory globally • Uncertain Global oil demand due to decline in China
growth and slow recovery in Europe• Forthcoming OPEC meeting in Nov 2016
Source: Bloomberg, Platts, Team Analysis

Questions
13
Global oil outlook for 2030
SOURCE: BP statistics 2015, McKinsey, Team Analysis
Growth Projections
2014-30 CAGR %• Global Energy Perspective : 0.8%• BP : 1.1%• IEA- WEO : 0.9%
Demand Influencers
Growth Drivers• Population growth• Increase in GDP per capita
Growth Dampeners• Energy Improvement initiatives• Fuel Mix change• Disruptive Technologies
Global Oil demand is projected to grow at CAGR of 0.8% to 1.1% p.a. to reach ~ 107 to 112 mbpd by 2030

Questions
14
1 Global Oil and Price Trends
2 Indian Oil Industry & Challenges
3 HPCL & Future Plans
Questions
15
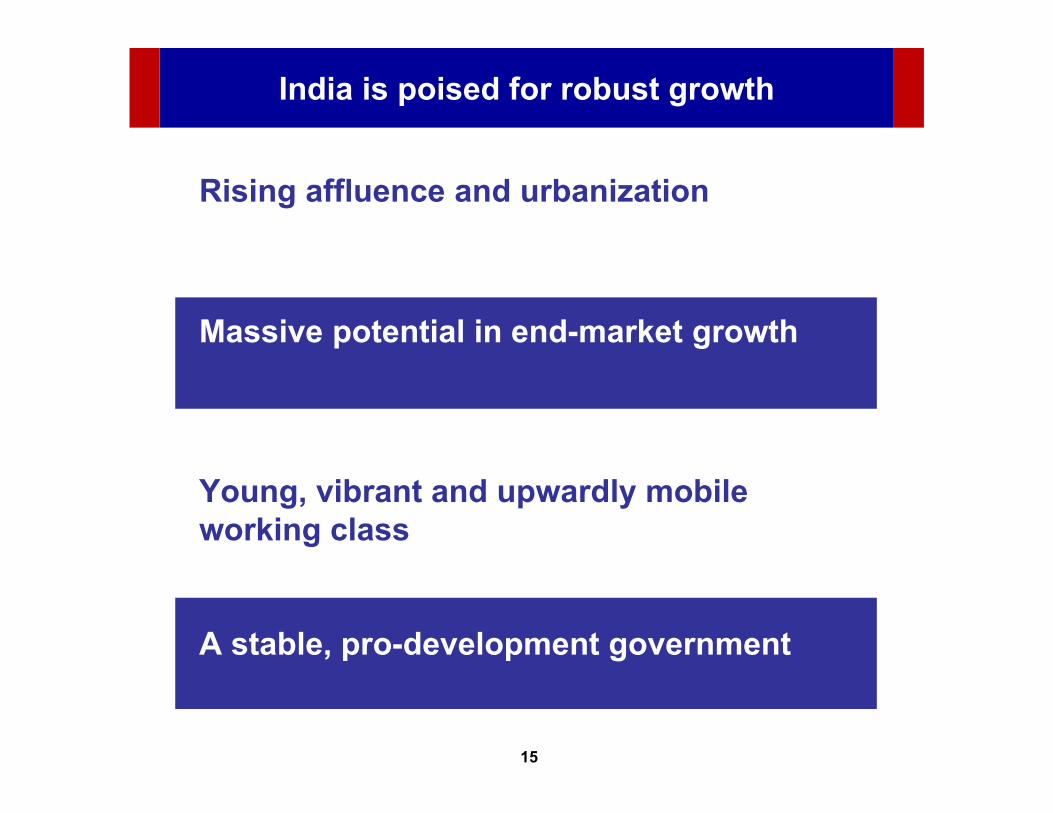
India is poised for robust growth
Rising affluence and urbanization
Massive potential in end-market growth
Young, vibrant and upwardly mobile working class
A stable, pro-development government

Questions
16
4 key macro-economic trends will drive energy demand and mix
1. Demographic change
▪ Steep growth in working-age group
▪ Dependency ratio in India will reduce from 60% to 45% during 2015-30
2. GDP Growth
▪ Rising Economic activities resulting in 6 to 8% GDP growth during 2015-30
Increase in Transportation & freight activities
4. Change in energy mix
▪ Thrust towards clean fuels
▪ Technology advancements
3. Increase in disposable income▪ Increasing household
income▪ Disposable income to
grow both in urban and rural sector
1
2
3
4
Source : McKinsey

Questions
17
Primary energy : India projections
Coal; 407; 58%
Oil; 196; 28%
Gas, 46, 7%
Hydro; 28; 4%
Renewables; 16; 2.2%
Nuclear; 9; 1%
Source: IEA, 2010, Planning Commission, BP Statistical review 2016
Energy mix: 2015 Energy mix: 2030
Total 700 Mtoe
Energy consumption in India is projected to double, growing by over 4.6% per year with gas and renewables increasing their share
Total 1,287 Mtoe
Coal, 586, 46% Oil; 341;
26%
Gas, 143, 11%
Hydro; 42; 3%
Renewables; 149; 12%
Nuclear; 28; 2%
Questions
18
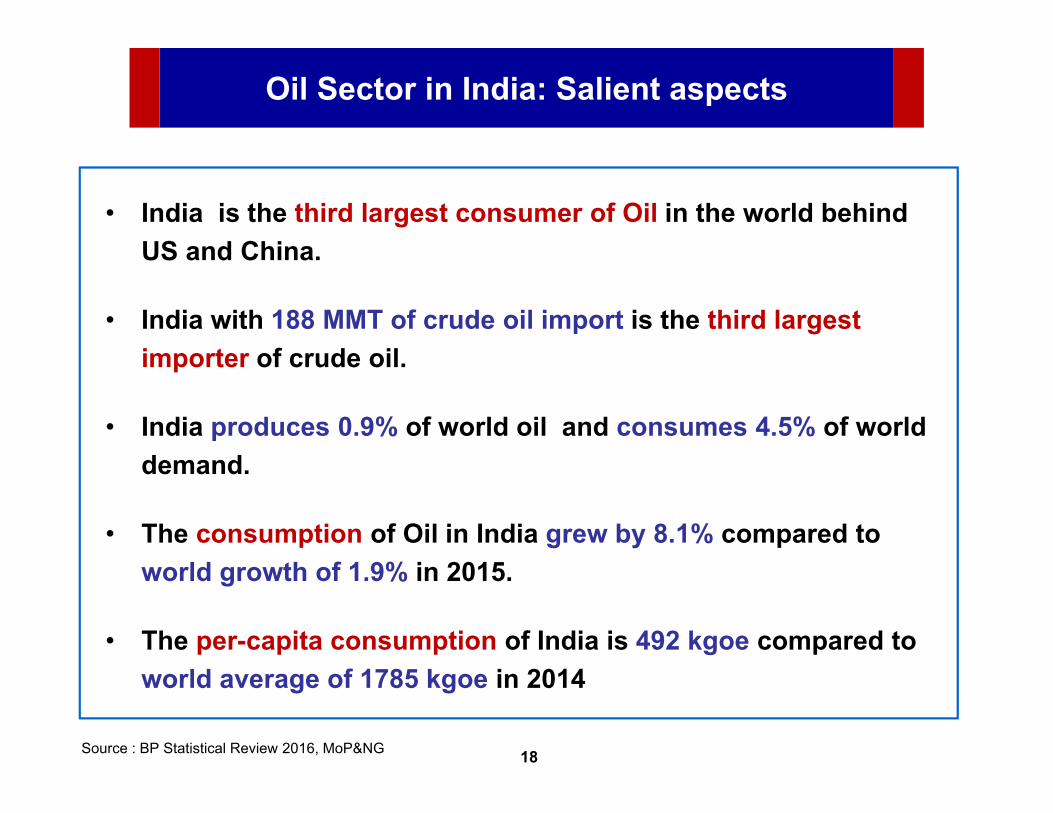
Oil Sector in India: Salient aspects
• India is the third largest consumer of Oil in the world behind US and China.
• India with 188 MMT of crude oil import is the third largest importer of crude oil.
• India produces 0.9% of world oil and consumes 4.5% of world demand.
• The consumption of Oil in India grew by 8.1% compared to world growth of 1.9% in 2015.
• The per-capita consumption of India is 492 kgoe compared to world average of 1785 kgoe in 2014
Source : BP Statistical Review 2016, MoP&NG

Questions
19
2015-16 : Consumption of Petroleum Products
HSD = 75 MMT
LPG = 19 MMT
MS = 22 MMT
Naphtha, ATF & SKO = 23 MMT
Others = 33 MMT
Product wise volumes / 5 Y CAGR%
Total Volume = 183 MMT, 5 year CAGR of 5.4%
FO & Bitumen = 11 MMT
2015-16 (Percentage)
4.5%
9.0%
41%
12%
10%
13%
6%
18%HSD
MS
LPG
Naphtha, ATF & SKO
FO & Bitumen
Others
6.8%

Questions
20
Factors influencing the Indian Petroleum Industry
• Auto sector growth
• Rural consumption
• Power sector growth
• Expansion of Highways
• Increasing working population
• Higher house hold income
• Growth of Tier II & Tier III cities
Regulatory forces
Competition
Technology
• Government thrust on clean energy• Stricter environmental legislation -
BS V / VI• Pricing
• Investments in refining capacities• Re-entry of private players
• Indigenization and R&D• Investments in bottom up-gradation• Automation of Operations and
Optimization
Customer • Evolving customer behavior and preferences
Economic Growth

Questions
21
India : Oil demand Projections
Current POL Consumption :• Total POL consumption during 2015-16 = 183 MMT
POL Consumption Trend• POL consumption growth :
During last 5 years = 5.4% CAGR
During last 10 years = 4.9% CAGR
During next 5 years = 5.6% CAGR (PPAC)
POL Demand projection as per IEA
• Projected POL demand by 2030 = 329 MMT
• Projected POL demand by 2040 = 458 MMT
Source : PPAC and IEA India energy outlook 2015
Questions
22
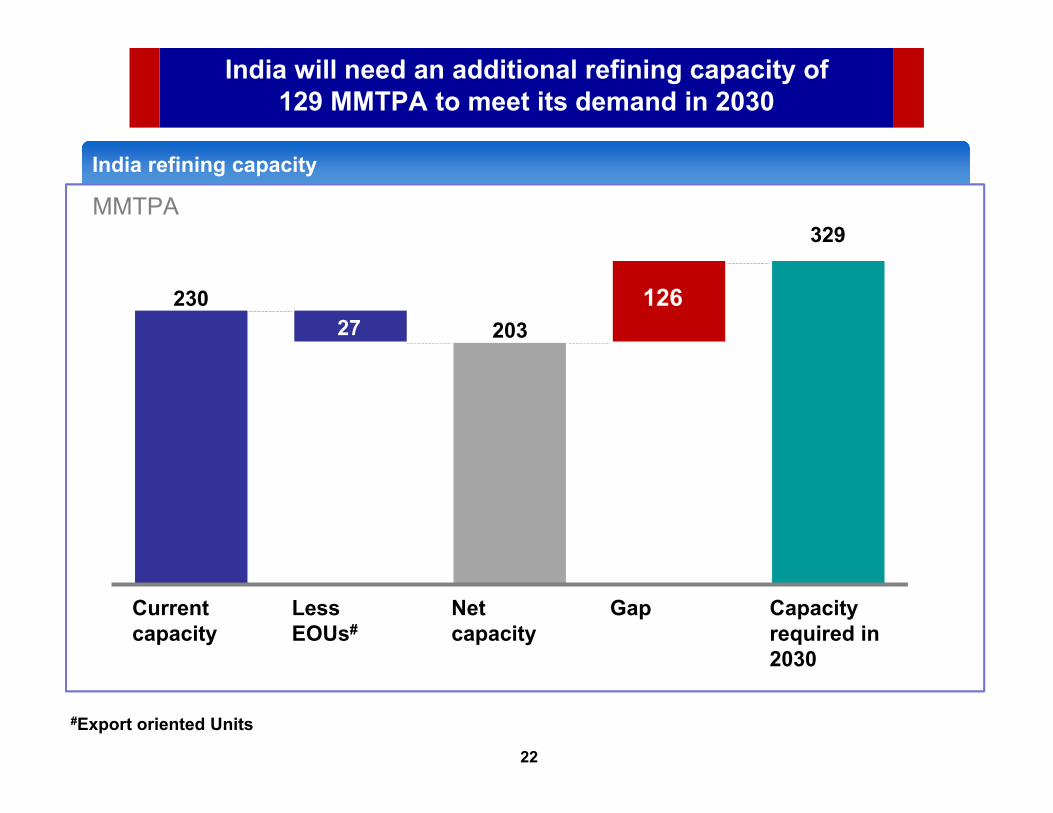
India will need an additional refining capacity of 129 MMTPA to meet its demand in 2030
India refining capacity
MMTPA
230203
329
Capacity required in 2030
Gap
126
Net capacity
Less EOUs#
27
Currentcapacity
#Export oriented Units

Questions
23
1 Global Oil and Price Trends
2 Indian Oil Industry & Challenges
3 HPCL & Future Plans

Questions
24
Origin of HPCL
Origin in Private Sector • Blend of Private & Public Sector Expertise
Incorpora-tion of Standard –Vacuum Oil Refining Company (StanVac)
Incorporation of Caltex Oil Refining Co.
StanVacoperations taken over by ESSO
Commission-ing of Lube India Ltd.
Amalgamation of ESSO and Lube India to form HPCL
Merger of Caltex undertaking in India into HPCL
Merger of Kosan Gas Company into HPCL
19521955
19621969
19741978
1979

Questions
25
Global Rankings
# 367# 367
# 133# 133

Questions
26
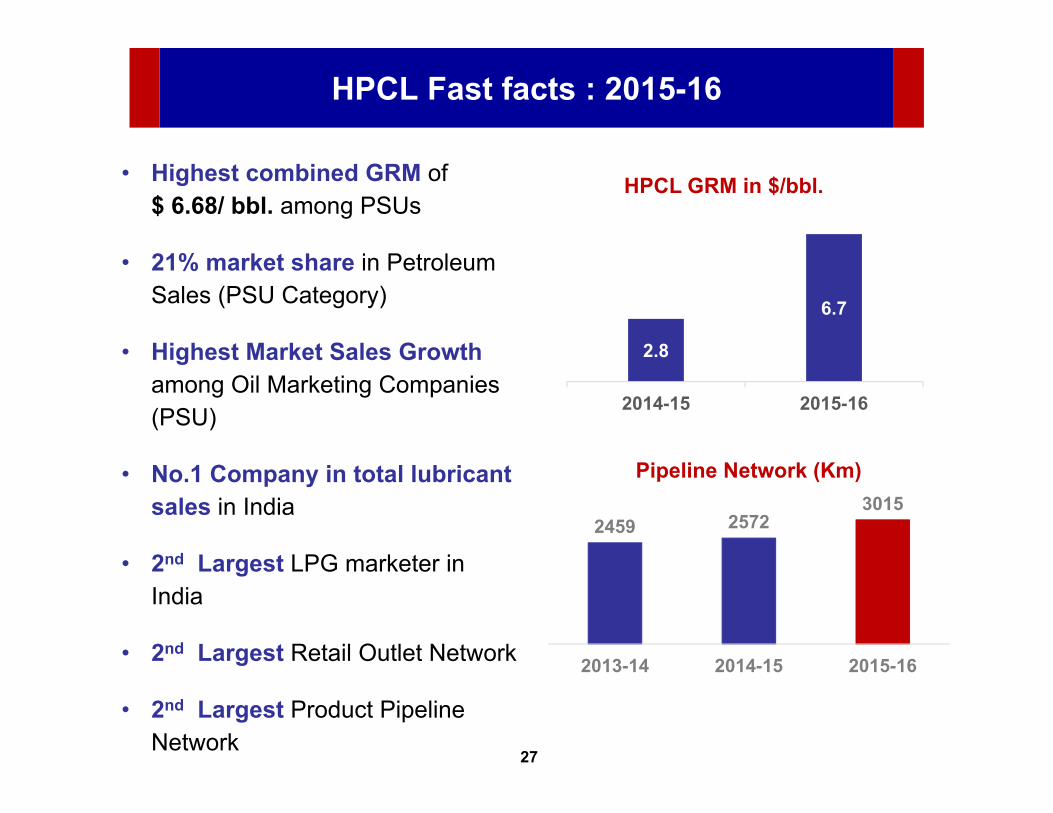
HPCL Fast facts : 2015-16
• NOC - Govt. of India (GOI) holding 51.11% equity
• Navratna PSU Since January’1999
• India’s 6th Largest company by Turnover
• Largest lube oil refinery in India
• Annual Gross sales of Rs 1,97,744 crore
• Net Profit of Rs 3,863 crore
• Market Capitalization of Rs. 26,601 crore
10489
2201426601
31st Mar 14 31st Mar 15 31st Mar 16
Market Cap (Rs crore)
Government of India, 51.11%
Financial Institutions,
4.06%
FII / OCB, 19.41%
Banks, 0.06%
Mutual Funds, 9.92%
NRIs, 0.27%
Public, 14.67% Employees,
0.06%
As of 30th June 2016
Questions
27
HPCL Fast facts : 2015-16
• Highest combined GRM of $ 6.68/ bbl. among PSUs
• 21% market share in Petroleum Sales (PSU Category)
• Highest Market Sales Growth among Oil Marketing Companies (PSU)
• No.1 Company in total lubricant sales in India
• 2nd Largest LPG marketer in India
• 2nd Largest Retail Outlet Network
• 2nd Largest Product Pipeline Network
2459 25723015
2013-14 2014-15 2015-16
Pipeline Network (Km)
2.8
6.7
2014-15 2015-16
HPCL GRM in $/bbl.
Questions
28
Refining
Marketing
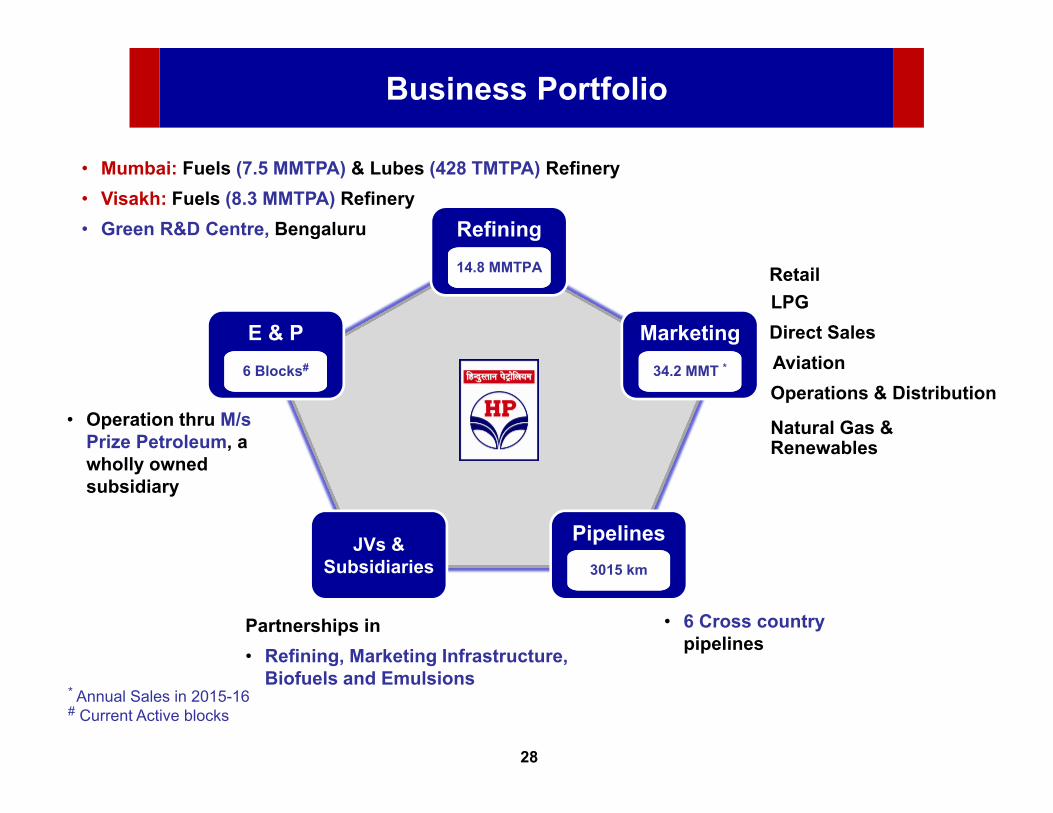
Business Portfolio
• Mumbai: Fuels (7.5 MMTPA) & Lubes (428 TMTPA) Refinery• Visakh: Fuels (8.3 MMTPA) Refinery• Green R&D Centre, Bengaluru
• 6 Cross country pipelines
• Operation thru M/s Prize Petroleum, a wholly owned subsidiary
JVs & Subsidiaries
E & P
Pipelines
14.8 MMTPA
34.2 MMT *
* Annual Sales in 2015-16# Current Active blocks
3015 km
6 Blocks#
RetailLPGDirect SalesAviationOperations & Distribution
Natural Gas & Renewables
Partnerships in• Refining, Marketing Infrastructure,
Biofuels and Emulsions

Questions
29
Performance : 2015-16
Market Sales : 34.2 MMT
Market Growth : 9.3% (Domestic) Vs PSU 7.7%
Refining Thruput : 17.2 MMT
Pipeline Thruput : 17.6 MMT
India’s No.1 Lube Marketer : 536 TMT
Highest ever PAT of Rs. 3,863 Crore during 2015-16

Questions
30
Performance over the years
5.210.4
17.4
26.3
34.2
0.0
10.0
20.0
30.0
40.0
1979-80 1989-90 1990-00 2009-10 2015-16
Sales incl. exports (MMT)
4.59.2 10.5
15.8
27.9
0.05.0
10.015.020.025.030.035.0
1979-80 1989-90 1990-00 2009-10 2015-16
Crude Thruput (MMT)HMEL Capacity (9 MMTPA)
2 14 2001057
3863
0
1000
2000
3000
4000
1974 1979-80 1989-90 1999-00 2015-16
Profit After Tax ( Rs. Crore)

Questions
31
16.217.2
10.0
13.0
16.0
19.0
2014-15 2015-16
Crude Thruput (MMT)
Snap shot of 2015-16 Performance
31.9
34.2
27.0
30.0
33.0
36.0
2014-15 2015-16
Marketing Sales (MMT)
14.9
17.6
12.0
14.0
16.0
18.0
2014-15 2015-16
Pipeline Thruput (MMT)
6% 7%
18%
4.44.8
2.0
3.0
4.0
5.0
2014-15 2015-16
LPG Bottling (MMT)
9%

Questions
32
Snap shot of 2015-16 Performance
27333863
0
2000
4000
6000
2014-15 2015-16
Net profit (Rs. Crores)
41%
80.7114.1
0.0
50.0
100.0
150.0
2014-15 2015-16
EPS (Rs. per share)
41%
707
640
600
650
700
750
2014-15 2015-16
Interest Cost (Rs. Crores)
-9%

Questions
33
Snap shot of 2015-16 Performance
1499
4921
0
2000
4000
6000
2014-15 2015-16
Consolidated Net profit (Rs. Crores)
228%
16022
18356
14000
16000
18000
20000
2014-15 2015-16
Net Worth (Rs. Crores)
15%
24.5034.50
0.0
10.0
20.0
30.0
40.0
2014-15 2015-16
Dividend (Rs. per share)
41%

Questions
34
Debt - Equity Ratio
2.46
2.14
1.27 1.16
Mar 2013 Mar 2014 Mar 2015 Mar 2016
Debt - Equity Ratio
Long Term Borrowing 10,278 15,789 18,136 17,448
Short Term Borrowing 23,511 16,377 2,200 3,889
Net Worth 13,726 15,012 16,022 18,356
(Rs. crores)
Questions
35
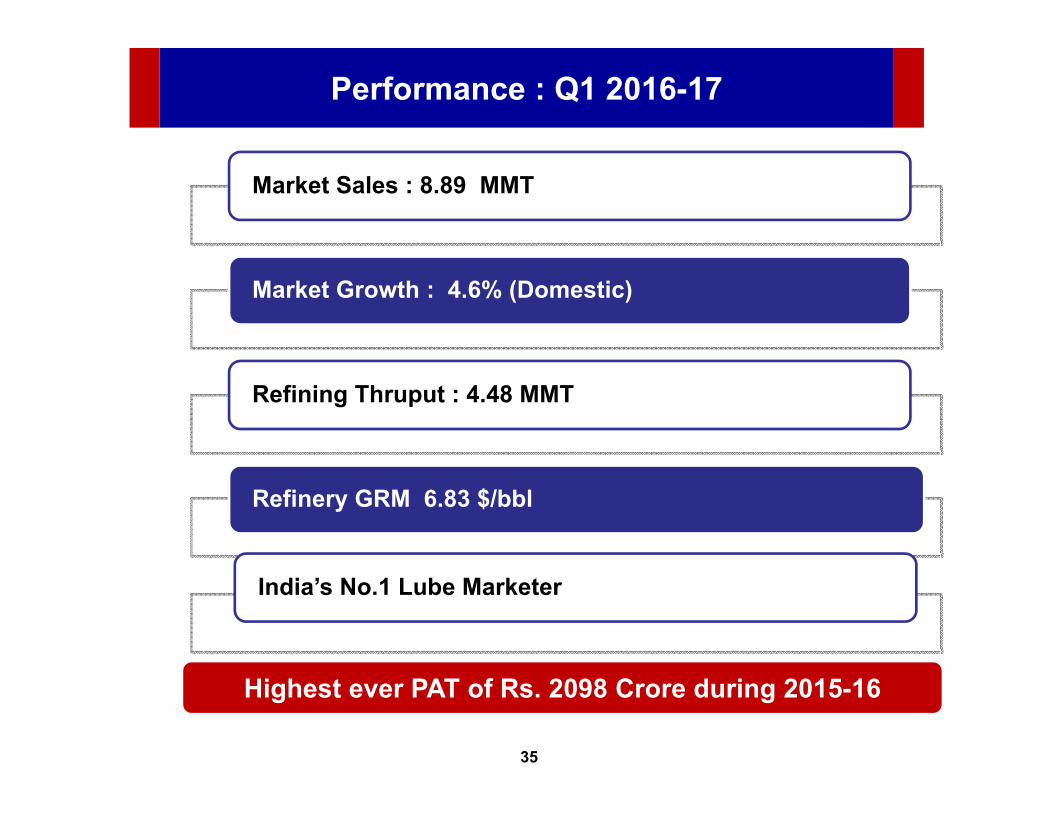
Performance : Q1 2016-17
Market Sales : 8.89 MMT
Market Growth : 4.6% (Domestic)
Refining Thruput : 4.48 MMT
Refinery GRM 6.83 $/bbl
India’s No.1 Lube Marketer
Highest ever PAT of Rs. 2098 Crore during 2015-16

Questions
Refining

Questions
37
Refining Capacity
Visakh Refinery
Mumbai Refinery
HMEL Bathinda
Refinery (JVC)
Rights for Marketing of Petroleum Products from HMEL
Refinery Capacity (MMTPA)
Mumbai 7.5
Visakh 8.3
Total 15.8
Bathinda (JVC) 9.0
Total 24.8
Lube Refinery (Mumbai) 428 TMTPA
Stake in HMEL : 48.94% ; Stake in MRPL : 16.95%

Questions
38
Crude Throughput
4.59.2 10.5
15.8 16.2 17.2
7.3 10.7
1979-80 1989-90 1999-00 2009-10 2014-15 2015-16
In MMT
HPCL HMEL
Average GRM for HPCL during 2015-16 is US $ 6.68 per Barrel
23.5
27.9
Questions
39
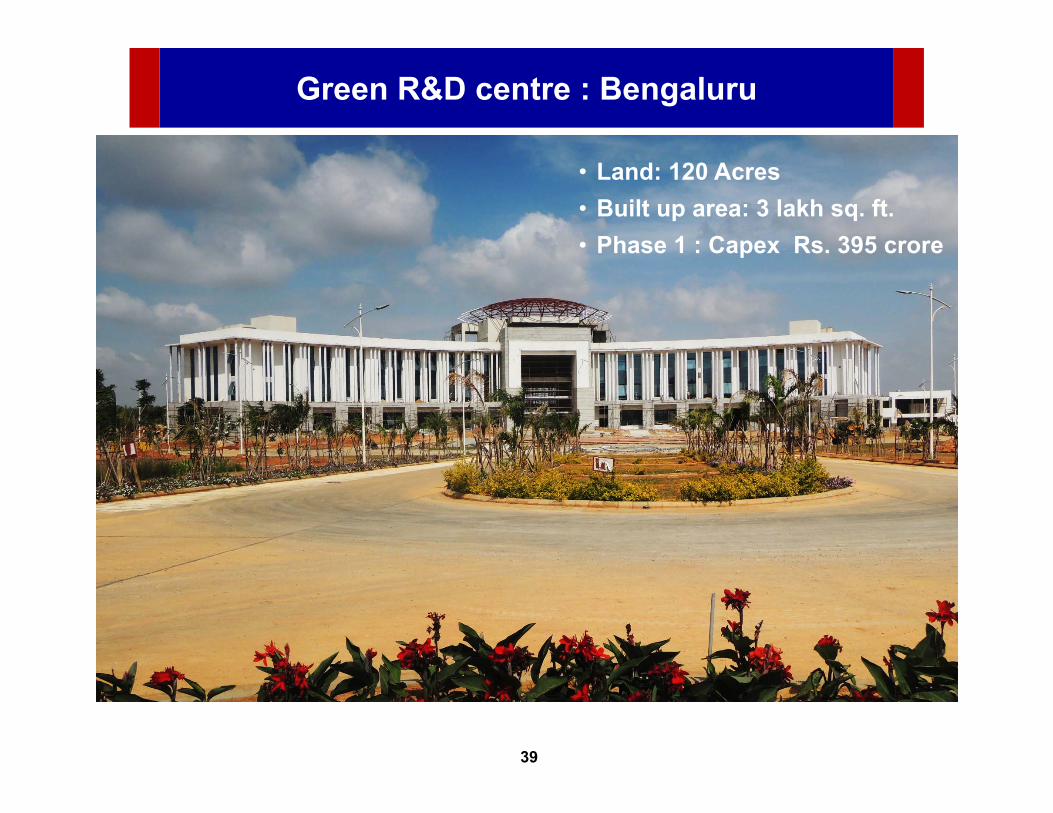
Green R&D centre : Bengaluru
• Land: 120 Acres• Built up area: 3 lakh sq. ft.• Phase 1 : Capex Rs. 395 crore

Questions
40
Research and Development
Green R&D Centres at Bengaluru & Vashi
Patents Applied Obtained
Research Areas 36 -Lubricants 6 2
Focusareas
Infrastructure Development
Support to Refining/MarketingFunctions
Collaborative Research
Product / process
Development
• Opportunity Crudes
• Residue Up-gradation
• New Process
Developments
• Catalyst Development
• Alternative Energies
R&D Thrust Areas

Questions
Marketing

Questions
42
2015-16 : Sale of Petroleum Products by HPCL
Product wise HPCL volumes
Total Volume = 34.2 MMT, 5 year CAGR = 5.7%
2015-16 (%)
50%
16%
15%
7%8% 4%
HSD
MS
LPG
Naphtha, ATF & SKO
FO & Bitumen
Others
*Note: FY 2010-11 is base year for 5 Year CAGR
Products MMT 5 Y CAGR %
HSD 17 6.5MS 6 9.3LPG 5 6.8Naphtha, ATF & SKO 2 (1.1)FO & Bitumen 3 (4.3)Others 1 26.6
Questions
43
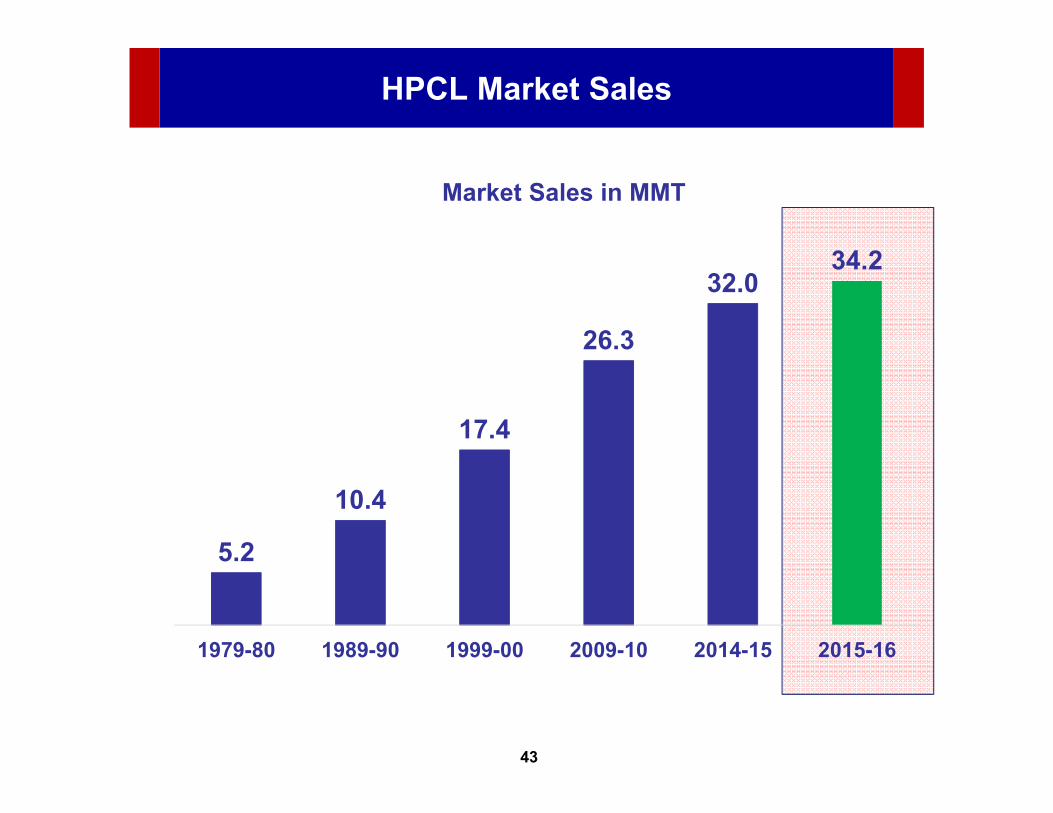
HPCL Market Sales
5.2
10.4
17.4
26.3
32.034.2
1979-80 1989-90 1999-00 2009-10 2014-15 2015-16
Market Sales in MMT
Questions
44
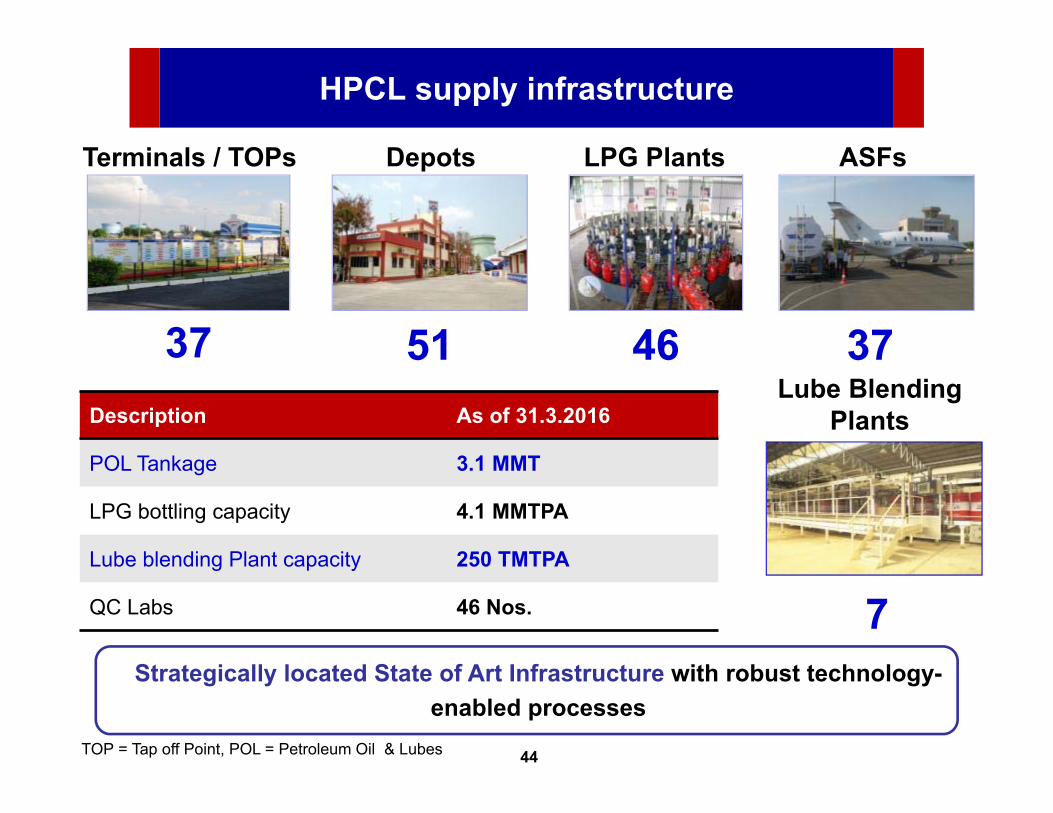
HPCL supply infrastructure
Terminals / TOPs Depots LPG Plants
37 51 46
ASFs
37Lube Blending
Plants
7
Description As of 31.3.2016
POL Tankage 3.1 MMT
LPG bottling capacity 4.1 MMTPA
Lube blending Plant capacity 250 TMTPA
QC Labs 46 Nos.
TOP = Tap off Point, POL = Petroleum Oil & Lubes
Strategically located State of Art Infrastructure with robust technology-enabled processes
Questions
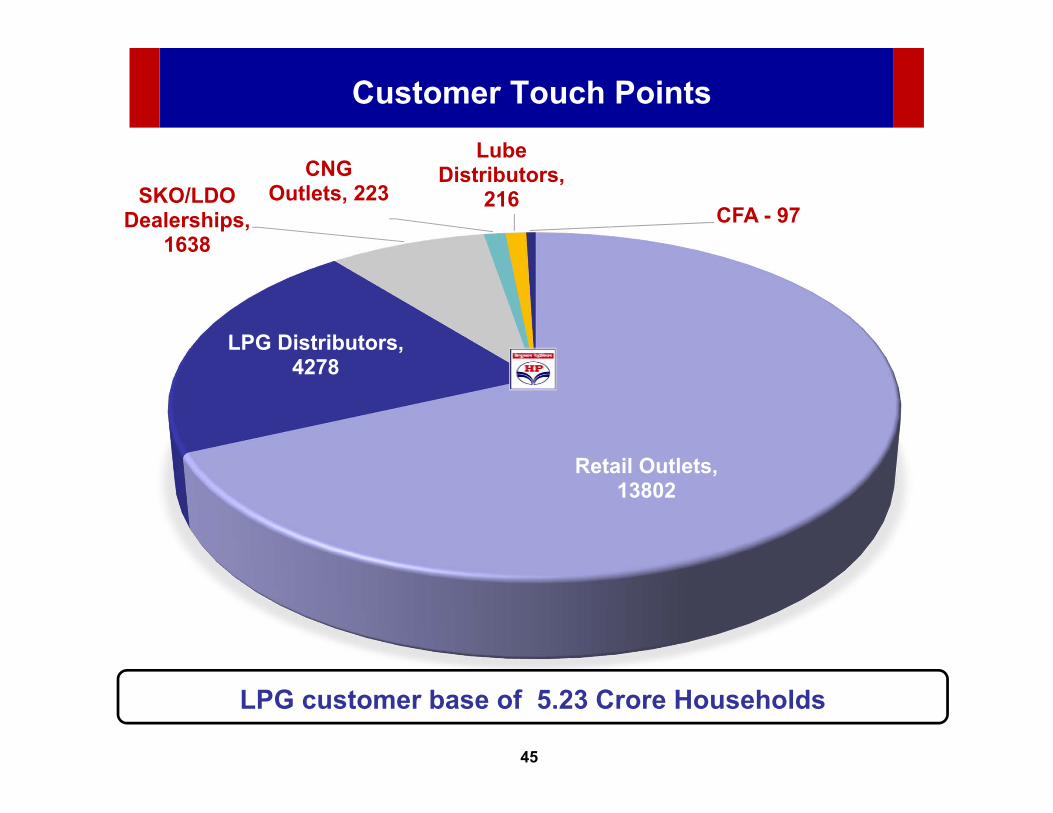
45
Retail Outlets, 13802
LPG Distributors, 4278
SKO/LDO Dealerships,
1638
CNG Outlets, 223
Lube Distributors,
216CFA - 97
Customer Touch Points
LPG customer base of 5.23 Crore Households

Questions
46
Marketing Highlights 2015-16
• Recorded best ever physical performance• Market sales : 34.2 MMT• Domestic Growth : 9.3%• Market share gain : 0.31%• Sale of RLNG : 36 TMT
Motor Fuels
• Market share gain of 0.36% (PSU category)• Commissioned 590 new retail outlets
LPG
• Highest ever sales of 5.07 MMT• First Company to introduce 450Kg SUMO cylinders for Forklift • Online payment facility for LPG refill• Introduced new product - Metal cutting gas under the brand
name of HP Razor

Questions
47
Marketing Highlights 2015-16
• No. 1 Lubricant Marketer position for the third successive year• Market share gain of ~ 2.6% • New products launched
• HP Milcy Turbo Ultra for diesel engines• HP Neo Synth 5W30 for passenger cars • HP Racer 4 Synth 10W30 for motorcycles
• Signed agreement with Snapdeal for online selling of HP lubes packs
Lubricants
B2B
• Market share gain of 1.2% (PSU category)• Commenced supplies of Winter Grade Diesel to Indian Army • Supplying Jet Fuel to all the eight scheduled domestic airlines of
the country
Questions
48
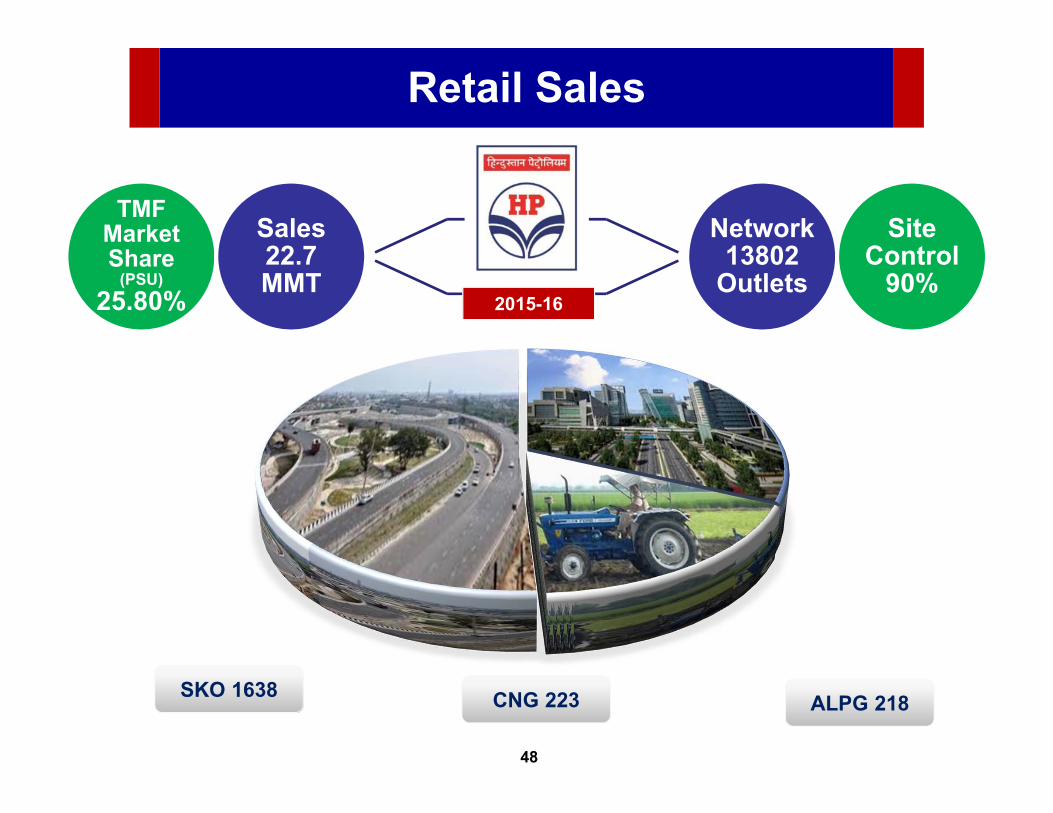
Retail Sales
TMF Market Share
(PSU) 25.80%
Sales 22.7 MMT
Network 13802
Outlets
Site Control
90%2015-16
SKO 1638 CNG 223 ALPG 218

Questions
49
Focus on Customer Experience
SegmentationSegmentation FormatsFormats e-fuel stationse-fuel stations NetworkProductivity
NetworkProductivity
Strong Customer Loyalty

Questions
50
Customer Centric Formats
“Retail Outlet Formats” designed to address needs of “Target Customer Segments” in a ‘Consistent’ manner.
Highway
Rural
Urban
NHAI Award to COMCO Shoolagiri“Best Amenities on Highways”

Questions
51
Retail : Improving Network Productivity
Implementing Outlet Diagnostics and Monitoring Tool (ODMT) as a structured approach for achieving outlet specific growth.
Scientific approach through Network Planning tool for identifying• Potential new locations• Sales potential at existing outlets
Network Planning (NP) Tool

Questions
52
Operations & Distribution
• Throughput : 47.5 MMT• Sustainable Development:
• 258 Kwp Solar PV power project commissioned at EnnoreTerminal, Tamil Nadu.
• Efficient energy and water management

Questions
53
IT Initiatives in Supply Chain
• Terminal Automation System
• Online Inventory Management System
• O&D Dashboard-Parichalan Darpan
• Electromechanical Locking
• Online HSE Index System
• Vehicle Tracking System
• Common Infrastructure Portal-Bandhan
• Inspection Tool and Mock Drill Reporting
• Online Budgeting Tool and Infrastructure Portal
• Online Work Permit System and Near Miss Portal
Questions
54
Ajmer
Mundra
Palanpur
B’garhRewari
JaipurDelhi
Kanpur
SolapurPune
B’Pur
R’MundryVijayawada
S’bad
Hassan
B’Lore
Mathura
Suryapet
Vashi
Jodhpur
2nd largest product pipeline network
Visakh-Vijayawada Secunderabad P/L
(VVSPL)
Rewari – Kanpur P/L-RKPL
Ramanmandi-Bahadurgarh P/L (RBPL)/Ramanmandi- Bathinda P/L (RBhPL)
Mumbai – Pune Solapur P/L (MPSPL)
Mundra Delhi P/L (MDPL)
Awa Salawas P/L (ASPL)
JVC - Petronet Mangalore Bangalore P/L (PMHBL)
Hazarwadi
M’lore
Mumbai
Visakh
Ramanmandi
POL pipeline network* 3,015 kms
* Excluding PMHB JVC P/L
HPCL Pipeline
JVC Pipeline
Questions
55
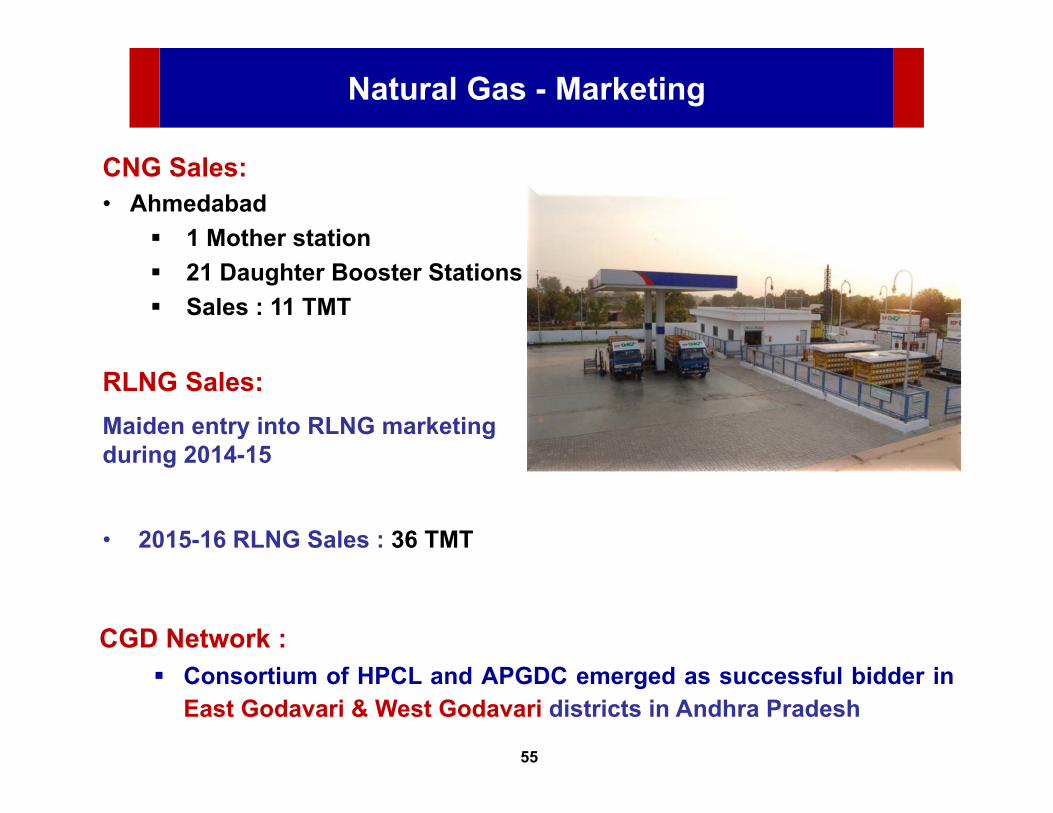
Natural Gas - Marketing
CNG Sales:• Ahmedabad
1 Mother station 21 Daughter Booster Stations Sales : 11 TMT
RLNG Sales:Maiden entry into RLNG marketing during 2014-15
• 2015-16 RLNG Sales : 36 TMT
CGD Network : Consortium of HPCL and APGDC emerged as successful bidder in
East Godavari & West Godavari districts in Andhra Pradesh
Questions
56
Projects Completed

Questions
57
New Projects Commissioned : 2015-16
Length : 443 Km
Capacity : 7.98 MMTPA
TOPs : Bharatpur, Mathura
Capex : Rs. 1,447 crore
Rewari – Kanpur Pipeline
Kanpur Terminal
Rewari pumping station
Tankage : 227 TKL
2 x 8 Bay White oil TT Gantry
State of Art Terminal

Questions
58
New Projects Commissioned : 2015-16
120 TMTPA LPG Bottling capacity
3 x 500 MT Mounded Storage Vessels
Two 24 Head Electronic Carousels
8 bay TT Gantry
Plant area ~43 acres
Project Cost ~83 crore
Commissioned during Feb’16
Solapur LPG Plant

Questions
59
Ongoing Projects

Questions
60
Projects under Implementation
• 356 km Mangalore – Hassan – Mysore – Bengaluru LPG Pipeline (3.1 MMTPA) .
• 168 km Uran –Chakan LPG pipeline (1.0 MMTPA).
LPG pipelines
• Revamp at Jabalpur Depot (Madhya Pradesh) and Loni Terminal (Maharashtra), Nalagarh Depot (Himachal Pradesh).
POL Depots
LPG Plants
• New LPG Plants at Bhopal (Madhya Pradesh) Karimnagar (Telangana) and at Panagarh (West Bengal).

Questions
61
Wind Farm Projects
• Capacity in Operation : 50.5 MW.
• Wind Power Plants in Rajasthan (Jaisalmer, Akal) and Maharashtra (Dhule)
Existing Capacity
• 50.4 MW capacity in Jaisalmer (Tejuva).
• Project Cost : Rs. 370 Crore
Planned Addition

Questions
62
Projects Planned

Questions
63
Expansion of Refineries
• Expansion of capacity from 6.5 MMTPA to 9.5 MMTPA • Salient features:
• Euro VI compliant Petrol & Diesel• Propylene Manufacturing facilities• Estimated Capex of Rs. 4,200 crore
Mumbai Refinery
• Expansion of capacity from 8.3 MMTPA to 15 MMTPA • Salient features: Residue up-gradation Euro VI compliant Petrol & Diesel Estimated Capex of Rs. 20,800 crore.
Visakh Refinery

Questions
64
New POL Pipeline Projects
• Extension from Palanpur to Vadodara with a new green field marketing terminal near Vadodara
• Approx. Cost : Rs.1900 Crore
MDPL Phase II
• Capacity expansion from 5.38 MMTPA to 8 MMTPA for evacuation post Visakh Refinery Expansion
• Extension of VVSPL from Vijayawada to Dharmapuri in Tamilnadu (628 Km) with a new green field terminal at Dharmapuri
• Approx. Cost : Rs.3000 Crore
VVSPL Phase II

Questions
65
New Marketing Projects
LPG Plants
• New POL Depot at Bilaspur (Chhattisgarh), Leh ( J&K) and Revamp at Meerut ( UP)
POL Depots
Lube Blending Plants
• New LPG Plants at Haldia (West Bengal) Varanasi (UP) and Sagauli(Bihar)
• Lube Blending Plants at Mumbai (Maharashtra) & Kasna (UP)

Questions
66
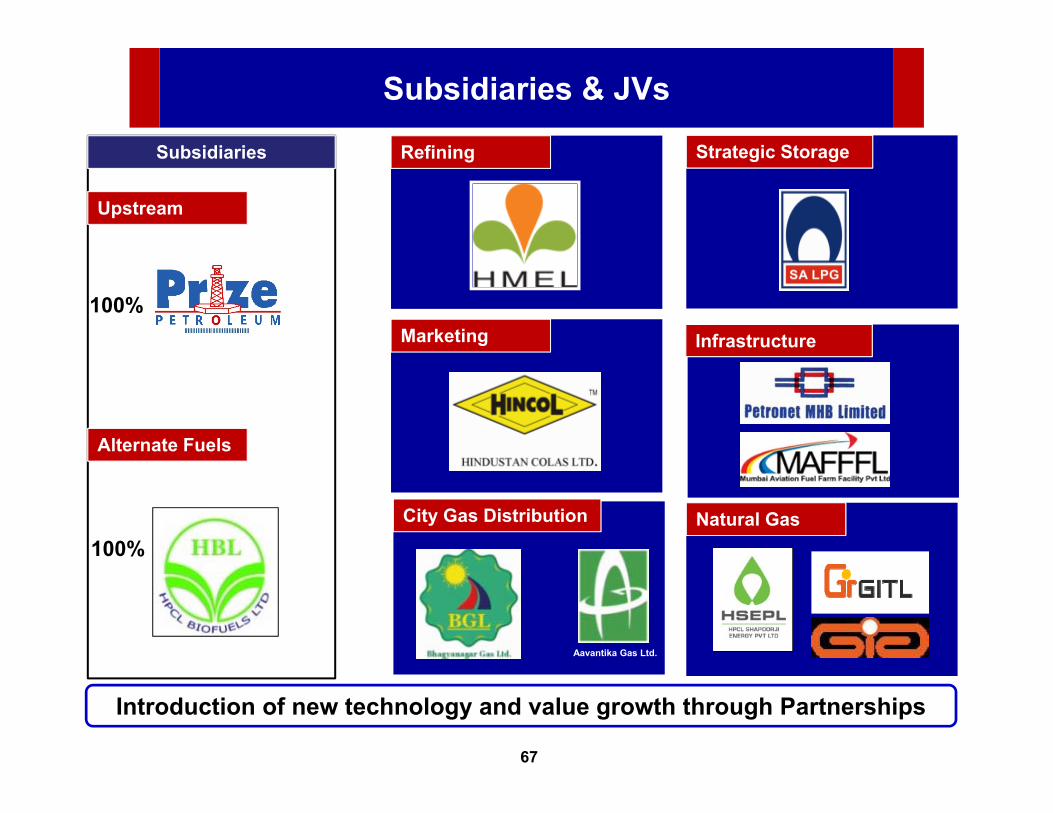
Subsidiaries & JVs
Questions
67
Subsidiaries & JVs
Introduction of new technology and value growth through Partnerships
Upstream
Alternate Fuels
100%
100%City Gas Distribution
Refining
Marketing Infrastructure
Aavantika Gas Ltd.
Strategic Storage
Natural Gas
Subsidiaries

Questions
68
Exploration & Production
2015-16 Production : 62 TMT
Prize Petroleum, a wholly owned subsidiary
Overseas Operations (Australia)
1 - Producing Field1 - Discovered Field
Domestic Operations
1- Producing Field (Sanganpur)1- Discovered Field (Cambay)1- Service contract (Hirapur)1- Exploration Blocks (NELP IX)

Questions
69
HMEL Expansion
Project Details:• Capacity enhancement from 9 MMTPA to 11.3 MMTPA
• Estimated Project cost ~ Rs. 2425 Crore
Additional HPCL Equity ~ Rs. 490 Crore
• Estimated Completion: June 2017

Questions
70
LNG Terminal at Chhara, Gujarat
• Being implemented thru JVC –HSEL. HPCL Equity : 50%
• 5 MMTPA LNG Regasification terminal at Chhara Port
• Capacity : 5 MMTPA
• Est. Cost: Rs. 5411 Crore; HPCL Equity: Rs. 810 Crore
• Financial closure for the project has been completed
• Environmental clearance : Public hearing completed
• Estimated Completion: Oct 2019
Questions
7171
HPCL Capex

Questions
72
Planned CAPEX : 2016-21 (5 Years)
Capex Projection 2016–2021 2016-17
Refining 25,741 1,418
Marketing 26,160 4,563
Renewables 970 289
R & D 504 112
Joint Venture 2,440 480
Total 55,815 6,862
(Rs. Crores)

Questions
73
Integrated Margin Management
Feed Stock Supply• Optimisation
of Crude & Long-term contracts
Refining• Production
optimisation
Distribution• Optimization
of distribution costs & higher infrastructure utilisation
Storage• Inventory
Optimization
Sales• Optimization
of Make or Buy decisions
Valu
e cr
eatio
n le
vers
Levers for value creation across supply chain
Crude & Shipping Refineries Supplies & Distribution Operation Marketing

Questions
74
Corporate Social Responsibility
Focus AreasChild Care
Education
Health Care
Skill Development
Sports
Environment & Community
Development
Touching over 1.1 Lakhlives since inception
Beyond Business …..
Questions
Thank you