hindustan unilever - visit note-sep-13-edelbsmedia.business-standard.com/_media/bs/data/marke… ·...
TRANSCRIPT
Edelweiss Research is also available on www.edelresearch.com,
Bloomberg EDEL <GO>, Thomson First Call, Reuters and Factset.
Edelweiss Securities Limited
Our recent interaction with the Hindustan Unilever (HUL) management
reaffirms our view that growth pace in discretionary categories (personal
products, ice creams) continues to moderate. We expect volume growth
to be tepid in Q2FY14 as well. In H2FY14, HUL’s volume growth is likely to
benefit from low base (5% and 6% YoY in Q3FY13 and Q4FY13,
respectively) and likely surge in rural spending owing to good monsoon
and impending elections. Implementation of the Food Security Bill will
further propel rural demand over the long term. Maintain ‘HOLD’.
Discretionary demand waning; heavier wallets to spur rural growth
HUL's discretionary category is facing slowdown and premium offerings are now
growing at par with category, unlike the superior pace earlier. Rural demand continues
to outpace urban primarily due to the company’s robust distribution network. Though
some respite in food inflation is inevitable due to good monsoon, diesel inflation is
likely to negate its impact to some extent. Good monsoon and forthcoming elections
augur well for rural disposable incomes.
Heightening competitive intensity in oral care, detergents
Competitive intensity has intensified post entry of Procter & Gamble (P&G) in the oral
care space. HUL has stepped up aggression and will continue to defend its position in
the space. In soaps, the company has unwound promotional offers and has taken
select price hikes to counter INR depreciation impact on palm oil prices; we expect
peers to follow suit. Competitive intensity in detergents has risen. Fair & Lovely (FAL)
has been re-launched recently with changes in packaging and cream color (back to
white from pink), though the price has been maintained.
Outlook and valuations: Cautious; maintain ‘HOLD’
We remain positive on HUL from a long-term perspective. However, slowdown in
discretionary segment remains an overhang. At CMP, the stock is trading at 38.5x
FY14E and 34.6x FY15E EPS. We maintain ‘HOLD’ recommendation and rate it ‘Sector
Underperformer’. We maintain target multiple at 34x FY15E EPS; TP of INR633.
VISIT NOTE
HINDUSTAN UNILEVER Near-term pain, long-term robust
EDELWEISS 4D RATINGS
Absolute Rating HOLD
Rating Relative to Sector Underperformer
Risk Rating Relative to Sector Low
Sector Relative to Market Overweight
MARKET DATA (R: HLL.BO, B: HUVR IN)
CMP : INR 642
Target Price : INR 633
52-week range (INR) : 725 / 432
Share in issue (mn) : 2,162.6
M cap (INR bn/USD mn) : 1,389 / 21,938
Avg. Daily Vol.BSE/NSE(‘000) : 2,866.1
SHARE HOLDING PATTERN (%)
Current Q4FY13 Q3FY13
Promoters *
52.5 52.5 52.5
MF's, FI's & BK’s 7.1 8.1 8.5
FII's 20.2 22.1 21.7
Others 20.2 17.3 17.3
* Promoters pledged shares
(% of share in issue)
: NIL
PRICE PERFORMANCE (%)
Stock Nifty
EW Consumer
Goods Index
1 month 7.2 7.1 9.2
3 months 7.8 1.5 16.8
12 months 22.4 5.3 40.8
Abneesh Roy
+91 22 6620 3141
Pooja Lath
+91 22 6620 3075
India Equity Research| Consumer Goods
September 18, 2013
Financials
Year to March FY12 FY13 FY14E FY15E
Revenues (INR mn) 229,877 263,172 289,357 326,097
Rev. growth (%) 17.0 14.5 10.0 12.7
EBITDA (INR mn) 34,836 42,053 46,477 52,860
Net profit (INR mn) 27,907 38,290 37,455 40,170
Shares outstanding (mn) 2,162 2,163 2,163 2,163
Diluted EPS (INR) 12.4 15.6 16.7 18.6
EPS growth (%) 30.3 26.0 7.0 11.2
Diluted P/E (x) 51.9 41.2 38.5 34.6
EV/EBITDA (x) 38.6 32.1 28.9 25.2
ROAE (%) 83.4 103.1 105.4 87.5
Consumer Goods
2 Edelweiss Securities Limited
Key management meet takeaways
Pricing action: Pricing action largely depends on raw material prices/forex fluctuation. Any
sudden, sharp movement in INR and crude compels price increase as it impacts PFAD (palm
oil fatty acid derivative), LAB, soda ash, packaging, freight and power costs. Soaps &
detergents (S&D) category is likely to see increased pricing action.
HUL’s pricing strategy is to keep the price hike below inflation as some internal cost
efficiencies compensate for the difference. Prices are always increased in a calibrated
manner. HUL is committed to remain competitive even if it impacts margin in near term.
Demand: Demand remains moderate with discretionary facing slowdown pressure. In
discretionary categories, rate of growth continues to remain tardy and quality of growth is
also getting impacted (premium offerings are now growing at pace with category, unlike
superior pace earlier).
Rural growth continues to outstrip the urban counterpart; as per Nielsen, though the
growth rate in both rural and urban is moderating at same levels. However, in case of HUL,
rural continues to outperform urban primarily due to the company’s robust distribution
network. Good monsoon augurs well as it will increase rural disposable incomes. Though
food inflation is likely to see some respite due to good monsoon, fuel inflation will negate its
impact to some extent.
Soaps: HUL has unwound promotional offers and taken select price hikes in soaps post
Q1FY14 to counter INR depreciation impact on palm oil prices.
Detergents: Competitive intensity in the space has risen significantly especially with respect
to promotions in the recent times.
Personal care: Market volume growth for skin category has slowed down from mid-teen in
Q1FY13 to flattish in Q1FY14 as disposable incomes are getting squeezed (fair amount
locked in fixed commitments like loan repayments further impacted by food inflation). Fresh
uptrading has moderated; in some categories, mass products are growing well, but there no
apparent signs of significant down trading.
Oral care: Competition has intensified post entry of P&G. HUL has stepped up aggression
and will continue to defend its position in the space.
Skin care: Fair & Lovely has been recently re-launched with a change in packaging and
colour of the cream (back to white from pink), though price has been maintained.
Overall skin care products consumption in India is low (China per capita consumption is 10x
India’s); increase in consumption combined with higher penetration will drive category
growth over the long term. Most products have been restaged with a single brand extended
to various products (example: Ponds, which was synonymous with cold cream earlier, has
been extended to face wash, whitening cream, anti-ageing cream, etc) to exploit growing
affinity for beauty products as disposable incomes are rising.
Hair care: Conditioners have not grown as expected. In developed markets, 60-70%
consumers purchase conditioners along with shampoo.
Hindustan Unilever
3 Edelweiss Securities Limited
TRESemmé was priced in line with Dove, but at an indirect discount (more grammage
offered at similar price) and positioned to deliver salon-like experience at home. It has been
well received and is doing particularly well in modern trade.
HUL will soon launch TIGI hair care brand targeting premium salons. The product will be
imported and HUL will create a separate channel with some level of leveraging from existing
channels.
Packaged foods: Soupy noodles received good response post re-launch, though more action
can be taken as the product has scope for faster and better growth. HUL does not intend to
vacate this space.
A&P: A&P spends are budgeted to maintain Share of Voice (SoV) depending on competitive
intensity. In 2010, ad spends had reduced from 13% of sales to 11% as category heat had
dipped. Recently, ad spends have been high as initial months of launches (both by self and
competition) require brand push. Oral care A&P spends are not likely to swing the needle
significantly.
TRAI recommendation on 12 minute ad cap per hour, if implemented, will reduce ad
inventory stock and lead to increase in ad rates depending on total GRPs of particular
channels. HUL will keep SoV constant and may benefit due to scale.
In our view; smaller players may not get adequate space due to fall in inventory.
HUL has been evaluating other media sources than TV like wall paintings, digital, etc.
However, TV will continue to corner a large share of ad spends with non-TV component
slowing picking. Though TV continues to be a popular advertising media, other media
segments are also gaining ground.
Food Security Bill: Though benefit will flow in only when effectively implemented, it is a
positive move as affluence and affordability will boost discretionary spending.
Inflation: Steady inflation bodes well for HUL, but volatility and sharp inflation hurts growth.
There are no signs of pressure on unorgainsed / regional players due to inflation, though the
same has been observed during past inflationary periods.
Segmental growth: HUL continues to grow competitively, ahead of market growth with
soaps, premium detergents, hair care, tea (robust price led growth owing to marketing
interventions in most brands), packaged foods (double digit growth in Kissan) doing well.
Some categories like mass detergents, ice creams (a drag for packaged foods), Clear, coffee
(growth was price led which has now anniversarised and competitive heat has increased)
are facing challenging times.
Consumer Goods
4 Edelweiss Securities Limited
Other key developments
Sanjiv Mehta takes over as CEO
Mr. Nitin Paranjpe has been promoted as the head of home care business of Unilever and
will directly report to Mr. Paul Polman. He will be replaced by Mr. Sanjiv Mehta, current
Chairman at Middle East and North Africa; his earlier stints at Unilever include Chairman
and CEO at Unilever Philippines, Chairman and Managing Director at Unilever Bangladesh,
Commercial Director at Unilever Bangladesh, Group Commercial Manager & Commercial
Head HPC at Unilever Arabia. He is a CA and has done MBA from Harvard Business School.
Oral care ad fight
Competitive intensity in the oral care space has heated up with the entry of a new player,
P&G. HUL had recently launched a comparative advertisement targeting Colgate in the mass
segment. With advertisement for a relaunched Pepsodent Germicheck claiming "130%
superiority" in terms of germ attack power over "Colgate Strong Teeth, at four hours after
brushing". However, the Delhi High Court overruled Colgate’s petition against HUL as the
claim was not found to be denigrating, slandering or rubbishing the competitor.
Later, Colgate was pulled up by the Advertising Standards Council of India (ASCI) for its
Colgate Strong Teeth television commercial, which claimed to provide "100% guarantee in
anti-cavity protection" on a complaint filed by HUL. ASCI asked Colgate to modify or
withdraw the ad since the claims were unsubstantiated. ASCI also noted that an IDA seal on
the toothpaste pack was misleading as the certification was meant for another variant,
Colgate Super Shakti. HUL's complaint against the claim that "Colgate is the No. 1 brand
recommended by dentists" was not upheld by ASCI.
Price hike summary
The consumer pack’s pricing action in September (compared against June prices) can be
summarised as follows:
Toothpaste
• Closeup menthol toothpaste (HUL) increased price of its 150g pack by 2.4%
• Cibaca (Colgate) took a price increase of 5.3% in its 175g pack.
• Colgate Active Salt (Colgate) increased the price of its 100g pack by 4.8%.
• Colgate Max Fresh (Colgate) took a price hike of 4.8% in its 80g pack.
• Sensodyne Rapid Relief has increased the price of its 80g pack by 9.1%, but is also
offering a Sensodyne brush worth INR40 free.
Detergents and bars
• Surf Excel Quick Wash (HUL) has increased its price by 1.7% of its 1kg pack.
• Rin Detergent (HUL) has increased price of 1kg pack by 5.4% and is offering INR10 Rin
Bar free.
• Surf Excel Matic (HUL) has increased the price of 1kg pack by 6.5%.
• Wheel Bar Blue (HUL) has reduced its grammage by 20gms to 215gms, leading to an
effective price increase of 9.3%.
Hindustan Unilever
5 Edelweiss Securities Limited
Soaps
• Dove Moisturising soap (HUL) increased its price of 75g pack by 4.8%.
• Pears Oil Clear (HUL) increased the price of 125g pack by 8%.
• Lux Creamy White (HUL) increased prices by 4.2% of the 75g pack.
• Lifebuoy (HUL) took price hike of 4.8% on the 125g pack.
• Dettol Original Soap (Reckitt Benckiser) took price hike of 5.7% in its 125g pack.
• Hamam (HUL) took price hike of 8.7% in its 100g pack.
Skin care
• Lakme peach milk moisturiser (HUL) increased price of 120ml pack by 12.9%.
• Ponds Dreamflower talc (HUL) increased the price of 400g pack by 8%.
Shampoos
• Clinic plus (HUL) took a price hike of 4.3%.
• All Clear (HUL) reduced grammage by 10g to 80ml, leading to an effective price increase
of 12.5%.
• Pantene Pro V (P&G) cut price of its 80ml pack by 4.8%.
• Head & Shoulders (P&G) took price hike of 11.3% on its 80ml pack.
• L’Oreal total repair took price hike of 16.9% in 90ml pack.
• Garnier Fructis reduced prices by 7.2% on the 100ml bottle.
Noodles and ketchup
• Yippie Noodles (ITC) cut grammage by 5gm, leading to effective price increase of 6.7%.
• Ketchup Kissan (HUL) took price hike of 7.1% on 1kg bottle.
• Ketchup Squeeze (HUL) took price hike of 10% on 1kg pack.
• Hienz tomato ketchup hiked price 8% on 1kg pack.
• Maggi Tomato Ketchup (Nestle) is offering INR12 off on its 1kg pack, leading to price cut
of 10%.
Tea & coffee
• Wagh Bakri raised prices on 500g pack of 3.2%.
• Tata Tea Agni (Tata Global) took a price hike of 3.1% on 500g pack.
• Brooke Bond Red label (HUL) is giving INR20 off on 500gm pack, leading to a price
decline of 4%.
Consumer Goods
6 Edelweiss Securities Limited
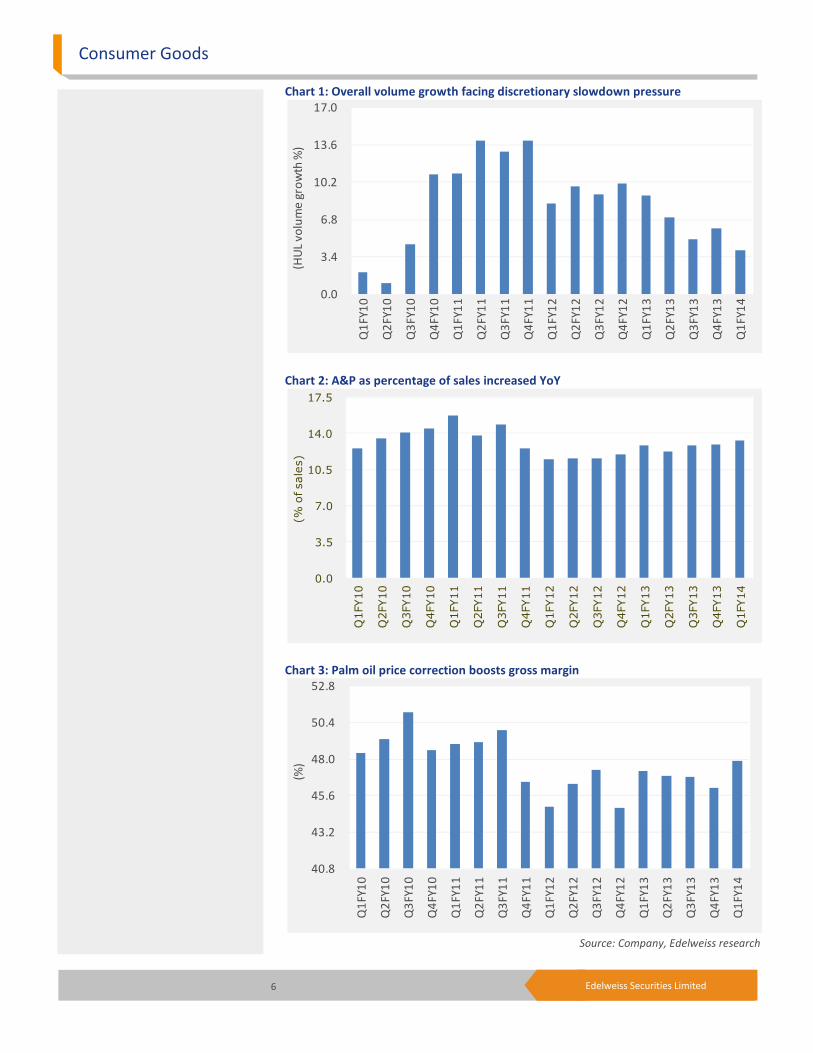
Chart 1: Overall volume growth facing discretionary slowdown pressure
Chart 2: A&P as percentage of sales increased YoY
Chart 3: Palm oil price correction boosts gross margin
Source: Company, Edelweiss research
0.0
3.4
6.8
10.2
13.6
17.0
Q1
FY
10
Q2
FY
10
Q3
FY
10
Q4
FY
10
Q1
FY
11
Q2
FY
11
Q3
FY
11
Q4
FY
11
Q1
FY
12
Q2
FY
12
Q3
FY
12
Q4
FY
12
Q1
FY
13
Q2
FY
13
Q3
FY
13
Q4
FY
13
Q1
FY
14
(HU
L v
olu
me
gro
wth
%)
0.0
3.5
7.0
10.5
14.0
17.5
Q1FY10
Q2FY10
Q3FY10
Q4FY10
Q1FY11
Q2FY11
Q3FY11
Q4FY11
Q1FY12
Q2FY12
Q3FY12
Q4FY12
Q1FY13
Q2FY13
Q3FY13
Q4FY13
Q1FY14
(% of sales)
40.8
43.2
45.6
48.0
50.4
52.8
Q1
FY
10
Q2
FY
10
Q3
FY
10
Q4
FY
10
Q1
FY
11
Q2
FY
11
Q3
FY
11
Q4
FY
11
Q1
FY
12
Q2
FY
12
Q3
FY
12
Q4
FY
12
Q1
FY
13
Q2
FY
13
Q3
FY
13
Q4
FY
13
Q1
FY
14
(%)
Hindustan Unilever
7 Edelweiss Securities Limited
Soaps and
Detergents
39%Personal
Products
48%
Beverages
10%
Packaged
Food
3%
Others
(includes
Chemicals,
Water etc)
0%
Q1FY13 - EBIT contribution
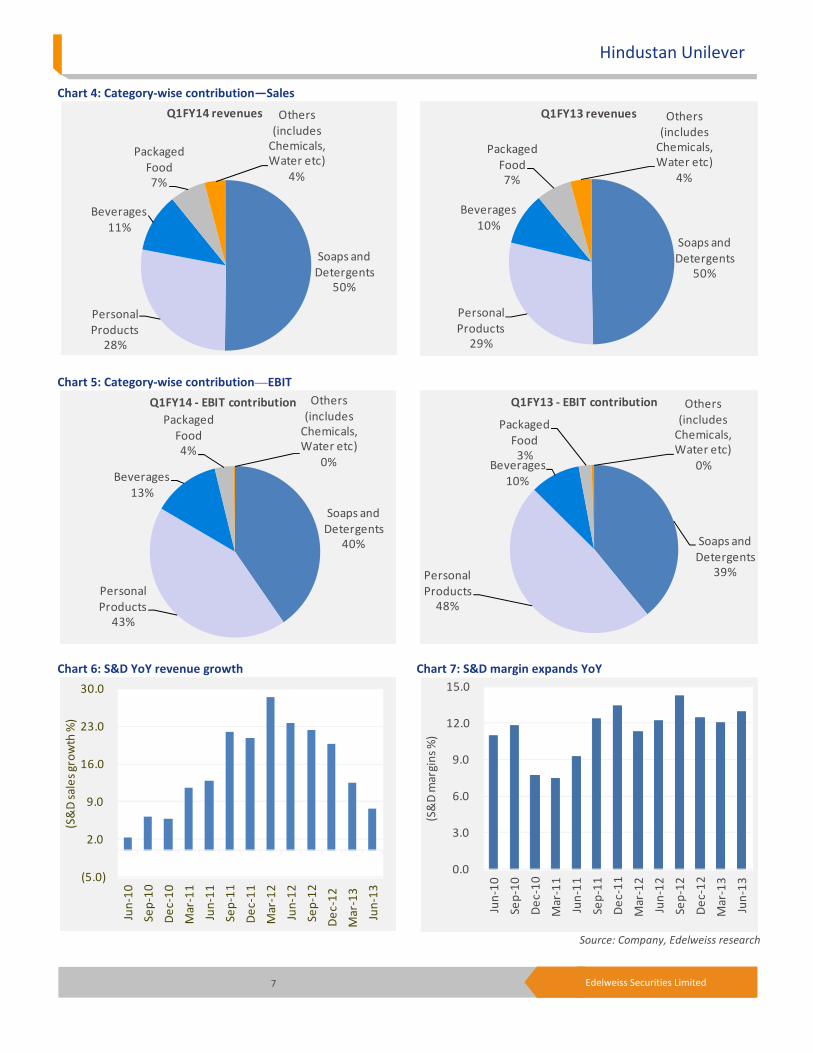
Chart 4: Category-wise contribution—Sales
Chart 5: Category-wise contribution—EBIT
Chart 6: S&D YoY revenue growth Chart 7: S&D margin expands YoY
Source: Company, Edelweiss research
Soaps and
Detergents
50%
Personal
Products
28%
Beverages
11%
Packaged
Food
7%
Others
(includes
Chemicals,
Water etc)
4%
Q1FY14 revenues
Soaps and
Detergents
40%
Personal
Products
43%
Beverages
13%
Packaged
Food
4%
Others
(includes
Chemicals,
Water etc)
0%
Q1FY14 - EBIT contribution
(5.0)
2.0
9.0
16.0
23.0
30.0
Jun
-10
Se
p-1
0
De
c-1
0
Ma
r-1
1
Jun
-11
Se
p-1
1
De
c-1
1
Ma
r-1
2
Jun
-12
Se
p-1
2
De
c-1
2
Ma
r-1
3
Jun
-13
(S&
D s
ale
s g
row
th %
)
Soaps and
Detergents
50%
Personal
Products
29%
Beverages
10%
Packaged
Food
7%
Others
(includes
Chemicals,
Water etc)
4%
Q1FY13 revenues
0.0
3.0
6.0
9.0
12.0
15.0
Jun
-10
Se
p-1
0
De
c-1
0
Ma
r-1
1
Jun
-11
Se
p-1
1
De
c-1
1
Ma
r-1
2
Jun
-12
Se
p-1
2
De
c-1
2
Ma
r-1
3
Jun
-13
(S&
D m
arg
ins
%)
Consumer Goods
8 Edelweiss Securities Limited
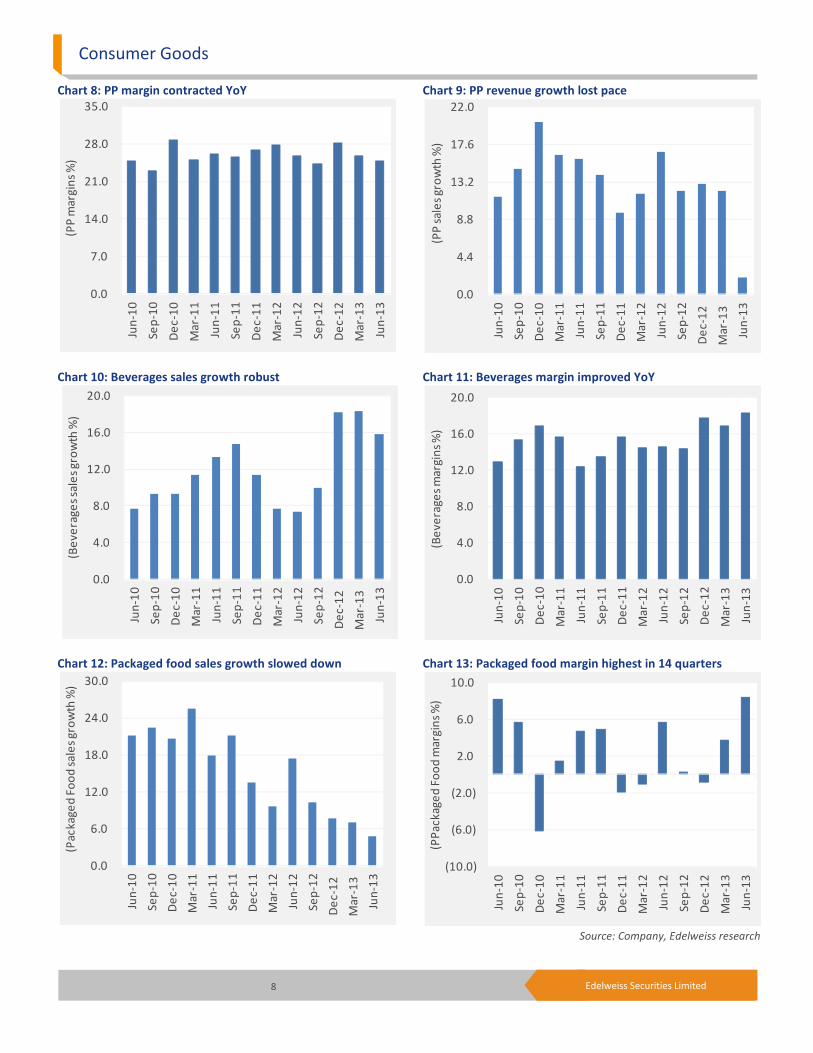
Chart 8: PP margin contracted YoY Chart 9: PP revenue growth lost pace
Chart 10: Beverages sales growth robust Chart 11: Beverages margin improved YoY
Chart 12: Packaged food sales growth slowed down Chart 13: Packaged food margin highest in 14 quarters
Source: Company, Edelweiss research
0.0
7.0
14.0
21.0
28.0
35.0
Jun
-10
Se
p-1
0
De
c-1
0
Ma
r-1
1
Jun
-11
Se
p-1
1
De
c-1
1
Ma
r-1
2
Jun
-12
Se
p-1
2
De
c-1
2
Ma
r-1
3
Jun
-13
(PP
ma
rgin
s %
)
0.0
4.0
8.0
12.0
16.0
20.0
Jun
-10
Se
p-1
0
De
c-1
0
Ma
r-1
1
Jun
-11
Se
p-1
1
De
c-1
1
Ma
r-1
2
Jun
-12
Se
p-1
2
De
c-1
2
Ma
r-1
3
Jun
-13
(Be
ve
rag
es
sale
s g
row
th %
)
0.0
6.0
12.0
18.0
24.0
30.0
Jun
-10
Se
p-1
0
De
c-1
0
Ma
r-1
1
Jun
-11
Se
p-1
1
De
c-1
1
Ma
r-1
2
Jun
-12
Se
p-1
2
De
c-1
2
Ma
r-1
3
Jun
-13
(Pa
ck
ag
ed
Fo
od
sa
les
gro
wth
%)
0.0
4.4
8.8
13.2
17.6
22.0
Jun
-10
Se
p-1
0
De
c-1
0
Ma
r-1
1
Jun
-11
Se
p-1
1
De
c-1
1
Ma
r-1
2
Jun
-12
Se
p-1
2
De
c-1
2
Ma
r-1
3
Jun
-13
(PP
sa
les
gro
wth
%)
0.0
4.0
8.0
12.0
16.0
20.0
Jun
-10
Se
p-1
0
De
c-1
0
Ma
r-1
1
Jun
-11
Se
p-1
1
De
c-1
1
Ma
r-1
2
Jun
-12
Se
p-1
2
De
c-1
2
Ma
r-1
3
Jun
-13
(Be
ve
rag
es
ma
rgin
s %
)
(10.0)
(6.0)
(2.0)
2.0
6.0
10.0
Jun
-10
Se
p-1
0
De
c-1
0
Ma
r-1
1
Jun
-11
Se
p-1
1
De
c-1
1
Ma
r-1
2
Jun
-12
Se
p-1
2
De
c-1
2
Ma
r-1
3
Jun
-13
(PP
ac
ka
ge
d F
oo
d m
arg
ins
%)
Hindustan Unilever
9 Edelweiss Securities Limited
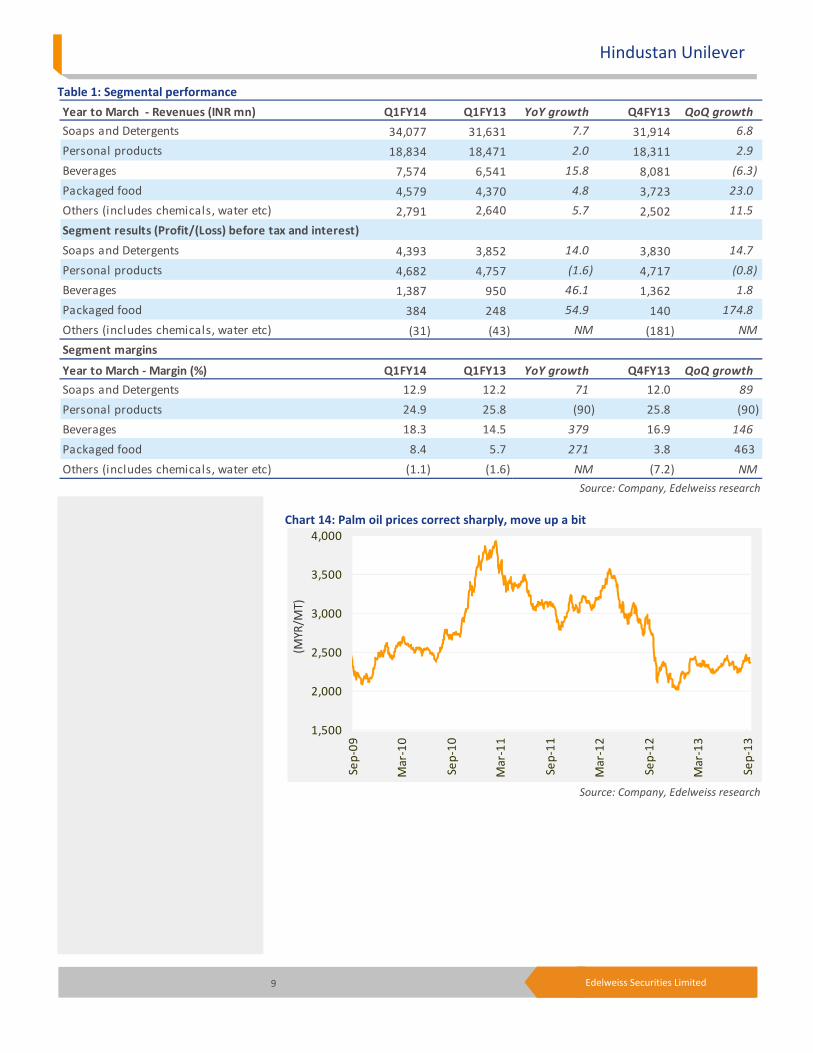
Table 1: Segmental performance
Source: Company, Edelweiss research
Chart 14: Palm oil prices correct sharply, move up a bit
Source: Company, Edelweiss research
Year to March - Revenues (INR mn) Q1FY14 Q1FY13 YoY growth Q4FY13 QoQ growth
Soaps and Detergents 34,077 31,631 7.7 31,914 6.8
Personal products 18,834 18,471 2.0 18,311 2.9
Beverages 7,574 6,541 15.8 8,081 (6.3)
Packaged food 4,579 4,370 4.8 3,723 23.0
Others (includes chemicals, water etc) 2,791 2,640 5.7 2,502 11.5
Segment results (Profit/(Loss) before tax and interest)
Soaps and Detergents 4,393 3,852 14.0 3,830 14.7
Personal products 4,682 4,757 (1.6) 4,717 (0.8)
Beverages 1,387 950 46.1 1,362 1.8
Packaged food 384 248 54.9 140 174.8
Others (includes chemicals, water etc) (31) (43) NM (181) NM
Segment margins
Year to March - Margin (%) Q1FY14 Q1FY13 YoY growth Q4FY13 QoQ growth
Soaps and Detergents 12.9 12.2 71 12.0 89
Personal products 24.9 25.8 (90) 25.8 (90)
Beverages 18.3 14.5 379 16.9 146
Packaged food 8.4 5.7 271 3.8 463
Others (includes chemicals, water etc) (1.1) (1.6) NM (7.2) NM
1,500
2,000
2,500
3,000
3,500
4,000
Se
p-0
9
Ma
r-1
0
Se
p-1
0
Ma
r-1
1
Se
p-1
1
Ma
r-1
2
Se
p-1
2
Ma
r-1
3
Se
p-1
3
(MY
R/M
T)
Consumer Goods
10 Edelweiss Securities Limited
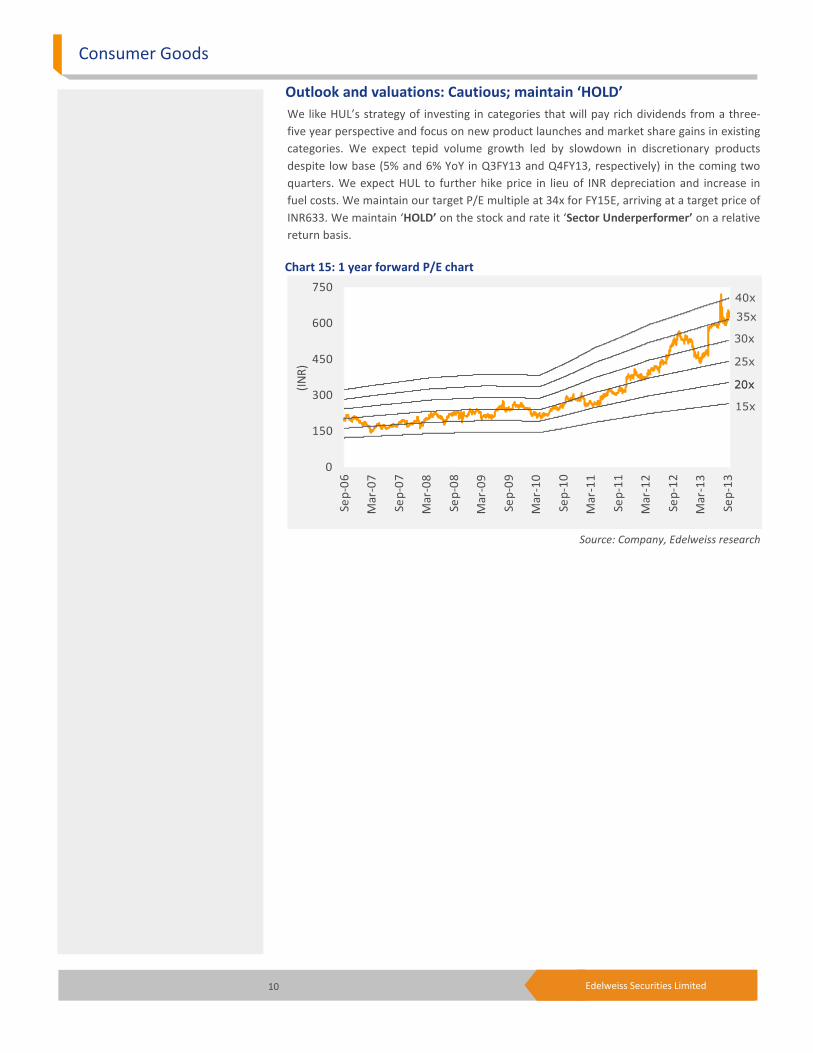
Outlook and valuations: Cautious; maintain ‘HOLD’
We like HUL’s strategy of investing in categories that will pay rich dividends from a three-
five year perspective and focus on new product launches and market share gains in existing
categories. We expect tepid volume growth led by slowdown in discretionary products
despite low base (5% and 6% YoY in Q3FY13 and Q4FY13, respectively) in the coming two
quarters. We expect HUL to further hike price in lieu of INR depreciation and increase in
fuel costs. We maintain our target P/E multiple at 34x for FY15E, arriving at a target price of
INR633. We maintain ‘HOLD’ on the stock and rate it ‘Sector Underperformer’ on a relative
return basis.
Chart 15: 1 year forward P/E chart
Source: Company, Edelweiss research
0
150
300
450
600
750
Se
p-0
6
Ma
r-0
7
Se
p-0
7
Ma
r-0
8
Se
p-0
8
Ma
r-0
9
Se
p-0
9
Ma
r-1
0
Se
p-1
0
Ma
r-1
1
Se
p-1
1
Ma
r-1
2
Se
p-1
2
Ma
r-1
3
Se
p-1
3
(IN
R)
20x
40x
15x
20x
25x
30x
35x
Hindustan Unilever
11 Edelweiss Securities Limited
Company Description
HUL, the largest FMCG Company in India, was formed by merging three subsidiaries of
Unilever in 1956. At present, Unilever Plc holds a 67.3% stake in the company. HUL’s
portfolio of products covers a wide spectrum including soaps, detergents, skin creams,
shampoos, toothpastes, tea, coffee, packaged foods and branded atta.
Powerful brands and an envious distribution network are HUL’s primary strengths. The
company operates through segments—soaps & detergents, personal products, beverages,
foods, exports, and other operations.
Investment Theme
HUL is a play on consumption growth in India. The company has displayed its ability to effect
price hikes and avoid impact of inflation in vegetable oils, which, combined with improved
outlook for fabric wash and strong growth in processed foods and beverages, boosts our
positive outlook on the stock. The recent moves by the company to dispose of its non-core
assets including few properties give it a near term upside. We like its revenue growth from a
medium to long term perspective, however increase in royalty, steep hike in tax rate and
slowdown in discretionary segments remains an overhang. Post partial success of Unilever’s
open offer to raise its stake in HUL the parent’s stake stands at 67.3% of the total
shareholding.
Key Risks
Depreciation in rupee impacts price of imported raw materials.
A rise in crude oil prices can impact packaging costs and indirectly / directly impact palm oil
and LAB prices.
Increase in palm oil prices may lead to gross margin contraction.
The price war in HUL’s popular segments with new entrants entering the fray could hit the
company hard.
12 Edelweiss Securities Limited
Consumer Goods
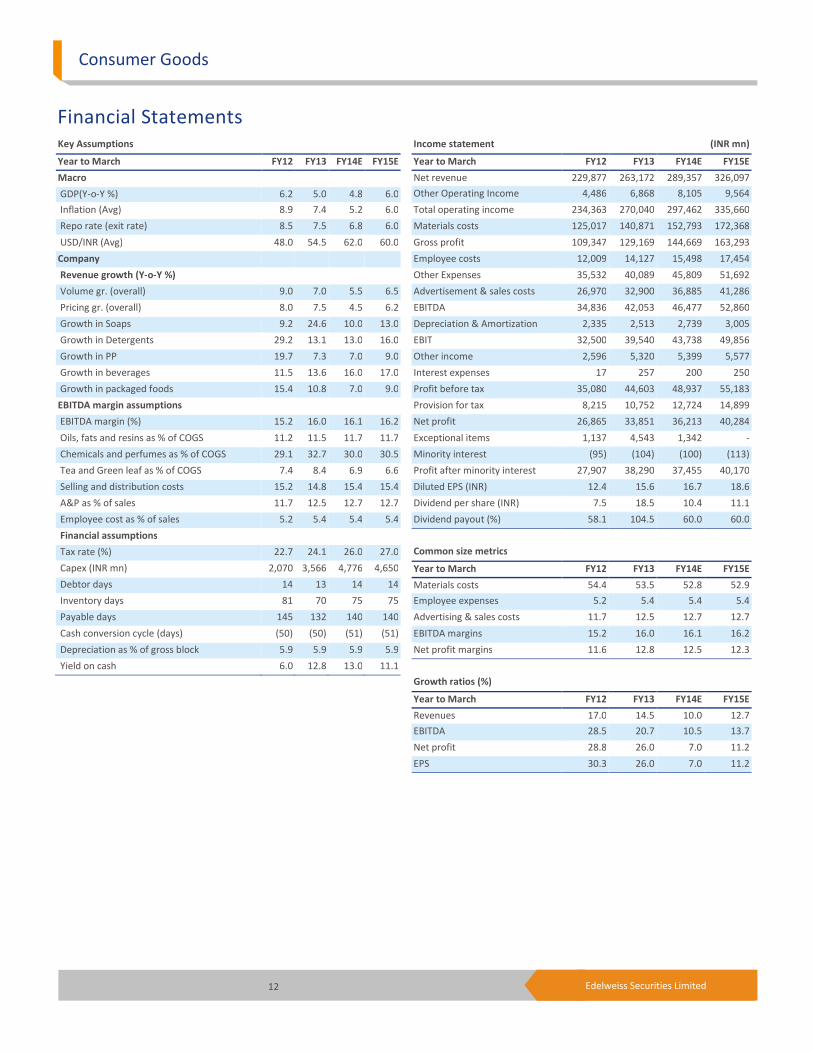
Financial Statements
Income statement (INR mn)
Year to March FY12 FY13 FY14E FY15E
Net revenue 229,877 263,172 289,357 326,097
Other Operating Income 4,486 6,868 8,105 9,564
Total operating income 234,363 270,040 297,462 335,660
Materials costs 125,017 140,871 152,793 172,368
Gross profit 109,347 129,169 144,669 163,293
Employee costs 12,009 14,127 15,498 17,454
Other Expenses 35,532 40,089 45,809 51,692
Advertisement & sales costs 26,970 32,900 36,885 41,286
EBITDA 34,836 42,053 46,477 52,860
Depreciation & Amortization 2,335 2,513 2,739 3,005
EBIT 32,500 39,540 43,738 49,856
Other income 2,596 5,320 5,399 5,577
Interest expenses 17 257 200 250
Profit before tax 35,080 44,603 48,937 55,183
Provision for tax 8,215 10,752 12,724 14,899
Net profit 26,865 33,851 36,213 40,284
Exceptional items 1,137 4,543 1,342 -
Minority interest (95) (104) (100) (113)
Profit after minority interest 27,907 38,290 37,455 40,170
Diluted EPS (INR) 12.4 15.6 16.7 18.6
Dividend per share (INR) 7.5 18.5 10.4 11.1
Dividend payout (%) 58.1 104.5 60.0 60.0
Common size metrics
Year to March FY12 FY13 FY14E FY15E
Materials costs 54.4 53.5 52.8 52.9
Employee expenses 5.2 5.4 5.4 5.4
Advertising & sales costs 11.7 12.5 12.7 12.7
EBITDA margins 15.2 16.0 16.1 16.2
Net profit margins 11.6 12.8 12.5 12.3
Growth ratios (%)
Year to March FY12 FY13 FY14E FY15E
Revenues 17.0 14.5 10.0 12.7
EBITDA 28.5 20.7 10.5 13.7
Net profit 28.8 26.0 7.0 11.2
EPS 30.3 26.0 7.0 11.2
Key Assumptions
Year to March FY12 FY13 FY14E FY15E
Macro
GDP(Y-o-Y %) 6.2 5.0 4.8 6.0
Inflation (Avg) 8.9 7.4 5.2 6.0
Repo rate (exit rate) 8.5 7.5 6.8 6.0
USD/INR (Avg) 48.0 54.5 62.0 60.0
Company
Revenue growth (Y-o-Y %)
Volume gr. (overall) 9.0 7.0 5.5 6.5
Pricing gr. (overall) 8.0 7.5 4.5 6.2
Growth in Soaps 9.2 24.6 10.0 13.0
Growth in Detergents 29.2 13.1 13.0 16.0
Growth in PP 19.7 7.3 7.0 9.0
Growth in beverages 11.5 13.6 16.0 17.0
Growth in packaged foods 15.4 10.8 7.0 9.0
EBITDA margin assumptions
EBITDA margin (%) 15.2 16.0 16.1 16.2
Oils, fats and resins as % of COGS 11.2 11.5 11.7 11.7
Chemicals and perfumes as % of COGS 29.1 32.7 30.0 30.5
Tea and Green leaf as % of COGS 7.4 8.4 6.9 6.6
Selling and distribution costs 15.2 14.8 15.4 15.4
A&P as % of sales 11.7 12.5 12.7 12.7
Employee cost as % of sales 5.2 5.4 5.4 5.4
Financial assumptions
Tax rate (%) 22.7 24.1 26.0 27.0
Capex (INR mn) 2,070 3,566 4,776 4,650
Debtor days 14 13 14 14
Inventory days 81 70 75 75
Payable days 145 132 140 140
Cash conversion cycle (days) (50) (50) (51) (51)
Depreciation as % of gross block 5.9 5.9 5.9 5.9
Yield on cash 6.0 12.8 13.0 11.1
13 Edelweiss Securities Limited
Hindustan Unilever
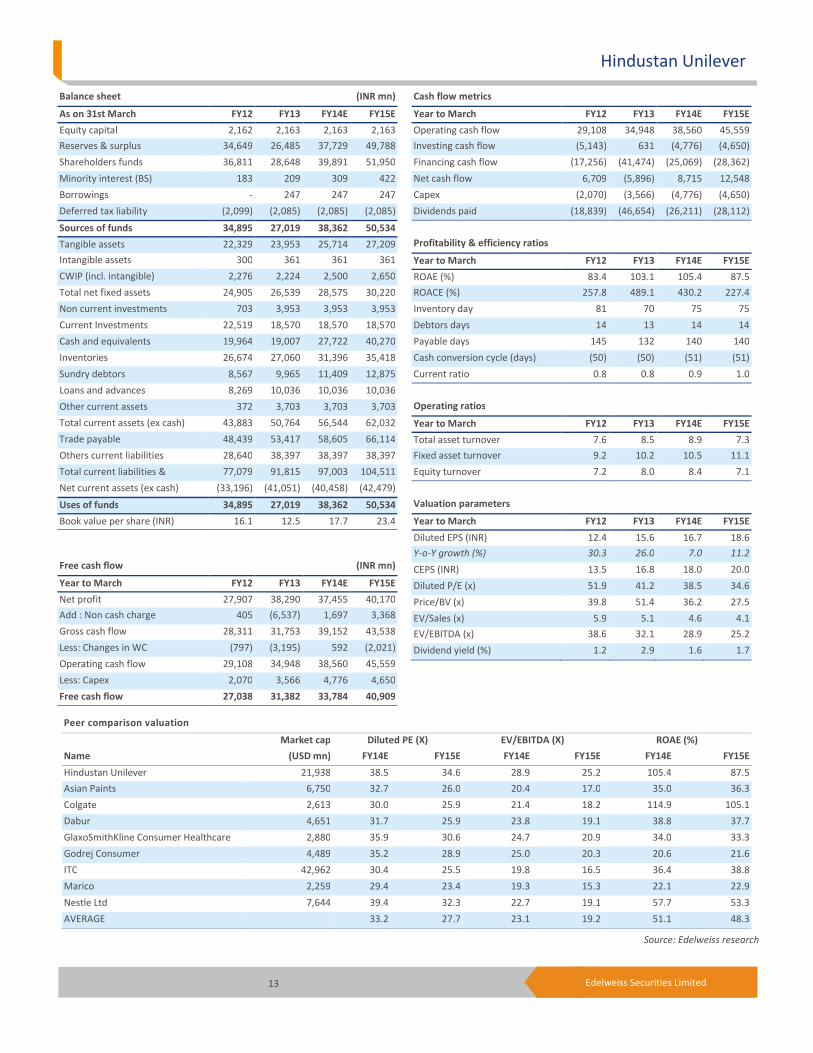
Peer comparison valuation
Market cap Diluted PE (X) EV/EBITDA (X) ROAE (%)
Name (USD mn) FY14E FY15E FY14E FY15E FY14E FY15E
Hindustan Unilever 21,938 38.5 34.6 28.9 25.2 105.4 87.5
Asian Paints 6,750 32.7 26.0 20.4 17.0 35.0 36.3
Colgate 2,613 30.0 25.9 21.4 18.2 114.9 105.1
Dabur 4,651 31.7 25.9 23.8 19.1 38.8 37.7
GlaxoSmithKline Consumer Healthcare 2,880 35.9 30.6 24.7 20.9 34.0 33.3
Godrej Consumer 4,489 35.2 28.9 25.0 20.3 20.6 21.6
ITC 42,962 30.4 25.5 19.8 16.5 36.4 38.8
Marico 2,259 29.4 23.4 19.3 15.3 22.1 22.9
Nestle Ltd 7,644 39.4 32.3 22.7 19.1 57.7 53.3
AVERAGE 33.2 27.7 23.1 19.2 51.1 48.3
Source: Edelweiss research
Cash flow metrics
Year to March FY12 FY13 FY14E FY15E
Operating cash flow 29,108 34,948 38,560 45,559
Investing cash flow (5,143) 631 (4,776) (4,650)
Financing cash flow (17,256) (41,474) (25,069) (28,362)
Net cash flow 6,709 (5,896) 8,715 12,548
Capex (2,070) (3,566) (4,776) (4,650)
Dividends paid (18,839) (46,654) (26,211) (28,112)
Profitability & efficiency ratios
Year to March FY12 FY13 FY14E FY15E
ROAE (%) 83.4 103.1 105.4 87.5
ROACE (%) 257.8 489.1 430.2 227.4
Inventory day 81 70 75 75
Debtors days 14 13 14 14
Payable days 145 132 140 140
Cash conversion cycle (days) (50) (50) (51) (51)
Current ratio 0.8 0.8 0.9 1.0
Operating ratios
Year to March FY12 FY13 FY14E FY15E
Total asset turnover 7.6 8.5 8.9 7.3
Fixed asset turnover 9.2 10.2 10.5 11.1
Equity turnover 7.2 8.0 8.4 7.1
Valuation parameters
Year to March FY12 FY13 FY14E FY15E
Diluted EPS (INR) 12.4 15.6 16.7 18.6
Y-o-Y growth (%) 30.3 26.0 7.0 11.2
CEPS (INR) 13.5 16.8 18.0 20.0
Diluted P/E (x) 51.9 41.2 38.5 34.6
Price/BV (x) 39.8 51.4 36.2 27.5
EV/Sales (x) 5.9 5.1 4.6 4.1
EV/EBITDA (x) 38.6 32.1 28.9 25.2
Dividend yield (%) 1.2 2.9 1.6 1.7
Balance sheet (INR mn)
As on 31st March FY12 FY13 FY14E FY15E
Equity capital 2,162 2,163 2,163 2,163
Reserves & surplus 34,649 26,485 37,729 49,788
Shareholders funds 36,811 28,648 39,891 51,950
Minority interest (BS) 183 209 309 422
Borrowings - 247 247 247
Deferred tax liability (2,099) (2,085) (2,085) (2,085)
Sources of funds 34,895 27,019 38,362 50,534
Tangible assets 22,329 23,953 25,714 27,209
Intangible assets 300 361 361 361
CWIP (incl. intangible) 2,276 2,224 2,500 2,650
Total net fixed assets 24,905 26,539 28,575 30,220
Non current investments 703 3,953 3,953 3,953
Current Investments 22,519 18,570 18,570 18,570
Cash and equivalents 19,964 19,007 27,722 40,270
Inventories 26,674 27,060 31,396 35,418
Sundry debtors 8,567 9,965 11,409 12,875
Loans and advances 8,269 10,036 10,036 10,036
Other current assets 372 3,703 3,703 3,703
Total current assets (ex cash) 43,883 50,764 56,544 62,032
Trade payable 48,439 53,417 58,605 66,114
Others current liabilities 28,640 38,397 38,397 38,397
Total current liabilities & 77,079 91,815 97,003 104,511
Net current assets (ex cash) (33,196) (41,051) (40,458) (42,479)
Uses of funds 34,895 27,019 38,362 50,534
Book value per share (INR) 16.1 12.5 17.7 23.4
Free cash flow (INR mn)
Year to March FY12 FY13 FY14E FY15E
Net profit 27,907 38,290 37,455 40,170
Add : Non cash charge 405 (6,537) 1,697 3,368
Gross cash flow 28,311 31,753 39,152 43,538
Less: Changes in WC (797) (3,195) 592 (2,021)
Operating cash flow 29,108 34,948 38,560 45,559
Less: Capex 2,070 3,566 4,776 4,650
Free cash flow 27,038 31,382 33,784 40,909
14 Edelweiss Securities Limited
Consumer Goods
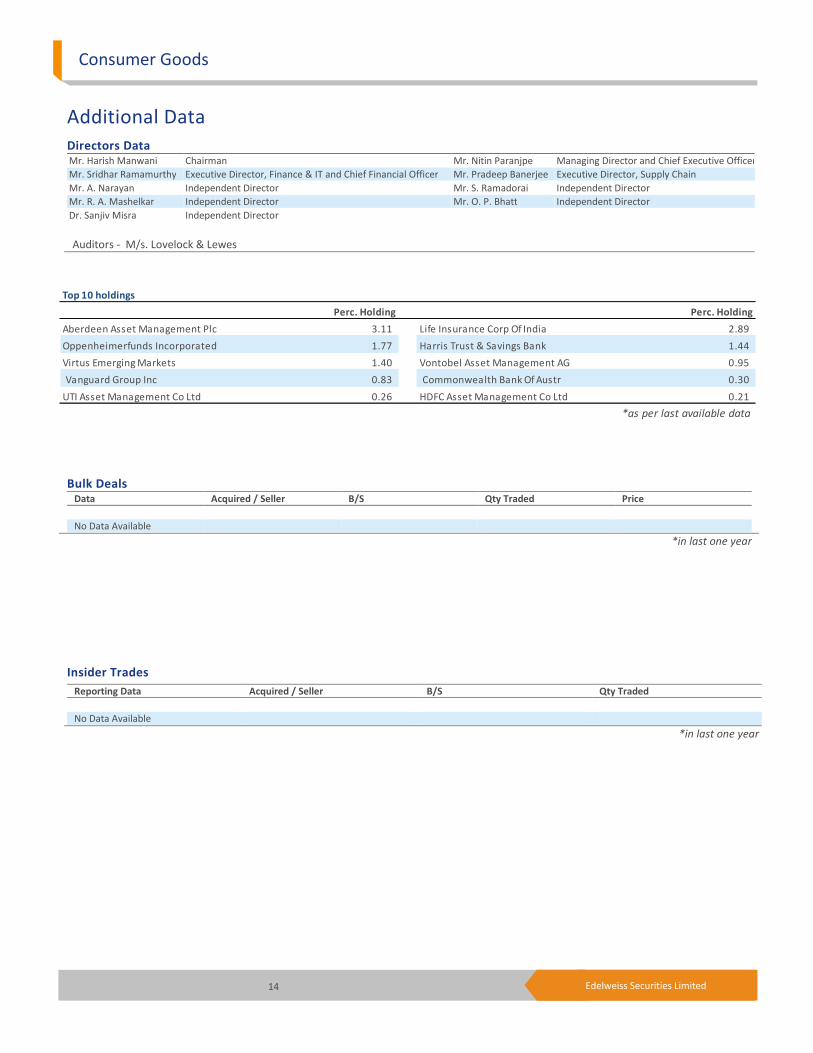
Top 10 holdings
Perc. Holding Perc. Holding
Aberdeen Asset Management Plc 3.11 Life Insurance Corp Of India 2.89
Oppenheimerfunds Incorporated 1.77 Harris Trust & Savings Bank 1.44
Virtus Emerging Markets 1.40 Vontobel Asset Management AG 0.95
Vanguard Group Inc 0.83 Commonwealth Bank Of Austr 0.30
UTI Asset Management Co Ltd 0.26 HDFC Asset Management Co Ltd 0.21
*as per last available data
Insider Trades
Reporting Data Acquired / Seller B/S Qty Traded
No Data Available
*in last one year
Bulk Deals Data Acquired / Seller B/S Qty Traded Price
No Data Available
*in last one year
Additional Data
Directors Data
Mr. Harish Manwani Chairman Mr. Nitin Paranjpe Managing Director and Chief Executive Officer
Mr. Sridhar Ramamurthy Executive Director, Finance & IT and Chief Financial Officer Mr. Pradeep Banerjee Executive Director, Supply Chain
Mr. A. Narayan Independent Director Mr. S. Ramadorai Independent Director
Mr. R. A. Mashelkar Independent Director Mr. O. P. Bhatt Independent Director
Dr. Sanjiv Misra Independent Director
Auditors - M/s. Lovelock & Lewes
*as per last annual report
15 Edelweiss Securities Limited
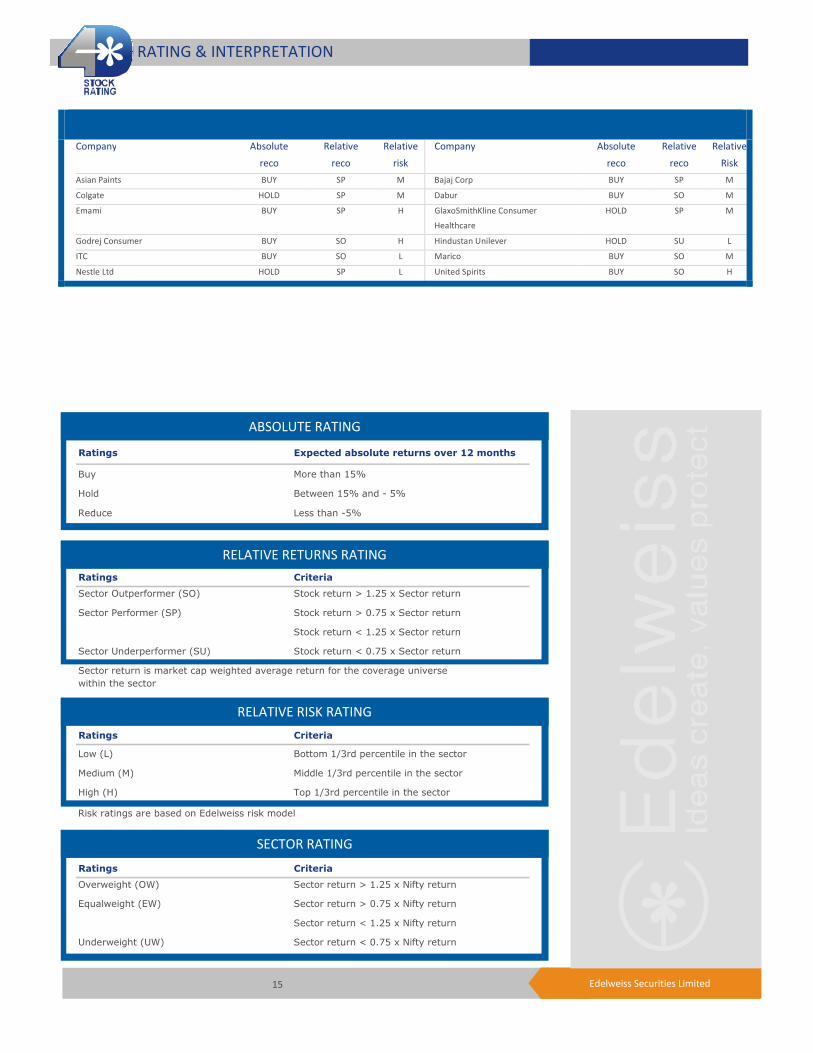
Company Absolute
reco
Relative
reco
Relative
risk
Company Absolute
reco
Relative
reco
Relative
Risk
Asian Paints BUY SP M Bajaj Corp BUY SP M
Colgate HOLD SP M Dabur BUY SO M
Emami BUY SP H GlaxoSmithKline Consumer
Healthcare
HOLD SP M
Godrej Consumer BUY SO H Hindustan Unilever HOLD SU L
ITC BUY SO L Marico BUY SO M
Nestle Ltd HOLD SP L United Spirits BUY SO H
RATING & INTERPRETATION
ABSOLUTE RATING
Ratings Expected absolute returns over 12 months
Buy More than 15%
Hold Between 15% and - 5%
Reduce Less than -5%
RELATIVE RETURNS RATING
Ratings Criteria
Sector Outperformer (SO) Stock return > 1.25 x Sector return
Sector Performer (SP) Stock return > 0.75 x Sector return
Stock return < 1.25 x Sector return
Sector Underperformer (SU) Stock return < 0.75 x Sector return
Sector return is market cap weighted average return for the coverage universe
within the sector
RELATIVE RISK RATING
Ratings Criteria
Low (L) Bottom 1/3rd percentile in the sector
Medium (M) Middle 1/3rd percentile in the sector
High (H) Top 1/3rd percentile in the sector
Risk ratings are based on Edelweiss risk model
SECTOR RATING
Ratings Criteria
Overweight (OW) Sector return > 1.25 x Nifty return
Equalweight (EW) Sector return > 0.75 x Nifty return
Sector return < 1.25 x Nifty return
Underweight (UW) Sector return < 0.75 x Nifty return
16 Edelweiss Securities Limited
Consumer Goods
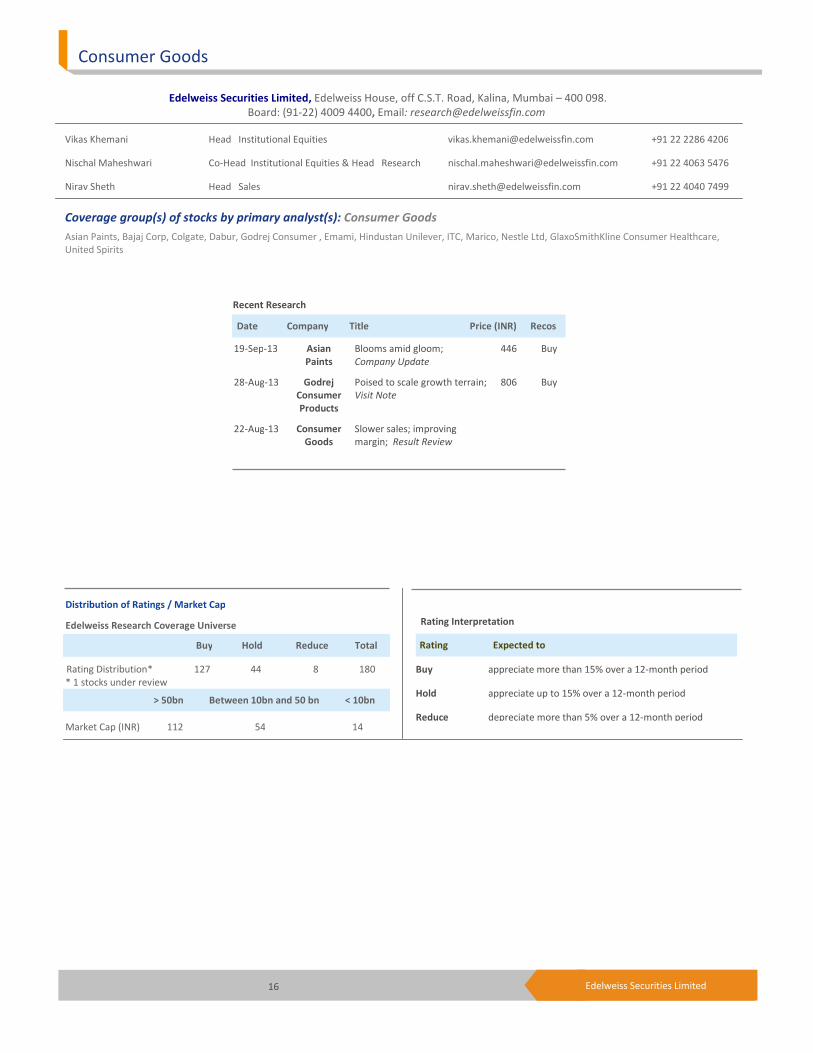
Edelweiss Securities Limited, Edelweiss House, off C.S.T. Road, Kalina, Mumbai – 400 098.
Board: (91-22) 4009 4400, Email: [email protected]
Vikas Khemani Head Institutional Equities [email protected] +91 22 2286 4206
Nischal Maheshwari Co-Head Institutional Equities & Head Research [email protected] +91 22 4063 5476
Nirav Sheth Head Sales [email protected] +91 22 4040 7499
Coverage group(s) of stocks by primary analyst(s): Consumer Goods
Asian Paints, Bajaj Corp, Colgate, Dabur, Godrej Consumer , Emami, Hindustan Unilever, ITC, Marico, Nestle Ltd, GlaxoSmithKline Consumer Healthcare,
United Spirits
Distribution of Ratings / Market Cap
Edelweiss Research Coverage Universe
Rating Distribution* 127 44 8 180
* 1 stocks under review
Market Cap (INR) 112 54 14
Date Company Title Price (INR) Recos
Recent Research
19-Sep-13 Asian
Paints
Blooms amid gloom;
Company Update
446 Buy
28-Aug-13 Godrej
Consumer
Products
Poised to scale growth terrain;
Visit Note
806 Buy
22-Aug-13 Consumer
Goods
Slower sales; improving
margin; Result Review
> 50bn Between 10bn and 50 bn < 10bn
Buy Hold Reduce Total
Rating Interpretation
Buy appreciate more than 15% over a 12-month period
Hold appreciate up to 15% over a 12-month period
Reduce depreciate more than 5% over a 12-month period
Rating Expected to
17 Edelweiss Securities Limited
Hindustan Unilever
DISCLAIMER
General Disclaimer:
This report has been prepared by Edelweiss Securities Limited (Edelweiss). Edelweiss, its holding company and associate
companies are a full service, integrated investment banking, portfolio management and brokerage group. Our research analysts
and sales persons provide important input into our investment banking activities. This report does not constitute an offer or
solicitation for the purchase or sale of any financial instrument or as an official confirmation of any transaction. The information
contained herein is from publicly available data or other sources believed to be reliable, but we do not represent that it is
accurate or complete and it should not be relied on as such. Edelweiss or any of its affiliates/ group companies shall not be in any
way responsible for any loss or damage that may arise to any person from any inadvertent error in the information contained in
this report. This report is provided for assistance only and is not intended to be and must not alone be taken as the basis for an
investment decision. The user assumes the entire risk of any use made of this information. Each recipient of this report should
make such investigation as it deems necessary to arrive at an independent evaluation of an investment in the securities of
companies referred to in this report (including the merits and risks involved), and should consult his own advisors to determine
the merits and risks of such investment. The investment discussed or views expressed may not be suitable for all investors. We
and our affiliates, group companies, officers, directors, and employees may: (a) from time to time, have long or short positions in,
and buy or sell the securities thereof, of company (ies) mentioned herein or (b) be engaged in any other transaction involving such
securities and earn brokerage or other compensation or act as advisor or lender/borrower to such company (ies) or have other
potential conflict of interest with respect to any recommendation and related information and opinions. This information is
strictly confidential and is being furnished to you solely for your information. This information should not be reproduced or
redistributed or passed on directly or indirectly in any form to any other person or published, copied, in whole or in part, for any
purpose. This report is not directed or intended for distribution to, or use by, any person or entity who is a citizen or resident of or
located in any locality, state, country or other jurisdiction, where such distribution, publication, availability or use would be
contrary to law, regulation or which would subject Edelweiss and affiliates/ group companies to any registration or licensing
requirements within such jurisdiction. The distribution of this report in certain jurisdictions may be restricted by law, and persons
in whose possession this report comes, should inform themselves about and observe, any such restrictions. The information given
in this report is as of the date of this report and there can be no assurance that future results or events will be consistent with this
information. This information is subject to change without any prior notice. Edelweiss reserves the right to make modifications
and alterations to this statement as may be required from time to time. However, Edelweiss is under no obligation to update or
keep the information current. Nevertheless, Edelweiss is committed to providing independent and transparent recommendation
to its client and would be happy to provide any information in response to specific client queries. Neither Edelweiss nor any of its
affiliates, group companies, directors, employees, agents or representatives shall be liable for any damages whether direct,
indirect, special or consequential including lost revenue or lost profits that may arise from or in connection with the use of the
information. Past performance is not necessarily a guide to future performance. The disclosures of interest statements
incorporated in this report are provided solely to enhance the transparency and should not be treated as endorsement of the
views expressed in the report. Edelweiss Securities Limited generally prohibits its analysts, persons reporting to analysts and their
dependents from maintaining a financial interest in the securities or derivatives of any companies that the analysts cover. The
information provided in these reports remains, unless otherwise stated, the copyright of Edelweiss. All layout, design, original
artwork, concepts and other Intellectual Properties, remains the property and copyright Edelweiss and may not be used in any
form or for any purpose whatsoever by any party without the express written permission of the copyright holders.
Analyst Certification:
The analyst for this report certifies that all of the views expressed in this report accurately reflect his or her personal views about
the subject company or companies and its or their securities, and no part of his or her compensation was, is or will be, directly or
indirectly related to specific recommendations or views expressed in this report.
Analyst holding in the stock: No.
Edelweiss shall not be liable for any delay or any other interruption which may occur in presenting the data due to any reason
including network (Internet) reasons or snags in the system, break down of the system or any other equipment, server
breakdown, maintenance shutdown, breakdown of communication services or inability of the Edelweiss to present the data. In no
event shall the Edelweiss be liable for any damages, including without limitation direct or indirect, special, incidental, or
consequential damages, losses or expenses arising in connection with the data presented by the Edelweiss through this
presentation.
18 Edelweiss Securities Limited
Consumer Goods
Access the entire repository of Edelweiss Research on www.edelresearch.com
Disclaimer for U.S. Persons
This research report is a product of Edelweiss Securities Limited, which is the employer of the research analyst(s) who has
prepared the research report. The research analyst(s) preparing the research report is/are resident outside the United States
(U.S.) and are not associated persons of any U.S. regulated broker-dealer and therefore the analyst(s) is/are not subject to
supervision by a U.S. broker-dealer, and is/are not required to satisfy the regulatory licensing requirements of FINRA or required
to otherwise comply with U.S. rules or regulations regarding, among other things, communications with a subject company, public
appearances and trading securities held by a research analyst account.
This report is intended for distribution by Edelweiss Securities Limited only to "Major Institutional Investors" as defined by Rule
15a-6(b)(4) of the U.S. Securities and Exchange Act, 1934 (the Exchange Act) and interpretations thereof by U.S. Securities and
Exchange Commission (SEC) in reliance on Rule 15a 6(a)(2). If the recipient of this report is not a Major Institutional Investor as
specified above, then it should not act upon this report and return the same to the sender. Further, this report may not be copied,
duplicated and/or transmitted onward to any U.S. person, which is not the Major Institutional Investor.
In reliance on the exemption from registration provided by Rule 15a-6 of the Exchange Act and interpretations thereof by the SEC
in order to conduct certain business with Major Institutional Investors, Edelweiss Securities Limited has entered into an
agreement with a U.S. registered broker-dealer, Enclave Capital, LLC ("Enclave").
Transactions in securities discussed in this research report should be effected through Enclave Capital, LLC.
Disclaimer for U.K. Persons
The contents of this research report have not been approved by an authorised person within the meaning of the Financial
Services and Markets Act 2000 ("FSMA").
In the United Kingdom, this research report is being distributed only to and is directed only at (a) persons who have professional
experience in matters relating to investments falling within Article 19(5) of the FSMA (Financial Promotion) Order 2005 (the
“Order”); (b) persons falling within Article 49(2)(a) to (d) of the Order (including high net worth companies and unincorporated
associations); and (c) any other persons to whom it may otherwise lawfully be communicated (all such persons together being
referred to as “relevant persons”).
This research report must not be acted on or relied on by persons who are not relevant persons. Any investment or investment
activity to which this research report relates is available only to relevant persons and will be engaged in only with relevant
persons. Any person who is not a relevant person should not act or rely on this research report or any of its contents. This
research report must not be distributed, published, reproduced or disclosed (in whole or in part) by recipients to any other
person.
Disclaimer for Canadian Persons
This research report is a product of Edelweiss Securities Limited ("ESL"), which is the employer of the research analysts who have
prepared the research report. The research analysts preparing the research report are resident outside the Canada and are not
associated persons of any Canadian registered adviser and/or dealer and, therefore, the analysts are not subject to supervision by
a Canadian registered adviser and/or dealer, and are not required to satisfy the regulatory licensing requirements of the Ontario
Securities Commission, other Canadian provincial securities regulators, the Investment Industry Regulatory Organization of
Canada and are not required to otherwise comply with Canadian rules or regulations regarding, among other things, the research
analysts' business or relationship with a subject company or trading of securities by a research analyst.
This report is intended for distribution by ESL only to "Permitted Clients" (as defined in National Instrument 31-103 ("NI 31-103"))
who are resident in the Province of Ontario, Canada (an "Ontario Permitted Client"). If the recipient of this report is not an
Ontario Permitted Client, as specified above, then the recipient should not act upon this report and should return the report to
the sender. Further, this report may not be copied, duplicated and/or transmitted onward to any Canadian person.
ESL is relying on an exemption from the adviser and/or dealer registration requirements under NI 31-103 available to certain
international advisers and/or dealers. Please be advised that (i) ESL is not registered in the Province of Ontario to trade in
securities nor is it registered in the Province of Ontario to provide advice with respect to securities; (ii) ESL's head office or
principal place of business is located in India; (iii) all or substantially all of ESL's assets may be situated outside of Canada; (iv)
there may be difficulty enforcing legal rights against ESL because of the above; and (v) the name and address of the ESL's agent for
service of process in the Province of Ontario is: Bamac Services Inc., 181 Bay Street, Suite 2100, Toronto, Ontario M5J 2T3 Canada.
Copyright 2009 Edelweiss Research (Edelweiss Securities Ltd). All rights reserved