hioki 3169-21 power demand analyzer - transcat · 2 the ultimate in clamp-on power meters! range...
TRANSCRIPT

Power Measuring Instruments
9667FLEXIBLE CLAMP
ON SENSOR
MAX. AC 5000A
CLAMP ON POWER HiTESTER
Measures power lines ofup to 254 mm in diameter
Offering a new approach to energy-related measurement such as energy conservation, ISO14001 testing, equipment diagnosis, and harmonics measurement.
The photo shows the 3169-21 combined with the 9661 and 9669 CLAMP ON
SENSORS (optional) for measuring two systems.
The 3169-20/21 can also be used in combination with CLAMP ON SENSORS (optional)
rated up to 5000 A.
The 3169-20 and 3169-21 are CLAMP ON POWER HiTESTERs that allow measurement ofsingle-phase to three-phase 4-wire circuits with a single unit. In addition to measuring standardparameters such as voltage, current, power, power factor, and integrated values, these clamp-on powermeters can simultaneously perform demand measurements required for carrying out powermanagement and energy-saving measures, as well as harmonic measurements. The two new powermeters also feature PC card data storage, and come equipped with an RS-232C interface for PCcommunications. Further, with greater data processing speeds, it is possible to measure the power ofjust a few cycles, enabling more detailed and effective energy-saving measures for equipment. The3169-20 and 3169-21 are ideal for users who want to achieve close control over energy-savingmanagement activities and measures.
Measure up to two 3-phase, 3-wire systems (displaysvoltage and current for three lines)Measure up to four single-phase,2-wire systems
0.5 A to 5000 A range
Compact and light weight
PC card data storage Power recording for individual waveforms Simultaneous recording of demand values and
harmonics 9625 POWER MEASUREMENT SUPPORT SOFTWARE
3169-20, 3169-21

Measure power lines of up to four systems(with a common voltage)
One single unit can measure four circuits (single-phase 2-wire), twocircuits (3-phase, 3-wire), or a one circuit (3-phase, 4-wire)system.
A wide range of measurement functions
The 3169-20/21 can simultaneously measure voltage, current, power(active, reactive, and apparent), integrated power, power factor, andfrequency. Further, when using 3-phase, 3-wire (3P3W2M) mode, youcan display the voltage and current for all three lines by measuring justtwo of them. When using the 3-phase, 4-wire (3P4W4I) mode, neutralline current can be displayed using 4 current measurement.
Housed in a compact A5 body size
The 3169-20 and 3169-21 feature a compact design that makes themportable and easy to use in tight spaces, and are approximately 30%more compact than the 3166 CLAMP ON POWER HiTESTER.
Multi-language Compatibility
Select from nine languages, including Japanese and English.
Detect incorrect connection using vectordiagrams
Use the vector display on the connection confirmation screen to checkthe phase, whether a connection is loose, or whether the clamp-onsensor connection has been reversed during VT/CT terminalmeasurement.
High-speed D/A output
The 3169-21 comes equipped with 4-channel high-speed D/A output toenable analog output of RMS values for individual waveforms.
PC Card compatible plus internal hard drivefor extra memory
Store valuable measurement data in convenient PC cards. The internalmemory (1 MB) supports measurement over extended periods and detailedmeasurement parameters.
Ideal for power and harmonics management
The power meters come equipped with a harmonics measurementfunction that supports measurement of 3-phase power lines. They canalso perform simultaneous measurement of harmonics and demandvalues, enabling both power and harmonics management.
Equipped with ranges from 0.5 A to 5000 A
The power meters support seven types of clamp-on current sensors toenable measurement for a variety of items, from CT terminals to largecurrent and thick power lines.
Polarity display and measurement using thereactive power measurement method
The units come equipped with a polarity display for checkingLAG/LEAD when measuring power factor or reactive power. Further,you can select the reactive power measurement method, or display thephase factors for RMS values and power comparison.
3169-21 CLAMP ON POWER HiTESTER(Shown with D/A output)
Offering a new measurementmethod for energy saving activities
9438-03 VOLTAGE CORD (4 provided)
All in a compact A5-size unit
Simultaneous measurement of two 3-phase,3-wire systems.Select the clamp-on sensor type most suitedto your measurement needs for eachindividual circuit.
Simultaneous recording ofa variety of signal andenergy-saving data.
Allows high-speed data transfer toa PC card for each waveform or atintervals of 0.1, 0.2, or 0.5 second.
Example of use in combination with four 9661 CLAMP ON SENSOR (optional)
Features
Supports high-speed data storage fromindividual waveforms
When using the standard mode to perform integrated power measurement,you can store data in intervals starting from one second, and whensimultaneously measuring integration and harmonics, in intervals startingfrom one minute. When in the fast mode, you can store RMS data forindividual waveforms.
9661 CLAMP ON SENSOR (500 A AC)9669 CLAMP ON SENSOR (1000 A AC) (optional)
1

2
The ultimate in clamp-on power meters!
Range Configuration Table
Note 1:The range configuration table displays the full-scale display values for each measurement range. Note 2:In the table, "unit W" has been replaced with "VA" or "var" for the apparent-power and reactive power measurement ranges. Note 3:Voltage and current input values 0.4% or less than the measurement range are displayed as "zero". When either the voltage or currentfor the power line is zero, the power value is displayed as zero. Note 4:You can display measurement values up to 130% of each measurement range.
Current (CLAMP ON SENSOR)input terminal
Voltage (9438-03 VOLTAGE CORD)input terminalSleek Design and Engineering
The photo shows the 3169-21 withD/A output.
D/A output terminal
External I/O terminal
RS-232C port
Contrast adjustvolume
Power switch
Power inlet
PC card slot
External I/O terminal pin placement
Use the 9440 CONNECTION CABLE to connect to external devices.
Key lock switch
9669 CLAMP ON SENSOR
150.00V
Single-phase 2-wire 15.000kW 30.000kW 150.00kWSingle-phase 3-wire
30.000kW 60.000kW 300.00kW
300.00V
Three-phase 3-wireThree-phase 4-wire 45.000kW 90.000kW 450.00kWSingle-phase 2-wire 30.000kW 60.000kW 300.00kWSingle-phase 3-wire
60.000kW 120.00kW 600.00kWThree-phase 3-wireThree-phase 4-wire 90.000kW 180.00kW 900.00kW
600.00V
Single-phase 2-wire 60.000kW 120.00kW 600.00kWSingle-phase 3-wire
120.00kW 240.00kW 1.2000MWThree-phase 3-wireThree-phase 4-wire 180.00kW 360.00kW 1.8000MW
100.00 A 200.00 A 1.0000kA9667 FLEXIBLE CLAMP ON SENSOR
500.00 A 5.0000kA
150.00V
Single-phase 2-wire 75.000kW 750.00kWSingle-phase 3-wire
150.00kW 1.5000MW
300.00V
Three-phase 3-wireThree-phase 4-wire 225.00kW 2.2500MWSingle-phase 2-wire 150.00kW 1.5000MWSingle-phase 3-wire
300.00kW 3.0000MWThree-phase 3-wireThree-phase 4-wire 450.00kW 4.5000MW
600.00V
Single-phase 2-wire 300.00kW 3.0000MWSingle-phase 3-wire
600.00kW 6.0000MWThree-phase 3-wireThree-phase 4-wire 900.00kW 9.0000MW
Pin Signal name1 Start/stop input
2 Free
3 Status output
Pin Signal name1 D/A output ch1
2 D/A output ch2
3 D/A output ch3
4 D/A output ch4
5 to 8 GND
Use the 9441 CONNECTION CABLE to connectto external devices. (Output resistance: 100 Ω)
D/A output terminal pin placement
Voltage ConnectionCurrent
Voltage ConnectionCurrent
9695-02 CLAMP ON SENSOR(CAT III 300V)
9661 CLAMP ON SENSOR(5A, 10A, 50A, 100A, 500A)
150.00V
Single-phase 2-wire 75.000 W 150.00 W 750.00 W 1.5000kW 7.5000kW 15.000kW 75.000kW
Single-phase 2-wire 150.00 W 300.00 W 1.5000kW 3.0000kW 15.000kW 30.000kW 150.00kW
600.00V
Single-phase 2-wire 300.00 W 600.00 W 3.0000kW 6.0000kW 30.000kW 60.000kW 300.00kW
Three-phase 3-wire
(CAT III 300V) (500mA, 1A, 5A)9694 CLAMP ON SENSOR
(CAT III 300V) (5A, 10A, 50A, 100A)9660, 9695-03 CLAMP ON SENSOR
500.00mA 1.0000A 5.0000A 10.000A 50.000A 100.00A 500.00A
Single-phase 3-wire150.00 W 300.00 W 1.5000kW 3.0000kW 15.000kW 30.000kW 150.00kW
Three-phase 4-wire 225.00 W 450.00 W 2.2500kW 4.5000kW 22.500kW 45.000kW 225.00kW
Three-phase 3-wire
Three-phase 3-wire
Single-phase 3-wire300.00 W 600.00 W 3.0000kW 6.0000kW 30.000kW 60.000kW 300.00kW
Three-phase 4-wire 450.00 W 900.00 W 4.5000kW 9.0000kW 45.000kW 90.000kW 450.00kW
Single-phase 3-wire600.00 W 1.2000kW 6.0000kW 12.000kW 60.000kW 120.00kW 600.00kW
Three-phase 4-wire 900.00 W 1.8000kW 9.0000kW 18.000kW 90.000kW 180.00kW 900.00kW
300.00V
Pin
4
5
Signal nameData storage input
GND
(500mA, 1A, 5A, 10A, 50A)Current
Voltage Connection

The addition of a vector display for viewing the connection statuscompletes the preparation required for measurement.
When measurement accuracy is crucial
3
Promises reliable measurement for power demandrequirements! Select from a variety of data, including detailed and harmonics data for multiple circuits
Measure hidden power waste through secure connections, simple measurementmethods, and detailed data capture.
Using the 9667 FLEXIBLE CLAMP ON SENSOR, you can measurepower lines that are up to 5000 A AC and up to 245 mm in diameter.
Having trouble clamping onto thick power lines?
Using the external I/O function, you can obtain even more detailedmeasurements for energy conservation.In addition to measurement start/stop control through external input, you can use this function
to output the measurement start/stop signal for the 3169-20/21. Simultaneous recording of a
variety of signals is also possible for equipment when using multiple devices to perform start
control and multi-channel recording.
Measure another device simultaneously
3169-20MEMORYHiCORDER3169-20
Master controlSynchronouswith master
Simultaneousoperation
Simultaneouscontrol for signalsfrom equipment
The basic settings are constantly displayed, allowingyou to measure with confidence.During measurement, in addition to displaying the voltage and current ranges, and VT (PT)and CT ratios for each system, the unit can also display items such as the measurementinterval. Because the basic settings are constantly visible, you can be confident of obtainingthe correct measurement results.
The 9667 FLEXIBLE CLAMP ON SENSOR ability to measure power lines with good phase
characteristics carrying up to 5000 A AC and measuring up to 254 mm in diameter allows you
to measure the power for large current lines that were previously difficult to measure, such as
trunk lines at factories.
A single unit can measure two three-phase, 3-wire systems. Further,you can make individual clamp-on sensor and current rangesettings for each system.
Also, in addition to performing simultaneous measurement for up to four systems (single-
phase, 2-wire) with a common voltage, you can set the current range individually for each
system. Setting the most suitable current range for both large and small loads allows you to
acquire more accurate measurements.
To measure multiple systems simultaneously
φ 254mm (10.0")
Range: AC 500A/5000A Power supply:4 × AAA alkaline batteries (LR03)(continuous use:one week or longer)or the 9445-02/03 AC adapter
Use a single unit to simultaneously measure data for power andharmonics.All acquired data can be saved onto a PC card.
Simultaneous power and harmonics management
Power data (including demand data) and harmonics data can be simultaneously saved onto a
PC card or in the unit's internal memory. Further, data for all of the systems being measured
can be saved when measuring multiple circuits. Each of these two new unit's offers a
management system for power and harmonic quality.
Have you ever experienced incorrect measurement results?The most common cause of incorrect data is a faulty connection. With the 3169-20/21 you canuse the vector display to check the phase, whether a connection is loose, or whether the clamp-on sensor connection has been reversed.Also, you are assured of proper connection when measuring the VT (PT)/CT terminals even ifyou cannot see the line you are measuring.
Checking the connection onthe vector display
Accurate and reliableresults
By using continuous processing to measure individual waveforms,you can accurately measure data in a relatively short amount of time.Use the desired measurement method to continuously measure the voltage, current, and power
for individual waveforms, enabling you to obtain accurate data in one second or less. Further,
you can record the maximum, minimum and average values.
Capture facility data quickly
Measurement for up to foursingle-phase, 2-wire systems
Measurement for up to twothree-phase, 3-wire systems
Use the 9669 sensor tomeasure two systems
Use the 9661 sensorto measure a singlesystem
4
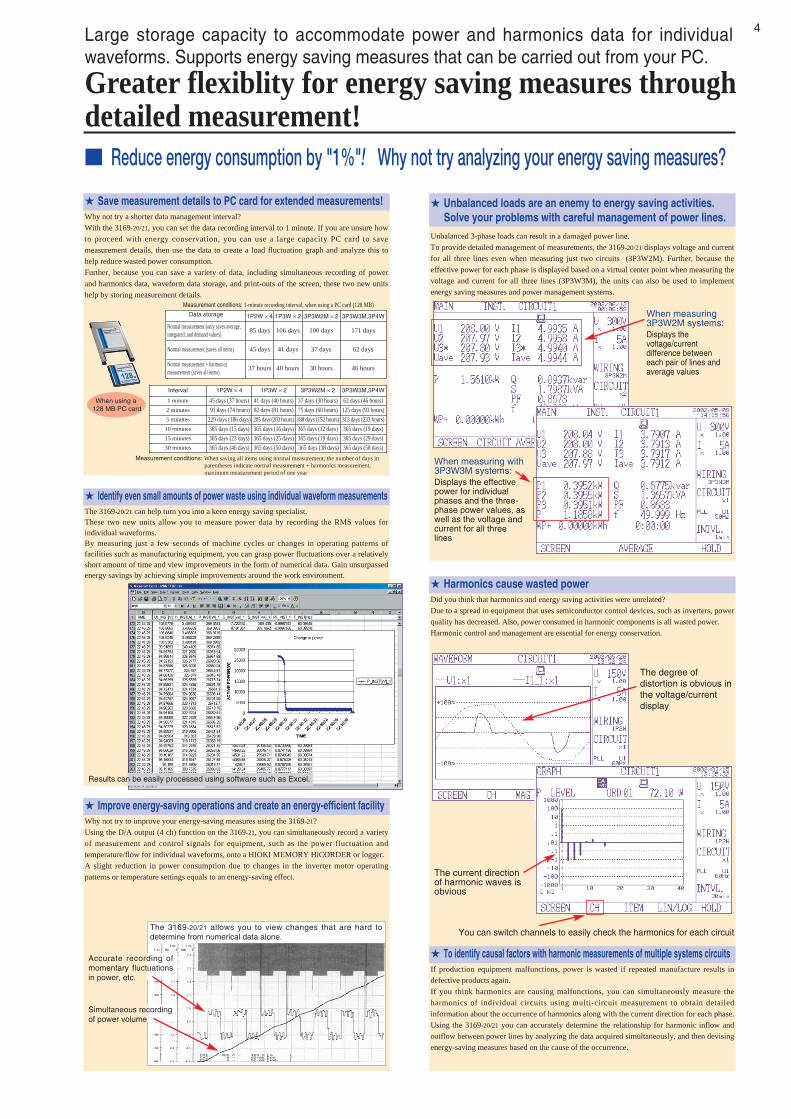
Greater flexiblity for energy saving measures throughdetailed measurement! Reduce energy consumption by "1%"! Why not try analyzing your energy saving measures?
Large storage capacity to accommodate power and harmonics data for individualwaveforms. Supports energy saving measures that can be carried out from your PC.
Harmonics cause wasted powerDid you think that harmonics and energy saving activities were unrelated?
Due to a spread in equipment that uses semiconductor control devices, such as inverters, power
quality has decreased. Also, power consumed in harmonic components is all wasted power.
Harmonic control and management are essential for energy conservation.
Save measurement details to PC card for extended measurements!
To identify causal factors with harmonic measurements of multiple systems circuitsIf production equipment malfunctions, power is wasted if repeated manufacture results in
defective products again.
If you think harmonics are causing malfunctions, you can simultaneously measure the
harmonics of individual circuits using multi-circuit measurement to obtain detailed
information about the occurrence of harmonics along with the current direction for each phase.
Using the 3169-20/21 you can accurately determine the relationship for harmonic inflow and
outflow between power lines by analyzing the data acquired simultaneously, and then devising
energy-saving measures based on the cause of the occurrence.
Improve energy-saving operations and create an energy-efficient facilityWhy not try to improve your energy-saving measures using the 3169-21?
Using the D/A output (4 ch) function on the 3169-21, you can simultaneously record a variety
of measurement and control signals for equipment, such as the power fluctuation and
temperature/flow for individual waveforms, onto a HIOKI MEMORY HiCORDER or logger.
A slight reduction in power consumption due to changes in the inverter motor operating
patterns or temperature settings equals to an energy-saving effect.
Unbalanced 3-phase loads can result in a damaged power line.
To provide detailed management of measurements, the 3169-20/21 displays voltage and current
for all three lines even when measuring just two circuits (3P3W2M). Further, because the
effective power for each phase is displayed based on a virtual center point when measuring the
voltage and current for all three lines (3P3W3M), the units can also be used to implement
energy saving measures and power management systems.
When measuring3P3W2M systems:Displays thevoltage/currentdifference betweeneach pair of lines andaverage values
Identify even small amounts of power waste using individual waveform measurementsThe 3169-20/21 can help turn you into a keen energy saving specialist.These two new units allow you to measure power data by recording the RMS values forindividual waveforms.By measuring just a few seconds of machine cycles or changes in operating patterns offacilities such as manufacturing equipment, you can grasp power fluctuations over a relativelyshort amount of time and view improvements in the form of numerical data. Gain unsurpassedenergy savings by achieving simple improvements around the work environment.
Why not try a shorter data management interval?
With the 3169-20/21, you can set the data recording interval to 1 minute. If you are unsure how
to proceed with energy conservation, you can use a large capacity PC card to save
measurement details, then use the data to create a load fluctuation graph and analyze this to
help reduce wasted power consumption.
Further, because you can save a variety of data, including simultaneous recording of power
and harmonics data, waveform data storage, and print-outs of the screen, these two new units
help by storing measurement details.
When measuring with3P3W3M systems:Displays the effectivepower for individualphases and the three-phase power values, aswell as the voltage andcurrent for all threelines
The current directionof harmonic waves isobvious
The degree ofdistortion is obvious inthe voltage/currentdisplay
Data storage 1P2W × 4 1P3W × 2 3P3W2M × 2 3P3W3M,3P4W
Normal measurement (only saves average, integrated, and demand values)
85 days 106 days 100 days 171 days
Normal measurement (saves all items) 45 days 41 days 37 days 62 days
Normal measurement + harmonics measurement (saves all items)
37 hours 40 hours 30 hours 46 hours
Measurement conditions: 1-minute recording interval, when using a PC card (128 MB)
Interval 1P2W × 4 1P3W × 2 3P3W2M × 2 3P3W3M,3P4W
1 minute 45 days (37 hours) 41 days (40 hours) 37 days (30 hours) 62 days (46 hours)
5 minutes 229 days (186 days) 205 days (203 hours) 188 days (152 hours) 313 days (233 hours)
15 minutes 365 days (23 days) 365 days (25 days) 365 days (19 days) 365 days (29 days)
2 minutes 91 days (74 hours) 82 days (81 hours) 75 days (60 hours) 125 days (93 hours)
10 minutes 365 days (15 days) 365 days (16 days) 365 days (12 days) 365 days (19 days)
30 minutes 365 days (46 days) 365 days (50 days) 365 days (38 days) 365 days (58 days)
Measurement conditions: When saving all items using normal measurement, the number of days in parentheses indicate normal measurement + harmonics measurement, maximum measurement period of one year
Unbalanced loads are an enemy to energy saving activities.Solve your problems with careful management of power lines.
You can switch channels to easily check the harmonics for each circuit
Accurate recording ofmomentary fluctuationsin power, etc.
Simultaneous recordingof power volume
Results can be easily processed using software such as Excel.
When using a128 MB PC card
The 3169-20/21 allows you to view changes that are hard todetermine from numerical data alone.

Easily display and print various screens such as graphs and spreadsheet tables
5
9625 POWER MEASUREMENT SUPPORT SOFTWARE
Time Series Graph Display FunctionMeasurement data can be displayed as a time series graph.Demand data measured in different series can be overlaid onthe display. Summary Display FunctionMeasurement data can be displayed directly in table form.
Features Daily, Weekly and Monthly Report Display
FunctionDaily, weekly and monthly reports of demand data can bedisplayed. Harmonic Analysis FunctionDisplay harmonic measurement data as a graph, list orwaveform. (Also compatible with the harmonic measurementdata captured by Model 3166.) Print FunctionEach screen can be printed.
The Model 9625 POWER MEASUREMENT SUPPORT SOFTWARE application provides easy graphical processingon a computer of measurement data saved on the Models 3169-20/21 and 3166 CLAMP ON POWER HiTESTERs.
Power Data & Harmonic Data
The 9625 handles both power andharmonic measurement datasimultaneously.
Power Data & Harmonic Data
Step 1. Load measurement dataLoad up to 16 data sets from the 3169-20/21 or 3166 at once. Measurednumerical values and waveform data are recognized and displayedautomatically.1. Loading and deleting data, and changing data names, can be done easily.2. Multiple sets of measurement data can be loaded and managed in a single
file.
Step 2. Select the display (screen) typeSelect from time series graph, summary, daily, weekly ormonthly report, harmonic list, harmonic graph, harmonicwaveform or settings.
Step 3. Select display items (two-axis display is possible)1. Select the data items (up to 16) to display.
For graph displays, the type of graph (line or bar) can beselected.
2. Enter details for data display. (data item names, levels, etc.)
Step 4. Set the start/stop times and data intervalto be displayed1. Set the data period to display. (start/stop time and data interval)
• The displayed period can be easily changed by scrolling.
Graphically process measurement data from Model 3169-20/21easily on a PC!
3166
3169-20/21

6
The displayed graph can be set to suit particular start/stop timesand data intervals. Harmonic time series graphs can be displayed.
Convenient Functions(1) The horizontal (time) axis can be easily scrolled to show
the desired range.(2) Upper and lower limits (measurement values) of the
vertical axis can be easily set and changed.* Graph type (line, bar or stacked bar), line type (such as solid or dashed),
color and details of upper and lower numerical values can be set.
(3) Any desired numerical data value on a graph canbe confirmed and displayed by cursormovement.
(4) The display can be switched between 2D and 3Dgraphs.
Summary Displays a summary of the data values between specified
start/stop times, at the specified data interval.Convenient Functions(1) In addition to measurement values within the period being
displayed, the summary shows period, maximum,minimum and average values.
(2) Measurement data names and measurement units can beedited in the summary.
Daily, Weekly or Monthly Report Display Displays a summary covering the total values in daily,
weekly or monthly reports.Convenient Functions(1) The time axis for each total scrolls to easily change the
totalized period.(2) The total time range of measurement
data can be totalized in up to foursections per time period.
Harmonic Time Series Display While displaying a time series graph, select the harmonic
item for the vertical axis to display a time series graph ofharmonics.
Convenient Functions(1) Up to 32 graphs can be displayed simultaneously using
2-axes display.For one circuit measurement, up to 32 orders can begraphed. Using multiple instruments, time series ofharmonics can be easily compared.
(2) Any desired chronological detail can be easily confirmedusing the cursors on the graph.
Harmonic Display Function Harmonic data measured by the 3169-20/21 and 3166 can be displayed in various ways
Harmonic List Display Displays harmonic data for the selected
display item as a list.
Harmonic Graph Display Displays harmonic data for the selected
display item as a bar graph.
Harmonic Waveform Display Displays the voltage and current
waveforms upon which harmonicdata is based.
Summary Display Function
Time Series Graph Display Function (two-axes display possible)
Upper/LowerLimit SettingSlider
Cursor Value
View the power graph to confirm trends in harmonics View the waveforms to confirm distortion conditions
Simultaneously display multipleorders to confirm changes inharmonics!Simultaneously display datafrom multiple instruments toconfirm concurrent series ofharmonics!
View the list to confirm details

3169-20/21
: 3169-20, 3169-21 and 3166(CLAMP ON POWER HiTESTERs)
: Computer: PC-AT compatible (DOS/V machine)CPU: Pentium 200 MHz or higherMemory: 128 MB or more (recommended)Hard disk: 128 MB or more free spaceDisplay: XGA (1024×768) or higherDisc device: CD-ROM drive (for installation)Operating system: Windows95/98, NT4.0, 2000, Me,
XP (English edition) Internet Explorer 4.0 or later
Supported instrumentmodelsOperating environment
7
General Specifications
[Data Load/Save Functions]
: Up to 528 MB per data set (total composite data up to 1.5 GB)
: Voltage, current, active power, reactive power, apparent power, power factor, frequency, Integrated value(active power, reactive power), demand, harmonic (level, content ratio, phase angle, total value, THD)
: The display position (upper and lower display limits) of the vertical (Y) axis of a graph can be set by scroll bar or by specifying values.
: Select each cycle, or 0.1, 0.2, 0.5, 1, 2, 5, 10, 15 or 30 sec.; 1, 2, 5, 10, 15 or 30 min.; or 1, 2, 3, 4, 6, 8 or 12 h; or 1 day
: An optional analysis period can be specified from the overall measurement data period
(1) Analysis start date and time (YMD, HMS) is specified numerically(2) Analysis stop date and time (YMD, HMS) is specified numericallyDisplay of measurement data period (measurement start and stop date and time)
Maximum data capacity
[Time Series GraphDisplay Function]Graph display item
Y-axis upper/lowerlimit settingInterval setting
Display period rangesetting
: Display set standard value: Line, bar, 2-axes and 3-dimensional: Line type and display color can be set for each data set,
and marker display is possible: Up to 16 types of data series (demand value, demand quantity )
can be displayed in an overlay graph
: Measurement values can be displayed by the cursor: Engineering units (m, k, M, G, etc.) can be selected
Reference value settingGraph type selectionGraph line type & colorsettingStacked bar graphdisplay
Cursor measurementData display units setting
Save data File extension Data format
9625 Combined file DAT Binary
9625 Specifications
Functional Specifications
When you select a data name to be load, the measuringinstrument model and setting conditions at measurement timeare displayed.Measurement data and measurement conditions can be managedat the same time.
Reports and screen copies of the displayed screen can be easily printed.Convenient Functions(1) Printing results can be confirmed by print preview.(2) When creating a report, screen data can be copied and pasted into a
commercial word processor program.
Print Function Settings Display Function
Preview printing to confirm print resultsbefore printing
: One CD-R discSupplied Media
Produce daily, weekly or monthly reportsby one-touch report printing
Graph copying is also a one-touch operation
Loading data File extension Data format Data contents
Data file CSV CSV Instantaneous value, average value, maximum value, minimum value,integrated value, demand value, harmonic
Waveform data file WUI Binary Instantaneous waveform
Short-interval data file BIN Binary Instantaneous values
3166
Integrated measurement data file ITG CSV Instantaneous value, integrated value
Demand measurement data file DEM CSV Instantaneous value, maximum value, minimum value, demand value
Harmonic measurement data file HRM CSV Instantaneous value, average value, maximum value
Waveform data file WUI Binary Instantaneous waveform
Setting file SET –
9625 Combined file DAT Binary

8
: Select the items to display in the summary: Displays a report for the specified daily weekly or monthly period
: Calculates the load factor and demand factor as a daily, weekly or monthly report, and displays the results
: Specify up to four time ranges and totalize data for each time range independently
: Displays waveform data for a specified time: Displays a list of harmonic data for a specified time: Display a bar graph of harmonic data for a specified time: Displays the value at the cursor with waveform and graph displays
: Displays a list of the setting conditionsLoads setting conditions from a data file (3169-20/21)Loads setting conditions from a settings file (3166)
[Summary DisplayFunction]Display item selectionDaily, weekly and monthlyreport displayLoad factor calculationdisplayIndependent time rangetotalizing
[Harmonic DisplayFunction]Waveform displayList displayGraph displayCursor measurement
[Setting DisplayFunction]Setting display
: Each display can be copied to the clipboard
: Previews and prints the contents displayed on a timeseries graph
: Previews and prints the contents displayed in a summary
: Previews and prints the contents displayed in a harmonic spreadsheet
: Previews and prints the contents displayed in the settings display
: Text comments can be entered in any printout: Any color or monochrome printing supported by the operating system
: English
[Copy Function]Copies to the clipboard
[Print Function]Printing a displayed timeseries graphPrinting a displayedsummaryPrinting a harmonicdisplayPrinting the settingsdisplayComment entryPrinting support
[Display Language]Language
3169-20/21 Specifications
: Single-phase 2-wire, single-phase 3-wire, three-phase 3-wire, and three-phase 4-wire systems (50/60 Hz)
:Single-phase: 1P2W. . . . . . . . . . . . . . . . . . . . . . . . . . . . . . . . . 4 systems
1P3W. . . . . . . . . . . . . . . . . . . . . . . . . . . . . . . . . 2 systemsThree-phase: 3P3W2M (measures the voltage and current for two lines) . . . . . 2 systems
3P3W3M (measures the voltage and current for all three lines) . . . 1 system3P4W (measures the voltage and current for three lines). . . . . . . . 1 system3P4W4I . . . . . . . . . . . . . . . . . . . . . . . . . . . . . . 1 system
(measures the voltage for three lines and the current for four lines)
: Voltage, current, active power, reactive power, apparent power, power factor, integrated value, frequency, harmonics
: For the voltage, current, and active power ranges, see the range configuration tables on page 2.
: Simultaneous digital sampling of voltage and current, PLL synchronization or a fixed clock (50/60 Hz)
: Voltage: Isolated inputCurrent: Isolated input using a clamp-on sensor
: Within 5 to 110% of the range: Voltage and current: Within 0.4 to 130% of the range
(zero is suppressed for less than 0.4%)
Power: Within 0 to 130% of the range (zero is suppressed when the voltage or current is zero)
Harmonic level: Within 0 to 130% of the range: 5.7-inch LCD (320 × 240 dots), with backlight: Manual (the current range can be set for each system): Approx. every 0.5 seconds
(except when using a PC card while accessing the internal memory, or when performing RS-232C communications)
: Voltage: 2.0 MΩ ± 10% (differential input)Current: 200 kΩ ± 10%
: Voltage input: 780 Vrms AC, peak value: 1103 VCurrent input: 1.7 Vrms AC, peak value: 2.4 V
: Voltage input terminals: 600 Vrms AC (50/60 Hz): Voltage: Less than 2 (for full-scale input)
Current: Less than 4 (for full-scale input. However, less than 2 for the 500 A, 1 kA, and 5 kA ranges)
: 1MB
Measurement line type
Number of systemsthat can be measured(for systems that sharethe same voltage)
Item
Measurement range
Measurement method
Input methods
Effective measurement areaTotal display area
DisplayRange switching methodDisplay update rate
Input resistance(50/60 Hz)Maximum input
Maximum rated voltage to earthCrest factor
Internal memory capacity
Instantaneous valuedisplay
Average value display
Maximum/minimumvalue display
Integrate display
Demand volume display(Integrated value withinthe specified interval)
Demand value display(average value withinthe specified interval)Maximum demand value display(average value within themaximum specified interval)Harmonics list
Harmonics graph
Waveform display
Measurement valueenlargement display
: Voltage, current, active power, reactive power, apparent power,power factor, frequency, average voltage, average current, (averagevalues are for each system)
: Voltage, current, active power, reactive power, apparent power,power factor, frequency, average voltage, average current* The average value from the beginning of time series measurement until the present.
: Voltage, current, active power, reactive power, apparent power,power factor, frequency* The maximum/minimum value from the beginning of time series measurement until the present.
: Integrated valueActive power (consumption/regeneration)Reactive power (lag/lead)* The total integrated value from the beginning of time series measurement.
: Integrated valueActive power volume (consumption/regeneration) Reactive power volume (lag/lead)* The integrated value within each specified interval (latest value).
: Active power (consumption), reactive power (lag), power factor* The demand value within each specified interval (previous value).
: The maximum demand value since the beginning of time seriesmeasurement and the time and date it occurred.
: List of the items measured for the specified harmonic (numericalvalue).(including the total value and total harmonic distortion factor (THD-F/THD-R))
: Bar graph or vector diagram of the items measured for the specifiedharmonic.(cursor measurement, magnification update, with a linear/LOG axis selection function)
: Voltage and current waveforms (with a magnification updatefunction)
: Select and enlarge up to 5 items from the instantaneous valuedisplay.
: True RMS method: Measurement of three voltage lines and 3 or 4 current lines is possible
when using three-phase 3-wire and three-phase 4-wire systems
: For three-phase 3-wire (the 3P3W3M setting), refer to the display forphase power values.
: For consumption: no symbol, for regeneration: "-"
: ON: Measures the reactive power directly using the reactive powermeasurement method
OFF: Calculates the reactive power from the measurement values forvoltage, current, and active power
: For lag phase (LAG : current is slower than voltage): no symbolFor lead phase (LEAD: current is faster than voltage) : "-"(Reactive power measurement method "ON")
: No polarity
: -1.0000 (lead) to 0.0000 to +1.0000 (lag): For lag phase (LAG: current is slower than voltage) :no symbol
For lead phase (LEAD: current is faster than voltage) : "-"
: 40.000 to 70.000 Hz: Within 10 to 110% of the range (for sine wave input)
: Voltage U1
[Voltage/current measurement]Measurement methodMeasurement display
[Active power measurement]Measurement display
Polarity display
[Reactive power measurement]Using the reactivepower measurementmethod
Polarity display
[Apparent power measurement]Polarity display
[Power factor measurement]Measurement rangePolarity display
[Frequency measurement]Measurement rangeInput area forguaranteed accuracyMeasurement source
Basic Specifications
: 40.000 to 70.000 Hz: Within 10 to 110% of the range (for sine wave input)
: Voltage U1
: Active power : 0.00000 mWh to 99999.9 GWh consumption-0.00000 mWh to -99999.9 GWh regeneration
Reactive power : 0.00000 mvarh to 99999.9 Gvarh lag-0.00000 mvarh to -99999.9 Gvarh lead
: Active power : Displays consumption and regeneration separatelyReactive power : Displays lag and lead separately
: Basic wave frequency: 45 to 66 HzPLL synchronization
: Up to the 40th order: A single cycle (number of data points analyzed: 128 points): Rectangular: 1/16 cycles: Harmonic level: The voltage, current, or power level for
each harmonic order: Harmonic content percentage: The voltage, current, or power
content percentage for each harmonic order: Harmonic phase angle: The voltage, current, or power phase
angle for each harmonic order: Total value: The total value for voltage, current, or
power up to the 40th harmonic order: Total harmonic distortion factor:For voltage or current
(THD-F or THD-R)
[Frequency measurement]Measurement rangeInput area forguaranteed accuracyMeasurement source
[Integrated measurement]Measurement range
Measurement display
[Harmonic measurement]Measurement rangeMeasurement methodOrder for analysisWindow widthWindow typeAnalysis rateItem for analysis
Measurement Specifications
Display Specifications
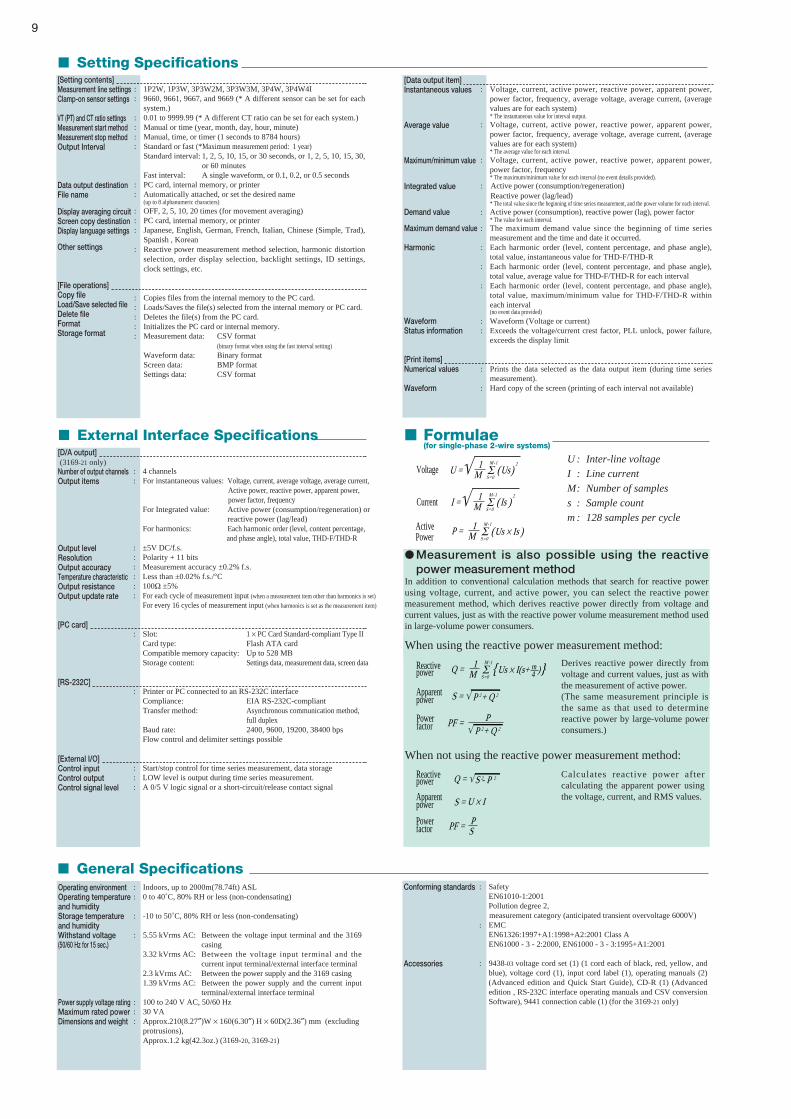
[Setting contents]Measurement line settingsClamp-on sensor settings
VT (PT) and CT ratio settingsMeasurement start methodMeasurement stop methodOutput Interval
Data output destinationFile name
Display averaging circuitScreen copy destinationDisplay language settings
Other settings
[File operations]Copy fileLoad/Save selected fileDelete fileFormatStorage format
: 1P2W, 1P3W, 3P3W2M, 3P3W3M, 3P4W, 3P4W4I: 9660, 9661, 9667, and 9669 (* A different sensor can be set for each
system.): 0.01 to 9999.99 (* A different CT ratio can be set for each system.): Manual or time (year, month, day, hour, minute): Manual, time, or timer (1 seconds to 8784 hours): Standard or fast (*Maximum measurement period: 1 year)
Standard interval: 1, 2, 5, 10, 15, or 30 seconds, or 1, 2, 5, 10, 15, 30,or 60 minutes
Fast interval: A single waveform, or 0.1, 0.2, or 0.5 seconds: PC card, internal memory, or printer: Automatically attached, or set the desired name
(up to 8 alphanumeric characters)
: OFF, 2, 5, 10, 20 times (for movement averaging): PC card, internal memory, or printer: Japanese, English, German, French, Italian, Chinese (Simple, Trad),
Spanish , Korean: Reactive power measurement method selection, harmonic distortion
selection, order display selection, backlight settings, ID settings,clock settings, etc.
: Copies files from the internal memory to the PC card.: Loads/Saves the file(s) selected from the internal memory or PC card.: Deletes the file(s) from the PC card.: Initializes the PC card or internal memory.: Measurement data: CSV format
(binary format when using the fast interval setting)
Waveform data: Binary formatScreen data: BMP formatSettings data: CSV format
9
Setting Specifications
: Voltage, current, active power, reactive power, apparent power,power factor, frequency, average voltage, average current, (averagevalues are for each system)* The instantaneous value for interval output.
: Voltage, current, active power, reactive power, apparent power,power factor, frequency, average voltage, average current, (averagevalues are for each system)* The average value for each interval.
: Voltage, current, active power, reactive power, apparent power,power factor, frequency* The maximum/minimum value for each interval (no event details provided).
: Active power (consumption/regeneration)Reactive power (lag/lead)* The total value since the beginning of time series measurement, and the power volume for each interval.
: Active power (consumption), reactive power (lag), power factor* The value for each interval.
: The maximum demand value since the beginning of time seriesmeasurement and the time and date it occurred.
: Each harmonic order (level, content percentage, and phase angle),total value, instantaneous value for THD-F/THD-R
: Each harmonic order (level, content percentage, and phase angle),total value, average value for THD-F/THD-R for each interval
: Each harmonic order (level, content percentage, and phase angle),total value, maximum/minimum value for THD-F/THD-R withineach interval(no event data provided)
: Waveform (Voltage or current): Exceeds the voltage/current crest factor, PLL unlock, power failure,
exceeds the display limit
: Prints the data selected as the data output item (during time seriesmeasurement).
: Hard copy of the screen (printing of each interval not available)
[Data output item]Instantaneous values
Average value
Maximum/minimum value
Integrated value
Demand value
Maximum demand value
Harmonic
WaveformStatus information
[Print items]Numerical values
Waveform
[D/A output](3169-21 only)
Number of output channelsOutput items
Output levelResolutionOutput accuracyTemperature characteristicOutput resistanceOutput update rate
[PC card]
[RS-232C]
[External I/O]Control inputControl outputControl signal level
: 4 channels: For instantaneous values: Voltage, current, average voltage, average current,
Active power, reactive power, apparent power, power factor, frequency
For Integrated value: Active power (consumption/regeneration) orreactive power (lag/lead)
For harmonics: Each harmonic order (level, content percentage, and phase angle), total value, THD-F/THD-R
: ±5V DC/f.s.: Polarity + 11 bits: Measurement accuracy ±0.2% f.s.: Less than ±0.02% f.s./°C: 100Ω ±5%: For each cycle of measurement input (when a measurement item other than harmonics is set)
For every 16 cycles of measurement input (when harmonics is set as the measurement item)
: Slot: 1 × PC Card Standard-compliant Type IICard type: Flash ATA cardCompatible memory capacity: Up to 528 MBStorage content: Settings data, measurement data, screen data
: Printer or PC connected to an RS-232C interfaceCompliance: EIA RS-232C-compliantTransfer method: Asynchronous communication method,
full duplexBaud rate: 2400, 9600, 19200, 38400 bpsFlow control and delimiter settings possible
: Start/stop control for time series measurement, data storage: LOW level is output during time series measurement.: A 0/5 V logic signal or a short-circuit/release contact signal
Conforming standards
Accessories
: SafetyEN61010-1:2001Pollution degree 2, measurement category (anticipated transient overvoltage 6000V)
: EMCEN61326:1997+A1:1998+A2:2001 Class AEN61000 - 3 - 2:2000, EN61000 - 3 - 3:1995+A1:2001
: 9438-03 voltage cord set (1) (1 cord each of black, red, yellow, andblue), voltage cord (1), input cord label (1), operating manuals (2)(Advanced edition and Quick Start Guide), CD-R (1) (Advancededition , RS-232C interface operating manuals and CSV conversionSoftware), 9441 connection cable (1) (for the 3169-21 only)
When using the reactive power measurement method:
Current I =√ 1M ∑
M-1
S=0 ( Is )
2
Voltage U =√ 1M ∑
M-1
S=0 (Us)
2
P =Active Power
1M ∑
M-1
S=0 (Us × Is )
U : Inter-line voltageI : Line currentM: Number of sampless : Sample countm : 128 samples per cycle
Apparent power P + QS = √ 2 2
Reactive power Q = 1
M ∑ M-1
S=0 Us × I(s+ ) 4
m
PF =Power factor
P P + Q √ 2 2
U × IS =Apparent power
Reactive power S - PQ = √ 2 2
PF =Power factor
PS
When not using the reactive power measurement method:
Derives reactive power directly fromvoltage and current values, just as withthe measurement of active power. (The same measurement principle isthe same as that used to determinereactive power by large-volume powerconsumers.)
Calculates reactive power aftercalculating the apparent power usingthe voltage, current, and RMS values.
Measurement is also possible using the reactivepower measurement method
In addition to conventional calculation methods that search for reactive powerusing voltage, current, and active power, you can select the reactive powermeasurement method, which derives reactive power directly from voltage andcurrent values, just as with the reactive power volume measurement method usedin large-volume power consumers.
Formulae(for single-phase 2-wire systems)
External Interface Specifications
Operating environmentOperating temperatureand humidityStorage temperatureand humidityWithstand voltage(50/60 Hz for 15 sec.)
Power supply voltage ratingMaximum rated powerDimensions and weight
: Indoors, up to 2000m(78.74ft) ASL: 0 to 40˚C, 80% RH or less (non-condensating)
: -10 to 50˚C, 80% RH or less (non-condensating)
: 5.55 kVrms AC: Between the voltage input terminal and the 3169casing
3.32 kVrms AC: Between the voltage input terminal and thecurrent input terminal/external interface terminal
2.3 kVrms AC: Between the power supply and the 3169 casing1.39 kVrms AC: Between the power supply and the current input
terminal/external interface terminal: 100 to 240 V AC, 50/60 Hz: 30 VA: Approx.210(8.27″)W × 160(6.30″) H × 60D(2.36″) mm (excluding
protrusions), Approx.1.2 kg(42.3oz.) (3169-20, 3169-21)
General Specifications

Conditions of guaranteed accuracyTemperature and humidity forguaranteed accuracyFundamental waveform range forguaranteed accuracyDisplay area for guaranteed accuracy
: After 30 minutes of warm-up, sine-wave input, PF=1: 23˚C ±5˚C, less than 80% relative humidity
: 45 to 66 Hz
: Effective measurement area
10
: Fundamental waveforms up to the 50th order ±3% f.s. + measurementaccuracy (of a 45- to 66-Hz fundamental waveform)
: Within ±0.03% f.s./˚C: Within ±0.2% f.s.
(600 Vrms AC, 50/60 Hz, between voltage input terminal and case): Within ±1.5% f.s.
(in a magnetic field of 400 A/m rms AC, 50/60 Hz): ±1.0% rdg.
(45 to 66 Hz, power factor = 0.5, for effective power measurement): ±1.0% rdg.
(45 to 66 Hz, reactive factor = 0.5, when using the reactive power measurement method): ±10 ppm ±1 second (23˚C) (within ±1.9 sec/day (23˚C))
Apparent power accuracyReactive power accuracy
Integration accuracy
Power factor accuracyFrequency accuracy
: ±1 dgt. for the calculation obtained from each measurement value: When using the reactive power measurement method
±0.2% rdg. ±0.1% f.s. + clamp-on sensor accuracyWhen not using the reactive power measurement method
±1 dgt. for the calculation obtained from each measurement value: ±1 dgt. for the measurement accuracy of effective power, reactive
power, and apparent power: ±1 dgt. for the calculation obtained from each measurement value: ±0.5% rdg. ±1dgt.
Reference: Accuracy of the 9694,9695-02, 9695-03,
9660, 9661, 9667, and 9669 CLAMP ON SENSORE
• 9694 (rated for 5 A) : ±0.3%rdg.±0.02%f.s.
• 9695-02 (rated for 50 A) : ±0.3%rdg.±0.02%f.s.
• 9695-03 (rated for 100 A): ±0.3%rdg.±0.02%f.s.
• 9660 (rated for 100 A) : ±0.3%rdg.±0.02%f.s.
• 9661 (rated for 500 A) : ±0.3%rdg.±0.01%f.s.
• 9669 (rated for 1000 A) : ±1.0%rdg.±0.01%f.s.
• 9667 (rated for 5000 A) : ±2.0%rdg.±1.5mV(500 A range: For 50 to 500 A input)
(5000 A range: For 500 to 5000 A input)
* f.s. is the sensor's rated primary current value.
Voltage Current/active power
±0.2%rdg.±0.1%f.s. ±0.2% rdg. ±0.1% f.s. + clamp-on sensor accuracy
Table of current and active power accuracy with clamp-on sensor combinations
Note: The table of accuracy for different clamp-on sensor combinations indicates the measurement accuracy for each current range of the 3169-20/21.(The accuracy for each clamp-on sensor is converted and displayed according to the 3169-20/21 current measurement range.)
Measurement accuracy (Guaranteed accuracy period : 1 year)
Option Specifications
CLAMP ON SENSOR 9694 9660
Primary current rating AC 5 A AC 100 A
9661 9669
AC 500 A
Accuracy Amplitude (45 to 66 Hz)
Phase (45 Hz to 5 kHz)
±0.3%rdg.±0.02%f.s. ±0.3%rdg.±0.02%f.s.
Appearance
Within ±2˚ Within ±1˚
Frequency characteristic Within ±1.0% at 40 Hz to 5 kHz (deviation from accuracy)
Effect of external magnetic field Equivalent to 0.1 A or less (with a magnetic field of 400 A/m AC)
Effect of conductor position Within ±0.5%
300 V rms (insulated conductor)Maximum rated voltage to earth 300 V rms (insulated conductor)
AC 1000 A
Maximum input (45 to 66 Hz) 50 A continuous 130 A continuous
Measurable conductor diameter Less than φ 15 mm(0.59") Less than φ 15 mm(0.59")
Dimensions and weight 46W(1.81") × 135H(5.31") × 21D(0.83") mm, 230g(9.9oz.)
46W(1.80") × 135H(5.31") × 21D(0.83") mm, 230g(9.9oz.)
±0.3%rdg.±0.01%f.s. ±1.0%rdg.±0.01%f.s.
Within ±0.5˚ Within ±1˚
Within ±2.0% at 40 Hz to 5 kHz (deviation from accuracy)
600 V rms (insulated conductor)
550 A continuous
Equivalent to 1 A or less (with a magnetic field of 400 A/m AC)
Less than φ 46 mm(1.81")
Within ±1.5%
77W(3.03") × 151H(5.94") ×42D(1.65")mm, 360g(12.7oz.)
600 V rms (insulated conductor)
1000 A continuousLess than φ 55 mm(2.17"),
80(3.15") × 20 (0.79")mm bus bar
99.5W(3.92") × 188H(7.40") ×42D(1.65") mm, 590g(20.8oz.)
Output voltage AC 10mV/A AC 1mV/A AC 1mV/A AC 0.5mV/A
CLAMP ON SENSOR 9667
Appearance
Primary current rating AC 500 A, 5000A
Output voltage AC 500 mV f.s.
Accuracy Amplitude (45 to 66 Hz)
Phase (45 Hz to 5 kHz)
±2.0%rdg.±1.5mV(for input 10% or more of the renge)
Power supply
Within ±1˚
Frequency characteristic Within ±3 dB at 10 Hz to 20 kHz (deviation from accuracy)
Effect of external magnetic field Equivalent to 5 A, 7.5 A max. (with a magnetic field of 400 A/m AC)
Effect of conductor position Within ±3.0%
Maximum rated voltage to earth 1000 V rms (insulated conductor)
Maximum input (45 to 66 Hz) 10000 A continuous
Measurable conductor diameter Less than φ 254 mm(10.0")
Dimensions and weight Sensor: 910 mm(2.99ft) long, 240g(8.5oz.), Circuit: 57W(2.24") × 86H(3.39") × 30D(1.18") mm, 140g(4.9oz.)LR03 alkaline battery × 4 (continuous operation max. 168 hours)
or 9445 AC ADAPTER(optional)
CAT III 1000V
Cord length:Sensor - circuit: 2 m(6.56ft)Circuit - connector: 1 m(3.28ft)
CAT III 300V CAT III 300V
Cord length: 3 m(9.84ft)
CAT III 600V CAT III 600V
Cord length: 3 m(9.84ft)
Cord length: 3 m(9.84ft)
Cord length: 3 m(9.84ft)
Current rang 9660, 9695-03 9661 9669 9667
5A ±0.5%rdg.±0.5%f.s. ±0.5%rdg.±1.1%f.s. - -10A ±0.5%rdg.±0.3%f.s. ±0.5%rdg.±0.6%f.s. - -
1A - - - -
50A ±0.5%rdg.±0.14%f.s. ±0.5%rdg.±0.2%f.s. - -100A ±0.5%rdg.±0.12%f.s. ±0.5%rdg.±0.15%f.s.. ±1.2%rdg.±0.2%f.s. -200A - - ±1.2%rdg.±0.15%f.s. -500A - ±0.5%rdg.±0.11%f.s. - ±2.2%rdg.±0.4%f.s.
1000A - - ±1.2%rdg.±0.11%f.s. -5000A - - - ±2.2%rdg.±0.4%f.s.
0.5A - - - -9694
±0.5%rdg.±0.12%f.s.
-
±0.5%rdg.±0.2%f.s.
------
±0.5%rdg.±0.3%f.s.
9695-02
±0.5%rdg.±0.3%f.s
±0.5%rdg.±0.2%f.s
±0.5%rdg.±1.1%f.s
±0.5%rdg.±0.12%f.s.
-----
±0.5%rdg.±2.1%f.s
Frequency characteristic
Temperature characteristicEffect of in-phase voltage
Effect of external magnetic field
Power factor influence
Effect of reactive factor
Real-time clock accuracy
9695-02
AC 50 A
AC 10 mV/A
Within ±2˚
60 A continuous
9695-03
AC 100 A
AC 1 mV/A
Within ±1˚
130 A continuous
Within ±1.0% at 40 Hz to 5 kHz (deviation from accuracy)
±0.3%rdg.±0.02%f.s.
Equivalent to 0.1 A or less (with a magnetic field of 400 A/m AC)
Within ±0.5%
300 V rms (insulated conductor)
Less than φ 15 mm(0.59")
50.5W(1.99") × 58H(2.28") × 18.7D(0.74")mm, 50g(1.8oz.)
Option : 9219 CONNECTION CABLE
CAT III 300VCAT III 300V

Options9660 CLAMP ON SENSOR (AC 100A)
9661 CLAMP ON SENSOR (AC 500A)
9667 FLEXIBLE CLAMP ON SENSOR (AC 5000A)
9669 CLAMP ON SENSOR (AC 1000A)
9694 CLAMP ON SENSOR (AC 5A)
9695-02 CLAMP ON SENSOR (AC 50A)
9695-03 CLAMP ON SENSOR (AC 100A)
9219 CONNECTION CABLE (for connection to the 9695-02, 9695-03)
9290-10 CLAMP ON ADAPTER (AC 1500A)
9440 CONNECTION CABLE (for external I/O)
9612 RS-232C CABLE (for connection to a PC)
9442 PRINTER9443-02 AC ADAPTER (for the 9442, for Europe)
9443-03 AC ADAPTER (for the 9442, for USA)
9721 RS-232C CABLE (for connection to the 9442)
1196 RECORDING PAPER (25 m(82ft)/10 rolls, for the 9442)
9720 CARRYING CASE9625 POWER MEASUREMENT SUPPORT SOFTWARE9726 PC CARD 128M9727 PC CARD 256M9728 PC CARD 512M
11
Option Specifications
9442 PRINTER
9720 CARRYING CASE
: Thermal serial dot printing: 112 mm(4.41ft): 52.5cps: 9443-02/03 AC adapter, or supplied nickel-
metal hydride battery (approx. 3000 linesof printing when fully charged and usedwith the 9443-02/03)
: Approx.160W (6.30")× 66.5H(2.62") ×17D(0.67") mm, approx.580g(20.5oz.)
Print methodPaper widthPrint speedPower supply
Dimensions and weight
A soft type case for storing the 3169-20/21 andits accessories, such as the clamp-on sensors.
9721 RS-232C CABLE 9443-02/03 AC ADAPTER
When purchasing the 9442 printer, make sure you also purchase the 9721RS-232C cable and 9443-02/03 AC adapter so that you can connect it to the3169-20/21.
9440 CONNECTION CABLE 9441 CONNECTION CABLEFor external I/O
Cord length: 2 m(2.65ft)
For D/A output(supplied withthe 3169-21)
: Approx. 445W(17.52") × 340H(13.39")× 150D(5.91") mm, approx. 2.2 kg(77.6oz.)
Dimensions andweight
Current and power cannot be measured using the 3169-20/21 CLAMP ON POWER
HiTESTER on its own. To perform current and power measurement, make sure you also
purchase a CLAMP ON SENSOR (9694, 9660, 9661, 9667, or 9669) (sold separately).
Use only PC Cards (9726, 9727or 9728) sold by HIOKI.
Compatibility and performance are not guaranteed for PC cards made by other
manufacturers. You may be unable to read from or save data to such cards.
Combination examplesFor single-phase 2-wire systems (one system) : 3169-20 + 9660(100A) × 1 +9726(128MB)For single-phase 3-wire systems : 3169-20 + 9660(100A) × 2 +9726(128MB)(one system/two single-phase 2-wire systems)
For three-phase 3-wire systems (one system) : 3169-20 + 9661(500A) × 2 +9726(128MB)For three-phase 3-wire systems : 3169-20 + 9661(500A) × 4 +9726(128MB)(two systems/four single-phase 2-wire systems)
For three-phase 4-wire systems (one system) : 3169-20 + 9661(500A) × 3 +9726(128MB)
3169-20 CLAMP ON POWER HiTESTER(supplied with the 9438-03 voltage cord (1), and power cord (1))
3169-21 (with D/A output)CLAMP ON POWER HiTESTER
(supplied with the 9438-03 voltage cord (1), 9441 connection cable (1) andpower cord (1))
Accessory Specifications9438-03 VOLTAGE CORD (1 cord each of black, red, yellow, and blue, cord length: 3 m(9.84ft))
9441 CONNECTION CABLE (D/A output cable, supplied with the 3169-21)
Max. 1500 A AC (continuous: 1000 A)Measurable conductor diameter:Bus bar : φ55 mm(2.17"), width 80 mm(3.46")CT ratio: 10:1
*Used for expanding the measurement ranges of the 9660and 9661 sensors
9290-10 CLAMP ON ADAPTERCord length: 3 m(9.84ft)
For the 9442Cord length forconnecting to the9442: 1.5 m(4.92ft)
Photo: 9443-03
Cord length: 2m(2.65ft)
3169E6-5ZM-02P Printed in JapanAll information correct as of Dec. 19, 2005. All specifications are subject to change without notice.
HEAD OFFICE :81 Koizumi, Ueda, Nagano, 386-1192, JapanTEL +81-268-28-0562 / FAX +81-268-28-0568 E-mail: [email protected]
HIOKI USA CORPORATION :6 Corporate Drive, Cranbury, NJ 08512 USATEL +1-609-409-9109 / FAX +1-609-409-9108E-mail: [email protected]
DISTRIBUTED BY
Shanghai Representative Office :1704 Shanghai Times Square Office93 Huaihai Zhong RoadShanghai, 200021, P.R.ChinaTEL +86-21-6391-0090, 0092 FAX +86-21-6391-0360E-mail: [email protected]
9726 to 9728 PC CARDUse only PC Cards (9726, 9727, or 9728) sold
by HIOKI.
For connection to the 9695-02, 9695-03
9219 CONNECTION CABLE
Cord length: 3 m(9.84ft)