hippocampal place-cell sequences depict future paths to
TRANSCRIPT

ARTICLEdoi:10.1038/nature12112
Hippocampal place-cell sequences depictfuture paths to remembered goalsBrad E. Pfeiffer1 & David J. Foster1
Effective navigation requires planning extended routes to remembered goal locations. Hippocampal place cells havebeen proposed to have a role in navigational planning, but direct evidence has been lacking. Here we show that beforegoal-directed navigation in an open arena, the rat hippocampus generates brief sequences encoding spatial trajectoriesstrongly biased to progress from the subject’s current location to a known goal location. These sequences predictimmediate future behaviour, even in cases in which the specific combination of start and goal locations is novel. Theseresults indicate that hippocampal sequence events characterized previously in linearly constrained environments as‘replay’ are also capable of supporting a goal-directed, trajectory-finding mechanism, which identifies importantplaces and relevant behavioural paths, at specific times when memory retrieval is required, and in a manner that couldbe used to control subsequent navigational behaviour.
A fundamental purpose of memory lies in using previous experienceto inform current choices, directing behaviour towards reward andaway from negative consequences based on knowledge of prior out-comes in similar situations. Goal-directed spatial navigation—planningextended routes to remembered locations—requires both memory ofthe goal location and knowledge of the intervening terrain to determinean efficient and safe path. The hippocampus has long been known tohave a critical role in spatial memory1,2 and memory for events3,4, and ithas been proposed that the hippocampus may have a fundamental rolein calculating routes to goals, especially under conditions demandingbehavioural flexibility1,5–8. This proposal stems largely from the dis-covery that excitatory neurons of the hippocampus show spatiallylocalized place responses during exploration1. However, it has been achallenge to understand how individual place responses tied to thecurrent location might be informative about other locations that theanimal cares about, such as the remembered goal9, or the set of loca-tions defining a route10,11.
Techniques to record simultaneously from multiple hippocampalplace cells12 have been used to show that place cells systematicallyrepresent positions other than the current location. The early discov-ery of phase precession of place-cell spikes relative to theta frequencyoscillations in the local field potential13 led to the hypothesis that placecells fire in sequences within a theta cycle, and thus represent placesbehind or ahead of the animal14–16. Theta sequences have since beendemonstrated experimentally across place-cell populations17. Alsoduring theta, place-cell activity seems to ‘sweep’ ahead of an animallocated at a choice point18, leading to the hypothesis that such activitycould support the evaluation of alternatives during decision making19.A separate group of phenomena termed ‘replay’ has been found duringsleep20,21 and non-exploratory awake periods22, and is associated withsharp-wave-ripple (SWR) events in the hippocampal local field poten-tial (with the sole exception of replay during rapid eye movementsleep20). In replay, simultaneously recorded populations of place cellsshow reactivation of temporal sequences reflecting prior behaviouraltrajectories up to 10-m long23. Although these forms of non-localactivity are now well established17,23–26, it has proven difficult to estab-lish a predictive relationship between non-local place-cell activity andbehaviour18,26, because of the twofold technical problem of ensuring
adequate behavioural sampling of the environment while recordingfrom sufficient numbers of place cells. Thus it remains unknownwhether non-local place-cell activity can specify remembered goals,or define specific routes that the animal will take.
Depiction of two-dimensional trajectoriesWe recorded from hippocampal neurons while rats performed a spa-tial memory task, using the statistical power of an open-field design inwhich the goal was one of 36 clearly separated locations within a2 m 3 2 m arena (Fig. 1a). We addressed the sampling problem bycombining random foraging and goal-directed behaviour, and byimplanting miniaturized lightweight microdrives supporting 40 inde-pendently adjustable tetrodes, with 20 tetrodes targeted to each dorsalhippocampal area CA1 (Supplementary Fig. 1), to record simul-taneously from up to 250 hippocampal neurons with well-definedplace fields. Our task, incorporating elements from previous taskdesigns9,27–29, was composed of trials each consisting of two phases:in phase one, the rat was required to forage to obtain reward (liquidchocolate) in an unknown location (Random). In phase two, the ratcould obtain reward in a predictable reward location (Home). Thetransition to the next phase or trial was automatic upon consum-mation of the reward, and was not signalled to the animal. The taskincorporated several features. First, because the shortest routes inphase one and two were matched, it was determined that animalscould remember Home, but could not detect Random locations,because latencies and path lengths were significantly shorter forHome-bound trajectories (Fig. 1b–d). Second, the Home locationwas moved to a new location each day. Thus, animals were requiredto learn a new goal location, demanding a flexible behavioural res-ponse that was more likely to engage the hippocampus than a fixedreference-memory response27,30,31. Third, for the first 19 trials of eachday, the Random locations were non-repeating. Hence during thisperiod, every Home-bound trajectory was always a novel combinationof current location and goal location. Thus, our task probed bothmemory for the goal location and flexible planning of a novel routeto get there.
We implanted four well-trained rat subjects with the 40-tetrodemicrodrive for electrophysiological recording. Large numbers of
1Solomon H Snyder Department of Neuroscience, Johns Hopkins University School Of Medicine, Baltimore, Maryland 21205, USA.
0 0 M O N T H 2 0 1 3 | V O L 0 0 0 | N A T U R E | 1
Macmillan Publishers Limited. All rights reserved©2013

well-isolated units (Supplementary Fig. 2)32 were recorded simulta-neously during behavioural sessions on two consecutive days (212 and250 units active during exploration from rat 1 on experimental days 1and 2, respectively; 166 and 193 units from rat 2 on days 1 and 2; 133and 106 units from rat 3 on days 1 and 2; 103 and 175 units from rat 4on days 1 and 2). The recorded units demonstrated position-specificfiring patterns (‘place fields’) that were distributed throughout theenvironment (Supplementary Figs 3–5), and a memory-less, uniformprior Bayesian decoding algorithm23 allowed us to estimate the spatiallocation of the rat accurately from the recorded spike trains through-out the experiment (Supplementary Fig. 6 and Supplementary Video 1).We identified candidate events as brief increases in population spikingactivity during periods of immobility while the rat performed the task(Fig. 2a) and applied the decoding algorithm to the population spiketrains (Fig. 2b). During many candidate events, decoded positionrevealed temporally compressed, two-dimensional trajectories acrossthe environment (Fig. 2c and Supplementary Video 2). We appliedlength, duration and smoothness criteria to the decoded positions ofcandidate events to define ‘trajectory events’ (see Methods). We foundbetween 144 and 373 trajectory events per session (between 25.3% and43.9% of candidate events) with a mean duration of 103.6 ms, and pathlengths that ranged from 40.0 cm to 199.1 cm (Supplementary Fig. 7and Supplementary Table 1). We tested the probability that trajectoryevents could have occurred by chance, using two separate Monte-Carloshuffle methods which varied either cell identity or place field position
(see Methods). Zero (out of 2,028) trajectory events had a P-valuegreater than 0.02 under either method, indicating that all trajectoryevents were statistically significant events. Spectrogram analysis oftrajectory events strongly matched SWR events identified within thesame experimental sessions (Supplementary Fig. 8a). In addition, anoverwhelming majority of trajectory events were coincident withSWR events (Supplementary Fig. 8b). Theta power, which is highduring exploration, was significantly decreased immediately beforeand after trajectory events (Supplementary Fig. 8c). Collectively, thesedata indicate that trajectory events are functionally similar to the SWR-associated events previously reported on linear tracks as ‘replay’21–26.
Trajectory events over-represent the goalTo examine whether non-local spatial information present in traject-ory events contributes to or is affected by acquisition or expression of
225 205 115
c
0 2 x position (m)
0
2
0
2
0
2
y p
ositio
n (m
)
0 2 0 2 0 2
1,593 1,613Time (s)
Unit n
um
ber
212
1
Tota
l sp
ike
density (kH
z)
0
3
a b
x position
y posi
tion
15
20
25
30
35
0 0.1
40
Away-events with a trajectory that does not end at Home
Away-events with a trajectory that ends at Home
Home-events
0
2
130
240 185 190
300
110 170
120 75
105 105
125 155
10
Frame 1
5
Figure 2 | Trajectory events. a, Raster plot (top) and spike density (bottom)of simultaneous unit activity for R1,D1 for representative epoch. Periodsof immobility denoted in black. Dashed lines represent candidate eventdetection threshold. b, Position posterior probabilities in selected framesfor the candidate event in a. c, 16 representative events (of 274) for R1,D1,decoded and summed across time. Values indicated by colour bar. Eventduration (in ms) in right corner. Cyan circle, Home well. Cyan line, peakprobability for each timeframe. Cyan arrowhead, position and headdirection of rat at time of event. Videos of each event available in onlineSupplementary Video 2.
Trial
90
25
D1
D2
b
*** 80
Late
ncy (s)
a
Late
ncy (s)
200
0
0
Home Random
Rat 1, day 1
Home Random
c
D1
***
D2
*** 11
Path
leng
th (m
)
D1
***
D2
d
Num
ber
of
tria
ls
45
Path length (m)
Latency (s)
20
150 0
2 m
Random Home
x
o
0
0
0
0 0
Figure 1 | Behaviour in the open-field spatial memory task. a, Schema ofarena and room, reward wells (circles), and Home location for days 1 and 2 (D1,cyan; D2, red). b, Per-trial latency to reach Home or Random well location forrat 1 (R1) on D1. c, Mean latency and path length to reach Home or Randomwell location across all rats for D1 and D2. P-values (Wilcoxon rank-sum test):latency D1 5.5 3 10219, D2 9.7 3 10214; path D1 2.7 3 10219, D2 5.2 3 10216.d, Histogram of latencies (5-s bins) and path lengths (50-cm bins) for all trials(shown to 150 s and 20 m, respectively) P-values (Kolmogorov–Smirnov test):latency 2.6 3 1022; path 9.1 3 1024.
RESEARCH ARTICLE
2 | N A T U R E | V O L 0 0 0 | 0 0 M O N T H 2 0 1 3
Macmillan Publishers Limited. All rights reserved©2013
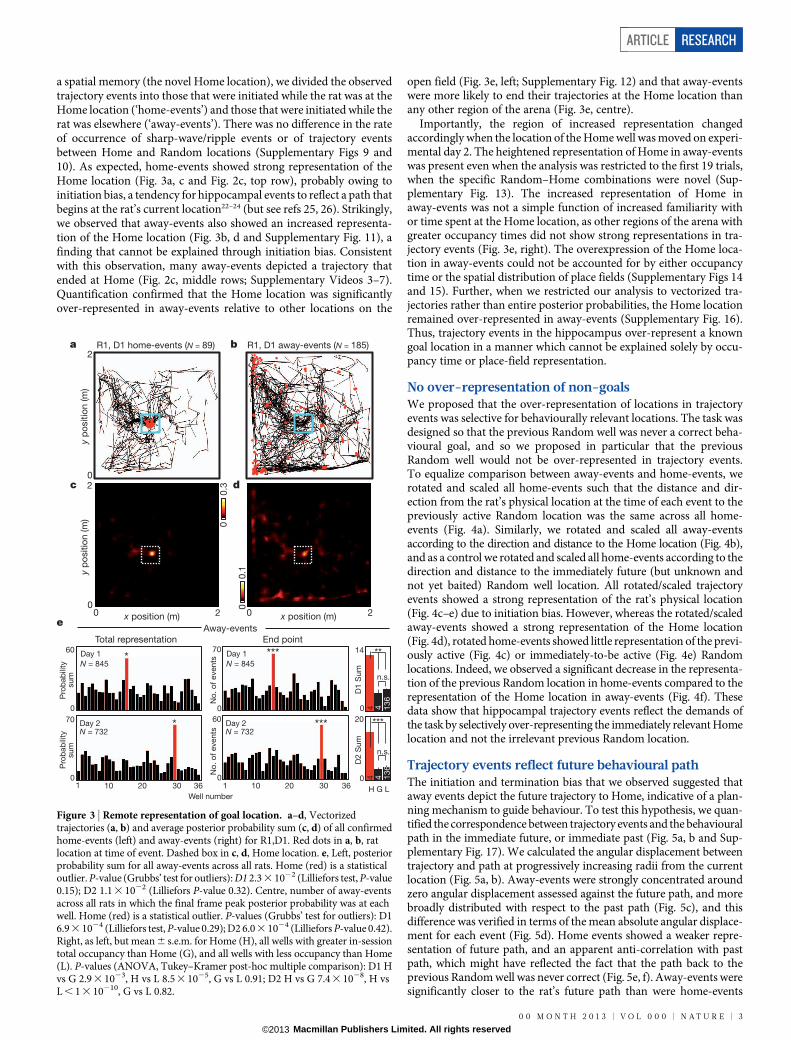
a spatial memory (the novel Home location), we divided the observedtrajectory events into those that were initiated while the rat was at theHome location (‘home-events’) and those that were initiated while therat was elsewhere (‘away-events’). There was no difference in the rateof occurrence of sharp-wave/ripple events or of trajectory eventsbetween Home and Random locations (Supplementary Figs 9 and10). As expected, home-events showed strong representation of theHome location (Fig. 3a, c and Fig. 2c, top row), probably owing toinitiation bias, a tendency for hippocampal events to reflect a path thatbegins at the rat’s current location22–24 (but see refs 25, 26). Strikingly,we observed that away-events also showed an increased representa-tion of the Home location (Fig. 3b, d and Supplementary Fig. 11), afinding that cannot be explained through initiation bias. Consistentwith this observation, many away-events depicted a trajectory thatended at Home (Fig. 2c, middle rows; Supplementary Videos 3–7).Quantification confirmed that the Home location was significantlyover-represented in away-events relative to other locations on the
open field (Fig. 3e, left; Supplementary Fig. 12) and that away-eventswere more likely to end their trajectories at the Home location thanany other region of the arena (Fig. 3e, centre).
Importantly, the region of increased representation changedaccordingly when the location of the Home well was moved on experi-mental day 2. The heightened representation of Home in away-eventswas present even when the analysis was restricted to the first 19 trials,when the specific Random–Home combinations were novel (Sup-plementary Fig. 13). The increased representation of Home inaway-events was not a simple function of increased familiarity withor time spent at the Home location, as other regions of the arena withgreater occupancy times did not show strong representations in tra-jectory events (Fig. 3e, right). The overexpression of the Home loca-tion in away-events could not be accounted for by either occupancytime or the spatial distribution of place fields (Supplementary Figs 14and 15). Further, when we restricted our analysis to vectorized tra-jectories rather than entire posterior probabilities, the Home locationremained over-represented in away-events (Supplementary Fig. 16).Thus, trajectory events in the hippocampus over-represent a knowngoal location in a manner which cannot be explained solely by occu-pancy time or place-field representation.
No over-representation of non-goalsWe proposed that the over-representation of locations in trajectoryevents was selective for behaviourally relevant locations. The task wasdesigned so that the previous Random well was never a correct beha-vioural goal, and so we proposed in particular that the previousRandom well would not be over-represented in trajectory events.To equalize comparison between away-events and home-events, werotated and scaled all home-events such that the distance and dir-ection from the rat’s physical location at the time of each event to thepreviously active Random location was the same across all home-events (Fig. 4a). Similarly, we rotated and scaled all away-eventsaccording to the direction and distance to the Home location (Fig. 4b),and as a control we rotated and scaled all home-events according to thedirection and distance to the immediately future (but unknown andnot yet baited) Random well location. All rotated/scaled trajectoryevents showed a strong representation of the rat’s physical location(Fig. 4c–e) due to initiation bias. However, whereas the rotated/scaledaway-events showed a strong representation of the Home location(Fig. 4d), rotated home-events showed little representation of the previ-ously active (Fig. 4c) or immediately-to-be active (Fig. 4e) Randomlocations. Indeed, we observed a significant decrease in the representa-tion of the previous Random location in home-events compared to therepresentation of the Home location in away-events (Fig. 4f). Thesedata show that hippocampal trajectory events reflect the demands ofthe task by selectively over-representing the immediately relevant Homelocation and not the irrelevant previous Random location.
Trajectory events reflect future behavioural pathThe initiation and termination bias that we observed suggested thataway events depict the future trajectory to Home, indicative of a plan-ning mechanism to guide behaviour. To test this hypothesis, we quan-tified the correspondence between trajectory events and the behaviouralpath in the immediate future, or immediate past (Fig. 5a, b and Sup-plementary Fig. 17). We calculated the angular displacement betweentrajectory and path at progressively increasing radii from the currentlocation (Fig. 5a, b). Away-events were strongly concentrated aroundzero angular displacement assessed against the future path, and morebroadly distributed with respect to the past path (Fig. 5c), and thisdifference was verified in terms of the mean absolute angular displace-ment for each event (Fig. 5d). Home events showed a weaker repre-sentation of future path, and an apparent anti-correlation with pastpath, which might have reflected the fact that the path back to theprevious Random well was never correct (Fig. 5e, f). Away-events weresignificantly closer to the rat’s future path than were home-events
Well number
c
x position (m) 0 2
y p
ositio
n (m
)
0
2
Pro
bab
ility
a
0
60
0
70
Total representation
x position (m) 0 2
30 36 10 20
R1, D1 away-events (N = 185)
0
2 R1, D1 home-events (N = 89)
y p
ositio
n (m
)
0
0.3
0
0.1
**
No
. o
f events
0
70
0
60
H G L
***
14
20 *
*
n.s.
n.s.
***
***
30 36 10 20
No
. o
f events
D2 S
um
D
1 S
um
136
136
d
b
e
Day 2 N = 732
End point
Day 1
Pro
bab
ility
sum
sum
N = 845
Day 1
N = 845
Day 2 N = 732
Away-events
4
4
4
4
0
01 1
Figure 3 | Remote representation of goal location. a–d, Vectorizedtrajectories (a, b) and average posterior probability sum (c, d) of all confirmedhome-events (left) and away-events (right) for R1,D1. Red dots in a, b, ratlocation at time of event. Dashed box in c, d, Home location. e, Left, posteriorprobability sum for all away-events across all rats. Home (red) is a statisticaloutlier. P-value (Grubbs’ test for outliers): D1 2.3 3 1022 (Lilliefors test, P-value0.15); D2 1.1 3 1022 (Lilliefors P-value 0.32). Centre, number of away-eventsacross all rats in which the final frame peak posterior probability was at eachwell. Home (red) is a statistical outlier. P-values (Grubbs’ test for outliers): D16.9 3 1024 (Lilliefors test, P-value 0.29); D2 6.0 3 1024 (Lilliefors P-value 0.42).Right, as left, but mean 6 s.e.m. for Home (H), all wells with greater in-sessiontotal occupancy than Home (G), and all wells with less occupancy than Home(L). P-values (ANOVA, Tukey–Kramer post-hoc multiple comparison): D1 Hvs G 2.9 3 1023, H vs L 8.5 3 1025, G vs L 0.91; D2 H vs G 7.4 3 1028, H vsL , 1 3 10210, G vs L 0.82.
ARTICLE RESEARCH
0 0 M O N T H 2 0 1 3 | V O L 0 0 0 | N A T U R E | 3
Macmillan Publishers Limited. All rights reserved©2013

(Fig. 5g), consistent with the goal-directed nature of Random-to-Home navigation. We conducted two further analyses of path corres-pondence, one based on the orientation of the depicted trajectory to alocation occupied 10 s in the future or the past (Supplementary Fig. 18),and one based on the spatial overlap between smoothed versions ofthe trajectory and future or past path (Supplementary Fig. 19), withmatching results. Rats showed no bias to face the direction of theirimmediately future path or the Home well location during away-events(Supplementary Fig. 20a, b). Furthermore, away-events were morespatially correlated with the rat’s future path than with his currentheading (Supplementary Fig. 20d–g). Thus, the strong reflection ofthe rat’s future path in away-events could not be trivially explainedas a representation of paths ‘in front’ of the rat, but rather suggested amore precise path-finding mechanism.
A flexible planning mechanismIf trajectory events reflect behavioural planning generally, they mightalso have depicted future behaviours when the animal did not proceedimmediately to the Home location. Indeed, away-events closelymatched the rat’s future path regardless of whether the rat’s futurepath took it to the Home location or elsewhere in the arena (Fig. 6a, c).For both cases, trajectories matched the future path more than thepast path (Fig. 6b, d). We proposed that if trajectory events reflectedan active process that could switch between goals, then before non-Home-seeking behaviours, not only would the representation of thenon-Home-seeking path be enhanced, but the representation ofthe Home well would be reduced. Indeed, we found reduced Homerepresentation in non-Home-seeking away-events compared to Home-seeking away-events (Fig. 6e).
We finally proposed that a flexible planning mechanism should beable to specify paths of novel importance (a novel combination of startand end points) over familiar terrain. The animals’ behaviour showedevidence of this ability over the first 19 trials of each day. We thereforeexamined trajectory events during this period of each session. Away-events during this novel period also bore a strong match to the rat’sfuture path (Fig. 6f and Supplementary Videos 3–7), and were closerto the rat’s future path than its past path (Fig. 6g).
H-F
P
A-F
P
451
0 1,5
77
π/2 *** 25
0
Past path
Angular displacement 0
y p
ositio
n
a b Event Future path Past path
0 0
2
2 0 0
2
2
A-P
P
A-F
P
***
1,5
77
π/2
π
π–π
π–ππ–π
π–π
0 1,5
77
25
0
Past path
Angular displacement 0
Cro
ssin
gs (%
)
Angular displacement
25
0 0
Future pathc
H-P
P
H-F
P
***
451
0 451
25
0
Future path
Angular displacement 0
Cro
ssin
gs (%
)
d Rat 1 Rat 2 Rat 3 Rat 4 All Rats
Away-events
Home-events
x position x position
Ab
s. d
isp
lacem
en
t A
bs.
dis
pla
cem
ent
e f g
Event Future path Past path
Figure 5 | Correspondence to past or future path. a, b, Representative eventfrom R1,D1, demonstrating trajectory event vector (black), immediate future(green) and past (magenta) path (up to 10 s or 50 cm, whichever is greater), andangular displacement along the minor arc between event and future (a) or past(b) path at each crossing. c, Per cent of crossings across all events as a functionof angular displacement for all away-events compared to future (left) or past(right) path. Dashed line indicates chance based upon 2,000 shuffled events.d, Mean absolute angular displacement for away-events compared to future(A-FP) or past (A-PP) path. Abs., absolute. e, f, As c, d, for home-events.g, Mean absolute angular displacement for future path for all away-events(A-FP) or home-events (H-FP). P-values (Wilcoxon rank-sum test):8.60 3 10231 (d); 3.54 3 10217 (f); 7.25 3 10216 (g).
Perpendicular to Home
Perpendicular to prev. Random
Away-events rotated/scaled to Home well locationb
Perpendicular to Home
Rat location
Home
Sum Trajectories
Home-events rotated/scaled to
previous Random well location
a
Perpendicular to prev. Random
Rat location
Prev. Random
Sum Trajectories
Rat location
Home
Rat location
Prev. Random
0 0.05
Rat location Next Random
0
0.25
Day 1 Day 2
24
0
21
1
Day 2 Day 1
Rat location Home
0
0.10
84
5
73
2
Rat location
Prev. Random
0
0.25 c
24
0
21
1
Rep
resen
tatio
n (p
rob
.)
Day 1 Day 2
d e f 0.8
0
Well/
rat
ratio
Day 1
Next
Ran
do
m
Pre
v. R
an
do
mH
om
e
Next
Ran
do
m
Pre
v. R
an
do
mH
om
e
**
***
Day 2
0 0.05
Tow
ard
s
Ho
me
Aw
ay f
rom
H
om
e
Tow
ard
s
Ran
do
m
Aw
ay f
rom
R
an
do
m
Figure 4 | Representation of relevant vs. irrelevant locations. a, Vectorizedtrajectories (left) and average posterior probability sum (right) of all home-events for R1,D1, centred by the rat’s physical location at time of event androtated and scaled according to direction and distance to the previouslyrewarded Random location. White circles, quantified regions. Prev., previous.b, As a, for Home. c–e, Across all rats, mean representation of quantifiedregions as in a, b. Event number displayed on bar. f, Normalized ratio of well/ratrepresentation for c–e. P-values (Wilcoxon rank-sum test): D1 Home vs prev.Random 4.4 3 10216, Home vs next Random 9.9 3 1023; D2 Home vs prev.Random 3.1 3 10220, Home vs next Random 1.3 3 10213.
RESEARCH ARTICLE
4 | N A T U R E | V O L 0 0 0 | 0 0 M O N T H 2 0 1 3
Macmillan Publishers Limited. All rights reserved©2013

DiscussionWe have demonstrated that hippocampal SWR-associated trajectoryevents predict immediate future navigational behaviour. This findingfollows a succession of results8 reporting that SWR-associatedsequences occur robustly during the awake state22–26, that sequencesare not always facsimiles of previous behavioural episodes22–24,26,33 andcan even depict novel combinations of previous experiences26, andthat sequences can be selective to the extent of not always reportingthe most recent experience26, or even necessarily experiences from thecurrent environment25. Moreover, disruption studies using electricalstimulation contingent on SWR detection have revealed a role forsleep SWRs in learning34,35, and a specific role for awake SWRs inworking memory but not reference memory36, which accords with theflexibility of trajectory events in response to a daily changing goallocation27,30,31. Regarding our observation of stronger prediction beforegoal-finding than random foraging, it is likely that during the latterbehaviour, an animal repeatedly makes online changes to his plannednavigational trajectory, which would reduce its initial predictability.This strategic variability may be reflected in the over-dispersion ofplace-cell firing rates during random foraging28,37. Regarding the mecha-nism generating trajectory events, low-level mechanisms might havecontributed, such as the spatial distributions of place cells’ firing rates,although these did not account for the precise depiction of the goallocation. Alternatively, it is equally possible that the spatial distri-butions of firing rates emerged as a consequence of the trajectoryevents. Simple models of encoding routes via direct experience cannoteasily explain either the trial-by-trial switching of trajectory eventsbetween different goals (Home-seeking versus non-Home-seeking),or the trajectory events corresponding to novel Random–Homecombinations6,38,39, although the incorporation of contextual codingfor the goal might account for some of this functionality5,40. It remainsunknown whether trajectory events can reflect the calculation of opti-mal paths in more challenging navigational tasks that incorporatebarriers to movement41,42. Finally, we might speculate on how theplanning function of trajectory events operates. Trajectory depictionby place cells before behaviour might support a plasticity mechanism
that reinforces the particular path, in a way that can be accessed locallyduring behaviour43. For example, trajectory events might drive associ-ations between places en route and estimates of value19,31,44,45 or chosenaction44,46 that could be accessed subsequently by local place-cellactivation during goal-directed behaviour, perhaps in combinationwith a local look-ahead mechanism such as theta sequences.
In summary, our data reveal a flexible, goal-directed mechanism forthe manipulation of previously acquired memories, in which beha-vioural trajectories to a remembered goal are depicted in the brainimmediately before movement. Such findings address longstandingquestions about the role of place cells in navigational learning andplanning, as well as broader questions regarding the recall and use ofstored memory. In particular, trajectory events relate to hippocampalfunction in multiple conceptual contexts: as a cognitive map in whichroutes to goals might be explored flexibly before behaviour1, as anepisodic memory system engaging in what has been termed ‘mentaltime travel’47, and as a substrate for the recall of imaginary events48,49.These conceptualizations reflect a continuity with earlier speculationson animals’ capacities for inference50. Trajectory events offer a newexperimental model for the study of these varied functions.
METHODS SUMMARYA microdrive array containing 40 independently adjustable, gold-plated tetrodesaimed at area CA1 of dorsal hippocampus (20 tetrodes per hemisphere; 4.00 mmposterior and 2.85 mm lateral to bregma) was implanted in four rat subjects. Finaltetrode placement and unit recording were as previously described22.
Position information was binned into 2-cm bins. Tuning curves were calcu-lated as the smoothed histogram of firing activity normalized by the time spentper bin. Population events were defined as peaks in a smoothed spike densityhistogram greater than the mean 1 3 standard deviations, bounded by crossingsof the mean.
Probability-based decoding of position information from spike trains wasperformed as previously described23, using a time window of 20 ms. Each can-didate event was truncated to the longest sequence of time frames in which thepeak posterior probability was less than 20 cm from that of the previous frame.Events with fewer than 10 steps in the final sequence or a start-to-end distance lessthan 40 cm were eliminated from further analysis.
Full Methods and any associated references are available in the online version ofthe paper.
Received 28 September 2012; accepted 21 March 2013.
Published online 17 April 2013.
1. O’Keefe, J. & Nadel, L. The Hippocampus As A Cognitive Map. (Clarendon, 1978).2. Morris, R.G., Garrud,P., Rawlins, J.N.&O’Keefe, J. Placenavigation impaired in rats
with hippocampal lesions. Nature 297, 681–683 (1982).3. Scoville, W. B. & Milner, B. Loss of recent memory after bilateral hippocampal
lesions. J. Neurol. Neurosurg. Psychiatry 20, 11–21 (1957).4. Olton, D. S. & Samuelson, R. J. Remembrance of places past: spatial memory in
rats. J. Exp. Psychol. Anim. Behav. Process. 2, 97–116 (1976).5. Levy, W. B. A sequence predicting CA3 is a flexible associator that learns and uses
context to solve hippocampal-like tasks. Hippocampus 6, 579–590 (1996).6. Redish, A. D. & Touretzky, D. S. The role of the hippocampus in solving the Morris
water maze. Neural Comput. 10, 73–111 (1998).7. Koene, R. A., Gorchetchnikov, A., Cannon, R. C. & Hasselmo, M. E. Modeling goal-
directed spatial navigation in the rat based on physiological data from thehippocampal formation. Neural Netw. 16, 577–584 (2003).
8. Foster, D. J. & Knierim, J. J. Sequence learning and the role of the hippocampus inrodent navigation. Curr. Opin. Neurobiol. 22, 294–300 (2012).
9. Hok, V. et al. Goal-related activity in hippocampal place cells. J. Neurosci. 27,472–482 (2007).
10. Wood, E. R., Dudchenko, P. A., Robitsek, R. J. & Eichenbaum, H. Hippocampalneurons encode information about different types of memory episodes occurringin the same location. Neuron 27, 623–633 (2000).
11. Ferbinteanu, J. & Shapiro, M. L. Prospective and retrospective memory coding inthe hippocampus. Neuron 40, 1227–1239 (2003).
12. Wilson, M. A. & McNaughton, B. L. Dynamics of the hippocampal ensemble codefor space. Science 261, 1055–1058 (1993).
13. O’Keefe, J.& Recce,M. L.Phase relationshipbetweenhippocampalplaceunits andthe EEG theta rhythm. Hippocampus 3, 317–330 (1993).
14. Muller, R. U. & Kubie, J. L. The firing of hippocampal place cells predicts the futureposition of freely moving rats. J. Neurosci. 9, 4101–4110 (1989).
15. Skaggs, W. E., McNaughton, B. L., Wilson, M. A. & Barnes, C. A. Theta phaseprecession in hippocampal neuronal populations and the compression oftemporal sequences. Hippocampus 6, 149–172 (1996).
TH
**
989
0.08
0 588
NH
Ho
me
rep
resenta
tio
n
25
0
Future path does not go Home
Angular displacement 0
Cro
ssin
gs (%
)
25
0
Away-events past path
Angular displacement 0
NH
-PP
N
H-F
P
***
989
0 989 C
rossin
gs (%
)
Angular displacement
25
0 0
Future path
goes to Homea
25
0
Away-eventsfuture path
Angular displacement 0
Away-events
First 19 trials
f
Ab
s.
dis
pla
cem
ent
Ab
s.
Dis
pla
cem
ent
A19-P
P
A19-F
P
***
653
0 653
/2
d e
g
TH
-PP
TH
-FP
***
588
0 588
π/2 π/2
Ab
s.
dis
pla
cem
ent
b c
π–ππ–π
π–π π–π
Figure 6 | Goal switching and flexibility in trajectory events. a, b, As Fig. 5c(left) and 5d, for away-events preceding behaviour ending at or crossingHome (future path, TH-FP; past path, TH-PP). c, d, As a, b, for away-eventspreceding behaviours directed elsewhere (future path, NH-FP; past path,NH-PP). e, Mean posterior probability representation of Home for samedivision of away-events (to Home, TH; not to Home, NH). f, g, As Fig. 5c, d,for away-events from the first 19 trials of each session (future path, A19-FP;
past path, A19-PP). P-values (Wilcoxon rank-sum test): 4.96 3 10222 (b);1.12 3 10213 (d); 9.60 3 1023 (e);
ARTICLE RESEARCH
0 0 M O N T H 2 0 1 3 | V O L 0 0 0 | N A T U R E | 5
Macmillan Publishers Limited. All rights reserved©2013

16. Jensen, O. & Lisman, J. E. Hippocampal CA3 region predicts memory sequences:accounting for the phase precession of place cells. Learn. Mem. 3, 279–287 (1996).
17. Foster, D. J. & Wilson, M. A. Hippocampal theta sequences. Hippocampus 17,1093–1099 (2007).
18. Johnson, A. & Redish, A. D. Neural ensembles in CA3 transiently encode pathsforward of the animal at a decision point. J. Neurosci. 27, 12176–12189 (2007).
19. Johnson, A., van der Meer, M. A. & Redish, A. D. Integrating hippocampus andstriatum in decision-making. Curr. Opin. Neurobiol. 17, 692–697 (2007).
20. Louie, K. & Wilson, M. A. Temporally structured replay of awake hippocampalensemble activity during rapid eye movement sleep. Neuron 29, 145–156 (2001).
21. Lee, A. K. & Wilson, M. A. Memory of sequential experience in the hippocampusduring slow wave sleep. Neuron 36, 1183–1194 (2002).
22. Foster, D. J. & Wilson, M. A. Reverse replay of behavioural sequences inhippocampal place cells during the awake state. Nature 440, 680–683 (2006).
23. Davidson, T. J., Kloosterman, F. & Wilson, M. A. Hippocampal replay of extendedexperience. Neuron 63, 497–507 (2009).
24. Diba, K. & Buzsaki, G. Forward and reverse hippocampal place-cell sequencesduring ripples. Nature Neurosci. 10, 1241–1242 (2007).
25. Karlsson, M. P. & Frank, L. M. Awake replay of remote experiences in thehippocampus. Nature Neurosci. 12, 913–918 (2009).
26. Gupta, A. S., van der Meer, M. A., Touretzky, D. S. & Redish, A. D. Hippocampalreplay is not a simple function of experience. Neuron 65, 695–705 (2010).
27. Steele, R. J. & Morris, R. G. Delay-dependent impairment of a matching-to-placetask with chronic and intrahippocampal infusion of the NMDA-antagonist D-AP5.Hippocampus 9, 118–136 (1999).
28. Olypher, A. V., Lansky, P. & Fenton, A. A. Properties of the extra-positional signal inhippocampal place cell discharge derived from the overdispersion in location-specific firing. Neuroscience 111, 553–566 (2002).
29. Kentros, C. G., Agnihotri, N. T., Streater, S., Hawkins, R. D. & Kandel, E. R. Increasedattention to spatial context increases both place field stability and spatial memory.Neuron 42, 283–295 (2004).
30. Eichenbaum, H., Otto, T. & Cohen, N. J. The hippocampus–what does it do? Behav.Neural Biol. 57, 2–36 (1992).
31. Foster, D. J., Morris, R. G. & Dayan, P. A model of hippocampally dependentnavigation, using the temporal difference learning rule. Hippocampus 10, 1–16(2000).
32. Schmitzer-Torbert, N., Jackson, J., Henze, D., Harris, K. & Redish, A. D. Quantitativemeasures of cluster quality for use in extracellular recordings. Neuroscience 131,1–11 (2005).
33. Csicsvari, J., O’Neill, J., Allen, K. & Senior, T. Place-selective firing contributes to thereverse-order reactivation ofCA1pyramidal cells during sharp waves inopen-fieldexploration. Eur. J. Neurosci. 26, 704–716 (2007).
34. Girardeau, G., Benchenane, K., Wiener, S. I., Buzsaki, G. & Zugaro, M. B. Selectivesuppression of hippocampal ripples impairs spatial memory. Nature Neurosci. 12,1222–1223 (2009).
35. Ego-Stengel, V. & Wilson, M. A. Disruption of ripple-associated hippocampalactivity during rest impairs spatial learning in the rat. Hippocampus 20, 1–10(2010).
36. Jadhav, S. P., Kemere, C., German, P. W. & Frank, L. M. Awake hippocampal sharp-wave ripples support spatial memory. Science 336, 1454–1458 (2012).
37. Jackson, J. & Redish, A. D. Network dynamics of hippocampal cell-assembliesresemble multiple spatial maps within single tasks. Hippocampus 17, 1209–1229(2007).
38. Buzsaki, G. Two-stage model of memory trace formation: a role for ‘‘noisy’’ brainstates. Neuroscience 31, 551–570 (1989).
39. Mehta, M. R., Lee, A. K. & Wilson, M. A. Role of experience and oscillations intransforming a rate code into a temporal code. Nature 417, 741–746 (2002).
40. Gerstner, W. & Abbott, L. F. Learning navigational maps through potentiation andmodulation of hippocampal place cells. J. Comput. Neurosci. 4, 79–94 (1997).
41. Poucet, B., Thinusblanc, C. & Chapuis, N. Route planning in cats, in relation to thevisibility of the goal. Anim. Behav. 31, 594–599 (1983).
42. Foster, D. & Dayan, P. Structure in the space of value functions. Mach. Learn. 49,325–346 (2002).
43. Sutton, R. S. in Neural Networks for Control (eds Miller, T., Sutton, R. S. & Werbos, P.)Ch. 8 (MIT Press, 1990).
44. Montague, P. R., Dayan, P. & Sejnowski, T. J. A framework for mesencephalicdopamine systems based on predictive Hebbian learning. J. Neurosci. 16,1936–1947 (1996).
45. Lansink, C. S., Goltstein, P. M., Lankelma, J. V., McNaughton, B. L. & Pennartz, C. M.Hippocampus leads ventral striatum in replay of place-reward information. PLoSBiol. 7, e1000173 (2009).
46. van der Meer, M. A., Johnson, A., Schmitzer-Torbert, N. C. & Redish, A. D. Tripledissociation of information processing in dorsal striatum, ventral striatum, andhippocampus on a learned spatial decision task. Neuron 67, 25–32 (2010).
47. Tulving, E. Episodic memory: from mind to brain. Annu. Rev. Psychol. 53, 1–25(2002).
48. Hassabis, D., Kumaran, D., Vann, S. D. & Maguire, E. A. Patients with hippocampalamnesia cannot imagine new experiences. Proc. Natl Acad. Sci. USA 104,1726–1731 (2007).
49. Buckner, R. L. The role of the hippocampus in prediction and imagination. Annu.Rev. Psychol. 61, 27–48 (2010).
50. Tolman, E. C. Purposive Behavior in Animals and Men (The Century Co., 1932).
Supplementary Information is available in the online version of the paper.
Acknowledgements This work was supported by the Alfred P. Sloan Foundation, TheBrain and Behavior Research Foundation (NARSAD Young Investigator Grant) and theNational Institutes of Health grant MH085823.
Author Contributions B.E.P. and D.J.F. designed the experiment and analyses, B.E.P.collected the data, B.E.P. and D.J.F. wrote the paper.
Author Information Reprints and permissions information is available atwww.nature.com/reprints. The authors declare no competing financial interests.Readers are welcome to comment on the online version of the paper. Correspondenceand requests for materials should be addressed to D.J.F. ([email protected]).
RESEARCH ARTICLE
6 | N A T U R E | V O L 0 0 0 | 0 0 M O N T H 2 0 1 3
Macmillan Publishers Limited. All rights reserved©2013

METHODSBehaviour and data acquisition. All procedures were approved by the JohnsHopkins University Animal Care and Use Committee and followed US NationalInstitutes of Health animal use guidelines. Behavioural training and in-sessionrecording took place from late afternoon to early evening (rats were housed on astandard, non-inverted, 12-h light cycle).
Adult male Long-Evans rats (10–20 weeks old, 450–550 g) were handled dailyand food-restricted to 85–90% of their free-feeding weight and then trained totraverse a 1.8-m linear track to receive a liquid chocolate-flavoured reward (200ml,Carnation) at either end. Rats were trained for the briefer of 20 min or 20 completelaps once per day for at least 10 consecutive days. Linear track training occurred ina room separate and visually distinct from the recording room.
After a rat achieved criterion performance on the linear track (three con-secutive days with 20 laps in under 20 min), training on the open field wasinitiated in a 2 m 3 2 m black arena with 30-cm-high walls and 36 identical,evenly spaced, 1.5-cm-diameter, 3-mm-deep conical reward delivery wellsembedded into the floor such that the rim of each well was level with the floor(Fig. 1a). Each well was attached to a tubing system that ran beneath the environ-ment, which allowed any well to be independently and soundlessly filled oremptied by the experimenter via a hand-held syringe. During the filling of a well,no obvious visible or audible cue was available to the rat signifying that a well hadbeen filled. When active, wells were filled with 300ml of chocolate milk. Open-field training took place in the recording room with all room and environmentalcues positioned as they would be during the eventual in-session recording.
Open-field training proceeded in four stages. First, each rat underwent one 30-min-long session per day for 2 days in which every available well was filled (andimmediately refilled following consumption) and food crumbs were scatteredthroughout the arena to encourage initial exploration. This was the only stageof training in which non-liquid food was present in the arena. In the second stageof training (3 days), each 30-min-long session began with four filled wells, one perquadrant of the arena. When the reward in one quadrant was consumed, anotherrandom well in that quadrant was filled, but only after the rat had left the quad-rant and consumed reward from another quadrant. In the third stage (3 days), thefinal experimental procedure (see below) was begun except that on the interleavedRandom trials, two randomly selected wells were filled to make the task easier tocomplete. When one Random well was discovered and consumed, the second wasimmediately emptied and the Home well was filled. Finally, on the fourth stage,the rats were trained on the final experimental protocol for the lesser of thirtyminutes or for 30 trials until they reached criterion performance (30 trials in lessthan 30 min for three consecutive days). Every session began by placing the rat inone corner of the arena and then allowing free exploration.
In the final experimental protocol, the Home well was initially filled and wasthe only filled well in the arena at the start of the session. Once the rat discoveredand consumed the Home well reward, a randomly selected well was filled. Onlyafter the rat discovered and consumed the Random well reward was the Homewell again filled. A trial consisted of the rat leaving the Home location, discoveringand consuming the reward at a Random well and then returning to the Homelocation and consuming the reward there. At no point in the training were the ratsprovided with any cue informing them when the Home or a Random well wasfilled (filling occurred during or immediately after consumption at the prior well).Instead, the rats learned to return to the Home well location without cue afterconsuming the reward at a filled Random well and to begin searching for aRandom well immediately after consuming the reward at Home. The Home welllocation changed every session, but was constant throughout the session. Thelocation of the Home well on the recording days had never previously beenexperienced by the rats as a Home well location, although they had sporadicallyreceived reward in those locations as Random wells in previous sessions.
After a rat achieved criterion performance on the task, it was surgicallyimplanted with a microdrive array (25–30 g) containing 40 independently adjust-able, gold-plated tetrodes aimed at area CA1 of dorsal hippocampus (20 tetrodesin each hemisphere; 4.00 mm posterior and 2.85 mm lateral to bregma).Following surgical implantation, tetrodes were slowly lowered into the CA1pyramidal layer over the course of 7–10 days. Final tetrode placement and unitrecording were as previously described22. Each tetrode consisted of a twistedbundle of four 17.8mm platinum/10% iridium wires (Neuralynx), and each wirewas electroplated with gold to an impedance of ,150 MV before surgery. A bonescrew firmly attached to the skull served as ground. During the first 4 or 5 daysfollowing implantation, the rat was not re-exposed to the experimental arena.After this recovery time, while tetrodes were still being advanced to the hip-pocampus, the rat was trained once per day on the final experimental protocolfor the lesser of 30 min or 30 trials to familiarize it with navigating the arena withthe microdrive and attached wires.
All data were collected using a Neuralynx data acquisition system and anoverhead video system that recorded continuously at 60 Hz. The rat’s positionand head direction were determined via two distinctly coloured, head-mountedLEDs. Analogue neural signals were digitized at 32,556 Hz. Spike threshold cross-ings (50 mV) were recorded at 32,556 Hz. Continuous local field potential datawere digitally filtered between 0.1 and 500 Hz and recorded at 3,255.6 Hz. Thebeginning and end of reward consumption were manually determined from thecaptured video data.Cluster analysis. Individual units were identified by manual clustering based onspike waveform peak amplitudes using custom software (xclust2, M. A. Wilson).Only well-isolated units were included in the analysis. Modified Lratio values32
were calculated for each cluster to confirm cluster quality using the peak ampli-tude of each waveform as the feature set. Briefly, the Lratio value of cluster C is
Lratio~Xi=[C
1{CDFx2df
D2i,C
� �� �0@
1A=ns
where ns is the total number of spikes recorded on the tetrode throughout theexperiment, i 6[C is the set of spikes which are not members of cluster C, D2
i,C is theMahalanobis distance of spike i from cluster C, and CDFx2
dfis the cumulative
distribution function of the x2 distribution with df 5 4. We modified the originalequation for Lratio to allow for comparison between tetrodes with different num-bers of spikes and between experiments of varying time spans. As the originalequation is a sum, even well-isolated clusters will necessarily have larger Lratio
values for particularly long experimental sessions or if they occur on tetrodes withlarge numbers of spikes. Thus, we normalized the sum by the total number ofspikes recorded on the tetrode.
Clustered units that may correspond to putative inhibitory neurons wereexcluded on the basis of spike width and mean firing rate. To ensure accuratedecoding of hippocampal events, only rats in which we obtained at least 100simultaneously recorded place units were used for subsequent analysis.Decoding spatial location. Position was binned (2 cm) and position tuningcurves (place fields) were calculated as the smoothed (Gaussian kernel, standarddeviation of 4 cm) histogram of firing activity normalized by the time spent perbin. Only periods of time when the rat was moving faster than 5 cm s21 were usedto determine place fields. Units were considered to have a place field if the unitwas classified as excitatory and the peak of the tuning curve was .1 Hz.
A memoryless probability-based decoding algorithm23 was used to estimate therat’s position throughout the experiment based on the unit position tuning curvesand the spike trains. Briefly, the probability of the animal’s position (pos) across Mtotal position bins given a time window (t) containing neural spiking (spikes) is
Pr (posjspikes)~|=XM
j~1
|
where
|~ PN
i~1fi posð Þni
� �e{tPN
i~1
fi posð Þ
and fi(pos) is the position tuning curve of the i-th unit, assuming independent ratesand Poisson firing statistics for all N units and a uniform prior over position. Atime window of 250 ms was used to estimate the rat’s position on a behaviouraltimescale. A time window of 20 ms was used to estimate position during candi-date population events.Sequential event analysis. A histogram (1-ms bins) of all clustered units for timeswhen the rat’s velocity was less than 5 cm s21 was smoothed (Gaussian kernel,standard deviation of 10 ms). Population events were defined as peaks in thesmoothed histogram greater than the mean 1 3 standard deviations. Start andend boundaries for each population event were defined as the points where thesmoothed histogram crossed the mean. To prevent estimation artefacts, the timewindow boundaries for each candidate event were adjusted inward (if necessary)to ensure that the first and last estimation bins contained a minimum of 2 spikes.Candidate events in which fewer than 10% of the clustered units participated orwith boundaries less than 50 ms or greater than 2,000 ms apart were excludedfrom analysis.
For each candidate event, the rat’s position was estimated using the probabil-ity-based decoding algorithm described above with a 20-ms time window,advanced in 5-ms increments throughout the putative event. Following positionestimation, each candidate replay event was truncated to the longest sequence oftime frames with peak posterior probability less than 20 cm from that of theprevious frame. Candidate events with fewer than 10 steps in the final sequenceor a start-to-end distance less than 40 cm were eliminated from future ana-lysis. The remaining candidate events were categorized as ‘trajectory events’.
ARTICLE RESEARCH
Macmillan Publishers Limited. All rights reserved©2013

For trajectory event quantification, the posterior probabilities for every timeframe of each trajectory event were summed across time. For comparisonbetween away-events and home-events, these sums were normalized for thenumber of time-frames in each event. For all analyses requiring per-well quan-tification, the arena was subdivided by drawing an imaginary line equidistantbetween each well, resulting in 36 regions, each encompassing an approximately33 3 33 cm area (Supplementary Fig. 4). Quantification for all event trajectoryanalysis in which the rat’s location was not specifically examined did not includethe area within 15 cm of the rat’s physical location at the time of the event toavoid initiation bias.
For all trajectory events, a Monte-Carlo P-value was calculated using twoshuffle methods: randomly shuffling cell identity and randomly shuffling eachcell’s place field in both the x and y dimensions. The P-value was calculated as(n 1 1)/(r 1 1), where n is the number of shuffles that met the criteria to beclassified as a trajectory event and r is the total number of shuffles. 5,000 shuffleswere used for both methods. All candidate events that met our criteria to beclassified as trajectory events had a P-value less than 0.02 for both shuffle methods.
To quantify the precise spatial correlation between trajectory events and therat’s future/past path, each trajectory event was transformed into a vector of thepeak posterior probabilities for each time frame of the event. Using the rat’sphysical location at the time of the event as the centre, concentric rings weredrawn around the rat with radial increments of 2 cm, starting with a radius of15 cm. For each ring, the first crossing for the event vector and the rat’s future orpast path were determined and the angular displacement (the minor arc along the
ring’s circumference, normalized by the ring’s radius) was calculated betweenthese points. This value was compared to that obtained from 2,000 randomlyselected events (chosen from across all sessions) which were spatially relocated sothat the rat’s physical location at the time of the random event matched the rat’sphysical location at the time of the trajectory event to generate a Monte-CarloP-value.Local field potential analysis. For each tetrode, one representative electrode wasselected and the local field potential signal was analysed. To examine SWRs, thelocal field potential was band-pass filtered between 150 and 250 Hz, and theabsolute value of the Hilbert transform of this filtered signal was then smoothed(Gaussian kernel, s.d. 5 12.5 ms). This processed signal was averaged across alltetrodes and ripple events were identified as local peaks with an amplitude greaterthan 3 s.d. above the mean, using only periods when the rat’s velocity was less than5 cm s21. The start and end boundaries for each event were defined as the pointwhen the signal crossed the mean. For theta-band power analysis, the raw localfield potential trace was band-pass filtered between 4 and 12 Hz and the absolutevalue of the Hilbert transform of the filtered signal was calculated. The z-scoretheta power for each electrode was determined for every time point of the 60 Hzposition data and for 100–200 ms before and after each identified trajectory event.For power spectral density analysis, 100 ms non-overlapping temporal bins wereused to compute the spectrograms. A z-score was calculated for each frequencyband across the entire behavioural session. The SWR or trajectory event triggeredspectrograms use the peak of the ripple power or the peak of the spike density,respectively, as time zero.
RESEARCH ARTICLE
Macmillan Publishers Limited. All rights reserved©2013