hispanic millennial project - opinions on food & beverages
TRANSCRIPT

The Hispanic Millennial ProjectWave 4: Food, Beverage & Alcohol
2
Overview
• Introduction
• Hispanic Millennial Project Overview
• HMP Wave 4 Overview
• 8 Key Themes
• Comparing Multicultural Millennials
• Points of Tension
• Implications for Marketers
• What’s Next

3
Roy Eduardo Kokoyachuk
Partner
ThinkNow Research
@ThinkNowTweets
thinknowresearch.com/blog
Roy Eduardo Kokoyachuk
4
The Hispanic Millennial Project is a joint research study developed by integrated cross-cultural
advertising agency Sensis and market research firm ThinkNow Research.
5
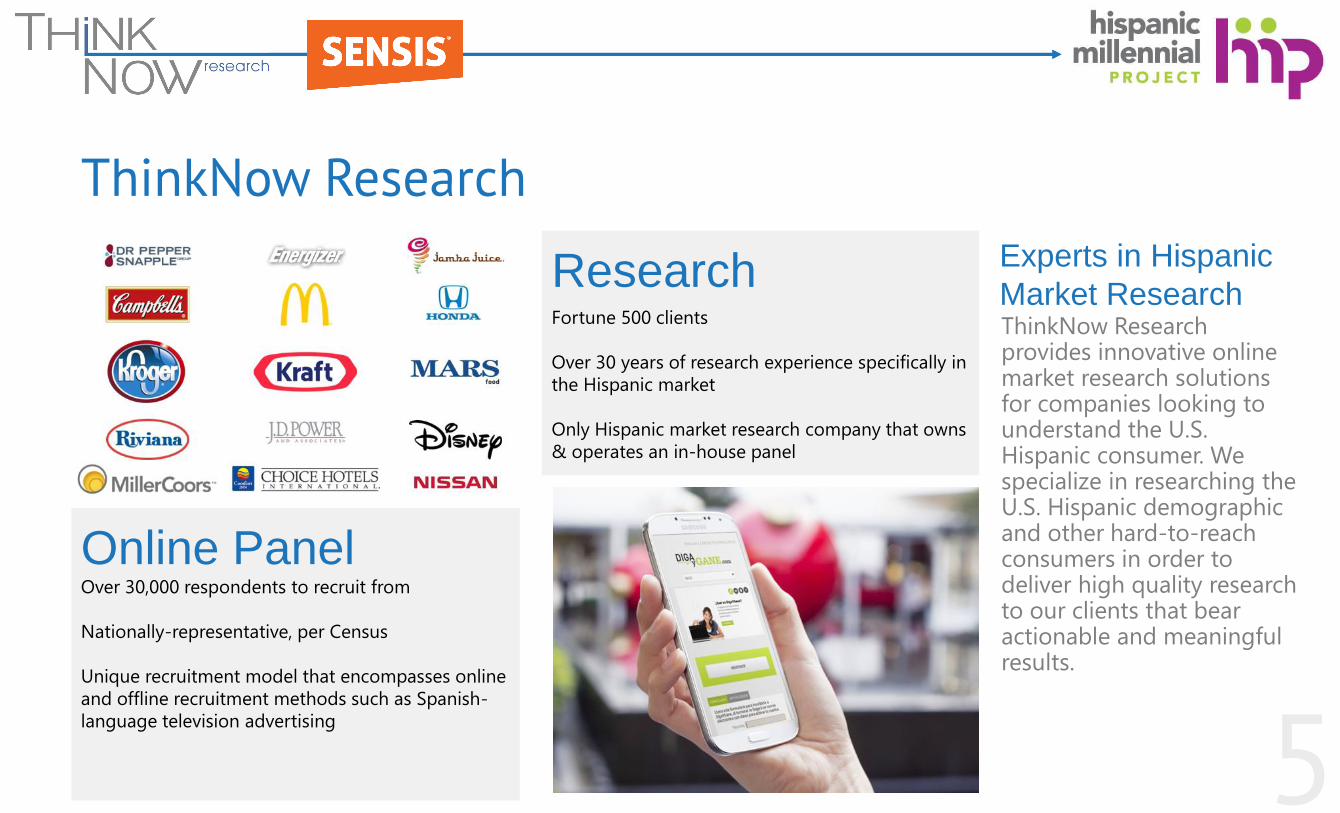
Online PanelOver 30,000 respondents to recruit from
Nationally-representative, per Census
Unique recruitment model that encompasses online
and offline recruitment methods such as Spanish-
language television advertising
ThinkNow Research
ResearchFortune 500 clients
Over 30 years of research experience specifically in
the Hispanic market
Only Hispanic market research company that owns
& operates an in-house panel
Experts in Hispanic
Market ResearchThinkNow Research provides innovative online market research solutions for companies looking to understand the U.S. Hispanic consumer. We specialize in researching the U.S. Hispanic demographic and other hard-to-reach consumers in order to deliver high quality research to our clients that bear actionable and meaningful results.

6
BACKGROUND
• Advertising & digital agency
• 13 million in revenue (2014)
• 17 years in business
• Independent, minority-owned
and certified (SCMBDC, SBA)
• Offices in L.A. , DC, Austin,
Atlanta
CAPABILITIES
• Research & Analytics
• Strategic Planning
• Media Planning & Buying
• Creative Development
• Branding & Package Design
• Digital & Multicultural Marketing
• Mobile & Website Development
Integrated cross-cultural advertising agency
7
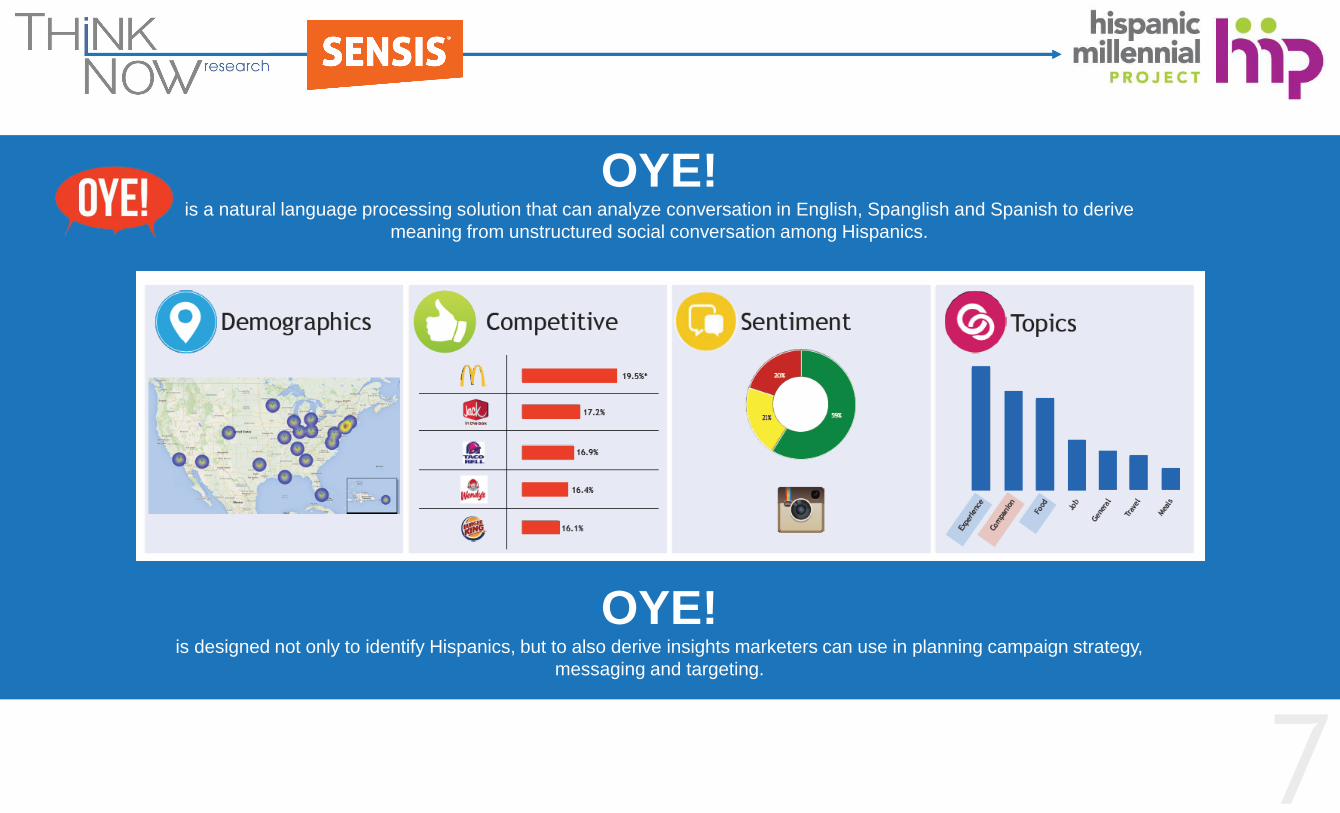
OYE! is a natural language processing solution that can analyze conversation in English, Spanglish and Spanish to derive
meaning from unstructured social conversation among Hispanics.
OYE!is designed not only to identify Hispanics, but to also derive insights marketers can use in planning campaign strategy,
messaging and targeting.

8
The Hispanic Millennial Project
• Innovative research initiative on U.S. Hispanic Millennials
• Designed to compare Hispanic Millennials to non-Hispanic Millennials as well as their older Hispanic (35+) counterparts
• Digs deeper into points of tension, segmentation, and difference between U.S.-born vs. foreign born.
www.HispanicMillennialProject.com

9
Hispanic Millennial ProjectWave 4: Food, Beverage and Alcohol
• The initial wave established a deeper understanding of Hispanic Millennials and highlighted meaningful differences between this group and other cohorts.
• The 2nd wave focused on healthcare, and explored attitudes and behaviors associated with health, diet, and exercise, as well as health-related technology, insurance, and the Affordable Care Act.
• This 3rd wave explores attitudes and opinions among Hispanic Millennials about money, saving, financial well-being, and banking.
• This 4th wave explores both the cultural impact and shopping behavior associated with food, beverage, and alcohol consumption.
10
Wave 4 research also surveyed
African-American and Asian Millennials
We’ve Expanded the Hispanic Millennial Project

11
Why Hispanic Millennials?
12
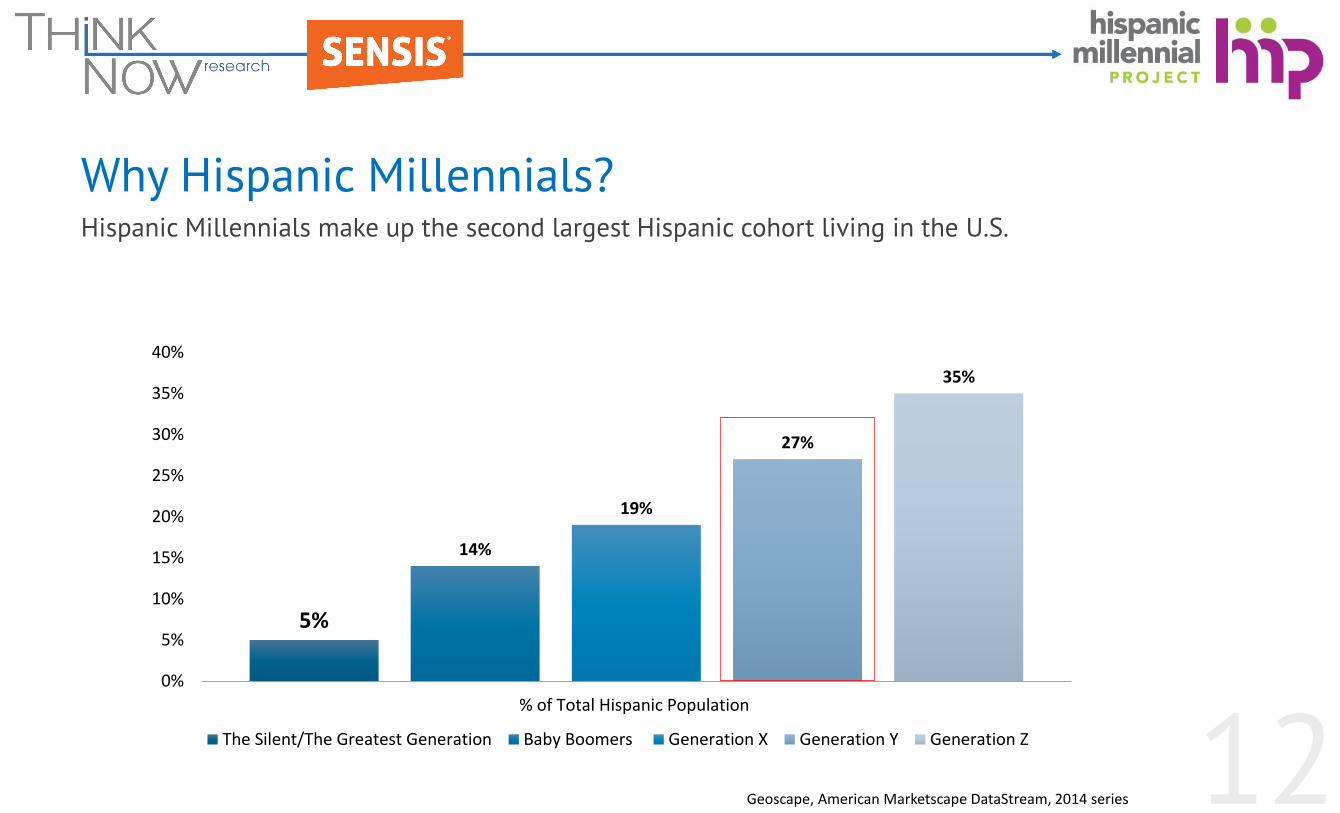
Why Hispanic Millennials?Hispanic Millennials make up the second largest Hispanic cohort living in the U.S.
5%
14%
19%
27%
35%
0%
5%
10%
15%
20%
25%
30%
35%
40%
% of Total Hispanic Population
The Silent/The Greatest Generation Baby Boomers Generation X Generation Y Generation Z
Geoscape, American Marketscape DataStream, 2014 series
13
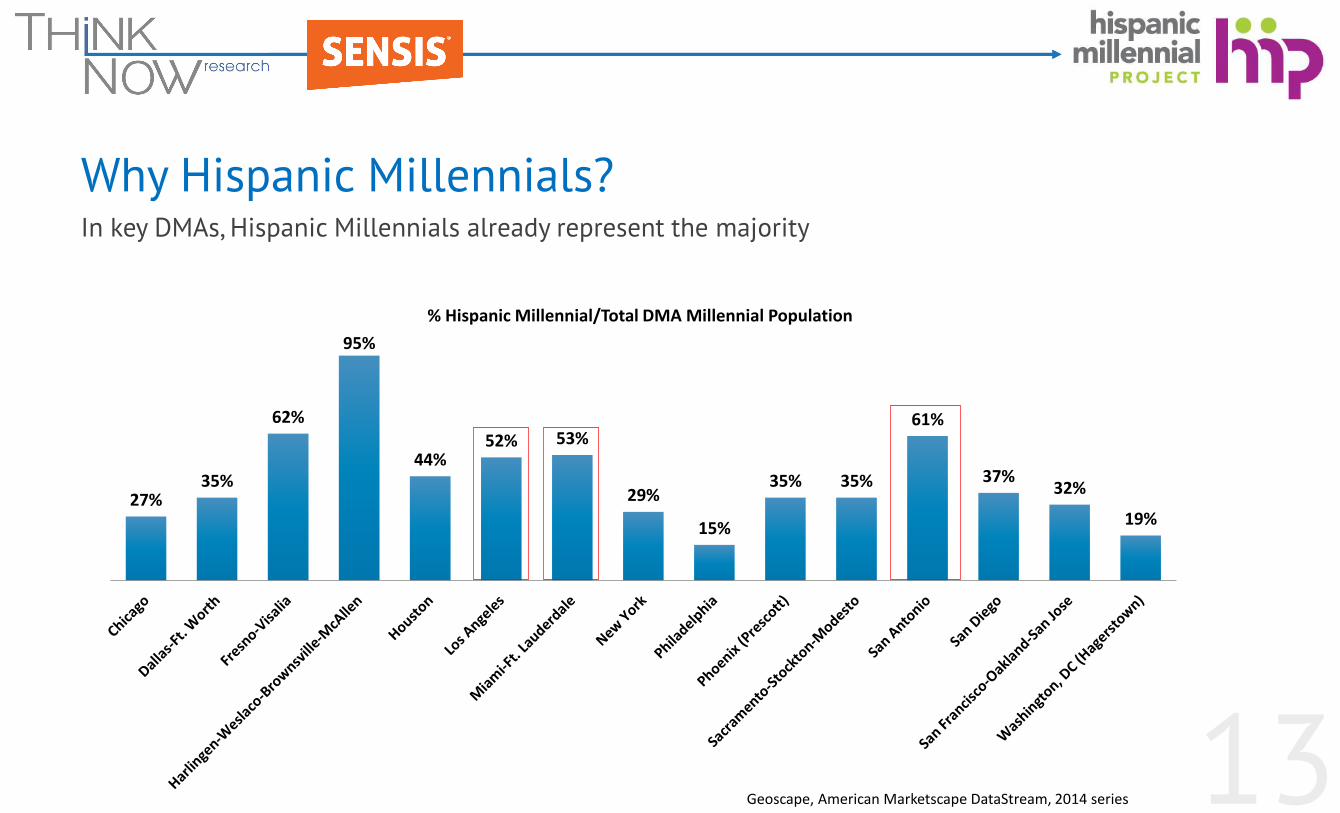
Why Hispanic Millennials?In key DMAs, Hispanic Millennials already represent the majority
27%35%
62%
95%
44%52% 53%
29%
15%
35% 35%
61%
37%32%
19%
Geoscape, American Marketscape DataStream, 2014 series
% Hispanic Millennial/Total DMA Millennial Population

14
Why Hispanic Millennials?Non-traditional markets will witness the fastest Hispanic Millennial growth
22%
23%
23%
23%
24%
25%
25%
25%
25%
26%
27%
28%
29%
33%
33%
0% 5% 10% 15% 20% 25% 30% 35%
Myrtle Beach-Florence
Greensboro-High Point-Winston Salem
Minot-Bismarck-Dickinson (Williston)
Memphis
Atlanta
Salisbury
Greenville-Spartanburg-Asheville-Anderson
Indianapolis
Lexington
Charleston, SC
Nashville
Wilmington
Raleigh-Durham (Fayetteville)
Charlotte
Bend, OR
% Change
DMA/Hispanic Millennial % change (2014-2019)
Geoscape, 2014-2019 American Marketscape DataStream
15
And, 40% of Hispanic Millennials are foreign-born!
Source: Experian Simmons, Hispanics (18-34) Fall 2014 NHCS Adult Study 12-month, 2014 Series
16
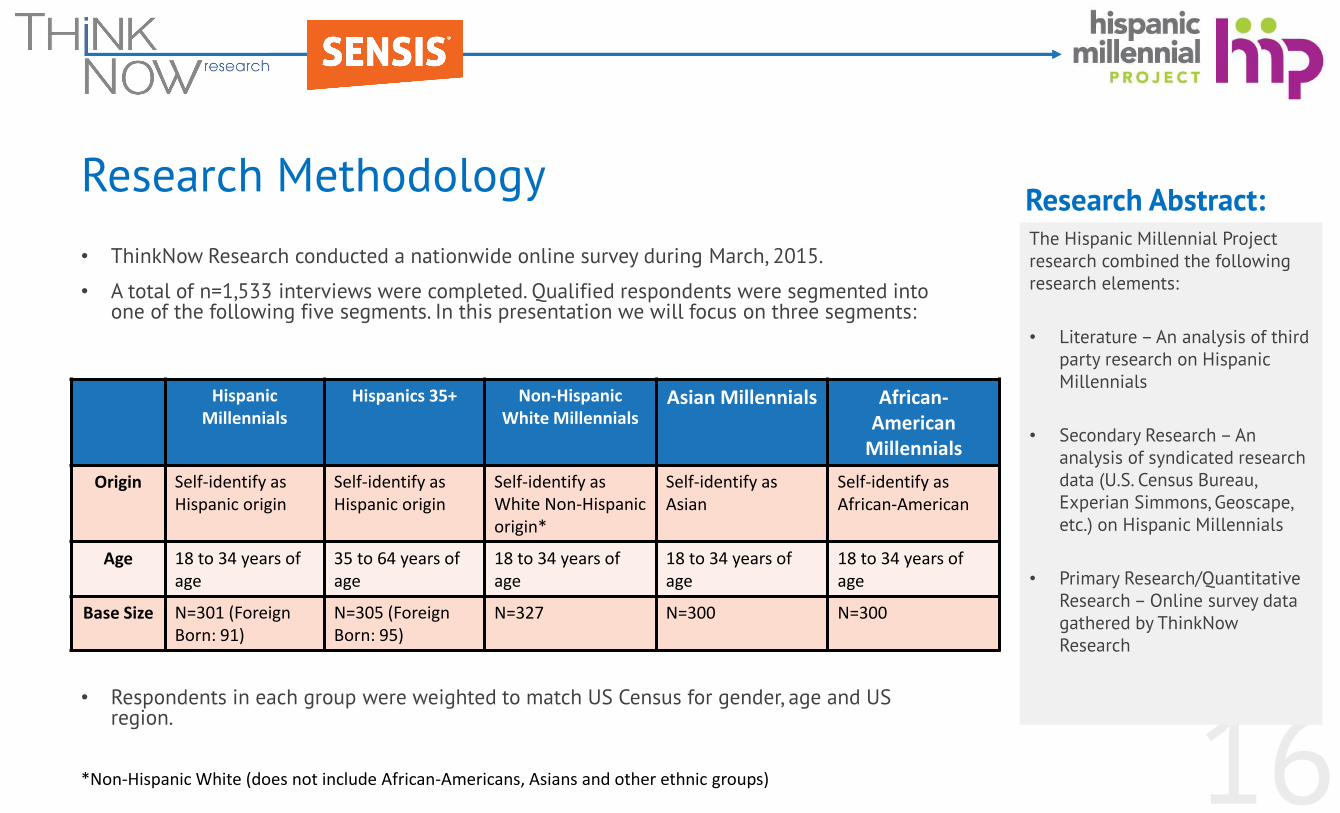
Research Methodology
• ThinkNow Research conducted a nationwide online survey during March, 2015.
• A total of n=1,533 interviews were completed. Qualified respondents were segmented into one of the following five segments. In this presentation we will focus on three segments:
• Respondents in each group were weighted to match US Census for gender, age and US region.
Hispanic Millennials
Hispanics 35+ Non-Hispanic White Millennials
Asian Millennials African-American
Millennials
Origin Self-identify as Hispanic origin
Self-identify as Hispanic origin
Self-identify as White Non-Hispanicorigin*
Self-identify as Asian
Self-identify as African-American
Age 18 to 34 years of age
35 to 64 years of age
18 to 34 years of age
18 to 34 years of age
18 to 34 years of age
Base Size N=301 (Foreign Born: 91)
N=305 (Foreign Born: 95)
N=327 N=300 N=300
The Hispanic Millennial Project research combined the following research elements:
• Literature – An analysis of third party research on Hispanic Millennials
• Secondary Research – An analysis of syndicated research data (U.S. Census Bureau, Experian Simmons, Geoscape, etc.) on Hispanic Millennials
• Primary Research/Quantitative Research – Online survey data gathered by ThinkNow Research
Research Abstract:
*Non-Hispanic White (does not include African-Americans, Asians and other ethnic groups)

17
HMP Wave 4 Overview
18
Eight Themes: Key Findings

19
• U.S. Born Hispanic Millennials use food and beverage as a means of connecting to their cultural roots.
• Hispanic Millennials that are Foreign-born consume mass market food and beverages because they are seeking assimilation into mainstream culture.
• Hispanic Millennials prefer established brands to craft or artisanal brands.
• Hispanic Millennials are actively involved in grocery shopping yet less likely to conduct research or use coupons.
• Hispanic Millennials are heavy beer drinkers whose consumption is linked to culture and friendship.
• While vodka is the spirit of choice among all Millennials, Hispanic Millennials are equally drawn to tequila.
• Non-Hispanic White Millennials embrace ethnic flavors.
• All Multicultural Millennials are “Foodies”, with Hispanic Millennials leading the preference for whole foods.
Key Findings: 8 Key Themes
20
Theme 1: U.S. Born Hispanic Millennials use food and beverage as a means of
connecting to their cultural roots.
21
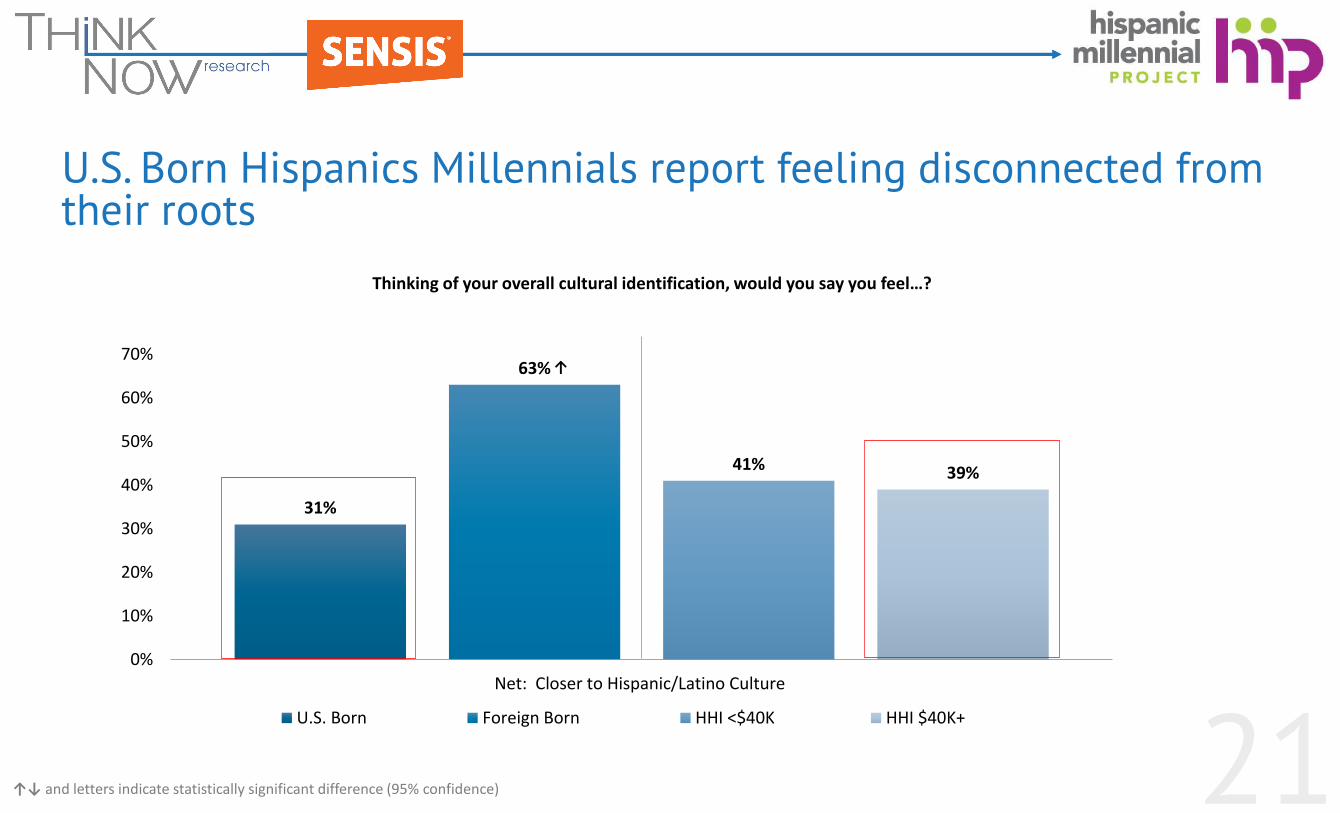
U.S. Born Hispanics Millennials report feeling disconnected from their roots
31%
63%
41% 39%
0%
10%
20%
30%
40%
50%
60%
70%
Net: Closer to Hispanic/Latino Culture
U.S. Born Foreign Born HHI <$40K HHI $40K+
Thinking of your overall cultural identification, would you say you feel…?
↑↓ and letters indicate statistically significant difference (95% confidence)
↑
22
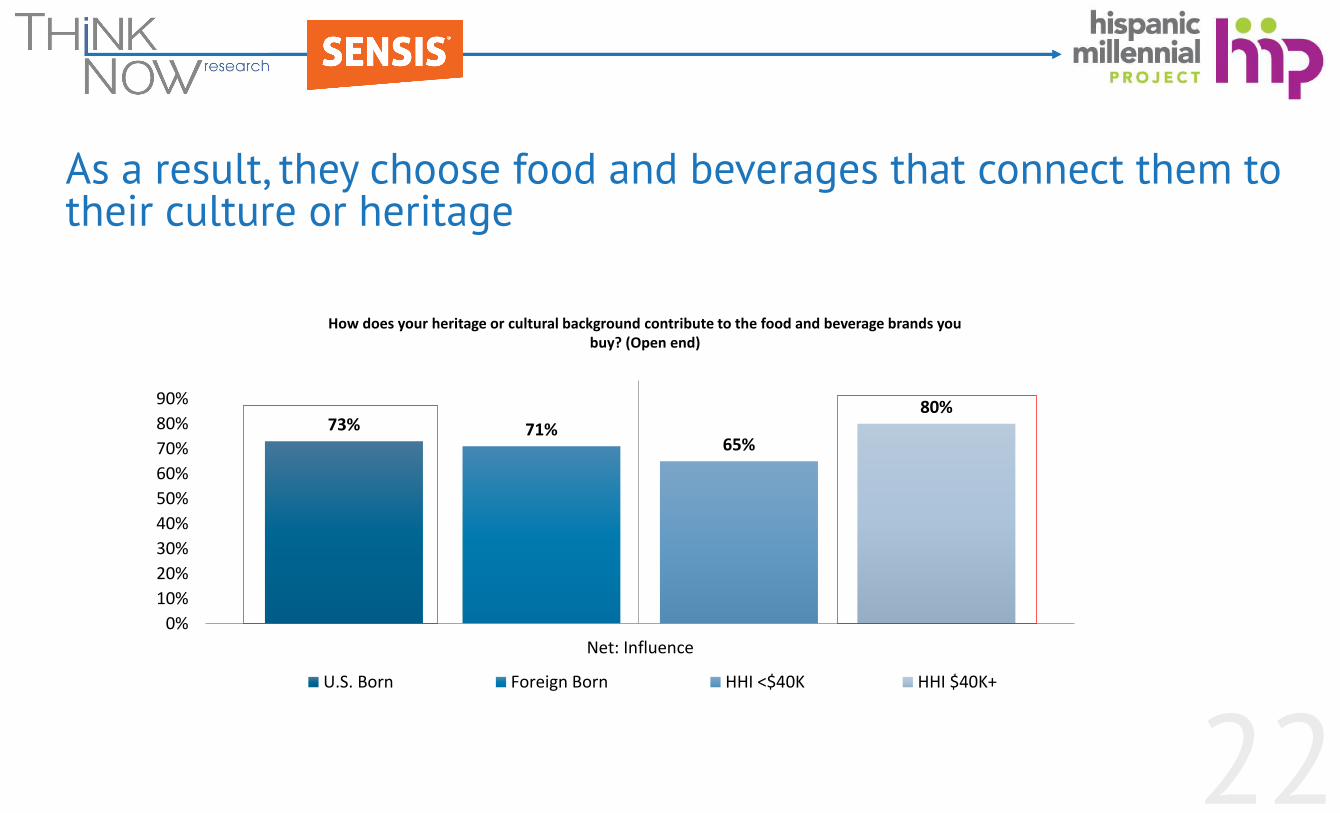
As a result, they choose food and beverages that connect them to their culture or heritage
73% 71%65%
80%
0%
10%
20%
30%
40%
50%
60%
70%
80%
90%
Net: Influence
U.S. Born Foreign Born HHI <$40K HHI $40K+
How does your heritage or cultural background contribute to the food and beverage brands you buy? (Open end)

23
This creates a strong connection between ethnic food and beverage consumption
56%
45% 46%
61%
0%
10%
20%
30%
40%
50%
60%
70%
I use/buy ethnic brands of food and beverages
U.S. Born Foreign Born HHI <$40K HHI $40K+
18% 16%13%
21%
0%
10%
20%
30%
40%
50%
60%
70%
Ethnic grocery store (Vallartas, Sedanos, King Ranch, etc.)
U.S. Born Foreign Born HHI <$40K HHI $40K+
Which types of stores do you and/or other members of your household usually buy groceries from?
Please select the point in the scale that describes how much you agree or disagree with each statement below.
Top 2 Box Agreement
↑↓ and letters indicate statistically significant difference (95% confidence)
↑
↑

24
Theme 2:Foreign-born Hispanic Millennials consume mass market food and
beverages because they are seeking assimilation into mainstream culture.
25
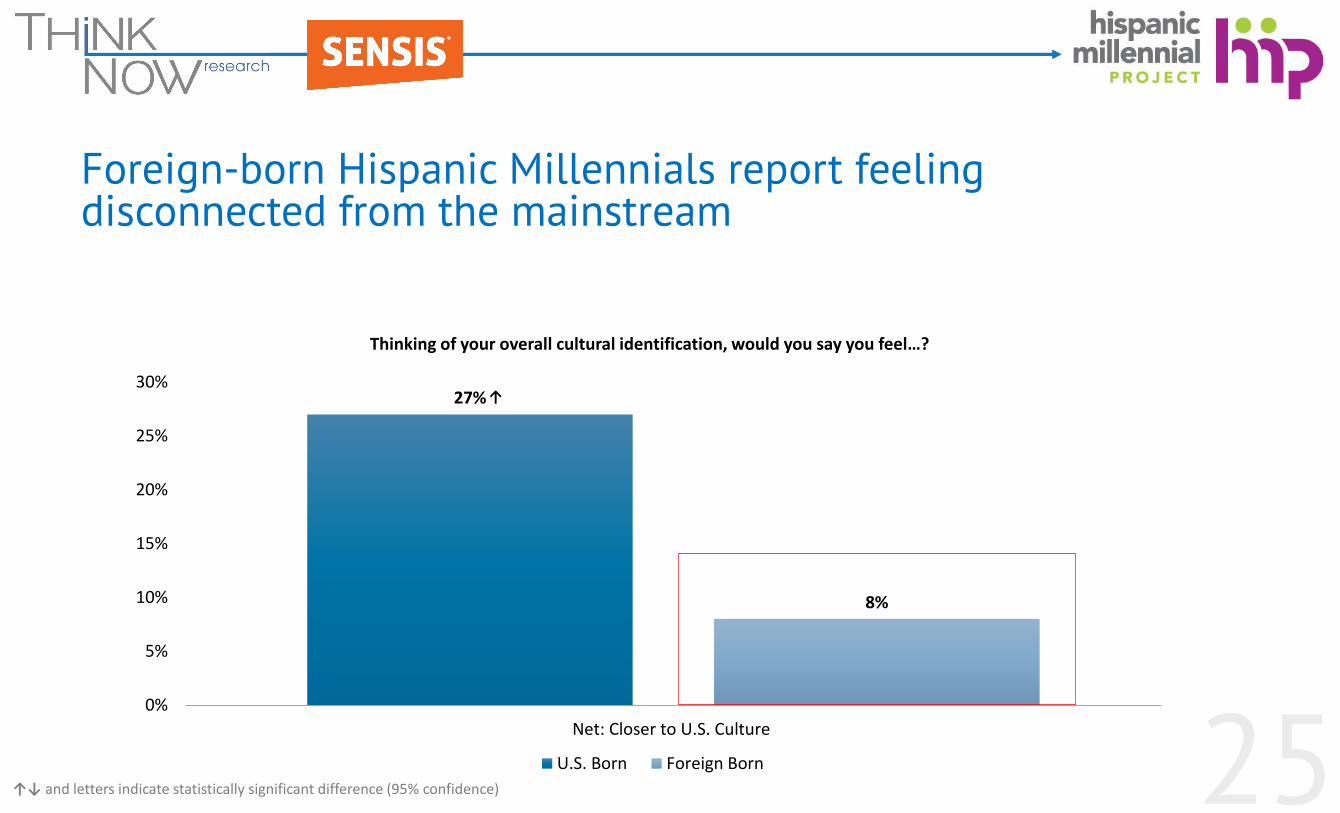
Foreign-born Hispanic Millennials report feeling disconnected from the mainstream
27%
8%
0%
5%
10%
15%
20%
25%
30%
Net: Closer to U.S. Culture
U.S. Born Foreign Born
Thinking of your overall cultural identification, would you say you feel…?
↑↓ and letters indicate statistically significant difference (95% confidence)
↑
26
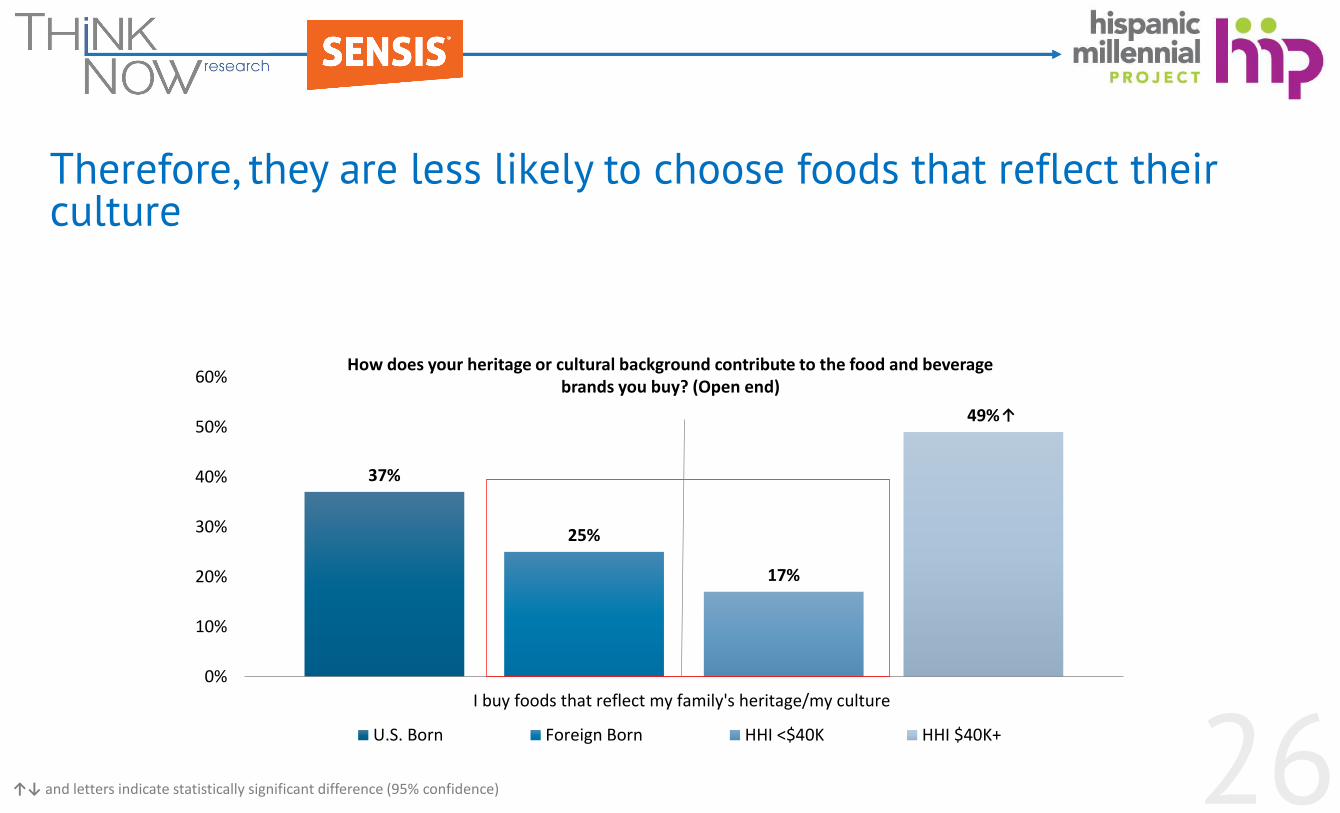
Therefore, they are less likely to choose foods that reflect their culture
37%
25%
17%
49%
0%
10%
20%
30%
40%
50%
60%
I buy foods that reflect my family's heritage/my culture
U.S. Born Foreign Born HHI <$40K HHI $40K+
How does your heritage or cultural background contribute to the food and beverage brands you buy? (Open end)
↑↓ and letters indicate statistically significant difference (95% confidence)
↑

27
They are also less likely to be influenced by their heritage when it comes to purchase
4%
15%
0%
2%
4%
6%
8%
10%
12%
14%
16%
Net: Not Influence
U.S. Born Foreign Born
How does your heritage or cultural background contribute to the food and beverage brands you buy? (Open end)

28
Theme 3:Hispanic Millennials prefer established brands to craft or
artisanal brands.
29
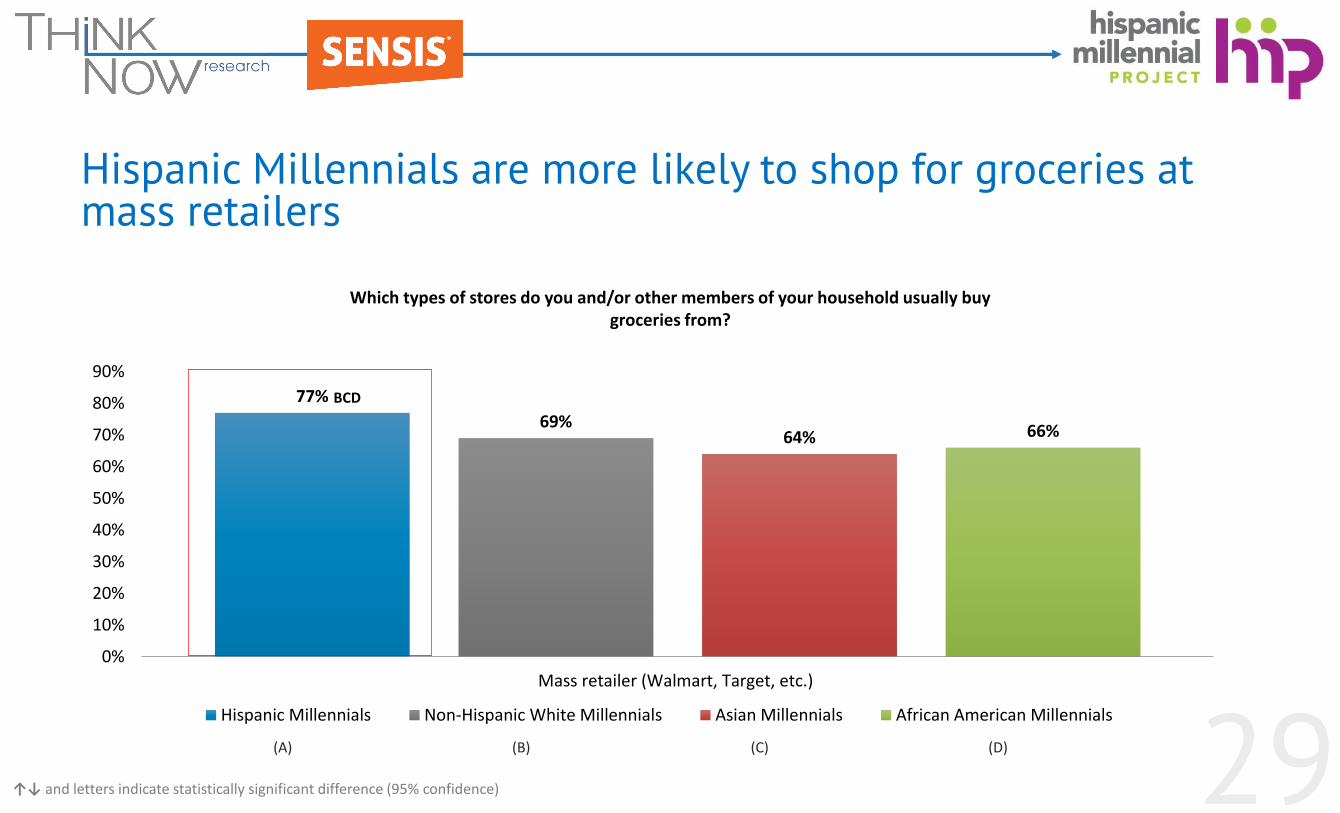
Hispanic Millennials are more likely to shop for groceries at mass retailers
77%
69%64% 66%
0%
10%
20%
30%
40%
50%
60%
70%
80%
90%
Mass retailer (Walmart, Target, etc.)
Hispanic Millennials Non-Hispanic White Millennials Asian Millennials African American Millennials
Which types of stores do you and/or other members of your household usually buy groceries from?
(A) (B) (C) (D)
↑↓ and letters indicate statistically significant difference (95% confidence)
BCD

30
Hispanic Millennials prefer established brands as much as other cohorts
46%44% 45%
50%
0%
10%
20%
30%
40%
50%
60%
Top 2 Box
Hispanic Millennials Non-Hispanic White Millennials Asian Millennials African American Millennials
When it comes to buying food and beverage products, I prefer large/national brands to smaller, more regional brands.
Only 2% of 5,400 Hispanic
conversations around food and
beverages contain mentions of major
brands.
31
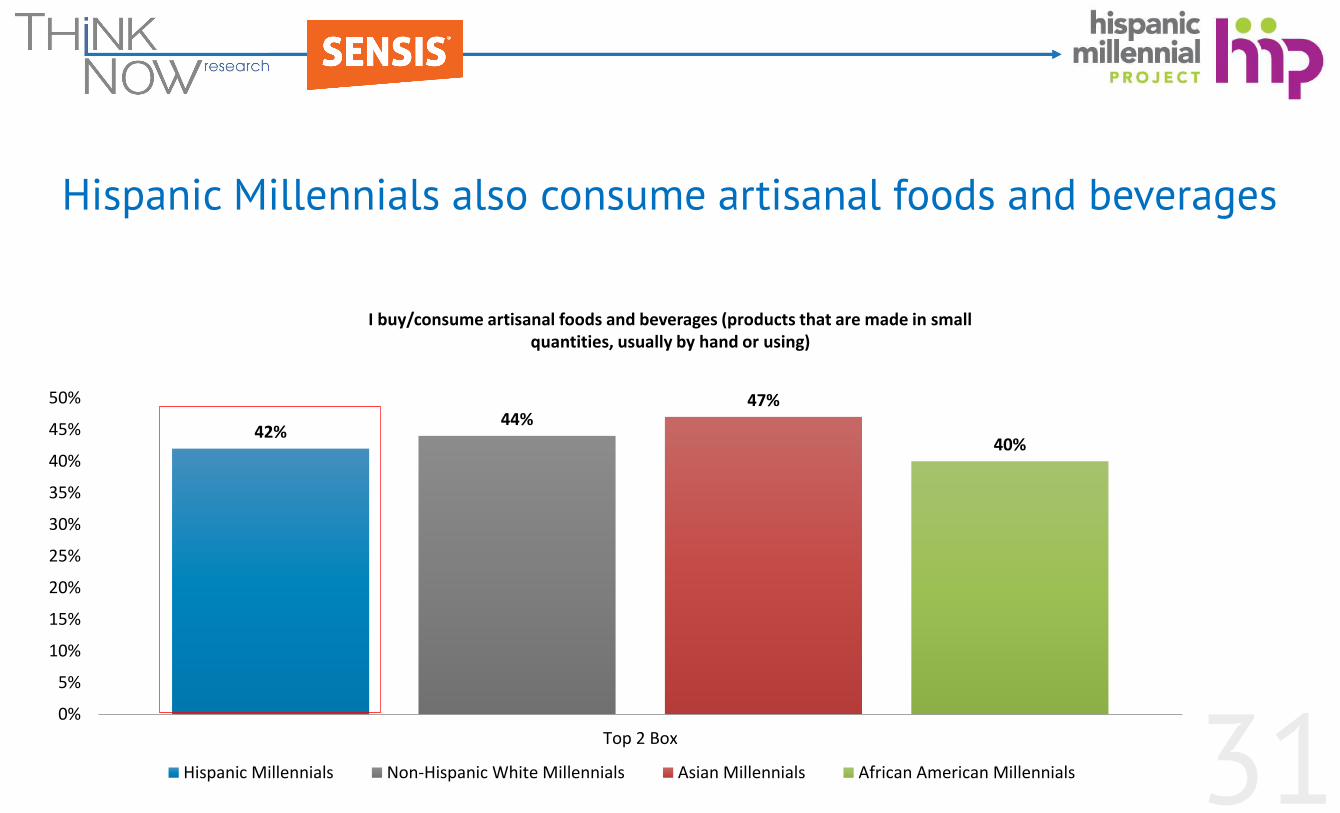
Hispanic Millennials also consume artisanal foods and beverages
42%44%
47%
40%
0%
5%
10%
15%
20%
25%
30%
35%
40%
45%
50%
Top 2 Box
Hispanic Millennials Non-Hispanic White Millennials Asian Millennials African American Millennials
I buy/consume artisanal foods and beverages (products that are made in small quantities, usually by hand or using)
32
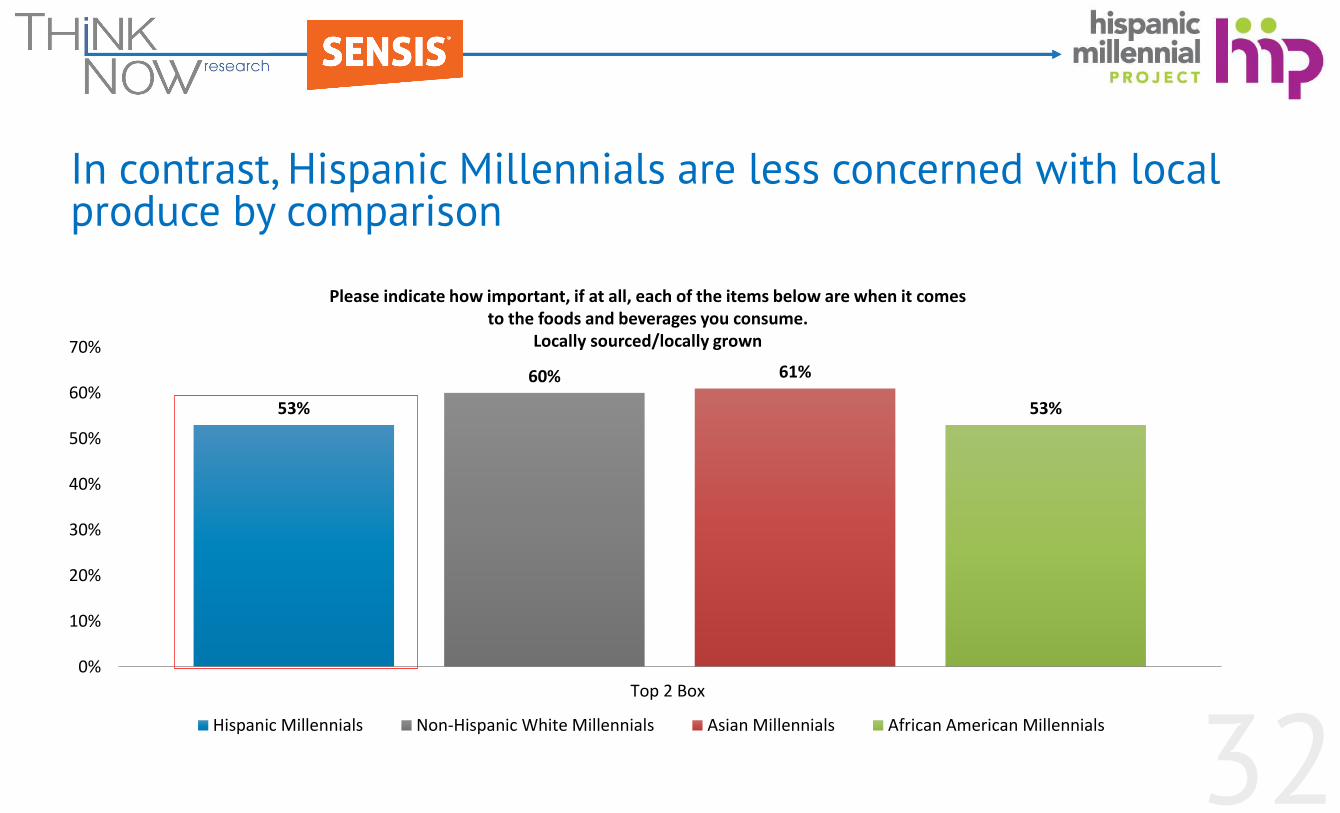
In contrast, Hispanic Millennials are less concerned with local produce by comparison
53%
60% 61%
53%
0%
10%
20%
30%
40%
50%
60%
70%
Top 2 Box
Hispanic Millennials Non-Hispanic White Millennials Asian Millennials African American Millennials
Please indicate how important, if at all, each of the items below are when it comes to the foods and beverages you consume.
Locally sourced/locally grown

33
Theme 4:Hispanic Millennials are actively involved in grocery shopping
yet less likely to conduct research or use coupons.

34
Hispanic Millennials shop independently
28%26%
29%
17%
0%
5%
10%
15%
20%
25%
30%
35%
Most of it
Hispanic Millennials Non-Hispanic White Millennials Asian Millennials African American Millennials
How much of your household’s grocery shopping do you do yourself?
35
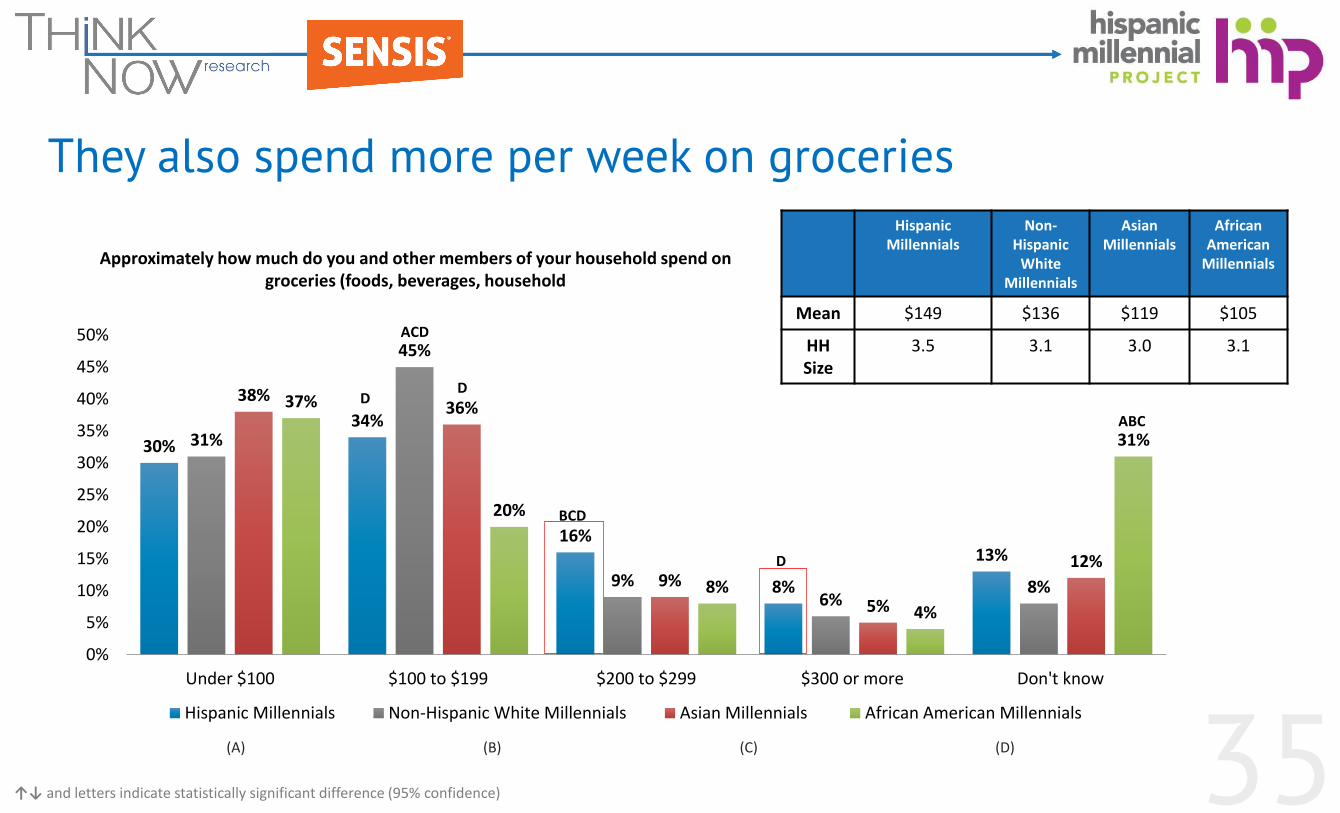
They also spend more per week on groceries
30%
34%
16%
8%
13%
31%
45%
9%6%
8%
38%36%
9%
5%
12%
37%
20%
8%
4%
31%
0%
5%
10%
15%
20%
25%
30%
35%
40%
45%
50%
Under $100 $100 to $199 $200 to $299 $300 or more Don't know
Hispanic Millennials Non-Hispanic White Millennials Asian Millennials African American Millennials
DD
ACD
BCD
D
ABC
Hispanic Millennials
Non-Hispanic
WhiteMillennials
Asian Millennials
African American
Millennials
Mean $149 $136 $119 $105
HH Size
3.5 3.1 3.0 3.1
Approximately how much do you and other members of your household spend on groceries (foods, beverages, household
↑↓ and letters indicate statistically significant difference (95% confidence)
(A) (B) (C) (D)

36
Yet, they are less likely to use coupons when shopping
26%
38%
34%
25%
0%
5%
10%
15%
20%
25%
30%
35%
40%
Top 2 Box
Hispanic Millennials Non-Hispanic White Millennials Asian Millennials African American Millennials
AD
D
How often, if at all, do you use coupons when shopping for groceries?
↑↓ and letters indicate statistically significant difference (95% confidence)
(A) (B) (C) (D)

37
And less likely to research deals in advance
50% 49%56%
50%57%
51%58%
55%61%
53%
64% 62%
49%43%
52%46%
0%
10%
20%
30%
40%
50%
60%
70%
Browse the store's website forspecials BEFORE shopping there
Compare prices on your mobilephone while at the store
Research specific productsonline BEFORE going shopping
Look up items (for productinformation/reviews) on yourmobile device while you are at
the store
Hispanic Millennials Non-Hispanic White Millennials Asian Millennials African American Millennials
How often do you do each of the following when it comes to grocery shopping?
↑↓ and letters indicate statistically significant difference (95% confidence)
(A) (B) (C) (D)
AD
D
D
DAD
38
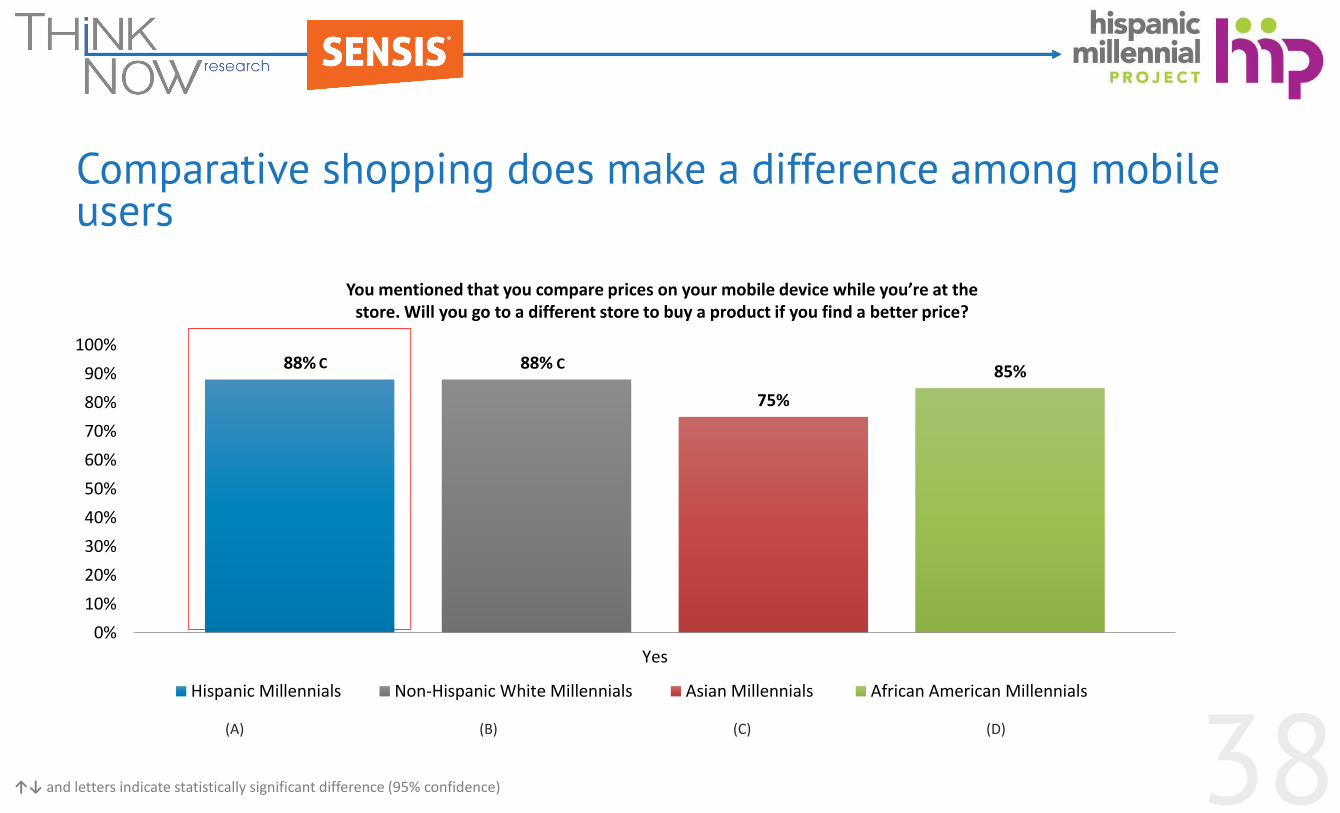
Comparative shopping does make a difference among mobile users
88% 88%
75%
85%
0%
10%
20%
30%
40%
50%
60%
70%
80%
90%
100%
Yes
Hispanic Millennials Non-Hispanic White Millennials Asian Millennials African American Millennials
You mentioned that you compare prices on your mobile device while you’re at the store. Will you go to a different store to buy a product if you find a better price?
(A) (B) (C) (D)
↑↓ and letters indicate statistically significant difference (95% confidence)
CC
39
Theme 5:Hispanic Millennials are heavy beer drinkers whose
consumption is linked to culture and friendship.
All responses in this section are 21+ Millennials
40
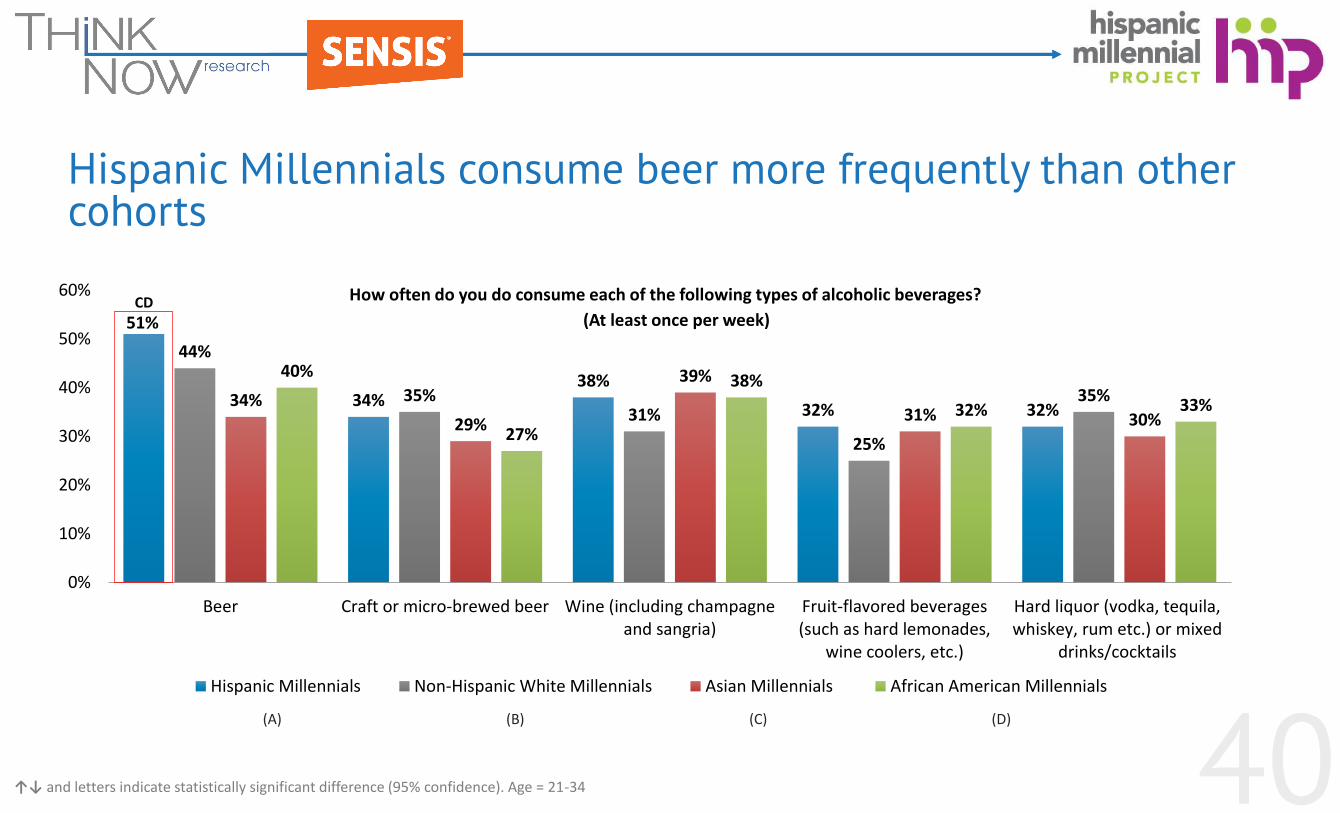
Hispanic Millennials consume beer more frequently than other cohorts
51%
34%38%
32% 32%
44%
35%31%
25%
35%34%
29%
39%
31% 30%
40%
27%
38%
32% 33%
0%
10%
20%
30%
40%
50%
60%
Beer Craft or micro-brewed beer Wine (including champagneand sangria)
Fruit-flavored beverages(such as hard lemonades,
wine coolers, etc.)
Hard liquor (vodka, tequila,whiskey, rum etc.) or mixed
drinks/cocktails
Hispanic Millennials Non-Hispanic White Millennials Asian Millennials African American Millennials
How often do you do consume each of the following types of alcoholic beverages?
(A) (B) (C) (D)
↑↓ and letters indicate statistically significant difference (95% confidence). Age = 21-34
CD(At least once per week)
41
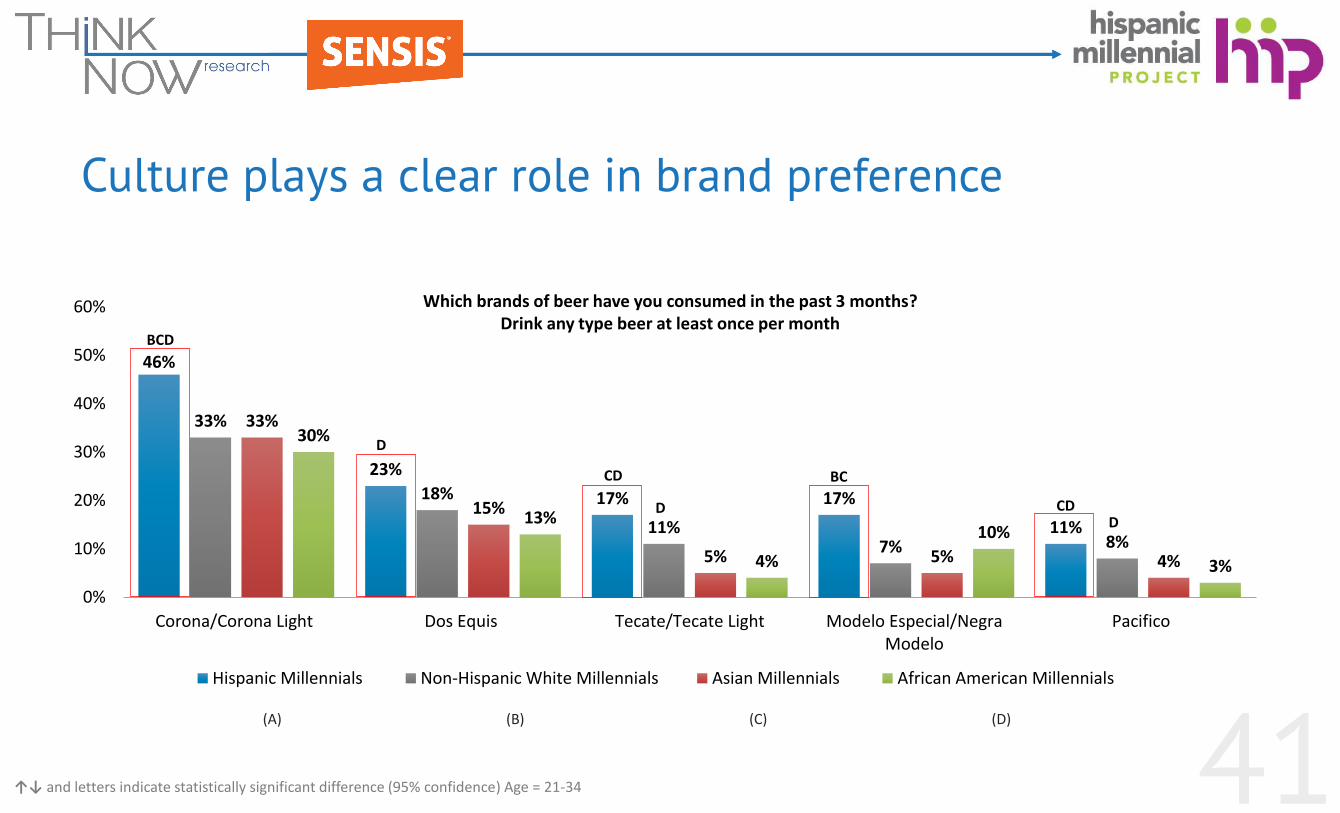
Culture plays a clear role in brand preference
46%
23%
17% 17%
11%
33%
18%
11%7% 8%
33%
15%
5% 5% 4%
30%
13%
4%
10%
3%
0%
10%
20%
30%
40%
50%
60%
Corona/Corona Light Dos Equis Tecate/Tecate Light Modelo Especial/NegraModelo
Pacifico
Hispanic Millennials Non-Hispanic White Millennials Asian Millennials African American Millennials
Which brands of beer have you consumed in the past 3 months?Drink any type beer at least once per month
(A) (B) (C) (D)
↑↓ and letters indicate statistically significant difference (95% confidence) Age = 21-34
BCD
D
CD
D
BC
CDD
42
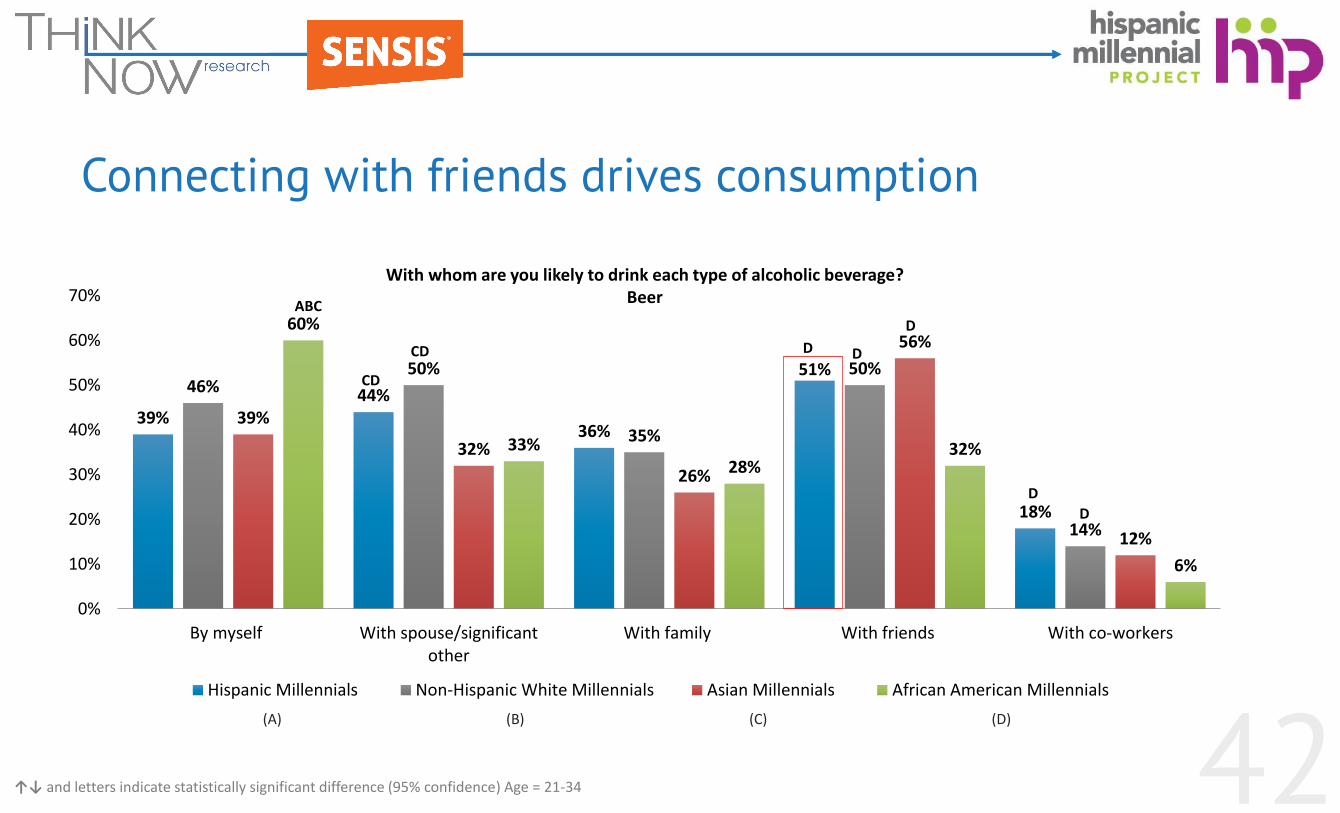
Connecting with friends drives consumption
39%44%
36%
51%
18%
46%50%
35%
50%
14%
39%
32%
26%
56%
12%
60%
33%28%
32%
6%
0%
10%
20%
30%
40%
50%
60%
70%
By myself With spouse/significantother
With family With friends With co-workers
Hispanic Millennials Non-Hispanic White Millennials Asian Millennials African American Millennials
With whom are you likely to drink each type of alcoholic beverage?Beer
(A) (B) (C) (D)
↑↓ and letters indicate statistically significant difference (95% confidence) Age = 21-34
ABC
CD
CD D D
D
D
D

43
Friends play an important role in how Hispanic Millennials discover new brands of alcohol
50% 50%53%
44%
0%
10%
20%
30%
40%
50%
60%
Friends
Hispanic Millennials Non-Hispanic White Millennials Asian Millennials African American Millennials
How do you find out about brands of alcohol?
Age = 21-34
44
Theme 6:While vodka is the spirit of choice among all Millennials,
Hispanic Millennials are equally drawn to tequila.
All responses in this section are 21+ Millennials
45
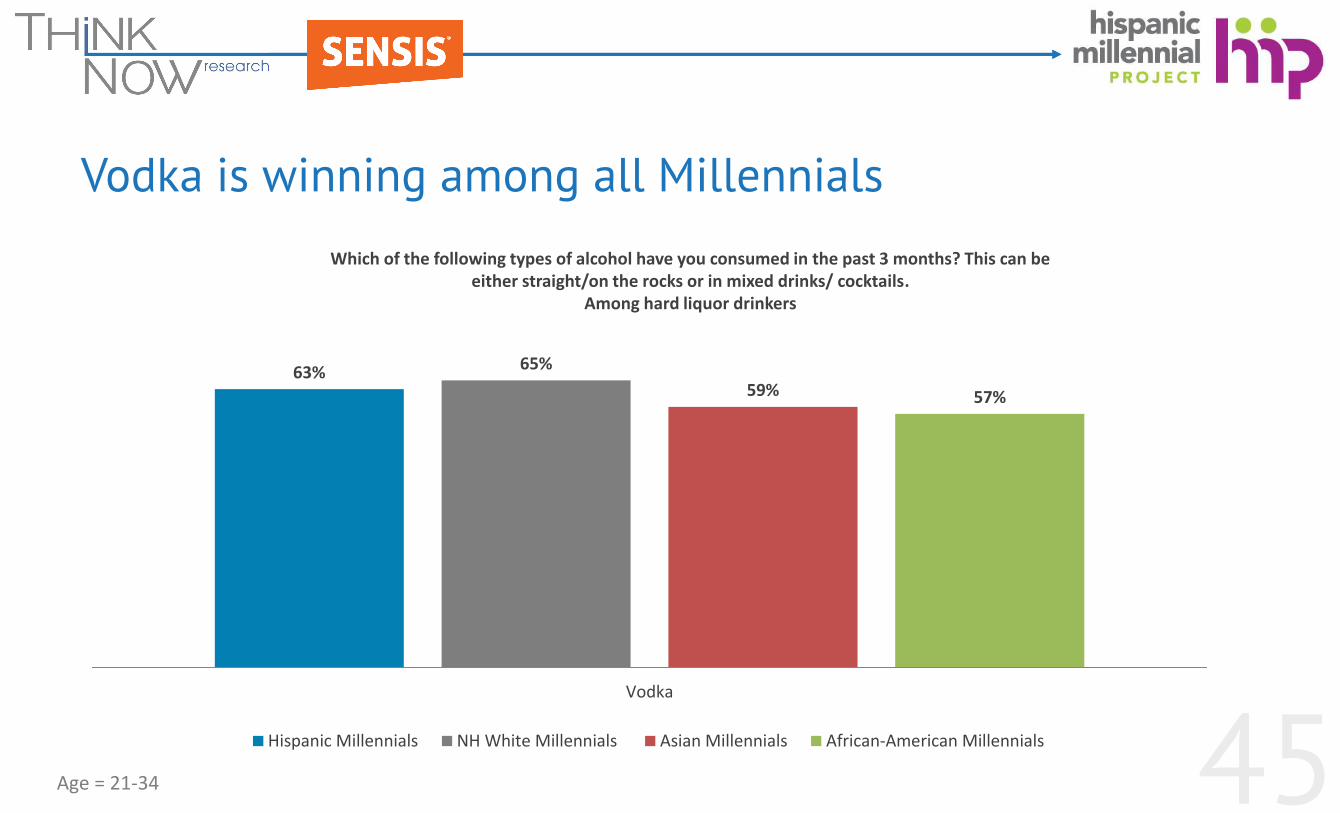
Vodka is winning among all Millennials
63% 65%
59% 57%
Vodka
Hispanic Millennials NH White Millennials Asian Millennials African-American Millennials
Which of the following types of alcohol have you consumed in the past 3 months? This can be either straight/on the rocks or in mixed drinks/ cocktails.
Among hard liquor drinkers
Age = 21-34
46
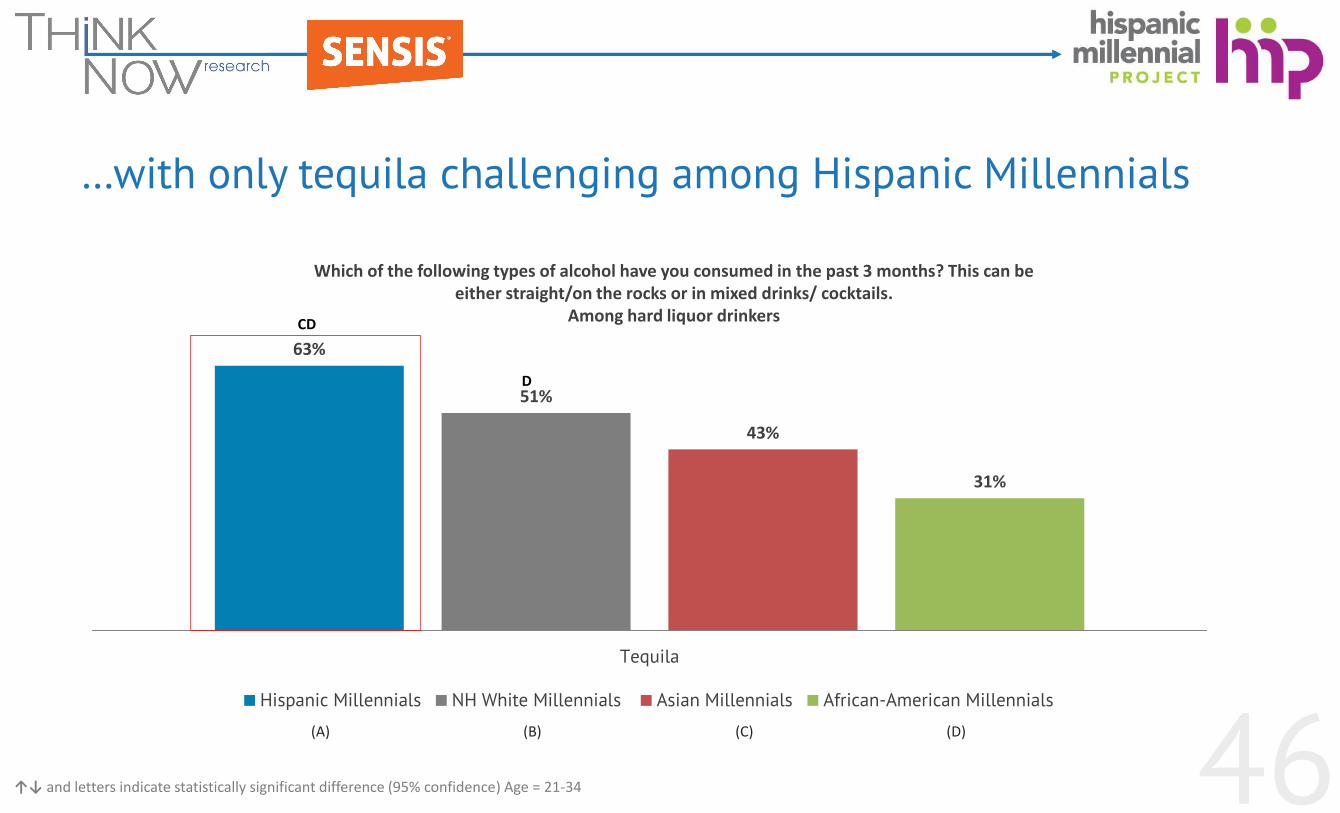
…with only tequila challenging among Hispanic Millennials
63%
51%
43%
31%
Tequila
Hispanic Millennials NH White Millennials Asian Millennials African-American Millennials
Which of the following types of alcohol have you consumed in the past 3 months? This can be either straight/on the rocks or in mixed drinks/ cocktails.
Among hard liquor drinkers
(A) (B) (C) (D)
↑↓ and letters indicate statistically significant difference (95% confidence) Age = 21-34
CD
D

47
Hispanic and Non-Hispanic White Millennials share similar preferences for spirits
63%
46% 45%
32%
22%
11%
65%
48% 48%
32%
21%
12%
Vodka Rum Whiskey/Scotch Flavored Liquor Brandy Cordial
Hispanic Millennials NH White Millennials
Which of the following types of alcohol have you consumed in the past 3 months? This can be either straight/on the rocks or in mixed drinks/ cocktails.
Among hard liquor drinkers
Age = 21-34
48
Theme 7:Non-Hispanic White Millennials embrace ethnic flavors.

49
46%40%
27%
Mexican Hot Sauce (Tapatio, Cholula, etc.)
NH White Millennials Asian Millennials African-American Millennials
C
Almost half of Non-Hispanic White Millennials consume Mexican Hot SauceMore so than Asian and African-American Millennials
I have consumed Mexican Hot Sauce (Tapatio, Cholula, etc.) in the past 3 months
(A) (B) (C)
↑↓ and letters indicate statistically significant difference (95% confidence)
C
50
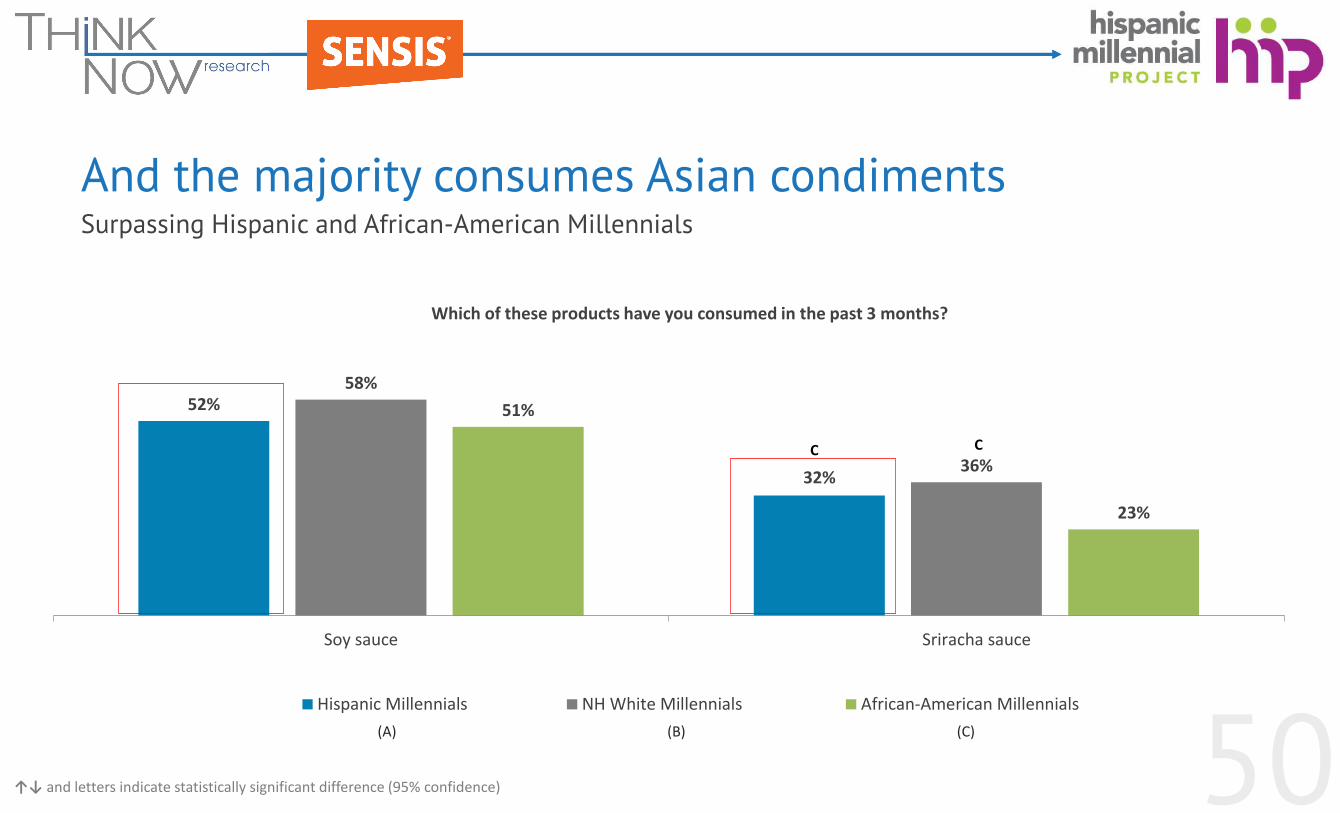
52%
32%
58%
36%
51%
23%
Soy sauce Sriracha sauce
Hispanic Millennials NH White Millennials African-American Millennials
And the majority consumes Asian condimentsSurpassing Hispanic and African-American Millennials
Which of these products have you consumed in the past 3 months?
(A) (B) (C)
↑↓ and letters indicate statistically significant difference (95% confidence)
CC

51
They also like ethnic flavored alcoholic beverages
19%
10%
12%
0%
2%
4%
6%
8%
10%
12%
14%
16%
18%
20%
Chelada (beer mixed with Clamato/tomato juice)
Non-Hispanic White Millennials Asian Millennials African American Millennials
Which of the following types of flavored beers do you like to drink, if any?
(A) (B) (C)
↑↓ and letters indicate statistically significant difference (95% confidence)
B

52
Theme 8:All Multicultural Millennials are “Foodies”, with Hispanic
Millennials leading the preference for whole foods.
53
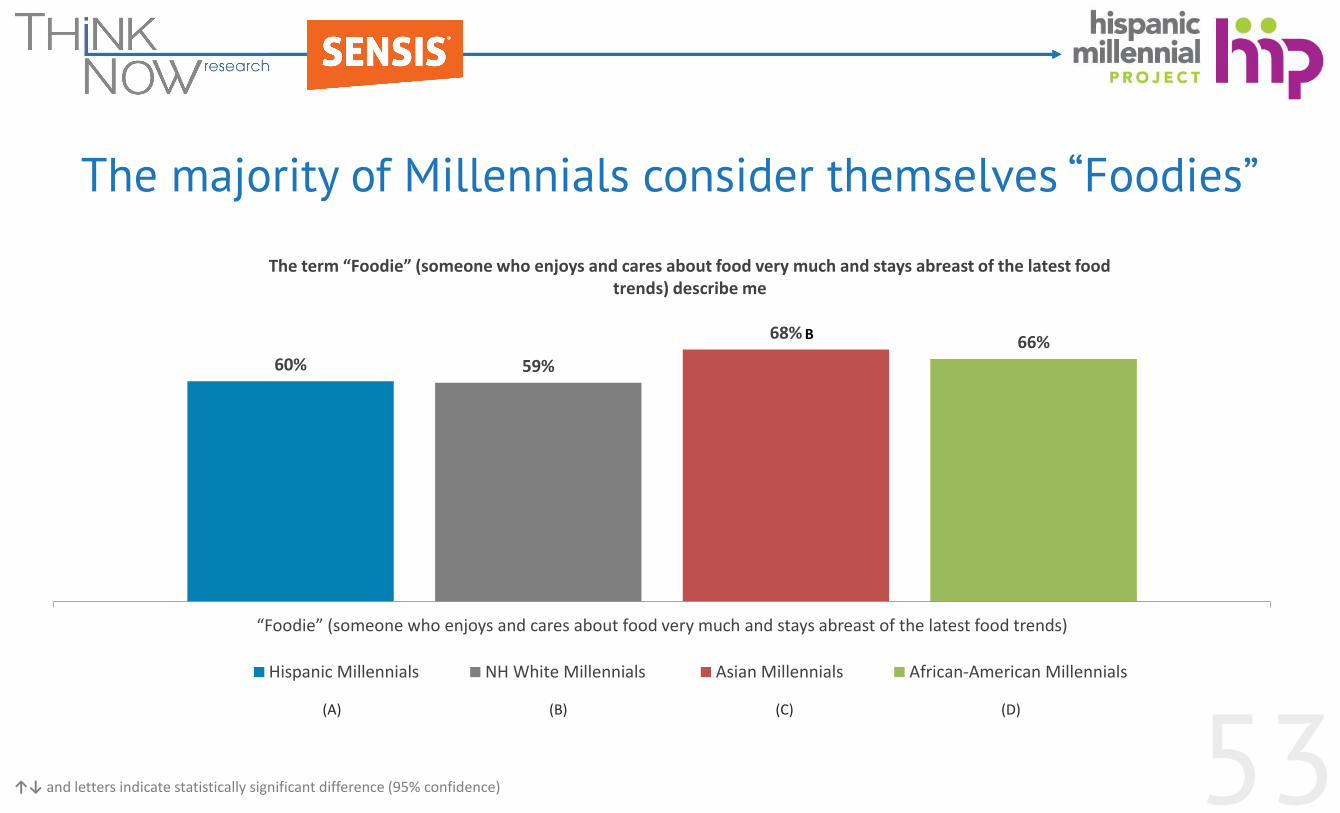
The majority of Millennials consider themselves “Foodies”
60% 59%
68%66%
“Foodie” (someone who enjoys and cares about food very much and stays abreast of the latest food trends)
Hispanic Millennials NH White Millennials Asian Millennials African-American Millennials
The term “Foodie” (someone who enjoys and cares about food very much and stays abreast of the latest food trends) describe me
(A) (B) (C) (D)
↑↓ and letters indicate statistically significant difference (95% confidence)
B
54
55
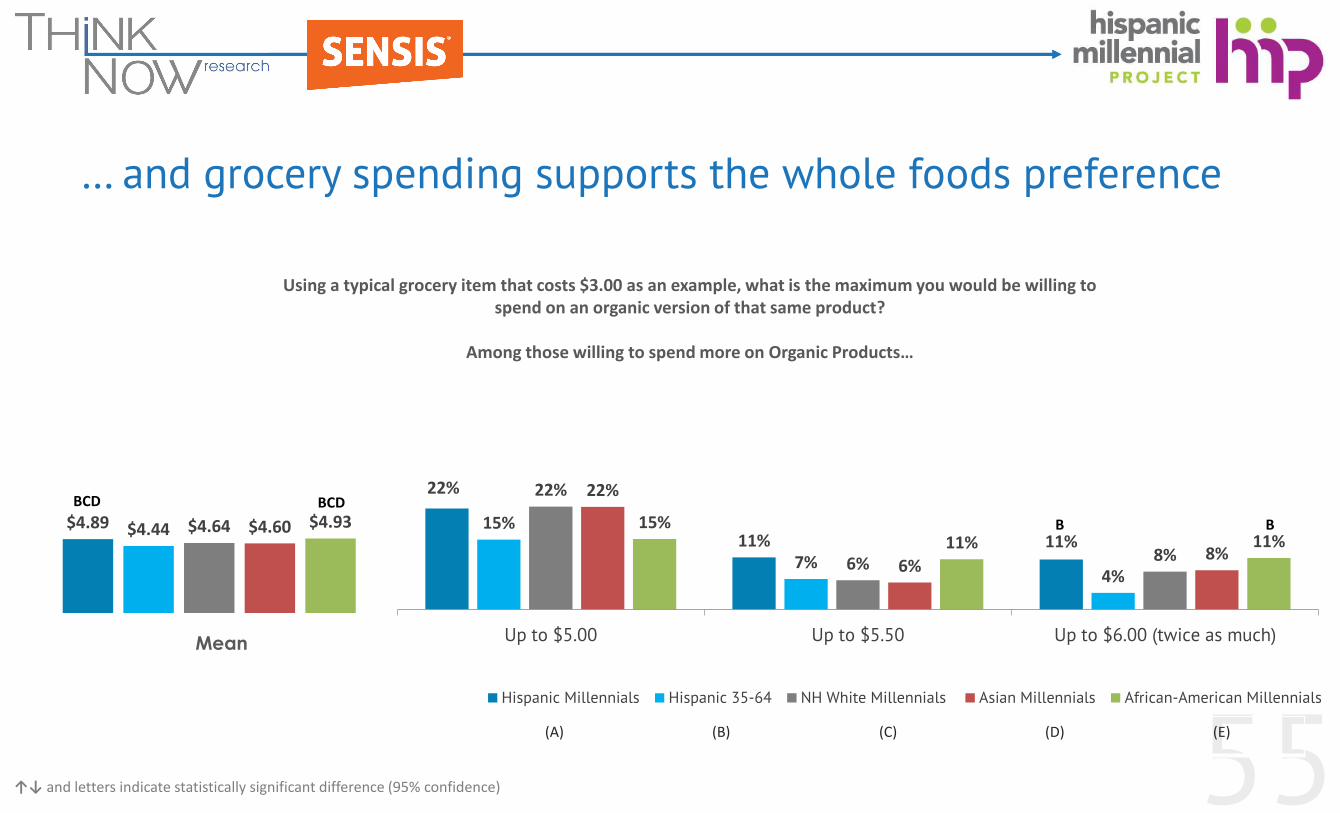
… and grocery spending supports the whole foods preference
$4.89 $4.44 $4.64 $4.60 $4.93
22%
11% 11%15%
7%4%
22%
6% 8%
22%
6%8%
15%11% 11%
Up to $5.00 Up to $5.50 Up to $6.00 (twice as much)
Hispanic Millennials Hispanic 35-64 NH White Millennials Asian Millennials African-American Millennials
Using a typical grocery item that costs $3.00 as an example, what is the maximum you would be willing to spend on an organic version of that same product?
Among those willing to spend more on Organic Products…
Mean
(A) (B) (C) (D) (E)
↑↓ and letters indicate statistically significant difference (95% confidence)
B B
BCD BCD

56
Comparing Multicultural Millennials
57
Hispanic Millennials vs. Hispanics 35-64
58
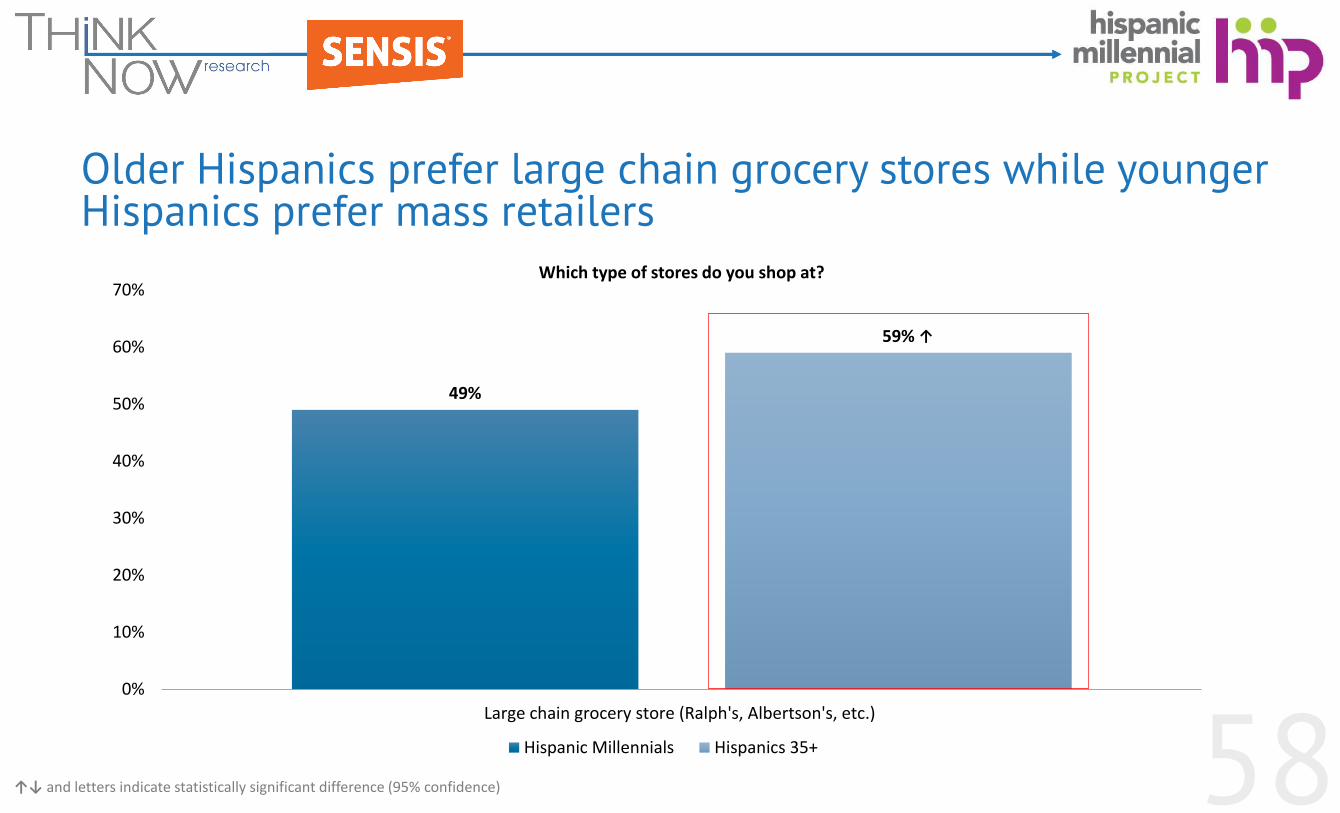
Older Hispanics prefer large chain grocery stores while younger Hispanics prefer mass retailers
49%
59%
0%
10%
20%
30%
40%
50%
60%
70%
Large chain grocery store (Ralph's, Albertson's, etc.)
Hispanic Millennials Hispanics 35+
Which type of stores do you shop at?
↑↓ and letters indicate statistically significant difference (95% confidence)
↑
59
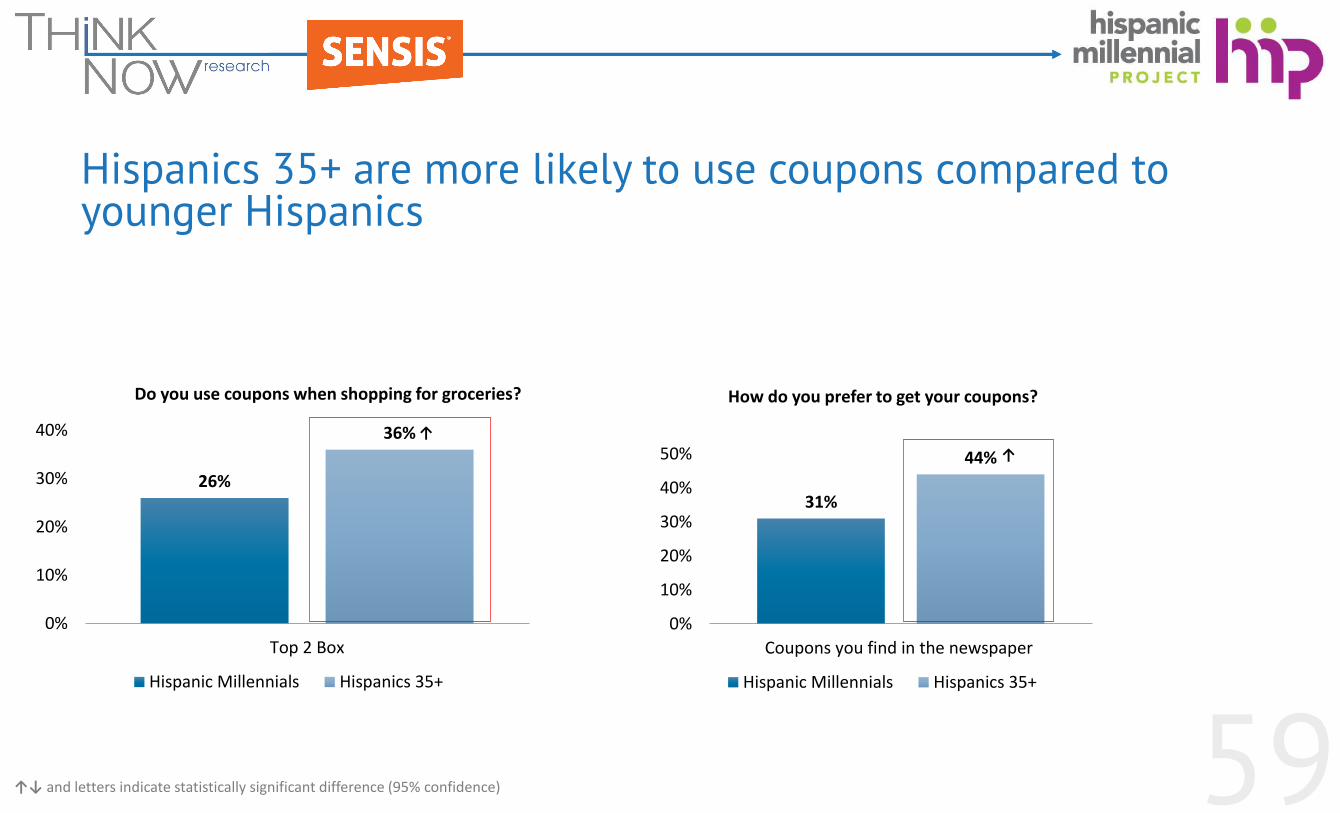
Hispanics 35+ are more likely to use coupons compared to younger Hispanics
26%
36%
0%
10%
20%
30%
40%
Top 2 Box
Hispanic Millennials Hispanics 35+
Do you use coupons when shopping for groceries?
31%
44%
0%
10%
20%
30%
40%
50%
Coupons you find in the newspaper
Hispanic Millennials Hispanics 35+
How do you prefer to get your coupons?
↑↓ and letters indicate statistically significant difference (95% confidence)
↑
↑
60
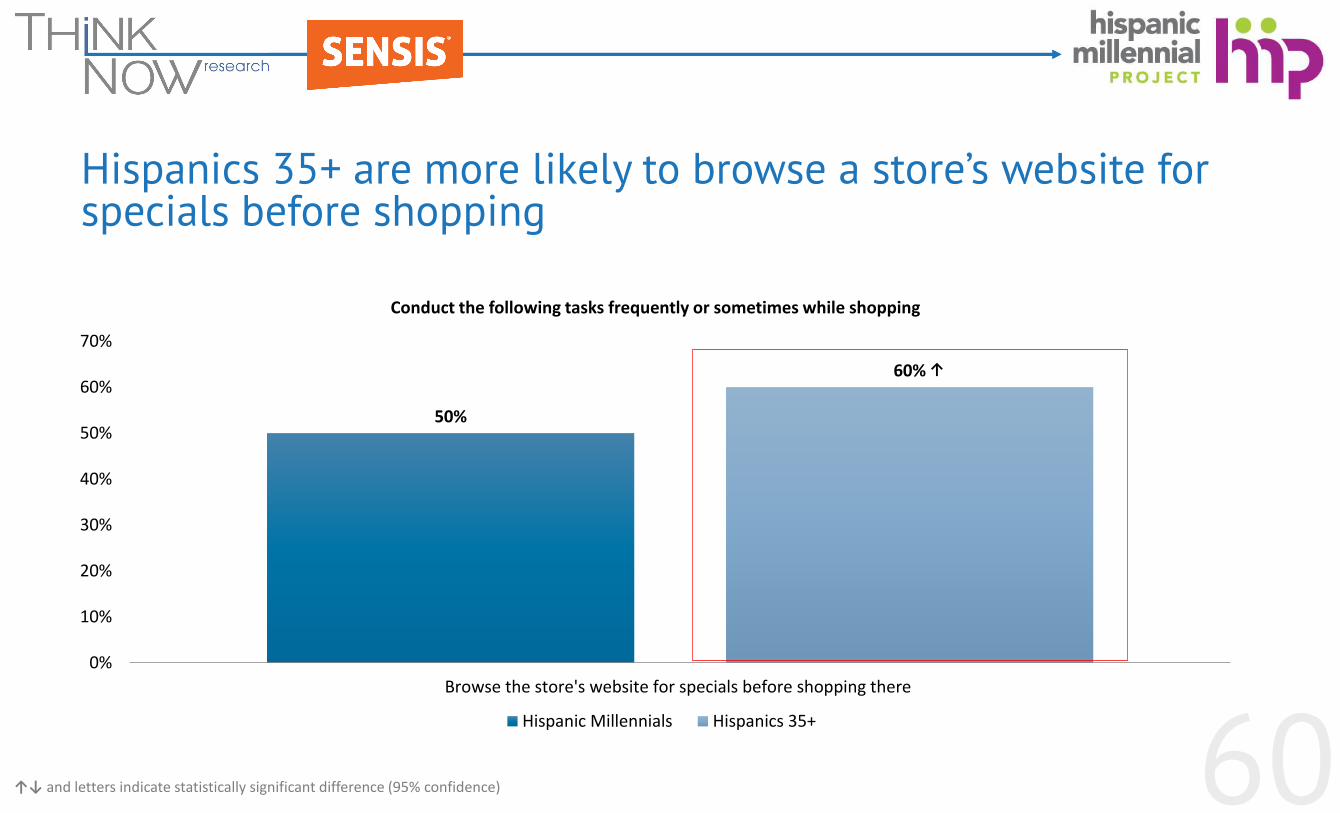
Hispanics 35+ are more likely to browse a store’s website for specials before shopping
50%
60%
0%
10%
20%
30%
40%
50%
60%
70%
Browse the store's website for specials before shopping there
Hispanic Millennials Hispanics 35+
Conduct the following tasks frequently or sometimes while shopping
↑↓ and letters indicate statistically significant difference (95% confidence)
↑

61
Hispanic Millennials vs. Non-Hispanic White Millennials
62
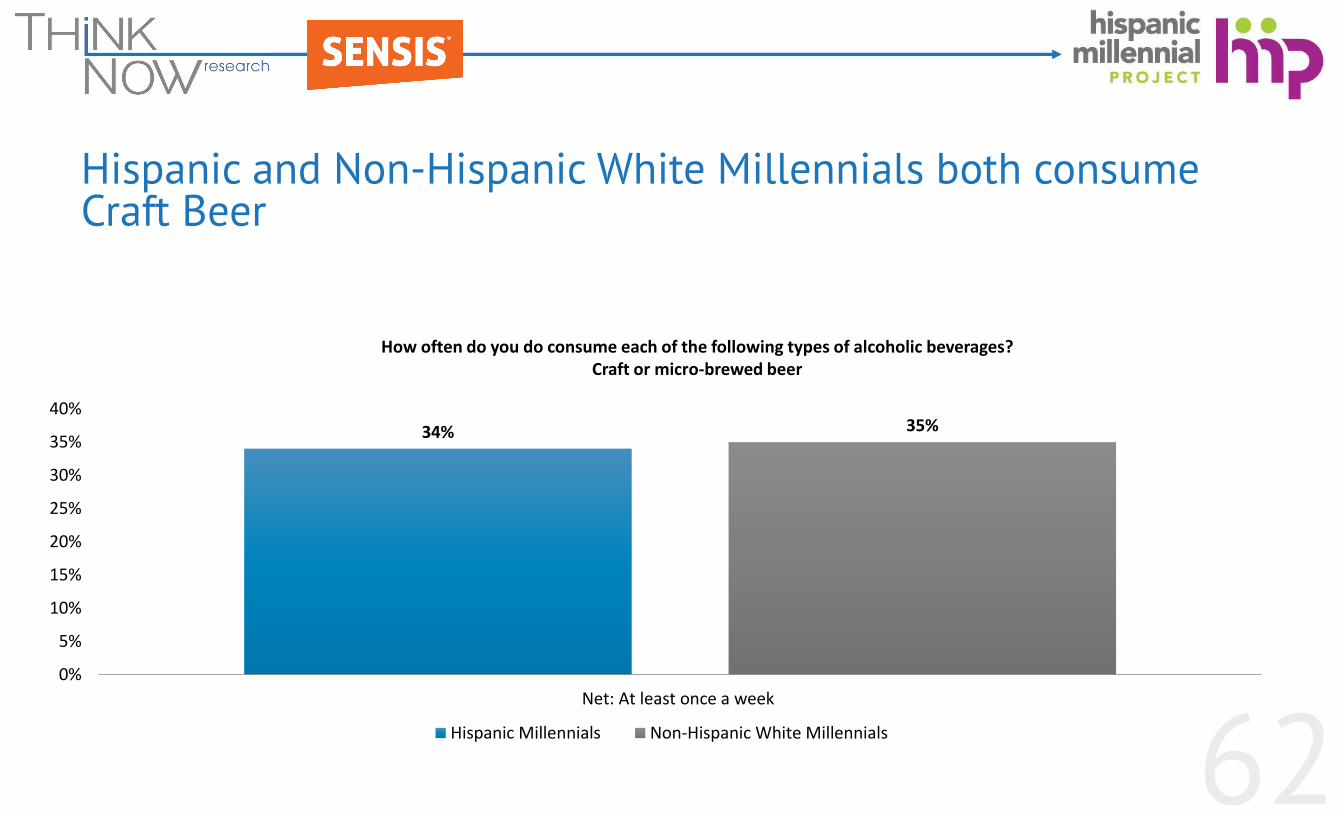
Hispanic and Non-Hispanic White Millennials both consume Craft Beer
34% 35%
0%
5%
10%
15%
20%
25%
30%
35%
40%
Net: At least once a week
Hispanic Millennials Non-Hispanic White Millennials
How often do you do consume each of the following types of alcoholic beverages?Craft or micro-brewed beer

63
Yet, Hispanic Millennials are less likely to say that craft beer tastes better than regular beer
43%
61%
0%
10%
20%
30%
40%
50%
60%
70%
Craft beer is better than regular beer
Hispanic Millennials Non-Hispanic White Millennials
Which statement below best describes your image of craft/micro-brewed beer compared to regular beer in terms of its quality and taste?
↑
64
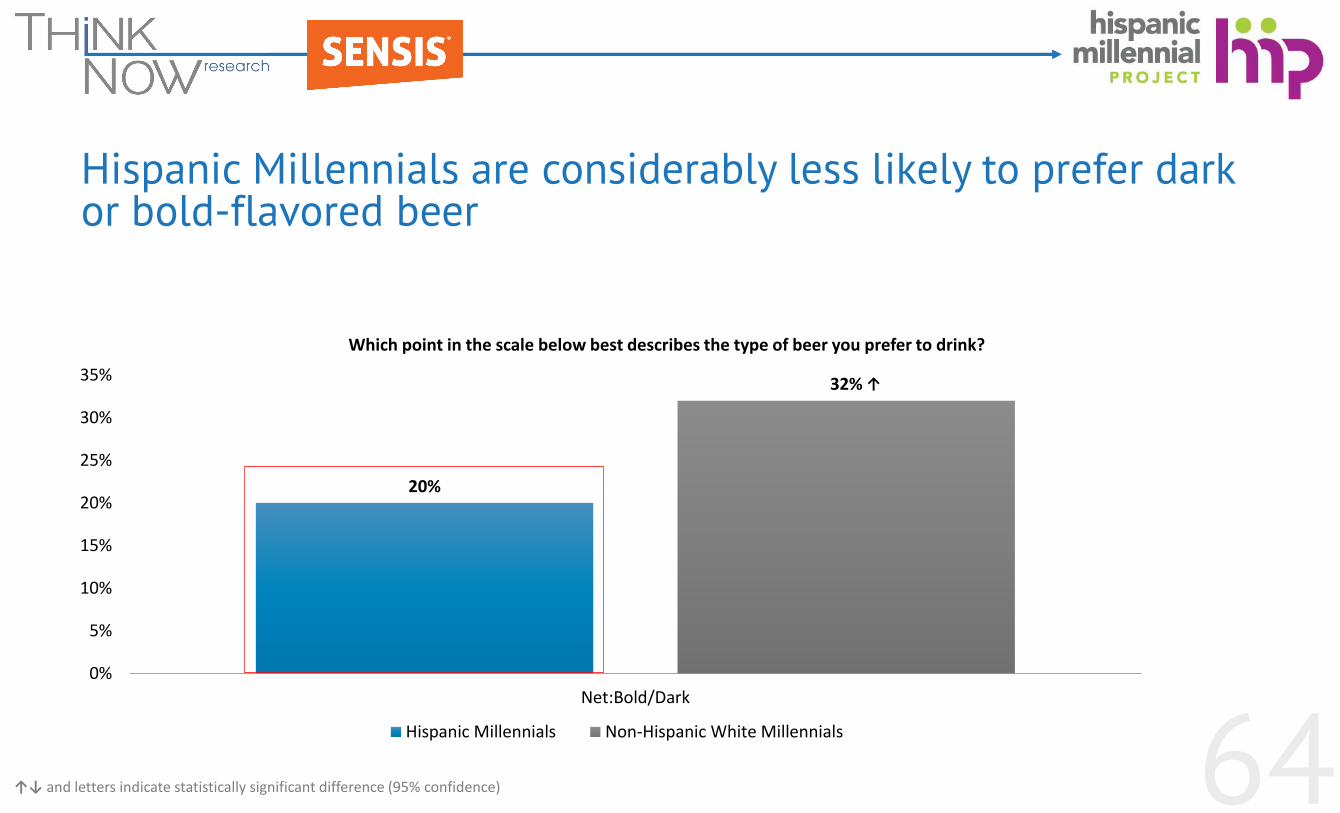
Hispanic Millennials are considerably less likely to prefer dark or bold-flavored beer
20%
32%
0%
5%
10%
15%
20%
25%
30%
35%
Net:Bold/Dark
Hispanic Millennials Non-Hispanic White Millennials
Which point in the scale below best describes the type of beer you prefer to drink?
↑↓ and letters indicate statistically significant difference (95% confidence)
↑
65
U.S. Born Hispanic Millennials vs. Foreign-born Hispanic Millennials
66
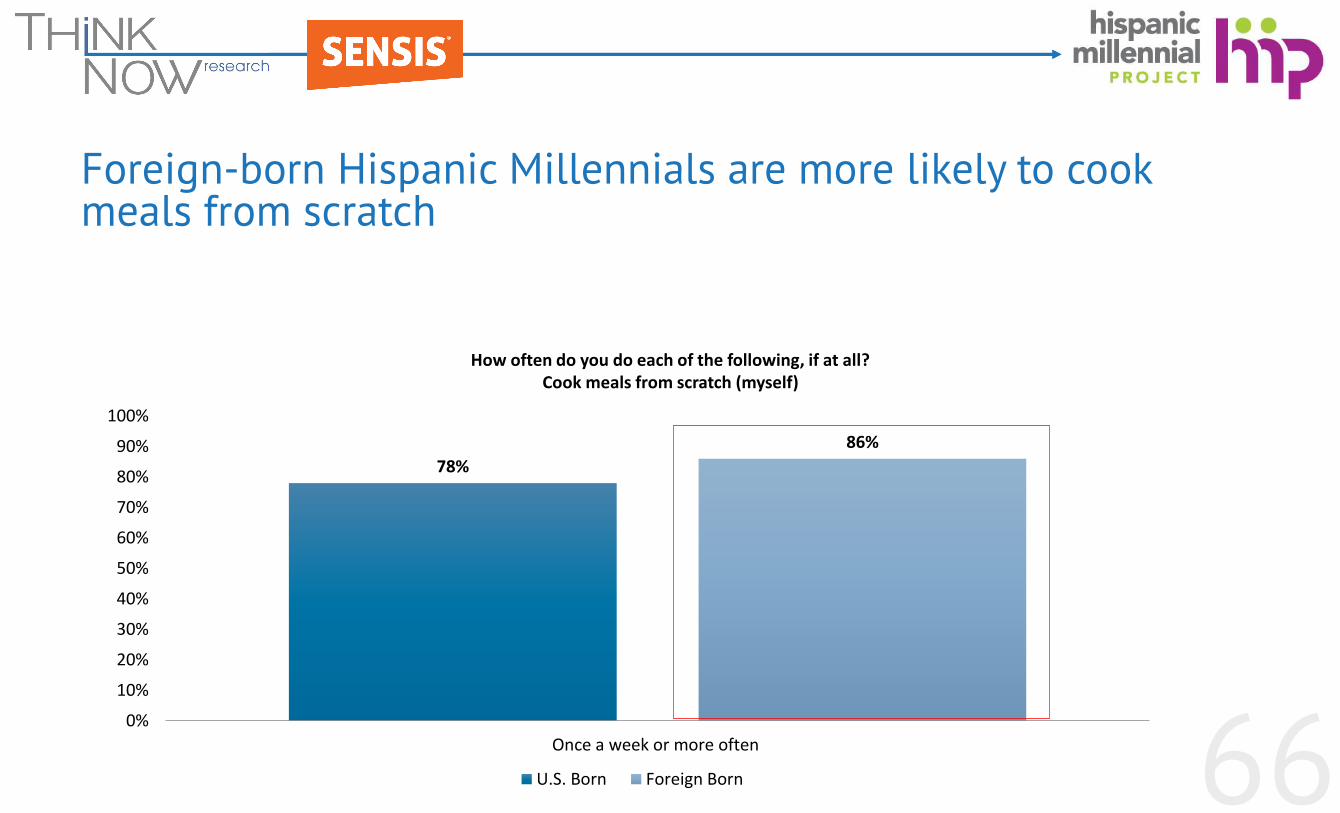
Foreign-born Hispanic Millennials are more likely to cook meals from scratch
78%
86%
0%
10%
20%
30%
40%
50%
60%
70%
80%
90%
100%
Once a week or more often
U.S. Born Foreign Born
How often do you do each of the following, if at all?Cook meals from scratch (myself)

67
Foreign-born Hispanic Millennials are less likely to eat at fast food restaurants
67%
50%
0%
10%
20%
30%
40%
50%
60%
70%
80%
Once a week or more often
U.S. Born Foreign Born
How often do you do each of the following, if at all?Eat at a fast food restaurant (including drive-thru)
↑↓ and letters indicate statistically significant difference (95% confidence)
↑
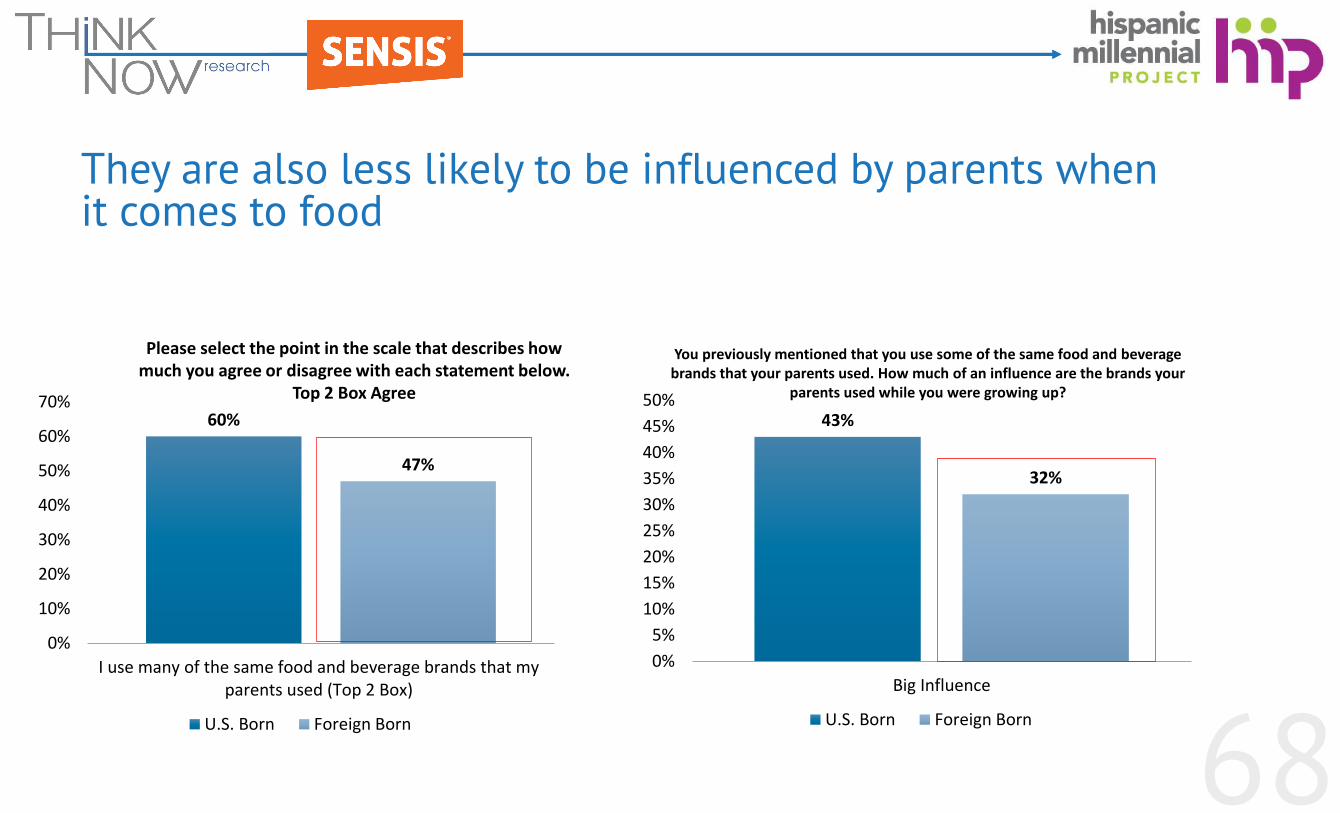
68
They are also less likely to be influenced by parents when it comes to food
60%
47%
0%
10%
20%
30%
40%
50%
60%
70%
I use many of the same food and beverage brands that myparents used (Top 2 Box)
U.S. Born Foreign Born
43%
32%
0%
5%
10%
15%
20%
25%
30%
35%
40%
45%
50%
Big Influence
U.S. Born Foreign Born
You previously mentioned that you use some of the same food and beverage brands that your parents used. How much of an influence are the brands your
parents used while you were growing up?
Please select the point in the scale that describes how much you agree or disagree with each statement below.
Top 2 Box Agree

69
Foreign-born Hispanic Millennials are also less likely to research deals before grocery shopping
78%
59%53%
63%
47%
38%
0%
10%
20%
30%
40%
50%
60%
70%
80%
90%
Read store flyer/newspaper for specials beforeshopping there
Research specific products online before goingshopping
Compare prices on your mobile phone while atthe store
U.S. Born Foreign Born
How often do you do each of the following when it comes to grocery shopping?
Frequently or Sometimes
↑↓ and letters indicate statistically significant difference (95% confidence)
↑
↑
70
Hispanic Millennials vs. Asian Millennials

71
Hispanic Millennials are less likely to feel that heritage influences the brands they purchase
72%
83%
0%
10%
20%
30%
40%
50%
60%
70%
80%
90%
Net: Influence
Hispanic Millennials Asian Millennials
How does your heritage or cultural background contribute to the food and beverage brands you buy? (Open end)

72
Hispanic Millennials are less likely to buy/use ethnic brands versus Asian Millennials
53%
61%
0%
10%
20%
30%
40%
50%
60%
70%
I use/buy ethnic brands of food and beverages
Hispanic Millennials Asian Millennials
Please select the point in the scale that describes how much you agree or disagree with each statement below.
Top 2 Box Agreement
73
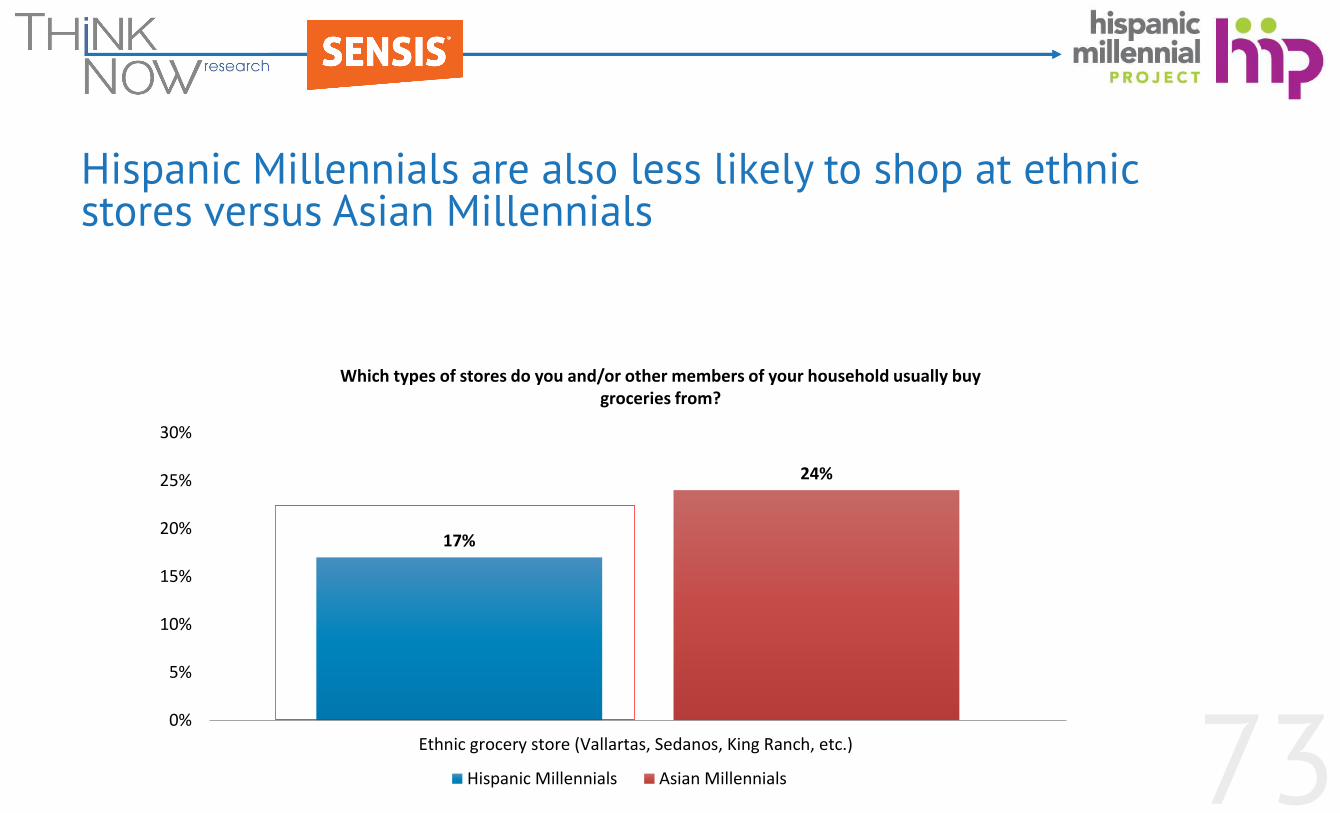
Hispanic Millennials are also less likely to shop at ethnic stores versus Asian Millennials
17%
24%
0%
5%
10%
15%
20%
25%
30%
Ethnic grocery store (Vallartas, Sedanos, King Ranch, etc.)
Hispanic Millennials Asian Millennials
Which types of stores do you and/or other members of your household usually buy groceries from?
74
Hispanic Millennials vs. African-American Millennials

75
Hispanic Millennials are more influenced by heritage than African-American Millennials
72%
58%
0%
10%
20%
30%
40%
50%
60%
70%
80%
Net: Influence
Hispanic Millennials African American Millennials
How does your heritage or cultural background contribute to the food and beverage brands you buy? (Open end)
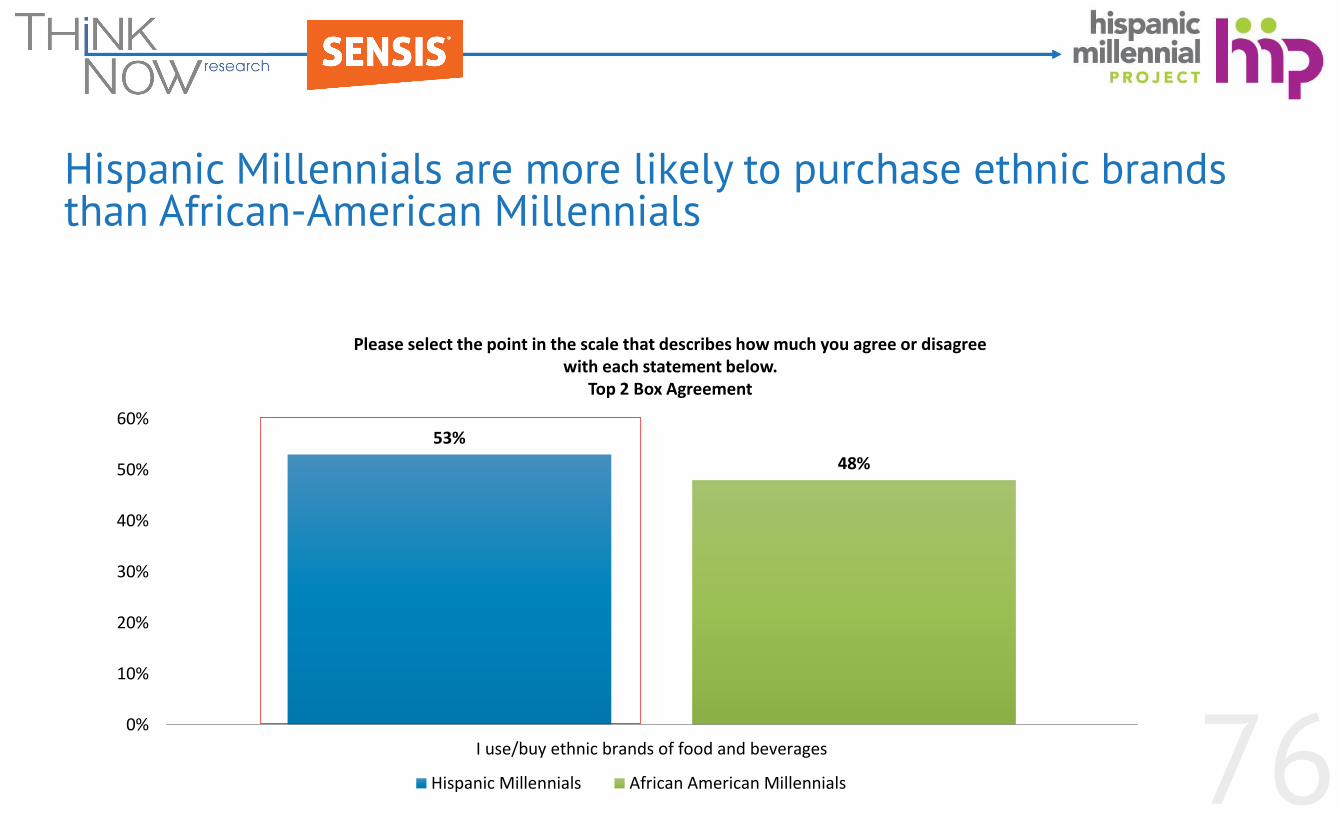
76
Hispanic Millennials are more likely to purchase ethnic brands than African-American Millennials
53%
48%
0%
10%
20%
30%
40%
50%
60%
I use/buy ethnic brands of food and beverages
Hispanic Millennials African American Millennials
Please select the point in the scale that describes how much you agree or disagree with each statement below.
Top 2 Box Agreement
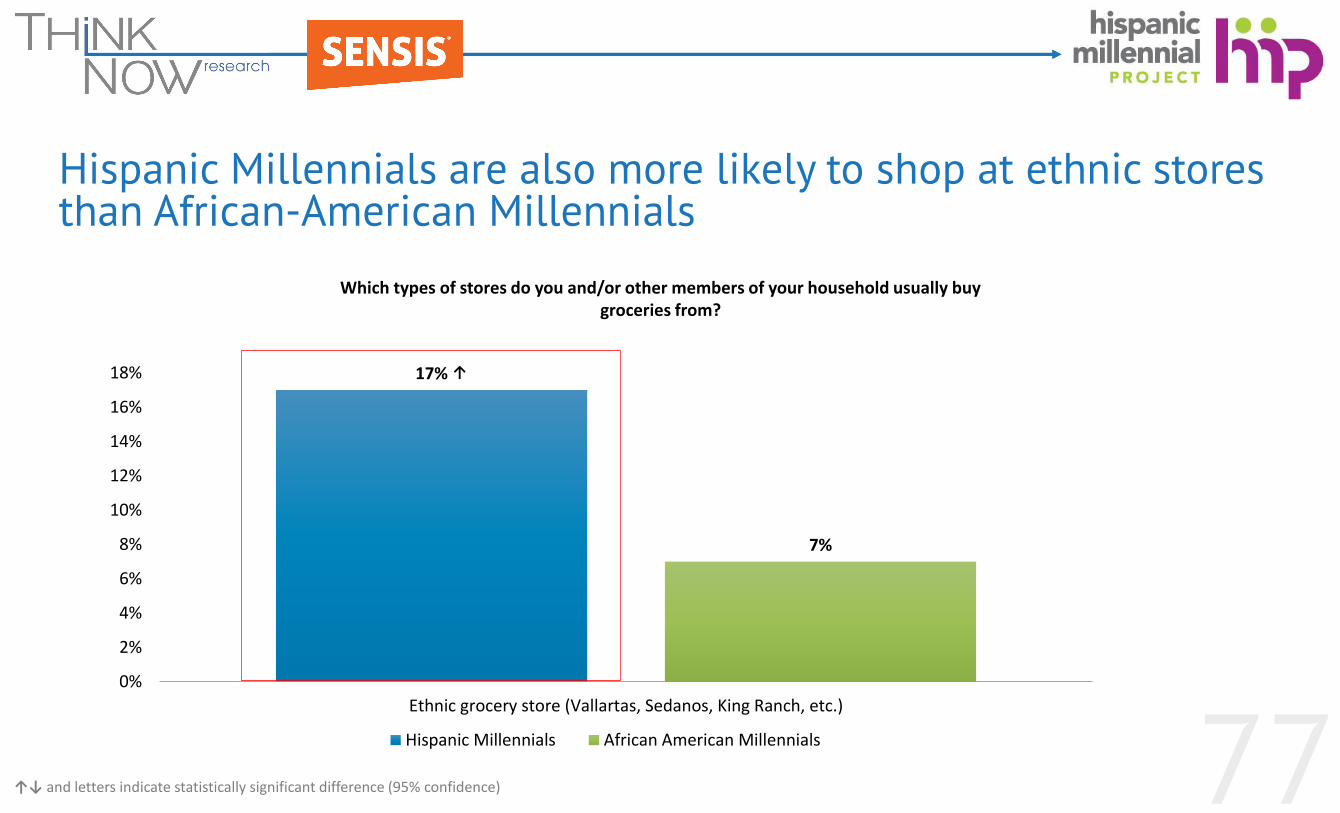
77
Hispanic Millennials are also more likely to shop at ethnic stores than African-American Millennials
17%
7%
0%
2%
4%
6%
8%
10%
12%
14%
16%
18%
Ethnic grocery store (Vallartas, Sedanos, King Ranch, etc.)
Hispanic Millennials African American Millennials
Which types of stores do you and/or other members of your household usually buy groceries from?
↑↓ and letters indicate statistically significant difference (95% confidence)
↑
78
Hispanic Millennial Males vs. Hispanic Millennial Females
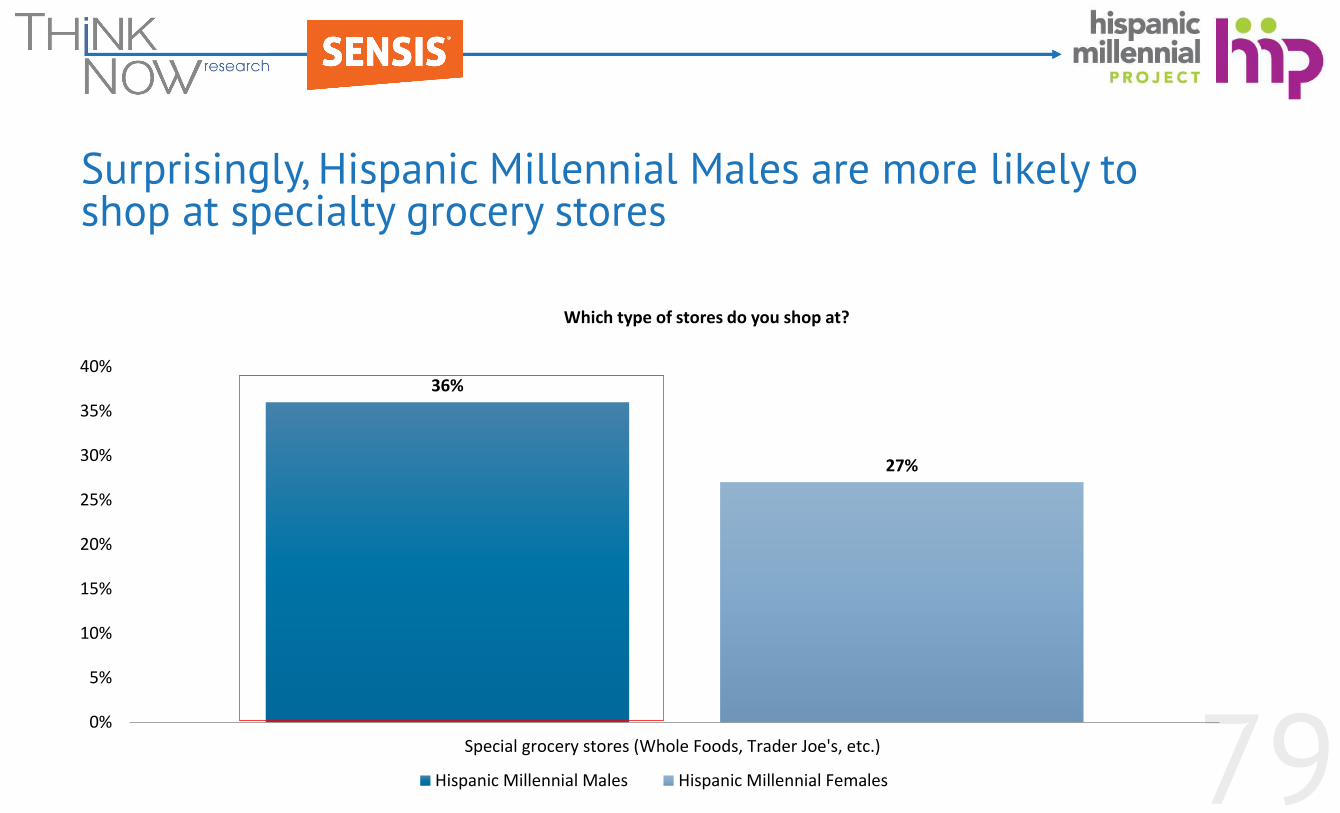
79
Surprisingly, Hispanic Millennial Males are more likely to shop at specialty grocery stores
36%
27%
0%
5%
10%
15%
20%
25%
30%
35%
40%
Special grocery stores (Whole Foods, Trader Joe's, etc.)
Hispanic Millennial Males Hispanic Millennial Females
Which type of stores do you shop at?

80
And shop at large chain grocery stores too
52%
45%
0%
10%
20%
30%
40%
50%
60%
Large chain grocery store (Ralph’s, Albertson’s, Kroger, Winn-Dixie, Giant, etc.)
Hispanic Millennial Males Hispanic Millennial Females
Which type of stores do you shop at?
81
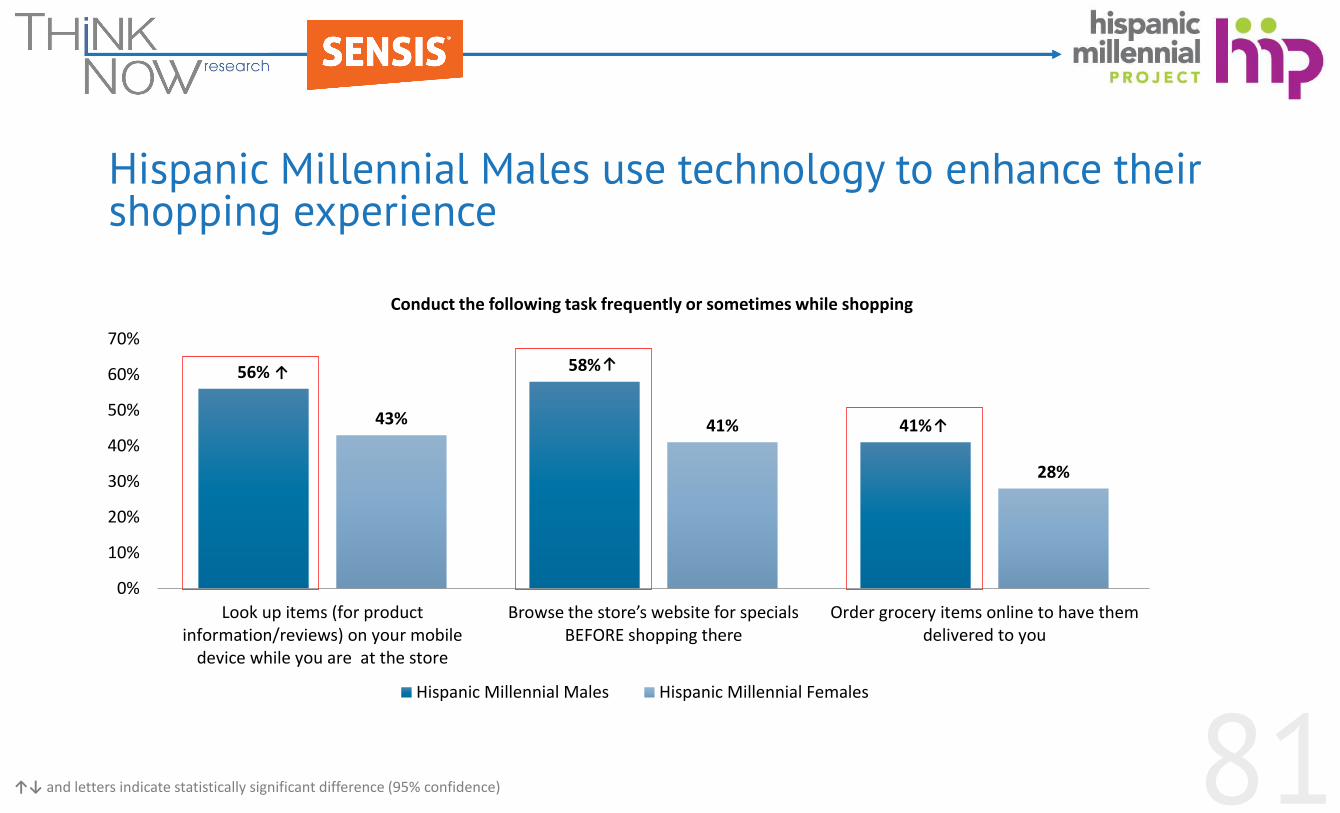
Hispanic Millennial Males use technology to enhance their shopping experience
56% 58%
41%43% 41%
28%
0%
10%
20%
30%
40%
50%
60%
70%
Look up items (for productinformation/reviews) on your mobile
device while you are at the store
Browse the store’s website for specials BEFORE shopping there
Order grocery items online to have themdelivered to you
Hispanic Millennial Males Hispanic Millennial Females
Conduct the following task frequently or sometimes while shopping
↑↓ and letters indicate statistically significant difference (95% confidence)
↑↑
↑
82
Points of Tension

83
Points of Tension
• One of the most important ways to establish a deeper understanding of Hispanic Millennials is to comprehend the points of tension characterizing their lives.
• As marketers, we know points of tension provide powerful opportunities to communicate and connect with consumers.
84
Among the defining characteristics we see in Hispanic Millennials are the numerous and deep cultural and psychographic points of tension they face.
• Because they live in two cultures, caught between very different generations, and their proper life stage, they face tensions related to decisions about financial services.
• We identified points of tension as it relates to food, beverage, and alcohol consumption.
85
Point of Tension #1: Perception is not reality
86
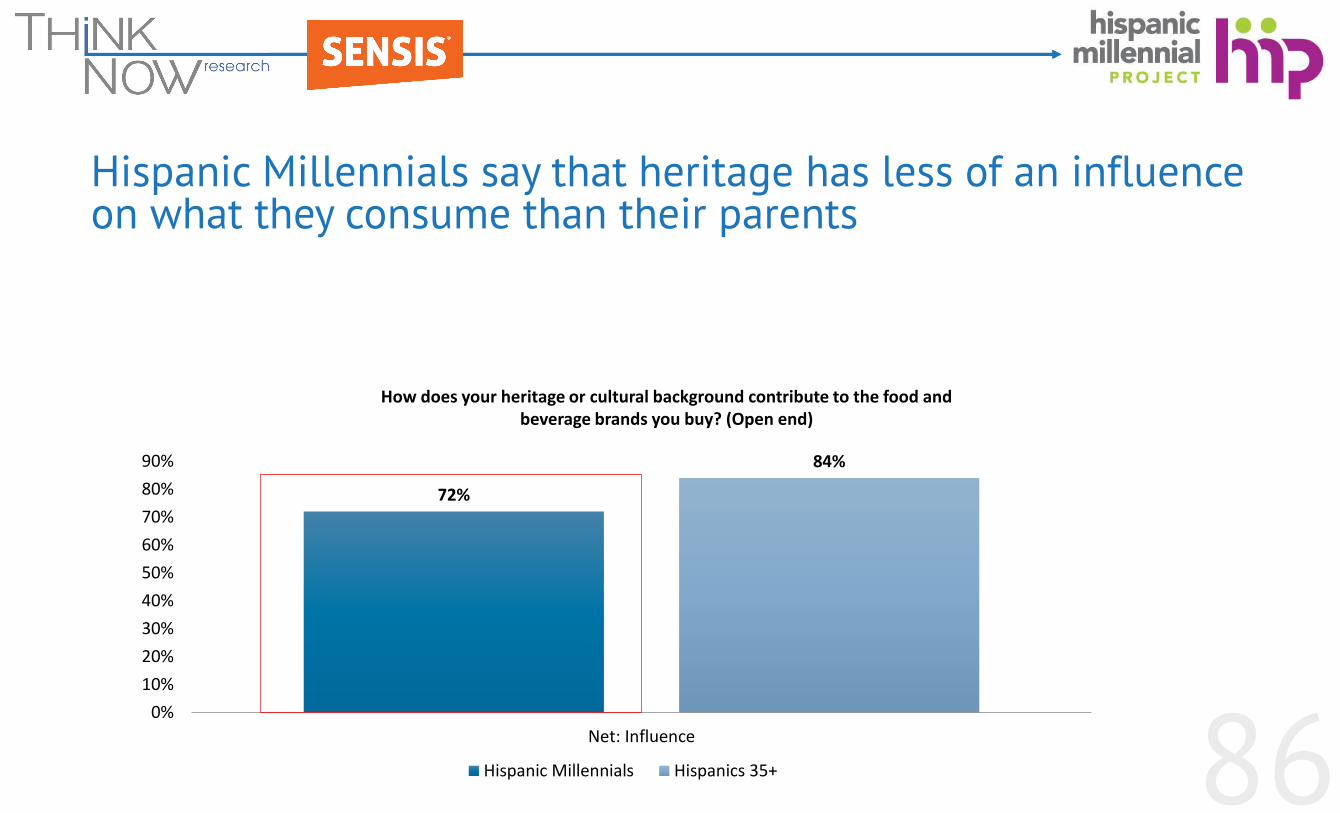
Hispanic Millennials say that heritage has less of an influence on what they consume than their parents
72%
84%
0%
10%
20%
30%
40%
50%
60%
70%
80%
90%
Net: Influence
Hispanic Millennials Hispanics 35+
How does your heritage or cultural background contribute to the food and beverage brands you buy? (Open end)
87
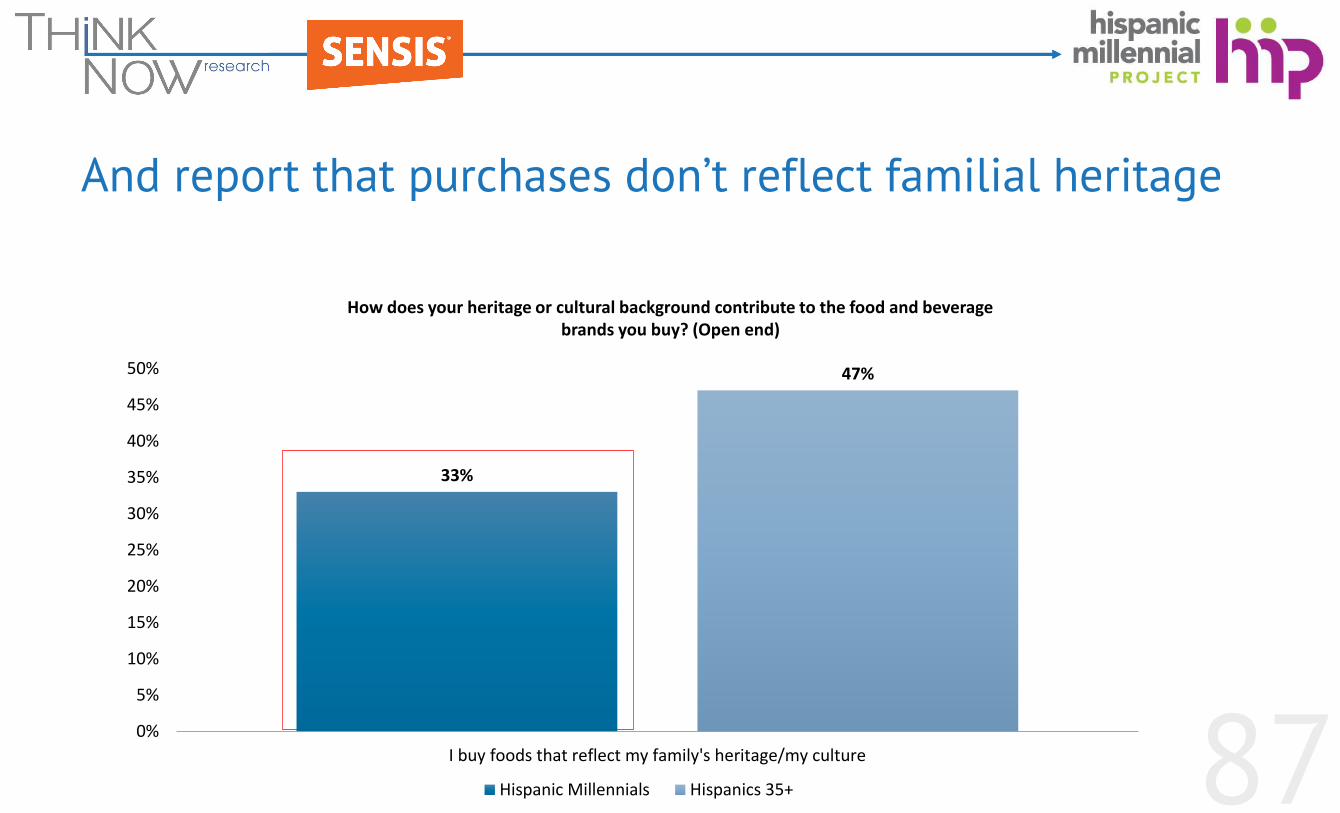
And report that purchases don’t reflect familial heritage
33%
47%
0%
5%
10%
15%
20%
25%
30%
35%
40%
45%
50%
I buy foods that reflect my family's heritage/my culture
Hispanic Millennials Hispanics 35+
How does your heritage or cultural background contribute to the food and beverage brands you buy? (Open end)

88
In reality, heritage drives preference
62%
49%
42%38%
61%
38%
28%
34%
0%
10%
20%
30%
40%
50%
60%
70%
Mexican Hot Sauce (Tapatio,Cholula, etc.)
"Aguas Frescas" (Tamrindo,Jamaica, Guava, etc.)
"Horchata" drink "Dulce de leche"
Hispanic Millennials Hispanic 35+
Which of these products have you consumed in the past 3 months?
↑↓ and letters indicate statistically significant difference (95% confidence)
↑
↑
89
Point of Tension #2:
Healthy diet (except on cheat days)
90
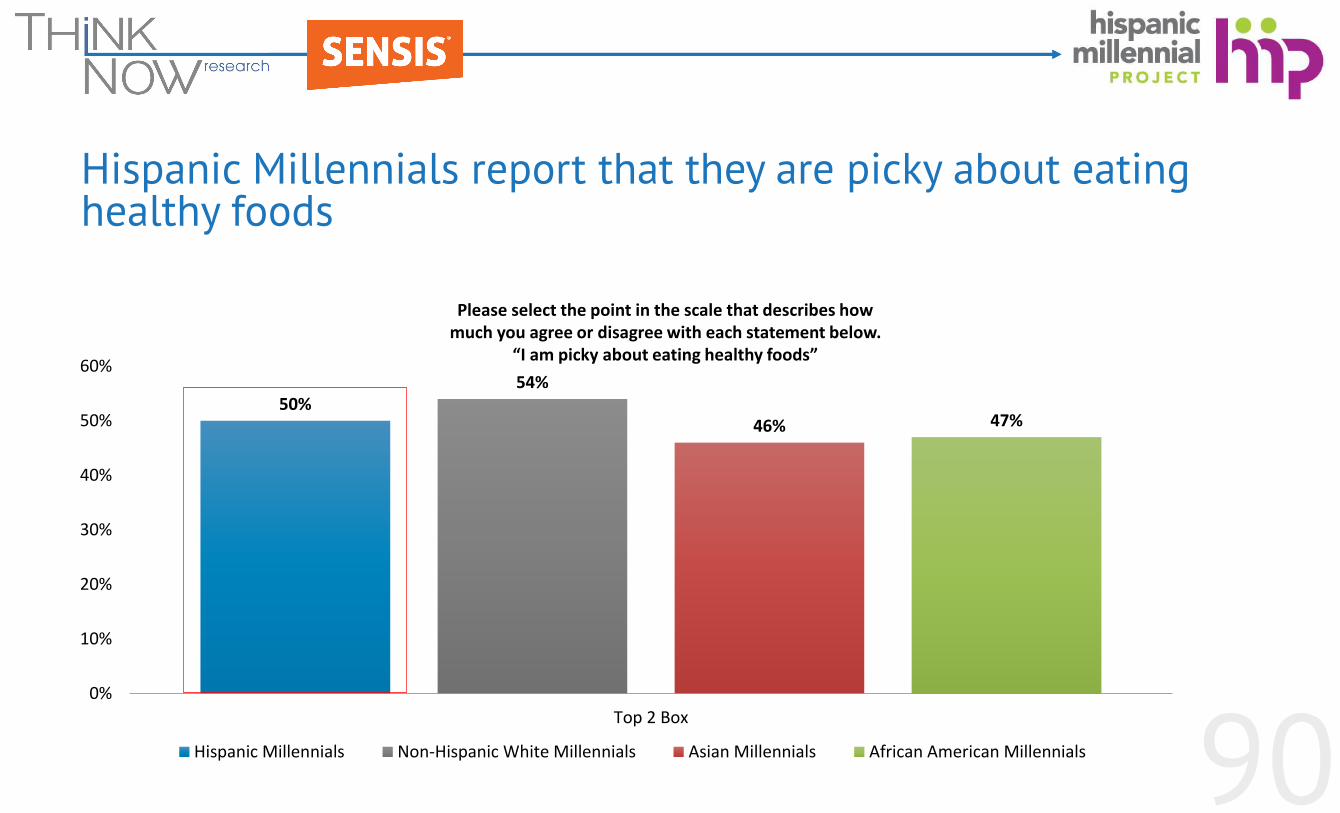
Hispanic Millennials report that they are picky about eating healthy foods
50%54%
46% 47%
0%
10%
20%
30%
40%
50%
60%
Top 2 Box
Hispanic Millennials Non-Hispanic White Millennials Asian Millennials African American Millennials
Please select the point in the scale that describes how much you agree or disagree with each statement below.
“I am picky about eating healthy foods”

91
Hispanic Millennials are also more likely to state that they are on a diet to lose weight than other Millennials
40%
36% 35%33%
0%
5%
10%
15%
20%
25%
30%
35%
40%
45%
Top 2 Box
Hispanic Millennials Non-Hispanic White Millennials Asian Millennials African American Millennials
Please select the point in the scale that describes how much you agree or disagree with each statement below.
“I am currently on a diet to lose weight.”
92
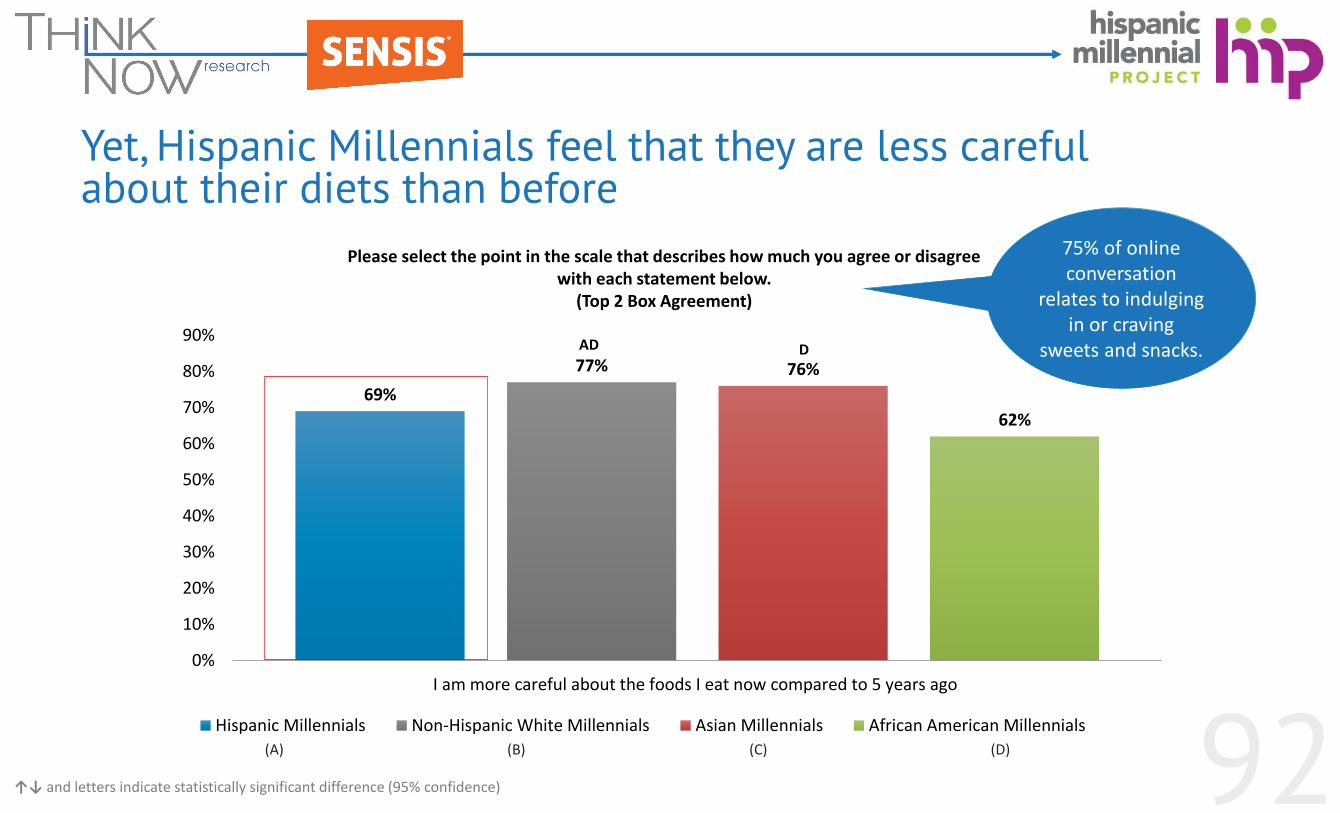
Yet, Hispanic Millennials feel that they are less careful about their diets than before
69%
77% 76%
62%
0%
10%
20%
30%
40%
50%
60%
70%
80%
90%
I am more careful about the foods I eat now compared to 5 years ago
Hispanic Millennials Non-Hispanic White Millennials Asian Millennials African American Millennials
Please select the point in the scale that describes how much you agree or disagree with each statement below.
(Top 2 Box Agreement)
75% of online conversation
relates to indulging in or craving
sweets and snacks.
↑↓ and letters indicate statistically significant difference (95% confidence)
(A) (B) (C) (D)
AD D
93
Point of Tension #3:
Whole foods are great, but processed ones are too?
94
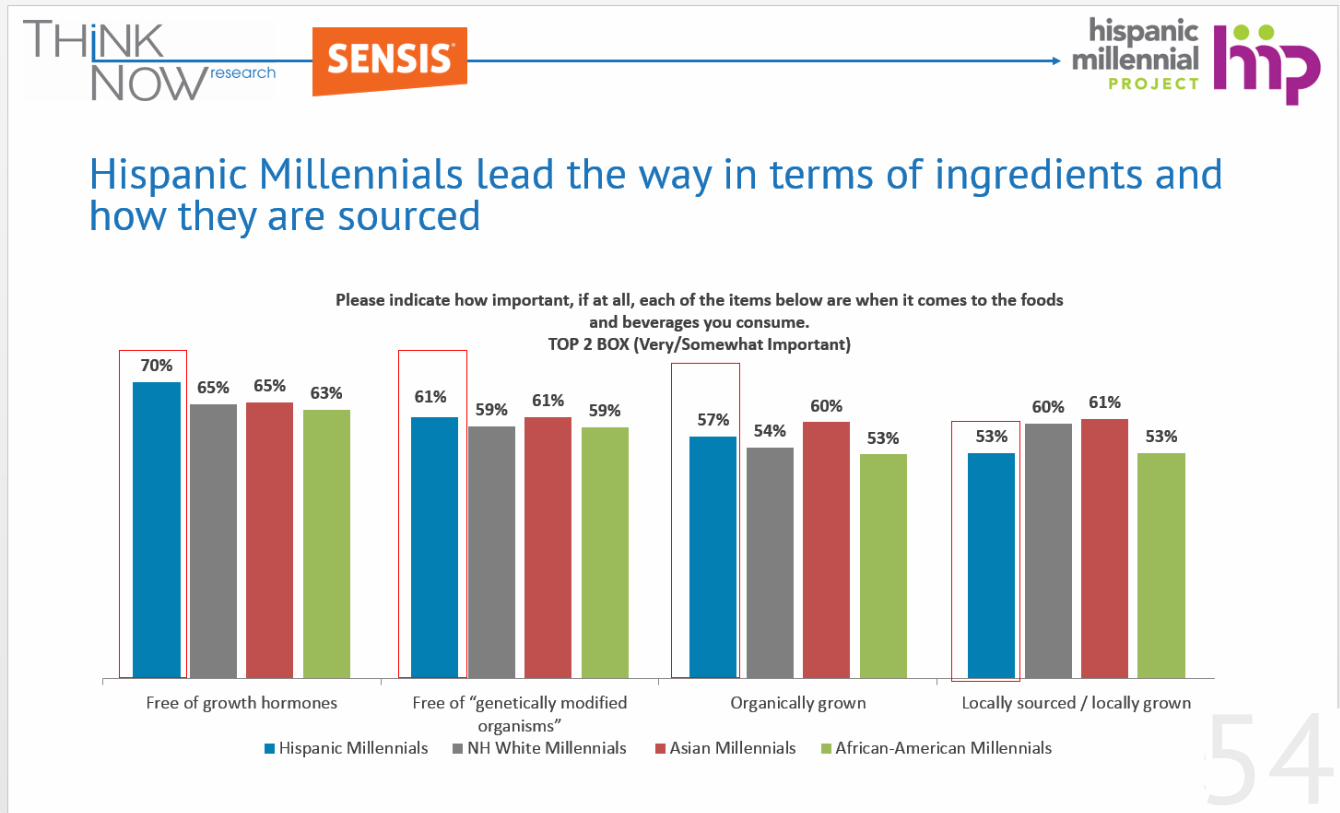
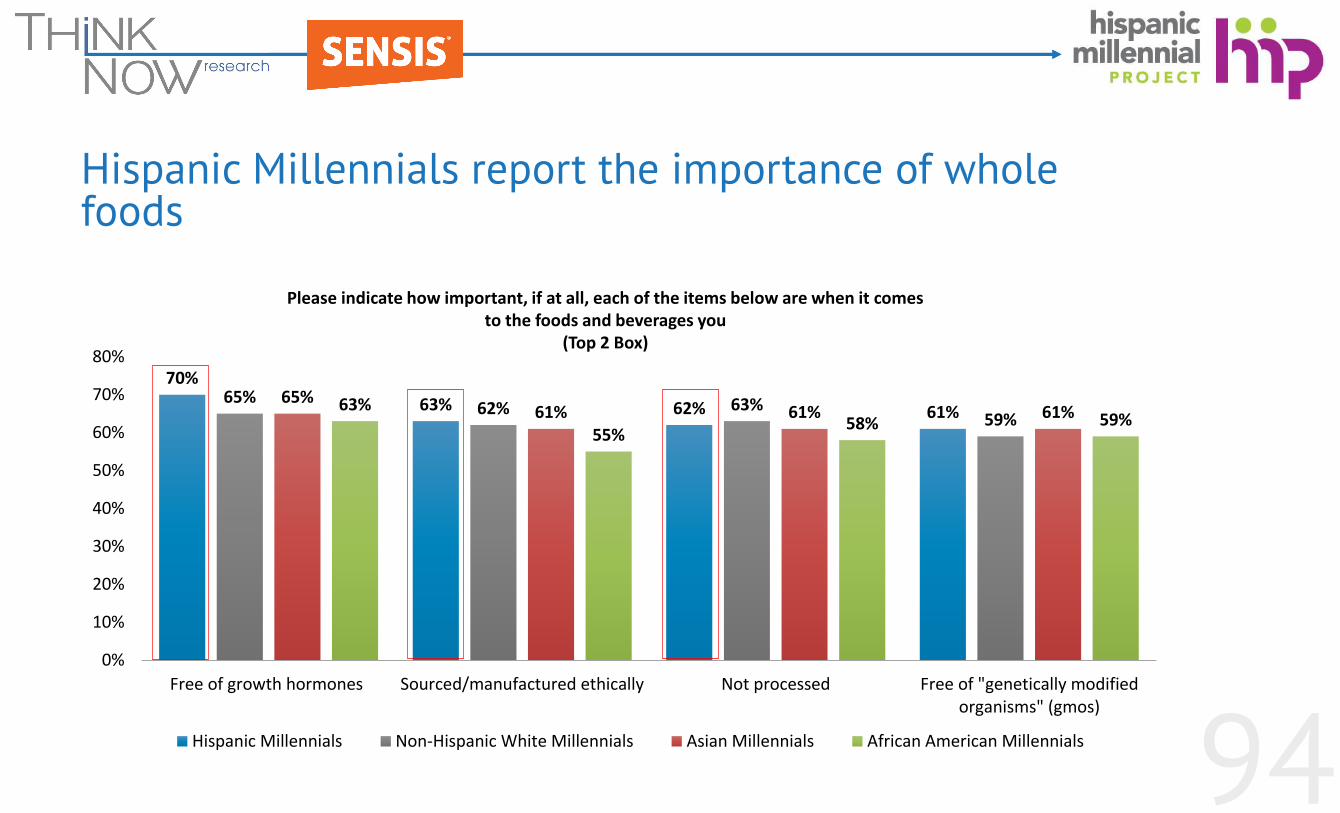
Hispanic Millennials report the importance of whole foods
70%
63% 62% 61%65%
62% 63%59%
65%61% 61% 61%63%
55%58% 59%
0%
10%
20%
30%
40%
50%
60%
70%
80%
Free of growth hormones Sourced/manufactured ethically Not processed Free of "genetically modifiedorganisms" (gmos)
Hispanic Millennials Non-Hispanic White Millennials Asian Millennials African American Millennials
Please indicate how important, if at all, each of the items below are when it comes to the foods and beverages you
(Top 2 Box)
95
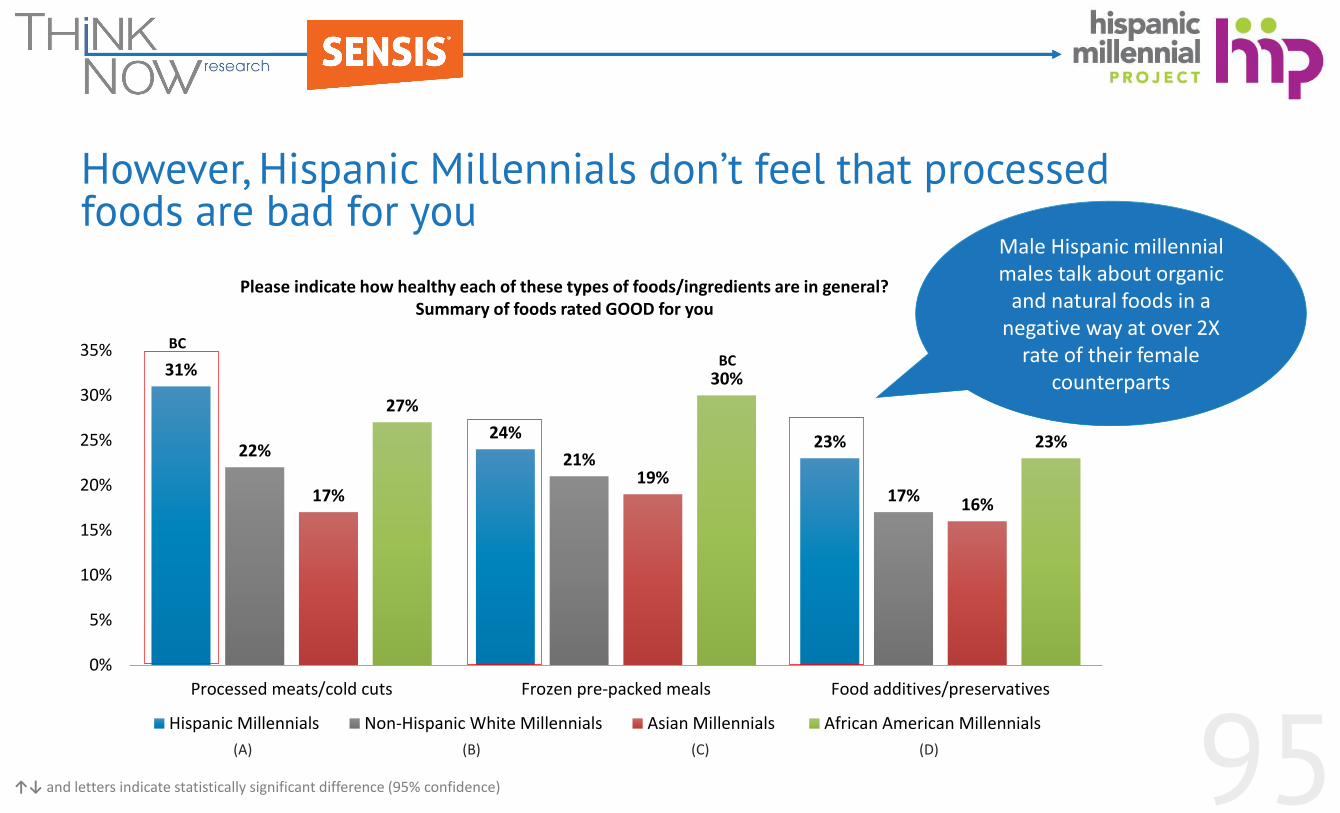
However, Hispanic Millennials don’t feel that processed foods are bad for you
31%
24% 23%22% 21%
17%17%19%
16%
27%
30%
23%
0%
5%
10%
15%
20%
25%
30%
35%
Processed meats/cold cuts Frozen pre-packed meals Food additives/preservatives
Hispanic Millennials Non-Hispanic White Millennials Asian Millennials African American Millennials
Male Hispanic millennial males talk about organic
and natural foods in a negative way at over 2X
rate of their female counterparts
Please indicate how healthy each of these types of foods/ingredients are in general? Summary of foods rated GOOD for you
↑↓ and letters indicate statistically significant difference (95% confidence)
(A) (B) (C) (D)
BCBC

96
Point of Tension #4:Home-cooked meals from the drive-thru?
97
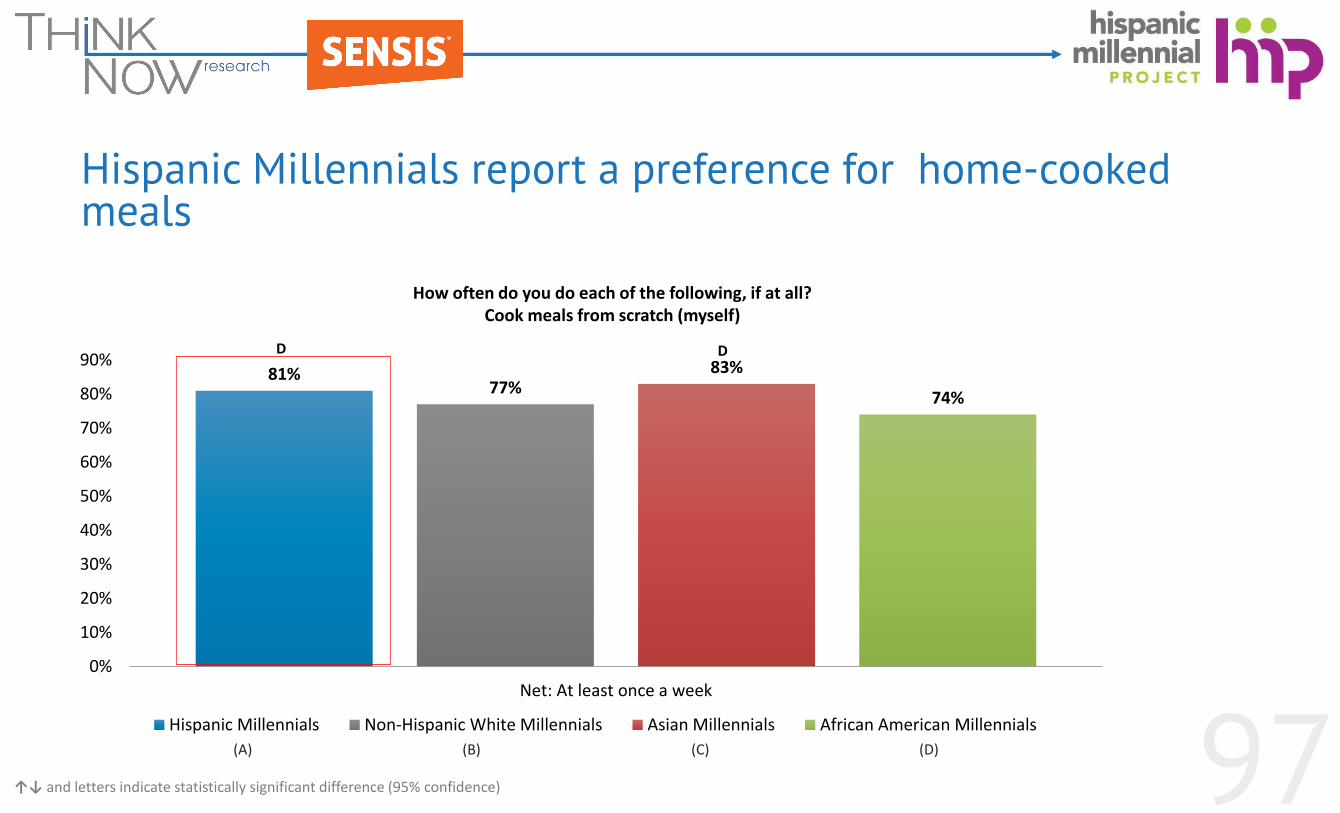
Hispanic Millennials report a preference for home-cooked meals
81%77%
83%
74%
0%
10%
20%
30%
40%
50%
60%
70%
80%
90%
Net: At least once a week
Hispanic Millennials Non-Hispanic White Millennials Asian Millennials African American Millennials
How often do you do each of the following, if at all? Cook meals from scratch (myself)
↑↓ and letters indicate statistically significant difference (95% confidence)
(A) (B) (C) (D)
DD

98
Yet are more likely to eat fast food weekly
62%
51% 52%
58%
0%
10%
20%
30%
40%
50%
60%
70%
Net: At least once a week
Hispanic Millennials Non-Hispanic White Millennials Asian Millennials African American Millennials
How often do you do each of the following, if at all? Eat at a fast food restaurant (including drive-thru)
↑↓ and letters indicate statistically significant difference (95% confidence)
(A) (B) (C) (D)
BC
99
Point of Tension #5:
Coupons dictate where you shop but not necessarily savings.
100
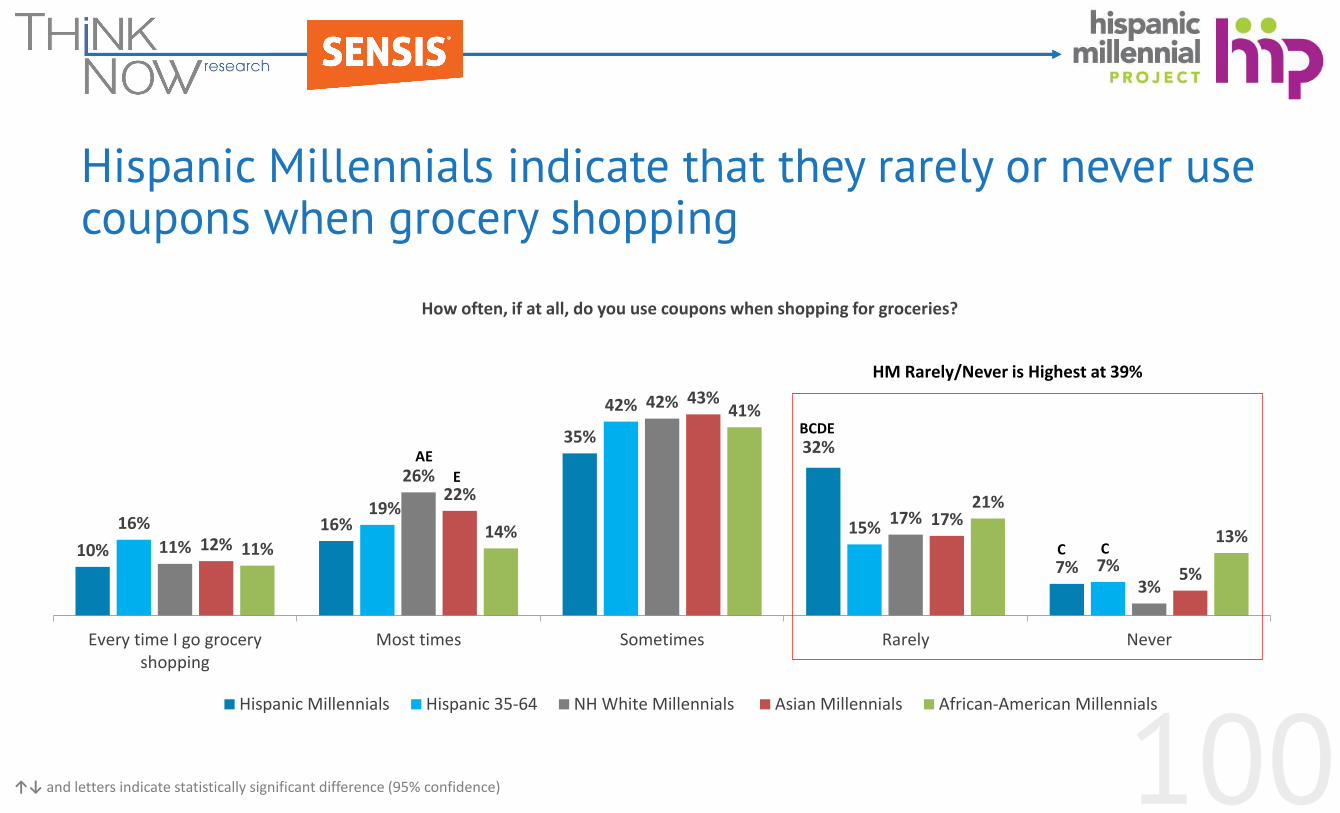
10%
16%
35%32%
7%
16%19%
42%
15%
7%11%
26%
42%
17%
3%
12%
22%
43%
17%
5%
11%14%
41%
21%
13%
Every time I go groceryshopping
Most times Sometimes Rarely Never
Hispanic Millennials Hispanic 35-64 NH White Millennials Asian Millennials African-American Millennials
C
Hispanic Millennials indicate that they rarely or never use coupons when grocery shopping
How often, if at all, do you use coupons when shopping for groceries?
HM Rarely/Never is Highest at 39%
↑↓ and letters indicate statistically significant difference (95% confidence)
AE
E
BCDE
C

101
Yet, a majority indicate coupons impact where they shop…
61%66%
59%
71%
53%
Yes
Hispanic Millennials Hispanic 35-64 NH White Millennials Asian Millennials African-American Millennials
Do coupons impact where you shop for groceries?
(A) (B) (C) (D) (E)
↑↓ and letters indicate statistically significant difference (95% confidence)
EACE

102
Point of Tension #6:
“I don’t like my parents’ beer, well kind of…”
103
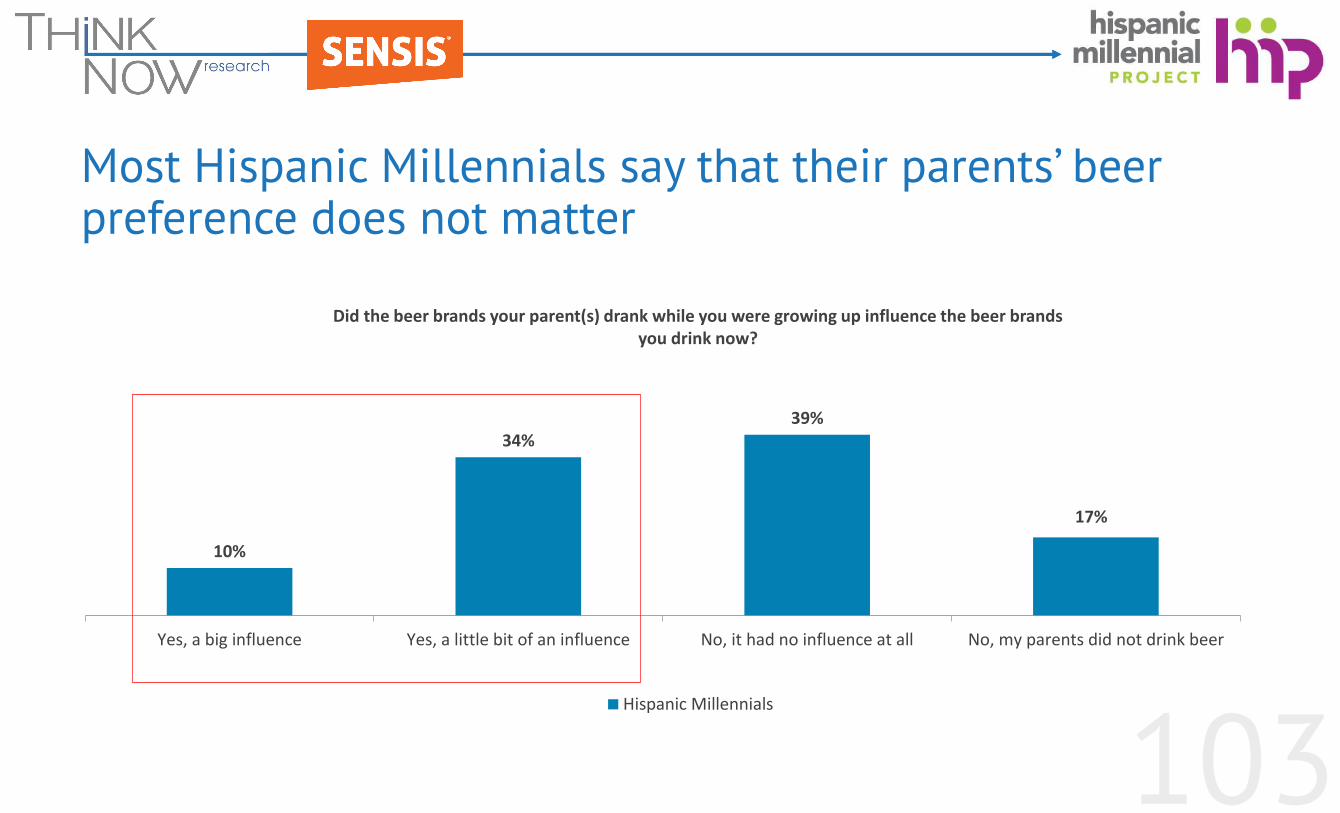
10%
34%39%
17%
Yes, a big influence Yes, a little bit of an influence No, it had no influence at all No, my parents did not drink beer
Hispanic Millennials
Did the beer brands your parent(s) drank while you were growing up influence the beer brands you drink now?
Most Hispanic Millennials say that their parents’ beer preference does not matter
104
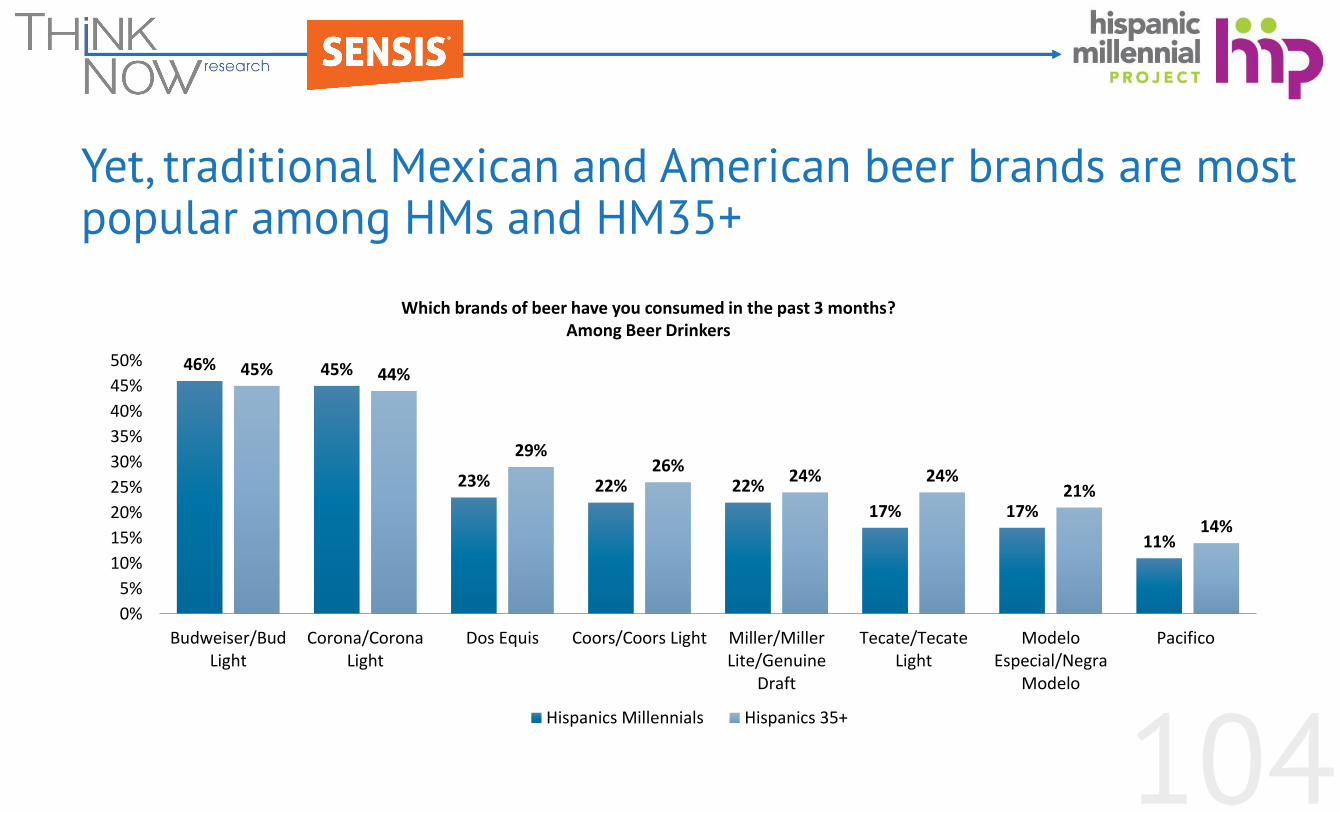
Yet, traditional Mexican and American beer brands are most popular among HMs and HM35+
Which brands of beer have you consumed in the past 3 months?Among Beer Drinkers
46% 45%
23% 22% 22%
17% 17%
11%
45% 44%
29%26%
24% 24%21%
14%
0%
5%
10%
15%
20%
25%
30%
35%
40%
45%
50%
Budweiser/BudLight
Corona/CoronaLight
Dos Equis Coors/Coors Light Miller/MillerLite/Genuine
Draft
Tecate/TecateLight
ModeloEspecial/Negra
Modelo
Pacifico
Hispanics Millennials Hispanics 35+
105
Implications for Marketers
106
Identify and leverage
points of tension
107
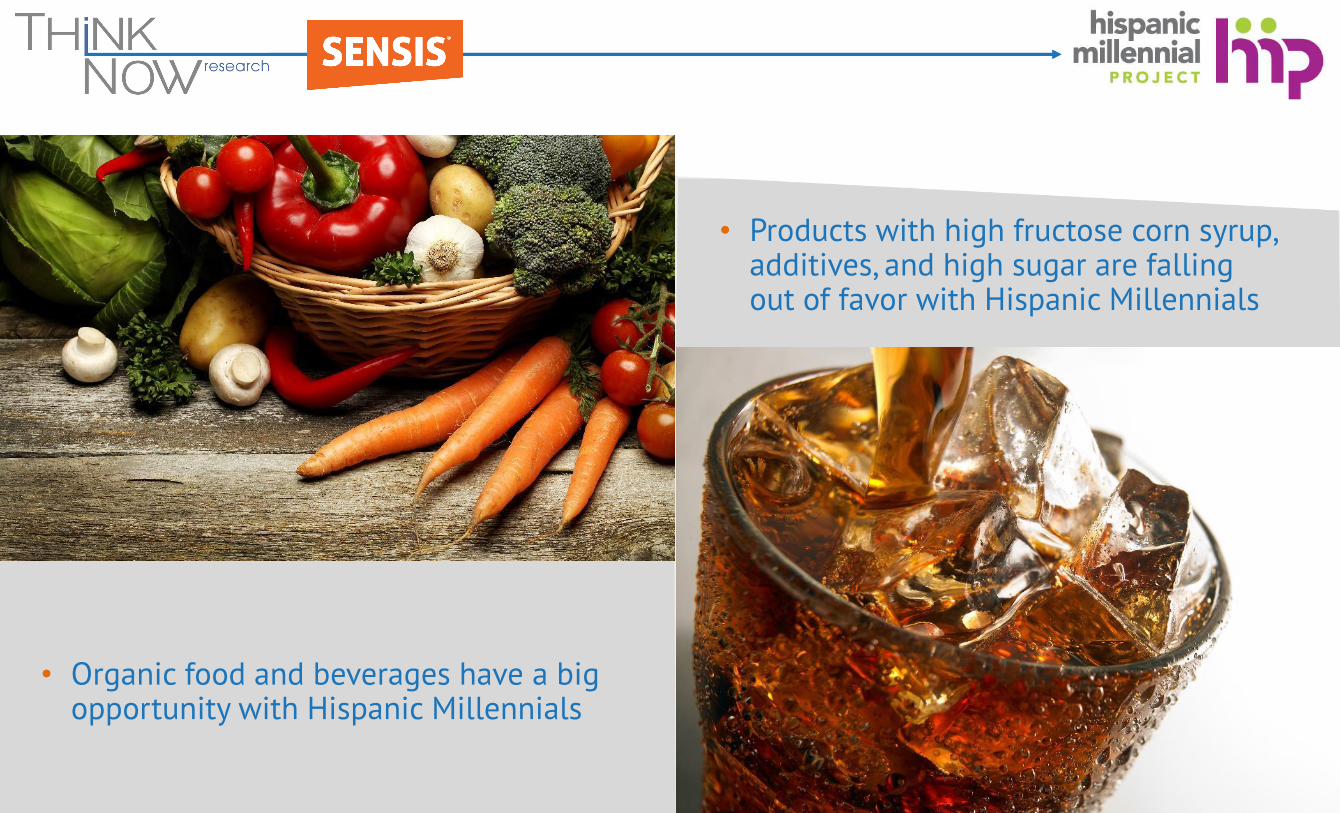
• Products with high fructose corn syrup, additives, and high sugar are falling out of favor with Hispanic Millennials
• Organic food and beverages have a big opportunity with Hispanic Millennials
108
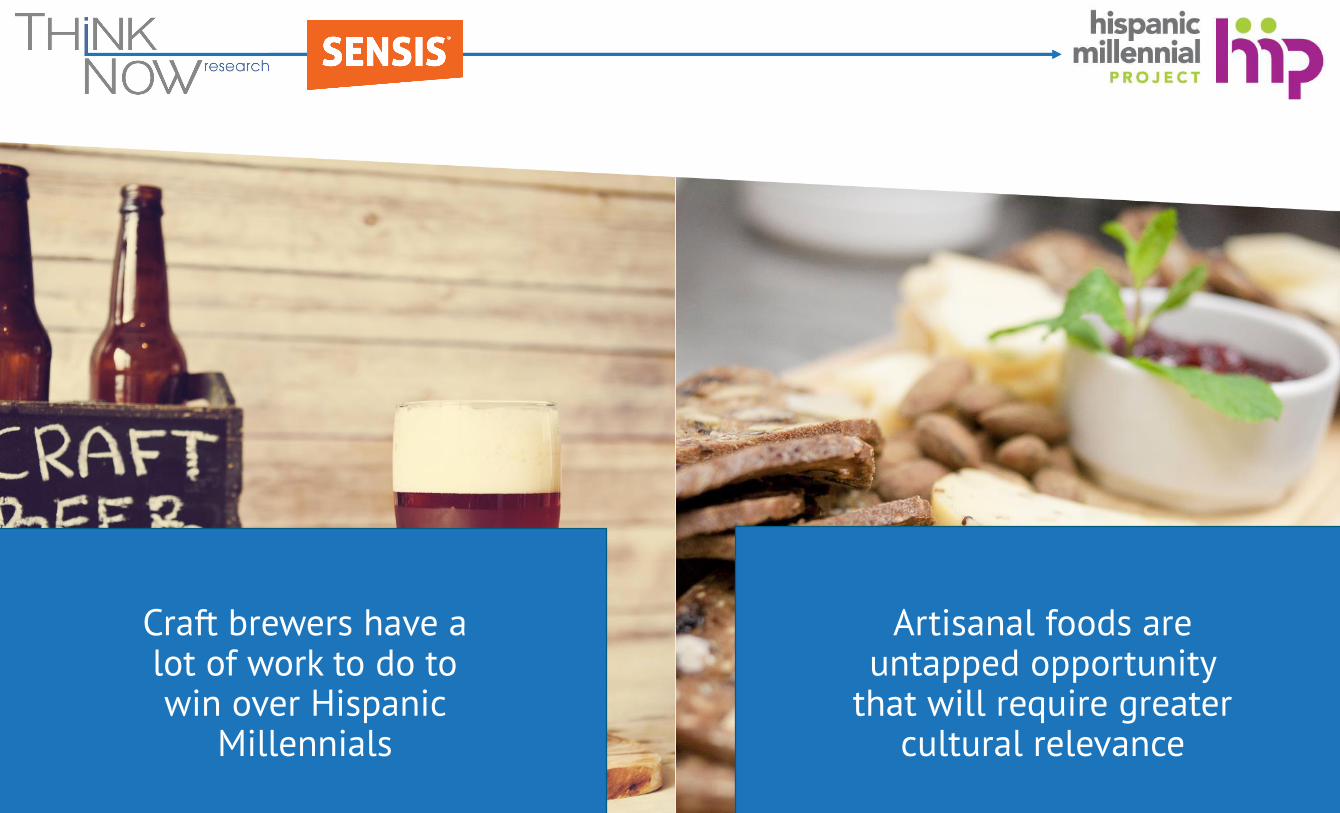
Artisanal foods are untapped opportunity
that will require greater cultural relevance
Craft brewers have a lot of work to do to win over Hispanic
Millennials
109109
Ethnic and culturally relevant recipes offer a huge opportunity for food, beverage and
Recipes matter to Hispanic Millennials
110
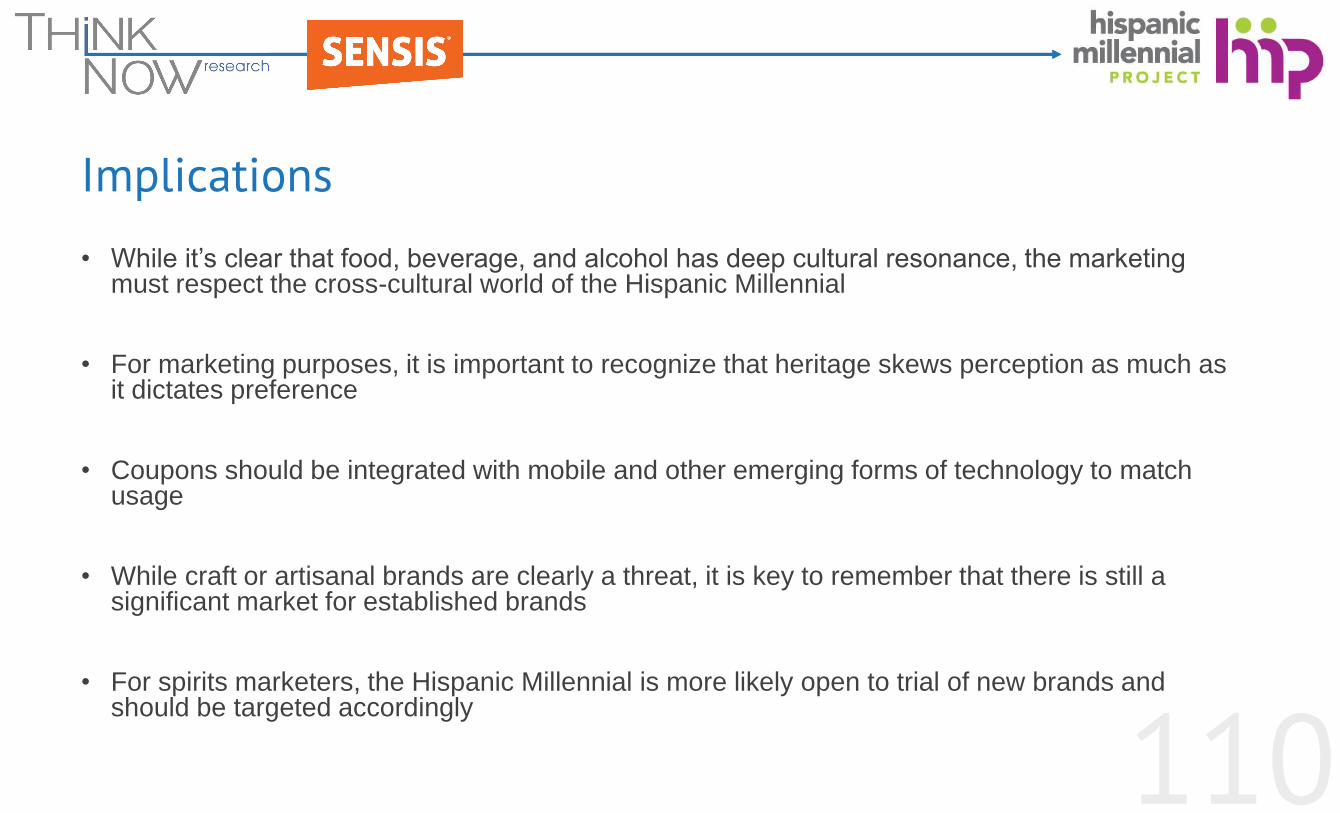
Implications
• While it’s clear that food, beverage, and alcohol has deep cultural resonance, the marketing must respect the cross-cultural world of the Hispanic Millennial
• For marketing purposes, it is important to recognize that heritage skews perception as much as it dictates preference
• Coupons should be integrated with mobile and other emerging forms of technology to match usage
• While craft or artisanal brands are clearly a threat, it is key to remember that there is still a significant market for established brands
• For spirits marketers, the Hispanic Millennial is more likely open to trial of new brands and should be targeted accordingly
111
Key Findings and Implications from previous HMP Waves
112
Key Findings Consistent Themes Across Waves 1-4
• Hispanic Millennials trust brands like Coke and Pepsi
• Hispanic Millennials have nuanced and multi-faceted definitions of concepts like wealth, health and happiness
• Embrace technology – both for financial services and health
• Hispanic millennial is key decision-maker in Hispanic household
113
Key Findings Consistent Points of Conflict Across Waves 1-4
• Wanting to fit in vs. standing out
• Eating Right Important Yet Difficult
114
What’s Next
115
Next Phases of The Hispanic Millennial ProjectUpcoming Final Wave
Each wave of The Hispanic Millennial Project is focusing on a different topic relevant to this segment:
• Wave 5: Media Consumption, Entertainment & Digital Behavior (July 2015)

116
Download the report here:www.thinknowresearch.com/downloads/
117
Roy Eduardo Kokoyachuk
Partner
ThinkNow Research
@ThinkNowTweets
thinknowresearch.com/blog
Roy Eduardo Kokoyachuk