historic droughts beyond the modern instrumental … · technical report no. 35 historic droughts...
TRANSCRIPT

Technical Report No. 35
HISTORIC DROUGHTS BEYOND THE MODERN INSTRUMENTAL RECORDS:
AN ANALYSIS OF CASES IN UNITED KINGDOM, FRANCE, RHINE AND SYROS
Emmanuel Garnier, Dionysis Assimacopoulos, Henny A.J. van Lanen 31 March 2015

Technical Report No. 35 - i -
DROUGHT-R&SPI (Fostering European Drought Research and Science-Policy Interfacing) is a Collaborative Project funded by the European Commission under the FP7 Cooperation Work Programme 2011, Theme 6: Environment (including Climate Change, ENV.2011.1.3.2-2: Vulnerability and increased drought risk in Europe (Grant agreement no: 282769). The DROUGHT-R&SPI project started 01/10/2011 and will continue for 3 years.
Title: Historic droughts beyond the modern instrumental records: an analysis of cases in United Kingdom, France, Rhine and Syros
Authors: Emmanuel Garnier, Dionysis Assimacopoulos, Henny A.J. van Lanen
Organisations: CNRS-Université de Caen Basse Normandie, France NTUA, National Technical University of Athens, Greece WU, Wageningen University, the Netherlands
Submission date: 23 September 2014; revised 31 March and 5 July 2015
Function: This report is an output from Work Package 2; Task 2.8.
Deliverable: This report contributes to DROUGHT-R&SPI Deliverable D2.9 Cover: Engraving of the procession ‘pro pluvia’ in Paris during the great European drought of 1694.
Source: Bibliothèque nationale de France, 62 C 2000L (E. Garnier)

Technical Report No. 35 - ii -
Abstract The results presented in this report were obtained within the framework of the EU PP7 project “Fostering European Drought Research and Science-Policy Interfacing” (project number 282769). The project aims to reduce Europe’s future vulnerability and risk of drought by innovative in-depth studies that combine drought investigations in case study areas in water stressed regions with drought analysis at the pan-European scale. In this perspective, a historical approach also has been deployed to improve understanding of the frequency and severity of the droughts during the last 500 years as well as the reactions of ancient societies. This approach mainly covers the period beyond instrumental records, and hence it substantially adds to the knowledge on past drought.
Droughts are well-known in history and because of their impacts on societies there are multiple evidences in the archives of the last 500 years. This report shows how combining textual and instrumental data recorded in the archives since the 16th century improved knowledge on European droughts between 1500 and 1950. Results are presented based on a specific method well adapted to the content of the available sources. In this context, several cases in Britain, France, Jucar Basin (Spain), Upper Rhine valley and Syros (Greece) were investigated to better understand the variation of these climatic extreme events during the last 500 years across European regions and their social and economic impacts on Europe’s ancient societies.
The Historical Severity Drought Scale (HSDS), which was used in this study to estimate the severity of historic droughts prior to the availability of instrumental data, showed to be a reliable measure. Key drought events in Europe since 1500 were identified (e.g. 1566, 1666, 1719, 1818, 1893, 1921 drought) based on a range of hydrometeorological information and documentary evidence of the impacts. An intercomparison of common reconstructed long drought series in England, the Ile-de-France and the Upper Rhine Valley showed that the English droughts were identical to those in the Ile-de-France in 32% of cases for the period 1500-2009 against 26% in the Upper Rhine Valley.
The historical drought time series from England, France and Rhine do not prove any increase in frequency of dry episodes since the 16th century. However, the historical approach requires careful consideration, because the HSDS is based upon impacts, and hence, it is associated with a region’s vulnerability to drought. For this reason the droughts in Syros Island were investigated in more depth to explore the link between drought and vulnerability. It appeared that vulnerability was affected by factors such as the rapid population growth, change in agricultural practices (greenhouse cultivations) and the success of new water supply measures (desalinization plants). Re-introduction of historical land and water management measures is expected to decrease drought vulnerability in the island.
Long term historical reconstructions of droughts are very useful for the climatologist and the hydrologist. History can be a mean to improve reliability of climatological and hydrological models by exploring if these models can capture past drought events of 50 years ago or more. The authors would like to thank the citizens and professionals of Syros Island who provided valuable help in collecting the information used for the historical analysis of droughts in Syros Island.

Technical Report No. 35 - iii -
Table of Contents Page 1. Introduction 1 2. Data and methodology 3 2.1 The historic material 3 2.2 Rebuilding drought of the past 5 3. Case studies 9 3.1 United Kingdom 9 3.1.1 Chronological fluctuations and severity of the UK droughts 9 3.1.2 The most extremes droughts in the last 500 years 11 3.2 Ile de France (France) 15 3.2.1 Chronological fluctuations and severity of the French droughts 15 3.2.2 Two examples of very severe droughts 18 3.3 Upper Rhine Valley (Germany, Switzerland, France) 19 3.3.1 Chronological fluctuations and severity of the droughts
in the Upper Rhine valley 20 3.3.2 The drought subject of collective memory in the Upper Rhine Valley 22 3.4 Syros (Greece) 24 3.4.1 Population rise and urbanization 1700-2011 25 3.4.2 Chronological fluctuations and severity of the droughts 28 3.4.3 Resilience strategies 30 3.4.4 The historic inheritance: a tool of resilience 32 4. Comparison of historic European droughts 34 5. Conclusions 38 References 40 Annexes Annex 1 Monthly precipitation (in mm) at the Radcliffe Observatory Oxford between
1853 and 2012 (Source: Meteorological Observations of the Radcliffe Observatory Oxford) 43
Technical Report No. 35 - 1 -
1 Introduction Trends in past droughts were extensively studied in the DROUGHT-R&SPI project. The European Drought Reference Database (EDR) (Stagge et al., 2012) that covered droughts from the second part of the 20th century onwards was a useful mean. Prior to the DROUGHT-R&SPI project, Stahl et al. (2010) already found increasing trends in annual streamflow in the northern part of Europe since 1960, whereas the opposite happened in the Mediterranean. A striking result was the decreasing trends in August streamflow and summer low flow measures almost in the whole of Europe (middle and northern part of Scandinavia were an exception). The study from Stahl et al. (2010) only used observed natural streamflow data, and hence substantial areas in Europe were not covered (data inaccessible, disturbed flow data due to human activities), in particular in the southern and south-eastern part of Europe, as well as some countries in the north (e.g. Poland). A multi-model ensemble of large-scale hydrological models was applied to fill in the data gap and to obtain trends in runoff across the whole of Europe since the 1960s (Stahl et al. 2012a). Although the models appeared to have their limitations (Van Huijgevoort et al., 2013; Tallaksen and Stahl, 2014), the results more or less confirmed the earlier findings for the areas with trends in the observations. More importantly, the study showed that for areas in the south and southeast without accessible or disturbed flow data, the decreasing trend in runoff was rather severe. Complementary to the pan-European study, trends were investigated in more detail in the Case Study areas of the DROUGHT-R&SPI project using the same multi-model and driving force data (Alderlieste and Van Lanen, 2012). Not surprisingly, the outcome of this study was in line with the findings from Stahl et al. (2012). In addition to the trend analysis with modelled data, observed hydrometeorological data were collated in the Case Study areas. Observed data generally are more representative than modelled data, but the trends in the observed data were not so obvious because often different periods were used (number of years, period covered) or different time scales (daily, monthly) (Van Lanen et al., 2013). The above-described studies are about trends in the natural hazard, i.e. societal exposure to the dry extreme. Interesting is how society has been impacted. In the DROUGHT-R&SPI project Stahl et al. (2012b) collected impacts of drought across Europe since 1900, which allowed to explore regional patterns, temporal trends and to quantify likelihood of occurrence. A challenge for the DROUGHT-R&SPI project was to explore how representative is the period since the 1960s with instrumental records in a long-term context (i.e. centuries). It is known from historic reports that people already suffered from severe drought already far beyond the instrumental record. These records are stored in archives and are mainly impact driven. Questions arise, if these droughts were more extreme, more frequent than those found in the observed records from the recent past. One of the objectives of the DROUGHT-R&SPI project was to carry out a historical analysis of droughts in (parts of) Europe by using administrative records as well as other documentary reports, and incidental observed historical meteorological data as far as available. In other words, the aim was to undertake a historical analysis mainly beyond the instrumental record. This historical analysis is anticipated to provide insight into the frequency of past drought events as well as their spatial distribution. It is carried out on the basis of information collected from the XVth century onwards. Drought events left multiple evidences in the archives of the last 500 years. For the record, it is necessary to realize that generally the term ‘drought’ covers different notions. Most often drought is synonymous with a precipitation deficit of an extreme nature. Droughts are in the historic record because of their impacts on society. It is thus important to understand that for the historian drought is viewed through the 'social signature' of these extreme events as recorded over the centuries in the European archives. This implies that the historian’ perspective of drought is impact oriented, like Stahl et al. (2015b), rather than solely natural hazard oriented as often is done by hydrologists. This also implies that typical identification and categorization approaches have to be used to generate time series that enable comparison with the drought information derived from time series of instrumental records. The historic experience is supposed to bring facts on past responses to drought in

Technical Report No. 35 - 2 -
terms of restricted water use, policies of prevention and management of drought in ancient landscapes often better adapted to temporarily lack of water. The report starts with a brief description of the historic material and then it continues with the method used to build historical drought series using the collected material (Chapter 2). Chapter 3 describes the outcome for four cases: (i) United Kingdom, (ii) Ile de France, (iii) Upper Rhine Valley, and (iv) Syros island. For each case the chronological fluctuations and severity is described, which is followed by a description of selected historic extreme droughts. The report concludes with an intercomparison of extreme droughts across Europa and Conclusions (Chapters 4 and 5).

Technical Report No. 35 - 3 -
2 Data and Methodology
2.1 The historic material Because of the unpredictable character of drought and the absence of civil services specially dedicated to the study of these extreme events before the middle of the 19th century, historians have to make maximum use of the entire body of sources. The information needed is often hidden at random in the margins of some documentation, and any type of archive cannot be neglected if the aim is to reconstruct long and relatively reliable chronologies1. Diaries drafted by private persons (priests, middle-class persons, aristocrats), and municipal chronicles are particularly useful. Besides the private, economic and political events, they include information about the extreme events which might lead to a disaster, etymologically (kata and strophe) an upset. Certain authors provide an integrated approach describing/analysing drought by combining the visual observations (heights of water on the hydrological scales on bridges) with the phenology (state of the vegetation, the fires), the prices on markets and even its social expression (scarcity, religious processions, riots). From 1750s, some diaries became real meteorological journals because of the new passion for the meteorology in Europe. These diaries contain daily meteorological data (Fig. 1).
Figure 1. Extract of Thomas Barker's meteorological Journal (Cambridgeshire, UK) for the summer
of the big European drought of 1785. The page indicates the temperatures, the precipitation as well as the state of the sky during August. Source: National Meteorological Library and Archives b1488027. Met Office, Exeter.
The Catholic Church is a faithful ally of the historian studying droughts. Ex voto, small naive paintings hung on in churches in France, in Spain, in Portugal and in Italy, are iconographic testimonies, which very 1 Garnier E (2010): Climat et Histoire, XVIe-XIXe siècles. 57-3. Revue d’Histoire Moderne et Contemporaine, Paris, Belin.

Technical Report No. 35 - 4 -
frequently concern a meteorological anomaly. Often up to the 18th century, the extreme event (drought, storm, flood) was considered a demonstration of the God’s wrath. That is why the ancient societies asked the Church for an intervention. Thanks to the religious processions, the historian has relatively homogeneous series of drought information in the archival and historic plans because they emanate from the same lay or religious institution which registers them over long periods. These religious ceremonies allow reconstruction of historic series covering the period 1500 and 1800, sometimes even beyond in the Spanish case. The Roman Catholic Church or the municipal authorities ordered these qualified ceremonies of rogations (rogativas) in Spain or processions in Portugal and in France to avoid endangering the established order or the socio-economic balance. In the case of droughts, processions were organised pro pluvia, literally 'for the rain'. Then in regions where wars spared cities, the historian has very precious municipal archives. They contain the registers of the municipal deliberations and the accounts. These documents begin frequently from the end of the 15th century. Deliberations and municipal accounts constitute an inexhaustible deposit of climatic data. The meteorological information is omnipresent in these registers and arises from an understandable desire to anticipate the risks of breaks in supplies, of diseases and riots. So any sustained drought sparks off a discussion within the government of the city. That is why the state or municipal authorities intervened by using diverse tools as processions, price controls, requisitions of wheat, and imports of wheat, for example, in the case of Valencia, Spain, from the 15th century.
Figure 2. Cover of the Societas Meteorologica Palatina Ephemerides (1783) of Mannheim. Source:
Bayerische Staatsbibliothek München, Bl., 424 S., (9) Bl Unlike temperature data, which appear around 1700s, instrumental data on precipitation or water flows are available from the beginning of the 19th century, as a result of the creation of scientific societies as the Royal Society of London, the Royal Academy of Sciences of Paris or the Societas Meteorologica Palatina of Mannheim in Germany (Fig. 2). They may also have been produced by the engineers responsible for river management.

Technical Report No. 35 - 5 -
2.2 Rebuilding the droughts of the past To address lack of reliable instrumental data before 1750, the contents of archives offer two methodological approaches to identify these natural events for which we have only textual descriptions. The first solution is to use all the chronological remarks of a drought appearing in archives. Concretely, it is a question of noting for example, the first mention of a religious procession pro pluvia, then the municipal acts, which evokes the drying up of the public fountains, the ban on drawing water from certain places, the layoff of wheat mills and, in the most extreme cases, the problems of supply of wheat and wood via waterways. Naturally, this list is not exhaustive. However, the location of these indicators in archives allows proposing duration in days for the very great majority of the droughts in the past. This choice is acceptable because today the World Meteorological Organization characterizes the drought, among others, according to the number of days without rain (i.e. consecutive number of dry days, CDD). Nevertheless, professional ethics require us to specify that the duration defined by the historian does not correspond to a total absence of rain, which might be an intrinsic climate characteristic at that location, but rather to its chronological perception by societies. Therefore the drought of the historian is defined as a very dry and long episode with sufficiently important economic and human impacts to appear in the archives of the time.
Figure 3. Estimate of the duration and severity of the Jucar drought (Spain) of 1725-1726.
The second methodological approach, which can complete the evaluation by duration (see above) consists of creating an indexed scale of severity directly built according to the descriptive contents of the drought. Naturally, it results from a systematic inventory of the impacts engendered by the extreme event on societies. The list below lists the types of drought-related damage mostly described in the archives:
- Processions (Catholics) or prayers (Protestants) pro pluvia - Early grape harvest dates - Plants dry and die - No harvest or bad harvest of hay and wheat - Low water - 'No rain' during the period - Drying up of springs - The ground is cracked - We can ford a river - Layoff of wheat mills - Forest fires - The cattle dies of thirst - Riots around the springs - Shortage or/and famine

Technical Report No. 35 - 6 -
Thus, the historian can observe the chronology of an event, which is well recorded in archives. Figure 3 gives the chronology of a particularly severe drought, which affected the region of Valencia in 1725 and 1726. From this inventory we introduced a Historical Severity Drought Scale (further called HSDS) was introduced, which ranges between the Index= - 1 and the Index 5, as shown in Table 1.
Table 1. Method of the Historical Severity Drought Scale (HSDS, 16th-18th centuries)
Index Descriptions
5 exceptional drought: no possible supply, shortage, sanitary problem, very high prices of wheat, forest fires
4 severe low-water marks: impossible navigation, layoff of wheat mills, search for new springs, forest fires, death of cattle
3 general low-waters (difficulties for navigation) and water resources
2 local low-waters of rivers, first effects on vegetation
1 absence of rainfall: rogations, prayers, evidences in texts
-1 insufficient qualitative and quantitative information but the event is kept in the chronological reconstruction
At the level Index=1, the absence of precipitation (meteorological drought) is reported. If this continues, agriculture is affected and a fall in levels of water is observed in the records (Index=2). For Index=3 and 4, the state of the resources becomes important. The situation deteriorates as the absence of precipitation affects societies with a high price of farm products, a layoff of wheat mills and a degradation of the ecosystems (Index=4). The paroxysm of the social crisis is reached with Index=5 when the drought has propagated from a meteorological into a hydrological drought with a very clear deterioration in living conditions and an increase of the social tensions about access to water. Figure 4 provides, as an example, the HSDS time series for the Jucar River basin in Spain for the period 1500-1900. These various types of droughts are not independent. The absence of rainfall results from a meteorological drought. The ground dries out because of the evaporation, wind and heat (soil water drought). When continuing, water resources decrease, the drought affects phreatic levels and then all hydrological variables (e.g. Tallaksen and Van Lanen, 2004).

Technical Report No. 35 - 7 -
Figure 4. Severity of droughts in the Jucar Basin (Spain) in the period 1500-1900. Red columns indicate the severity of drought according to the severity index scale (HSDS).

Technical Report No. 35 - 8 -
Table 2. Extract from historical database of the Jucar Basin
Location River Year Date Comments Relative duration
Severity index
Valencia Jucar Basin
1412 Que com per esguard de la seccada e sterilitat el any present, que per nostras paccats era estada en aquestra ciutat
1 year 5
Orihuela Segura 1726 Februar Rogativas ad petendam pluviam
30 days 2
Valencia Jucar Basin
1815-1816
Las sequais extraordinarias de 1815 y 1816, las que dieron margen a abusos tan considerables y a tanta indigencia que à cado paso se veia uno asaltado, robado, espueto a mil insultos y usurpaciones
2 years 4
Finally, the method then consists of building a database. An example is presented here for the Jucar Basin (Table 2). The database is divided into several columns with information. From left to right, the following information is successively provided: the location, the river affected by the drought, the date (month, and day where they are indicated by archives), an example of the comments in the archives, and finally the relative duration deduced from the records in archives, and the index of severity (HSDS), which is described in detail in Chapter 3.

Technical Report No. 35 - 9 -
3 Case Studies
3.1 United Kingdom Multiple archives and printed sources were exploited in Cambridge and in London, in particular the remarkable diary of Samuel Pepys, Secretary of the Admiralty under the reign of Charles II and James II2, in order to analyse drought events in the UK. 3.1.1 Chronological fluctuations and severity of the UK droughts The available British archives allowed us to count 42 droughts of variable severity according to the Historical Severity Drought Scale (HSDS) between 1500 and 2012. As shown in Figure 5, the chronology shows very strong disparities from one century to the next in terms of frequencies and severity.
Figure 5. Chronology and severity of droughts in Britain between 1500 and 2014 according to HSDS
(total 42 droughts).
First of all, the distribution of these extreme events by periods of 50 years (Fig. 6) reveals the big dry phases of the history of Great Britain since the 1500s. A rather clear break between the period prior to 1700 and the last three centuries is observed. The first period indeed has only 11 events against 31 for the last 300 years. This low number before 1700 can be explained in two ways. The first one would be the less rich historic documentation during the period, and the lack of archives. The second reason, doubtless the most relevant, would be connected to the climatic context of the period. Indeed, the 16th and 17th centuries correspond in Europe to a very severe phase of the Little Ice Age (1300-1850) which is characterized by much wetter and cooler seasons, particularly between 1540 and 1640 and then 1683-16933.
2 Cambridgeshire Archives: Memorials and petitions presented to the Bedford Level Corporation. Cooper CH (1827): Annals of Cambridge. Warwick, Cambridge. (1827): Chronicle of London. London, Taylor. Smith John (1825): Memoirs of Samuel Pepys, Esq. F.R.S., Secretary to the Admiralty in the reigns of Charles II. and James II., comprising his Diary from 1659 to 1669. London, Henry Colburn. 3 Leroy Ladurie E (1972): Times of Feast, Times of Famine: A History of Climate Since the Year 1000. London, Georges Allen & Unwin. Garnier E (2010): Les dérangements du temps, 500 ans de chaud et froids en Europe. Paris, Plon.

Technical Report No. 35 - 10 -
Figure 6. Distribution of British droughts by 49-year periods between 1500 and 2014.
After the 1700s, drought clearly became more frequent. The first dry episode corresponds to the years 1700-1750 during which continental Europe experienced different weather conditions. So from 1705 and till the end of 1730s, the climate was hotter and drier, even if 1709 is called nowadays the year of the "Great Winter" in Europe. Moreover, several droughts such as those of 1714, 1715, 1740 began during very cold and very dry winters. The second turning point occurs after 1800 with a greater frequency of droughts, which might be attributable to the beginning of global warming from around 1830-1850. From then on, every period of 50 years is characterized by 6 and 7 dry events, although a real increase in drought is observed from the 1950s onwards.
Figure 7. Distribution of the severity of British droughts by periods of 49-years between 1500 and
2014 according to HSDS.
0
1
2
3
4
5
6
7
8
0
1
2
3
4
5
6
7
8
index 1 index 2 index 3 index 4 index 5

Technical Report No. 35 - 11 -
On the other hand, the chronology and the distribution of the droughts according to their severity index (HSDS) do not confirm the previously suggested observations. The period prior to 1700, which was characterized by a low number of droughts, presents a majority of average severity drought events according the HSDS scale (Index=3). The most severe episodes (Index=5) are found in the second part of the 19th century (HSDS≥4), while droughts in the 20th century seems more moderate in severity with most of the events having a HSDS ≤3. There are numerous events between 1950 and 1999, but they are not associated with an increase of droughts with HSDS=5.
Figure 8. Comparison of the UK droughts between the HSDS and the Oxford rainfall 1767-2012.
Source: Meteorological Observations at the Radcliffe Observatory Oxford.
Finally, the monthly precipitation data from Oxford since the 18th century allowed a comparison of this series with the droughts estimated according to the HSDS (Fig. 8). Good similarities between the historic events listed in archives and the periods of precipitation deficits are noticed. Nevertheless, the droughts with HSDS=5 do not correspond in all cases to periods with lowest precipitation. For instance, the extremely severe droughts of 1785 and 1976 (both with HSDS=5) do not coincide with the lowest rain levels in Oxford. This discrepancy might be explained by local precipitation being different to the rest of the country or by other meteorological factors, such as wind, which could have aggravated the drought. 3.1.2 The most extreme events in the last 500 years It is important to specify that a large number of droughts prior to 1800 were systematically associated with epidemics. Up to the great drought of 1666, most of them correspond to the worst British plague epidemics (in 1544-1546, 1592-1593, 1665-1666). After the fire of London, the droughts from then on were more often associated with epidemics of fevers and smallpox. It would thus seem plausible that low water levels favoured the pollution of water courses, which in turn induced the epidemics. The drought of 1634 In his diary, Samuel Rogers, Chaplain of Bishop’s Stortford, says about the 1634 drought ‘it is a sad thing to consider the sad seasons we have had this year, and this, a most heavy drought, the last year in the former part of the summer, which burnt up the grass, scarse raine for a quater together, yet then a michlemasse spring; this yeare in the former part, a singeing, year scorching drought, heavye, gods people mourned, and made the heavens weep; but the lord hath turned raine into a crosse justlye’.
0
1
2
3
4
5
6
0
200
400
600
800
1000
1200
1767
1775
1783
1791
1799
1807
1815
1823
1831
1839
1847
1855
1863
1871
1879
1887
1895
1903
1911
1919
1927
1935
1943
1951
1959
1967
1975
1983
1991
1999
2007
Index severity (HSDS) Oxford rainfall

Technical Report No. 35 - 12 -
This extract of archives (in old English) thus underlines the severity of the drought but especially reveals the way it was perceived by the population at least till the beginning of the 18th century. As often, the extreme event is seen as a sign of God’s wrath. So Samuel Rogers declares that ' the Lord is angry with us a most sinful nation'. In reality, the year of 1634 actually is a social and economic disaster. The plague, fevers and smallpox ravage the cities of London, Newcastle, the ports of the kingdom, and Essex. At Cambridge, the drought which rages for three years, is explained by the drainage of Fens which began at the beginning of the 17th century rather than God’s wrath4. The disastrous national drought of 1666 According to numerous authors of that time, the 1666 drought would be the cause of the ‘Great Fire’ of London on September 2nd, 1666. Fortunately for the historian, the documentation dealing with this catastrophic climate-related event is particularly rich. In particular, there are several diaries available of which the best known are those of Samuel Pepys and John Evelyn5. These are of great importance because both were direct actors in the events. Samuel Pepys (1633-1703) was the Secretary of the Admiralty and later President of the Royal Society of London, whereas John Evelyn (1620-1706) was a renowned scientist and a founder of the Royal Society of London. Their diaries are indispensable to understand the history of the drought and the Great Fire of London. Another remarkable witness of the event was the philosopher John Locke, who studied in Oxford (Christ Church College) at the time. Besides his philosophical works, he also used to record multiple meteorological variables, such as temperature, humidity, atmospheric pressure, wind-direction and wind-strength. These historical data are nowadays underestimated even though they constitute probably the first meteorological reports of Great Britain. These data were published in 1692 in Boyle’s General history of the air (Fig. 9)6.
Figure 9. Meteorological statements of the English philosopher John Locke in Oxford during the drought and ' Great Fire ' of 1666. Source: Bodleian Library, University of Oxford, QC 161 B69 1692.
4 Webster T, Shipps K (2004) : The Diary of Samuel Rogers, 1634-1638. Woodbridge, The Boydell Press, p. 66. Fuller T (1811) : The History of the University of Cambridge, London, James Nichols, p. 149. 5 Bray W (1901) : The Diary of John Evelyn. Vol 2, Walter Dunne, p. 27. Fraser J (1905): Chronicles of the Frasers. Edinburgh, Constable, p. 465. 6 Boyle R (1692) : The General History of the Air. London, Awnsbam&John Churchill, p. 104-108.

Technical Report No. 35 - 13 -
In his diary, John Evelyn declares on October 21st, 1666, that the season after a long and extraordinary dryness between July and September, was totally unprecedented. He explains that the dry episode began during the plague of 1665 and that it was aggravated by a cold and very dry winter (1666) then a particularly warm summer. Rain was rare between November, 1665 and September, 1666. John Locke's meteorological observations (Fig. 10) reveal perfectly the extreme dryness, which prevailed then in Oxford. Even, if the temperatures do not indicate a particular heat wave, the shortage of precipitation is evident. Indeed, between June 24th and September 13th, 1666, the philosopher records only 7 days in the course of which there was precipitation (June 27th, July 2-5-17-24th, September 9th and 15th).
Figure 10. Temperatures and rainfall recorded by John Locke during the drought of the summer, 1666. Source : Bodleian Library, University of Oxford, QC 161 B69 1692.
In Scotland, the chronicle from Frasers speaks about a 'hot drought' in May 1666 and indicates that the dryness also became widespread in England7. In Oxford, the River Cherwell and the River Thames were 'almost dry' said the witnesses, which evoked the unemployment of the boatmen who could not navigate anymore because of the low water. In London, once again, God is sought to put an end in the extreme dryness. The wardens of St. Margaret’s church in Fish Street paid 6 pennies to 'My Lord Mayor officers' for bringing an order to pray for rain. Regrettably, God did not answer their prayers and on September 2nd, London had become a tinderbox ready to ignite. The socio-economic impact of the drought of 1785 The summer heat wave of 1785 led to a drought of severe intensity, with disastrous consequences throughout the country. As reported by the English naturalist Gilbert White (1720-1793), it was a severe 'drying exhausting drought' and the kingdom was not more than ‘dust’. In another diary, a Norwich mill owner explains in July, 1785, that there has not been enough water anymore to turn the wheel of his mill since June 23rd and that it has consequently been impossible to grind the flour, which caused a big increase in the bread price. The drought also affected the other industries, which were dependent on the hydraulic power to work (textile industry, dying). The environment was also negatively affected by the event, as there were forest fires in Rothburg Forest, near Newcastle-upon-Tyne, at Easthampstead and in Berkshire. The Rothburg Forest fire led to more than a thousand acres (404 ha) of sheep pasture and
7 Fraser J (1905): Chronicles of the Frasers. Edinburgh, Constable, p. 465.
0
5
10
15
20
25
30
24 June
27 June
30 June
3 July
6 July
9 July
12 July
15 July
18 July
21 July
24 July
27 July
30 July
2 August
5 August
8 August
11 August
14 August
17 August
20 August
23 August
26 August
29 August
1 Sep
tember
4 Sep
tember
7 Sep
tember
10 Sep
tember
13 Sep
tember
Rainfall Temperatures °C

Technical Report No. 35 - 14 -
heath being rendered totally useless. In the Fens (Cambridgeshire) the drought of the summer totally dried up the rivers and a great number of the cattle languished and died because of lack of water (Fig. 11). The situation was so critical that the inhabitants asked the Governor of the Company of Conservators of the Great Level of the Fens for a reduction in their taxes which they could not pay anymore.
Figure 11. Petition of the inhabitants and owners of lands to the Governor of the Company of Conservators of the Great Level of the Fens (Beford Level) about the effects of the drought of 1785. Source: Cambridgeshire Archives S/B/SP 742.
The ‘peril of the drought’: the drought of 1921 in Britain The extreme 1921 drought can be regarded as extending back to the fairly dry August of 1920. High pressure systems from the Azores remained stuck for almost the entire year. The rainfall of October, November and December showed considerable deficiencies. From February onwards, the drought really may have to be set in.
Figure 12. Opening credits of the Pathé Gazette News about the drought of 1921. Source: http://www.britishpathe.com/video/the-peril-of-the-drought/query/menace.
The whole of Wales, most of England and large areas in the East Midlands, of Scotland and Ireland had less than a quarter of their average precipitation, while considerable areas in the north and the south-west of England and Wales received less than 10% of normal precipitation. There was a temporary break in the dry weather in March, when rather more than the average rainfall fell over the country. The subsequent months of 1921 were all markedly dry, except August. The three driest consecutive months of 1921 were April to June, when the rainfall over the British Isles generally was 58% of the

Technical Report No. 35 - 15 -
average rainfall8. According the British Environment Agency, there is no doubt that 1921 was the driest year since 17859. The film news of Pathé Gazette presented the consequences of the drought of 1921 on society very well (Fig. 12). The movie was produced on July 28th, 1921. Very probably for the first time in Europe, the drought became a national cause and a threat and was presented as such to the whole nation. Under the suggestive title 'The danger of the drought' and of a subtitle devoid of ambiguity because it was entitled 'Burning crops and stacks threatens our winter food supplies', it showed the danger which it was for the British population. Still very much affected by the conflict of the First World War and still subjected to food rationing, the British were at risk of being deprived of their harvests for the coming winter. We indeed see in the movie fields on fire and trees transformed into torches as firemen try to fight against the fire by pumping water from an almost dried up river. As a conclusion, it is clear that throughout the historical records, drought has been a recurring feature of the UK climate with recent drought events by no means being exceptional in terms of their intensity or duration. In fact, this UK research shows that there is a repeated tendency throughout the historical record for dry years to cluster, which results in multi-year droughts that contain shorter, more intense periods (e.g. 1700-1740, 1806-1860, 1887-1901).
3.2 Ile-de-France (France) Thanks to its long administrative and scientific tradition, France offers exceptional archives to study droughts’ history. The region of Ile-de-France (Paris and the area around it) was chosen as observation site, because it benefits from rich documentation, and because it is situated in between England (Sect. 3.1) and the Upper Rhine Valley (Sect. 3.3). In the Ile-de-France, the historian could make use of numerous instrumental data and observations, which have been exploited over the last 10 years within the framework of research programs of the French National Agency of the Research10. 3.2.1 Chronological fluctuations and severity of the French droughts The available documentation allowed us to identify 68 droughts in Ile-de-France. They are very unevenly distributed between 1500 and 2014, and also have a very variable severity (Fig. 13). As in Great Britain (Figs. 5 and 6), the fluctuations are very strong during the five centuries that were investigated. These disparities are even more striking when these events are distributed over periods of 50 years (Fig. 14). Three major trends can be discerned since the 16th century. The first one is between 1500 and 1700 and is characterized by a steady frequency of droughts with on average one drought every 8 years. A distinct break can be observed in the 18th century, when a very important increase in the number of droughts occurred. There were 21 droughts in that century, with a peak of 14 droughts in the first half of the century, or one drought every 3.5 years. This was quite different from the rest of the 500 years studied. Prior to 1700 and post 1800 there were no comparable frequencies observed. This series of droughts is particularly well documented in archives and in memoirs of the royal Academy of Sciences of Paris. Indeed, the scientists of the Paris Observatory were particularly worried by this long dry and very hot episode.
8 Brooks CEP, Glasspoole J (1928): British Floods and Droughts. Ernest Benn Limited London. p. 119-132. 9 Environment Agency (2006) : The impact of climate change on severe droughts. Major droughts in England and Wales from 1800 and evidence of impact. Science Report : SC40068/SR1. 10 http://www.gisclimat.fr/en/project/renasec, http://www.agence-nationale-recherche.fr/fileadmin/user_upload/documents/aap/2009/finance/cep-financement-2009.pdf.

Technical Report No. 35 - 16 -
Figure 13. Chronology and severity of droughts in France between 1500 and 2014 according to HSDS
(68 droughts).
Contrary to Great Britain, the 19th and 20th centuries are not characterized by more frequent droughts, and there was a falling off from 1850s onwards with the Little Ice Age. However, the 20th century experienced a real increase again, although without any detectable turning point from 1950 onwards. This increase is remarkable already within the framework of that 200 year period, although the total number of drought was very clearly lower than in the 18th century.
Figure 14. Distribution of French droughts by 49-years periods between 1500 and 2014.
In terms of severity, it is also very difficult to distinguish notable differences or trends in the historical series (Fig. 15). Until 1700, events with low and average severity (Index=1-3) did not show any noticeable evolution, as also with the most extreme droughts (Index=4-5). Once again, the period 1700-1750 stands out clearly with 10 droughts with a severity index 4 and 5 out of 21 events. Consequently, the first half of the 18th century was simultaneously affected by an increase in number and the severity of absolutely exceptional droughts.
0
2
4
6
8
10
12
14
16

Technical Report No. 35 - 17 -
Figure 15. Distribution of number of French droughts by periods of 49-years between 1500 and 2014
according to HSDS.
The 19th century is rather homogeneous with 2-3 events per 50 years. The rare droughts of the century divide up between indexes 3 and 4. If there is a break in the contemporary period (from 1900 onwards), it is paradoxically situated at the turn of the 20th century and not at the midpoint (1950). The first half of the century saw 6 extreme events droughts of strong severity (Index=4-5). The second part of the 20th century saw more low intensity droughts (Index≤3) while the strongest intensity droughts were infrequent.
Figure 16. Comparison of the HSDS of the French droughts and the annual Paris rainfall 1689-2013.
Source: Meteo France-OPHELIE ANR Project and Bibliothèque de l’Académie Nationale de Médecine de Paris.
Thanks to the scientists (Cassini, La Hire, Réaumur) of the Paris Observatory, by then the meteorologist of the meteorological station of Montsouris, the Parisian precipitation was regularly recorded, and hence for this station one of the longest meteorological series in Europe is available. These data are more or less continuous from 1676 up to the present. So the comparison of the annual precipitation with the indications of severity of the droughts (Fig. 16) shows a rather good similarity. The latter thus confirms the reliability of the Historical Severity Drought Scale (HSDS) to estimate the severity of historic droughts prior to the availability of instrumental data.
0
2
4
6
8
10
12
14
16
Index 1 Index 2 Index 3 Index 4 Index 5

Technical Report No. 35 - 18 -
3.2.2 Two examples of very severe droughts The drought of 1578 The 1578 drought is very probably one of most extreme of the history of France of the last five centuries. Despite the lack of instrumental data at that time, there are a plethora of written testimonies in archives because of its severity (Fig. 17). It is during the winter of 1577 when archives mention for the first time a "rather dry" season, followed by a very hot spring the same year. The low precipitation continues and in April 1578, archives evoke the general concern about the harvest outlook. They spoke of barley and hemp, which did not grow and ‘pro pluvia’ processions were organized in Paris by the municipal authorities.
Figure 17. Progress of the great drought of 1577-1578 in Ile-de-France according to the written archives.
The environmental crisis reached its climax in the autumn in Ile-de-France where springs and fountains dried up. In the countryside, farmers spoke about the soil being difficult to plough because of being completely dry to a depth of 1.20 m. On the water management plan, it was the whole of the Seine basin that was affected. Low-water then affected the Seine, the Yonne and the Marne rivers and in June, it was even possible to cross the Seine on foot in Paris. This had catastrophic socio-economic consequences. It prevented the wood and wheat supplies to the city on the eve of the winter and led to the lay-off of mills. Wheat being rare in the market and grinding impossible, bread prices shot up and diseases gained ground. In total, during 565 days dryness was observed in the archives between 1577 and 1578, and there were only 15 rainy days11. Droughts and hot seasons in the 18th century in Ile-de-France As it has been already mentioned (Sect. 3.2.1), the 18th century was totally atypical because of the exceptional number of droughts which it experienced. Figure 18 highlights a series of droughts between 1700 and the 1740s, which caught attention because these events were both long and very severe (Index=4-5). One example among the others in this series is the major episode of 1719, which had a national dimension, and simultaneously set a record number of dry days (220 days) and for low precipitation. Symbolic for the general trend of global warming, the 1719 drought and heat wave was far worse than the 2003 drought.
11 Archives nationales. H 1803. Garnier E (2010) : Les dérangements du temps, 500 ans de chaud et froids en Europe. Paris, Plon. Prize of the Académie des Sciences Morales et Politiques (Institut de France).

Technical Report No. 35 - 19 -
Figure 18. Droughts and heat waves in Ile-de-France in the 18th century.
In 1719, the temperature increased more than normal from May onwards; a trend which continued and strengthened throughout the summer. In the village of Varrèdes (Seine-et-Marne, near Paris), the farmers feared the worst when they noticed the low harvest because of ‘very dry and very warm’ August. The scientists of the Observatory of Paris monitored the event very closely and noted that the annual precipitation added up to only 366 mm, a number which makes them say ‘that there is no year so dry; these three years (1717-1719) are the driest for more than 30 years’12. The exceptional heat wave did not escape them either and the academicians followed very closely the fast increase in the temperatures, the climax of which occurs on July 16th, 1719. The thermometer of the astronomer La Hire showed then at 3 pm more than Florentine 82 degrees, in other words a temperature of 36.1° C, at least! The heat and the lack of water finally led to a dysentery epidemic that was with other infections. It is then a national tragedy for the Kingdom of France, which suffered 450.000 additional fatalities out of a population of 21 million inhabitants in 1719.
3.3 Upper Rhine Valley (Germany, Switzerland, France) The Upper Rhine Valley area (South Rhine, Baden-Württemberg, Switzerland and Alsace) is particularly well documented through religious chronicles, meteorological newspapers and the municipal archives13. This rich body of information enables a reliable chronological reconstruction.
12 (1720): Mémoires de mathématiques et de physique tirés des registres de l’Académie royale des Sciences. 13 Hegel (1869): Die Chronik der Stadt Straßburg. Leipzig, Verlag Hirzel. Dietler (1994): Chronique des Dominicains de Guebwiller 1124-1723. Guebwiller, Société d’Histoire et du Musée du Florival. Mercklen FJ (1864): Annales oder Jahrs-Gesachichten der Baarfüseren oder Minderen Brüdern S. Franc. Ord. Insgeneim Conventualen gennant, zu Than durch Malachias Tschamser, Colmar. Dostal P (2005): Klimarekonstruktion der Regio TriRhena mit Hilfe von direkten und indirekten Daten vor der Instrumentenbeobachtung. Freiburg, Berichte des Meteorologischen Institutes der Universität Freiburg. Glaser R (1991): Klimarekonstruktion für Mainfranken, Bauland und Odenwald anhand direkter und indirekter Witterungsdaten, Paläoklimaforschung 5, Stuttgart, New York, 1991, 138p. Muller C (1997-2002): Chronique de la viticulture alsacienne au XVIIe siècle, Riquewihr, J.D. Reber. Pfister C, Weingartner R, Luterbacher J (2006): Hydrological winter droughts over the last 450 years in the Upper Rhine basin : a methodological approach, Hydrological Sciences-Journal-des Sciences Hydrologiques 51-5: 966-985.

Technical Report No. 35 - 20 -
3.3.1 Chronological fluctuations and severity of the droughts in the Upper Rhine Valley
Far more than the French case (Sect. 3.2), the Rhineland basin offers a more puzzling scenario with the theory that outbreak of extreme events occurred since the 1950s. Compared with the English and French cases, the Upper Rhine Valley (Alsace, Baden-Württemberg, Basel region) has a low number of droughts with 37 events identified between 1500 and 2013, against 68 in Ile-de-France and 42 in Great Britain (Sect. 3.1.1 and 3.2.1). In terms of fluctuations, five, more or less, dry periods are observed during the last 500 years (Fig. 19): - 1500-1540: 5 droughts - 1630-1670: 8 droughts - 1715-1750: 4 droughts - 1820-1890: 9 droughts - 1940-1980: 5 droughts The first intense phase was in the first half of the 16th century, called the ‘Beautiful 16th Century’ by historians because of the favourable weather conditions. A break of about forty years, which coincides with the Little Ice Age, which was accompanied in this part of Europe by an agricultural and demographic boom. The second phase is clearly more problematic to interpret because it corresponds more according to climate historians to a cold and wet period attributable to the ‘Minimum of Maunder’14.
Figure 19. Chronology and severity of the Rhineland droughts between 1500 and 2013 according to
HSDS.
The distribution of these Rhenish droughts by half centuries turns out very surprising because we observe a regular and important decline in the number of droughts from the peak (6 droughts) in the second half of the 19th century (Fig. 20). In the 20th century, a time for which the documentation is very rich and easily to exploit, the droughts did not stop decreasing, particularly during the period 1950-2000 only three droughts happened. On the other hand, the period between 1500 and 1850 gives clearly drier conditions, in particular in the 17th century, and between 1850-1900.
14 Le Roy Ladurie E (2004) : Histoire humaine et comparée du climat. Vol. 1, Paris, Fayard. Luterbacher J et al. (2004): European Seasonal and Annual Temperature Variability, Trends since 1500. Science 3 03-5663 : 1499-1503.
Technical Report No. 35 - 21 -
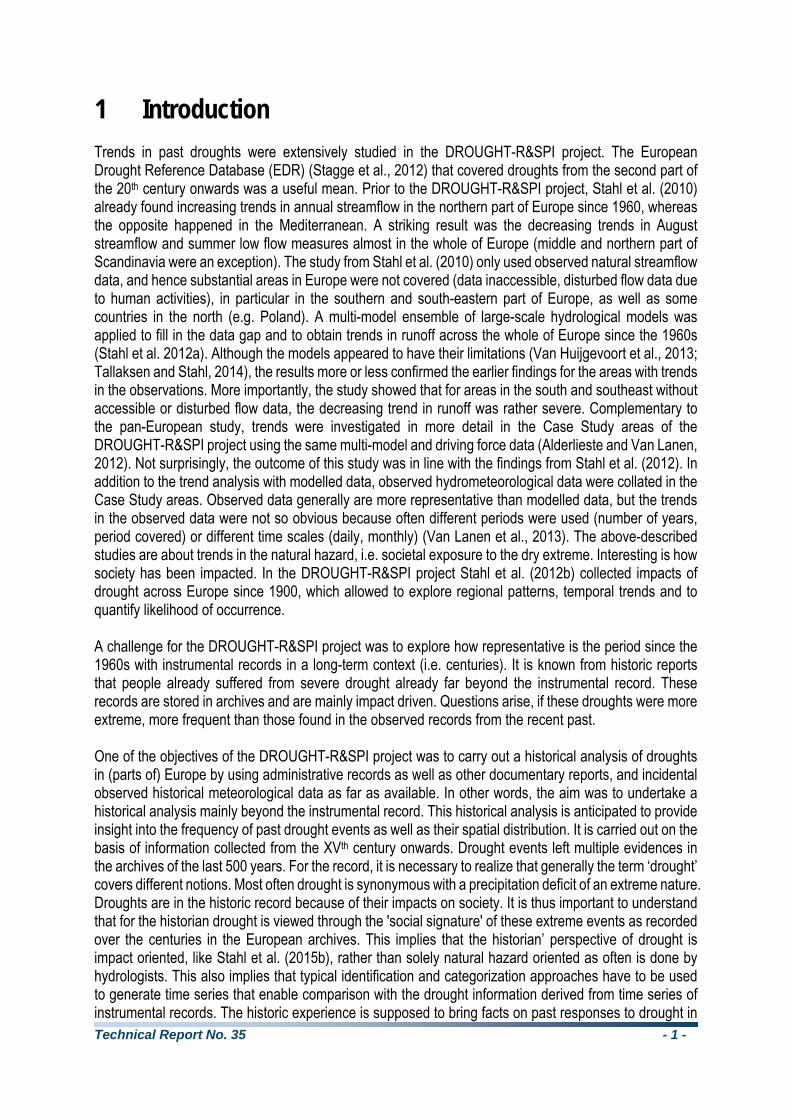
Figure 10. Distribution of number of Rhineland droughts by 49-years periods between 1500 and 2013.
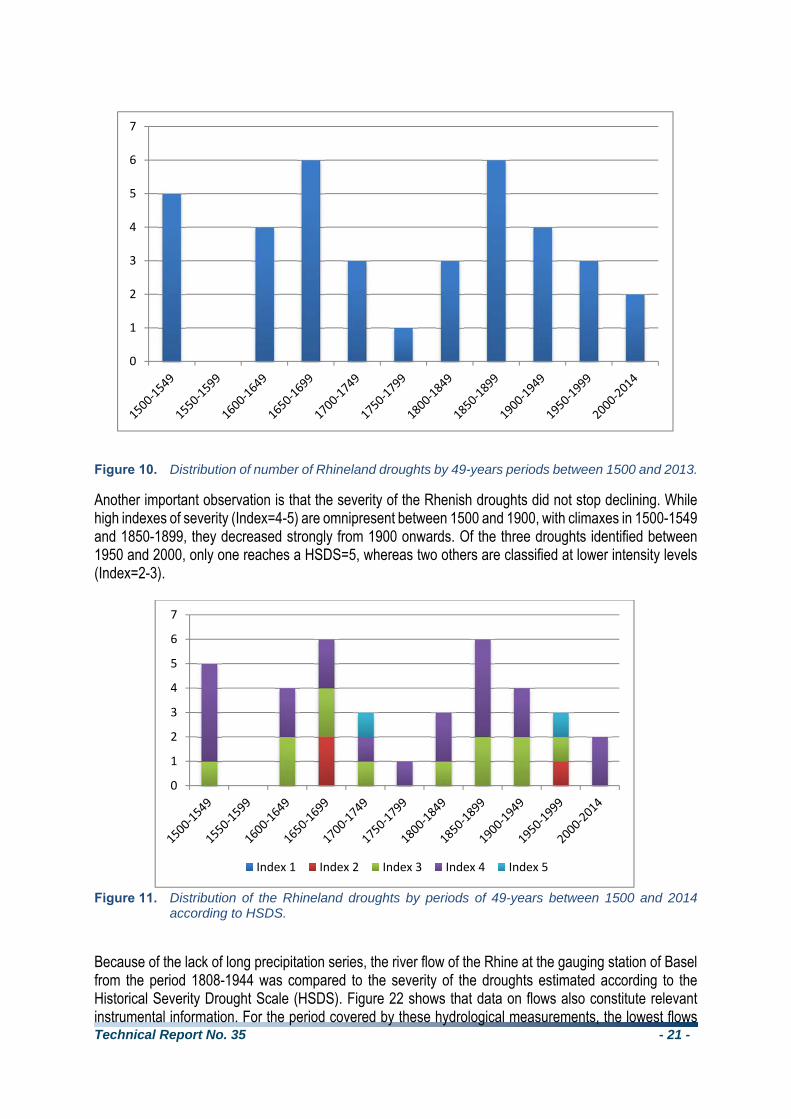
Another important observation is that the severity of the Rhenish droughts did not stop declining. While high indexes of severity (Index=4-5) are omnipresent between 1500 and 1900, with climaxes in 1500-1549 and 1850-1899, they decreased strongly from 1900 onwards. Of the three droughts identified between 1950 and 2000, only one reaches a HSDS=5, whereas two others are classified at lower intensity levels (Index=2-3).
Figure 11. Distribution of the Rhineland droughts by periods of 49-years between 1500 and 2014
according to HSDS.
Because of the lack of long precipitation series, the river flow of the Rhine at the gauging station of Basel from the period 1808-1944 was compared to the severity of the droughts estimated according to the Historical Severity Drought Scale (HSDS). Figure 22 shows that data on flows also constitute relevant instrumental information. For the period covered by these hydrological measurements, the lowest flows
0
1
2
3
4
5
6
7
0
1
2
3
4
5
6
7
Index 1 Index 2 Index 3 Index 4 Index 5

Technical Report No. 35 - 22 -
correlate rather systematically with extreme droughts with the notable exception of that of the 1830 low flow, because of its low socio-economic impact. It should be noted that the HSDS is based on the economic and social consequences engendered by droughts and not on absolute statistical values derived from time series of environmental data.
Figure 12. Comparison of the Rhineland droughts between the HSDS and the annual Rhine flow in
Basel rainfall 1808-2013. Source: Oesterhaus M (1947): Mehrjährige periodische Schwankungen der Abflussmengen des Rheins bei Basel. Thesis, Basel.
3.3.2 The drought, subject of collective memory in the Upper Rhine Valley The memory engraved in the stone: the ‘Laufenstein’ As a result of their historical frequency, the droughts in the Upper Rhine Valley gave birth very early to a cultural memory of the risk which was maintained and passed on from one generation to the next. The archetypal symbol of this memory is the stone of ‘Laufenstein’, literally in German the ‘stone which sinks’, which served as early-stage indicator for the local populations for centuries. More exactly, it consists of a rock situated a hundred meters to the west of the old bridge of Laufenbourg. This small German town in the current district of Baden-Württemberg is located approximately 40 km east of Basel just past the confluence of the Rhine with the river Aare15. This mark unfortunately disappeared in 1909 when the authorities decided to blow up it to facilitate the construction of a hydroelectric power plant nearby. Fortunately, a German hydrology engineer described it exactly in his thesis published in 190116. On February 18th, 1891, he took advantage of a wintry low tide to study it closely having beforehand questioned the inhabitants about its function. He notices at the time that the dates of nine droughts since the 16th century were engraved on the stone. Among them, some were perfectly recognizable and reflected the extreme events in 1541, 1750, 1823, on 1858 and 1891 (Fig. 14). Moreover, the photograph published in his thesis was taken in January, 1891, during a previous winter low-water period (Fig. 13).
15 Pfister C, Weingartner R, Luterbacher J (2006): Hydrological winter drought over the last 450 years in the Upper Rhine basin: A methodological approach. Hydrological Sciences 51-5: 966-985. 16 Walter H (1901): Uber die Stromschnelle von Laufenburg. Diss. Phil. II, Zürich, Zürcher and Furrer, p. 27 and Tafel IV.

Technical Report No. 35 - 23 -
Figure 13. Photography of January, 1891 showing (white circle) the mark of low-water of "Laufenstein" situated near the old bridge of Laufenburg (Bade-Wurtemberg). Source: Walter H (1901): Uber die Stromschnelle von Laufenburg. Diss. Phil. II, Tafel 4, Zürich, Zürcher and Furrer.
On the other hand, he remained careful for the other dates and proposed those of 1692, 1764, 1797 and 1848. In this last case nevertheless, neither the archives nor the annual flow of the river (884 m3/s) indicated a particularly severe drought. It is the same for the lowest water level, indicated in the stone in 1823 and which does not correspond to a low flow at Basel station (1098 m3/s).
Figure 14. Sketch realized by the engineer Heinrich Walter in his thesis before destruction of the mark of Laufenstein in 1909. We see clearly the historic marks of the droughts of 1541, 1750, 1823, on 1858, 1891. Source: Walter H (1901): Uber die Stromschnelle von Laufenburg. Diss. Phil. II, Zürich, Zürcher and Furrer.
The drought of 1540-1541 Among the nine dates mentioned on the Laufenstein, that of 1540-541 drought merits particular attention because the dryness really concerned the whole region of the Upper Rhine, and was consequently
Technical Report No. 35 - 24 -
perfectly preserved in the written memory of the time. For climatologists, the summer of 1540 was one of the warmest and driest in the history of Central Europe17. From the middle of March till the end of September 1540, an anticyclone is assumed to have blocked the centre of Europe. During the winter of 1541, the level of Lake Constance was so low that the city of Constance was able to begin the construction of new fortifications. In Alsace and in the Canton of Basel, June 1540 was dry and July even drier to the point that water shortages became widespread in town and in the countryside. In their chronicles and diaries, the bourgeois of Basel and Strasbourg describe how jars of water were being sold for the same price as jars of wine. Hunger was added to thirst in August because mills on the Rhine and its tributaries could not grind wheat anymore because of a lack of water. In the countryside around Thann and around Guebwiller (Haut-Rhin, Vosges), fruits dried out on trees and religious chronicles of Colmar, Guebwiller and Thann all speak of apples, pears and walnuts falling from the trees. The grape was not spared either because vines were dry and did not give fruits. Graver still in this much wooded region, forest fires multiplied and the archives even speak about forests which ignited ‘spontaneously’. As the ultimate curse connected indirectly to the drought, the plague reappeared and quickly spread in the cities of Basel, Mulhouse and Colmar18.
3.4 Syros (Greece) In numerous Mediterranean regions, water resources are exploited so intensively that it faces the risk of a major water shortage. In an uncertain climatic context, the situation could get worse, if an outbreak of droughts occurs, as it is predicted by numerous climatic models. The recent report IPCC-SREX underlines the absence of transverse knowledge on this subject19. There is a lack of historical hydrological data and of knowledge regarding traditional practices, all of which could confirm or contradict the current climatic models. Besides the pressure exercised by the climate change, the transformations of land use constitute an aggravating factor for the Mediterranean environment and water resources. These changes in land use proceed from anthropogenic interventions engendered by agriculture, urbanization or additionally by natural events, such as fires20. The Syros case is a bit more elaborated than the previous ones in Central and Northwest Europe because of the dry climate. In this case factors involving vulnerability are also addressed, because socio-economic impacts of drought have to be associated with the vulnerability of society. Aware of the scientific information on drought in the Mediterranean and the possible changes, this section reports about the interdisciplinary approach followed for a historical drought analysis using the Island of Syros, situated in the Cyclades complex (Greece), as an example from a dry European region. This work addresses water resources availability and management on the island over a long chronological period
17 Luterbacher J, Xoplaki E, Dietrich D, Rickli R, Jacobeit J, Beck C, Gyalistras D, Schmutz C and Wanner H (2002): Reconstruction of Sea Level Pressure fileds over the Eastern North Atlantic and Europe back to 1500. Climate Dynamics 18: 545-561. 18 Bibliothèque municipale de Colmar: Wunderbuch aus Colmar, T.CH. 60 Mss Jahrbücher der Dominker zu Colmar, I.CH. 60Mss Chronik von Sigmund Billing, I.CH. 64 Mss ischer W and Stern A (1872): Basler Chroniken Herausgegeben von der historischen gesellschaft in Basel. Leipzig, verlag von S. Hirzel, p. 160-161. Hegel G (1869): Die Chronik der Stadt Strassbourg. Leipzig, Verlag Hirzel. Dietler, frère Séraphin (1994): Chronique des Dominicains de Guebwiller 1124-1723. Guebwiller, Société d’Histoire et du Musée du Florival Mercklen, F.J., Annales oder Jahrs-Gesachichten der Baarfüseren oder Minderen Brüdern S. Franc. Ord. Insgeneim. Conventualen gennant, zu Than durch Malachias Tschamser, Colmar, 1864, 2 volumes. 19 IPCC (2012): Managing the Risks of Extreme Events and Disasters to Advance Climate Change Adaptation. Special Report of Intergovernmental Panel on Climate Change. Cambridge, Cambridge University Press. 20 Sofios S, Arabatzis G, Baltas E (2008): Policy for managment of water resources in Greece. Environmentalist 28: 185-194.

Technical Report No. 35 - 25 -
of three centuries by combining several disciplines. The history, the engineering, the hydrology and the sociology were combined to better understand water shortage in its scientific and social dimensions. In spite of the multiple recommendations of the international scientific and political authorities, studies of this type are rare. Nevertheless, they may constitute effective tools of mediation within the framework of the necessary dialogue between policy-makers, scientists and local societies. While the current strategies are usually dictated by the short-term need to meet the immediate water requirements of a population, which is consuming more and more, the experience of the past also contributes to the design of different strategies to minimize the impact of droughts and increase the resilience of the population. To achieve this aim, various and previously unexamined historical documentation was exploited as well as an oral survey (interviews), to better understand the perception of the risk of water shortage in Syros. The study then examined the vulnerability factors with regard to the drought risk, which are demography, urbanization and land settlement. Eventually, it underlines the existence of strategies of resilience used between 1700 and the present time from the perspective of a more sustainable use (ecologically and economically) of water resources. 3.4.1 Population rise and urbanization 1700-2011 Archives and censuses conducted by the Greek Statistical Service since its inception have been used to study the evolution of the population of the island since 1702 and 1879 to investigate the simultaneous evolution of urban and rural populations up to 2001, respectively. Overall, the demographic turning point occurred between the second part of the 18th century and the beginning of the 19th century (Fig. 15). Since early 1700s, the population grew almost sevenfold until 1828 and continued to increase until 1889 with a peak of 31,573 inhabitants. After this date, the long-term population declined until 1971, after which a slight increase was recorded. For the period prior to 1820, records and accounts of consuls and French Catholic religious visitors agree in talking about an almost empty island with very few inhabitants. At the end of the 18th century, the island had about 3,000 inhabitants mainly concentrated in the old town of Ano Syros, a medieval walled town built on a hill overlooking a bay where the ruins can still be seen in the ancient city of Syros and its port. These textual descriptions were confirmed by prints and drawings at the time deposited in the municipal archives of Hermoupolis. Until the early 19th century fearful, surprise attacks happened by pirates or the Ottoman navy. The population worked by day in the countryside and returned to take refuge at night in Ano Syros. At that time, Syros is described as successful in terms of agriculture. It produced wheat, barley, wine, figs, olives and cotton in large quantities21. Although the island mainly was covered with brush, it was popular with locals and sailors for its freshness and the lushness that distinguished it from other islands of the Cyclades. At that time, the historical evidences all emphasize the self-sufficiency of the island in water resources and the quality and flow of the fountain near Ano Syros, called later the Saint Athanassios spring. Already in ancient times, this spring was known to pilgrims, who came to purify themselves before going to Delos (testimony of Homer). At the scale of the island as a whole, agriculture was possible due to the many springs distributed mainly over the southern and western parts as evidenced by the Abbot Della Rocca in 1790. According to him, without these springs it would be impossible to irrigate vegetable gardens and fruit trees producing oranges and lemon trees.
21 Pitton de Tournefort J (1717): Relation d’un voyage du Levant fait par ordre du Roy : contenant l’histoire ancienne et moderne de plusieurs isles de l’Archipel, de Constantinople, des côtes de la mer Noire, de l’Arménie, de la Géorgie, des frontières de Perse et d’Asie mineure. Paris, Imprimerie Royale.

Technical Report No. 35 - 26 -
Figure 15. Evolution of the population of Syros, 1702-2011. The bars show the population of the island
in thousands of people since 1702.
An important turning point in both demographic and environmental terms comes in 1821 with the creation ex nihilo of what would become the town of Hermoupolis along the deserted cove dominated by the perched medieval town of Ano Syros. This spontaneous agglomeration was rapidly populated with the influx of refugees driven out by the Ottomans during the Greek War of Independence (1821-1829). The refugees from Chios and Parsa, Crete, the Peloponnese and Asia Minor found in Syra (old name of Syros Island), which was then occupied by a catholic population, a safe haven assured by the protection of France. The refugees created a new town with an orthodox Greek population; the contrast between the orthodox town and the interior with its strong Catholic dominance would ease only slowly22. The town of Hermoupolis, by taking over the sales function of the ancient Delos, found within the framework of the Greek State a sensational prosperity and became the compulsory port of passage on the road to Constantinople as well as a big textile (cotton, wools and leathers) and naval construction centre. Very quickly, urban and city dwellers faced a major problem of water culminating in 1857 when the steam from the Kaloutas tannery exploded due to a lack of fresh water. They tried to address this deficit by increasing private wells (manganopigada) that provided water often of poor quality, sometimes brackish. The majority of citizens could not benefit from the sale of drinkable water by municipal authorities from the 1850s either, due to its high price (2.50-3.00 Drachmas per day). Despite several projects of the authorities to guarantee the supply of water, it was not until the year 1923 that a water supply network was finally established with the signing of a contract between the municipality of Hermoupolis and the Swiss company Fauster and Riffel engineers23. During this long period, only residents of the old town of Ano Syros had a steady supply of good quality water from the ancient spring. However it required the water to be carried either manually or by animal between the spring and the market town. This was a 30 minutes’ walk; a mostly female activity which continued to be practiced until the early 1980s.
22 Kolodny E (1969) : Hermoupolis-Syra : naissance et évolution d’une ville insulaire grecque. Méditerranée 2 : 189-220. 23 Fenerli A (2008) : To provlima tou nerou stin Ermoupoli (1823-1923). Hermoupolis, Declaration during the ‘Hermoupolis Seminars’.
0
5000
10000
15000
20000
25000
30000
35000

Technical Report No. 35 - 27 -
Figure 16. Geographical distribution of the population of Syros 1879-2001. The blue column indicates
the number of inhabitants in the capital Hermoupolis, the red column is the number of inhabitants in the old town of Ano Syros and the green column the village population.
In 1828, the island had 20,197 inhabitants, 68% of them (13,805 people) living in Hermoupolis. At that time, the population of Hermoupolis was also increasing as a result of campaigns from the 1880s in favour of an exodus of Catholics from Ano Syros causing a collapse of the rural settlements. They had created villages located near the land they cultivated (Fig. 16). This rural part of the island population would only start to increase again after 1980, thanks to the return of retired people originally from the island who had made a career in Athens. In 2001, the population permanently residing in the villages was as high as 35% of the total population. More serious for water resources is the mode of urbanization of the countryside since the 1990s. Indeed, it occurs in the form of an often impressive sprawl of housing estates around the main towns. However, many new homes are not connected to the mains sewage network and as a result sewage often pollutes the groundwater. Another conflict emerged recently as a result of the administrative reform of the Kallikratis plan of 2011, which abolished the former municipalities of Ano Syros, Hermoupolis, and Posidonia to create a single municipality of ‘Syros-Hermoupolis’. The concentration of decision-making power in the capital at the cost of old rural municipalities resulted in new drillings near farms to feed the city. The oral evidence from the interviews confirms that the new administrative policy affected water use and management and created tensions among farmers and citizens who found that their resources were being depleted. To summarize, the dual phenomenon of population growth associated with urbanization until 1890 and the subsequent settlement of the countryside has increased anthropogenic pressures on water supplies, more in the east of the island (Hermoupolis) than in the southern plains and valleys, which are well endowed with springs. In contrast, the population has increased only slightly over the last thirty years. Indeed, unlike other islands of the Cyclades, the old industrial and commercial capital of the archipelago, while remaining the most populated island with its 21,507 inhabitants, has benefited less from the tourism and population renewal of the Greek islands24.
24 Sintes P, Thuillier G (2009): Western residents in the Aegean Sea: the case of Tinos’island. Méditerranée 113: 79-89.
0
5000
10000
15000
20000
25000
30000
35000
1879 1889 1896 1907 1920 1928 1940 1951 1961 1971 1981 1991 2001
Ermoupolis (capital city) Ano Syros (old city) Villages

Technical Report No. 35 - 28 -
3.4.2 Chronological fluctuations and severity of the droughts Historical droughts of the pre-instrumental period Available records allowed studying drought in Syros since the mid-18th century. The results show a large gap between the first events in 1758 and 1786 and the drought series stars again in 1855 (Fig. 17). The 1750-1800 period has only two rather severe droughts. The 1758 drought was so severe that it destroyed much of the crops of the island and caused a famine that forced the bishop to import wheat from Italy. The catastrophic 1786 drought had quite an exceptional geographical extent as it affected the whole Ottoman Empire. In both cases, these extremes correspond to a very dry phase in the western Mediterranean Basin, particularly in the south of France, Sicily and Spain25. The long sequence without droughts between 1800 and 1850 corresponds to the Saros Cycle of 55-56 years of Mediterranean rainfall linked to the cycle of eclipses caused by the positions of the sun and moon, known since the Egyptians and Babylonians.
Figure 17. Severity of the droughts in Syros Island, 1758-1890.
The 19th century reveals an increase in droughts around the 1850s that are widely echoed in the Catholic processions and the press of the time. Generally, religious ceremonies occurred during autumn (November) and winter (January and February) or more rarely in the spring. These data are thus strongly correlated with the normal rainfall pattern in Syros at the time characterized by more sustained rains between October and December and between February and March. It should also be noted, as evidenced by the newspapers of the island, that the 1880s were extremely dry with several consecutive years of drought. The archives of the time describe a lot of dry reservoirs, quarrels around fountains and poor harvests. Once again, the timing of droughts in Syros in this period coincides well with low precipitation in the western basin of the Mediterranean26. The contemporary droughts A time series of precipitation data has been constructed using information from three sources:
25 Garnier E (2010): Exceptional Meanness Water and Hot Weather 500 years of drought and heat wave in France and neighboring countries. La Houille Blanche 4: 26-42. 26 Camuffo D, Bertolin C, Diodato N, Cocheo C, Barriendos M, Dominguez-Castro F, Garnier E, Alcoforado M, Nunes M (2013): Western Mediterranean precipitation over the last 300 years from instrumental observations. Climatic Change 107: 85-101.
0
1
2
3
4
5
6
1758
1763
1768
1773
1778
1783
1788
1793
1798
1803
1808
1813
1818
1823
1828
1833
1838
1843
1848
1853
1858
1863
1868
1873
1878
1883
1888
Severity index

Technical Report No. 35 - 29 -
- The Meteorological Service of Syros (1932-1957, ‘agricultural year’); - The Union of Agricultural Cooperatives of Syros (1957-1987, ‘agricultural year’); and - The Hellenic National Meteorological Service (1970-2010, monthly data). The quality of the data from the first two sources cannot be assessed, as (i) there is no information available on the instruments used and monitoring processes followed at that time, and (ii) there are no data available at smaller time steps (e.g. monthly). Regarding the third source of data, there are a lot of missing data, particularly for the period 1980-1985. Therefore, data after 1986 were used for the reconstruction of the time series. The data from the two first sources have the same time step and thus can be combined to have a complete series for the period 1932/33 to 1986/87. Data indicate a slight decreasing trend in precipitation in Syros Island (Fig. 18). The average annual precipitation was 487 mm in the 1894-1929 period, this value decreased to 431 mm in 1932-1957 and 405 mm in 1957-198727. There is an equal number of years being below or above the period average values. However the years with the lowest precipitation values are: 1948/49, 1949/50, 1958/59, 1973/74, 1982/83, 1985/86.
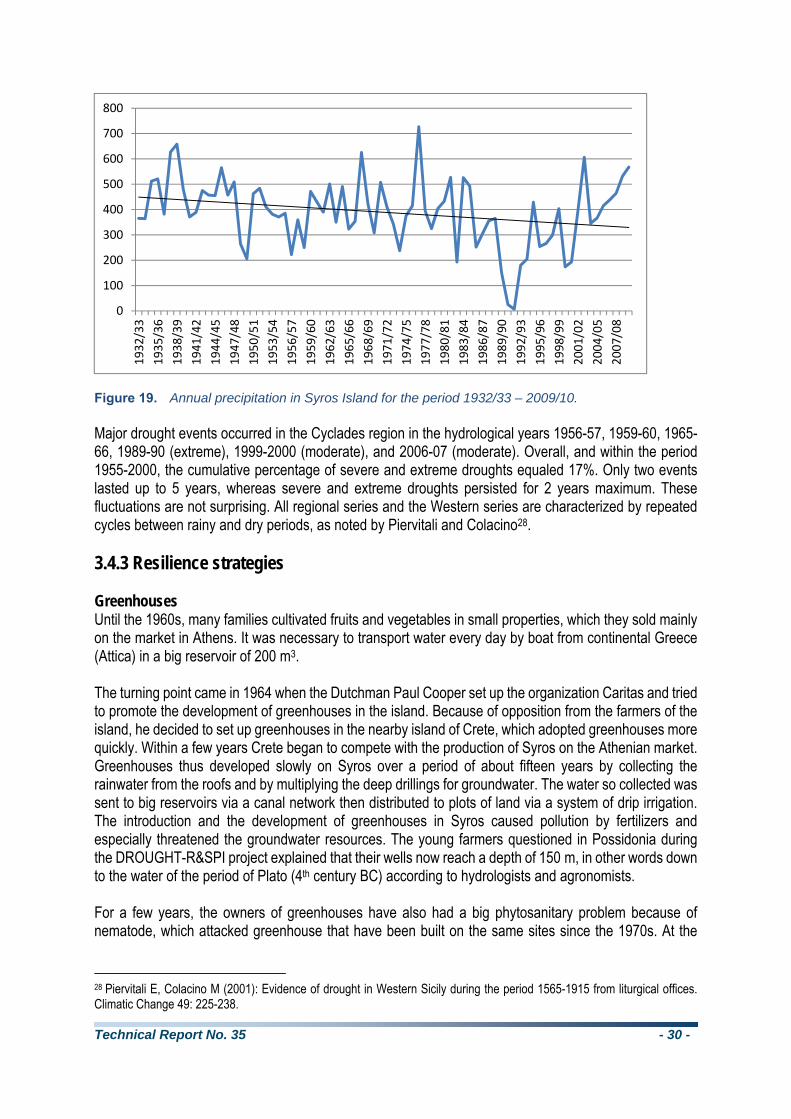
Figure 18. Annual precipitation in Syros Island for the period 1932/33 – 1986/87 (bold blue line), and
the slight downward trend (black line) Monthly precipitation data for the period 1986-2010 were aggregated to produce annual values, corresponding to the ‘agricultural year’ of the older time series (October to September). The average annual precipitation value for this period is even lower than the one from the previous periods and equals 323 mm. Dry years (with low precipitation values) were: 1989/90-1993/94, 1995/96, 1999/2000-2000/01. The whole time series is given in Figure 19.
27 Mariolopoulos I (1938): To Kila tis Ellados. Athens.
0
100
200
300
400
500
600
700
800
1932/33
1934/35
1936/37
1938/39
1940/41
1942/43
1944/45
1946/47
1948/49
1950/51
1952/53
1954/55
1956/57
1958/59
1960/61
1962/63
1964/65
1966/67
1968/69
1970/71
1972/73
1974/75
1976/77
1978/79
1980/81
1982/83
1984/85
1986/87
mm
Technical Report No. 35 - 30 -
Figure 19. Annual precipitation in Syros Island for the period 1932/33 – 2009/10. Major drought events occurred in the Cyclades region in the hydrological years 1956-57, 1959-60, 1965-66, 1989-90 (extreme), 1999-2000 (moderate), and 2006-07 (moderate). Overall, and within the period 1955-2000, the cumulative percentage of severe and extreme droughts equaled 17%. Only two events lasted up to 5 years, whereas severe and extreme droughts persisted for 2 years maximum. These fluctuations are not surprising. All regional series and the Western series are characterized by repeated cycles between rainy and dry periods, as noted by Piervitali and Colacino28. 3.4.3 Resilience strategies Greenhouses Until the 1960s, many families cultivated fruits and vegetables in small properties, which they sold mainly on the market in Athens. It was necessary to transport water every day by boat from continental Greece (Attica) in a big reservoir of 200 m3. The turning point came in 1964 when the Dutchman Paul Cooper set up the organization Caritas and tried to promote the development of greenhouses in the island. Because of opposition from the farmers of the island, he decided to set up greenhouses in the nearby island of Crete, which adopted greenhouses more quickly. Within a few years Crete began to compete with the production of Syros on the Athenian market. Greenhouses thus developed slowly on Syros over a period of about fifteen years by collecting the rainwater from the roofs and by multiplying the deep drillings for groundwater. The water so collected was sent to big reservoirs via a canal network then distributed to plots of land via a system of drip irrigation. The introduction and the development of greenhouses in Syros caused pollution by fertilizers and especially threatened the groundwater resources. The young farmers questioned in Possidonia during the DROUGHT-R&SPI project explained that their wells now reach a depth of 150 m, in other words down to the water of the period of Plato (4th century BC) according to hydrologists and agronomists. For a few years, the owners of greenhouses have also had a big phytosanitary problem because of nematode, which attacked greenhouse that have been built on the same sites since the 1970s. At the
28 Piervitali E, Colacino M (2001): Evidence of drought in Western Sicily during the period 1565-1915 from liturgical offices. Climatic Change 49: 225-238.
0
100
200
300
400
500
600
700
800
1932/33
1935/36
1938/39
1941/42
1944/45
1947/48
1950/51
1953/54
1956/57
1959/60
1962/63
1965/66
1968/69
1971/72
1974/75
1977/78
1980/81
1983/84
1986/87
1989/90
1992/93
1995/96
1998/99
2001/02
2004/05
2007/08

Technical Report No. 35 - 31 -
beginning, seeds were bought in the Netherlands and then they were replaced by expensive grafted young plants (approximately 2.00 euros per seedling), which were sold by big companies. The early choice of desalination On 27 July 1969, the dictatorship of the colonels decided on the construction of a desalination plant, which was intended to solve the water problem in the island (source: newspaper 'Courage'). The works lasted 7 years and had a cost by then of 15,000,000 drachmas for the building of the factory and 22,000,000 drachmas for the construction of the water distribution network. Aware of the risk of opposition by the inhabitants and of local elected representatives, the government adopted an educational and very careful approach. At the same time the government cancelled the debts of the farming community, and they organized an exhibition in the library of Hermoupolis that was intended to prove the benefits of the desalination plant to the inhabitants. On 6 April 1970, the desalination plant began to supply 1,000 m3 of water a day to the inhabitants. In 1989, a new modern installation was put in place thanks to the financing of the European Union (70 % of the cost). The new desalination plant uses reverse osmosis which replaced the first system of multi-stage distillation29. The choice of desalination led to the misleading impression that drought risk was pushed aside from then on. In reality, this system of water production is vulnerable for diverse reasons. First of all, it is very expensive because it requires a significant financial contribution from the users, but also from the Greek State to ensure the durability of the installations at the very moment. This fact is particularly important for periods, such as current years, when the country is struck by exceptional economic crises. The current technical system uses extremely expensive filters to produce the water. In addition, the desalination plant requires electricity (produced by diesel oil) as source of energy.
Figure 20. Water Consumption (m3) in the old town of Ano Syros in 2005-2010 (Source: Municipal Water Supply and Sewerage of Hermoupolis).
The desalination did not definitively remedy the centuries-old problem of the quality of the water supplied to the consumers. The drinking water, which leaves of the desalination plant, used to become quickly undrinkable because of a network of dilapidated pipes, which requires significant investment to be
29 Comado S (2001): Forty-year design life: The next target material selection –conditions in thermal desalination plants. Desalination 136: 169-176.
0
50000
100000
150000
200000
250000
2005 2006 2007 2008 2009 2010

Technical Report No. 35 - 32 -
modernized. Finally, the population of the old town of Ano Syros also experienced interruptions in the water supply. These interruptions lasted on average 2.5 hrs and happened twice to three times per week after 19.00 pm. Given these conditions, numerous Hermoupolis residents had to buy filters, which they installed in their homes. Finally, the price of the water produced by the desalination plant remains high. The price per m3 of produced water is of the order of € 2.50, while the Greek average wage amounted to € 580 per month (Eurostat, April 2013).
Figure 21. Water Consumption (m3) in the city of Hermoupolis in 2005-2010 (Source: Municipal Water
Supply and Sewerage of Hermoupolis). The high cost of drinking water produced by the desalinization plant caused many inhabitants of the old town of Ano Syros and Hermoupolis to reduce their consumption considerably by making use of Saint Athanassios's spring instead, although it implied a trip of several kilometres. Figures 20 and 21 show that the water consumption in both urban areas decreased from the beginning of the economic crisis in 2008. 3.4.4 The historic inheritance: a tool of resilience? The island of Syros faces challenges, namely the economic crisis, the demographic development and access to water. The experience of history lends a clear legitimacy to support exploration of future strategies for sustainable development. De facto, archives as well as the testimonies collected from old people, highlight the traditional management of water and droughts compared with contemporary practices (Sect. 3.4.1 - 3.4.3). In an article published in March 1960 in the newspaper 'Courage' about the water problem, the role of anavathmi, the terraces to grow crops used for centuries in the Cyclades (Fig. 22) was evoked. These terraces were endangered because of the rural exodus. Hence, the newspaper praised their virtues by explaining that they prevent the fast flow of the rainwater towards the sea thanks to the culture of vegetables, some barley and to the arboriculture (olive trees and fig trees mainly) on more flat terrain. Because of its mountainous character, particularly in the north part, and of its semi-arid climate, the construction of terraces was imperative from antiquity to make best use of the low precipitation, conserve
0
100000
200000
300000
400000
500000
600000
700000
800000
900000
2005 2006 2007 2008 2009 2010

Technical Report No. 35 - 33 -
soils and to develop farming30. The terraces that are still visible today are maintained by a retaining wall the construction of which requires the reorganization of the pre-existing soil to the full height of the wall. Then, the farmer sets up the base of the wall and a heap of rubble stones to direct the drainage towards the interior of the wall. So, sediments carried by rainfall accumulate behind the walls of terraces laid out in a cascade formation31.
Figure 22. Terraces to grow crops (anavathmi) in the North of Syros (Source: E. Garnier).
Archives and chronicles of the 18th century show the existence of an agricultural system with an original crop rotation and field operations. It included a part of the land under ploughing (engheria) and another one lying fallow (pastra). These lands sowed alternately were cultivated by means of the swing plough, which enabled ploughing in a crossed pattern to collect the rain, the major part of which fall in October and in November32. The land which was fallow for one year was not wasted because vegetables were sown there. As a paradoxical effect of the economic crisis, terraces which had been largely abandoned over these last few decades and reconquered by bushes and shrubs, have now benefitted from the return of the native island inhabitants who had previously migrated to Athens. Unemployed and impoverished retired people have returned to the family farms to run them again after a long period of abandonment. Deprived of financial means, they try to reuse the traditional hydraulic techniques but the task turns out to be difficult because the knowledge has been lost sometimes irretrievably. Another important fact for adaptation of societies confronted with the water shortage in the Mediterranean regions and Africa, are oral testimonies that reveal the existence of plants called anhydra, in other words, plants which were not watered (not irrigated). Produced for centuries in the Cyclades, these plants included melons, tomatoes and French beans, which were cultivated on the cooler north-facing hillsides. To compensate for the absence of irrigation, farmers prepared the ground by digging up it so that it is not too hard and so that the night humidity can penetrate. These anhydra are endangered today because they are now only cultivated by elderly people, who still preserve seeds. These plants produce on average 4 to 5 kg of vegetables and fruit a day for a cultivated area of less than 5 acres.
30 Koutsoyannis D, Zarkadouas N, Angelakis AN, Tchobanoglous G (2008): Urban Water management in ancient Greece: legacies and lessons. Journal of Water Resources Planning and Management 134: 45-54. 31 Harfouche R (2005): Retenir et cultiver le sol sur la longue durée : les terrasses de culture et la place du bétail dans la montagne méditerranéenne. Anthropozoologica 40: 45-80. 32 Della Rocca (1790): Traité complet sur les abeilles avec une méthode nouvelle de les gouverner, telle qu’elle se pratique à Syra, île de l’Archipel; précédé d’un précis historique et économique de cette île. Paris, Imprimerie Bleuet.

Technical Report No. 35 - 34 -
4 Comparison of historic European droughts The French droughts of the Seine (Ile-de-France) were compared to the Upper Rhine Valley and British areas because the Seine basin enjoys a moderate, intermediate climate between the western (British) and semi-continental oceanic climate (Upper Rhine Valley)33. For the 69 droughts of the Seine region, there were 22 and 18 similar events in England and in the Rhine valley, respectively (Fig. 23). The best correlation with the Seine basin events were across the Channel. Droughts in the UK were identical to those in the Ile-de-France in 32% of cases for the period 1500-2009 against 26% in the Upper Rhine Valley. In the case of England, the highest correlations with the French droughts were in the 16th (41 %) and 20th (40%) centuries, while the best correlations with the Upper Rhine Valley area were in 17th (46%) and 19th (31%) centuries.
Figure 23. Chronology and duration (number of days) of droughts in Ile-de-France, England and the
Valley of the Upper Rhine 1500-2006. The chronologies of the Rhine and England confirm rather broadly the main trends observed for the Seine valley. Three series of drought events show up: (i) a first phase of droughts between 1500 and 1800, (ii) a long less dry cycle between 1800 up to recent, and (iii) then a clear resumption by 1960, both in duration and frequency. In addition to a systematic comparison between the droughts of 16th and 20th centuries, the most extreme common droughts were studied in more depth. The first of them is the disaster of 1556, very well described by the priests, the bourgeois and the Parisian Aldermen. Sources underline the severity of the event when they speak of a 'very big hot season' and religious processions were organized almost everywhere in France. Even worse, they assert that not a single droplet of rain fell between Good Friday and the All Saints' Day. On other side of the Channel, the situation was particularly difficult because the agricultural 33 Garnier E (2010): Les dérangements du temps, 500 ans de chaud et de froid en Europe. Paris, Plon. (2010): Exceptional Meanness Water and Hot Weather - 500 years of drought and heat wave in France and neighbouring countries. La Houille Blanche 4: 26-42

Technical Report No. 35 - 35 -
impact of the drought caused a rise in the price of wheat, which rose six fold. The Aldermen of London also evoke the drying up of fountains, wells and springs in their reports. The most extreme event, however, was the 1666 drought, bringing into play France and England, both victims of an exceptional drought whose consequences turned out catastrophic in London. Big processions were associated with the impacts of the extreme meteorological conditions from May 17th onwards. As usual, the Parisians and their Aldermen turned to Saint Geneviève (protector of Paris) to pray for rain34. In England, the progress of the crisis is much better known35. The drought began in November 1665 and peaked in August of the next year. Towards 15 August, Londoners discovered, dumbfounded, that the Thames was reduced to a brook which was easily passable on foot. At the beginning of September, in the climax of the heat wave and the drought, Samuel Pepys delivered a very prophetic meteorological vision when he compared the timber-framed houses of the capital to matches ready to ignite after several months without rain. On 2 September, when a hot easterly wind was blowing, a fire broke out at a bakery, immediately fanned by the wind. Illustrated in an anonymous picture in the London Museum, the great fire ravaged altogether the medieval city inside the old Roman outer wall and threatened the aristocratic district of Westminster, which was finally spared. The blaze stopped on 5 September, but it was necessary to wait until 19 September and the first important rain so that embers were definitively extinguished. Although the disaster caused few fatalities (eight), on the other hand, the material loss was very heavy. More than 13,000 houses, 87 churches, including St. Paul's cathedral and the majority of the public buildings were destroyed. More gravely still it had been necessary to evacuate 80,000 inhabitants during the fire and it was then necessary to rehouse them. In addition, the tragedy was also an unexpected opportunity for the King to eliminate a 'dangerous' population in social terms and to launch one of the largest town planning schemes of the modern era (16th-18th centuries). Then, a continuous series of droughts struck the valleys of the Seine, and the Rhine, which in the Thames region were around the 1680s (1681, 1683, 1684, 1685) then 1700s (1701, 1705, 1709, 1714), and there were many indicators of the European drought and heat wave of 1719. The 1719 summer is considered as one of the hottest of the century in the United Kingdom. It stretched mainly in England and in Wales with a precipitation deficit often mentioned in the English archives. The echo is similar in the Rhineland countries. The Dominican of Guebwiller (Vosges, Alsace) noticed, after a still very cold and snow-covered April, a gradual rise in temperatures in the course of May. One month later, they considered the conditions to be 'very hot'. In August, the situation is such that the Magistrates of the Sovereign Council of Colmar (Alsace) sent investigators to find water resources in the Vosges Mountains. By that time, the wheat mills of the city were unemployed for more than fortnight threatening the city with scarcity36. The 1818 drought, common to the basins of the Seine (200 days) and the Thames (90 days), coincides with an extremely dry phase 1815-1822 in the Mediterranean countries. In the British Isles they spoke about 'the longest, the hottest and the driest summer in living memory'. In France, the farmers noticed that the soil is dry in mid-May and that most of the ponds almost disappeared in August. The Parisian observers indicated that the drought has persisted until Christmas, indicating duration of the order of 200 days. After 1818 a long phase with low frequency of drought occurrence began and it is necessary to wait for 1893 for another event of European scale. During this year, we observe 28 and 45 days of drought in Ile-de-France, in the Rhine Valley. Especially in Great Britain the drought was extreme. There was only
34 Archives nationales: H 1820/1. 35 Smith John (1825): Memoirs of Samuel Pepys, Esq. F.R.S., Secretary to the Admiralty in the reigns of Charles II. and James II., comprising his Diary from 1659 to 1669. London, Henry Colburn. 36 Archives municipales de Munster: CC 65.

Technical Report No. 35 - 36 -
21.8 mm of rain in Oxford between February and May37. The situation was also aggravated by a heat wave with disastrous health consequences in Europe. Using the climatological definition of spring (March, April and May), that year’s spring was the warmest in the Central England with a temperature record38. In the 20th century severe droughts occurred again. The century began with a very severe drought in 1921 which affected a large part of the European continent and which even provoked a famine in Eastern Europe, aggravated in Russia by the political conditions connected to the civil war. From England to Italy, the precipitation was 40 % lower than the normal precipitation. Across the Channel the year 1921 was the driest since 1758 and it was characterized by a particularly long dry phase between April and August (Fig. 24). In the major part of Great Britain and in Ireland, the total precipitation in June was lower than 25 mm and in certain regions, there was no rain at all. During the driest four months (April to July), the British precipitation was only 63 % of the usual average over that period.
Figure 24. The monthly precipitation in 1921 (mm) in Oxford (Source: Radcliffe Observatory Oxford). In France, the year 1921 was the hottest and the driest since the beginning of meteorological observations at Montsouris Park near Paris (1873). All in all, only 270 mm of precipitation fell (against 625 mm on average per year). The drought was also accompanied by an exceptional sunshine duration with 2,314 hours of sun (annual average: 1650 hours). The drought began in the autumn of 1920 and got worse in February 1921. As in Great Britain, March and April were exceptionally dry and even enhanced, so that in June the drought became dramatic. In Paris, it was the driest June since 1810 and between 22 May and 11 July, only 2 mm of rain was recorded. In the region of the Upper Rhine Valley, the River Rhine reached its lowest level recorded in Cologne since records began (1816). On 11 May, it reached the extraordinarily low level of only 1.22 m depth39. As in France, the driest month in Basel was February and the following months remained very dry until the following winter of 1921/1922 with the exception of May, August and September, which were relatively wetter (Fig. 25).
37 Wallace JG (1997): Meteorological Observations at the Radcliffe Observatory Oxford: 1815-1995. School of Geography, Oxford, Research Paper 53. 38 Manley G, Central England Temperatures: monthly means 1659 to 1973, Quarterly J. of the Royal Meteorological Society, vol. 100, 1974, 389-405. 39 Kölner Stadt-Anzeiger Newspaper (May 12th, 1921).
0
10
20
30
40
50
60
70
Rain in mm

Technical Report No. 35 - 37 -
Figure 25. The monthly precipitation in 1921 (mm) in Basel-Binningen (Switzerland). Source:
http://www.infoclimat.fr/climatologie/annee/1921/bale-binningen/valeurs/06601.html. The 1921 drought put in a wider chronological context, appeared to be one of the most extreme events of the last 100 years.
Figure 26. Annual precipitation (mm) in Basel-Binningen between 1901 and 2012. Source:
http://www.infoclimat.fr/climatologie/annee/1921/bale-binningen/valeurs/06601.html. Figure 26 presents the annual precipitation recorded in the station of Basel-Binningen (Switzerland) between 1902 and 2012. It reveals that only the drought of 1953 (498.9 mm) in terms of annual precipitation was more severe than the one of 1921 (499.1 mm) while those, more contemporary, of 1976, 2003 and 2011 show higher totals of precipitation.
0
20
40
60
80
100
120
Rain in mm
0
200
400
600
800
1000
1200
1400
1901
1905
1909
1913
1917
1921
1925
1929
1933
1937
1941
1945
1949
1953
1957
1961
1965
1969
1973
1977
1981
1985
1989
1993
1997
2001
2005
2009
1921499,1mm
1953498,9mm
1976519,4mm
2003614,6mm

Technical Report No. 35 - 38 -
5 Conclusions The study has successfully identified key drought events in Europe since 1500 based on a range of hydrometeorological evidence, and provided documentary evidence of the impacts for each event. The report also examined the rather patchy documentary evidence for drought pre-1500 and found several European clusters of dry years over five centuries. The following was found: The Historical Severity Drought Scale (HSDS) was used in this study to estimate the severity of historic
droughts prior to the availability of instrumental data. The HSDS is impact based and its comparison with droughts derived from the instrumental record for more recent periods showed that the HSDS is a reliable measure (e.g. comparison of long records for the Ile-de-France).
Historical information indicates that drought has been a recurring feature of the UK climate with recent drought events being by no means exceptional in terms of their intensity or duration. Actually, there is a repeated tendency throughout the historical record for dry years to cluster, which results in multi-year droughts that contain shorter, more intense periods (e.g. 1700-1740, 1806-1860, 1887-1901).
In France, the 18th century, in particular the first part, had by far the highest drought frequency and extremely severe droughts.
The Upper Rhine Valley (Alsace, Baden-Württemberg, Basel region) had a lower number of droughts than the English and French cases. The Ile-de-France suffered from almost twice as much drought events than the Upper Rhine Valley. The numbers of Rhenish droughts seems to decline since the second part of the 19th century. For more recent periods this is supported with comprehensive information.
An intercomparison of common long drought series in England, the Ile-de-France and the Upper Rhine Valley showed that the English droughts were identical to those in the Ile-de-France in 32% of cases for the period 1500-2009 against 26% in the Upper Rhine Valley. In the case of England, the highest correlations with the French droughts were in the 16th (41%) and 20th (40%) centuries, while the best correlations with the Upper Rhine Valley area were in 17th (46%) and 19th (31%) centuries.
The chronologies of the Rhine, England and the Seine show rather broad trends: (i) a first phase of droughts between 1500 and 1800, (ii) a long less dry cycle between 1800 up to rather recent, and (iii) then a clear increase by 1960, both in duration and in frequency.
The in-depth study of the most extreme common droughts revealed: (i) the 1556 drought in Paris and London as the first event on the record, (ii) the 1666 drought, incl. again France and England, which finally led to the Big Fire in London with few fatalities, but with immense material losses (e.g. about 80,000 inhabitants were evacuated and had to be rehoused), (iii) the 1719 drought with indications of a European-wide drought and heat wave. In the UK the drought was considered as one of the hottest of the century, and in the Rhineland countries new water resources in the mountains were searched for, (iv) the 1818 drought led to serious impacts in the basins of the Seine and the Thames, coincides with an extremely dry phase in the Mediterranean countries (1815-1822), (v) the 1893 drought, which has been observed in the Ile-de-France, the Rhine Valley and the UK (e.g. there was only 21.8 mm of rain in Oxford between February and May). Conditions were aggravated by a heat wave with disastrous health consequences in Europe, and (vi) the 1921 drought, which affected a large part of the European continent and which even provoked a famine in Eastern Europe. From England to Italy, the precipitation was 40% lower than normal precipitation. The 1921 drought appeared to be one of the most extreme events of the last 100 years.
The historical drought time series from England, France and Rhine do not prove any increase in frequency of dry episodes since the 16th century. But the historical method deserves a careful interpretation as well. The Historical Severity Drought Scale (HSDS) is based upon impacts, and hence, it is associated with a region’s vulnerability to drought. For instance, the vulnerability to drought in the 18th century can be weaker than in the two previous centuries because it is constantly changing depending on the available

Technical Report No. 35 - 39 -
water resources, water demand, and supply infrastructure. In the 16th-19th centuries droughts directly affected peoples’ livelihood and water supplies, while later the impact is mainly economic. In this study the Syros Island was investigated in more depth to explore the link between drought and vulnerability. The following was found: Vulnerability in Syros Island was affected by population growth and associated urbanization until 1890
(in particular a rapid growth occurred in the period 1821-1829) that has increased anthropogenic pressures on water supplies.
The archives in Syros report on two substantial droughts in 1750-1850, but on six droughts in the second part of the 19th century (1850-1900).
Inhabitants of Syros tried to increase resilience through rainwater harvesting for irrigating greenhouses and increasing domestic water supply using desalinisation.
Recently, attention was drawn to old water management practices as means to increase drought vulnerability in Syros. The role of anavathmi (terraces to grow crops that were used for centuries in the Cyclades) was evoked. The same applied to agricultural system with original field operations (partly ploughing (engheria) and partly fallow (pastra) of land) and the re-introduction of plants called anhydra (plants which were not watered).
In conclusion, long term historical reconstructions of droughts are very useful for the climatologist and the hydrologist. History can be a mean to improve reliability of climatological and hydrological models by exploring if these models can capture past drought events of 50 years ago or more. While the various scenarios of the IPCC (SREX report, 2012) predict an increase in extreme events in multiple regions in Europe, it is necessary to place them in a historical context.
Technical Report No. 35 - 40 -
References Papers in scientific journals Camuffo D, Bertolin C, Diodato N, Cocheo C, Barriendos M, Dominguez-Castro F, Garnier E, Alcoforado
M, Nunes M (2013): Western Mediterranean precipitation over the last 300 years from instrumental observations. Climatic Change 107: 85-101.
Comado S (2001): Forty-year design life: The next target material selection – conditions in thermal desalination plants. Desalination 136: 169-176.
Garnier E (2010): Exceptional Meanness Water and Hot Weather. 500 years of drought and heat wave in France and neighboring countries. La Houille Blanche 4 : 26-42.
Harfouche R (2005): Retenir et cultiver le sol sur la longue durée : les terrasses de culture et la place du bétail dans la montagne méditerranéenne. Anthropozoologica 40: 45-80.
Kolodny E (1969): Hermoupolis-Syra : naissance et évolution d’une ville insulaire grecque. Méditerranée 2 : 189-220.
Koutsoyannis D, Zarkadouas N, Angelakis AN, Tchobanoglous G (2008): Urban Water management in ancient Greece: legacies and lessons. Journal of Water Resources Planning and Management 134: 45-54.
Luterbacher J, Xoplaki E, Dietrich D, Rickli R, Jacobeit J, Beck C, Gyalistras D, Schmutz C and Wanner H (2002): Reconstruction of Sea Level Pressure fileds over the Eastern North Atlantic and Europe back to 1500. Climate Dynamics 18 : 545-561.
Luterbacher J et al. (2004): European Seasonal and Annual Temperature Variability, Trends since 1500. Science 303-5663: 1499-1503.
Manley G (1974): Central England temperatures: monthly means 1659 to 1973. Quart. J. R. Meteorological Society 100: 389-405.
Pfister C, Weingartner R, Luterbacher J (2006): Hydrological winter drought over the last 450 years in the Upper Rhine basin: a methodological approach. Hydrological Sciences 51-5: 966-985.
Piervitali E, Colacino M (2001): Evidence of drought in Western Sicily during the period 1565-1915 from liturgical offices. Climatic Change 49: 225-238.
Sintes P, Thuillier G (2009): Western residents in the Aegean Sea: the case of Tinos’island. Méditerranée 113: 79-89.
Sofios S, Arabatzis G, Baltas E (2008) : Policy for management of water resources in Greece. Environmentalist 28: 185-194.
Stagge, J.H., Tallaksen, L.M., Kohn, I, Stahl, K. & Van Loon, A.F. (2013): A European Drought Reference Database: Design and Online Implementation. DROUGHT-R-SPI Technical Report no. 12, 42 pg., Oslo, Norway.
Stahl, K., Hisdal, H., Hannaford, J., Tallaksen, L.M., van Lanen, H.A.J., Sauquet, E., Demuth, S., Fendeková, M. & Jódar, J. (2010): Streamflow trends in Europe: evidence from a dataset of near-natural catchments. Hydrol. Earth Syst. Sci. 14: 2376-2382, doi:10.5194/hess-14-2367-2010.
Stahl, K., Tallaksen, L. M., Hannaford, J., and van Lanen, H. A. J. (2012a): Filling the white space on maps of European runoff trends: estimates from a multi-model ensemble, Hydrol. Earth Syst. Sci., 16: 2035-2047, doi:10.5194/hess-16-2035-2012.
Tallaksen, L.M., and Stahl, K. (2014) Spatial and temporal patterns of large-scale droughts in Europe: model dispersion and performance. Geophys. Res. Letters 41(2), 429-434, doi:10.1002/2013GL05857.
Van Huijgevoort, M.H.J., Hazenberg, P., Van Lanen, H.A.J., Teuling, R., Clark, D., Folwell, S., Gosling, S., Hanasaki, N., Heinke, J., Koirala, S., Stacke, T., Voβ, F., Sheffield J. & Uijlenhoet, R. (2013): Global multi-model analysis of hydrological drought in the second part of the 20th century (1963-2000). Journal of Hydrometeorology 14, 1535–1552, doi:10.1175/JHM-D-12-0186.1.

Technical Report No. 35 - 41 -
Books or reports Alderlieste, M.A.A. & Lanen, H.A.J. van (2012): Trends in low flow and drought in selected European
areas derived from WATCH forcing data and simulated multi-model mean runoff. DROUGHT-R&SPI Technical Report No. 1, Wageningen, The Netherlands.
Bernoulli A (1890): Basler Chroniken herausgebeden von der historischen und antiquarischen gesellschaft in Basel. Leipzig, Verlag von S. Hirzel.
Boyle R (1692): The General History of the Air. London, Awnsbam&John Churchill. Brooks CEP, Glasspoole J (1928): British Floods and Droughts. Ernest Benn Limited London. Della Rocca (1790): Traité complet sur les abeilles avec une méthode nouvelle de les gouverner, telle
qu’elle se pratique à Syra, île de l’Archipel ; précédé d’un précis historique et économique de cette île. Paris, Imprimerie Bleuet.
Dostal P (2005): Klimarekonstruktion der Regio TriRhena mit Hilfe von direkten und indirekten Daten vor der Instrumentalbeobachtung. Fribourg, Berichte des Meteorologischen Institutes.
Environment Agency (2006): The impact of climate change on severe droughts. Major droughts in England and Wales from 1800 and evidence of impact. Science Report: SC040068/SR1.
Fenerli A (2008): To provlima tou nerou stin Ermoupoli (1823-1923). Hermoupolis, Declaration during the ‘Hermoupolis Seminars’.
Garnier E (2010): Les dérangements du temps, 500 ans de chaud et froids en Europe. Paris, Plon. Prize of the Académie des Sciences Morales et Politiques (Institut de France) and Risques 2010 La Tribune/BFM radio (2e édition).
Garnier E eds. (2010): Climat et Histoire, XVIe-XIXe siècles en Europe. Special issue 57-3, Revue d’Histoire Moderne et Contemporaine, Paris, Belin.
Hegel G (1869): Die Chronik der Stadt Strassbourg. Leipzig, Verlag Hirzel. IPCC (2012): Managing the Risks of Extreme Events and Disasters to Advance Climate Change
Adaptation. Special Report of Intergovernmental Panel on Climate Change. Cambridge, Cambridge University Press.
Le Roy Ladurie E (2004): Histoire humaine et comparée du climat. Vol. 1, Paris, Fayard. Lowe EJ (1870): Natural Phenomena and Chronology of the Seasons. Bell and Daldy, London. Mariolopoulos I (1938): To Kila tis Ellados. Athens. Pitton de Tournefort J (1717) : Relation d’un voyage du Levant fait par ordre du Roy : contenant l’histoire
ancienne et moderne de plusieurs isles de l’Archipel, de Constantinople, des côtes de la mer Noire, de l’Arménie, de la Géorgie, des frontières de Perse et d’Asie mineure. Paris, Imprimerie Royale.
Stadelhofer M (1880): Aufzeichnungen über die Witterungsverhältnisse zu Meersburg in den Jahren 1724 bis 1785: sowie über denkwürdige Vorkommisse jener Zeit; ursprünglich niedergeschrieben von den Rebleuten des Gotteshauses Münsterlingen. Karlsruhe, Müller.
Stahl, K., Blauhut, V., Kohn, I., Acácio, V., Assimacopoulos, D., Bifulco, C., De Stefano, L., Dias, S., Eilertz, D., Freilingsdorf, B., Hegdahl, T.J., Kampragou, E., Kourentzis, E., Melsen, L., Lanen, H.A.J. van, Loon, A.F. van, Massarutto, A., Musolino, D., De Paoli, L., Senn, L., Stagge, J.H., Tallaksen, L.M. & Urquijo, J. (2012b): A European drought impact report inventory (EDII): Design and test for selected recent droughts in Europe. DROUGHT-R&SPI Technical Report No 3, Freiburg, Germany.
Stolz H and Stolz W (1979): Die Hans Stolz’sche Gebweiler Chronik: Zeugenbericht über den Bauernkrieg am Oberrhein. Freiburg, Stolz.
Vischer W, Stern A (1872): Basel Chroniken herausgeberen von der historischen gesellschaft in Basel. Leipzig, Verlag von S. Hirzel.
Van Lanen, H.A.J., Alderlieste, M.A.A., Acacio, A., Andreu, J., Garnier, E., Gudmundsson, L., Haro Monteagudo, D., Lekkas, D., Paredes, J., Solera, A., Assimacopoulos, d., Rego, F., Seneviratne, S., Stahl, K., & Tallaksen, L.M. (2013): Quantitative analysis of historic droughts in selected European case study areas. DROUGHT-R&SPI Technical Report No. 8, Wageningen, The Netherlands.

Technical Report No. 35 - 42 -
Wallace JG (1997): Meteorological Observations at the Radcliffe Observatory Oxford: 1815-1995. School of Geography, Oxford, Research Paper 53.
Walter H (1901): Uber die Stromschnelle von Laufenburg. Diss. Phil. II, Zürich, Zürcher and Furrer. White G (1789): The Naturalist history and antiquities of Selborne. Edinburgh, Chambers. Chapter in Book, Proceedings Garnier, E. (2014):A historic experience for a strengthened resilience. European societies in front of
hydro-meteors 16th-20th centuries. In Quevauviller, P. (Eds). Prevention of hydrometeorological extreme events-Interfacing sciences and policies. Chichester, John Wiley & Sons, pp. 3-26.

Technical Report No. 35 - 43 -
Annexes Annex 1 Monthly and annual precipitation (in mm) at the Radcliffe Observatory Oxford between 1853
and 2012. Each of the panels gives the precipitation per months for a certain season and per year. Source: Meteorological Observations of the Radcliffe Observatory Oxford