historic rehabilitation tax credit recapture survey
TRANSCRIPT
HistoricRehabilitationTax CreditRecaptureSurveyCommissioned bythe National Trust forHistoric Preservation
2
Historic Rehabilitation Tax Credit Recapture Survey
The National Trust for Historic Preservation and
Novogradac & Company LLP wish to acknowledge the
contributions and assistance of Jerome Breed of Bryan
Cave International consulting LLC; William Machen
of Holland & Knight LLP; and Forrest Milder of Nixon
Peabody LLP in the preparation of this report.
On the Cover: The White Stag Block, Portland, Oregon. The 133,000-square-foot facility, built between 1892 and 1907, merges three buildings retaining the historic features that facilitated the use of historic rehabilitation tax credits and new markets tax credits.
3
Historic Rehabilitation Tax Credit Recapture Survey
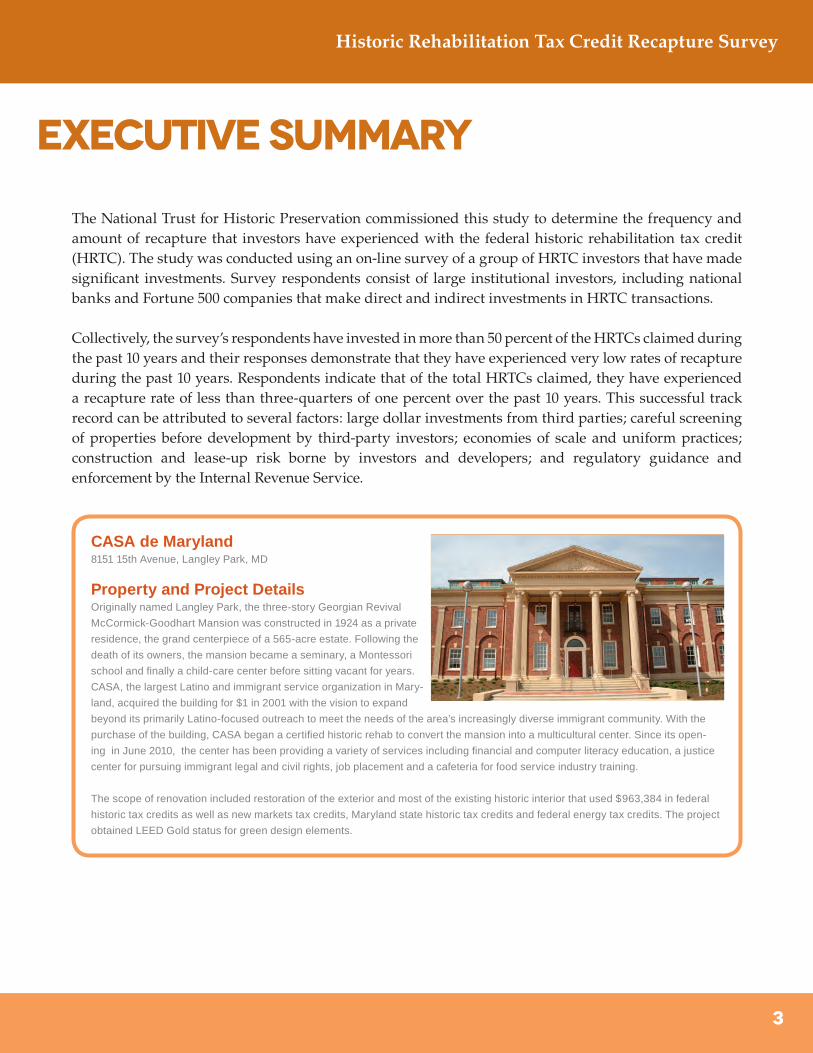
The National Trust for Historic Preservation commissioned this study to determine the frequency and amount of recapture that investors have experienced with the federal historic rehabilitation tax credit (HRTC). The study was conducted using an on-line survey of a group of HRTC investors that have made significant investments. Survey respondents consist of large institutional investors, including national banks and Fortune 500 companies that make direct and indirect investments in HRTC transactions.
Collectively, the survey’s respondents have invested in more than 50 percent of the HRTCs claimed during the past 10 years and their responses demonstrate that they have experienced very low rates of recapture during the past 10 years. Respondents indicate that of the total HRTCs claimed, they have experienced a recapture rate of less than three-quarters of one percent over the past 10 years. This successful track record can be attributed to several factors: large dollar investments from third parties; careful screening of properties before development by third-party investors; economies of scale and uniform practices; construction and lease-up risk borne by investors and developers; and regulatory guidance and enforcement by the Internal Revenue Service.
EXECUTIVE SUMMARY
CASA de Maryland8151 15th Avenue, Langley Park, MD
Property and Project DetailsOriginally named Langley Park, the three-story Georgian Revival
McCormick-Goodhart Mansion was constructed in 1924 as a private
residence, the grand centerpiece of a 565-acre estate. Following the
death of its owners, the mansion became a seminary, a Montessori
school and finally a child-care center before sitting vacant for years.
CASA, the largest Latino and immigrant service organization in Mary-
land, acquired the building for $1 in 2001 with the vision to expand
beyond its primarily Latino-focused outreach to meet the needs of the area’s increasingly diverse immigrant community. With the
purchase of the building, CASA began a certified historic rehab to convert the mansion into a multicultural center. Since its open-
ing in June 2010, the center has been providing a variety of services including financial and computer literacy education, a justice
center for pursuing immigrant legal and civil rights, job placement and a cafeteria for food service industry training.
The scope of renovation included restoration of the exterior and most of the existing historic interior that used $963,384 in federal
historic tax credits as well as new markets tax credits, Maryland state historic tax credits and federal energy tax credits. The project
obtained LEED Gold status for green design elements.
4
Historic Rehabilitation Tax Credit Recapture Survey
IntroductionFederal tax incentives for historic rehabilitation have rehabilitated more than 37,000 historic properties since 1978, restoring old, deteriorating buildings to commercial viability.1 Over the past 34 years, the HRTC has leveraged more than $90 billion in private investment toward the restoration of historic buildings, while at the same time creating more than two million jobs.2 It has revitalized distressed areas through the fostering of private
sector investment by providing an alternative to government ownership and management of historic properties, creating jobs and renewed commerce to the historic cores of cities and towns, increasing property values in these areas, and helping create additional alternatives for affordable housing. Pictures of successful projects have been included throughout this report to help illustrate the versatility of the HRTC.
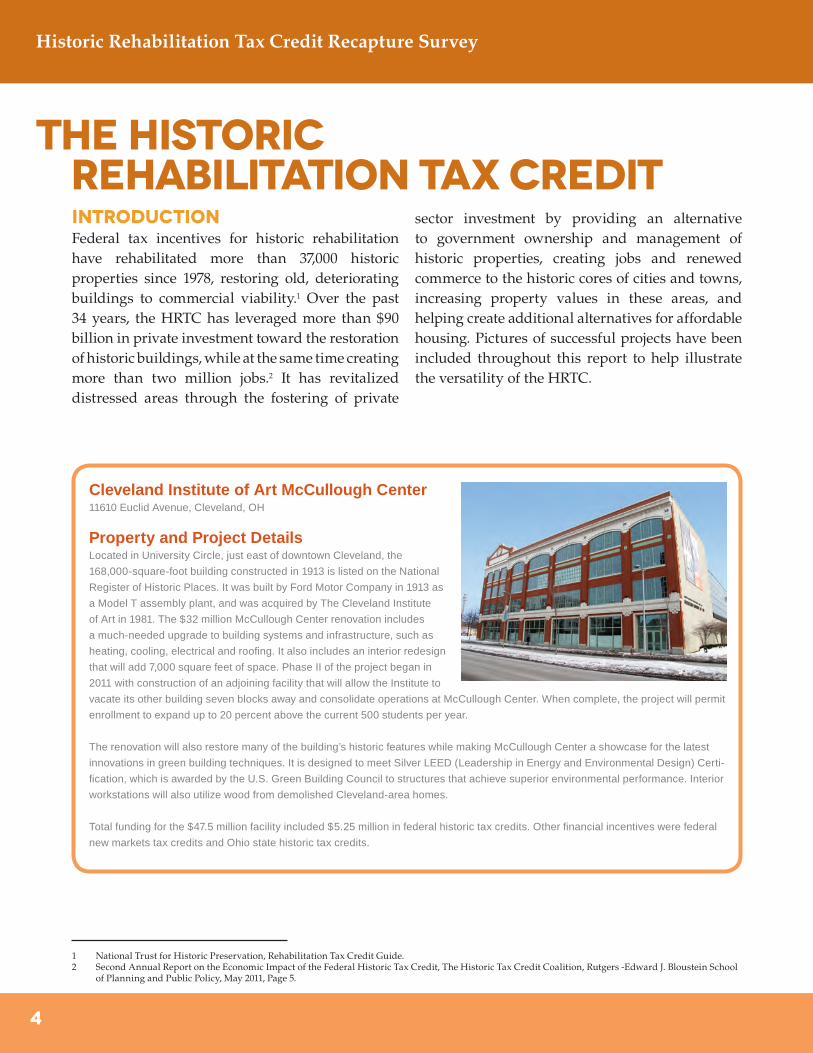
Cleveland Institute of Art McCullough Center11610 Euclid Avenue, Cleveland, OH
Property and Project DetailsLocated in University Circle, just east of downtown Cleveland, the
168,000-square-foot building constructed in 1913 is listed on the National
Register of Historic Places. It was built by Ford Motor Company in 1913 as
a Model T assembly plant, and was acquired by The Cleveland Institute
of Art in 1981. The $32 million McCullough Center renovation includes
a much-needed upgrade to building systems and infrastructure, such as
heating, cooling, electrical and roofing. It also includes an interior redesign
that will add 7,000 square feet of space. Phase II of the project began in
2011 with construction of an adjoining facility that will allow the Institute to
vacate its other building seven blocks away and consolidate operations at McCullough Center. When complete, the project will permit
enrollment to expand up to 20 percent above the current 500 students per year.
The renovation will also restore many of the building’s historic features while making McCullough Center a showcase for the latest
innovations in green building techniques. It is designed to meet Silver LEED (Leadership in Energy and Environmental Design) Certi-
fication, which is awarded by the U.S. Green Building Council to structures that achieve superior environmental performance. Interior
workstations will also utilize wood from demolished Cleveland-area homes.
Total funding for the $47.5 million facility included $5.25 million in federal historic tax credits. Other financial incentives were federal
new markets tax credits and Ohio state historic tax credits.
The Historic Rehabilitation Tax Credit
1 National Trust for Historic Preservation, Rehabilitation Tax Credit Guide.2 Second Annual Report on the Economic Impact of the Federal Historic Tax Credit, The Historic Tax Credit Coalition, Rutgers -Edward J. Bloustein School
of Planning and Public Policy, May 2011, Page 5.
5
Historic Rehabilitation Tax Credit Recapture Survey
LegislationFederal tax incentives for historic rehabilitation originally began as part of the Tax Reform Act of 1976 (TRA ’76). Prior to 1976, the Internal Revenue Code (IRC) provided no targeted incentives for rehabilitating historic or aged buildings.
Legislation for historic rehabilitation tax incentives can be segregated into four distinct periods: TRA ‘76, the Revenue Act of 1978, the Economic Recovery Tax Act of 1981, and the Tax Reform Act of 1986 (TRA ’86). Current rehabilitation tax credit legislation was passed as IRC Section 48(g) in TRA ‘86, and subsequently was re-designated to IRC Section 47 in the Revenue Reconciliation Act (RRA) of 1990. Treasury Regulations are promulgated in sections 1.47, 1.48 and 1.50.
TRA ‘86 changes to the IRC also ushered in some of
the most sweeping changes in real estate taxation that have occurred since the adoption of the modern tax code in 1954. That Act instituted limitations on the ability of investors (generally individuals and closely held C corporations) to use losses or credits generated by passive investments (including real estate),3 and lengthened depreciable lives for both regular and alternative minimum tax.
The changes contained in TRA ‘86 also provide what are essentially the rehabilitation tax credit rules that are in place today. TRA ‘86 amended IRC Section 48(g) by repealing the 15 percent and 20 percent credits and replacing both with a 10 percent credit for qualified rehabilitation expenditures for buildings first placed in service before 1936, and by replacing the 25 percent credit with a 20 percent credit for qualified rehabilitation expenditures for certified historic structures.
3 Internal Revenue Code Section (IRC §) 469. All references are to the Internal Revenue Code of 1986, as amended.
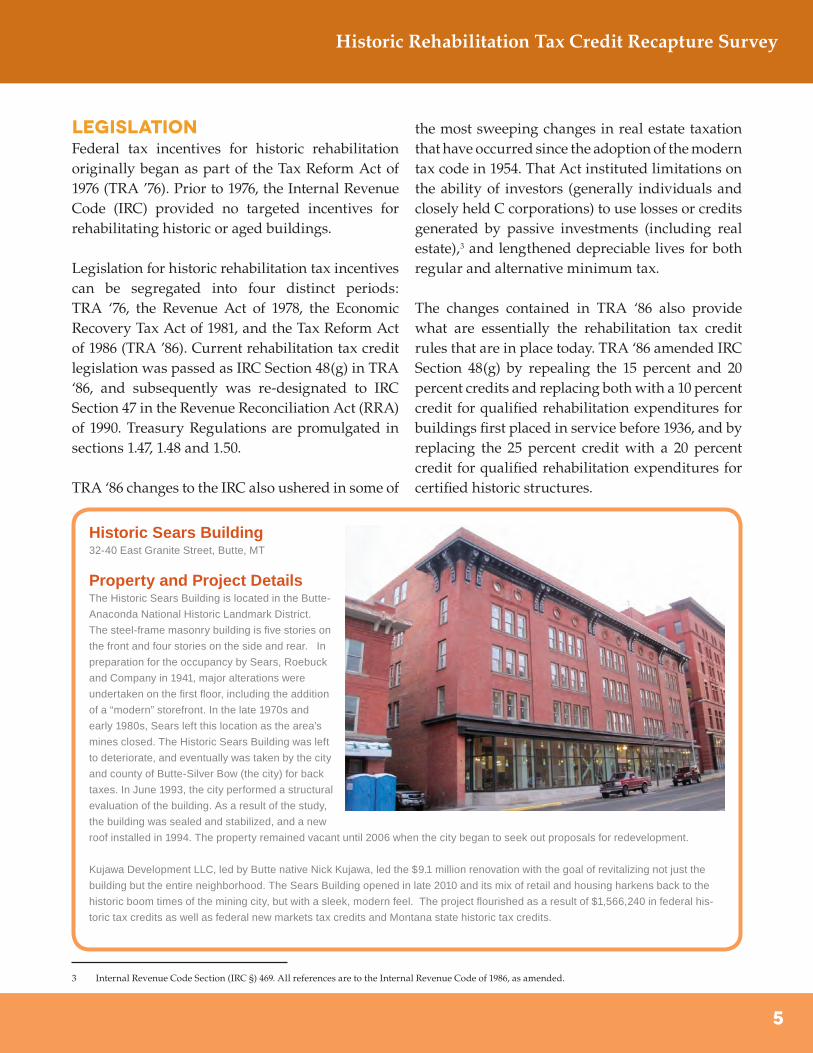
Historic Sears Building32-40 East Granite Street, Butte, MT
Property and Project DetailsThe Historic Sears Building is located in the Butte-
Anaconda National Historic Landmark District.
The steel-frame masonry building is five stories on
the front and four stories on the side and rear. In
preparation for the occupancy by Sears, Roebuck
and Company in 1941, major alterations were
undertaken on the first floor, including the addition
of a “modern” storefront. In the late 1970s and
early 1980s, Sears left this location as the area’s
mines closed. The Historic Sears Building was left
to deteriorate, and eventually was taken by the city
and county of Butte-Silver Bow (the city) for back
taxes. In June 1993, the city performed a structural
evaluation of the building. As a result of the study,
the building was sealed and stabilized, and a new
roof installed in 1994. The property remained vacant until 2006 when the city began to seek out proposals for redevelopment.
Kujawa Development LLC, led by Butte native Nick Kujawa, led the $9.1 million renovation with the goal of revitalizing not just the
building but the entire neighborhood. The Sears Building opened in late 2010 and its mix of retail and housing harkens back to the
historic boom times of the mining city, but with a sleek, modern feel. The project flourished as a result of $1,566,240 in federal his-
toric tax credits as well as federal new markets tax credits and Montana state historic tax credits.
6
Historic Rehabilitation Tax Credit Recapture Survey
Overview of HRTC4
The rehabilitation tax credit is an indirect federal subsidy used to finance the rehabilitation of historic and older buildings. Eligible taxpayers receive the incentive by claiming an investment tax credit on their federal income tax returns. The rehabilitation tax credit generally offsets taxes dollar-for-dollar because it is a tax credit, not a tax deduction. The rehabilitation tax credit was created as an incentive for private developers and investors to restore older and historic buildings to productive use.
The rehabilitation tax credit is generally claimed in the year the rehabilitation of the underlying building is placed in service. The credit is two-tiered: a credit of 10 percent for all qualified rehabilitation expenditures on any qualifying rehabilitation of a building that was first placed in service before 1936 and is not a certified historic structure, or a credit
of 20 percent (HRTC)5 of all qualified rehabilitation expenditures on any building that is a certified historic structure. A certified historic structure is defined as a building listed in the Department of the Interior’s National Register of Historic Places, or located in a National Register historic district and certified by the Secretary of the Interior as contributing to the significance of the district.
After the rehabilitation expenditures are placed in service, the building must remain in productive use and the entity owning the building must not sell the property for a period of five years from the date it was placed in service.
In order to qualify for the HRTC, a building must be a qualified rehabilitated building (QRB). To be considered a QRB, a building must meet four tests. First, the building must be “substantially
4 The overview of the HRTC is not intended to be a comprehensive technical discussion of all the rules and regulations. For a more in-depth look at the technical aspects of the HRTC, see Novogradac & Company LLP’s Historic Rehabilitation Handbook, 2009.
5 This study only surveyed investors regarding their recapture experience with the 20 percent historic rehabilitation tax credit.
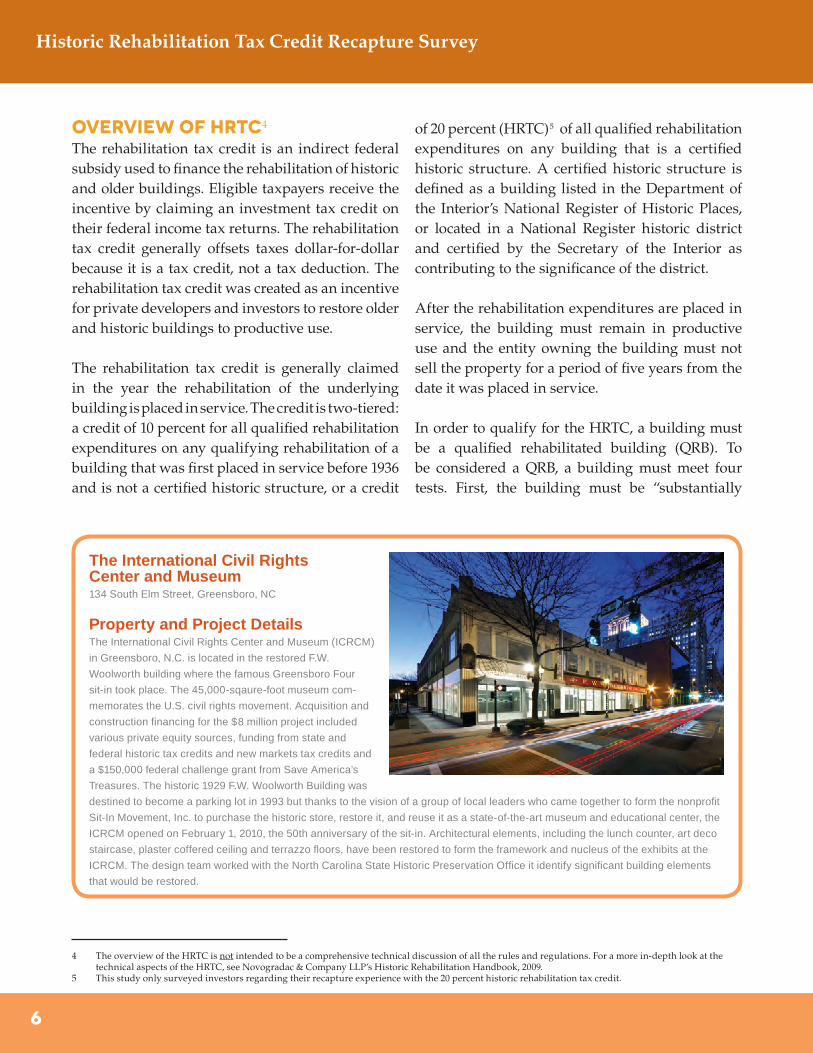
The International Civil RightsCenter and Museum134 South Elm Street, Greensboro, NC
Property and Project DetailsThe International Civil Rights Center and Museum (ICRCM)
in Greensboro, N.C. is located in the restored F.W.
Woolworth building where the famous Greensboro Four
sit-in took place. The 45,000-sqaure-foot museum com-
memorates the U.S. civil rights movement. Acquisition and
construction financing for the $8 million project included
various private equity sources, funding from state and
federal historic tax credits and new markets tax credits and
a $150,000 federal challenge grant from Save America’s
Treasures. The historic 1929 F.W. Woolworth Building was
destined to become a parking lot in 1993 but thanks to the vision of a group of local leaders who came together to form the nonprofit
Sit-In Movement, Inc. to purchase the historic store, restore it, and reuse it as a state-of-the-art museum and educational center, the
ICRCM opened on February 1, 2010, the 50th anniversary of the sit-in. Architectural elements, including the lunch counter, art deco
staircase, plaster coffered ceiling and terrazzo floors, have been restored to form the framework and nucleus of the exhibits at the
ICRCM. The design team worked with the North Carolina State Historic Preservation Office it identify significant building elements
that would be restored.
7
Historic Rehabilitation Tax Credit Recapture Survey
rehabilitated.”6 Second, the building must have been placed in service before the beginning of the rehabilitation.7 Third, depreciation (or amortization in lieu of depreciation) must be allowable with respect to such building.8 Fourth, the building must be located in the United States or in a territory or possession of the United States.9
Once the historic project has been identified, the taxpayer submits an application to the State Historic Preservation Office (SHPO) or directly to the National Park Service (NPS) for buildings located in those states that do not have a SHPO. The Part 1 application makes the case for nominating a building to the National Register. If the building is already on the Register or is listed as contributing to a National Register historic district, Part 1 documents this status. The Part 2 application describes the planned rehabilitation and how it meets the Secretary of
Interior’s Standards for Rehabilitation.
On completion of the rehabilitation work, the owner completes and submits a Part 3 application - Request for Certification of Completed Work. The NPS determination on Part 3 is the final word on whether the project does in fact qualify as a certified rehabilitation for purposes of the HRTC. For approved projects, NPS sends a copy of the Part 3 application to the IRS and the taxpayer is eligible to claim credits on the project.
While both the NPS and the SHPO administer the application and approval process of the federal HRTC, the Internal Revenue Service (IRS) also plays an important and integral role in the federal HRTC program. The following is a discussion of the responsibilities of the NPS, the SHPO and the IRS.
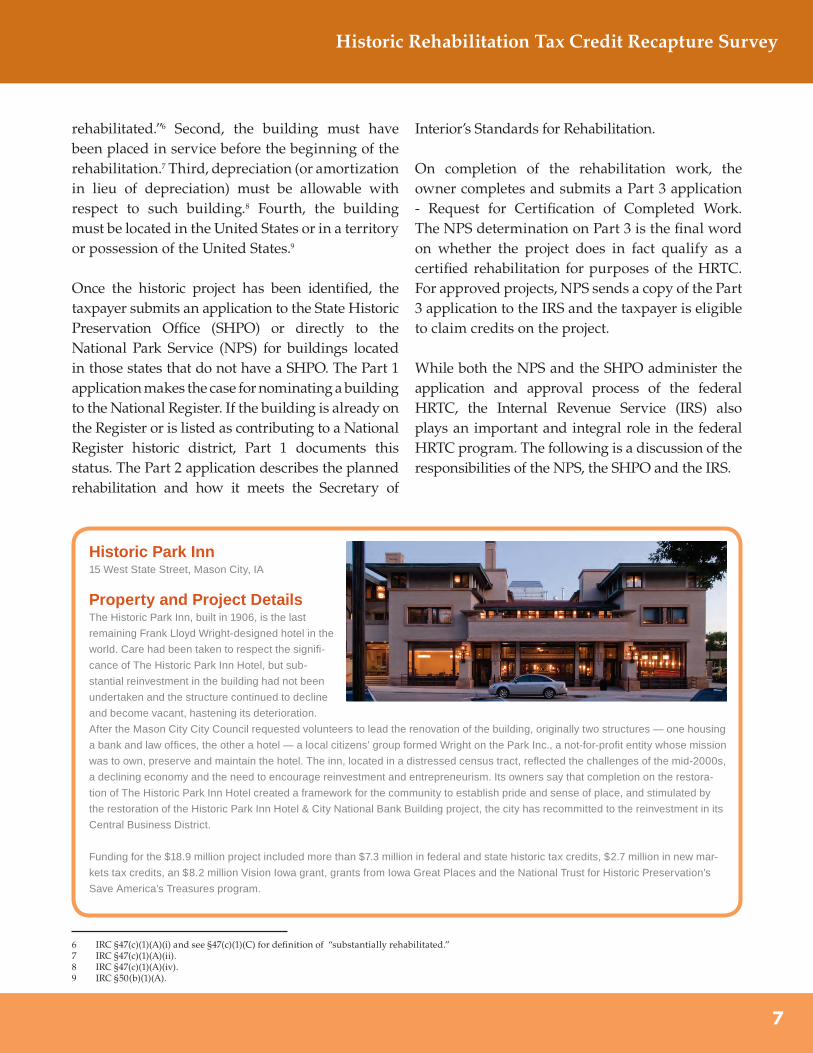
Historic Park Inn15 West State Street, Mason City, IA
Property and Project DetailsThe Historic Park Inn, built in 1906, is the last
remaining Frank Lloyd Wright-designed hotel in the
world. Care had been taken to respect the signifi-
cance of The Historic Park Inn Hotel, but sub-
stantial reinvestment in the building had not been
undertaken and the structure continued to decline
and become vacant, hastening its deterioration.
After the Mason City City Council requested volunteers to lead the renovation of the building, originally two structures — one housing
a bank and law offices, the other a hotel — a local citizens’ group formed Wright on the Park Inc., a not-for-profit entity whose mission
was to own, preserve and maintain the hotel. The inn, located in a distressed census tract, reflected the challenges of the mid-2000s,
a declining economy and the need to encourage reinvestment and entrepreneurism. Its owners say that completion on the restora-
tion of The Historic Park Inn Hotel created a framework for the community to establish pride and sense of place, and stimulated by
the restoration of the Historic Park Inn Hotel & City National Bank Building project, the city has recommitted to the reinvestment in its
Central Business District.
Funding for the $18.9 million project included more than $7.3 million in federal and state historic tax credits, $2.7 million in new mar-
kets tax credits, an $8.2 million Vision Iowa grant, grants from Iowa Great Places and the National Trust for Historic Preservation’s
Save America’s Treasures program.
6 IRC §47(c)(1)(A)(i) and see §47(c)(1)(C) for definition of “substantially rehabilitated.”7 IRC §47(c)(1)(A)(ii).8 IRC §47(c)(1)(A)(iv).9 IRC §50(b)(1)(A).
8
Historic Rehabilitation Tax Credit Recapture Survey
The Role of the Administering AgenciesThe HRTC program is a partnership among the NPS, the SHPO and the IRS. Each has the following important roles:10
SHPO•Serves as first point of contact for property
owners•Provides application forms, regulations and
other program information•Maintains complete records of its state’s
buildings and districts listed in the National Register of Historic Places, as well as state and local districts that may qualify as registered historic districts
•Assists anyone wishing to list a building or a district in the National Register of Historic Places
•Provides technical assistance and literature on appropriate rehabilitation treatments
•Advises owners on their applications and makes occasional site visits to assist owners
•Recommends certification to the NPS
NPS•Reviews all applications for conformance to
the Secretary of the Interior’s Standards for Rehabilitation
•Issues all certification decisions (approvals or denials) in writing
•Transmits copies of all decisions to the IRS•Develops and publishes program regulations,
the Secretary of the Interior’s Standards for Rehabilitation, the Historic Preservation Certification Application, and information on rehabilitation treatments
IRS•Publishes regulations governing which
rehabilitation expenses qualify, the time periods for incurring expenses, the tax consequences of certification decisions by NPS, and all other procedural and legal matters concerning both the 20 percent HRTC and the 10 percent rehabilitation tax credits
•Answers public inquiries concerning legal and financial aspects of the rehabilitation tax credit program, and publishes the audit guide, Market Segment Specialization Program: Rehabilitation Tax Credit, to assist owners
•Ensures that only parties eligible for the rehabilitation tax credit utilize them.
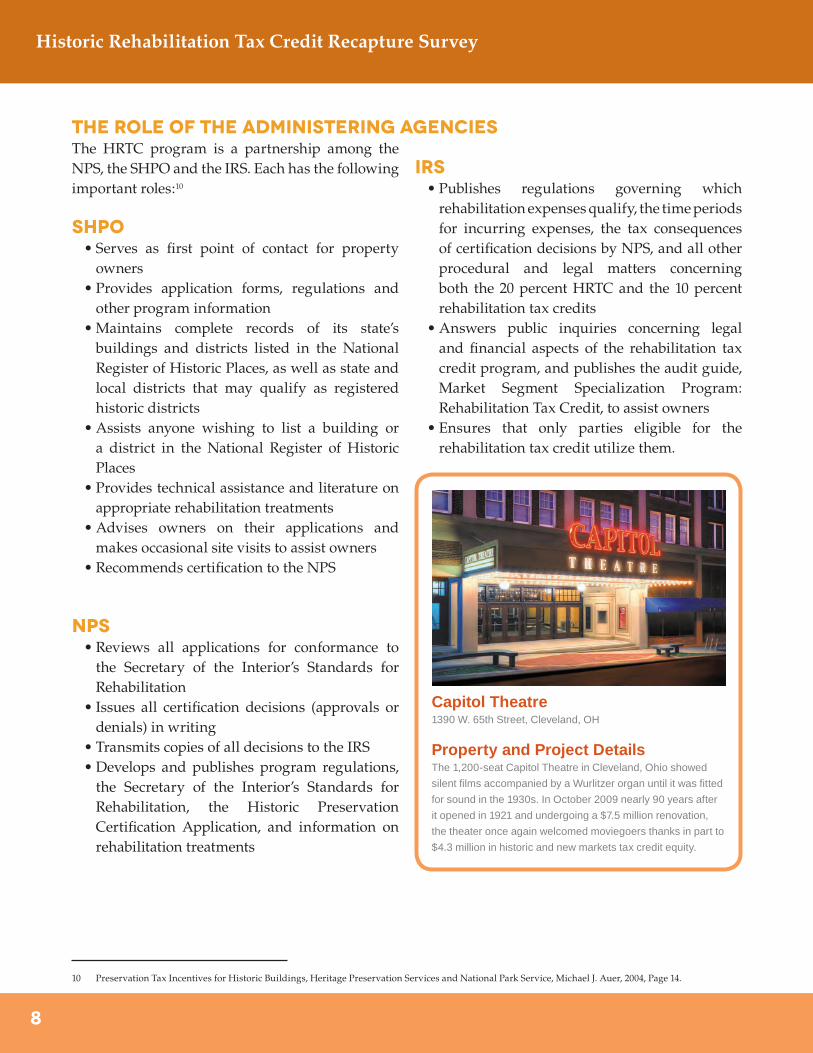
Capitol Theatre1390 W. 65th Street, Cleveland, OH
Property and Project DetailsThe 1,200-seat Capitol Theatre in Cleveland, Ohio showed
silent films accompanied by a Wurlitzer organ until it was fitted
for sound in the 1930s. In October 2009 nearly 90 years after
it opened in 1921 and undergoing a $7.5 million renovation,
the theater once again welcomed moviegoers thanks in part to
$4.3 million in historic and new markets tax credit equity.
10 Preservation Tax Incentives for Historic Buildings, Heritage Preservation Services and National Park Service, Michael J. Auer, 2004, Page 14.
9
Historic Rehabilitation Tax Credit Recapture Survey
Basis Reduction Requirement11
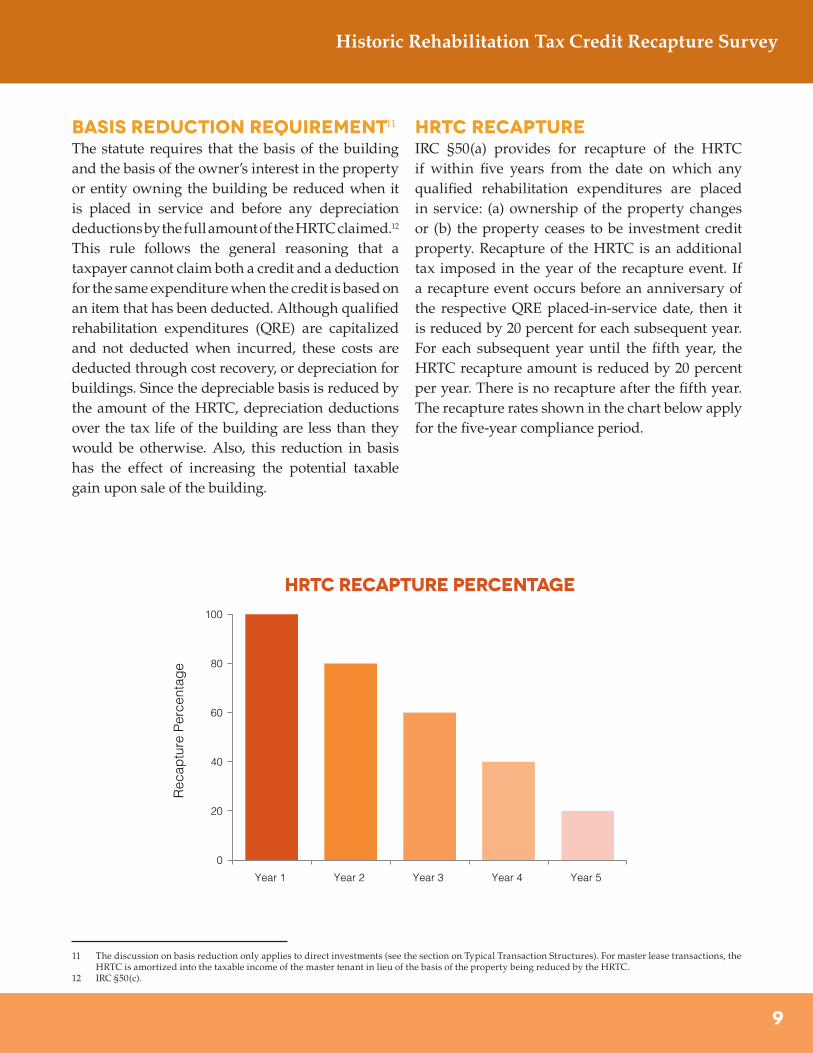
The statute requires that the basis of the building and the basis of the owner’s interest in the property or entity owning the building be reduced when it is placed in service and before any depreciation deductions by the full amount of the HRTC claimed.12 This rule follows the general reasoning that a taxpayer cannot claim both a credit and a deduction for the same expenditure when the credit is based on an item that has been deducted. Although qualified rehabilitation expenditures (QRE) are capitalized and not deducted when incurred, these costs are deducted through cost recovery, or depreciation for buildings. Since the depreciable basis is reduced by the amount of the HRTC, depreciation deductions over the tax life of the building are less than they would be otherwise. Also, this reduction in basis has the effect of increasing the potential taxable gain upon sale of the building.
HRTC RecaptureIRC §50(a) provides for recapture of the HRTC if within five years from the date on which any qualified rehabilitation expenditures are placed in service: (a) ownership of the property changes or (b) the property ceases to be investment credit property. Recapture of the HRTC is an additional tax imposed in the year of the recapture event. If a recapture event occurs before an anniversary of the respective QRE placed-in-service date, then it is reduced by 20 percent for each subsequent year. For each subsequent year until the fifth year, the HRTC recapture amount is reduced by 20 percent per year. There is no recapture after the fifth year. The recapture rates shown in the chart below apply for the five-year compliance period.
100
0
20
40
60
80
Year 1 Year 2 Year 3 Year 4 Year 5
Rec
aptu
re P
erce
ntag
e
HRTC Recapture Percentage HRTC Recapture rATE AS ApERCENTAGE oF aLL cREDITS cLAIMED
HRTC Recapture rATE AS ApERCENTAGE oF ALL
RESPONDENT TRANSACTIONS
$0
$5,000
$10,000
$15,000
$20,000
$25,000
$30,000
QREs HRTCs
Mill
ions
QRES and HRTCSOver the Past 10 Years
Total in the Past 10 Years
Claimed by Respondents
$0
$500
$1,000
$1,500
$2,000
$2,500
$3,000
$3,500
Total HRTCs Claimed byRespondents
HRTCs Recaptured
Am
ount
of H
RTC
s C
laim
ed(in
mill
ions
)
Total HRTCs Claimed byRespondents
HRTCs Recaptured
0
100
200
300
400
500
600
700
Total Transactions Recaptured Transactions
Num
ber
of T
rans
actio
ns R
ecap
ture
d
Total Transactions
Recaptured Transactions
0
LIHTC NMTC Renewable Energy
Perc
enta
ge o
f Res
pon
den
ts
0
50
100
150
200
250
300
Investor A Investor B Investor C Investor D Investor E Investor F
Axi
s Ti
tle
Number of Transactions
0
1
2
3
4
Year 1 Year 2 Year 3 Year 4 Year 5
Num
ber
of T
rans
actio
ns
yEAR OF cOMPLIANCE pERIODIN WHICH rECAPTURE oCCURRED
nUMBER OF YEARS THE oRGANIZATIONhAS bEEN iNVESTING IN hrtc
pERCENTAGE OF rESPONDENTSpARTICIPATING IN oTHERtAX cREDIT pROGRAMS
0
40
20
60
80
100
0-10 10-20 20-30
Perc
enta
ge o
f Res
pond
ents
Number of Years the Organization has been Investing in HRTC
Projects Types of Total CertifiedProjects in the Past 10 Years
nUMBER OF tRANSACTION eXPERIENCING rECAPTURE
BY rESPONDENTS
0
1
2
3
4
5
$1 Million or Less More than $6 Million$1 - $6 Million
Num
ber
of T
rans
actio
ns
Amount of Recapture
$1 Million or Less
$1 - $6 Million
More than $6 Million
40
20
60
80
100
hrtc rECAPTURErATE FOR THEPAST 10 YEARS
IS 1.07%
hrtc rECAPTURErATE FOR THEPAST 10 YEARSIS 0.73% on a
dollar volumebasis.
51%
17%15%
8%
6%3%
Housing
Mixed use
Retail
Office
Other
Hotel
11 The discussion on basis reduction only applies to direct investments (see the section on Typical Transaction Structures). For master lease transactions, the HRTC is amortized into the taxable income of the master tenant in lieu of the basis of the property being reduced by the HRTC.
12 IRC §50(c).
10
Historic Rehabilitation Tax Credit Recapture Survey
For partnerships owning an HRTC property, recapture is required if the partnership sells or transfers the building to another taxpayer or if a partner disposes of more than one-third of its interest in the partnership.
Recapture is also required if the building ceases to qualify as investment credit property. Investment credit property is defined as a property that is depreciable or amortizable and otherwise qualifies as a rehabilitation, energy or reforestation credit property. Therefore, if within the five-year recapture period the HRTC property subsequently becomes non-depreciable — i.e., it is converted to personal use; is taken out of service; or becomes a non-qualified rehabilitated building — for example, it is destroyed by a natural disaster — recapture is generally required.
Those Who Can Use the HRTCThe HRTC is a dollar-for-dollar credit against regular U.S. federal income tax and alternative minimum tax. In general, it is available to any taxpayer that is liable for income taxes, including individuals, regular corporations (including personal service corporations), estates and trusts, although the ability of individuals and closely-held corporations to utilize the HRTC is limited by the passive activity rules contained in IRC §469.
The HRTC is not directly available to pass-through entities, such as partnerships, limited liability companies treated as partnerships for tax purposes, or S corporations, since these entities generally are not subject to entity-level income tax.
The credit does, however, pass through these types of entities to be then used by partners, members or shareholders. In fact, the majority of HRTC properties are owned by pass-through entities because of other business considerations. Exempt organizations are not generally subject to federal income tax; therefore, they generally do not claim or use the HRTC.
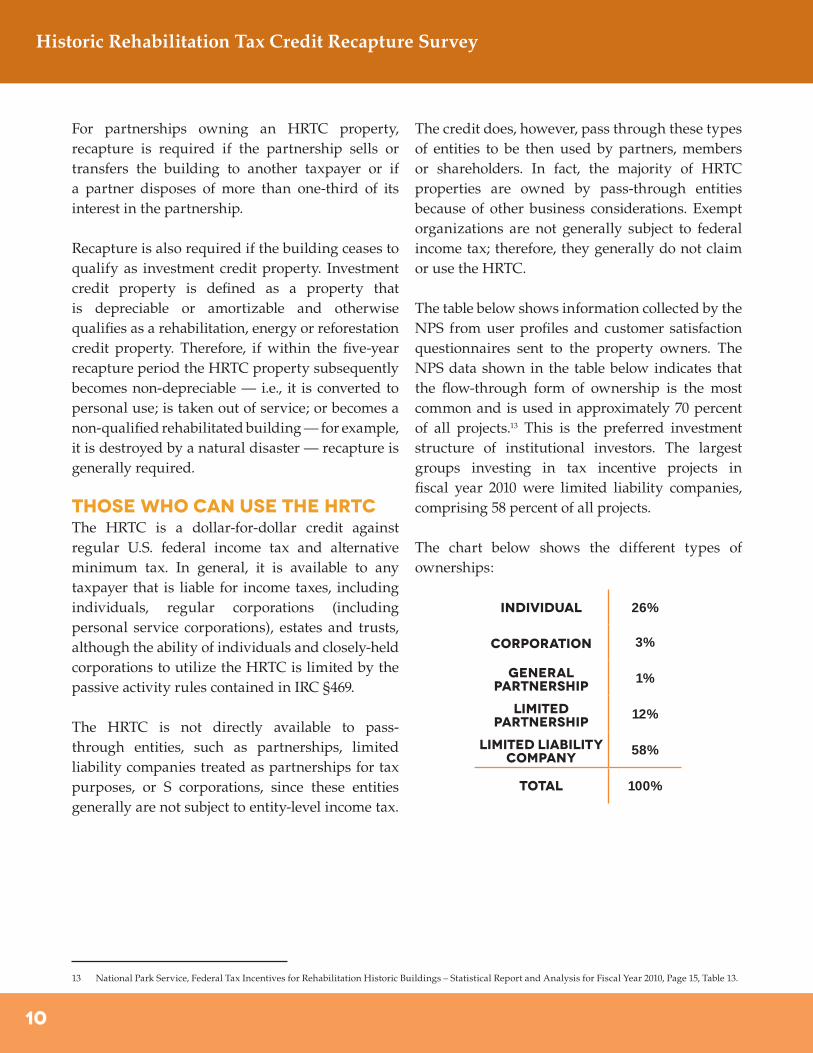
The table below shows information collected by the NPS from user profiles and customer satisfaction questionnaires sent to the property owners. The NPS data shown in the table below indicates that the flow-through form of ownership is the most common and is used in approximately 70 percent of all projects.13 This is the preferred investment structure of institutional investors. The largest groups investing in tax incentive projects in fiscal year 2010 were limited liability companies, comprising 58 percent of all projects.
The chart below shows the different types of ownerships:
iNDIVIDUAL 26%
cORPORATION 3%
gENERAL PARTNERSHIP 1%
LIMITED PARTNERSHIP 12%
LIMITED LIABILITY COMPANY 58%
TOTAL 100%
13 National Park Service, Federal Tax Incentives for Rehabilitation Historic Buildings – Statistical Report and Analysis for Fiscal Year 2010, Page 15, Table 13.
11
Historic Rehabilitation Tax Credit Recapture Survey
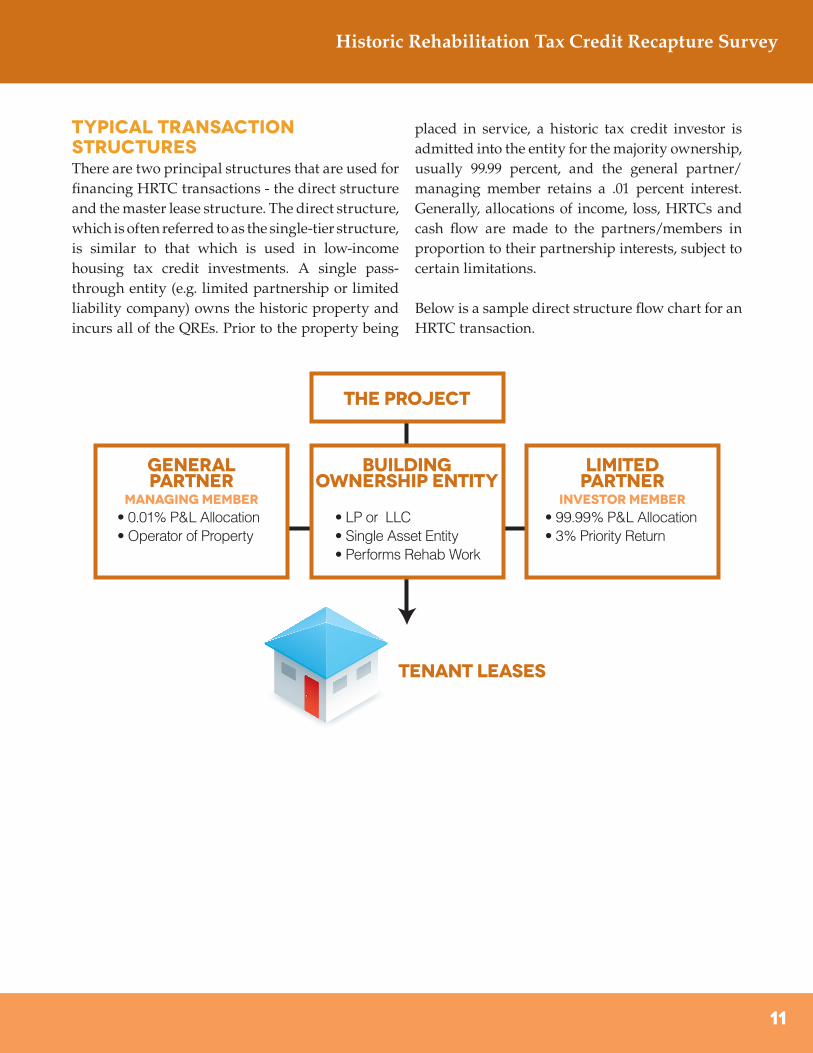
Typical Transaction StructuresThere are two principal structures that are used for financing HRTC transactions - the direct structure and the master lease structure. The direct structure, which is often referred to as the single-tier structure, is similar to that which is used in low-income housing tax credit investments. A single pass-through entity (e.g. limited partnership or limited liability company) owns the historic property and incurs all of the QREs. Prior to the property being
placed in service, a historic tax credit investor is admitted into the entity for the majority ownership, usually 99.99 percent, and the general partner/managing member retains a .01 percent interest. Generally, allocations of income, loss, HRTCs and cash flow are made to the partners/members in proportion to their partnership interests, subject to certain limitations.
Below is a sample direct structure flow chart for an HRTC transaction.
The Project
BuildingOwnership Entity
Tenant Leases
GeneralPartner
managing member investor member
LimitedPartner
• LP or LLC• Single Asset Entity• Performs Rehab Work
• 99.99% P&L Allocation• 3% Priority Return
• 0.01% P&L Allocation• Operator of Property
12
Historic Rehabilitation Tax Credit Recapture Survey
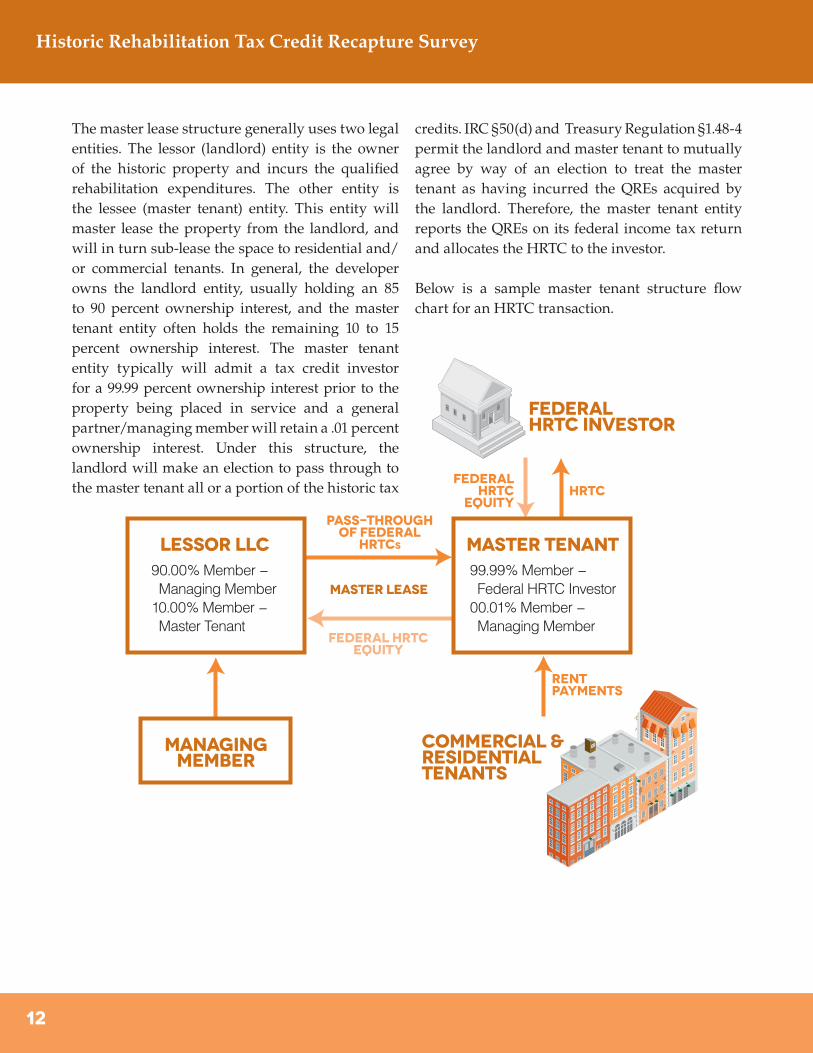
The master lease structure generally uses two legal entities. The lessor (landlord) entity is the owner of the historic property and incurs the qualified rehabilitation expenditures. The other entity is the lessee (master tenant) entity. This entity will master lease the property from the landlord, and will in turn sub-lease the space to residential and/or commercial tenants. In general, the developer owns the landlord entity, usually holding an 85 to 90 percent ownership interest, and the master tenant entity often holds the remaining 10 to 15 percent ownership interest. The master tenant entity typically will admit a tax credit investor for a 99.99 percent ownership interest prior to the property being placed in service and a general partner/managing member will retain a .01 percent ownership interest. Under this structure, the landlord will make an election to pass through to the master tenant all or a portion of the historic tax
credits. IRC §50(d) and Treasury Regulation §1.48-4 permit the landlord and master tenant to mutually agree by way of an election to treat the master tenant as having incurred the QREs acquired by the landlord. Therefore, the master tenant entity reports the QREs on its federal income tax return and allocates the HRTC to the investor.
Below is a sample master tenant structure flow chart for an HRTC transaction.
ManagingMember
commercial &residentialTenants
FederalHrtc investor
Lessor LLC90.00% Member − Managing Member10.00% Member − Master Tenant
Master Tenant99.99% Member − Federal HRTC Investor00.01% Member − Managing Member
RentPayments
hrtcFederal
HRTCEquity
pass-throughof federal
HRtcS
Federal HRtcequity
master lease
13
Historic Rehabilitation Tax Credit Recapture Survey
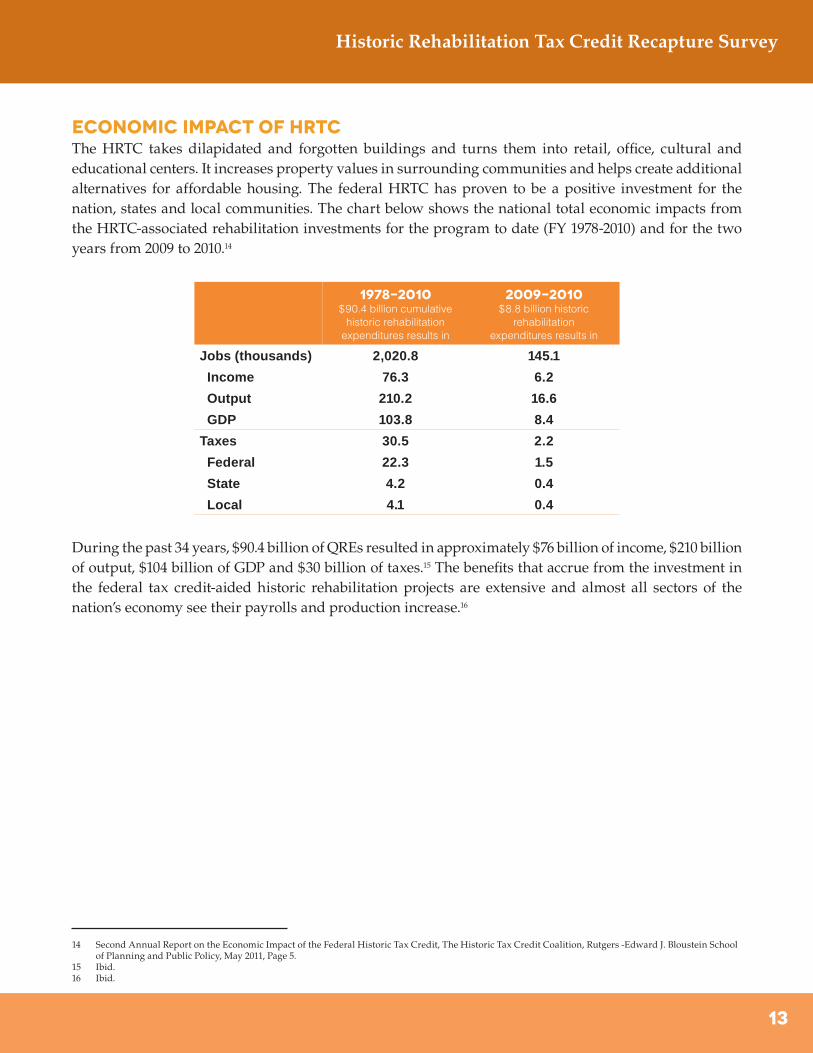
Economic Impact of HRTCThe HRTC takes dilapidated and forgotten buildings and turns them into retail, office, cultural and educational centers. It increases property values in surrounding communities and helps create additional alternatives for affordable housing. The federal HRTC has proven to be a positive investment for the nation, states and local communities. The chart below shows the national total economic impacts from the HRTC-associated rehabilitation investments for the program to date (FY 1978-2010) and for the two years from 2009 to 2010.14
During the past 34 years, $90.4 billion of QREs resulted in approximately $76 billion of income, $210 billion of output, $104 billion of GDP and $30 billion of taxes.15 The benefits that accrue from the investment in the federal tax credit-aided historic rehabilitation projects are extensive and almost all sectors of the nation’s economy see their payrolls and production increase.16
1978-2010$90.4 billion cumulative
historic rehabilitationexpenditures results in
2009-2010$8.8 billion historic
rehabilitationexpenditures results in
Jobs (thousands) 2,020.8 145.1
Income 76.3 6.2
Output 210.2 16.6
GDP 103.8 8.4
Taxes 30.5 2.2
Federal 22.3 1.5
State 4.2 0.4
Local 4.1 0.4
14 Second Annual Report on the Economic Impact of the Federal Historic Tax Credit, The Historic Tax Credit Coalition, Rutgers -Edward J. Bloustein School of Planning and Public Policy, May 2011, Page 5.
15 Ibid.16 Ibid.
14
Historic Rehabilitation Tax Credit Recapture Survey
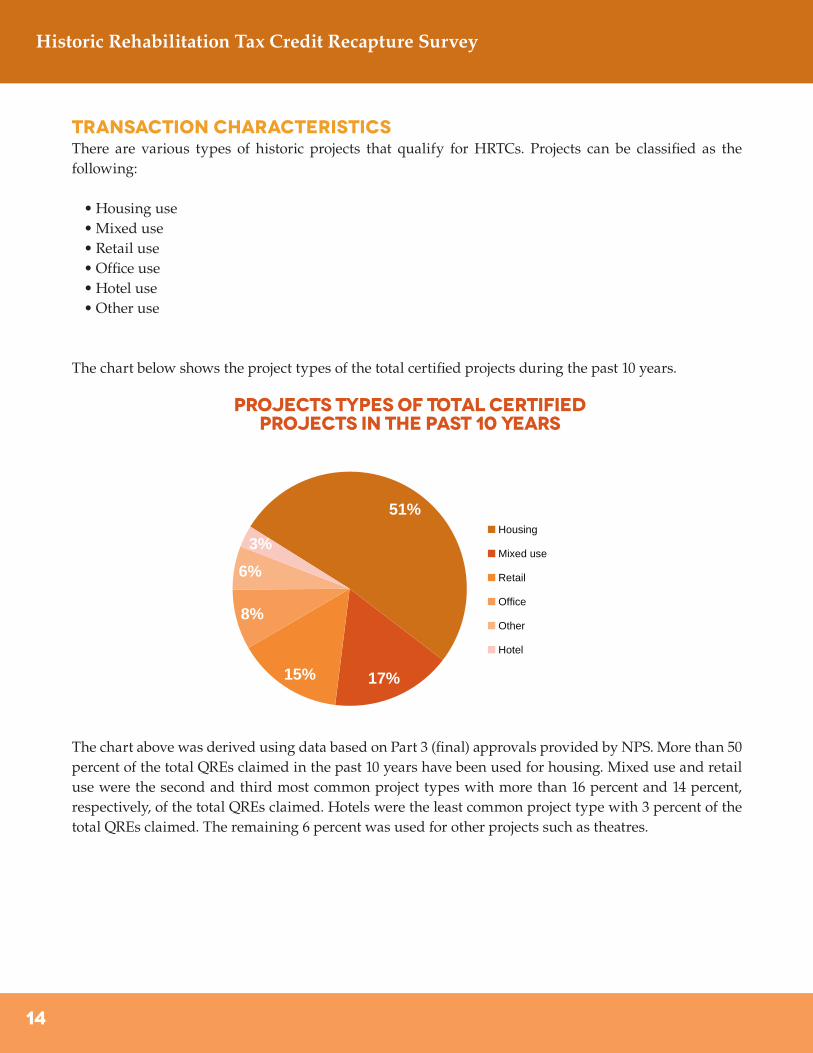
Transaction CharacteristicsThere are various types of historic projects that qualify for HRTCs. Projects can be classified as the following:
•Housing use•Mixed use•Retail use•Office use•Hotel use•Other use
The chart below shows the project types of the total certified projects during the past 10 years.
The chart above was derived using data based on Part 3 (final) approvals provided by NPS. More than 50 percent of the total QREs claimed in the past 10 years have been used for housing. Mixed use and retail use were the second and third most common project types with more than 16 percent and 14 percent, respectively, of the total QREs claimed. Hotels were the least common project type with 3 percent of the total QREs claimed. The remaining 6 percent was used for other projects such as theatres.
100
0
20
40
60
80
Year 1 Year 2 Year 3 Year 4 Year 5
Rec
aptu
re P
erce
ntag
e
HRTC Recapture Percentage HRTC Recapture rATE AS ApERCENTAGE oF aLL cREDITS cLAIMED
HRTC Recapture rATE AS ApERCENTAGE oF ALL
RESPONDENT TRANSACTIONS
$0
$5,000
$10,000
$15,000
$20,000
$25,000
$30,000
QREs HRTCs
Mill
ions
QRES and HRTCSOver the Past 10 Years
Total in the Past 10 Years
Claimed by Respondents
$0
$500
$1,000
$1,500
$2,000
$2,500
$3,000
$3,500
Total HRTCs Claimed byRespondents
HRTCs Recaptured
Am
ount
of H
RTC
s C
laim
ed(in
mill
ions
)
Total HRTCs Claimed byRespondents
HRTCs Recaptured
0
100
200
300
400
500
600
700
Total Transactions Recaptured Transactions
Num
ber
of T
rans
actio
ns R
ecap
ture
d
Total Transactions
Recaptured Transactions
0
LIHTC NMTC Renewable Energy
Perc
enta
ge o
f Res
pon
den
ts
0
50
100
150
200
250
300
Investor A Investor B Investor C Investor D Investor E Investor F
Axi
s Ti
tle
Number of Transactions
0
1
2
3
4
Year 1 Year 2 Year 3 Year 4 Year 5
Num
ber
of T
rans
actio
ns
yEAR OF cOMPLIANCE pERIODIN WHICH rECAPTURE oCCURRED
nUMBER OF YEARS THE oRGANIZATIONhAS bEEN iNVESTING IN hrtc
pERCENTAGE OF rESPONDENTSpARTICIPATING IN oTHERtAX cREDIT pROGRAMS
0
40
20
60
80
100
0-10 10-20 20-30
Perc
enta
ge o
f Res
pond
ents
Number of Years the Organization has been Investing in HRTC
Projects Types of Total CertifiedProjects in the Past 10 Years
nUMBER OF tRANSACTION eXPERIENCING rECAPTURE
BY rESPONDENTS
0
1
2
3
4
5
$1 Million or Less More than $6 Million$1 - $6 MillionN
umb
er o
f Tra
nsac
tions
Amount of Recapture
$1 Million or Less
$1 - $6 Million
More than $6 Million
40
20
60
80
100
hrtc rECAPTURErATE FOR THEPAST 10 YEARS
IS 1.07%
hrtc rECAPTURErATE FOR THEPAST 10 YEARSIS 0.73% on a
dollar volumebasis.
51%
17%15%
8%
6%3%
Housing
Mixed use
Retail
Office
Other
Hotel
15
Historic Rehabilitation Tax Credit Recapture Survey
Novogradac & Company LLP conducted a survey of large institutional investors including national banks and Fortune 500 companies17 that make direct and indirect investments in HRTC transactions.18
Survey respondents collectively have earned more than 50 percent of the HRTCs claimed during the past 10 years.
Information on the following was gathered from the respondents:
•Number of years the organization has been investing in HRTCs•Total amount invested in HRTCs•Number of HRTC transactions the organization has completed•Other types of tax credit programs in which the organization participates•Number of transactions that have experienced recapture•The year of the compliance period in which recapture occurred
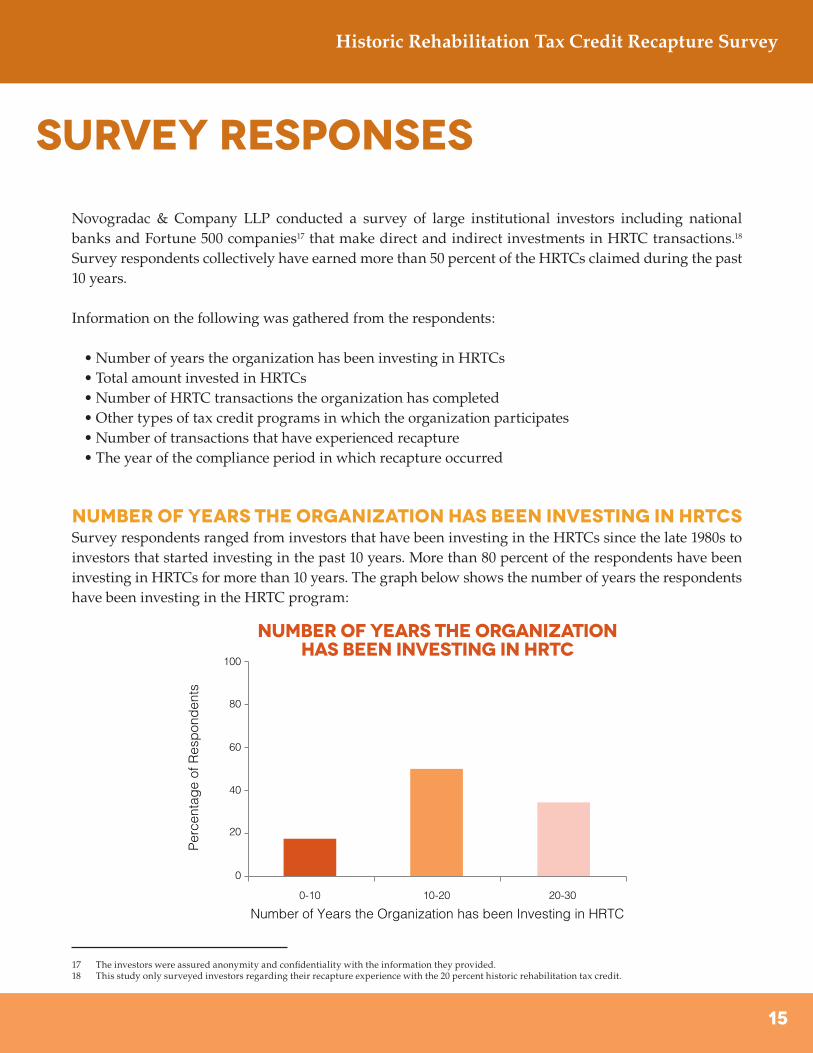
Number of years the organization has been investing in HRTCsSurvey respondents ranged from investors that have been investing in the HRTCs since the late 1980s to investors that started investing in the past 10 years. More than 80 percent of the respondents have been investing in HRTCs for more than 10 years. The graph below shows the number of years the respondents have been investing in the HRTC program:
100
0
20
40
60
80
Year 1 Year 2 Year 3 Year 4 Year 5
Rec
aptu
re P
erce
ntag
e
HRTC Recapture Percentage HRTC Recapture rATE AS ApERCENTAGE oF aLL cREDITS cLAIMED
HRTC Recapture rATE AS ApERCENTAGE oF ALL
RESPONDENT TRANSACTIONS
$0
$5,000
$10,000
$15,000
$20,000
$25,000
$30,000
QREs HRTCs
Mill
ions
QRES and HRTCSOver the Past 10 Years
Total in the Past 10 Years
Claimed by Respondents
$0
$500
$1,000
$1,500
$2,000
$2,500
$3,000
$3,500
Total HRTCs Claimed byRespondents
HRTCs Recaptured
Am
ount
of H
RTC
s C
laim
ed(in
mill
ions
)
Total HRTCs Claimed byRespondents
HRTCs Recaptured
0
100
200
300
400
500
600
700
Total Transactions Recaptured TransactionsN
umb
er o
f Tra
nsac
tions
Rec
aptu
red
Total Transactions
Recaptured Transactions
0
LIHTC NMTC Renewable Energy
Perc
enta
ge o
f Res
pon
den
ts
0
50
100
150
200
250
300
Investor A Investor B Investor C Investor D Investor E Investor F
Axi
s Ti
tle
Number of Transactions
0
1
2
3
4
Year 1 Year 2 Year 3 Year 4 Year 5
Num
ber
of T
rans
actio
ns
yEAR OF cOMPLIANCE pERIODIN WHICH rECAPTURE oCCURRED
nUMBER OF YEARS THE oRGANIZATIONhAS bEEN iNVESTING IN hrtc
pERCENTAGE OF rESPONDENTSpARTICIPATING IN oTHERtAX cREDIT pROGRAMS
0
40
20
60
80
100
0-10 10-20 20-30
Perc
enta
ge o
f Res
pond
ents
Number of Years the Organization has been Investing in HRTC
Projects Types of Total CertifiedProjects in the Past 10 Years
nUMBER OF tRANSACTION eXPERIENCING rECAPTURE
BY rESPONDENTS
0
1
2
3
4
5
$1 Million or Less More than $6 Million$1 - $6 Million
Num
ber
of T
rans
actio
ns
Amount of Recapture
$1 Million or Less
$1 - $6 Million
More than $6 Million
40
20
60
80
100
hrtc rECAPTURErATE FOR THEPAST 10 YEARS
IS 1.07%
hrtc rECAPTURErATE FOR THEPAST 10 YEARSIS 0.73% on a
dollar volumebasis.
51%
17%15%
8%
6%3%
Housing
Mixed use
Retail
Office
Other
Hotel
17 The investors were assured anonymity and confidentiality with the information they provided.18 This study only surveyed investors regarding their recapture experience with the 20 percent historic rehabilitation tax credit.
Survey Responses
16
Historic Rehabilitation Tax Credit Recapture Survey
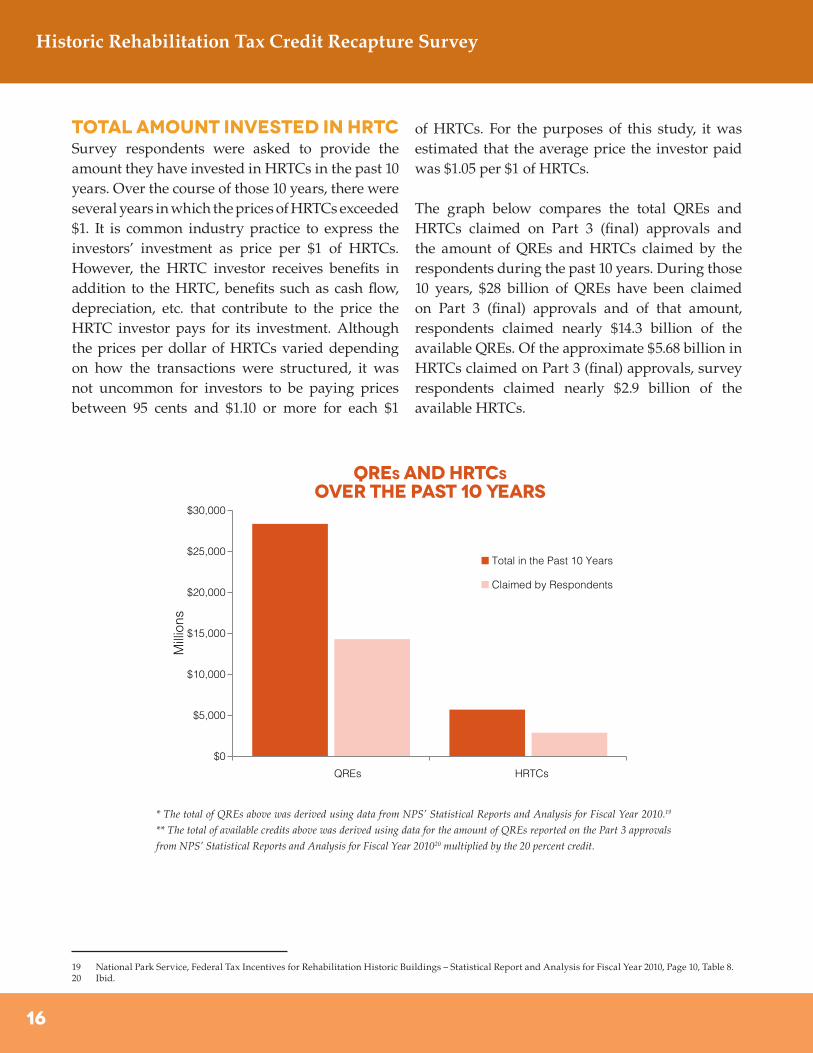
Total Amount Invested in HRTCSurvey respondents were asked to provide the amount they have invested in HRTCs in the past 10 years. Over the course of those 10 years, there were several years in which the prices of HRTCs exceeded $1. It is common industry practice to express the investors’ investment as price per $1 of HRTCs. However, the HRTC investor receives benefits in addition to the HRTC, benefits such as cash flow, depreciation, etc. that contribute to the price the HRTC investor pays for its investment. Although the prices per dollar of HRTCs varied depending on how the transactions were structured, it was not uncommon for investors to be paying prices between 95 cents and $1.10 or more for each $1
of HRTCs. For the purposes of this study, it was estimated that the average price the investor paid was $1.05 per $1 of HRTCs.
The graph below compares the total QREs and HRTCs claimed on Part 3 (final) approvals and the amount of QREs and HRTCs claimed by the respondents during the past 10 years. During those 10 years, $28 billion of QREs have been claimed on Part 3 (final) approvals and of that amount, respondents claimed nearly $14.3 billion of the available QREs. Of the approximate $5.68 billion in HRTCs claimed on Part 3 (final) approvals, survey respondents claimed nearly $2.9 billion of the available HRTCs.
100
0
20
40
60
80
Year 1 Year 2 Year 3 Year 4 Year 5
Rec
aptu
re P
erce
ntag
e
HRTC Recapture Percentage HRTC Recapture rATE AS ApERCENTAGE oF aLL cREDITS cLAIMED
HRTC Recapture rATE AS ApERCENTAGE oF ALL
RESPONDENT TRANSACTIONS
$0
$5,000
$10,000
$15,000
$20,000
$25,000
$30,000
QREs HRTCs
Mill
ions
QRES and HRTCSOver the Past 10 Years
Total in the Past 10 Years
Claimed by Respondents
$0
$500
$1,000
$1,500
$2,000
$2,500
$3,000
$3,500
Total HRTCs Claimed byRespondents
HRTCs Recaptured
Am
ount
of H
RTC
s C
laim
ed(in
mill
ions
)
Total HRTCs Claimed byRespondents
HRTCs Recaptured
0
100
200
300
400
500
600
700
Total Transactions Recaptured Transactions
Num
ber
of T
rans
actio
ns R
ecap
ture
d
Total Transactions
Recaptured Transactions
0
LIHTC NMTC Renewable Energy
Perc
enta
ge o
f Res
pon
den
ts
0
50
100
150
200
250
300
Investor A Investor B Investor C Investor D Investor E Investor F
Axi
s Ti
tle
Number of Transactions
0
1
2
3
4
Year 1 Year 2 Year 3 Year 4 Year 5
Num
ber
of T
rans
actio
ns
yEAR OF cOMPLIANCE pERIODIN WHICH rECAPTURE oCCURRED
nUMBER OF YEARS THE oRGANIZATIONhAS bEEN iNVESTING IN hrtc
pERCENTAGE OF rESPONDENTSpARTICIPATING IN oTHERtAX cREDIT pROGRAMS
0
40
20
60
80
100
0-10 10-20 20-30
Perc
enta
ge o
f Res
pond
ents
Number of Years the Organization has been Investing in HRTC
Projects Types of Total CertifiedProjects in the Past 10 Years
nUMBER OF tRANSACTION eXPERIENCING rECAPTURE
BY rESPONDENTS
0
1
2
3
4
5
$1 Million or Less More than $6 Million$1 - $6 Million
Num
ber
of T
rans
actio
ns
Amount of Recapture
$1 Million or Less
$1 - $6 Million
More than $6 Million
40
20
60
80
100
hrtc rECAPTURErATE FOR THEPAST 10 YEARS
IS 1.07%
hrtc rECAPTURErATE FOR THEPAST 10 YEARSIS 0.73% on a
dollar volumebasis.
51%
17%15%
8%
6%3%
Housing
Mixed use
Retail
Office
Other
Hotel
* The total of QREs above was derived using data from NPS’ Statistical Reports and Analysis for Fiscal Year 2010.19
** The total of available credits above was derived using data for the amount of QREs reported on the Part 3 approvals
from NPS’ Statistical Reports and Analysis for Fiscal Year 201020 multiplied by the 20 percent credit.
19 National Park Service, Federal Tax Incentives for Rehabilitation Historic Buildings – Statistical Report and Analysis for Fiscal Year 2010, Page 10, Table 8.20 Ibid.
17
Historic Rehabilitation Tax Credit Recapture Survey
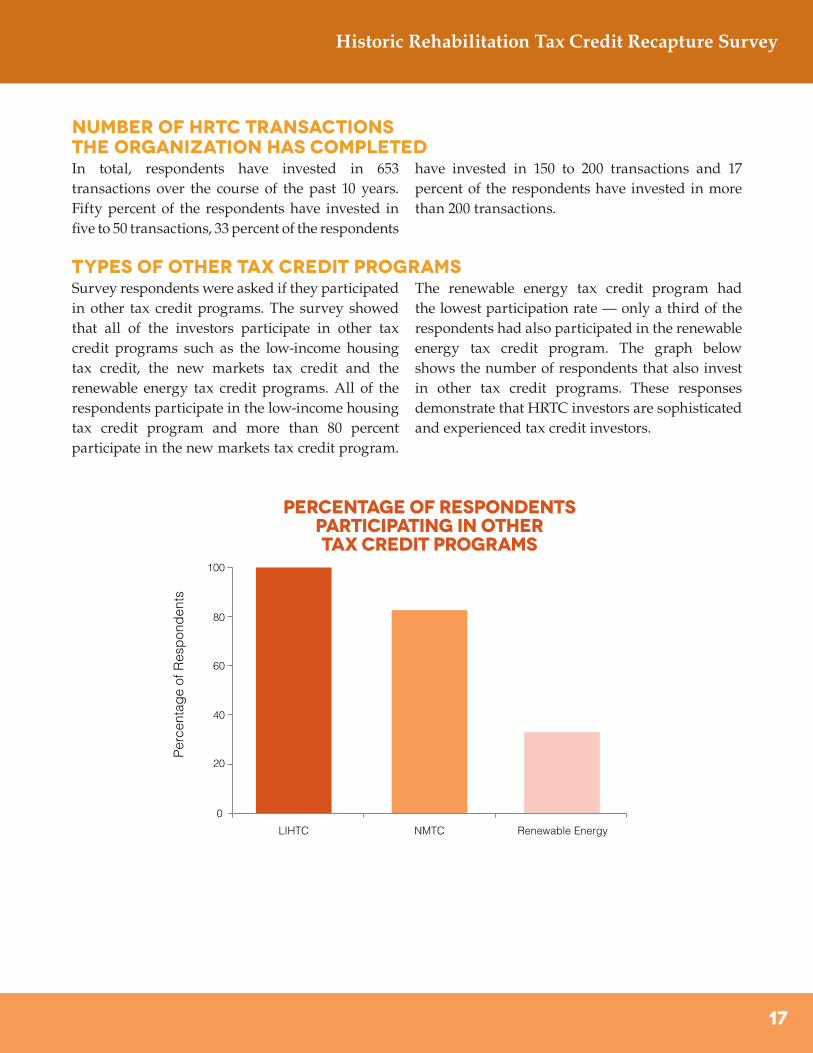
Number of HRTC Transactionsthe Organization Has CompletedIn total, respondents have invested in 653 transactions over the course of the past 10 years. Fifty percent of the respondents have invested in five to 50 transactions, 33 percent of the respondents
have invested in 150 to 200 transactions and 17 percent of the respondents have invested in more than 200 transactions.
Types of Other Tax Credit Programs Survey respondents were asked if they participated in other tax credit programs. The survey showed that all of the investors participate in other tax credit programs such as the low-income housing tax credit, the new markets tax credit and the renewable energy tax credit programs. All of the respondents participate in the low-income housing tax credit program and more than 80 percent participate in the new markets tax credit program.
The renewable energy tax credit program had the lowest participation rate — only a third of the respondents had also participated in the renewable energy tax credit program. The graph below shows the number of respondents that also invest in other tax credit programs. These responses demonstrate that HRTC investors are sophisticated and experienced tax credit investors.
100
0
20
40
60
80
Year 1 Year 2 Year 3 Year 4 Year 5
Rec
aptu
re P
erce
ntag
e
HRTC Recapture Percentage HRTC Recapture rATE AS ApERCENTAGE oF aLL cREDITS cLAIMED
HRTC Recapture rATE AS ApERCENTAGE oF ALL
RESPONDENT TRANSACTIONS
$0
$5,000
$10,000
$15,000
$20,000
$25,000
$30,000
QREs HRTCs
Mill
ions
QRES and HRTCSOver the Past 10 Years
Total in the Past 10 Years
Claimed by Respondents
$0
$500
$1,000
$1,500
$2,000
$2,500
$3,000
$3,500
Total HRTCs Claimed byRespondents
HRTCs Recaptured
Am
ount
of H
RTC
s C
laim
ed(in
mill
ions
)
Total HRTCs Claimed byRespondents
HRTCs Recaptured
0
100
200
300
400
500
600
700
Total Transactions Recaptured Transactions
Num
ber
of T
rans
actio
ns R
ecap
ture
d
Total Transactions
Recaptured Transactions
0
LIHTC NMTC Renewable Energy
Perc
enta
ge o
f Res
pon
den
ts
0
50
100
150
200
250
300
Investor A Investor B Investor C Investor D Investor E Investor F
Axi
s Ti
tle
Number of Transactions
0
1
2
3
4
Year 1 Year 2 Year 3 Year 4 Year 5
Num
ber
of T
rans
actio
ns
yEAR OF cOMPLIANCE pERIODIN WHICH rECAPTURE oCCURRED
nUMBER OF YEARS THE oRGANIZATIONhAS bEEN iNVESTING IN hrtc
pERCENTAGE OF rESPONDENTSpARTICIPATING IN oTHERtAX cREDIT pROGRAMS
0
40
20
60
80
100
0-10 10-20 20-30
Perc
enta
ge o
f Res
pond
ents
Number of Years the Organization has been Investing in HRTC
Projects Types of Total CertifiedProjects in the Past 10 Years
nUMBER OF tRANSACTION eXPERIENCING rECAPTURE
BY rESPONDENTS
0
1
2
3
4
5
$1 Million or Less More than $6 Million$1 - $6 Million
Num
ber
of T
rans
actio
ns
Amount of Recapture
$1 Million or Less
$1 - $6 Million
More than $6 Million
40
20
60
80
100
hrtc rECAPTURErATE FOR THEPAST 10 YEARS
IS 1.07%
hrtc rECAPTURErATE FOR THEPAST 10 YEARSIS 0.73% on a
dollar volumebasis.
51%
17%15%
8%
6%3%
Housing
Mixed use
Retail
Office
Other
Hotel
18
Historic Rehabilitation Tax Credit Recapture Survey
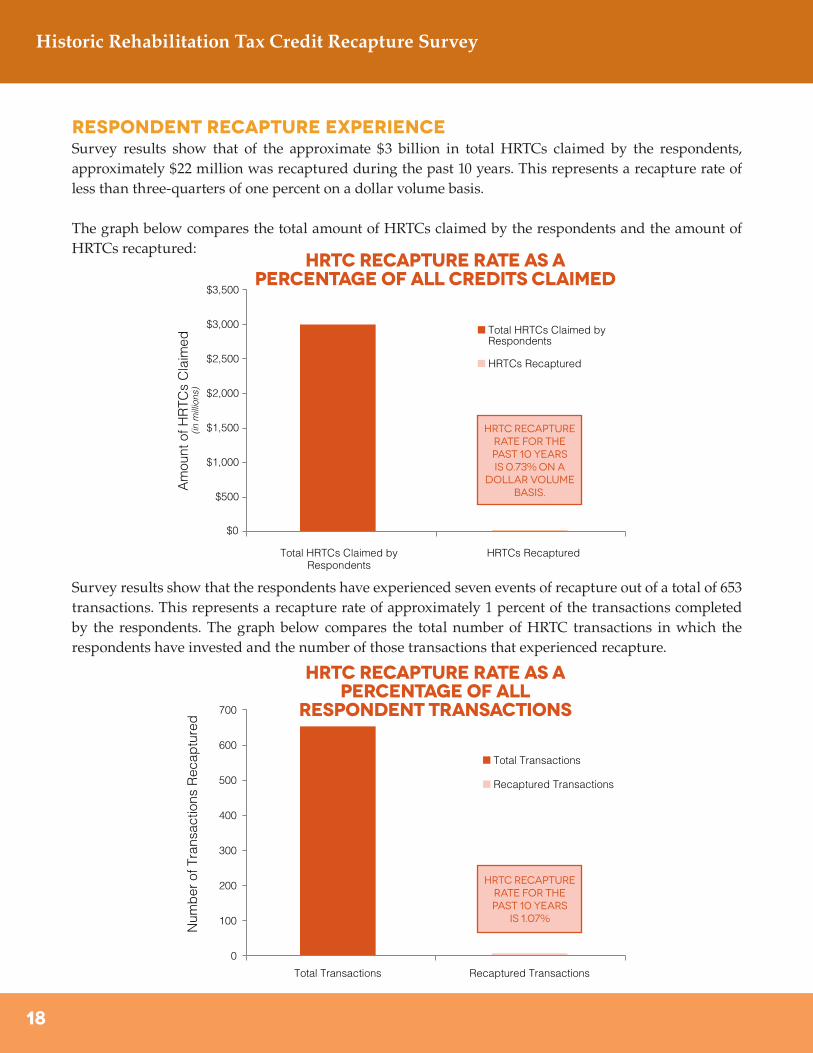
Respondent Recapture ExperienceSurvey results show that of the approximate $3 billion in total HRTCs claimed by the respondents, approximately $22 million was recaptured during the past 10 years. This represents a recapture rate of less than three-quarters of one percent on a dollar volume basis.
The graph below compares the total amount of HRTCs claimed by the respondents and the amount of HRTCs recaptured:
100
0
20
40
60
80
Year 1 Year 2 Year 3 Year 4 Year 5
Rec
aptu
re P
erce
ntag
e
HRTC Recapture Percentage HRTC Recapture rATE AS ApERCENTAGE oF aLL cREDITS cLAIMED
HRTC Recapture rATE AS ApERCENTAGE oF ALL
RESPONDENT TRANSACTIONS
$0
$5,000
$10,000
$15,000
$20,000
$25,000
$30,000
QREs HRTCs
Mill
ions
QRES and HRTCSOver the Past 10 Years
Total in the Past 10 Years
Claimed by Respondents
$0
$500
$1,000
$1,500
$2,000
$2,500
$3,000
$3,500
Total HRTCs Claimed byRespondents
HRTCs Recaptured
Am
ount
of H
RTC
s C
laim
ed(in
mill
ions
)
Total HRTCs Claimed byRespondents
HRTCs Recaptured
0
100
200
300
400
500
600
700
Total Transactions Recaptured Transactions
Num
ber
of T
rans
actio
ns R
ecap
ture
d
Total Transactions
Recaptured Transactions
0
LIHTC NMTC Renewable Energy
Perc
enta
ge o
f Res
pon
den
ts
0
50
100
150
200
250
300
Investor A Investor B Investor C Investor D Investor E Investor F
Axi
s Ti
tle
Number of Transactions
0
1
2
3
4
Year 1 Year 2 Year 3 Year 4 Year 5
Num
ber
of T
rans
actio
ns
yEAR OF cOMPLIANCE pERIODIN WHICH rECAPTURE oCCURRED
nUMBER OF YEARS THE oRGANIZATIONhAS bEEN iNVESTING IN hrtc
pERCENTAGE OF rESPONDENTSpARTICIPATING IN oTHERtAX cREDIT pROGRAMS
0
40
20
60
80
100
0-10 10-20 20-30
Perc
enta
ge o
f Res
pond
ents
Number of Years the Organization has been Investing in HRTC
Projects Types of Total CertifiedProjects in the Past 10 Years
nUMBER OF tRANSACTION eXPERIENCING rECAPTURE
BY rESPONDENTS
0
1
2
3
4
5
$1 Million or Less More than $6 Million$1 - $6 Million
Num
ber
of T
rans
actio
ns
Amount of Recapture
$1 Million or Less
$1 - $6 Million
More than $6 Million
40
20
60
80
100
hrtc rECAPTURErATE FOR THEPAST 10 YEARS
IS 1.07%
hrtc rECAPTURErATE FOR THEPAST 10 YEARSIS 0.73% on a
dollar volumebasis.
51%
17%15%
8%
6%3%
Housing
Mixed use
Retail
Office
Other
Hotel
100
0
20
40
60
80
Year 1 Year 2 Year 3 Year 4 Year 5
Rec
aptu
re P
erce
ntag
e
HRTC Recapture Percentage HRTC Recapture rATE AS ApERCENTAGE oF aLL cREDITS cLAIMED
HRTC Recapture rATE AS ApERCENTAGE oF ALL
RESPONDENT TRANSACTIONS
$0
$5,000
$10,000
$15,000
$20,000
$25,000
$30,000
QREs HRTCs
Mill
ions
QRES and HRTCSOver the Past 10 Years
Total in the Past 10 Years
Claimed by Respondents
$0
$500
$1,000
$1,500
$2,000
$2,500
$3,000
$3,500
Total HRTCs Claimed byRespondents
HRTCs Recaptured
Am
ount
of H
RTC
s C
laim
ed(in
mill
ions
)
Total HRTCs Claimed byRespondents
HRTCs Recaptured
0
100
200
300
400
500
600
700
Total Transactions Recaptured Transactions
Num
ber
of T
rans
actio
ns R
ecap
ture
d
Total Transactions
Recaptured Transactions
0
LIHTC NMTC Renewable Energy
Perc
enta
ge o
f Res
pon
den
ts
0
50
100
150
200
250
300
Investor A Investor B Investor C Investor D Investor E Investor F
Axi
s Ti
tle
Number of Transactions
0
1
2
3
4
Year 1 Year 2 Year 3 Year 4 Year 5
Num
ber
of T
rans
actio
ns
yEAR OF cOMPLIANCE pERIODIN WHICH rECAPTURE oCCURRED
nUMBER OF YEARS THE oRGANIZATIONhAS bEEN iNVESTING IN hrtc
pERCENTAGE OF rESPONDENTSpARTICIPATING IN oTHERtAX cREDIT pROGRAMS
0
40
20
60
80
100
0-10 10-20 20-30
Perc
enta
ge o
f Res
pond
ents
Number of Years the Organization has been Investing in HRTC
Projects Types of Total CertifiedProjects in the Past 10 Years
nUMBER OF tRANSACTION eXPERIENCING rECAPTURE
BY rESPONDENTS
0
1
2
3
4
5
$1 Million or Less More than $6 Million$1 - $6 Million
Num
ber
of T
rans
actio
ns
Amount of Recapture
$1 Million or Less
$1 - $6 Million
More than $6 Million
40
20
60
80
100
hrtc rECAPTURErATE FOR THEPAST 10 YEARS
IS 1.07%
hrtc rECAPTURErATE FOR THEPAST 10 YEARSIS 0.73% on a
dollar volumebasis.
51%
17%15%
8%
6%3%
Housing
Mixed use
Retail
Office
Other
Hotel
Survey results show that the respondents have experienced seven events of recapture out of a total of 653 transactions. This represents a recapture rate of approximately 1 percent of the transactions completed by the respondents. The graph below compares the total number of HRTC transactions in which the respondents have invested and the number of those transactions that experienced recapture.
19
Historic Rehabilitation Tax Credit Recapture Survey
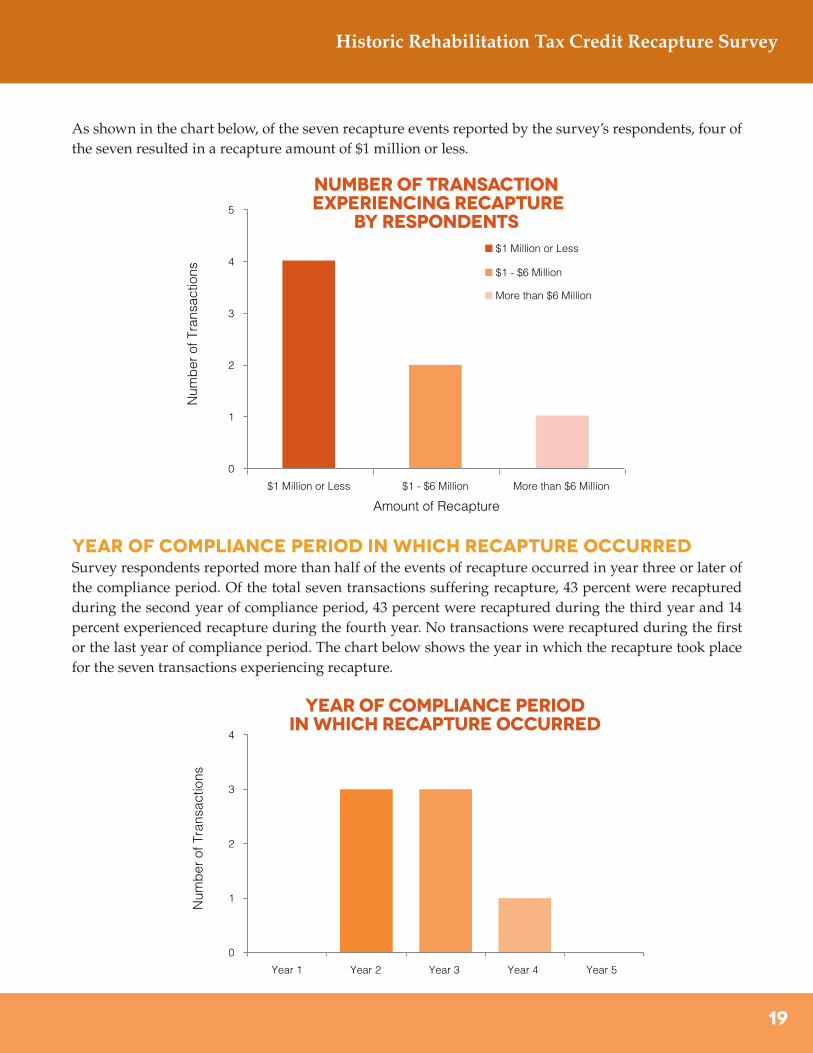
As shown in the chart below, of the seven recapture events reported by the survey’s respondents, four of the seven resulted in a recapture amount of $1 million or less.
Year of Compliance Period in Which Recapture OccurredSurvey respondents reported more than half of the events of recapture occurred in year three or later of the compliance period. Of the total seven transactions suffering recapture, 43 percent were recaptured during the second year of compliance period, 43 percent were recaptured during the third year and 14 percent experienced recapture during the fourth year. No transactions were recaptured during the first or the last year of compliance period. The chart below shows the year in which the recapture took place for the seven transactions experiencing recapture.
100
0
20
40
60
80
Year 1 Year 2 Year 3 Year 4 Year 5
Rec
aptu
re P
erce
ntag
e
HRTC Recapture Percentage HRTC Recapture rATE AS ApERCENTAGE oF aLL cREDITS cLAIMED
HRTC Recapture rATE AS ApERCENTAGE oF ALL
RESPONDENT TRANSACTIONS
$0
$5,000
$10,000
$15,000
$20,000
$25,000
$30,000
QREs HRTCs
Mill
ions
QRES and HRTCSOver the Past 10 Years
Total in the Past 10 Years
Claimed by Respondents
$0
$500
$1,000
$1,500
$2,000
$2,500
$3,000
$3,500
Total HRTCs Claimed byRespondents
HRTCs Recaptured
Am
ount
of H
RTC
s C
laim
ed(in
mill
ions
)
Total HRTCs Claimed byRespondents
HRTCs Recaptured
0
100
200
300
400
500
600
700
Total Transactions Recaptured Transactions
Num
ber
of T
rans
actio
ns R
ecap
ture
d
Total Transactions
Recaptured Transactions
0
LIHTC NMTC Renewable Energy
Perc
enta
ge o
f Res
pon
den
ts
0
50
100
150
200
250
300
Investor A Investor B Investor C Investor D Investor E Investor F
Axi
s Ti
tle
Number of Transactions
0
1
2
3
4
Year 1 Year 2 Year 3 Year 4 Year 5
Num
ber
of T
rans
actio
ns
yEAR OF cOMPLIANCE pERIODIN WHICH rECAPTURE oCCURRED
nUMBER OF YEARS THE oRGANIZATIONhAS bEEN iNVESTING IN hrtc
pERCENTAGE OF rESPONDENTSpARTICIPATING IN oTHERtAX cREDIT pROGRAMS
0
40
20
60
80
100
0-10 10-20 20-30
Perc
enta
ge o
f Res
pond
ents
Number of Years the Organization has been Investing in HRTC
Projects Types of Total CertifiedProjects in the Past 10 Years
nUMBER OF tRANSACTION eXPERIENCING rECAPTURE
BY rESPONDENTS
0
1
2
3
4
5
$1 Million or Less More than $6 Million$1 - $6 Million
Num
ber
of T
rans
actio
ns
Amount of Recapture
$1 Million or Less
$1 - $6 Million
More than $6 Million
40
20
60
80
100
hrtc rECAPTURErATE FOR THEPAST 10 YEARS
IS 1.07%
hrtc rECAPTURErATE FOR THEPAST 10 YEARSIS 0.73% on a
dollar volumebasis.
51%
17%15%
8%
6%3%
Housing
Mixed use
Retail
Office
Other
Hotel
100
0
20
40
60
80
Year 1 Year 2 Year 3 Year 4 Year 5
Rec
aptu
re P
erce
ntag
e
HRTC Recapture Percentage HRTC Recapture rATE AS ApERCENTAGE oF aLL cREDITS cLAIMED
HRTC Recapture rATE AS ApERCENTAGE oF ALL
RESPONDENT TRANSACTIONS
$0
$5,000
$10,000
$15,000
$20,000
$25,000
$30,000
QREs HRTCs
Mill
ions
QRES and HRTCSOver the Past 10 Years
Total in the Past 10 Years
Claimed by Respondents
$0
$500
$1,000
$1,500
$2,000
$2,500
$3,000
$3,500
Total HRTCs Claimed byRespondents
HRTCs Recaptured
Am
ount
of H
RTC
s C
laim
ed(in
mill
ions
)
Total HRTCs Claimed byRespondents
HRTCs Recaptured
0
100
200
300
400
500
600
700
Total Transactions Recaptured Transactions
Num
ber
of T
rans
actio
ns R
ecap
ture
d
Total Transactions
Recaptured Transactions
0
LIHTC NMTC Renewable Energy
Perc
enta
ge o
f Res
pon
den
ts
0
50
100
150
200
250
300
Investor A Investor B Investor C Investor D Investor E Investor F
Axi
s Ti
tle
Number of Transactions
0
1
2
3
4
Year 1 Year 2 Year 3 Year 4 Year 5
Num
ber
of T
rans
actio
ns
yEAR OF cOMPLIANCE pERIODIN WHICH rECAPTURE oCCURRED
nUMBER OF YEARS THE oRGANIZATIONhAS bEEN iNVESTING IN hrtc
pERCENTAGE OF rESPONDENTSpARTICIPATING IN oTHERtAX cREDIT pROGRAMS
0
40
20
60
80
100
0-10 10-20 20-30
Perc
enta
ge o
f Res
pond
ents
Number of Years the Organization has been Investing in HRTC
Projects Types of Total CertifiedProjects in the Past 10 Years
nUMBER OF tRANSACTION eXPERIENCING rECAPTURE
BY rESPONDENTS
0
1
2
3
4
5
$1 Million or Less More than $6 Million$1 - $6 Million
Num
ber
of T
rans
actio
ns
Amount of Recapture
$1 Million or Less
$1 - $6 Million
More than $6 Million
40
20
60
80
100
hrtc rECAPTURErATE FOR THEPAST 10 YEARS
IS 1.07%
hrtc rECAPTURErATE FOR THEPAST 10 YEARSIS 0.73% on a
dollar volumebasis.
51%
17%15%
8%
6%3%
Housing
Mixed use
Retail
Office
Other
Hotel
20
Historic Rehabilitation Tax Credit Recapture Survey
Comparison of Survey ResultsThe survey results are in line with data obtained from the IRS for this report from 2008 Form 1120s.21 An analysis of data from the 2008 Form 3468 – Investment Credit shows that of the total $1,485,957,000 investment credits claimed by all filers of Form 1120, $679,681,000 of this amount was for the HRTC. The HRTCs therefore represent more than 45.74 percent of the total investment credits claimed that year. Additionally, of the corporations that filed a Form 1120 in 2008, there were five incidents of recapture reported on Form 4255, Recapture of Investment Credit, and the total recapture amount for all investment tax credits was $773,000. If it is assumed that tax credit recapture occurs proportionally among all of the investment tax credits, it can be presumed that $353,57022 in HRTCs were recaptured.
Using the survey results, and assuming a conservative position that the average HRTC
recapture occurs in year three of the compliance period, we can look to the amount of tax credits claimed three years prior to the recapture event. Thus, the amount of tax credits recaptured when compared to the $498,200,00023 of tax credits claimed in 2005 results in an annual recapture rate of 0.07 percent. This analysis supports the report’s survey results that HRTCs are financially sound and safe investments.
The survey results are also favorable when compared to loan loss rates on commercial real estate loans. The average annual loan loss rate that commercial banks have experienced on their commercial real estate loans during the past 10 years has been 0.66 percent net of recoveries.24 When adjusted to eliminate recoveries,25 the annual loss rate is 1.02 percent as compared to the more favorable annual HRTC recapture rate of 0.07 percent as derived from the 2008 corporate data set.
21 Department of Treasury, Internal Revenue Service: 2008 Estimated Data Line Counts Corporation Tax Returns. The IRS has only made available the 2008 estimated corporate data.
22 45.74 percent ratio of HRTC as compared to total investment tax credits claimed. 23 National Park Service, Federal Tax Incentives for Rehabilitation Historic Buildings – Statistical Report and Analysis for Fiscal Year 2010, Page 10, Table 8.24 Federal Financial Institutions Examinations Council (FFIEC) Consolidated Report of Condition and Income (1985-2000: FFIEC 031-034; 2001-: FFIEC 031 &
041)25 Mean recovery rates on defaulted commercial real estate loans estimated based on data from US Capital Trends: Special Report. Recovery Rates, pub-
lished by Real Capital Analytics Inc. January 2012.
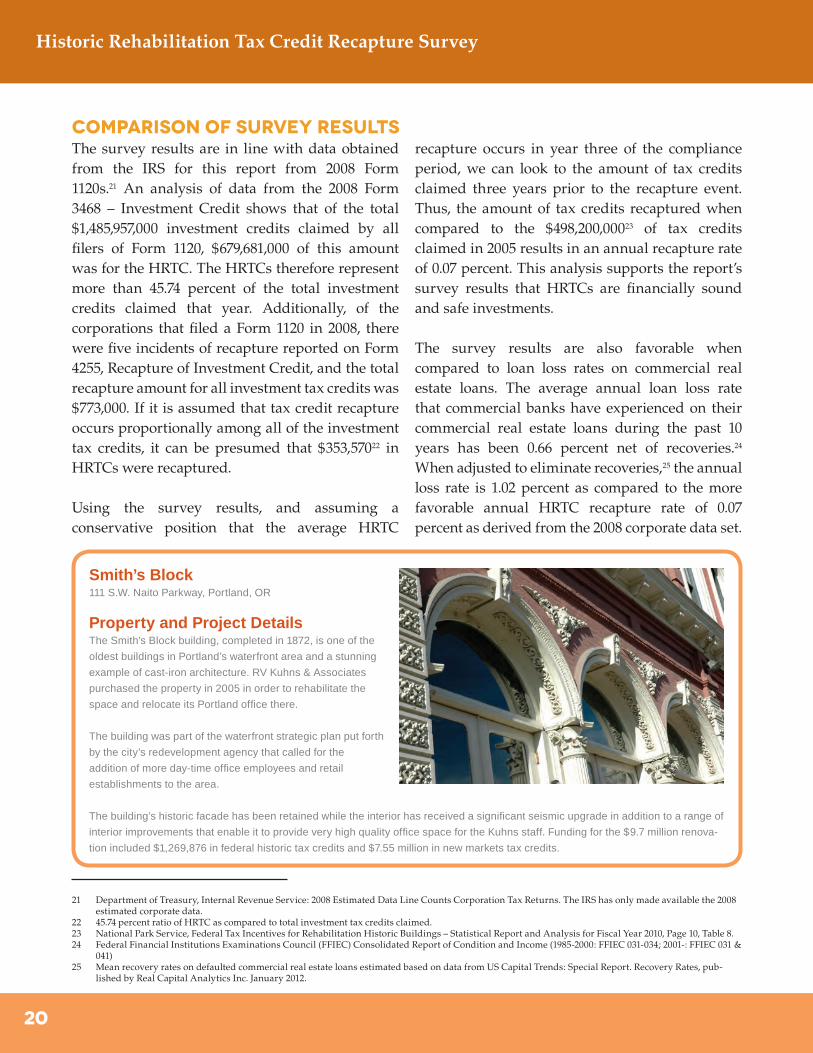
Smith’s Block111 S.W. Naito Parkway, Portland, OR
Property and Project DetailsThe Smith’s Block building, completed in 1872, is one of the
oldest buildings in Portland’s waterfront area and a stunning
example of cast-iron architecture. RV Kuhns & Associates
purchased the property in 2005 in order to rehabilitate the
space and relocate its Portland office there.
The building was part of the waterfront strategic plan put forth
by the city’s redevelopment agency that called for the
addition of more day-time office employees and retail
establishments to the area.
The building’s historic facade has been retained while the interior has received a significant seismic upgrade in addition to a range of
interior improvements that enable it to provide very high quality office space for the Kuhns staff. Funding for the $9.7 million renova-
tion included $1,269,876 in federal historic tax credits and $7.55 million in new markets tax credits.
21
Historic Rehabilitation Tax Credit Recapture Survey
There are several factors that contribute to the successful track record of the HRTC program:
•Large dollar investments from third-party investors (non-federal sources)
•Thorough underwriting and asset management
of properties by syndicators and investors •Economies of scale and uniform practices •Construction and lease-up risk borne by
investors and developers•Regulatory guidance and enforcement by the IRS
Large-Dollar Investments from Third-Party Investors (Non-Federal Sources)More than $28 billion in QREs was claimed for Part 3 approvals between 2001 and 2010. Investors often invest a significant amount of capital per HRTC property, frequently more than $1 million per investment. Because of the complexity and expense of HRTC transactions, investors are generally sophisticated institutional investors. In addition, investors often receive not only HRTCs but a share of the project’s annual cash flow and a
payment when they exit the transaction. As a result they monitor their HRTC investments constantly. Moreover, many HRTC investors require additional testing and auditing beyond what is required by the HRTC statue and regulations. Adding a third party to the transaction helps add experience, different perspectives and different motives to help assure an HRTC property’s success.
Screening of Properties before Development by Third-Party InvestorsThe financial health of an HRTC property is very important to the investor. If an HRTC property is lost to foreclosure, the investor could face the recapture of its HRTCs and the loss of other benefits. Thus, investors will generally step in to save a troubled property before it is lost to foreclosure. This also causes investors to spend significant time underwriting and screening properties for quality and sustainability before investing in an HRTC transaction.
HRTC investors spend considerable time reviewing and assessing the financing, market forecasts and forecasted operating cash flows of the properties in which they are investing. This investor review often results in a more durable financial structure, such as funding of additional cash reserves. Bringing in an experienced investor for added screening not only strengthens the HRTC transaction, the additional screening is important in maintaining a low recapture rate for the HRTC program.
Reasons for Successful Track Record of The HRTC
22
Historic Rehabilitation Tax Credit Recapture Survey
Economies of Scale and Uniform PracticesThere are countless third-party investors that have invested in HRTC properties since the inception of the HRTC program. Some of these investors make direct investments in HRTC properties while others rely on third-party syndicators to pool properties into investment funds. These third-party syndicators market HRTC properties to tax credit investors and ultimately place them in investment funds. The number of HRTC properties in an investment fund can range from as few as one to as many as several hundred properties, thus accommodating varying investment appetites of tax credit investors. By investing in HRTCs via an investment fund, a tax credit investor has the flexibility to diversify or concentrate the investment in varying property types.
The use of investment funds as ownership vehicles has allowed investors with dedicated HRTC
investment and compliance departments, as well as those that simply invest alongside other more knowledgeable investors through syndicators, to generate economies of scale and investment diversification. Because of the sizable capital invested by tax credit investors in HRTC funds, many uniform practices have developed regarding how to underwrite HRTC investments, value the associated financial benefits, and manage the ongoing compliance.
Through the proliferation of common underwriting and reporting guidelines, HRTC properties are held to much more consistent standards after rehabilitation than they might be otherwise. For those properties that are funded, this results in a higher long-term success rate and more predictable investment yields for HRTC investors.
Construction Risk Borne by Investors and DevelopersDuring the life of a property, the riskiest period from a financial standpoint is the construction or rehabilitation phase. One important dynamic of the HRTC program is that the federal government is not subject to construction risk because HRTCs are not earned until the rehabilitation is completed and the building is placed in service. Major construction/rehabilitation risk is borne by the developer, and to a somewhat lesser extent, the HRTC investor, the lender and/or the bridge loan provider when applicable. On a typical HRTC property, a developer is generally required by its tax credit equity investor to guarantee completion of rehabilitation of the property. The developer
generally is liable for completion of the property and any associated cost overruns. This typically heightens the developer’s motivation to oversee the contractor during the construction process. With some exceptions, an HRTC property’s funding sources are usually fixed. A permanent lender will only lend up to an appropriate amount of debt that is supported by the property’s forecasted net operating income based on a requisite debt service coverage ratio. Tax credit equity investors stage their capital contributions based on various benchmarks and are protected from having to increase their total capital contributions by HRTC adjuster provisions in the partnership agreement.
23
Historic Rehabilitation Tax Credit Recapture Survey
Regulatory Guidance and Enforcement by Various Governmental AgenciesTo be able to claim the HRTCs, property owners must perform the rehabilitation in accordance with the Secretary of the Department of Interior’s Standards. After the rehabilitation is completed, it is certified by the SHPO and NPS. On approval/certification, the property owners are eligible to claim a tax credit. These filing requirements with
various governmental agencies, along with other filings that are required by the IRS, keep them well informed of problems with specific properties. This oversight is valuable in keeping property owners compliant with the rules and assists in reducing the recapture risk for the investors.
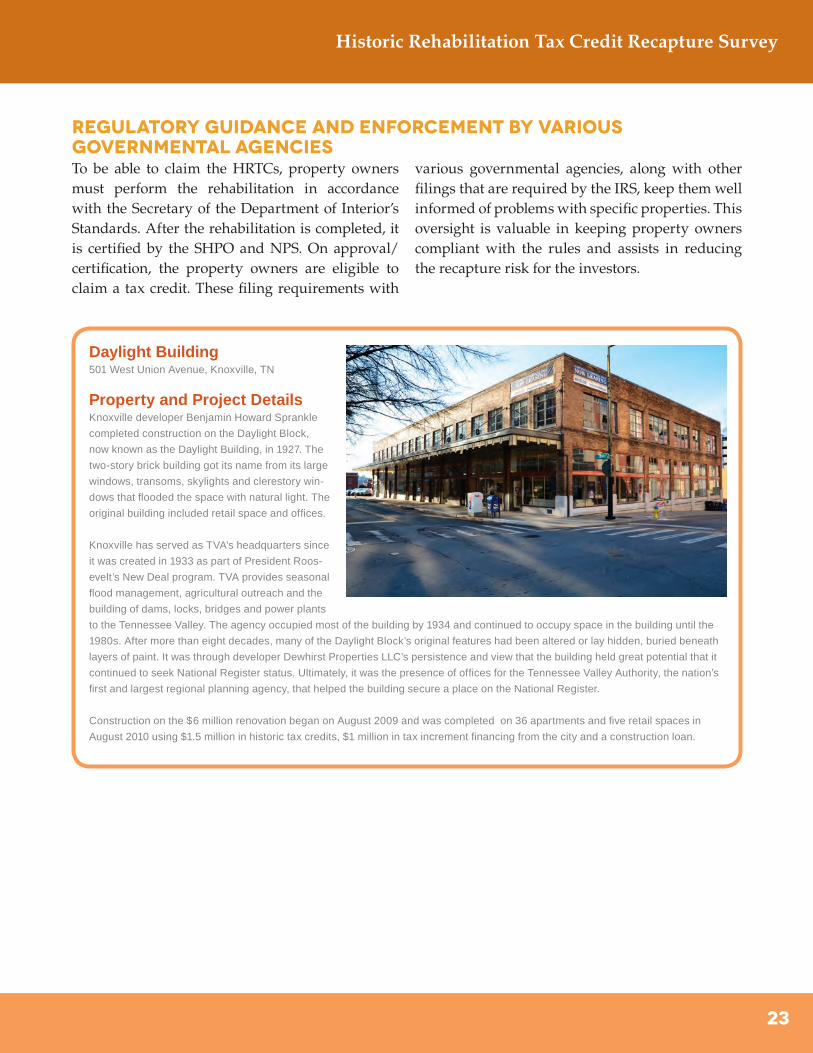
Daylight Building501 West Union Avenue, Knoxville, TN
Property and Project DetailsKnoxville developer Benjamin Howard Sprankle
completed construction on the Daylight Block,
now known as the Daylight Building, in 1927. The
two-story brick building got its name from its large
windows, transoms, skylights and clerestory win-
dows that flooded the space with natural light. The
original building included retail space and offices.
Knoxville has served as TVA’s headquarters since
it was created in 1933 as part of President Roos-
evelt’s New Deal program. TVA provides seasonal
flood management, agricultural outreach and the
building of dams, locks, bridges and power plants
to the Tennessee Valley. The agency occupied most of the building by 1934 and continued to occupy space in the building until the
1980s. After more than eight decades, many of the Daylight Block’s original features had been altered or lay hidden, buried beneath
layers of paint. It was through developer Dewhirst Properties LLC’s persistence and view that the building held great potential that it
continued to seek National Register status. Ultimately, it was the presence of offices for the Tennessee Valley Authority, the nation’s
first and largest regional planning agency, that helped the building secure a place on the National Register.
Construction on the $6 million renovation began on August 2009 and was completed on 36 apartments and five retail spaces in
August 2010 using $1.5 million in historic tax credits, $1 million in tax increment financing from the city and a construction loan.
24
Historic Rehabilitation Tax Credit Recapture Survey
Survey respondents have collectively claimed more than 50 percent of all the HRTCs claimed during the past 10 years. The survey responses demonstrate that HRTC transactions have experienced very low rates of recapture. The responses show that respondents have experienced a recapture rate of less than three-quarters of one percent over the past 10 years. Additionally, the survey results are further supported by an analysis of the information obtained from the IRS, which reflects an annual HRTC recapture rate of 0.07 percent for 2008. As discussed, this successful track record can be attributed to several factors: large dollar investments from third parties; screening of properties before development by third-party investors; economies of scale and uniform practices; construction risk and lease-up risk borne by investors and developers; and regulatory guidance and enforcement by the IRS. The results of this survey demonstrate that HRTCs are a safe and sound investment for banks and corporations in general - an investment with low risk of tax credit recapture.
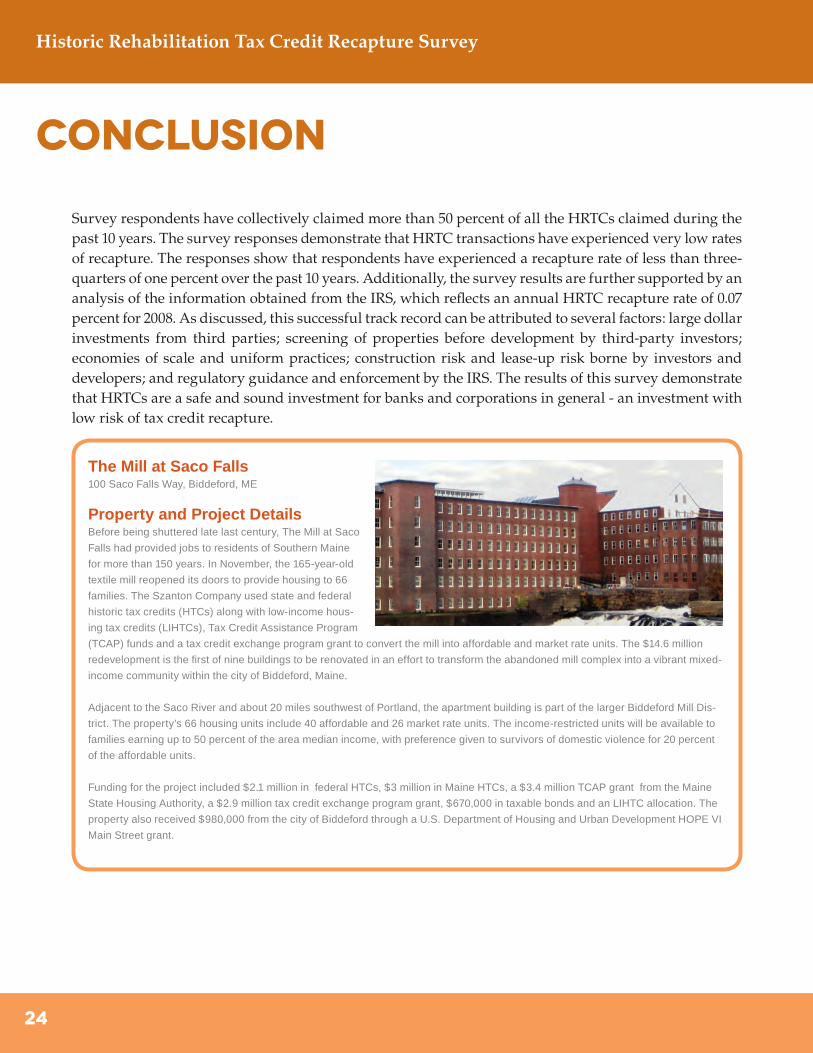
The Mill at Saco Falls100 Saco Falls Way, Biddeford, ME
Property and Project DetailsBefore being shuttered late last century, The Mill at Saco
Falls had provided jobs to residents of Southern Maine
for more than 150 years. In November, the 165-year-old
textile mill reopened its doors to provide housing to 66
families. The Szanton Company used state and federal
historic tax credits (HTCs) along with low-income hous-
ing tax credits (LIHTCs), Tax Credit Assistance Program
(TCAP) funds and a tax credit exchange program grant to convert the mill into affordable and market rate units. The $14.6 million
redevelopment is the first of nine buildings to be renovated in an effort to transform the abandoned mill complex into a vibrant mixed-
income community within the city of Biddeford, Maine.
Adjacent to the Saco River and about 20 miles southwest of Portland, the apartment building is part of the larger Biddeford Mill Dis-
trict. The property’s 66 housing units include 40 affordable and 26 market rate units. The income-restricted units will be available to
families earning up to 50 percent of the area median income, with preference given to survivors of domestic violence for 20 percent
of the affordable units.
Funding for the project included $2.1 million in federal HTCs, $3 million in Maine HTCs, a $3.4 million TCAP grant from the Maine
State Housing Authority, a $2.9 million tax credit exchange program grant, $670,000 in taxable bonds and an LIHTC allocation. The
property also received $980,000 from the city of Biddeford through a U.S. Department of Housing and Urban Development HOPE VI
Main Street grant.
Conclusion
25
Historic Rehabilitation Tax Credit Recapture Survey
26
Historic Rehabilitation Tax Credit Recapture Survey
Novogradac & Company LLP is a national certified public accounting and consulting firm with 13 offices nationwide. Our clients represent a broad range of industries, with a major emphasis in the real estate sector. We provide publicly and privately held national enterprises, including not-for-profits, government agencies, development and construction companies, real estate investment companies and securities firms with a full spectrum of audit, tax, valuation, expert witness and litigation support, property compliance and general consulting services. We work extensively in the historic preservation, affordable housing, community development and renewable energy fields. The firm has consulted for 23 years on thousands of real estate projects and maintains client relationships with the leading sponsors in the industry.
The partners of Novogradac & Company LLP have published numerous articles on a wide variety of business subjects. They also are the authors of the Historic Rehabilitation Handbook, the Low-Income Housing Tax Credit Handbook, the New Markets Tax Credit Handbook and the Renewable Energy Handbook. Additionally, the firm publishes the monthly Novogradac Journal of Tax Credits.
The firm sponsors numerous conferences aimed at the most prominent players in the community development and affordable housing industries to conduct training workshops, deliver educational sessions and forecast legislative and industry change. Novogradac & Company LLP is ranked by Accounting Today and Inside Public Accounting as one of the top 50 accounting firms in the nation.
The National Trust for Historic Preservation provides leadership, education, advocacy, and resources to save America’s diverse historic places and revitalize our communities.
The National Trust for Historic Preservation is a private, nonprofit membership organization dedicated to saving historic places and revitalizing America’s communities. Recipient of the National Humanities Medal, the Trust was founded in 1949 and provides leadership, education, advocacy and resources to protect the irreplaceable places that tell America’s story. Staff at the Washington, DC, headquarters, six regional offices and 29 historic sites work with the Trust’s 200,000 members and thousands of preservation groups in all 50 states.
27
Historic Rehabilitation Tax Credit Recapture Survey
This analysis surveyed a sample of market participants to determine their experiences with historic rehabilitation tax credit recapture. Novogradac & Company LLP makes no representation regarding the sufficiency of the procedures, either for the purpose of its analysis or for any other purpose. The survey included a sample of market participants and was by no means exhaustive. As a result, other market participants involved in similar transactions may use other methodologies and involve other considerations that may also produce meaningful results. The information received from the market participants has not been tested or verified. Therefore, Novogradac & Company LLP does not warrant the accuracy of the data received from the market participants.
The publication of this report does not constitute a professional services engagement, including without limitation any form of attestation engagement, such as an audit, compilation or review. Novogradac & Company LLP, therefore, did not issue any independent accountants’ reports, findings or other work product including a compilation, review or audit report in connection with this engagement. Any federal tax advice that may be contained in this Special Report is not intended to constitute a covered opinion pursuant to regulation section 10.35 of Internal Revenue Service (IRS) Circular 230 nor is it to be used for the purpose of (i) avoiding tax-related penalties under the Internal Revenue Code or (ii) promoting, marketing or recommending to another party any tax-related matters addressed therein.
Limiting Conditions
1785 Massachusetts Ave. NW, Washington, DC 20036-2117 tel: 202.588.6000 800.944.6847 fax: 202.588.6038
U.S. Mail Address:P.O. Box 7833San Francisco, CA 94120-7833
Physical & Delivery Address:246 First Street, 5th FloorSan Francisco, CA 94105Tel: 415.356.8000Fax: 415.356.8001