historical and ecological determinants of genetic structure in arctic...
TRANSCRIPT
Molecular Ecology (2007)
16
, 3466–3483 doi: 10.1111/j.1365-294X.2007.03381.x
© 2007 The AuthorsJournal compilation © 2007 Blackwell Publishing Ltd
Blackwell Publishing Ltd
Historical and ecological determinants of genetic structure in arctic canids
L . E . CARMICHAEL,
*
J . KRIZAN,
†
J . A . NAGY,
‡
E . FUGLEI ,
§
M. DUMOND,
¶
D . JOHNSON,
‡
A . VEITCH,
‡
D . BERTEAUX
**
and C. STROBECK
*
*
CW405 Biological Sciences Building, Department of Biological Sciences, University of Alberta, Edmonton, AB, Canada
, †
IMG-Golder Corporation, Inuvik, NT, Canada
, ‡
Department of Environment and Natural Resources, Government of the Northwest Territories, NT, Canada
, §
Norwegian Polar Institute, Polar Environmental Center, NO-9296 Tromsø, Norway
, ¶
Department of Environment, Government of Nunavut, Kugluktuk, NU, Canada
, **
Chaire de recherche du Canada en conservation des écosystèmes nordiques et Centre d’études nordiques, Université du Québec à Rimouski, Rimouski, QC, Canada
Abstract
Wolves (
Canis lupus
) and arctic foxes (
Alopex lagopus
) are the only canid species foundthroughout the mainland tundra and arctic islands of North America. Contrasting evolu-tionary histories, and the contemporary ecology of each species, have combined to producetheir divergent population genetic characteristics. Arctic foxes are more variable than wolves,and both island and mainland fox populations possess similarly high microsatellitevariation. These differences result from larger effective population sizes in arctic foxes,and the fact that, unlike wolves, foxes were not isolated in discrete refugia during thePleistocene. Despite the large physical distances and distinct ecotypes represented, a single,panmictic population of arctic foxes was found which spans the Svalbard Archipelago andthe North American range of the species. This pattern likely reflects both the absence ofhistorical population bottlenecks and current, high levels of gene flow following frequentlong-distance foraging movements. In contrast, genetic structure in wolves correlatesstrongly to transitions in habitat type, and is probably determined by natal habitat-biaseddispersal. Nonrandom dispersal may be cued by relative levels of vegetation cover betweentundra and forest habitats, but especially by wolf prey specialization on ungulate speciesof familiar type and behaviour (sedentary or migratory). Results presented here suggestthat, through its influence on sea ice, vegetation, prey dynamics and distribution, continuedarctic climate change may have effects as dramatic as those of the Pleistocene on the geneticstructure of arctic canid species.
Keywords
:
Alopex lagopus
, arctic fox,
Canis lupus
, dispersal, genetic structure, grey wolf, micro-satellite, prey specialization
Received 2 December 2006; revision received 20 March 2007; accepted 4 April 2007
Introduction
Canid species inhabit forests and jungles, prairies andsavannas, mountains, deserts and coastlines; they are ableto thrive in undisturbed habitats and in human cities(Wandeler
et al
. 2003; IUCN/SSC 2004). However, only twospecies, the arctic fox (
Alopex lagopus
) and the grey wolf
(
Canis lupus
), occupy the mainland tundra and arcticarchipelago of North America (Angerbjörn
et al
. 2004a;Mech & Boitani 2004). Commonalities and contrasts in thehistory and behaviour of these arctic canid species couldmake a comparison of their population genetics parti-cularly interesting.
Fossil evidence suggests modern wolves and arctic foxesreached the New World during later phases of the Pleis-tocene (Kurtén & Anderson 1980), but their post-arrivalhistories show few similarities. Grey wolf morphologysupports persistence in multiple glacial refugia (Brewster
Correspondence: L. E. Carmichael, Fax: (780) 492-9234; E-mail: [email protected]
G E N E T I C S T R U C T U R E I N A R C T I C C A N I D S
3467
© 2007 The AuthorsJournal compilation © 2007 Blackwell Publishing Ltd
& Fritts 1995), followed by expansion throughout NorthAmerica at the onset of the current interglacial (Nowak2003); the present reduced range of this species is a con-sequence of recent persecution (Leonard
et al
. 2005). Unlikewolves, arctic foxes were widely distributed during the lastglaciation, their current North American range reflectingprogressive contraction of suitable habitat towards thepole (Kurtén & Anderson 1980; Dalén
et al
. 2004, 2005) andnorthward expansion of their primary competitor, thered fox (
Vulpes vulpes
, Hersteinsson & Macdonald 1992;Tannerfeldt
et al
. 2002). Contemporary variation and geneticstructure in arctic canids could therefore be very different.
On the other hand, analogous ecologies and life historiesmay be expected to produce analogous population geneticcharacteristics. For example, northern wolves and arcticfoxes have developed similar strategies for dealing withthe variation in type and density of available prey thatis typical of arctic ecosystems. Two arctic fox ecotypesare generally recognized: ‘coastal’ foxes, feeding on birds,eggs, and carrion from the marine ecosystem (e.g. polarbear kills); and ‘lemming’ foxes, which subsist primarilyon small mammals of cyclical abundance (Braestrup 1941).The stable resource base available to coastal foxes resultsin smaller home ranges (Eide
et al
. 2004) which may beoccupied and defended year round (Anthony 1997; Audet
et al
. 2002). However, lemming foxes are territorial pri-marily during the breeding season, and in winter, manyarctic foxes travel distances up to 2300 km in search of food(Eberhardt
et al
. 1983). Long-range foraging movementshave also been documented through regions which donot support breeding populations, such as sea ice (640 km)and the southern boreal forest (1000 km, Wrigley & Hatch1976). The high vagility of these small canids is thoughtto be an adaptation to regional synchrony of lemmingpopulation dynamics (Pulliainen 1965; Audet
et al
. 2002;Dalén
et al
. 2006), and would be expected to reduce geneticdifferentiation among populations. We might even predictlower differentiation among North American lemmingfoxes, relative to coastal foxes living, for example, in theSvalbard archipelago.
Like arctic foxes, northern grey wolves can be dividedinto two prey-defined ecotypes with divergent behav-iours. Forest wolves feed primarily on resident ungulateslike moose, elk, and deer, and inhabit and defend theirterritories in all seasons (e.g. Huggard 1993; Hayes
et al
.2000; Mech & Boitani 2003). Mainland tundra wolves relyon migratory barren ground caribou and are territorialonly while denning; during the fall and winter, wolvesfollow the movements of the caribou from their calvingareas on the tundra to wintering grounds below the tree line,which may be thousands of kilometres away (Kuyt 1972;Heard & Williams 1992; Walton
et al
. 2001; Musiani 2003).Dispersal distances of forest wolves vary with availabilityof vacant territories, and can be as great as 886 km (Fritts
1983; Mech & Boitani 2003). Studies distinguishing dispersaldistances from migratory movements of tundra wolveshave not been conducted, but dispersal during migrationwas recently documented (Walton
et al
. 2001). Gene flow oftundra wolves could therefore be much greater than that ofwolves in the boreal forest or on arctic islands withoutmigratory caribou populations, even as gene flow amonglemming foxes could be higher than that of coastal foxes. Inboth species, prey specialization could reduce gene flowbetween populations of different ecotypes (Carmichael
et al
. 2001; Geffen
et al
. 2004; Pilot
et al
. 2006).Despite their similar responses to common climatic and
foraging challenges, the social behaviour of wolves andarctic foxes is quite different, and could have opposingeffects on variation and genetic differentiation. Wolvesform packs which generally centre around a dominantbreeding pair (Mech & Boitani 2003). Groups average six toeight individuals, and may include offspring of the breedersand additional nonbreeding helpers. By comparison, arcticfoxes form smaller groups — most often consisting of amated pair and their offspring (Audet
et al
. 2002) — thatmay not persist after the denning season. Grey wolves alsohave smaller litter sizes relative to arctic foxes, which maywean as many as 19 cubs in a peak lemming year (Geffen
et al
. 1996; Angerbjörn
et al
. 2004a). Lower current effectivepopulation sizes should produce lower genetic variation ingrey wolves relative to arctic foxes, perhaps maintainingpatterns originally produced by the species’ divergentPleistocene histories.
Of the various genetic studies that have been conductedon wolves (e.g. Roy
et al
. 1994; Vilà
et al
. 1999; Flagstad
et al
.2003; Blanco
et al
. 2005; Kyle
et al
. 2006), only one focusedspecifically on New World arctic populations, and it wasunfortunately restricted to a small portion of the CanadianNorthwest (Carmichael
et al
. 2001). The single geneticstudy of North American arctic foxes included few sam-pling locations and focused on phylogeography usingmitochondrial DNA (mtDNA, Dalén
et al
. 2005); recentor finer-scale differentiation may therefore have goneundetected. Here, we compare population-level geneticsof both canid species, using microsatellite markers andpopulations distributed throughout the North AmericanArctic. Wolves are expected to display lower geneticvariation and greater genetic structuring than arctic foxes.Differentiation among territorial forest wolves should behigher than that among migratory barren ground popula-tions; in arctic foxes, coastal populations might displaygreater differentiation than inland ‘lemming’ fox popula-tions. In both wolves and arctic foxes, gene flow betweenecotypes could be inhibited by prey specialization. Identi-fication of the historical, physical, and/or ecological factorswith greatest influence on the contemporary geneticsof these canid species may be particularly useful for theirconservation in a changing arctic environment.
3468
L . E . C A R M I C H A E L
E T A L .
© 2007 The AuthorsJournal compilation © 2007 Blackwell Publishing Ltd
Materials and methods
Sample collection, laboratory analysis and data set validation
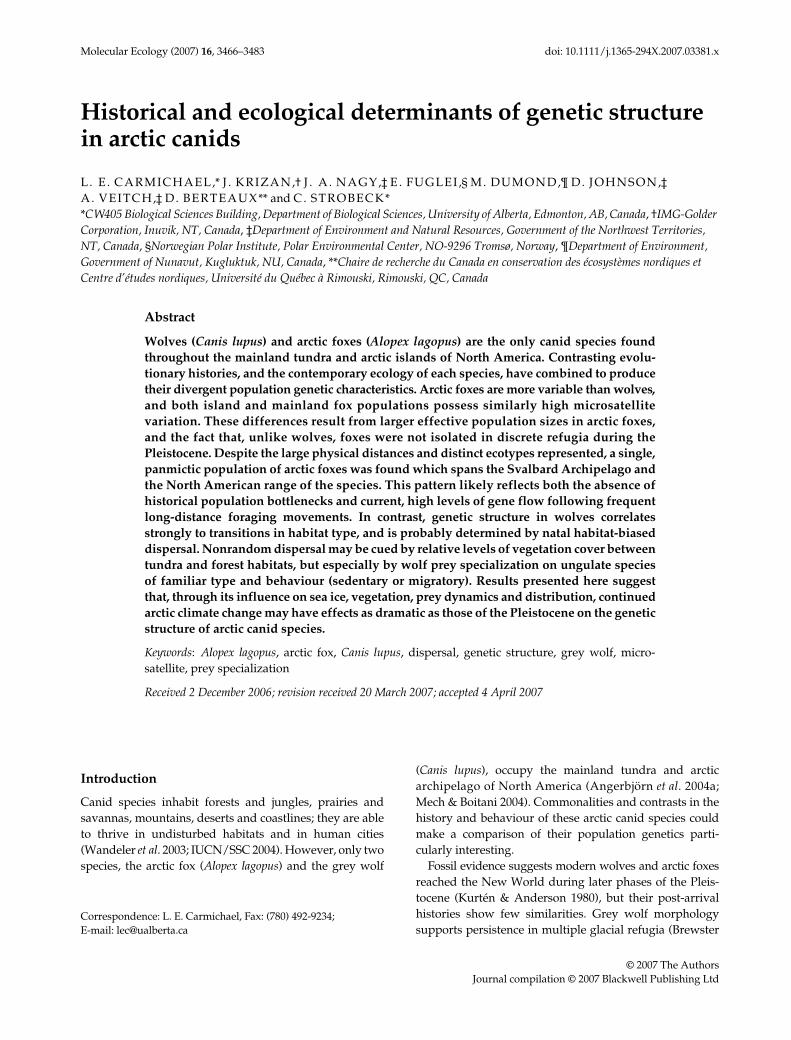
We collected contemporary samples of 1063 lemmingarctic foxes distributed throughout their North Americanrange (Fig. 1). Foxes from the Svalbard archipelago (
n
=637) were included for comparison due to their physicalseparation from contiguous New World populations andtheir membership in the coastal ecotype. Sampling area forwolves extended across the North American Arctic andincluded territorial boreal forest wolves for comparison tomigratory tundra populations (Fig. 2). We genotyped 2025wolves, including 491 individuals previously examinedby Carmichael
et al
. (2001). Samples obtained from theUniversity of Alaska tissue collections are listed in TableS1, Supplementary material.
Tissue and blood samples were stored frozen while drymaterial such as pelt or hair was kept at room temperature.We used DNeasy tissue kits (QIAGEN) to extract genomicDNA from all samples. Microsatellite loci were amplifiedthrough polymerase chain reaction (PCR) using fluores-cently labelled primers from domestic dogs. Fifteen loci
were amplified in wolves: CPH5 and CPH16 (Fredholm &Wintero 1995); CXX110, CXX140, CXX173, CXX250, CXX251,and CXX377 (Ostrander
et al
. 1993); CXX618, CXX671,CXX733, CXX745, CXX758, CXX781, and CXX2079(Mellersh
et al
. 1997). We used 13 loci for arctic foxes:CPH5, CPH8, CPH9, and CPH15 (Fredholm & Wintero1995); CXX140, CXX147, CXX173, and CXX250 (Ostrander
et al
. 1993); CXX671, CXX733, CXX745, CXX758, and CXX771(Mellersh
et al
. 1997). Eight loci were common betweenthe species; six of the wolf markers were also used byCarmichael
et al
. (2001).For arctic foxes, single-locus amplifications of CPH5,
CPH8, CPH9, CXX140, CXX147, CXX250, or CXX745 con-tained 0.16
µ
mol each primer, 0.12 mmol dNTP, 2.5 mmolMgCl
2
, 1
×
PCR buffer (50 mmol KCl, 10 mmol Tris-HCl,pH 8.8, 0.1% Triton X100), 1 U
Taq
polymerase, andapproximately 40 ng template in 15
µ
L total. For multiplexreactions of CXX173/CXX671, CPH15/CXX758, or CXX733/CXX771, we increased dNTP concentration to 0.16 mmoland MgCl
2
to 2.7 mmol. Wolf loci were amplified in thefollowing multiplexes: CPH5/CXX2079; CXX671/CXX173/CXX377; CXX745/CPH16; CXX140/CXX250/CXX251;CXX618/CXX758/CXX110; and CXX733/CXX781. Reac-tions contained 0.16 mmol dNTP, 1.7–2.5 mmol MgCl
2
, and
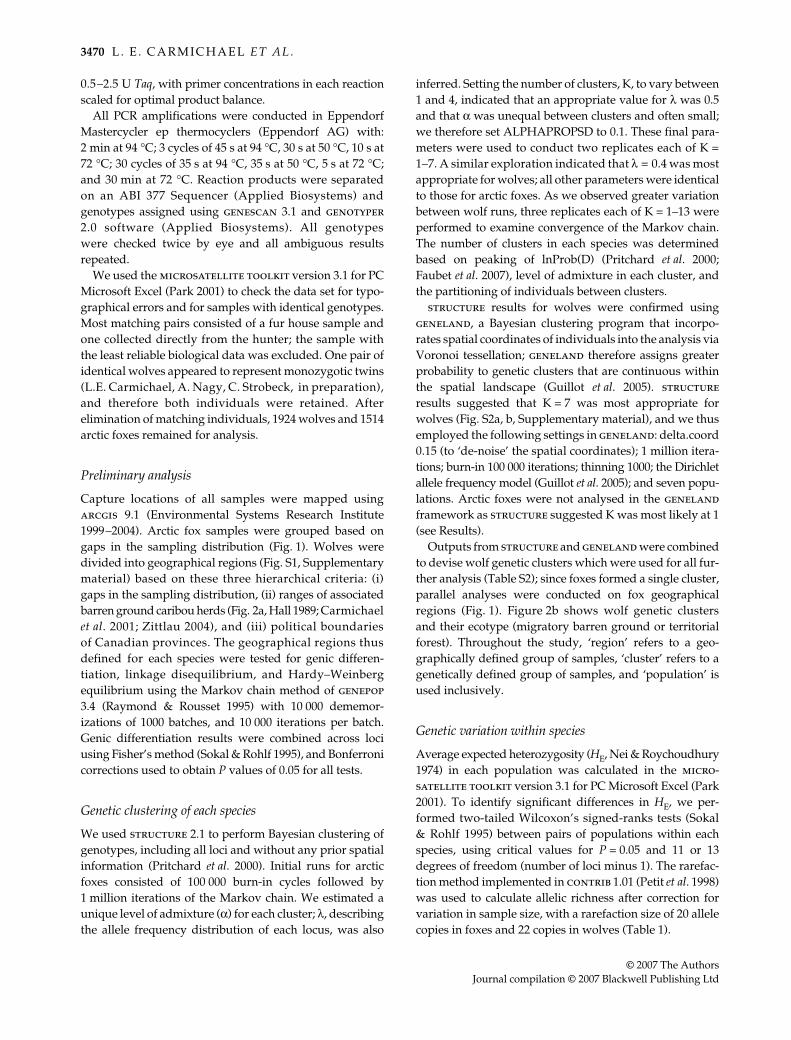
Fig. 1 Arctic fox samples grouped into geographical regions (some sites represent multiple samples). Svalbard foxes are considered coastalfoxes, with all other populations belonging to the lemming ecotype. Tree line is indicated with a grey line.
G E N E T I C S T R U C T U R E I N A R C T I C C A N I D S
3469
© 2007 The AuthorsJournal compilation © 2007 Blackwell Publishing Ltd
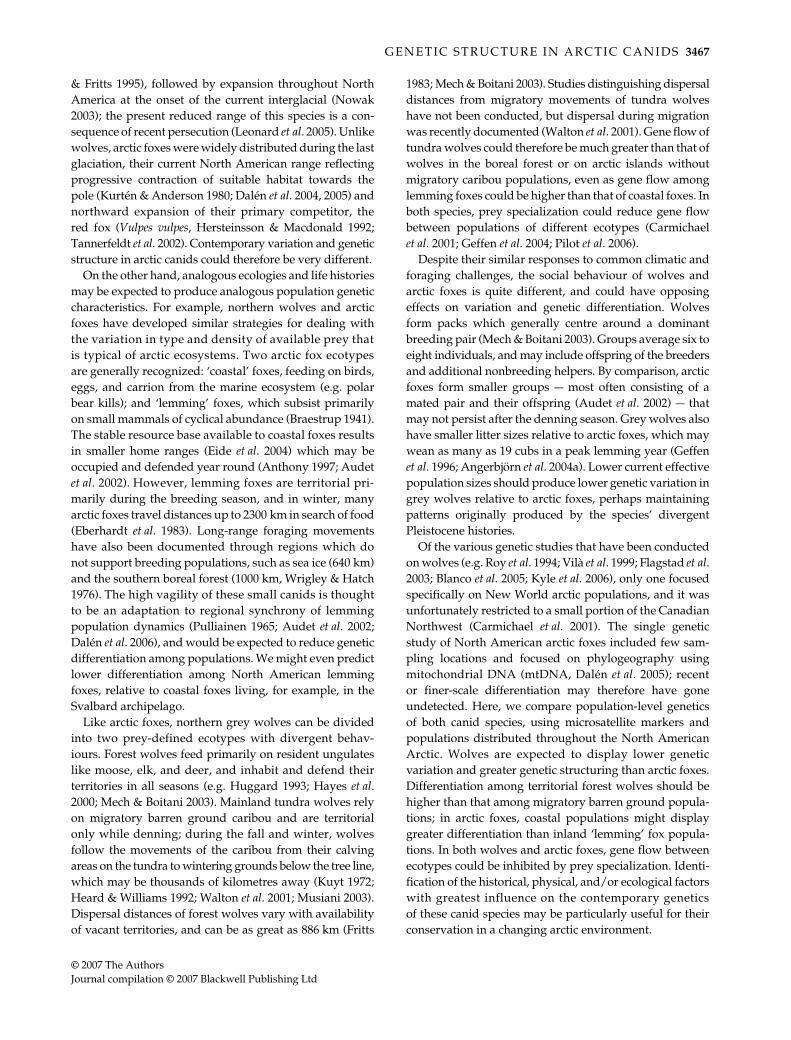
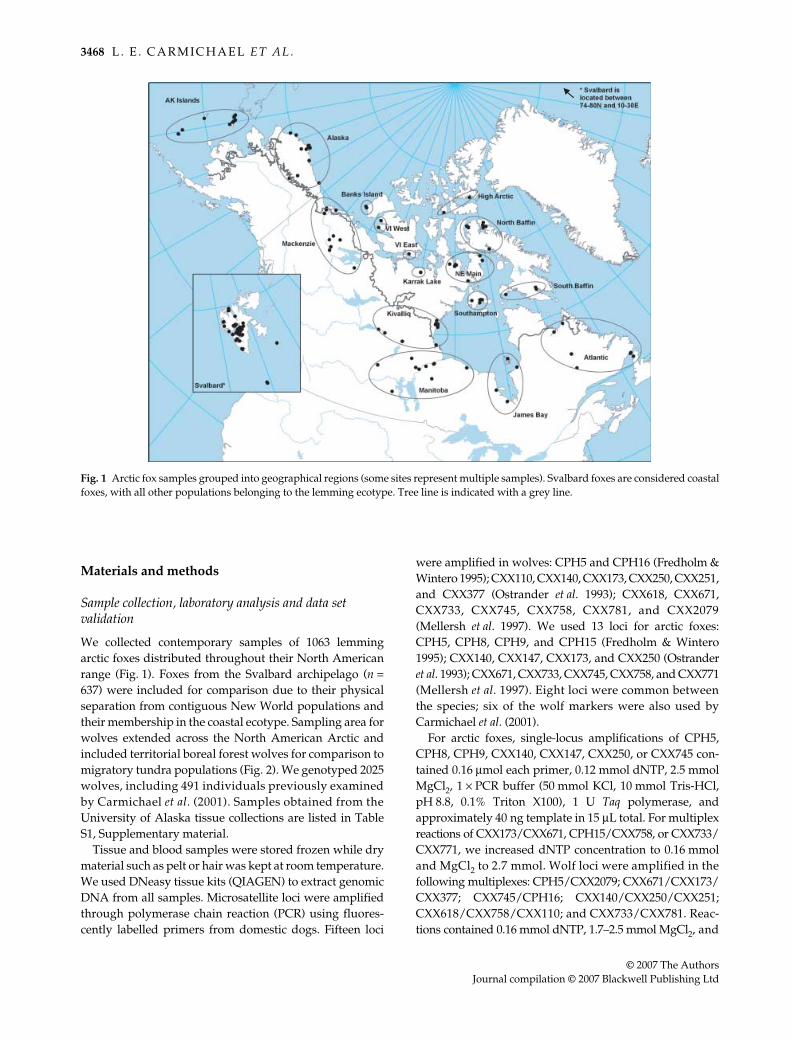
Fig. 2 (a) Annual ranges of migratory barren-ground caribou herds found on the mainland. Caribou calve on the tundra and winter belowtree line. (b) Grey wolf samples grouped into genetic clusters, based on structure and geneland analyses. Western Barrens and EasternBarrens represent migratory wolves, with all other populations belonging to the territorial ecotype.
3470
L . E . C A R M I C H A E L
E T A L .
© 2007 The AuthorsJournal compilation © 2007 Blackwell Publishing Ltd
0.5–2.5 U
Taq
, with primer concentrations in each reactionscaled for optimal product balance.
All PCR amplifications were conducted in EppendorfMastercycler ep thermocyclers (Eppendorf AG) with:2 min at 94
°
C; 3 cycles of 45 s at 94
°
C, 30 s at 50
°
C, 10 s at72
°
C; 30 cycles of 35 s at 94
°
C, 35 s at 50
°
C, 5 s at 72
°
C;and 30 min at 72
°
C. Reaction products were separatedon an ABI 377 Sequencer (Applied Biosystems) andgenotypes assigned using
genescan
3.1 and
genotyper
2.0 software (Applied Biosystems). All genotypeswere checked twice by eye and all ambiguous resultsrepeated.
We used the
microsatellite toolkit
version 3.1 for PCMicrosoft Excel (Park 2001) to check the data set for typo-graphical errors and for samples with identical genotypes.Most matching pairs consisted of a fur house sample andone collected directly from the hunter; the sample withthe least reliable biological data was excluded. One pair ofidentical wolves appeared to represent monozygotic twins(L.E. Carmichael, A. Nagy, C. Strobeck, in preparation),and therefore both individuals were retained. Afterelimination of matching individuals, 1924 wolves and 1514arctic foxes remained for analysis.
Preliminary analysis
Capture locations of all samples were mapped using
arcgis
9.1 (Environmental Systems Research Institute1999–2004). Arctic fox samples were grouped based ongaps in the sampling distribution (Fig. 1). Wolves weredivided into geographical regions (Fig. S1, Supplementarymaterial) based on these three hierarchical criteria: (i)gaps in the sampling distribution, (ii) ranges of associatedbarren ground caribou herds (Fig. 2a, Hall 1989; Carmichael
et al
. 2001; Zittlau 2004), and (iii) political boundariesof Canadian provinces. The geographical regions thusdefined for each species were tested for genic differen-tiation, linkage disequilibrium, and Hardy–Weinbergequilibrium using the Markov chain method of
genepop
3.4 (Raymond & Rousset 1995) with 10 000 dememor-izations of 1000 batches, and 10 000 iterations per batch.Genic differentiation results were combined across lociusing Fisher’s method (Sokal & Rohlf 1995), and Bonferronicorrections used to obtain
P
values of 0.05 for all tests.
Genetic clustering of each species
We used
structure
2.1 to perform Bayesian clustering ofgenotypes, including all loci and without any prior spatialinformation (Pritchard
et al
. 2000). Initial runs for arcticfoxes consisted of 100 000 burn-in cycles followed by1 million iterations of the Markov chain. We estimated aunique level of admixture (
α
) for each cluster;
λ
, describingthe allele frequency distribution of each locus, was also
inferred. Setting the number of clusters, K, to vary between1 and 4, indicated that an appropriate value for
λ
was 0.5and that
α
was unequal between clusters and often small;we therefore set ALPHAPROPSD to 0.1. These final para-meters were used to conduct two replicates each of K =1–7. A similar exploration indicated that
λ
= 0.4 was mostappropriate for wolves; all other parameters were identicalto those for arctic foxes. As we observed greater variationbetween wolf runs, three replicates each of K = 1–13 wereperformed to examine convergence of the Markov chain.The number of clusters in each species was determinedbased on peaking of lnProb(D) (Pritchard
et al
. 2000;Faubet
et al
. 2007), level of admixture in each cluster, andthe partitioning of individuals between clusters.
structure
results for wolves were confirmed using
geneland
, a Bayesian clustering program that incorpo-rates spatial coordinates of individuals into the analysis viaVoronoi tessellation;
geneland
therefore assigns greaterprobability to genetic clusters that are continuous withinthe spatial landscape (Guillot
et al
. 2005).
structure
results suggested that K = 7 was most appropriate forwolves (Fig. S2a, b, Supplementary material), and we thusemployed the following settings in
geneland
: delta.coord0.15 (to ‘de-noise’ the spatial coordinates); 1 million itera-tions; burn-in 100 000 iterations; thinning 1000; the Dirichletallele frequency model (Guillot
et al
. 2005); and seven popu-lations. Arctic foxes were not analysed in the
geneland
framework as
structure
suggested K was most likely at 1(see Results).
Outputs from
structure
and
geneland
were combinedto devise wolf genetic clusters which were used for all fur-ther analysis (Table S2); since foxes formed a single cluster,parallel analyses were conducted on fox geographicalregions (Fig. 1). Figure 2b shows wolf genetic clustersand their ecotype (migratory barren ground or territorialforest). Throughout the study, ‘region’ refers to a geo-graphically defined group of samples, ‘cluster’ refers to agenetically defined group of samples, and ‘population’ isused inclusively.
Genetic variation within species
Average expected heterozygosity (
H
E
, Nei & Roychoudhury1974) in each population was calculated in the
micro-satellite toolkit
version 3.1 for PC Microsoft Excel (Park2001). To identify significant differences in
H
E
, we per-formed two-tailed Wilcoxon’s signed-ranks tests (Sokal& Rohlf 1995) between pairs of populations within eachspecies, using critical values for
P
= 0.05 and 11 or 13degrees of freedom (number of loci minus 1). The rarefac-tion method implemented in
contrib
1.01 (Petit
et al
. 1998)was used to calculate allelic richness after correction forvariation in sample size, with a rarefaction size of 20 allelecopies in foxes and 22 copies in wolves (Table 1).
G E N E T I C S T R U C T U R E I N A R C T I C C A N I D S
3471
© 2007 The AuthorsJournal compilation © 2007 Blackwell Publishing Ltd
Genetic distance and assignment
We used
phylip
3.65 (Felsenstein 1995) to generate 1000bootstrap pseudoreplicates of wolf clusters and foxregions. Nei’s
D
S
(Nei 1972) was calculated for eachreplicate, and neighbour-joining majority-rule consensustrees constructed (Felsenstein 1985; Saitou & Nei 1987).Euclidean distance was calculated among populationswithin species using average latitude and longitudeand the ‘Geographic Distances’ subroutine of
mantel
4.0(Casgrain & Legendre 2001). We then performed a Manteltest (Mantel 1967) of DS and log-transformed geographicaldistances, with 9999 permutations, to assess isolation bydistance in each species.
Paetkau et al.’s (1995) assignment test was conductedwith allele frequencies adjusted to avoid zeros (Titteringtonet al. 1981). To identify levels of cross-assignment greaterthan those expected due to correlation of allele frequenciesbetween clusters, 10 000 replicates were performed,creating new individuals and assuming Hardy–Weinbergequilibrium (Carmichael et al. 2001). In addition to provid-ing estimates of the relative number of migrants betweentwo populations, assignment indices can be used as anindicator of relative differentiation, and were employed toexplore contrasts between wolves in different habitat types.
Correlates of genetic structure in wolves
Carmichael et al. (2001) used partial Mantel tests to estimatecorrelations between physical barriers and geneticdistance between populations while controlling for theinfluence of physical distance (Smouse et al. 1986). Theinability to simultaneously assess more than two predictorvariables, and recent concerns regarding the validityof associated significance estimates (Raufaste & Rousset2001), are limitations of this technique. An alternativerecently applied to population genetic data in wolves isdistance-based redundancy analysis (dbRDA, McArdle &Anderson 2001; Geffen et al. 2004; Pilot et al. 2006). ThedbRDA allows the user to test up to N – 1 predictor variables(N = number of populations) either individually, or fittedin sequence to produce a combined model. Significanceestimates in dbRDA have also been proven adequate(McArdle & Anderson 2001). We used this approach to testcorrelations between Nei’s DS among our wolf clusters anda suite of 22 potential determinants of genetic structure.The eight factors most related to DS in preliminary testswere retained for full analysis and are described below.
Carmichael et al. (2001) and Pilot et al. (2006) suggestedwolf genetic structure may result from specialization onparticular prey types. We therefore designed a categorical
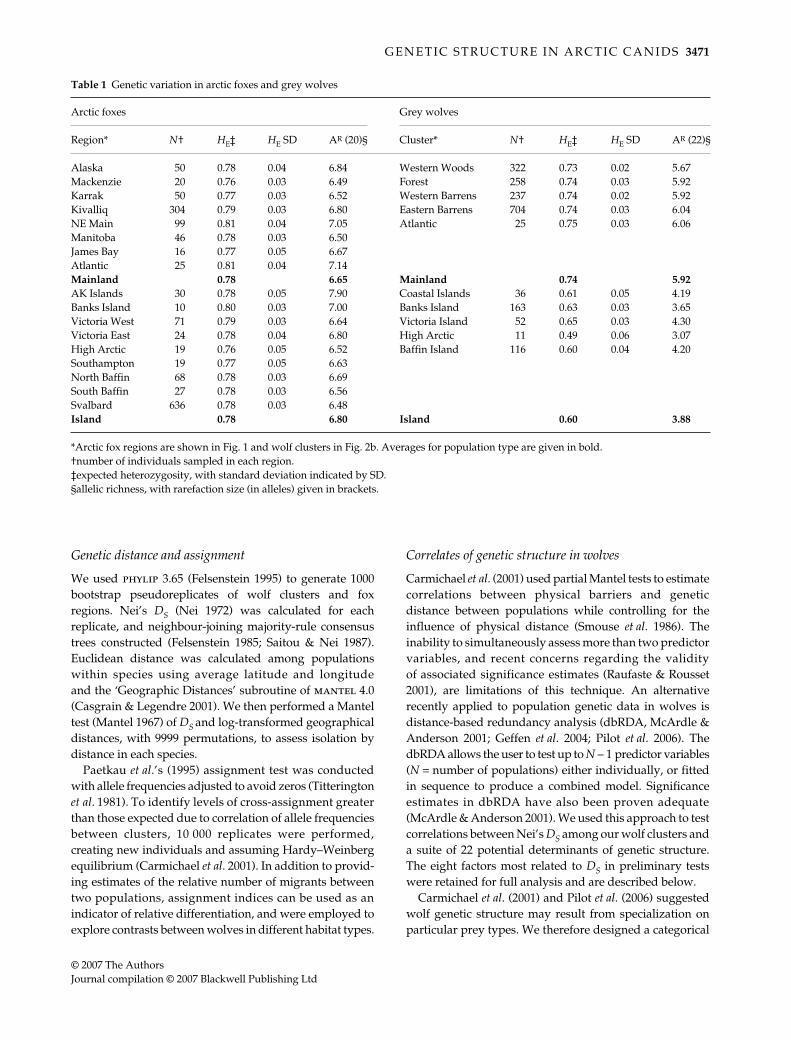
Table 1 Genetic variation in arctic foxes and grey wolves
Arctic foxes Grey wolves
Region* N† HE‡ HE SD AR (20)§ Cluster* N† HE‡ HE SD AR (22)§
Alaska 50 0.78 0.04 6.84 Western Woods 322 0.73 0.02 5.67Mackenzie 20 0.76 0.03 6.49 Forest 258 0.74 0.03 5.92Karrak 50 0.77 0.03 6.52 Western Barrens 237 0.74 0.02 5.92Kivalliq 304 0.79 0.03 6.80 Eastern Barrens 704 0.74 0.03 6.04NE Main 99 0.81 0.04 7.05 Atlantic 25 0.75 0.03 6.06Manitoba 46 0.78 0.03 6.50James Bay 16 0.77 0.05 6.67Atlantic 25 0.81 0.04 7.14Mainland 0.78 6.65 Mainland 0.74 5.92AK Islands 30 0.78 0.05 7.90 Coastal Islands 36 0.61 0.05 4.19Banks Island 10 0.80 0.03 7.00 Banks Island 163 0.63 0.03 3.65Victoria West 71 0.79 0.03 6.64 Victoria Island 52 0.65 0.03 4.30Victoria East 24 0.78 0.04 6.80 High Arctic 11 0.49 0.06 3.07High Arctic 19 0.76 0.05 6.52 Baffin Island 116 0.60 0.04 4.20Southampton 19 0.77 0.05 6.63North Baffin 68 0.78 0.03 6.69South Baffin 27 0.78 0.03 6.56Svalbard 636 0.78 0.03 6.48Island 0.78 6.80 Island 0.60 3.88
*Arctic fox regions are shown in Fig. 1 and wolf clusters in Fig. 2b. Averages for population type are given in bold.†number of individuals sampled in each region.‡expected heterozygosity, with standard deviation indicated by SD.§allelic richness, with rarefaction size (in alleles) given in brackets.
3472 L . E . C A R M I C H A E L E T A L .
© 2007 The AuthorsJournal compilation © 2007 Blackwell Publishing Ltd
predictor indicating the dominant prey species within therange of each wolf cluster, based upon distribution oflarge ungulate species (moose, elk, deer, muskoxen, orbarren-ground caribou) and available wolf diet studies(Larter et al. 1994; Hayes et al. 1997, 2000; Kohira & Rexstad1997; Olsen et al. 2001; Mahoney & Virgl 2003; Stenhouseet al. 1995; Spaulding et al. 1998; Schaefer et al. 1999; Urton& Hobson 2005; R. Popko, personal communication).However, wolf diet is complex and variable over space andtime, and we were forced to make a number of assumptionswhile constructing this predictor. To simplify and to focuson an aspect of prey behaviour that influences movementpatterns of associated wolves (Ballard et al. 1997; Waltonet al. 2001), we constructed a second indicator denoting thebehaviour, sedentary or migratory, of each dominant preyspecies (migratory barren-ground caribou = 0, all others= 1). These predictors were tested singly and as a set called‘prey’.
Isolation by a water barrier — the Mackenzie River, chan-nels of the Arctic ocean and the straits between the CoastalIslands and the mainland (Fig. 2a) — was coded with a 1,with absence of a barrier represented by 0. Annualminimum temperature and annual rainfall in each areawere obtained from Environment Canada (2000) and theNational Climatic Data Center’s (2000) online databases,and represented as continuous variables. Vegetationcomplex in each cluster was coded as a categorical variablebased on the World Wildlife Fund’s Terrestrial Ecosystems(ESRI). Temperature, rainfall, and vegetation were testedseparately and as a set called ‘habitat.’ Finally, averagelatitude and longitude for each cluster were tested individ-ually, as a set called ‘spatial’, and in combination withother variable sets.
We used the program pco to perform principle co-ordinate analysis (PCA) on our genetic distance matrix(Anderson 2003b), then conducted dbRDA on all variablesusing distlm forward (Anderson 2003a). Marginal tests ofeach predictor or set of predictors were made, followed bysequential tests using a forward selection procedure toproduce a combined model of genetic differentiation inwolves (Pilot et al. 2006).
Results
Equilibrium and differentiation in each species
Allele frequencies in arctic fox regions were generallyhomogeneous; the Svalbard population was one consistentexception. Ten locus pairs deviated from linkage equili-brium in the Svalbard fox population alone, suggestinghidden population structure rather than nonindependenceof loci.
CPH5 and CXX110 showed significant association ineight out of 21 wolf regions, indicating potential physical
linkage (all other Bonferroni-corrected significant resultsoccurred in a single population). Since CXX110 was lessvariable and more difficult to type, it was excluded fromfurther analysis. In arctic foxes, CPH8 suffered a significantdeficiency of heterozygotes in 12 of 17 regions. CPH8 alsoaccounted for over 50% of the missing data in our foxsamples, and was excluded for likely possession of nullalleles. We therefore proceeded with 14 microsatellite lociin wolves and 12 loci in arctic foxes.
Genetic clustering of each species
As K was increased, lnProb(D) for arctic foxes increasedslightly (Fig. S2a). However, for K = 2, an average of 97%of the individuals in each geographical region assignedto a single cluster, and this trend persisted as K wasincreased. While linkage disequilibrium results suggestedsubstructuring within the Svalbard group, the vastmajority of these samples consistently assigned to thesingle cluster also containing the vast majority of NorthAmerican arctic foxes. We therefore concluded that theincrease in probability with larger K resulted fromover-parameterization of the model, and that structurewas segregating rare alleles, rather than partitioningindividuals according to true genetic discontinuities.A single panmictic unit including North America andSvalbard seemed most likely for this species.
In contrast, given the plateau in lnProb(D) and cohesionof the clusters (Fig. S2a, b), K = 7 was the most appropriatechoice for wolves. In general, structure recovered anAtlantic group, a western and eastern boreal forest group(Western Woods and Forest), and a western and easternbarren ground group (Western Barrens and Eastern Bar-rens), shown in Fig. 2b. Assignment of mainland clusterswas nearly identical in geneland as in structure (TableS2); however, the methods differed with regards to islandpopulations. geneland separated Coastal Island wolvesand grouped all arctic island wolves into a single cluster;structure divided the arctic islands into a western group-ing (Banks and Victoria Island) and an eastern grouping(North and South Baffin Island), and did not delineateCoastal Island wolves until K = 9 (data not shown). Wesuspect this difference is due to spatial concentration ofthe Coastal samples, which would receive high weightingin the geneland framework.
We combined results from structure and geneland todevise genetic clusters of wolves in all regions (Fig. 2b;Table S2). North and South Baffin Island were pooled, butall other island populations remained distinct for thesethree reasons: (i) the conflict between the clustering methods;(ii) the obvious physical boundaries of islands in the land-scape; and (iii) to retain the ability to perform detailedexaminations of island wolf genetics (Carmichael et al.,submitted). Ten clusters of wolves were therefore used
G E N E T I C S T R U C T U R E I N A R C T I C C A N I D S 3473
© 2007 The AuthorsJournal compilation © 2007 Blackwell Publishing Ltd
for all analysis detailed below. Since arctic foxes formed asingle cluster, we performed parallel analyses on arctic foxregions (Fig. 1).
Genetic variation
Average HE for mainland wolves was 74%, with islandpopulations significantly less variable (Wilcoxon’s signed-rank test, P = 0.05). In arctic foxes, HE averaged 78% in alltypes of populations. Allelic richness for both speciesduplicated these trends (Table 1).
Relationships among canid populations
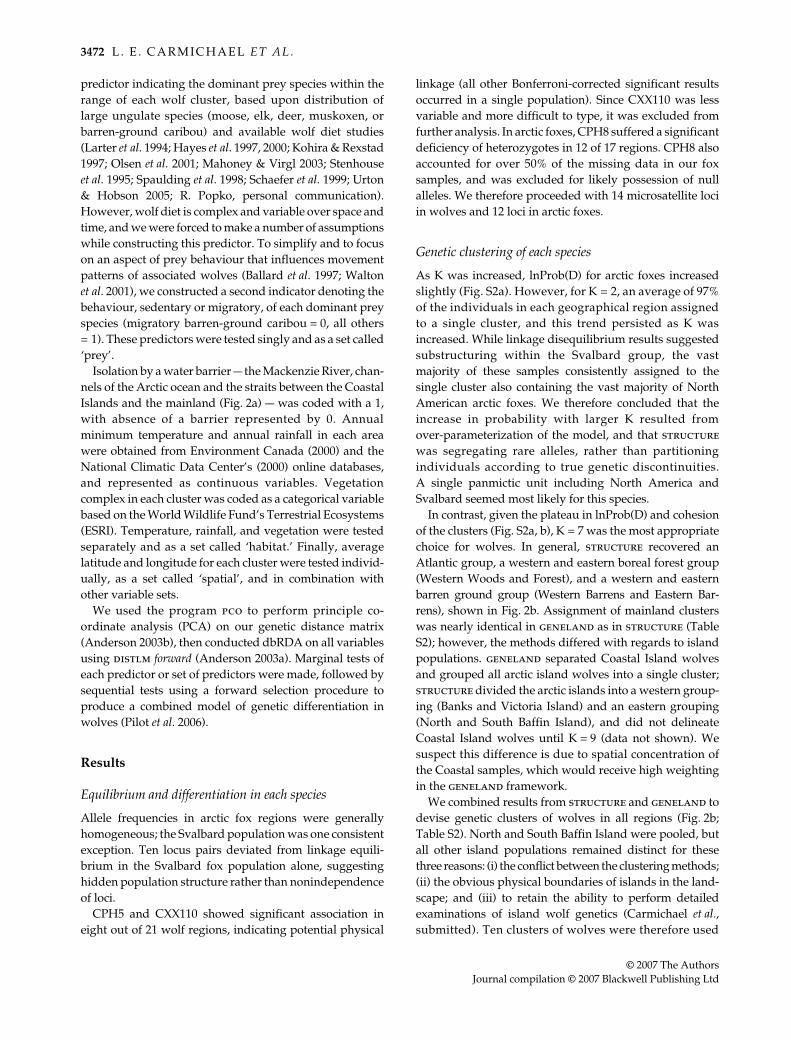
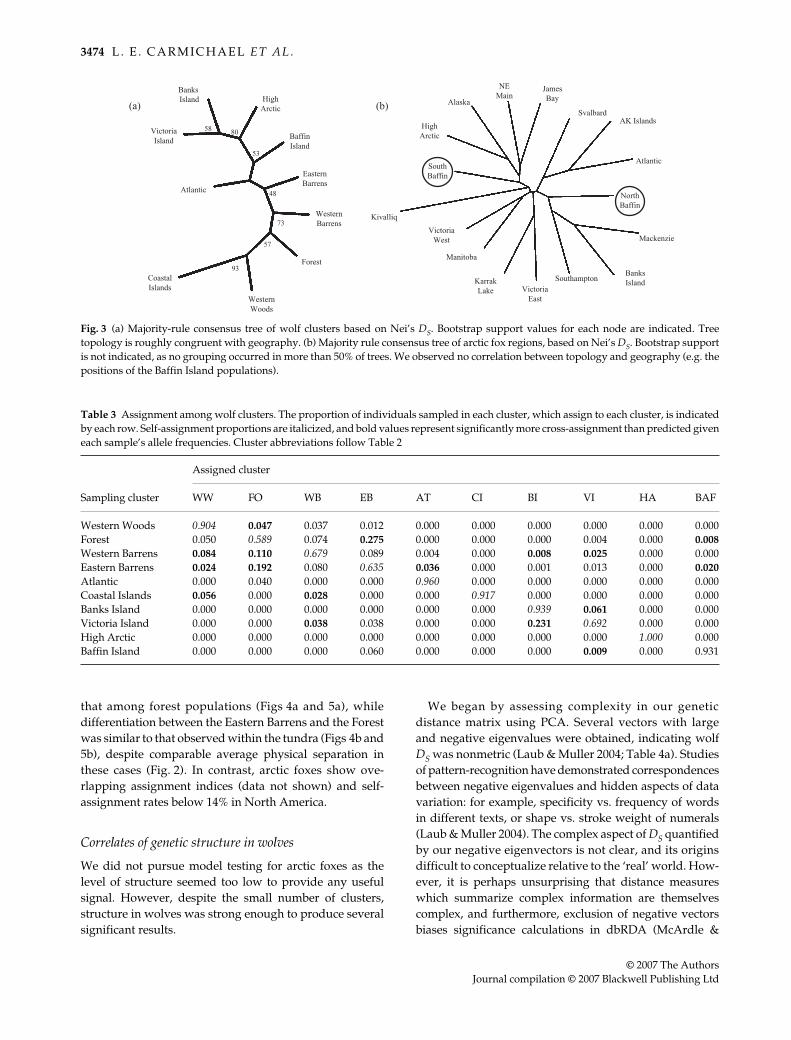
DS among wolf clusters is shown in Table 2. Moderateto high levels of support (48–93%) were observed for allnodes in the bootstrap consensus tree except that for theAtlantic population (Fig. 3a). As the placement of theAtlantic cluster is not well supported, we are reluctant tospeculate on its basis, but in general, clusters were groupedin approximate reflection of their physical locations
(Fig. 2). Despite this visual correspondence between treetopology and geography, we obtained only a moderatecorrelation between log-transformed physical distanceand DS (Mantel test, r = 0.44, P = 0.04). In contrast to resultsfor wolf clusters, there was no association, visual orstatistical, between geography and DS in arctic foxes(Mantel test, r = 0.16, P = 0.19). Indeed, subpopulationslocated on the same island appear on opposite sides of thetree (Figs 1 and 3b), and genetic distances between regionswere generally small (Table 2). These observations confirmthat arctic foxes form a single genetic unit.
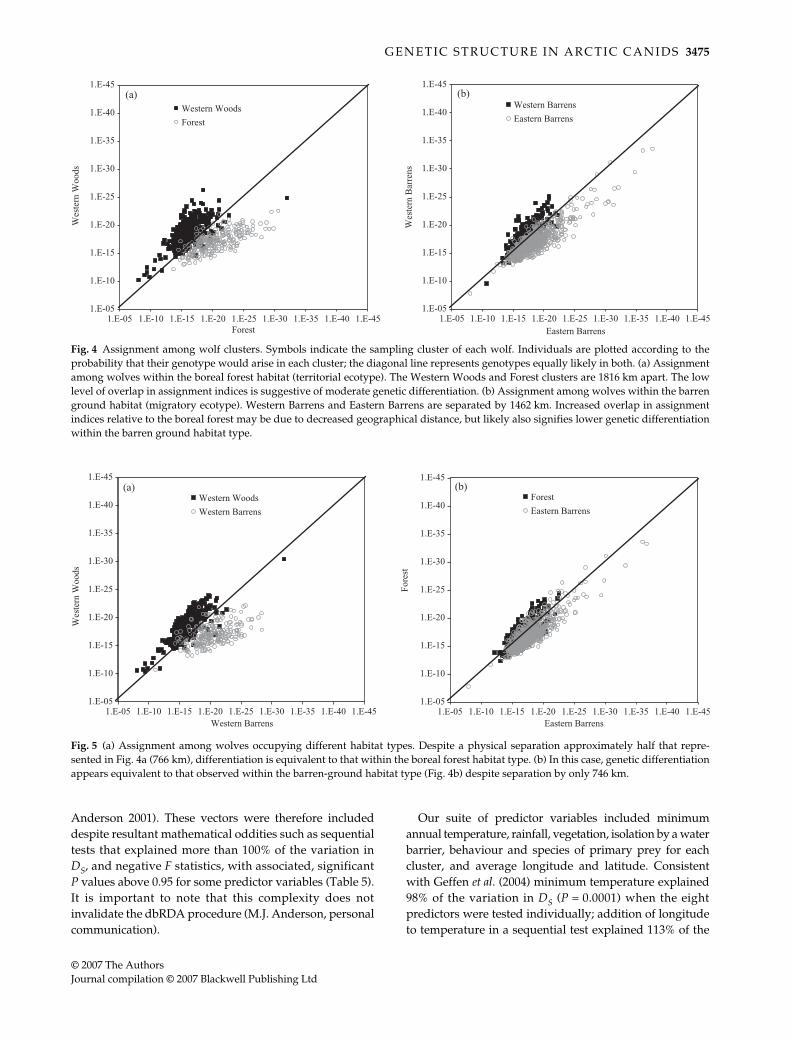
We next performed classical assignment tests for wolfclusters and fox regions (Paetkau et al. 1995). Unsur-prisingly, island wolves were most distinct in both geneticdistance (Table 2) and assignment analyses (Table 3). Wewere interested to note, however, that divergence in assign-ment indices for wolves suggested higher differentiationamong territorial boreal forest populations than migratorybarren ground ones (Fig. 4). Assignment across habitattypes was more complex. Differentiation between theWestern Woods and the Western Barrens was similar to
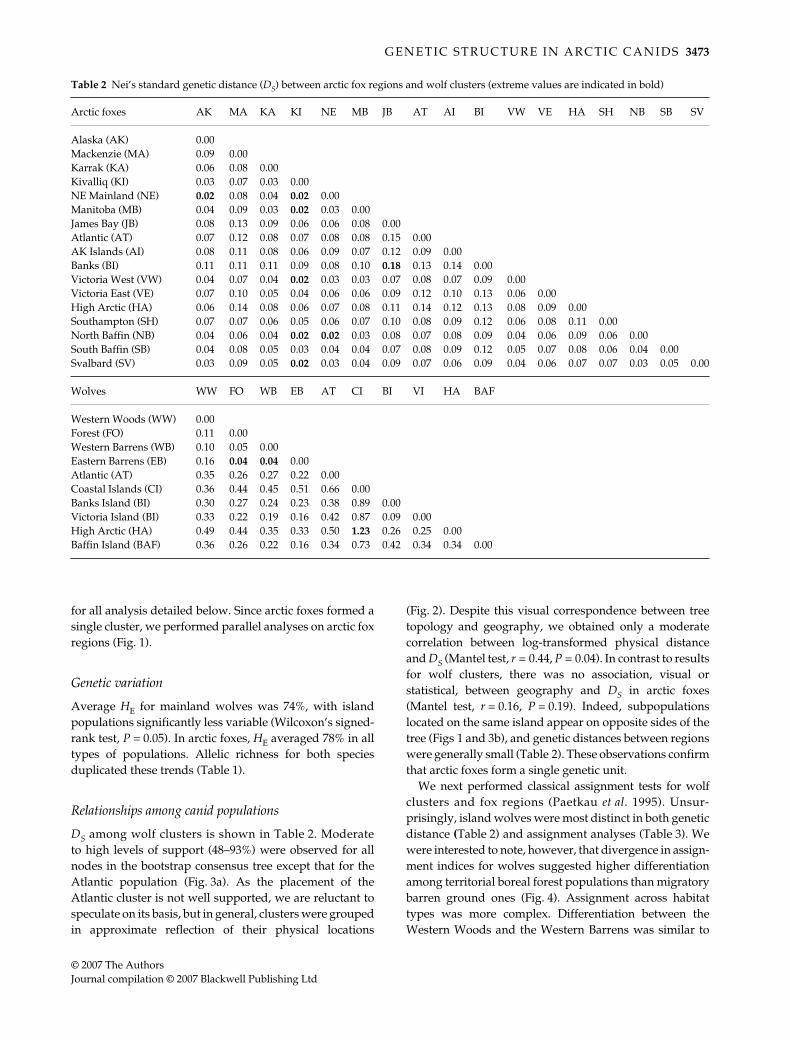
Table 2 Nei’s standard genetic distance (DS) between arctic fox regions and wolf clusters (extreme values are indicated in bold)
Arctic foxes AK MA KA KI NE MB JB AT AI BI VW VE HA SH NB SB SV
Alaska (AK) 0.00Mackenzie (MA) 0.09 0.00Karrak (KA) 0.06 0.08 0.00Kivalliq (KI) 0.03 0.07 0.03 0.00NE Mainland (NE) 0.02 0.08 0.04 0.02 0.00Manitoba (MB) 0.04 0.09 0.03 0.02 0.03 0.00James Bay (JB) 0.08 0.13 0.09 0.06 0.06 0.08 0.00Atlantic (AT) 0.07 0.12 0.08 0.07 0.08 0.08 0.15 0.00AK Islands (AI) 0.08 0.11 0.08 0.06 0.09 0.07 0.12 0.09 0.00Banks (BI) 0.11 0.11 0.11 0.09 0.08 0.10 0.18 0.13 0.14 0.00Victoria West (VW) 0.04 0.07 0.04 0.02 0.03 0.03 0.07 0.08 0.07 0.09 0.00Victoria East (VE) 0.07 0.10 0.05 0.04 0.06 0.06 0.09 0.12 0.10 0.13 0.06 0.00High Arctic (HA) 0.06 0.14 0.08 0.06 0.07 0.08 0.11 0.14 0.12 0.13 0.08 0.09 0.00Southampton (SH) 0.07 0.07 0.06 0.05 0.06 0.07 0.10 0.08 0.09 0.12 0.06 0.08 0.11 0.00North Baffin (NB) 0.04 0.06 0.04 0.02 0.02 0.03 0.08 0.07 0.08 0.09 0.04 0.06 0.09 0.06 0.00South Baffin (SB) 0.04 0.08 0.05 0.03 0.04 0.04 0.07 0.08 0.09 0.12 0.05 0.07 0.08 0.06 0.04 0.00Svalbard (SV) 0.03 0.09 0.05 0.02 0.03 0.04 0.09 0.07 0.06 0.09 0.04 0.06 0.07 0.07 0.03 0.05 0.00
Wolves WW FO WB EB AT CI BI VI HA BAF
Western Woods (WW) 0.00Forest (FO) 0.11 0.00Western Barrens (WB) 0.10 0.05 0.00Eastern Barrens (EB) 0.16 0.04 0.04 0.00Atlantic (AT) 0.35 0.26 0.27 0.22 0.00Coastal Islands (CI) 0.36 0.44 0.45 0.51 0.66 0.00Banks Island (BI) 0.30 0.27 0.24 0.23 0.38 0.89 0.00Victoria Island (BI) 0.33 0.22 0.19 0.16 0.42 0.87 0.09 0.00High Arctic (HA) 0.49 0.44 0.35 0.33 0.50 1.23 0.26 0.25 0.00Baffin Island (BAF) 0.36 0.26 0.22 0.16 0.34 0.73 0.42 0.34 0.34 0.00
3474 L . E . C A R M I C H A E L E T A L .
© 2007 The AuthorsJournal compilation © 2007 Blackwell Publishing Ltd
that among forest populations (Figs 4a and 5a), whiledifferentiation between the Eastern Barrens and the Forestwas similar to that observed within the tundra (Figs 4b and5b), despite comparable average physical separation inthese cases (Fig. 2). In contrast, arctic foxes show ove-rlapping assignment indices (data not shown) and self-assignment rates below 14% in North America.
Correlates of genetic structure in wolves
We did not pursue model testing for arctic foxes as thelevel of structure seemed too low to provide any usefulsignal. However, despite the small number of clusters,structure in wolves was strong enough to produce severalsignificant results.
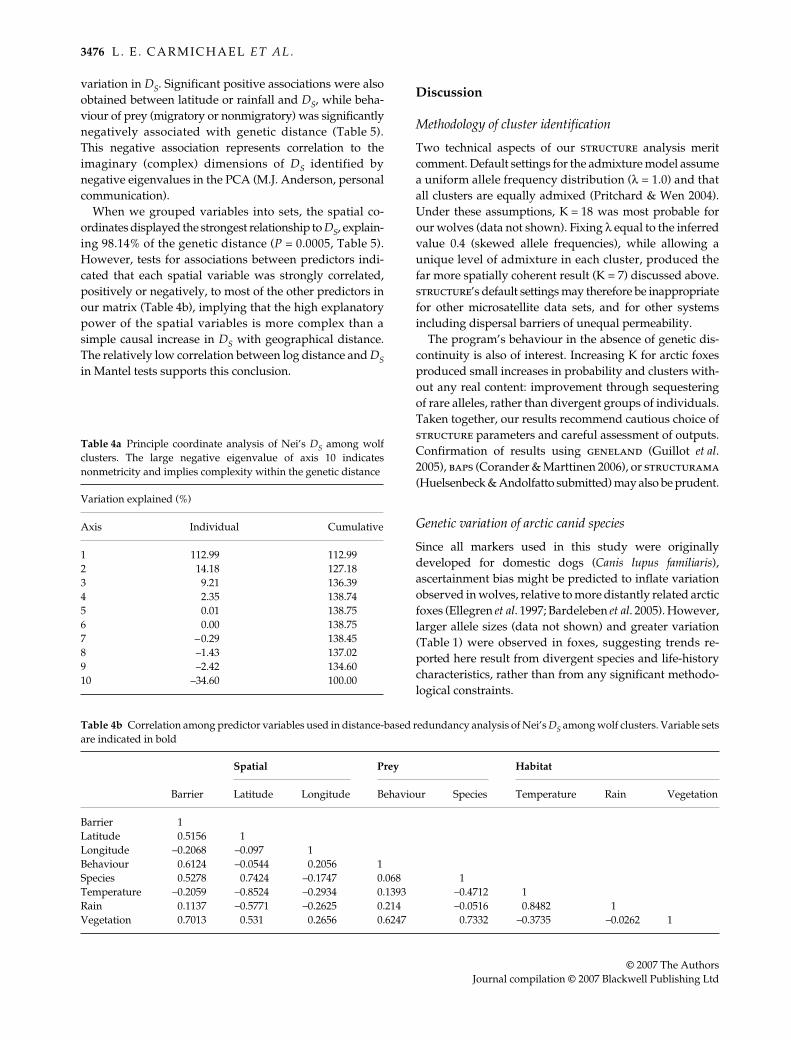
We began by assessing complexity in our geneticdistance matrix using PCA. Several vectors with largeand negative eigenvalues were obtained, indicating wolfDS was nonmetric (Laub & Muller 2004; Table 4a). Studiesof pattern-recognition have demonstrated correspondencesbetween negative eigenvalues and hidden aspects of datavariation: for example, specificity vs. frequency of wordsin different texts, or shape vs. stroke weight of numerals(Laub & Muller 2004). The complex aspect of DS quantifiedby our negative eigenvectors is not clear, and its originsdifficult to conceptualize relative to the ‘real’ world. How-ever, it is perhaps unsurprising that distance measureswhich summarize complex information are themselvescomplex, and furthermore, exclusion of negative vectorsbiases significance calculations in dbRDA (McArdle &
Fig. 3 (a) Majority-rule consensus tree of wolf clusters based on Nei’s DS. Bootstrap support values for each node are indicated. Treetopology is roughly congruent with geography. (b) Majority rule consensus tree of arctic fox regions, based on Nei’s DS. Bootstrap supportis not indicated, as no grouping occurred in more than 50% of trees. We observed no correlation between topology and geography (e.g. thepositions of the Baffin Island populations).
Table 3 Assignment among wolf clusters. The proportion of individuals sampled in each cluster, which assign to each cluster, is indicatedby each row. Self-assignment proportions are italicized, and bold values represent significantly more cross-assignment than predicted giveneach sample’s allele frequencies. Cluster abbreviations follow Table 2
Assigned cluster
Sampling cluster WW FO WB EB AT CI BI VI HA BAF
Western Woods 0.904 0.047 0.037 0.012 0.000 0.000 0.000 0.000 0.000 0.000Forest 0.050 0.589 0.074 0.275 0.000 0.000 0.000 0.004 0.000 0.008Western Barrens 0.084 0.110 0.679 0.089 0.004 0.000 0.008 0.025 0.000 0.000Eastern Barrens 0.024 0.192 0.080 0.635 0.036 0.000 0.001 0.013 0.000 0.020Atlantic 0.000 0.040 0.000 0.000 0.960 0.000 0.000 0.000 0.000 0.000Coastal Islands 0.056 0.000 0.028 0.000 0.000 0.917 0.000 0.000 0.000 0.000Banks Island 0.000 0.000 0.000 0.000 0.000 0.000 0.939 0.061 0.000 0.000Victoria Island 0.000 0.000 0.038 0.038 0.000 0.000 0.231 0.692 0.000 0.000High Arctic 0.000 0.000 0.000 0.000 0.000 0.000 0.000 0.000 1.000 0.000Baffin Island 0.000 0.000 0.000 0.060 0.000 0.000 0.000 0.009 0.000 0.931
G E N E T I C S T R U C T U R E I N A R C T I C C A N I D S 3475
© 2007 The AuthorsJournal compilation © 2007 Blackwell Publishing Ltd
Anderson 2001). These vectors were therefore includeddespite resultant mathematical oddities such as sequentialtests that explained more than 100% of the variation inDS, and negative F statistics, with associated, significantP values above 0.95 for some predictor variables (Table 5).It is important to note that this complexity does notinvalidate the dbRDA procedure (M.J. Anderson, personalcommunication).
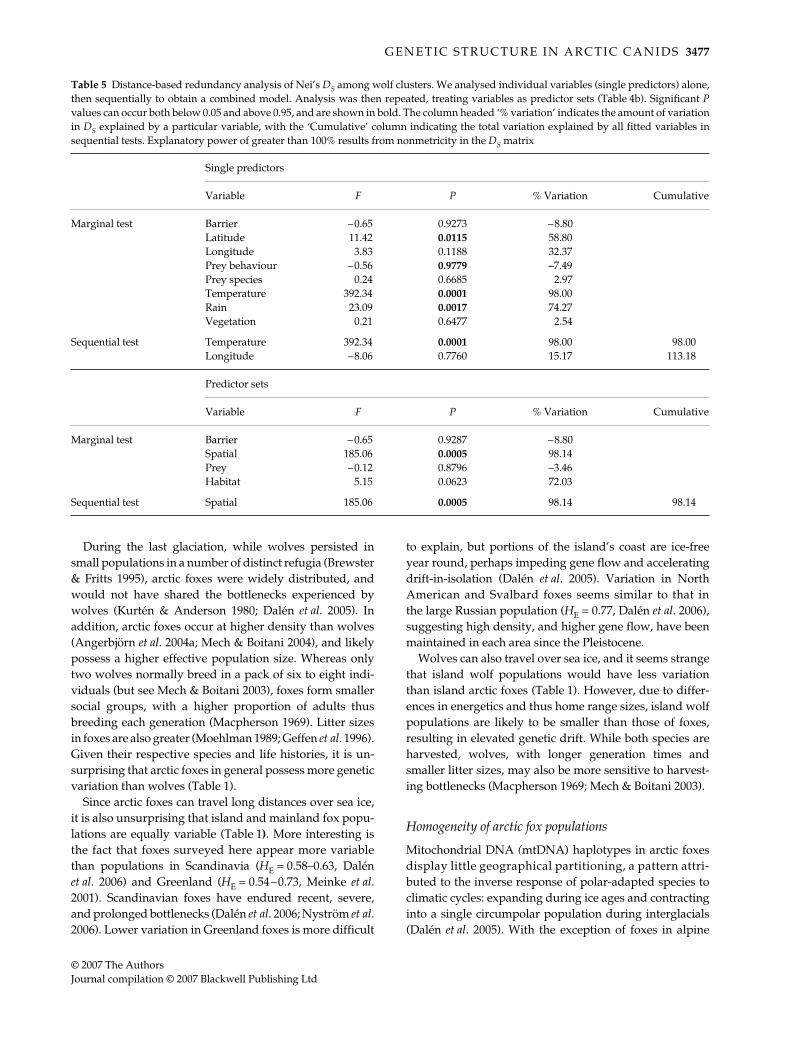
Our suite of predictor variables included minimumannual temperature, rainfall, vegetation, isolation by a waterbarrier, behaviour and species of primary prey for eachcluster, and average longitude and latitude. Consistentwith Geffen et al. (2004) minimum temperature explained98% of the variation in DS (P = 0.0001) when the eightpredictors were tested individually; addition of longitudeto temperature in a sequential test explained 113% of the
Fig. 4 Assignment among wolf clusters. Symbols indicate the sampling cluster of each wolf. Individuals are plotted according to theprobability that their genotype would arise in each cluster; the diagonal line represents genotypes equally likely in both. (a) Assignmentamong wolves within the boreal forest habitat (territorial ecotype). The Western Woods and Forest clusters are 1816 km apart. The lowlevel of overlap in assignment indices is suggestive of moderate genetic differentiation. (b) Assignment among wolves within the barrenground habitat (migratory ecotype). Western Barrens and Eastern Barrens are separated by 1462 km. Increased overlap in assignmentindices relative to the boreal forest may be due to decreased geographical distance, but likely also signifies lower genetic differentiationwithin the barren ground habitat type.
Fig. 5 (a) Assignment among wolves occupying different habitat types. Despite a physical separation approximately half that repre-sented in Fig. 4a (766 km), differentiation is equivalent to that within the boreal forest habitat type. (b) In this case, genetic differentiationappears equivalent to that observed within the barren-ground habitat type (Fig. 4b) despite separation by only 746 km.
3476 L . E . C A R M I C H A E L E T A L .
© 2007 The AuthorsJournal compilation © 2007 Blackwell Publishing Ltd
variation in DS. Significant positive associations were alsoobtained between latitude or rainfall and DS, while beha-viour of prey (migratory or nonmigratory) was significantlynegatively associated with genetic distance (Table 5).This negative association represents correlation to theimaginary (complex) dimensions of DS identified bynegative eigenvalues in the PCA (M.J. Anderson, personalcommunication).
When we grouped variables into sets, the spatial co-ordinates displayed the strongest relationship to DS, explain-ing 98.14% of the genetic distance (P = 0.0005, Table 5).However, tests for associations between predictors indi-cated that each spatial variable was strongly correlated,positively or negatively, to most of the other predictors inour matrix (Table 4b), implying that the high explanatorypower of the spatial variables is more complex than asimple causal increase in DS with geographical distance.The relatively low correlation between log distance and DSin Mantel tests supports this conclusion.
Discussion
Methodology of cluster identification
Two technical aspects of our structure analysis meritcomment. Default settings for the admixture model assumea uniform allele frequency distribution (λ = 1.0) and thatall clusters are equally admixed (Pritchard & Wen 2004).Under these assumptions, K = 18 was most probable forour wolves (data not shown). Fixing λ equal to the inferredvalue 0.4 (skewed allele frequencies), while allowing aunique level of admixture in each cluster, produced thefar more spatially coherent result (K = 7) discussed above.structure’s default settings may therefore be inappropriatefor other microsatellite data sets, and for other systemsincluding dispersal barriers of unequal permeability.
The program’s behaviour in the absence of genetic dis-continuity is also of interest. Increasing K for arctic foxesproduced small increases in probability and clusters with-out any real content: improvement through sequesteringof rare alleles, rather than divergent groups of individuals.Taken together, our results recommend cautious choice ofstructure parameters and careful assessment of outputs.Confirmation of results using geneland (Guillot et al.2005), baps (Corander & Marttinen 2006), or structurama(Huelsenbeck & Andolfatto submitted) may also be prudent.
Genetic variation of arctic canid species
Since all markers used in this study were originallydeveloped for domestic dogs (Canis lupus familiaris),ascertainment bias might be predicted to inflate variationobserved in wolves, relative to more distantly related arcticfoxes (Ellegren et al. 1997; Bardeleben et al. 2005). However,larger allele sizes (data not shown) and greater variation(Table 1) were observed in foxes, suggesting trends re-ported here result from divergent species and life-historycharacteristics, rather than from any significant methodo-logical constraints.
Table 4b Correlation among predictor variables used in distance-based redundancy analysis of Nei’s DS among wolf clusters. Variable setsare indicated in bold
Barrier
Spatial Prey Habitat
Latitude Longitude Behaviour Species Temperature Rain Vegetation
Barrier 1Latitude 0.5156 1Longitude –0.2068 –0.097 1Behaviour 0.6124 –0.0544 0.2056 1Species 0.5278 0.7424 –0.1747 0.068 1Temperature –0.2059 –0.8524 –0.2934 0.1393 –0.4712 1Rain 0.1137 –0.5771 –0.2625 0.214 –0.0516 0.8482 1Vegetation 0.7013 0.531 0.2656 0.6247 0.7332 –0.3735 –0.0262 1
Table 4a Principle coordinate analysis of Nei’s DS among wolfclusters. The large negative eigenvalue of axis 10 indicatesnonmetricity and implies complexity within the genetic distance
Variation explained (%)
Axis Individual Cumulative
1 112.99 112.992 14.18 127.183 9.21 136.394 2.35 138.745 0.01 138.756 0.00 138.757 –0.29 138.458 –1.43 137.029 –2.42 134.6010 –34.60 100.00
G E N E T I C S T R U C T U R E I N A R C T I C C A N I D S 3477
© 2007 The AuthorsJournal compilation © 2007 Blackwell Publishing Ltd
During the last glaciation, while wolves persisted insmall populations in a number of distinct refugia (Brewster& Fritts 1995), arctic foxes were widely distributed, andwould not have shared the bottlenecks experienced bywolves (Kurtén & Anderson 1980; Dalén et al. 2005). Inaddition, arctic foxes occur at higher density than wolves(Angerbjörn et al. 2004a; Mech & Boitani 2004), and likelypossess a higher effective population size. Whereas onlytwo wolves normally breed in a pack of six to eight indi-viduals (but see Mech & Boitani 2003), foxes form smallersocial groups, with a higher proportion of adults thusbreeding each generation (Macpherson 1969). Litter sizesin foxes are also greater (Moehlman 1989; Geffen et al. 1996).Given their respective species and life histories, it is un-surprising that arctic foxes in general possess more geneticvariation than wolves (Table 1).
Since arctic foxes can travel long distances over sea ice,it is also unsurprising that island and mainland fox popu-lations are equally variable (Table 1). More interesting isthe fact that foxes surveyed here appear more variablethan populations in Scandinavia (HE = 0.58–0.63, Dalénet al. 2006) and Greenland (HE = 0.54–0.73, Meinke et al.2001). Scandinavian foxes have endured recent, severe,and prolonged bottlenecks (Dalén et al. 2006; Nyström et al.2006). Lower variation in Greenland foxes is more difficult
to explain, but portions of the island’s coast are ice-freeyear round, perhaps impeding gene flow and acceleratingdrift-in-isolation (Dalén et al. 2005). Variation in NorthAmerican and Svalbard foxes seems similar to that inthe large Russian population (HE = 0.77, Dalén et al. 2006),suggesting high density, and higher gene flow, have beenmaintained in each area since the Pleistocene.
Wolves can also travel over sea ice, and it seems strangethat island wolf populations would have less variationthan island arctic foxes (Table 1). However, due to differ-ences in energetics and thus home range sizes, island wolfpopulations are likely to be smaller than those of foxes,resulting in elevated genetic drift. While both species areharvested, wolves, with longer generation times andsmaller litter sizes, may also be more sensitive to harvest-ing bottlenecks (Macpherson 1969; Mech & Boitani 2003).
Homogeneity of arctic fox populations
Mitochondrial DNA (mtDNA) haplotypes in arctic foxesdisplay little geographical partitioning, a pattern attri-buted to the inverse response of polar-adapted species toclimatic cycles: expanding during ice ages and contractinginto a single circumpolar population during interglacials(Dalén et al. 2005). With the exception of foxes in alpine
Table 5 Distance-based redundancy analysis of Nei’s DS among wolf clusters. We analysed individual variables (single predictors) alone,then sequentially to obtain a combined model. Analysis was then repeated, treating variables as predictor sets (Table 4b). Significant Pvalues can occur both below 0.05 and above 0.95, and are shown in bold. The column headed ‘% variation’ indicates the amount of variationin DS explained by a particular variable, with the ‘Cumulative’ column indicating the total variation explained by all fitted variables insequential tests. Explanatory power of greater than 100% results from nonmetricity in the DS matrix
Single predictors
Variable F P % Variation Cumulative
Marginal test Barrier –0.65 0.9273 –8.80Latitude 11.42 0.0115 58.80Longitude 3.83 0.1188 32.37Prey behaviour –0.56 0.9779 –7.49Prey species 0.24 0.6685 2.97Temperature 392.34 0.0001 98.00Rain 23.09 0.0017 74.27Vegetation 0.21 0.6477 2.54
Sequential test Temperature 392.34 0.0001 98.00 98.00Longitude –8.06 0.7760 15.17 113.18
Predictor sets
Variable F P % Variation Cumulative
Marginal test Barrier −0.65 0.9287 –8.80Spatial 185.06 0.0005 98.14Prey –0.12 0.8796 –3.46Habitat 5.15 0.0623 72.03
Sequential test Spatial 185.06 0.0005 98.14 98.14
3478 L . E . C A R M I C H A E L E T A L .
© 2007 The AuthorsJournal compilation © 2007 Blackwell Publishing Ltd
habitats and on sea ice-free islands like Iceland, worldwidearctic fox populations were therefore assumed to have beenphysically continuous since the Pleistocene. Microsatellitedata presented here support contemporary maintenanceof high levels of gene flow throughout a large portion ofthis contiguous range.
While geographical partitioning of mtDNA was notobserved, Dalén et al. (2005) detected some differentiationbetween worldwide fox populations of the coastal andlemming ecotypes. As our study area included only onecoastal population, Svalbard, we could not confirm thisfinding directly; however, the genetic affinity of Svalbardwith North America, and ear-tagging studies conductedin the Svalbard archipelago (Fuglei & Oritsland 2003),suggest gene flow between these spatially and ecologicallydistinct groups may still take place. Furthermore, whilefoxes inhabiting the coastlines of North America use marinefood resources, particularly when lemmings are at lowabundance (Roth 2002, 2003), no significant genetic differ-entiation was detected within the North American range ofthis species. It is therefore likely that, despite the largedistances and varying feeding ecologies represented here,no population sampled has experienced significant geneticisolation since initial colonization.
Demographic and historical factors may contribute togenetic homogeneity of contemporary arctic foxes, but theirlong-distance movements are likely also key. These move-ments may occur: in response to lemming populationdeclines (Audet et al. 2002; Dalén 2005); in coastal-dwellingfoxes that may follow polar bears long distances in searchof carrion; or in inland areas, among foxes scavenging onwolf-killed migratory caribou (J. Akat, personal communi-cation). In North America, these movements have beendocumented during both low and peak lemming years, andthus may be prompted by breeding as well as by foragingimperatives (Eberhardt & Hanson 1978). Regardless oftheir timing or motivation, they appear to result in geneflow over very large geographical areas.
Most of our fox samples were obtained from wintertrapping. If foxes were a truly migratory species, roamingover long distances during winter but returning each yearto breed in their natal areas, a study based on spring andsummer sampling might be expected to reveal greatergenetic structuring than found here. However, to our know-ledge, such behaviour has not been documented in arcticfoxes. Furthermore, juveniles and adults tagged in nataland breeding areas have been recaptured, the followingbreeding season, hundreds or thousands of kilometresaway (Eberhardt & Hanson 1978; Eberhardt et al. 1983). Weare therefore confident that the lack of structure observedin our study is not a product of our sampling scheme, buta true absence of differentiation. This is particularlysupported by the fact that the Karrak Lake population,which was sampled entirely during denning season, showed
no greater genetic differentiation than any other popula-tion included here (Table 2).
No fox populations were separated by FST above 0.02,and our pairwise values averaged 0.002 (data not shown).In contrast, pairwise FST ranged from 0.06 to 0.2 in Scandi-navian foxes (Dalén et al. 2006), while Meinke et al. (2001)observed values from 0.07 to 0.262 among coastal Green-land populations. Higher differentiation, like low variation,is expected among isolated Scandinavian populations.Greenland foxes are restricted to coastal regions (Meinkeet al. 2001), and if movement occurs only around theisland’s circumference, gene flow between populationsmay be restricted. Greater resource stability may alsoreduce the number of long distance movements made byGreenland foxes relative to North American ones.
The low level of genetic structure in our arctic fox popu-lations appears to be unique among canids studied to date.DS between wolf populations was higher than that amongfoxes in almost all cases (Table 2). Coyotes (Canis latrans)were once considered genetically homogeneous (Roy et al.1994), but recent work suggests the existence of previouslyundetected genetic subdivisions (Sacks et al. 2004). Thesmallest pairwise FST observed in red foxes was 0.009(Lade et al. 1996; Wandeler et al. 2003): low, but higher thanour average value of 0.002. A global value of 0.043 wasfound in kit foxes (Vulpes macrotis, Schwartz et al. 2005),and FST was 0.11 between Channel Island foxes (Urocyonlittoralis) separated by only 13 km (Roemer et al. 2001). TheChannel Island fox population has also diverged intoa unique species after a time since founding (by Urocyoncinereoargenteus) equivalent to that of Svalbard arctic foxes,which remain largely indistinguishable from those in NorthAmerica. While extreme, our results are however, con-sistent with the minimal social structure and larger littersizes observed in arctic foxes relative to other canid species(Moehlman 1989; Geffen et al. 1996).
Ecologically defined genetic structure of grey wolves
Since the Pleistocene distribution of arctic foxes is onelikely contributor to their contemporary structure, itis reasonable to expect the same for wolves. The fivemorphologically defined subspecies of North Americanwolves are thought to have resulted from populationspreviously isolated in distinct glacial refugia (Nowak 1995,2003), but their ranges do not correspond to the popula-tion boundaries detected here (Nowak 1995). Our micro-satellite signal thus appears to reflect predominantlycontemporary influences.
Dalén et al. (2005) found that the degree of genetic dif-ferentiation among arctic fox populations varied betweenecotypes; we observed similar patterns in wolves. Differ-entiation was lower among barren ground populationsthan territorial forest populations (Fig. 4a, b), consistent
G E N E T I C S T R U C T U R E I N A R C T I C C A N I D S 3479
© 2007 The AuthorsJournal compilation © 2007 Blackwell Publishing Ltd
with the extensive annual migrations that facilitate long-distance dispersal of tundra wolves (Walton et al. 2001),and with the high potential for gene flow when wolvesfollow distinct caribou herds into common winteringgrounds. In addition, despite separation by half thedistance, differentiation between wolves in the WesternBarrens (migratory tundra) and Western Woods (territorialforest) was equivalent to that among forest clusters,suggesting the differences between wooded and tundrahabitats, and between territorial and migratory life his-tories, discourage gene flow between wolf populations(Fig. 5a). Of these potential isolating factors, wolf lifehistory seems to dominate: boundaries of Bayesian-derived genetic clusters correspond to habitat transitionsas defined by migratory caribou ranges (Fig. 2).
We used dbRDA to identify aspects of habitat statis-tically correlated to the genetic discontinuities observed.The greatest single predictor of wolf genetic differentiationwas climate (minimum annual temperature, Table 5). How-ever, it is not clear if this result represents a causal linkbetween climate and gene flow (Geffen et al. 2004); indeed,it is difficult to imagine how temperature could directlyinfluence the amount or direction of genetic exchangebetween wolf populations. However, two correlates oftemperature, vegetation type (0.7332) and prey species(–0.4712, Table 4b) could direct the dispersal choices ofindividual wolves. Pilot et al. (2006) recently established acorrelation between frequency of red deer in wolf diet andstructure of European wolf populations; in our study,the behaviour of the dominant prey species in each area(resident or migratory) was significantly correlated to thecomplex vectors within wolf Ds (P = 0.9779, Table 5).
When we treated our predictor variables as sets, thespatial descriptors — latitude and longitude — explainedmore variation in DS than minimum temperature alone(Table 5). These coordinates have been used to signifygeographical distance between groups (Geffen et al. 2004;Pilot et al. 2006), but we are uncertain if they describe aparameter as directly relevant to the dispersal of wolves asthe distance in kilometres between regions, especially aslatitude and longitude seem to possess unequal predictivevalue (Table 5, Geffen et al. 2004; Pilot et al. 2006). As withclimate, we suggest that the high explanatory power ofthese spatial descriptors reflects a more complex, underlyingcausal process. This idea is supported by the observationthat latitude and longitude are correlated, positively ornegatively, to all variables describing the habitat andecology of wolves in our sampling regions (Table 4b).
Considered together, the outcomes of our Bayesianclustering, classical assignment, and dbRDA analysissupport the hypothesis that natal habitat-biased dispersaldrives genetic differentiation in wolves (Davis & Stamps2004; Geffen et al. 2004; Sacks et al. 2004; Pilot et al. 2006).For northern wolves, a familiar level of vegetation cover —
forest or tundra — could signify a suitable habitat, encour-aging dispersing wolves to remain within their natalhabitat type. Dispersers that settle in familiar areas mayalso increase their reproductive success via cultural mech-anisms, as hunting strategies specific to local prey wouldbe learned during tenure with their natal pack (Sacks et al.2005; Pilot et al. 2006). Here, learned behaviour is mostlikely to isolate forest from tundra wolves, which haveadapted their denning and territorial behaviour to copewith the large-scale seasonal movements of barren groundcaribou (Heard & Williams 1992; Walton et al. 2001). Preyspecialization as a barrier to gene flow has been suggestedby other authors (Carmichael et al. 2001; Musiani 2003;Geffen et al. 2004; Pilot et al. 2006), and has been used toexplain differences in skull morphology between wolfpopulations in other regions (Brewster & Fritts 1995).
In our study area, two additional processes may helpreinforce population boundaries established throughbiased dispersal. In the Western Arctic, wolves which crosshabitat types must also cross the human-populatedMackenzie Delta region, and increased mortality of thesedispersers, overlaid upon the change in habitat type, couldcreate a barrier more intractable to wolves than eitherinfluence alone (Carmichael et al. 2001; Blanco et al. 2005).It is possible that the marginally significant correlationbetween the barrier predictor and complex aspects ofgenetic distance between populations reflects this process(Table 5). In the Central Arctic, wolves from the EasternBarrens follow the southern winter migration of caribouinto the spatial range of the forest population. Sincetheir period of range overlap includes the wolf breed-ing season (Mech 2002), a high potential for admixtureexists. Significant cross-assignment between these clusters(Table 3, Fig. 5b) suggests some level of gene flow doesoccur, although it is likely overestimated in our data dueto winter sampling of wolves in this area. Regardless ofits precise degree, gene flow is not sufficient to preventdifferentiation between these forest and tundra wolves(Fig. 2b). Since pale pelage occurs at much higher frequencyin tundra than in forest wolves (Musiani 2003), assortativemating is one possible isolating mechanism. Finer-scaledgenetic or ecological studies of wolves in this region shouldbe most informative (M. Musiani, J.A. Leonard, H.D. Cluff,C.C. Gates, S. Mariani, P.C. Paquet, C. Vila & R. Wayne, inpreparation).
Conclusions
Arctic fox populations in North America and Svalbardappear to be genetically homogeneous, a uniformity likelymaintained through long-distance movements occurringin response to spatiotemporal changes in availability ofprey. Wolves exhibit biased dispersal, resulting in partfrom specialization on prey with divergent behaviours,
3480 L . E . C A R M I C H A E L E T A L .
© 2007 The AuthorsJournal compilation © 2007 Blackwell Publishing Ltd
and producing differentiated populations restricted toparticular habitats. While the contemporary genetic struc-tures we observe are dramatically different, both arisefrom the response of arctic carnivores to a shared ecologicalchallenge — the problem of acquiring adequate prey.
Differential responses to historical climate change arealso potential contributors to the genetic characteristics ofnorthern wolves and arctic foxes. While wolves are thoughtto have been isolated in multiple Pleistocene refugia, arcticfoxes enjoyed an extensive range expansion. During thecurrent interglacial, wolf populations have expanded andmerged, while foxes have retreated, following arcticecosystems toward the pole and avoiding intraguildcompetition with more temperate-adapted red foxes(Tannerfeldt et al. 2002; Dalén et al. 2004). As the arctic climatecontinues to warm and sea ice becomes scarcer, arctic foxesmay persist only in those isolated high arctic islands redfoxes cannot reach. The fox populations surveyed heremay then begin to resemble currently isolated populations(e.g. Iceland), with higher differentiation and lower geneticvariation (Dalen et al. 2005, 2006). Winter thaw–freezecycles associated with climatic warming may also nega-tively impact winter survival of lemmings, and thereforebreeding success of arctic foxes (Ims & Fuglei 2005;Killengreen et al. 2007); reduced sea ice could hamper foxes’ability to escape crashes in lemming population density.However, as long as migratory birds nest on the arcticislands (Samelius & Alisauskas 2000; Bêty et al. 2001), andcarrion from the marine ecosystem is available (Angerbjörnet al. 2004b; Goltsman et al. 2005), arctic foxes are likely topersist.
Predictions for wolves are more difficult to make, but asclimate change provokes a northward shift in the tree line(Grace et al. 2002), wolves may begin to den at higher lati-tudes (Heard & Williams 1992), increasing their access tocaribou calves during breeding season (Frame et al. 2004),and thus increasing pup survival (Fuller et al. 2003). How-ever, shifts in the distribution of vegetation and associatedprey species (Brotton & Wall 1997; Mech 2005) may alsoresult in further intermingling of wolf types and an even-tual loss of regional differentiation, at least in mainlandregions. It is likely that the forthcoming climatic changeswill have influences as dramatic as those of the Pleistoceneon the distribution and genetics of arctic canids, and indeed,of all arctic species.
Acknowledgements
Thanks to all those who contributed samples or facilitated theircollection: Alaska Raw Fur; D. Bewick and North AmericanFur Auctions; G. Jarrell and the University of Alaska Museum; P.Merchant; R. Mulders; P. Clarkson; D. St Pierre; R. Otto; G. Bihun;G. Samelius; D. Berezanski; G. Szor; I. Stirling; R. Brenneman; P.Hoekstra; the Governor of Svalbard; and numerous hunters and
trappers’ associations and wildlife officers across the NorthwestTerritories, Manitoba, Nunavut, and Svalbard. Special thanks toM.J. Anderson and G. Guillot for advice regarding distlm forwardand geneland; to B. Dust for sample collection assistance, com-putational support and memory allocation adjustments in struc-ture; to J. Bonneville for help with DNA extraction; to G. Carmichaeland T. Mørk for preparation of tissue samples for extraction; andto A. Carmichael for verification of wolf harvest dates. R. Popkooffered information of dietary habits of wolves in the Sahtu. Financialsupport was provided by the Natural Sciences and EngineeringResearch Council of Canada, the Alberta Ingenuity Fund, theKillam Foundation, the Government of Nunavut, the NorthernScientific Training Program, the Network of Centres of Excellenceof Canada ArcticNet, and the Polar Continental Shelf Project(PCSP/EPCP No. 015-07). The authors also appreciate thethorough and thoughtful comments made by G.A. Wilson,C.J. Kyle, S. Moore, R.K. Wayne, D. Coltman, and D. Hik on earlydrafts of the manuscript, as well as the advice of four anonymousreviewers.
References
Anderson MJ (2003a) distlm forward: a fortran computer programto calculate a distance-based multivariate analysis for a linear modelusing forward selection. URL: http://www.stat.auckland.ac.nz/~mja/Programs.htm. Auckland, New Zealand.
Anderson MJ (2003b) PCO: a fortran computer program forprincipal coordinate analysis. Auckland, New Zealand.
Angerbjörn A, Hersteinsson P, Tannerfeldt M (2004a) Arctic fox.In. Canids: Foxes, Wolves, Jackals and Dogs. Status Survey andConservation Action Plan (eds Sillero-Zubiri C, Hoffman M,MacDonald DW), pp. 117–123. IUCN/SSC Canid SpecialistGroup, Gland, Switzerland.
Angerbjörn A, Hersteinsson P, Tannerfeldt M (2004b) Arctic foxes:consequences of resource predictability in the arctic fox — twolife history strategies. In: Biology and Conservation of Wild Canids(eds MacDonald DW, Sillero-Zubiri C), pp. 163–172. OxfordUniversity Press, Oxford, UK.
Anthony RM (1997) Home ranges and movements of arctic fox(Alopex lagopus) in Western Alaska. Arctic, 50, 147–157.
Audet AM, Robbins CB, Larivière S (2002) Alopex lagopus. MammalianSpecies, 713, 1–10.
Ballard WB, Ayres LA, Krausman PR, Reed DJ, Fancy SG (1997)Ecology of wolves in relation to a migratory caribou herd innorthwest Alaska. Wildlife Monographs, 135, 1–47.
Bardeleben C, Moore RL, Wayne RK (2005) A molecular phylogenyof the Canidae based on six nuclear loci. Molecular Phylogeneticsand Evolution, 37, 815–831.
Bêty J, Gauthier G, Giroux JF, Korpimaki E (2001) Are goose nestingsuccess and lemming cycles linked? Interplay between nestdensity and predators. Oikos, 93, 388–400.
Blanco JC, Cortes Y, Virgos E (2005) Wolf response to two kinds ofbarriers in an agricultural habitat in Spain. Canadian Journal ofZoology, 83, 312–323.
Braestrup FW (1941) A Study on the Arctic Fox in Greenland. Medd,Greenland.
Brewster WG, Fritts SH (1995) Taxonomy and genetics of thegray wolf in western North America: a review. In: Ecology andConservation of Wolves in a Changing World (eds Carbyn LN,Fritts SH, Seip DR), pp. 353–374. Canadian CircumpolarInstitute, Edmonton, Canada.
G E N E T I C S T R U C T U R E I N A R C T I C C A N I D S 3481
© 2007 The AuthorsJournal compilation © 2007 Blackwell Publishing Ltd
Brotton J, Wall G (1997) Climate change and the Bathurst caribouherd in the Northwest Territories, Canada. Climatic Change, 35,35–52.
Carmichael LE, Nagy JA, Larter NC, Strobeck C (2001) Preyspecialization may influence patterns of gene flow in wolves ofthe Canadian Northwest. Molecular Ecology, 10, 2787–2798.
Casgrain P, Legendre P (2001) The r package for multivariateand spatial analysis (version 4.0). Universite de Montreal.Available from http://ProgicielR.webhop.org/ and http://www.bio.umontreal.ca/legendre/.
Corander J, Marttinen P (2006) Bayesian identification ofadmixture events using multilocus molecular markers.Molecular Ecology, 15, 2833–2843.
Dalén L (2005) Distribution and abundance of genetic variation in thearctic fox, PhD Thesis. Stockholm University, Stockholm, Sweden.
Dalén L, Elmhagen B, Angerbjorn A (2004) DNA analysis on foxfaeces and competition induced niche shifts. Molecular Ecology,13, 2389–2392.
Dalén L, Fuglei E, Hersteinsson P et al. (2005) Population historyand genetic structure of a circumpolar species: the arctic fox.Biological Journal of the Linnean Society, 84, 79–89.
Dalén L, Kvaløy K, Linnell DC et al. (2006) Population structure ina critically endangered arctic fox population: does geneticsmatter? Molecular Ecology, 15, 2809–2819.
Davis JM, Stamps JA (2004) The effect of natal experience onhabitat preferences. Trends in Ecology & Evolution, 19, 411–416.
Eberhardt LE, Hanson WC (1978) Long-distance movements ofarctic foxes tagged in northern Alaska. The Canadian Field Natu-ralist, 92, 386–389.
Eberhardt LE, Garrot RA, Hanson WC (1983) Winter movementsof arctic foxes, Alopex lagopus, in a petroleum development area.Canadian Field Naturalist, 97, 66–70.
Eide NE, Jepsen JU, Prestrud P (2004) Spatial organization ofreproductive arctic foxes Alopex lagopus: responses to changesin spatial and temporal availability of prey. Journal of AnimalEcology, 73, 1056–1068.
Ellegren H, Moore S, Robinson N et al. (1997) Microsatelliteevolution — a reciprocal study of repeat lengths at homologousloci in cattle and sheep. Molecular Biology and Evolution, 14, 854–860.
Environment Canada (2000) Canadian climate normal data. Govern-ment of Canada. URL: http://climate.weatheroffice.ec.gc.ca/climate_normals/index_e.html
Environmental Systems Research Institute (1999–2004) arcgis 9.0software, Redlands, California.
Faubet P, Waples RS, Gaggilotti OE (2007) Evaluation theperformance of a multilocus Bayesian method for the estimationof migration rates. Molecular Ecology. doi: 10.1111/j.1365-294X.2006.03218.x.
Felsenstein J (1985) Confidence limits on phylogenies: anapproach using the bootstrap. Evolution, 39, 783–791.
Felsenstein J (1995) PHYLIP (Phylogeny Inference Package) Version3.57c. University of Washington, Seattle, Washington.
Flagstad Ø, Walker CW, Vilà C et al. (2003) Two centuries of theScandinavian wolf population: patterns of genetic variabilityand migration during an era of dramatic decline. MolecularEcology, 12, 869–880.
Frame PF, Hik DS, Cluff HD, Paquet PC (2004) Long foragingmovement of a denning tundra wolf. Arctic, 57, 196–203.
Fredholm M, Wintero AK (1995) Variation of short tandem repeatswithin and between species belonging to the Canidae family.Mammalian Genome, 6, 11–18.
Fritts SH (1983) Record dispersal by a wolf from Minnesota.Journal of Mammalogy, 64, 166–167.
Fuglei E, Oritsland NA (2003) Energy cost of running in an arcticfox, Alopex lagopus. Canadian Field Naturalist, 117, 430–435.
Fuller TK, Mech LD, Cochrane JF (2003) Wolf population dynamics.In: Wolves: Behavior, Ecology, and Conservation (eds Mech LD,Boitani L), pp. 161–191. University of Chicago Press, Chicago.
Geffen E, Anderson MJ, Wayne RK (2004) Climate and habitatbarriers to dispersal in the highly mobile grey wolf. MolecularEcology, 13, 2481–2490.
Geffen E, Gompper ME, Gittleman JL et al. (1996) Size, life-historytraits, and social organization in the Canidae: a re-evaluation.The American Naturalist, 147, 140–160.
Goltsman M, Kruchenkova EP, Sergeev S, Johnson PJ, MacDonaldDW (2005) Effects of food availability on dispersal and cub sexratio in the Mednyi arctic fox. Behavioral Ecology and Sociobiology,59, 198–206.
Grace J, Berninger F, Nagy L (2002) Impact of climate change onthe tree line. Annals of Botany, 90, 537–544.
Guillot G, Estoup A, Mortier F, Cosso JF (2005) A spatial statisticalmodel for landscape genetics. Genetics, 170, 1261–1280.
Hall E (1989) People and Caribou in the Northwest Territories. Depart-ment of Renewable Resources, Government of the NorthwestTerritories, Yellowknife, Northwest Territories, Canada.
Hayes B, Baer A, Clarkson P (1997) The Ecology and Management ofWolves in the Porcupine Caribou Range. Government of Yukon,Canada.
Hayes RD, Baer AM, Wotschikowsky U, Harestad AS (2000) Killrate by wolves on moose in the Yukon. Canadian Journal of Zoo-logy, 78, 49–59.
Heard DC, Williams TM (1992) Distribution of wolf dens onmigratory caribou ranges in the Northwest Territories, Canada.Canadian Journal of Zoology, 70, 1504–1510.
Hersteinsson P, Macdonald DW (1992) Interspecific competitionand the geographical distribution of red and arctic foxes Vulpesvulpes and Alopex lagopus. Oikos, 64, 505–515.
Huelsenbeck JP, Andolfatto P (submitted) Inference of populationstructure under a Dirichlet process model. Genetics.
Huggard DJ (1993) Prey selectivity of wolves in Banff Nationalpark. I. Prey species. Canadian Journal of Zoology, 71, 130–139.
Ims RA, Fuglei E (2005) Trophic interaction cycles in tundra eco-systems and the impact of climate change. Bioscience, 55, 311–322.
IUCN/SSC (2004) Canids: foxes, wolves, jackals and dogs. Statussurvey and conservation action plan. In: Canids: Foxes, Wolves,Jackals and Dogs. Status Survey and Conservation Action Plan (edsSillero-Zubiri C, Hoffman M, MacDonald DW). IUCN/SSCCanid Specialist Group, Gland, Switzerland.
Killengreen ST, Ims RA, Yoccoz NG, Bråthen KA, Henden J-A,Schott T (2007) Structural characteristics of a low arctic tundraecosystem and the retreat of the arctic fox. Biological Conserva-tion, 135, 459–472.
Kohira M, Rexstad EA (1997) Diets of wolves, Canis lupus, inlogged and unlogged forests of southeastern Alaska. CanadianField Naturalist, 111, 429–435.
Kurtén B, Anderson E (1980) Pleistocene Mammals of North America.Columbia University Press, New York.
Kuyt E (1972) Food habits and ecology of wolves on barren-ground caribou range in the Northwest Territories. In: CanadianWildlife Service Report Series. Information Canada, Ottawa.
Kyle CJ, Johnson AR, Patterson BR et al. (2006) Genetic nature ofeastern wolves: past, present and future. Conservation Genetics,7, 273–287.
3482 L . E . C A R M I C H A E L E T A L .
© 2007 The AuthorsJournal compilation © 2007 Blackwell Publishing Ltd
Lade JA, Murray ND, Marks CA, Robinson NA (1996) Micro-satellite differentiation between Phillip Island and mainlandAustralian populations of the red fox Vulpes vulpes. MolecularEcology, 5, 81–87.
Larter NC, Sinclair ARE, Gates CC (1994) The response of pre-dators to an erupting bison, Bison bison athabascae, population.Canadian Field-Naturalist, 108, 318–327.
Laub J, Muller KR (2004) Feature discovery in non-metric pairwisedata. Journal of Machine Learning Research, 5, 801–818.
Leonard JA, Vila C, Wayne RK (2005) Legacy lost: genetic variabilityand population size of extirpated US grey wolves (Canis lupus).Molecular Ecology, 14, 9–17.
Macpherson AH (1969) The dynamics of Canadian arctic foxpopulations. In: Canadian Wildlife Service Report Series. Informa-tion Canada, Ottawa.
Mahoney SP, Virgl JA (2003) Habitat selection and demography ofa nonmigratory woodland caribou population in Newfound-land. Canadian Journal of Zoology, 81, 321–334.
Mantel N (1967) The detection of disease clustering and a gener-alized regression approach. Cancer Research, 27, 209–220.
McArdle BH, Anderson MJ (2001) Fitting multivariate models tocommunity data: a comment on distance-based redundancyanalysis. Ecology, 82, 290–297.
Mech LD (2002) Breeding season of wolves, Canis lupus, in relationto latitude. Canadian Field Naturalist, 116, 139–140.
Mech LD (2005) Decline and recovery of a high arctic wolf-preysystem. Arctic, 58, 305–307.
Mech LD, Boitani L (2003) Wolf social ecology. In: Wolves. Behavior,Ecology, and Conservation (eds Mech LD, Boitani L), pp. 1–34.University of Chicago Press, Chicago.
Mech LD, Boitani L (2004) Grey wolf. In: Canids: Foxes, Wolves,Jackals and Dogs. Status Survey and Conservation Action Plan (edsSillero-Zubiri C, Hoffman M, MacDonald DW), pp. 124–129.IUCN/SSC Canid Specialist Group, Gland, Switzerland.
Meinke PG, Kapel CMO, Arctander P (2001) Genetic differentia-tion of populations of Greenlandic arctic fox. Polar Research, 20,75–83.
Mellersh CS, Langston AA, Acland GM et al. (1997) A linkage mapof the canine genome. Genomics, 46, 326–336.
Moehlman PD (1989) Intraspecific variation in canid social systems.In: Carnivore Behavior, Ecology, and Evolution (ed. Gittleman JL),pp. 143–163. Cornell University Press, Ithaca, New York.
Musiani M (2003) Conservation biology and management of wolvesand wolf–human conflicts in western North America, PhD Thesis.University of Calgary, Calgary, Canada.
National Climatic Data Center (2000) Alaska climate normals. USDepartment of Commerce. URL: http://lwf.ncdc.noaa.gov/oa/climate/normals/usnormals.html
Nei M (1972) Genetic distance between populations. The AmericanNaturalist, 106, 283–292.
Nei M, Roychoudhury AK (1974) Sampling variances of heterozy-gosity and genetic distance. Genetics, 76, 379–390.
Nowak RM (1995) Another look at wolf taxonomy. In: Ecology andConservation of Wolves in a Changing World (eds Carbyn LN, FrittsSH, Seip DR), pp. 375–398. Canadian Circumpolar Institute,Edmonton, Canada.
Nowak RM (2003) Wolf evolution and taxonomy. In: Wolves:Behavior, Ecology, and Conservation (eds Mech LD, Boitani L),pp. 239–258. University of Chicago Press, Chicago.
Nyström V, Angerbjörn A, Dalén L (2006) Genetic consequencesof a demographic bottleneck in the Scandinavian arctic fox.Oikos, 114, 84–94.
Olsen B, MacDonald M, Zimmer A (2001) Co-management ofwoodland caribou in the Sahtu settlement area: workshop onresearch, traditional knowledge, conservation and cumulativeimpacts. Sahtu Renewable Resources Board, Tulita, NorthwestTerritories, Canada.
Ostrander EA, Sprague GF, Rine J (1993) Identification and char-acterization of dinucleotide repeat (CA)n markers for geneticmapping in dog. Genomics, 16, 207–213.
Paetkau D, Calvert W, Stirling I, Strobeck C (1995) Microsatelliteanalysis of population structure in Canadian polar bears.Molecular Ecology, 4, 347–354.
Park SDE (2001) Trypanotolerance in West African cattle and the popu-lation genetic effect of selection, PhD Thesis. University of Dublin.
Petit RJ, El Mousadik A, Pons O (1998) Identifying populationsfor conservation on the basis of genetic markers. ConservationBiology, 12, 844–855.
Pilot M, Jedrzejewski W, Branicki W et al. (2006) Ecological factorsinfluence population genetic structure of European greywolves. Molecular Ecology, 15, 4533–4553.
Pritchard JK, Stephens M, Donnelly P (2000) Inference of popu-lation structure using multilocus genotype data. Genetics, 155,945–959.
Pritchard JK, Wen W (2004) Documentation for structure Software(version 2, p. Structure). Department of Human Genetics,University of Chicago, Chicago.
Pulliainen E (1965) On the distribution and migrations of the arcticfox (Alopex lagopus) in Finland. Aquilo Serie Zoologica, 2, 25–40.
Raufaste N, Rousset F (2001) Are partial Mantel tests adequate?Evolution, 55, 1703–1705.
Raymond M, Rousset F (1995) genepop (version 1.2). Population-genetics software for exact tests and ecumenicism. Journal ofHeredity, 86, 248–249.
Roemer GW, Smith DA, Garcelon DK, Wayne RK (2001) Thebehavioral ecology of the island fox (Urocyon littoralis). Journal ofZoology, 255, 1–14.
Roth JD (2002) Temporal variability in arctic fox diet as reflectedin stable-carbon isotopes; the importance of sea ice. Oecologia,133, 70–77.
Roth JD (2003) Variability in marine resources affects arctic foxpopulation dynamics. Journal of Animal Ecology, 72, 668–676.
Roy MS, Geffen E, Smith D, Ostrander EA, Wayne RK (1994)Patterns of differentiation and hybridization in North Americanwolf-like canids, revealed by analysis of microsatellite loci.Molecular Biology and Evolution, 11, 553–570.
Sacks BN, Brown SK, Ernest HB (2004) Population structureof California coyotes corresponds to habitat-specific breaksand illuminates species history. Molecular Ecology, 13, 1265–1275.
Sacks BN, Mitchell BR, Williams CL, Ernest HB (2005) Coyotemovements and social structure along a cryptic populationgenetic subdivision. Molecular Ecology, 14, 1241–1249.
Saitou N, Nei M (1987) The neighbor-joining method: a newmethod for reconstructing phylogenetic trees. Molecular Biologyand Evolution, 4, 406–425.
Samelius G, Alisauskas RT (2000) Foraging patterns of arctic foxesat a large arctic goose colony. Arctic, 53, 279–288.
Schaefer JA, Veitch AM, Harrington FH et al. (1999) Demographyof decline of the Red Wine Mountains caribou herd. Journal ofWildlife Management, 63, 580–587.
Schwartz MK, Ralls K, Williams DF et al. (2005) Gene flow amongSan Joaquin kit fox populations in a severely changed ecosystem.Conservation Genetics, 6, 25–37.
G E N E T I C S T R U C T U R E I N A R C T I C C A N I D S 3483
© 2007 The AuthorsJournal compilation © 2007 Blackwell Publishing Ltd
Smouse PE, Long JC, Sokal RR (1986) Multiple regression and cor-relation extensions of the Mantel test of matrix correspondence.Systematic Zoology, 35, 627–632.
Sokal RR, Rohlf FJ (1995) Biometry: the Principles and Practice ofStatistics in Biology Research, 3rd edn. W.H. Freeman, New York.
Spaulding RL, Krausman PR, Ballard WB (1998) Summer diet ofgray wolves, Canis lupus, in northwestern Alaska. Canadian FieldNaturalist, 112, 262–266.
Stenhouse GB, Latour PB, Kutny L, Maclean N, Glover G (1995)Productivity, survival, and movements of female moose in alow-density population, Northwest Territories, Canada. Arctic,48, 57–62.
Tannerfeldt M, Elmhagen B, Angerbjorn A (2002) Exclusion byinterference competition? The relationship between red andarctic foxes. Oecologia, 132, 213–220.
Titterington DM, Murray GD, Murray LS et al. (1981) Comparisonof discrimination techniques applied to a complex data set ofhead injured patients. Journal of the Royal Statistical Society. SeriesA, Statistics in Society, 144, 145–175.
Urton EJM, Hobson KA (2005) Intrapopulation variation in graywolf isotope (delta N-15 and delta C-13) profiles: implicationsfor the ecology of individuals. Oecologia, 145, 317–326.
Vilà C, Amorim R, Leonard JA et al. (1999) Mitochondrial DNAphylogeography and population history of the grey wolf Canislupus. Molecular Ecology, 8, 2089–2103.
Walton LR, Cluff HD, Paquet PC, Ramsay MA (2001) Movementpatterns of barren-ground wolves in the central CanadianArctic. Journal of Mammalogy, 82, 867–876.
Wandeler P, Funk M, Largiadèr CR, Gloor S, Breitenmoser U (2003)The city-fox phenomenon: genetic consequences of a recentcolonization of urban habitat. Molecular Ecology, 12, 647–656.
Wrigley RE, Hatch DRM (1976) Arctic fox migrations in Manitoba.Arctic, 29, 147–158.
Zittlau KA (2004) Population Genetic Analyses of North AmericanCaribou (Rangifer tarandus), PhD Thesis. University of Alberta,Canada.
This work forms part of L.E. Carmichael’s PhD thesis on ecologicalgenetics of wolves and arctic foxes, conducted under the super-vision of C. Strobeck. J. Krizan, J.A. Nagy, E. Fuglei, M. Dumond,D. Johnson, A. Veitch, and D. Berteaux are biologists pursuing avariety of polar research programs in Svalbard and the CanadianNorth.
Supplementary material
The following supplementary material is available for this article:
Figure S1 Grey wolf samples grouped into geographical regions.
Figure S2 Summary of structure analysis in arctic foxes andgrey wolves
Table S1 Samples obtained from the University of AlaskaMuseum tissue collection.
Table S2 Individual, sampling location, geographical region,final genetic cluster, and Bayesian cluster assignments are shownfor all wolf samples included in this study.
This material is available as part of the online article from:http://www.blackwell-synergy.com/doi/abs/10.1111/j.1365-294X.2007.03381.x(This link will take you to the article abstract).
Please note: Blackwell Publishing are not responsible for thecontent or functionality of any supplementary materials suppliedby the authors. Any queries (other than missing material) shouldbe directed to the corresponding author for the article.
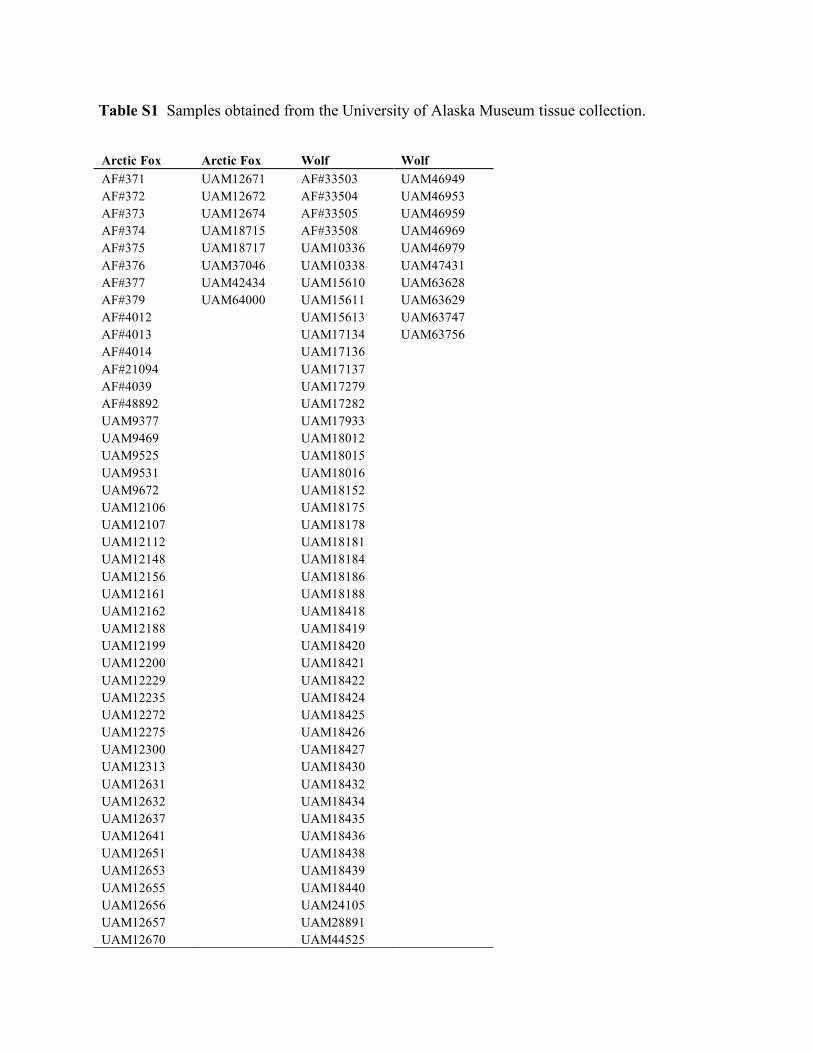
Arctic Fox Arctic Fox Wolf Wolf AF#371 UAM12671 AF#33503 UAM46949 AF#372 UAM12672 AF#33504 UAM46953 AF#373 UAM12674 AF#33505 UAM46959 AF#374 UAM18715 AF#33508 UAM46969 AF#375 UAM18717 UAM10336 UAM46979 AF#376 UAM37046 UAM10338 UAM47431 AF#377 UAM42434 UAM15610 UAM63628 AF#379 UAM64000 UAM15611 UAM63629 AF#4012 UAM15613 UAM63747 AF#4013 UAM17134 UAM63756 AF#4014 UAM17136 AF#21094 UAM17137 AF#4039 UAM17279 AF#48892 UAM17282 UAM9377 UAM17933 UAM9469 UAM18012 UAM9525 UAM18015 UAM9531 UAM18016 UAM9672 UAM18152 UAM12106 UAM18175 UAM12107 UAM18178 UAM12112 UAM18181 UAM12148 UAM18184 UAM12156 UAM18186 UAM12161 UAM18188 UAM12162 UAM18418 UAM12188 UAM18419 UAM12199 UAM18420 UAM12200 UAM18421 UAM12229 UAM18422 UAM12235 UAM18424 UAM12272 UAM18425 UAM12275 UAM18426 UAM12300 UAM18427 UAM12313 UAM18430 UAM12631 UAM18432 UAM12632 UAM18434 UAM12637 UAM18435 UAM12641 UAM18436 UAM12651 UAM18438 UAM12653 UAM18439 UAM12655 UAM18440 UAM12656 UAM24105 UAM12657 UAM28891 UAM12670 UAM44525
Table S1 Samples obtained from the University of Alaska Museum tissue collection.
