historical research and existing data esp 178 s. handy 2/27/07
TRANSCRIPT

Historical Research and Existing Data
ESP 178
S. Handy
2/27/07

Cross-Sectional Longitudinal
Single Case Historical events research
Historical process research
Multiple Cases
Cross-sectional comparative research
Comparative historical research

Examples
• Qualitative historical research:– TxDOT Highway Bypasses Study
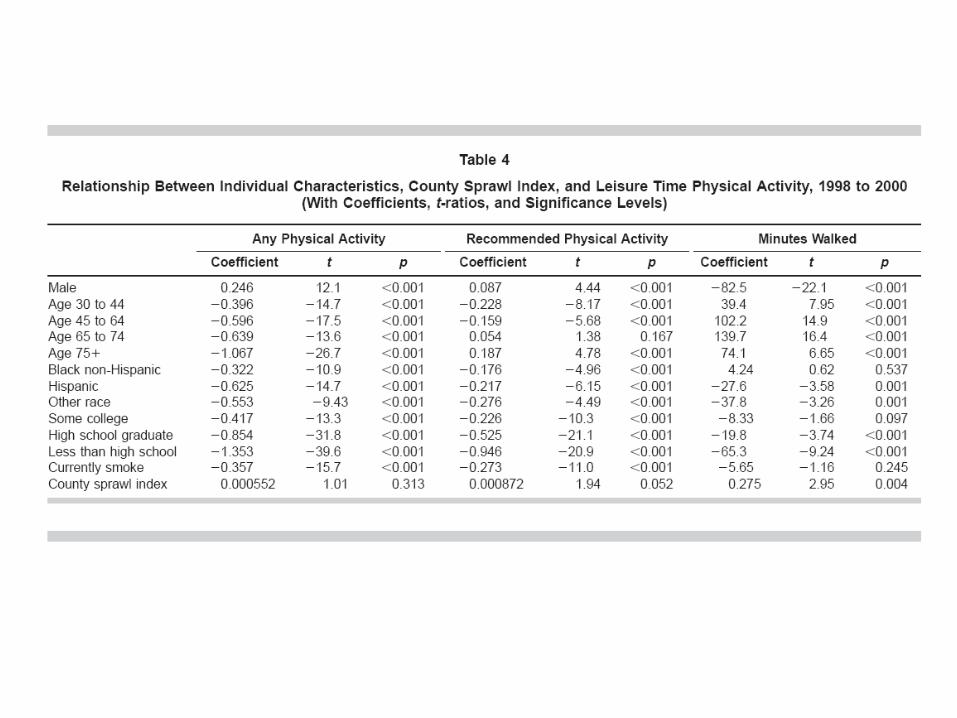
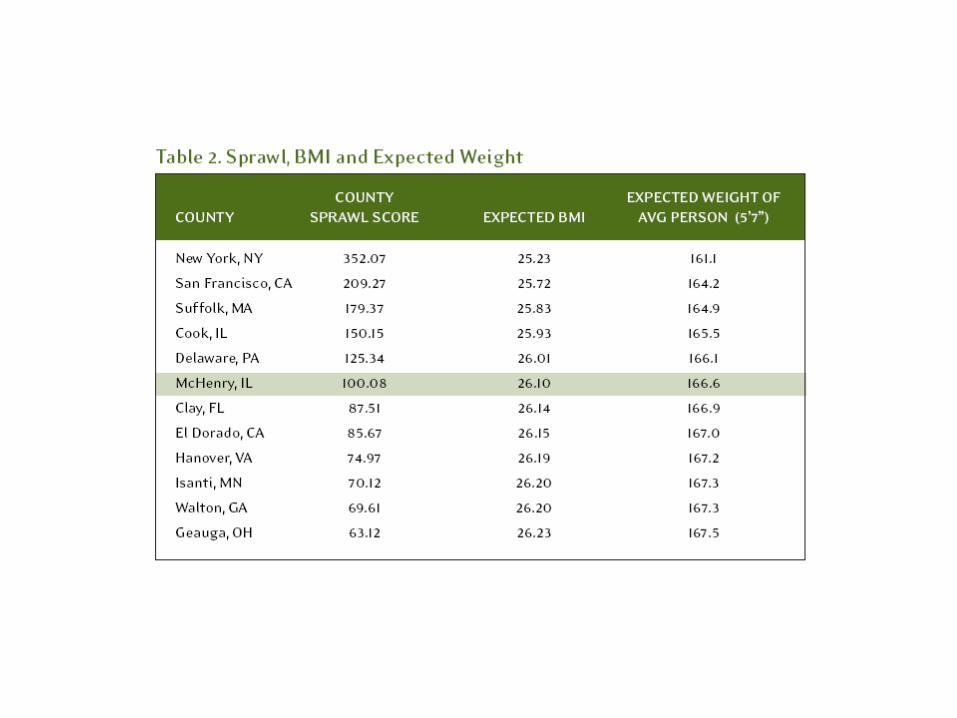
• Quantitative comparative research:– Portland State bicycle study– Sprawl and obesity study

The Economic Impacts of Highway Relief Routes on
Small Towns in Texas
1999-2001 project for the Texas Department of Transportation

Figure 3-10. Map of Fort Stockton Highways
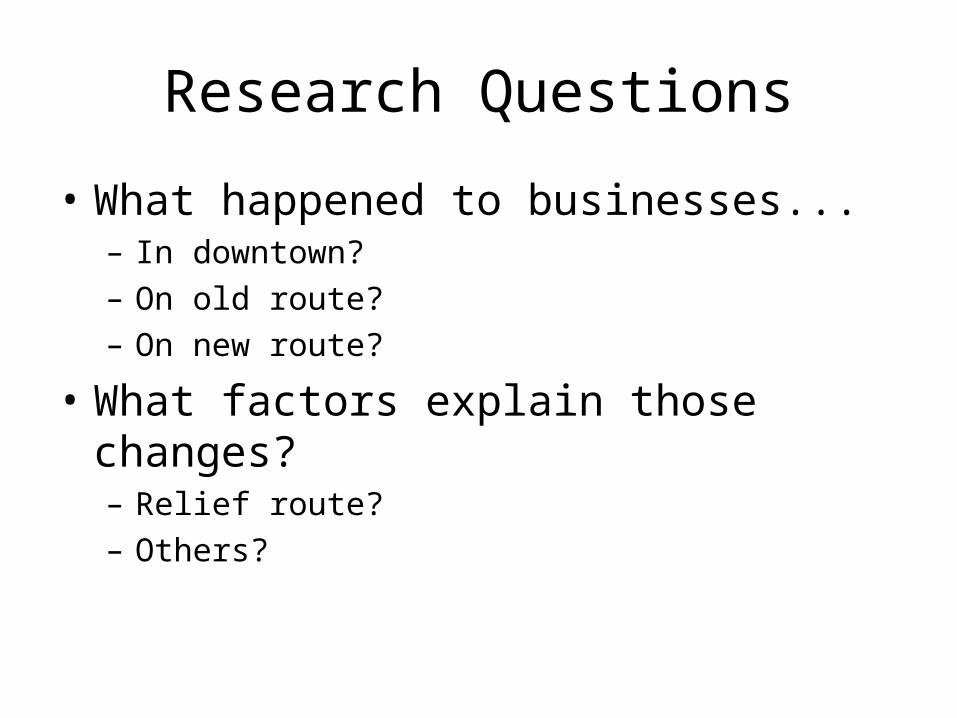
Research Questions
• What happened to businesses...– In downtown?– On old route?– On new route?
• What factors explain those changes?– Relief route?– Others?

Figure 2-1. Location of Case Study Communities
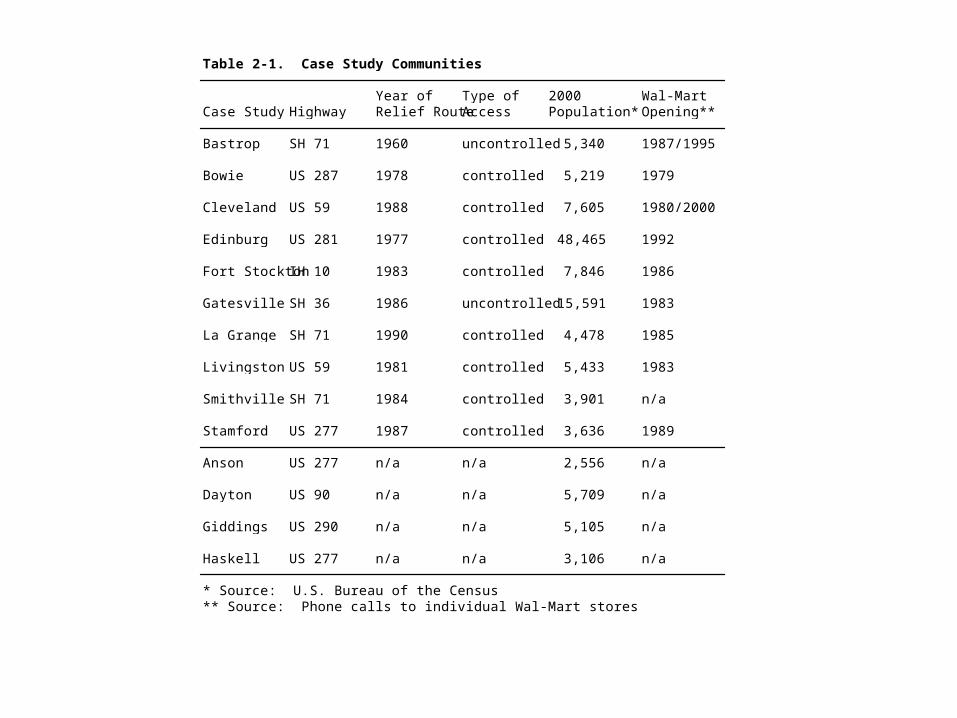
Table 2-1. Case Study Communities
Year of Type of 2000 Wal-MartCase Study Highway Relief Route Access Population* Opening**
Bastrop SH 71 1960 uncontrolled 5,340 1987/1995
Bowie US 287 1978 controlled 5,219 1979
Cleveland US 59 1988 controlled 7,605 1980/2000
Edinburg US 281 1977 controlled 48,465 1992
Fort Stockton IH 10 1983 controlled 7,846 1986
Gatesville SH 36 1986 uncontrolled 15,591 1983
La Grange SH 71 1990 controlled 4,478 1985
Livingston US 59 1981 controlled 5,433 1983
Smithville SH 71 1984 controlled 3,901 n/a
Stamford US 277 1987 controlled 3,636 1989
Anson US 277 n/a n/a 2,556 n/a
Dayton US 90 n/a n/a 5,709 n/a
Giddings US 290 n/a n/a 5,105 n/a
Haskell US 277 n/a n/a 3,106 n/a
* Source: U.S. Bureau of the Census** Source: Phone calls to individual Wal-Mart stores

• Socio-demographic, geographic and economic data
• Site visit:– Interviews – Observations– Photographs
• Follow-up interviews
Data Collection
Business ownersCity officialsCommunity leadersTxDOT officials

0
2,000
4,000
6,000
8,000
10,000
12,000
14,000
16,000
Pecos Co. Fort Stockton
Figure 3-9. Population of FORT STOCKTON AND PECOS COUNTY, 1900-1990

Table 5-2. Traffic Volumes on Original Route and Relief Route
Original Route Relief Route
Change Change Changefrom from from
Case Study Before After Before 1996 Before Opening 1996 Opening
Bastrop 2,050 700 -66% 3,400 66% 3,070 14,300 366%
Bowie 6,370 2,380 -63% 2,600 -59% 6,090 13,200 117%
Cleveland 19,200 4,700 -76% 4,800 -75% 16,400 22,000 34%
Edinburg 7,420 7,640 3% 6,300 -15% 1,660 3,600 117%
Fort Stockton 4,000 1,700 -58% 3,000 -25% 3,100 4,500 45%
Gatesville 5,100 3,000 -41% 3,700 -27% 2,300 4,700 104%
La Grange 3,700 3,400 -8% 3,900 5% 2,400 8,000 233%
Livingston 14,420 4,700 -67% 3,500 -76% 8,300 16,500 99%
Smithville 7,000 2,100 -70% 1,300 -81% 7,200 7,700 7%
Stamford 2,900 2,600 -10% 3,200 10% 2,800 6,100 118%
1970 1996 Change
Anson 5,600 10,600 89%
Dayton 9,090 21,000 131%
Giddings 3,410 19,400 469%
Haskell 2,310 4,700 103%
Source: TxDOT District Traffic Maps
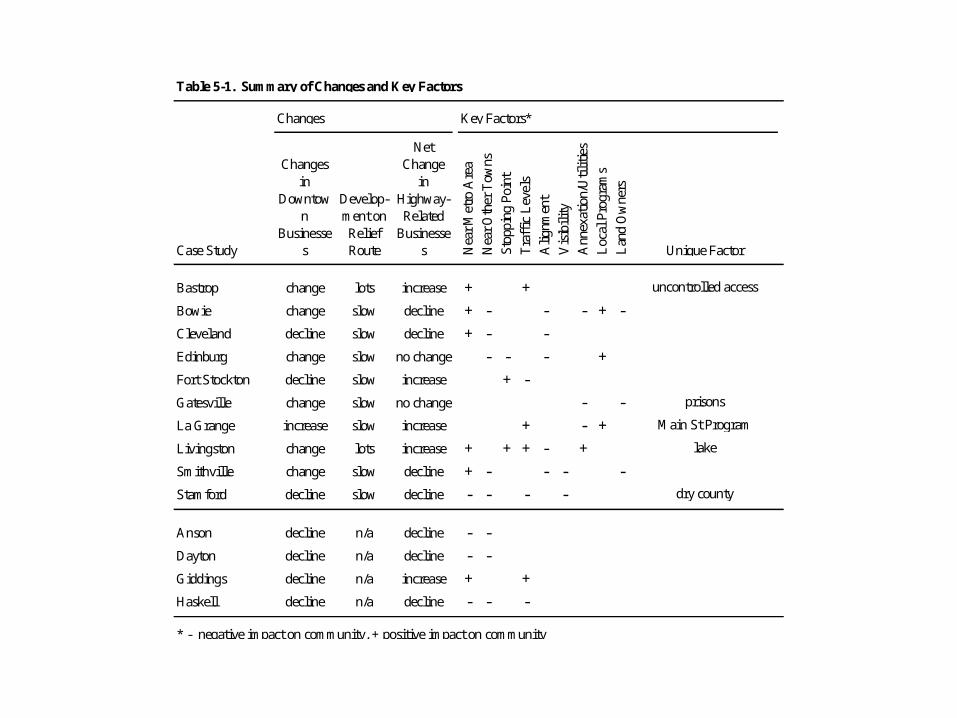
Table 5-1. Summary of Changes and Key Factors
Changes Key Factors*
Case Study
Changes in
Downtown
Businesses
Develop-ment on Relief Route
Net Change
in Highway-Related
Businesses N
ear
Met
ro A
rea
Nea
r O
ther
Tow
ns
Stop
ping
Poi
nt
Tra
ffic
Lev
els
Ali
gnm
ent
Vis
ibil
ity
Ann
exat
ion/
Uti
liti
es
Loc
al P
rogr
ams
Lan
d O
wne
rs
Unique Factor
Bastrop change lots increase + + uncontrolled access
Bowie change slow decline + - - - + -
Cleveland decline slow decline + - -
Edinburg change slow no change - - - +
Fort Stockton decline slow increase + -
Gatesville change slow no change - - prisons
La Grange increase slow increase + - + Main St Program
Livingston change lots increase + + + - + lake
Smithville change slow decline + - - - -
Stamford decline slow decline - - - - dry county
Anson decline n/a decline - -
Dayton decline n/a decline - -
Giddings decline n/a increase + +
Haskell decline n/a decline - - -
* - negative impact on community, + positive impact on community

Quantitative Comparative Research

Source: Dill and Carr 2003

Source: Dill and Carr 2003

Source: Dill and Carr 2003


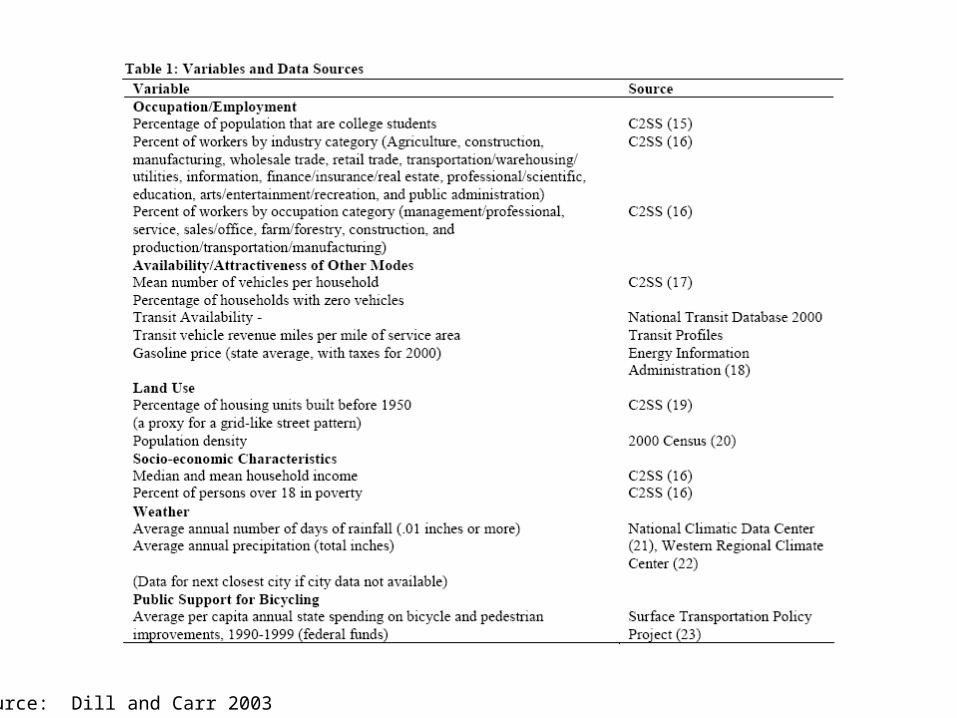
Data Sources

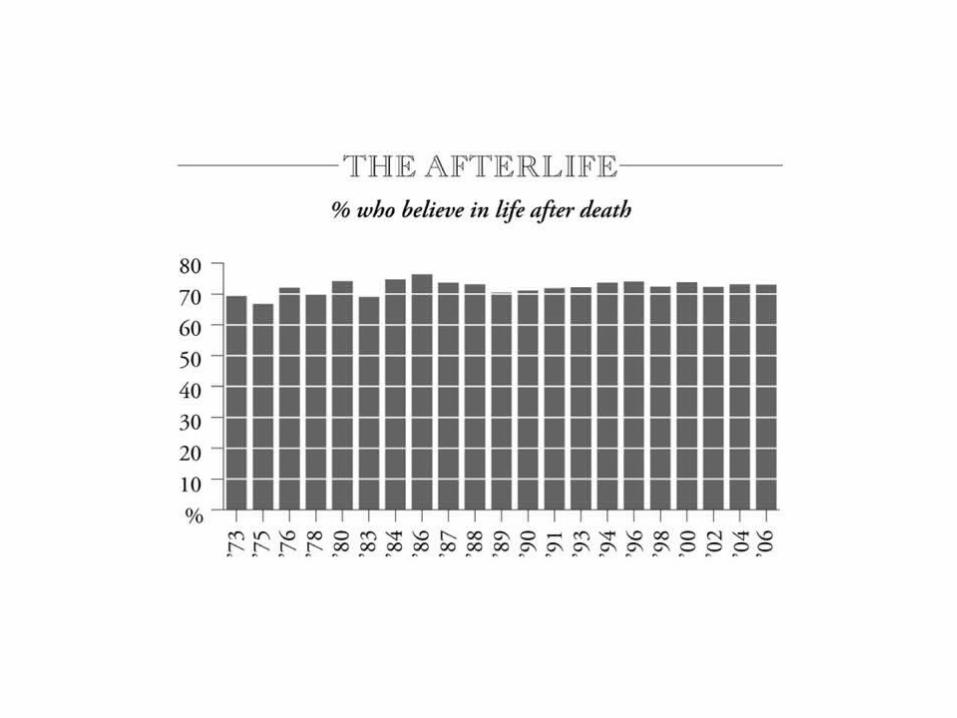
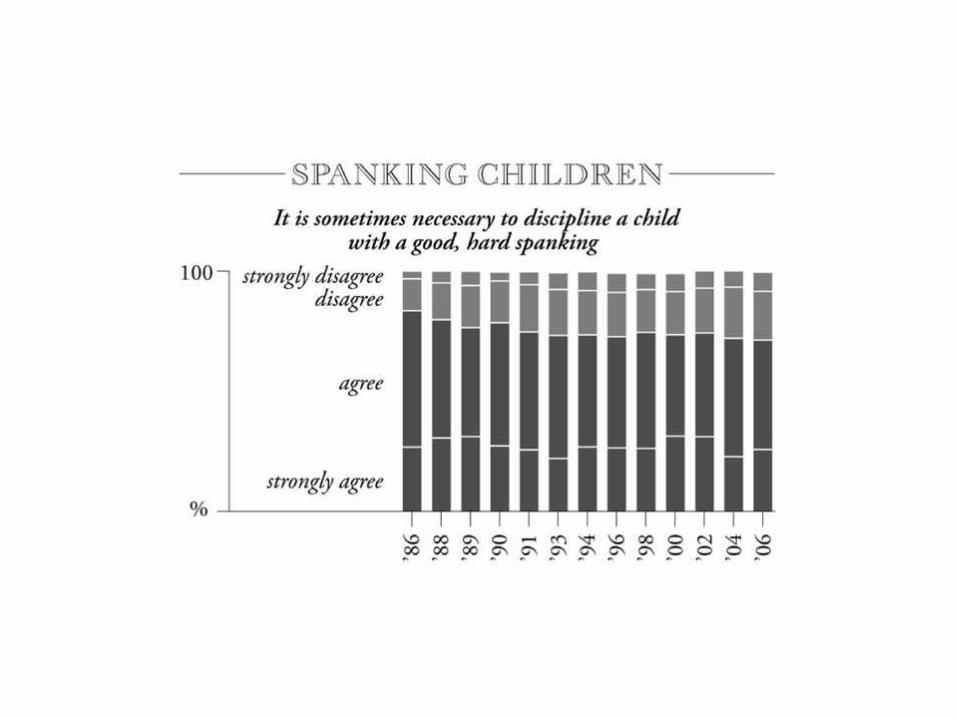
National Surveys
• US Census: http://www.census.gov/main/www/cen2000.html
• American Time Use Survey, BLS: http://www.bls.gov/tus/home.htm
• General Social Survey: http://www.norc.uchicago.edu/projects/gensoc.asp

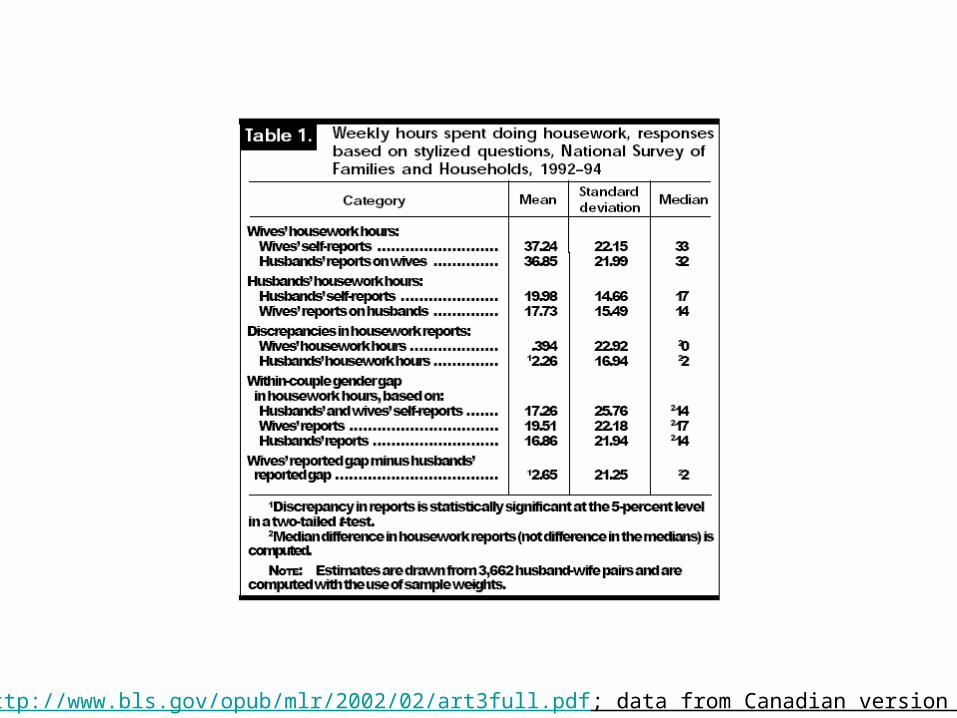
Source: http://www.bls.gov/opub/mlr/2002/02/art3full.pdf; data from Canadian version of ATUS

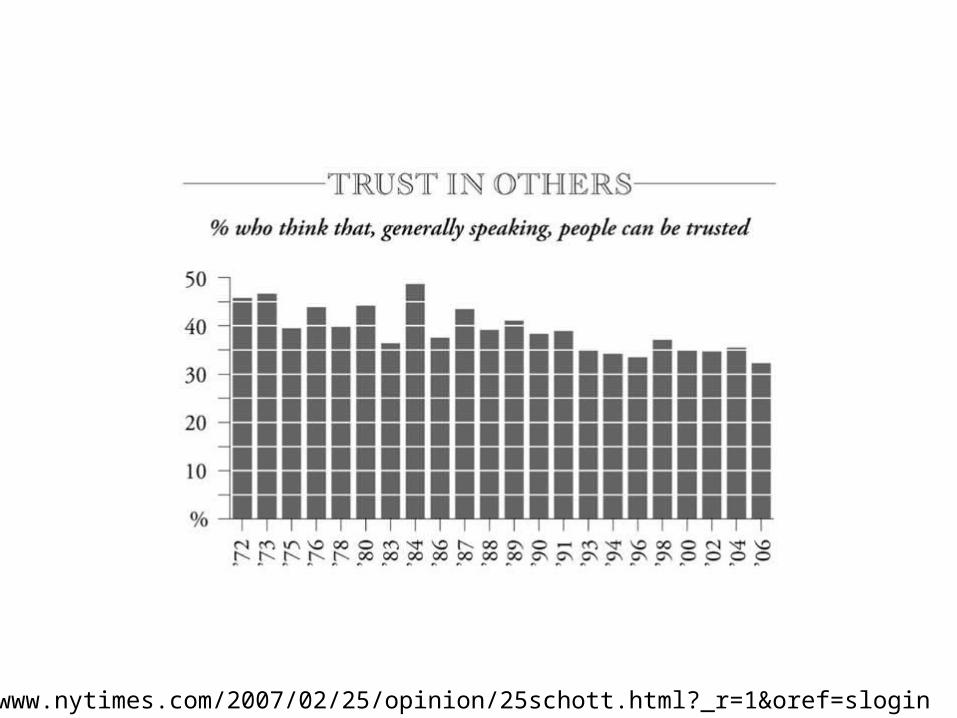
http://www.nytimes.com/2007/02/25/opinion/25schott.html?_r=1&oref=slogin


Uses of Census and Other Data
• As a source of descriptive statistics at the start of a research project.
• As a way of identifying appropriate communities to use as a part of a sampling plan.
• As a basis for assessing how well your sample matches the target population.


Figure 1. Vehicle Miles Traveled per Person in US, 1936-2003
-
2,000
4,000
6,000
8,000
10,000
12,000
1936
1940
1944
1948
1952
1956
1960
1964
1968
1972
1976
1980
1984
1988
1992
1996
2000

Figure 2. Capital Outlays for Highways in US, 1956-2000
$0
$10
$20
$30
$40
$50
$60
$70
1956
1959
1962
1965
1968
1971
1974
1977
1980
1983
1986
1989
1992
1995
1998
Mill
ion
s o
f Co
nst
an
t 20
00
Do
llars


Figure 1. Percent Biking to Work
0%
5%
10%
15%
20%
25%
Isla
Vista (
UCSB)
DAVIS
Boulde
r, CO
Palo A
lto
Berke
ley
Eugen
e, O
R
Santa
Cru
z
San L
uis O
bispo
Santa
Barb
ara
Mad
ison,
WI
Tusco
n, AZ
Ithac
a, NY
Irvin
e
From UCTC proposal

Table 1. Socio-Economic Characteristics: Sacramento Region vs. California and U.S.
United States California
Sacramento--Yolo, CA
CMSA
Population 281,421,906 33,871,648 1,796,857
Percent Hispanic or Latino 12.5% 32.4% 15.5%Percent Black or African American alone 12.3% 6.7% 7.1%Percent Asian alone 3.6% 10.9% 9.0%
Percent English-speaking households 81.1% 62.2% 77.2%Percent Spanish-speaking households 10.2% 22.4% 10.7%Percent Asian language-speaking households 2.6% 8.6% 5.9%Linguistically isolated households 4.1% 9.6% 5.0%Percent foreign born 12.4% 35.4% 16.9%
Percent of population under 18 years 25.7% 27.3% 27.1%Percent of population under 5 years 6.8% 7.3% 6.9%Median age 35.3 33.3 34.6
Average Household size 2.59 2.87 2.65Percent of families with children under 18 48.8% 52.7% 51.5%Percent of families with children under 6 21.3% 24.2% 22.9%
Median household income in 1999 41,994$ 47,493$ 46,106$ Percent of population with income in 1999 below poverty level 12.4% 14.2% 12.7%Percent of children under 18 with income in 1999 below poverty level 16.2% 19.0% 16.9%
Percent with college degree or higher 30.7% 33.7% 35.3%
Percent of workers who walk, bike, use transit 8.0% 8.8% 6.3%
Percent of housing units built 1950 or later 77.7% 82.9% 89.6%Percent of housing units built 1970 or later 51.3% 50.6% 62.5%
Source: Census 2000 Summary File 1 (SF 1) and Summary File 3 (SF 3)
From ALR cul-de-sacs proposal
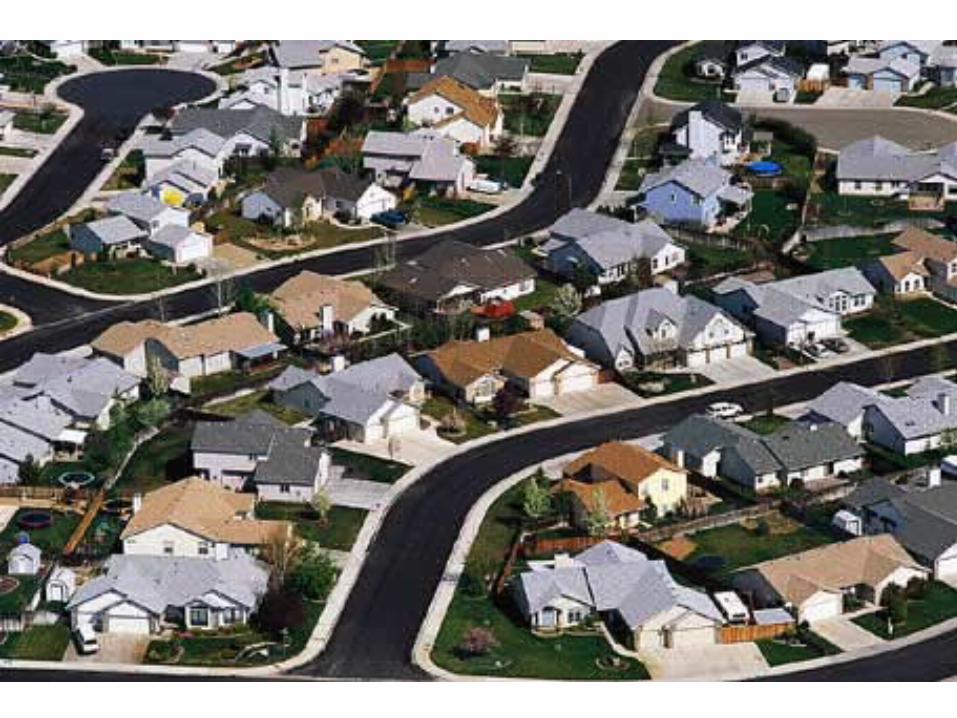

Table 3-4. Selection of Neighborhoods
Traditional Neighborhood Suburban Neighborhood
Silicon Valley - Mountain View Silicon Valley -Sunnyvale
Sacramento - Midtown Sacramento - Natomas
Santa Rosa - Junior College Santa Rosa - Rincon Valley
Modesto - Central Modesto - Suburban
Large Metro Area
Small City
From Caltrans study

Table 3-5. Respondent Characteristics vs. Census Characteristics
Traditional Suburban
Sili
con
Val
ley
- M
ount
ain
Vie
w
San
ta R
osa
- Ju
nior
Col
lege
Mod
esto
-C
entr
al
Sac
ram
ento
-
Mid
tow
n
Sili
con
Val
ley
- S
unny
vale
San
ta R
osa
- R
inco
n V
alle
y
Mod
esto
-
Sub
urba
n
Sac
ram
ento
-
Nat
omas
Number 228 215 184 271 217 165 220 182
Percent female 47.3 54.3 56.3 58.2 46.9 50.9 50.9 54.9
Average auto ownership 1.80 1.63 1.59 1.50 1.79 1.66 1.88 1.68
Average age 43.3 47.0 51.3 43.4 47.1 54.7 53.2 45.6
Average HH size 2.08 2.03 2.13 1.78 2.58 2.19 2.41 2.35
Percent of HHs w/kids 21.1 18.6 21.7 8.9 42.4 24.8 25.5 31.9
Average number of kids 1.60 1.58 1.83 1.58 1.65 1.59 1.98 1.64
Percent home owner 51.1 57.8 75.6 47.0 61.1 68.7 81.0 82.4
Median HH income (k$) 74.3 40.2 42.5 43.8 88.4 49.6 40.2 46.2
Population 5,493 9,886 13,295 7,259 14,973 13,617 19,045 13,295
Average age 36.1 36.3 36.5 42.7 35.9 38.3 38.1 31.7
Average HH size 2.08 2.21 2.46 1.79 2.66 2.48 2.51 2.57
Percent of HHs w/kids 19.3 20.3 32.9 12.4 35.3 35.4 34.2 41.7
Percent home owner 34.3 31.2 58.8 34.3 53.2 63.5 61.4 55.2
Median HH income (k$) 75.1 41.6 43.8 47.5 92.3 51.1 42.1 46.2
Percent of units built after 1960 54.3 37.2 21.4 22.7 79.9 90.3 94.6 90.2
Respondent Characteristics
Census Characteristics
From Caltrans study

Environmental Justice Analysis

“Environmental Justice is the fair treatment and meaningful involvement of all people regardless of race, color, national origin, or income with respect to the development, implementation, and enforcement of environmental laws, regulations, and policies.
Fair treatment means that no group of people, including a racial, ethnic, or a socioeconomic group, should bear a disproportionate share of the negative environmental consequences resulting from industrial, municipal, and commercial operations or the execution of federal, state, local, and tribal programs and policies.
Meaningful involvement means that: (1) potentially affected community residents have an appropriate opportunity to participate in decisions about a proposed activity that will affect their environment and/or health; (2) the public's contribution can influence the regulatory agency's decision; (3) the concerns of all participants involved will be considered in the decision making process; and (4) the decision makers seek out and facilitate the involvement of those potentially affected.”
Source: http://www.epa.gov/compliance/environmentaljustice/
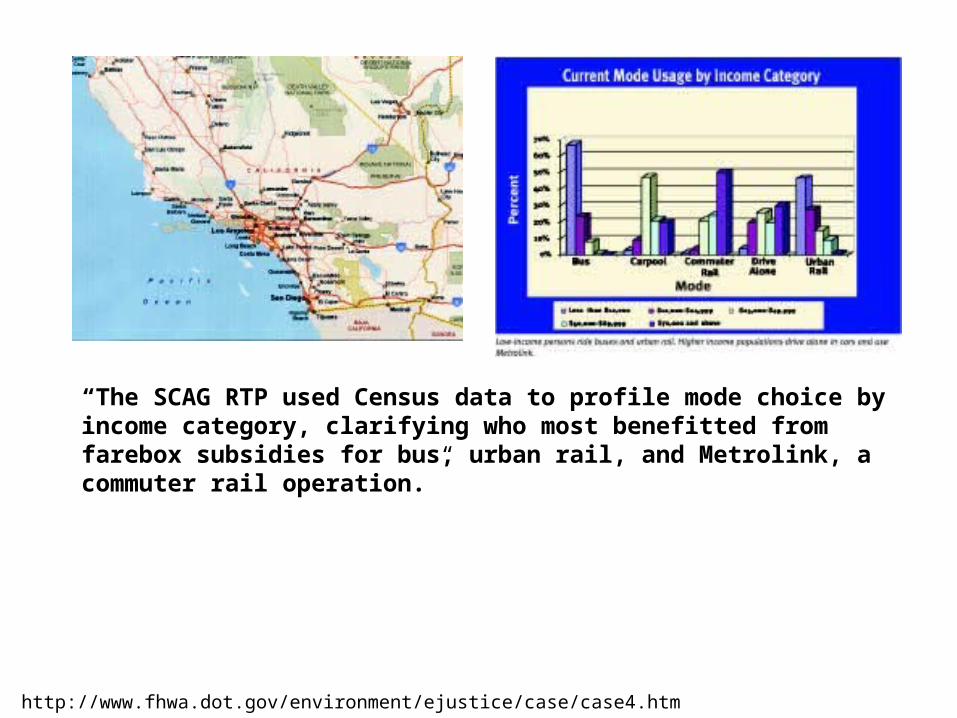
“The SCAG RTP used Census data to profile mode choice by income category, clarifying who most benefitted from farebox subsidies for bus, urban rail, and Metrolink, a commuter rail operation.”
Source: http://www.fhwa.dot.gov/environment/ejustice/case/case4.htm

Table 1-4. Population Characteristics in Monitor Area 1 vs. Region2- 2000
Exceed-
ances Monitor Region Monitor Region Monitor Region Monitor Region Monitor City3
ID 1995+ Area Area Area Area AreaLynwood - Long Beach Blvd. 06-037-1301 71 65.3 51.3 87.0 44.6 7,739 20,683 12.7 14.6 17,827 14,389 Calexico - 129 Ethel Street 06-025-0005 64 51.0 50.6 93.9 72.2 10,193 13,239 16.0 10.3 5,441 4,353 Fairbanks - Cushman 02-090-0002 18 31.2 22.2 4.8 4.2 20,921 21,553 32.6 10.4 3,042 949 Fairbanks - Gilliam Way 02-090-0020 14 48.6 22.2 5.6 4.2 15,886 21,553 13.4 10.4 3,547 949 Fairbanks - 7th Avenue 02-090-0013 7 31.2 22.2 4.8 4.2 20,921 21,553 32.6 10.4 3,042 949 Phoenix - Grand Ave & Thomas Rd04-013-0022 7 38.5 23.0 62.5 25.1 13,109 21,907 18.6 10.0 6,117 2,782 Hawthorne - 120th Street 06-037-5001 7 46.4 51.3 47.6 44.6 21,148 20,683 8.2 14.6 7,679 13,879 Spokane - Third Avenue 53-063-0044 5 12.7 8.6 3.2 2.8 19,016 19,233 43.5 11.0 4,798 3,387 Burbank - W. Palm Avenue 06-037-1002 5 34.6 51.3 33.2 44.6 20,275 20,683 10.3 14.6 11,966 5,782 Las Vegas - East Charleston Blvd 32-003-0557 4 34.2 26.2 32.6 5.3 15,935 21,697 13.1 9.8 8,609 4,223 Las Vegas - Sunrise Avenue 32-003-0561 3 49.6 26.2 68.7 5.3 10,413 21,697 22.9 9.8 11,878 4,223 Reseda - Gault Street 06-037-1201 3 41.2 51.3 45.4 44.6 15,069 20,683 16.6 14.6 11,444 2,344 Anchorage - 3201 New Seward Hwy02-020-0037 3 33.6 27.8 7.1 5.7 26,260 25,287 17.4 11.0 4,297 153 El Paso - North Campbell 48-141-0027 3 17.4 26.1 93.6 78.2 3,907 13,139 19.9 7.9 4,519 2,263 Denver - Broadway - Camp 08-031-0002 2 48.6 20.6 40.1 18.8 20,300 26,206 47.2 10.1 6,041 3,617 Denver - Speer & Auraria Parkway 08-031-0019 2 19.5 20.6 9.2 18.8 68,944 26,206 55.9 10.1 5,139 3,617 Kalispell - Idaho & Main 30-029-0045 2 3.5 3.7 1.3 1.4 19,085 17,915 13.0 10.8 2,047 2,606 Spokane - Hamilton Street 53-063-0040 1 11.7 8.6 4.6 2.8 10,838 19,233 26.3 11.0 5,913 3,387 Phoenix - Indian School Road 04-013-0016 1 48.8 23.0 60.5 25.1 9,986 21,907 11.0 10.0 8,776 2,782 Provo - 242 N. University Avenue 49-049-0004 1 12.5 7.6 12.4 7.0 9,991 15,557 40.3 12.6 17,094 2,653 Provo - 363 N. University Avenue 49-049-0005 1 12.5 7.6 12.4 7.0 9,991 15,557 70.5 12.6 17,094 2,653 Anchorage - 3201 Turnagain 02-020-0048 1 32.6 27.8 6.5 5.7 23,388 25,287 31.0 11.0 7,192 153
Source: 2000 U.S. Population Census; U.S. EPA1Monitor area def ined by census tracts immediately surrounding monitor site.2 Region def ined by Metropolitan Statistical Area (MSA) except for Fairbanks North Star Burough, Los Angeles PMSA, Imperial County (Calexico), and Flathead County (Kalispell).3County of Los Angeles used for Reseda monitor site.4Share of w orkers 16 years and older that do not drive alone or carpool to w ork.
Pop/Sq Mile
Monitor
% Non Driving4% Non White % Hispanic Per Capita Income
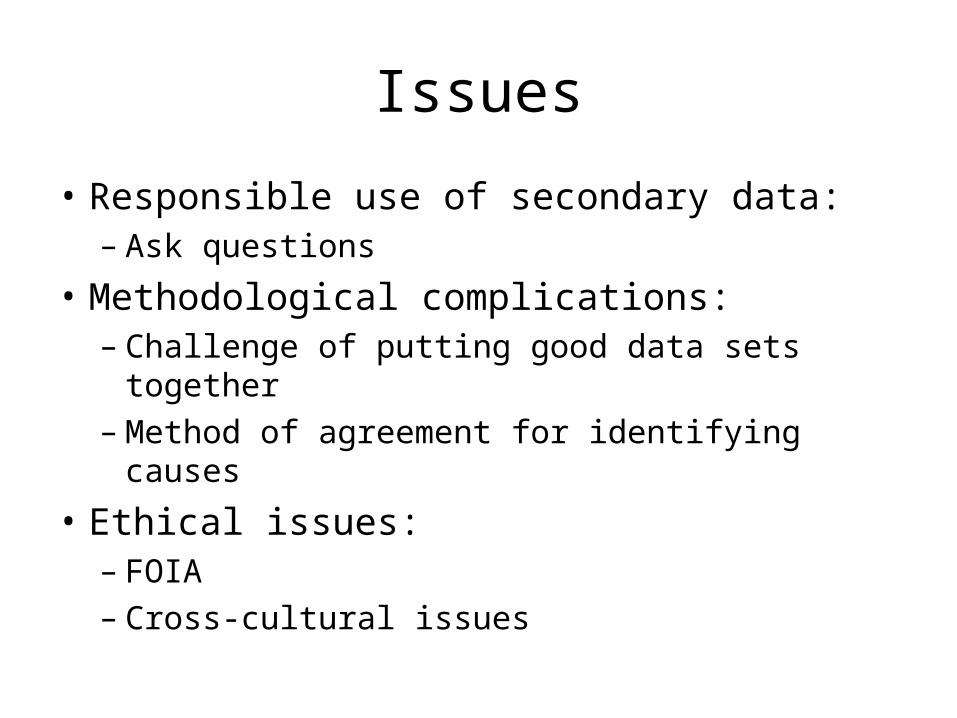
Issues
• Responsible use of secondary data: – Ask questions
• Methodological complications:– Challenge of putting good data sets together– Method of agreement for identifying causes
• Ethical issues:– FOIA– Cross-cultural issues

Meet in 1137 PES again on Thursday!