history chartgizmo was created by max kuchin and galinkskiy dmitriy, two software developers from...
TRANSCRIPT


HistoryHistoryChartGizmo was created by Max Kuchin and ChartGizmo was created by Max Kuchin and
Galinkskiy Dmitriy, two software developers from Sankt-Galinkskiy Dmitriy, two software developers from Sankt-Petersburg, Russia.Petersburg, Russia.
The first version of ChartGizmo was hosted from a The first version of ChartGizmo was hosted from a home computer, and then was moved to paid VPS hosting home computer, and then was moved to paid VPS hosting on linode.com. Now, after one and a half years, there are on linode.com. Now, after one and a half years, there are several applications hosted at two servers located in several applications hosted at two servers located in Germany and Moscow. Germany and Moscow.
The maintenance of ChartGizmo remains a hobby, The maintenance of ChartGizmo remains a hobby, but the creators have the goal of developing it into but the creators have the goal of developing it into a more profitable program so they are able to quit their a more profitable program so they are able to quit their full time jobs.full time jobs.

PurposePurposeThe purpose of ChartGizmo is to use the free The purpose of ChartGizmo is to use the free
account to formulate a variety of charts.account to formulate a variety of charts. ChartGizmo allows you to create completely free ChartGizmo allows you to create completely free
charts that can be very useful for presentations, charts that can be very useful for presentations, visualizations for data, and experiments. visualizations for data, and experiments.
ChartGizmo provides many features on the site ChartGizmo provides many features on the site that allow for the customization of your own personal that allow for the customization of your own personal charts, and it lets you update and modify your charts charts, and it lets you update and modify your charts within your own account.within your own account.
You can make many different types of graphs such You can make many different types of graphs such as bar graphs, line graphs, pie charts, and scatter plots.as bar graphs, line graphs, pie charts, and scatter plots.

Types of GraphsTypes of Graphs
How ChartGizmo WorksHow ChartGizmo Works ChartGizmo works by taking the three basic ChartGizmo works by taking the three basic
components of a chart, which are labeling, scales, and the components of a chart, which are labeling, scales, and the actual data representation. The labeling of the X and Y actual data representation. The labeling of the X and Y axis is what defines the data. The title tells you what that axis is what defines the data. The title tells you what that specific chart will be about. Then the axis titles and labels specific chart will be about. Then the axis titles and labels define how the data will be graphed within the chart. define how the data will be graphed within the chart. Lastly legends define separate data series that are then Lastly legends define separate data series that are then easily broken down into viewing within the charts.easily broken down into viewing within the charts.
After the data has been collected, Chart Gizmo After the data has been collected, Chart Gizmo allows the user to decide whether the graph will be a bar allows the user to decide whether the graph will be a bar graph, line plot, scatter plot, or pie chart.graph, line plot, scatter plot, or pie chart.

Create A Simple ChartBelow is a step-by-step description of creating a simple chart. Below is a step-by-step description of creating a simple chart.
The chart will display “Actual Age of Men Who Claim to Be 29 Online.”The chart will display “Actual Age of Men Who Claim to Be 29 Online.”Click the New Chart button at the Charts page.Click the New Chart button at the Charts page.
Design the chartDesign the chartSTEP 1STEP 1

Enter the data in to the tableEnter the data in to the table
Create A Simple ChartSTEP 2STEP 2

Click Save & Publish to save the chart and generate the HTML code for your chart
STEP 3STEP 3Create A Simple Chart
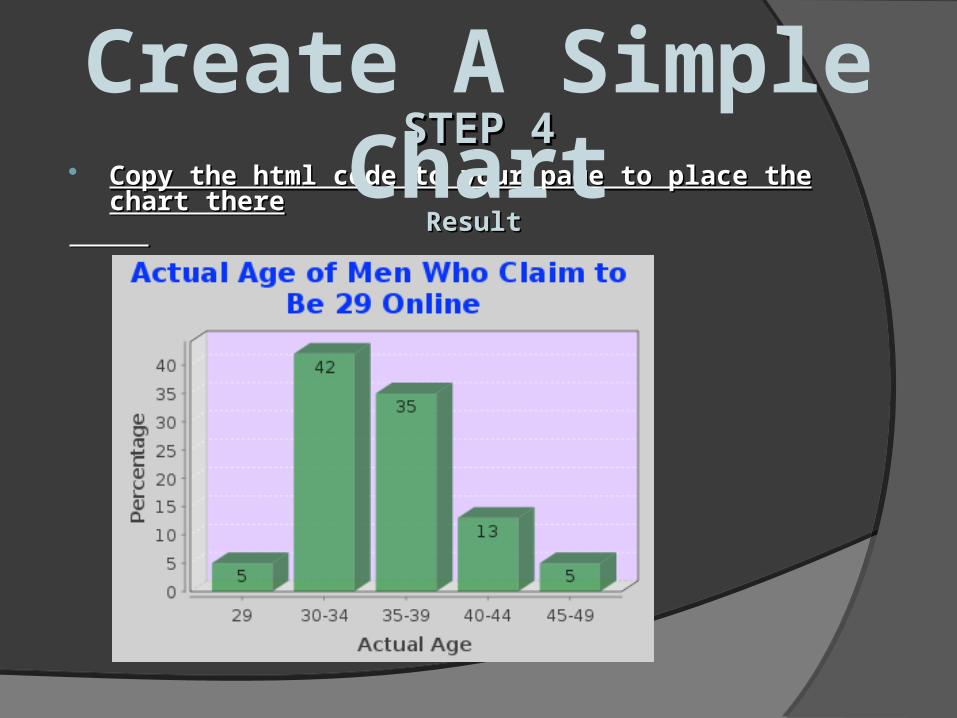
Copy the html code to your page to place the chart thereCopy the html code to your page to place the chart there
STEP 4STEP 4Create A Simple Chart
ResultResult

Relation to Other Applications Relation to Other Applications ChartGizmo has a feature that allows you to import data ChartGizmo has a feature that allows you to import data
from Microsoft Excel and Microsoft Access. This way you can have from Microsoft Excel and Microsoft Access. This way you can have all of the information in an Excel file already created, and then all of the information in an Excel file already created, and then just import all of that data into ChartGizmo to allow for fast and just import all of that data into ChartGizmo to allow for fast and easy creation of charts.easy creation of charts.
Different data sources can be used to insert data into the Different data sources can be used to insert data into the chart, such as static data, historic data, dynamic data from chart, such as static data, historic data, dynamic data from JavaScript code, and dynamic data from an HTML table on a web JavaScript code, and dynamic data from an HTML table on a web page. This allows you to copy and paste data from a table in any page. This allows you to copy and paste data from a table in any website or a word processing document to enable fast importing website or a word processing document to enable fast importing of data to create a chart.of data to create a chart.
It supports charts with values in Japanese, Chinese, and It supports charts with values in Japanese, Chinese, and other Unicode languages. This allows someone to use it with other other Unicode languages. This allows someone to use it with other languages and even in other countries.languages and even in other countries.

Entering/Editing the Chart DataEntering/Editing the Chart DataThe chart editor allows you to enter/edit the data manually The chart editor allows you to enter/edit the data manually
or copy data from a table editor (Excel, Access).or copy data from a table editor (Excel, Access).Click Click New ChartNew Chart or to run the chart editor. The chart or to run the chart editor. The chart
design and chart source tables are displayed. design and chart source tables are displayed.
Manual data editingManual data editingYou can add or delete rows and columns using the buttons You can add or delete rows and columns using the buttons
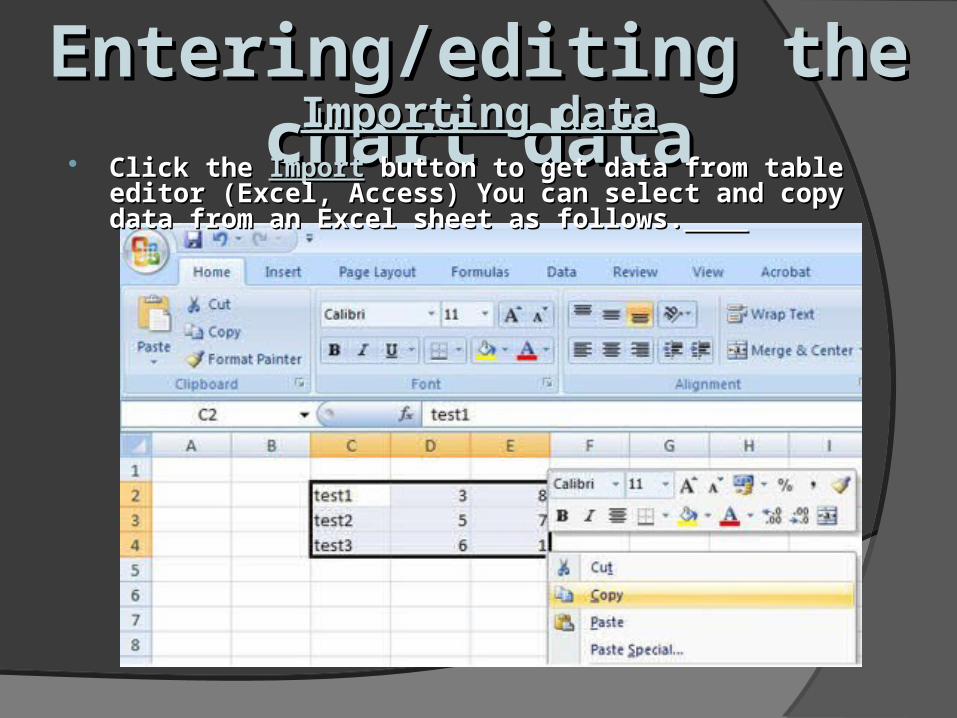
Entering/editing the chart dataEntering/editing the chart dataImporting dataImporting data
Click the Click the ImportImport button to get data from table editor (Excel, Access) button to get data from table editor (Excel, Access) You can select and copy data from an Excel sheet as follows.You can select and copy data from an Excel sheet as follows.
Entering/editing the chart dataEntering/editing the chart dataImporting dataImporting data
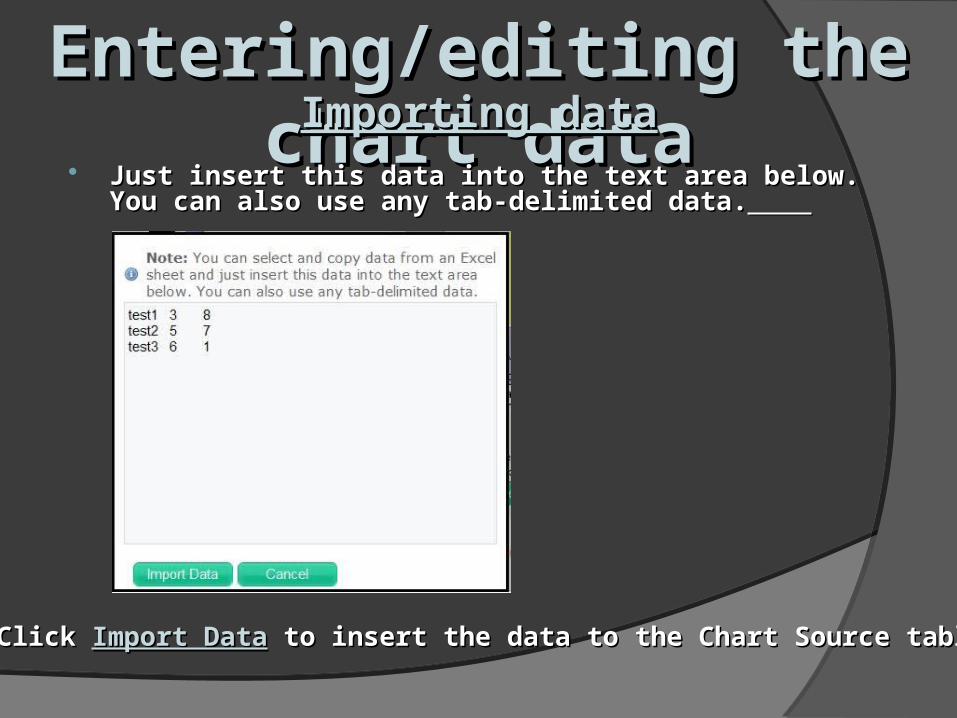
Just insert this data into the text area below. You can also use any tab-Just insert this data into the text area below. You can also use any tab-delimited data.delimited data.
Click Click Import DataImport Data to insert the data to the Chart Source table to insert the data to the Chart Source table
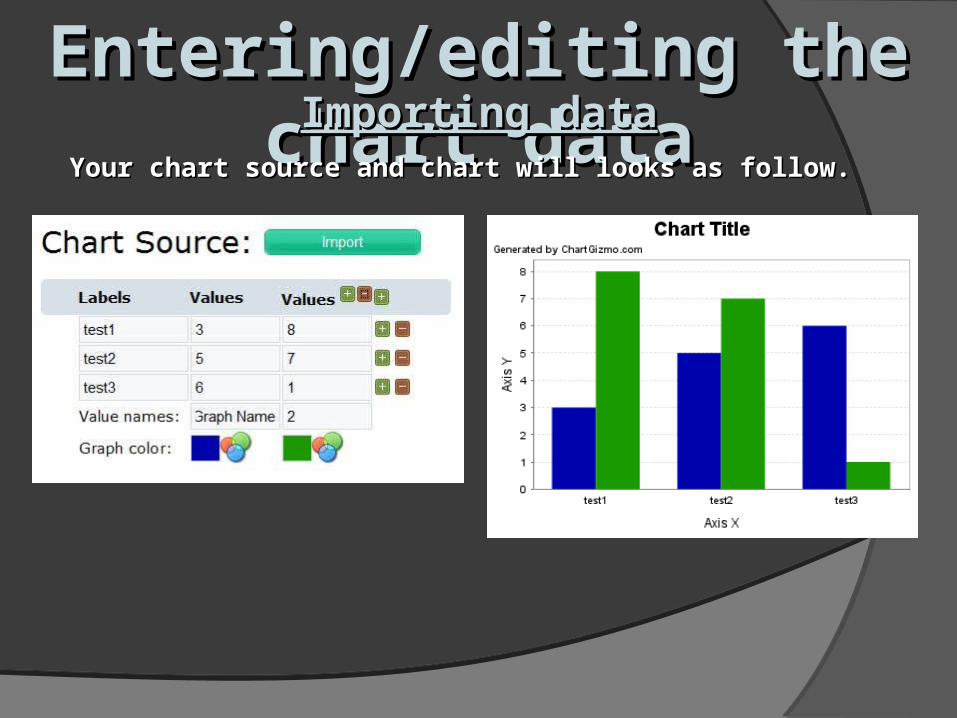
Entering/editing the chart dataEntering/editing the chart dataImporting dataImporting data
Your chart source and chart will looks as follow.Your chart source and chart will looks as follow.

How ChartGizmo is UsedHow ChartGizmo is Used Elementary EducationElementary Education Secondary EducationSecondary Education Post Secondary EducationPost Secondary Education Unique UsesUnique Uses
Downloading it onto your phone so that you Downloading it onto your phone so that you can create and capture graphs while on a bus can create and capture graphs while on a bus or airplane.or airplane.
So simple that you can use this application in So simple that you can use this application in about 5 minutes and have a very accurate about 5 minutes and have a very accurate graph.graph.
Includes different colors, value schemes, and Includes different colors, value schemes, and fonts.fonts.

How ChartGizmo is UsedHow ChartGizmo is Used Business and Industry UsesBusiness and Industry Uses
Businesses can use ChartGizmo by Businesses can use ChartGizmo by representing growths of companies they representing growths of companies they compete with through a graph.compete with through a graph.
They can use this graph and the They can use this graph and the information observed to help their information observed to help their business succeed even more.business succeed even more.
Also, businesses can organize their Also, businesses can organize their information and represent their information and represent their company in a chart so future employees company in a chart so future employees can understand the values of the can understand the values of the company easily.company easily.
Different ideas throughout a business Different ideas throughout a business can be presented through charts and can be presented through charts and graphs by using ChartGizmo, so the graphs by using ChartGizmo, so the information is clear and easy to follow.information is clear and easy to follow.

Global Use of ChartGizmo Global Use of ChartGizmo ChartGizmo is available in several languages. Its purpose is to ChartGizmo is available in several languages. Its purpose is to
help teachers, students, or users of the application from all over the help teachers, students, or users of the application from all over the world to better make many different types of graphs. It allows you to world to better make many different types of graphs. It allows you to create completely free charts that can be very useful for presentations, create completely free charts that can be very useful for presentations, visualizations for data, and experiments.visualizations for data, and experiments.
ChartGizmo is listed as a recommended technology for ChartGizmo is listed as a recommended technology for teachers in educational resource sites. ChartGizmo is useful for teachers in educational resource sites. ChartGizmo is useful for brainstorming, drafting, and note taking.brainstorming, drafting, and note taking.
ChartGizmo is especially necessary for economists and ChartGizmo is especially necessary for economists and businessmen in their jobs to compare and change the structure of businessmen in their jobs to compare and change the structure of actions, to automate the selection of schedule types under the actions, to automate the selection of schedule types under the analyzed data, and to develop other directions. It also allows you to analyzed data, and to develop other directions. It also allows you to simplify a diagram choice and visualize the data.simplify a diagram choice and visualize the data.