history of kansas education and evaluation... · education. thus, the first schools were...
TRANSCRIPT

HISTORY OF KANSAS EDUCATION
September 2001
Dr. Sherrill Martinez and Lue Ann Snider
Planning and Research Kansas State Department of Education

i
TABLE OF CONTENTS
Page Introduction ...................................................................................................................... 1 Question 1:. What should be the mission of the public school system? ......................... 1 Question 2: Who is being provided a public school education? ..................................... 5 Question 3: Who should be allowed to teach in the public schools? .............................. 7 Question 4: How should public schools be governed? .................................................... 9 Summary ........................................................................................................................ 13 Timeline of History of Kansas State Board of Education.............................................. 14 Kansas School Governance............................................................................................ 15 Kansas Teacher Preparation/Certification...................................................................... 19 Kansas School Accreditation/Improvement................................................................... 21 Kansas Special Education .............................................................................................. 23 Kansas School Unification/Finance Issues .................................................................... 25 Kansas Postsecondary Education................................................................................... 27 National Scene ............................................................................................................... 28 Technology..................................................................................................................... 33 References ...................................................................................................................... 34 Appendix: Historical Data Tables................................................................................. 35

ii
Data Tables Page
Table 1 History of Kansas Building, Staff, and Enrollment Totals (1992-1999)......................36 Table 2 Kansas Certified Personnel Data (2001) ......................................................................37 Table 3 Kansas Student FTE Enrollment for 21 Years (1979-1999) ........................................38 Table 4 Kansas Headcount Enrollment by Grade, Race, and Sex (1999-2000)........................39 Table 5 Kansas Headcount Enrollment by Grade, Race, and Sex (2000-2001)........................40 Table 6 Pupil-Teacher Ratios for Kansas and Nation (1992-2001) ..........................................41 Table 7 National Pupil-Teacher Ratios (1955-1997) ................................................................42 Table 8 Kansas Special Education Personnel Total Compensated FTE by Area (FY 1991-2000) ..............................................................................................43-47 Table 9 Kansas Special Education Professionals FTE Trends (FY 91-00) ...............................48 Table 10 Kansas Special Education Paraprofessional Trends (FY 91-00)..................................49 Table 11 Kansas Special Education Child Count and Prevalence Trends (1989-2000)..............50 Table 12 Kansas Special Education Child Count Trends by Exceptionality (1989-1998)..........51 Table 13 Number of Personnel in the Kansas State Department of Education (1978 2001) ......52 Table 14 Percent Public High School Graduation Rate (Rank) ..................................................53 Table 15 Status of 1999-2000 Kansas Graduates (May 2001)....................................................53 Table 16 Kansas and National Student Dropout Rate (1994-2000) ............................................54 Table 17 Kansas ACT Scores (1993-2001).................................................................................54 Table 18 National ACT Scores 1993-2001 .................................................................................54 Table 19 Kansas and National SAT Trend Data (1988-2000) ....................................................55 Table 20 Kansas and National NAEP Scores (1998-2000).........................................................55 Table 21 Crime Rates in Kansas Schools: Violent Acts Against Students (1995-2000) ............56 Table 22 Crime Rates in Kansas Schools:Violent Acts Against Teachers (1995-2000).............56 Table 23 National Crime Rates in Schools (1997)......................................................................57

iii
Table 24 Computers for Instructional Use in Public Schools in U.S. (1994-2000) ....................58 Table 25 Intensity of Computer Use in Kansas and the Nation ..................................................58 Table 26 American Public Schools and the Internet (1994-2000) ..............................................59 Table 27 Kansas School Districts with High Speed Internet Connectivity (1999) .....................60 Table 28 Kansas School Districts Using Dial-up Moderns (1999) .............................................61 Table 29 Kansas Expenditures by Source, Weighted FTE Enrollment (1992-2000)..................62 Table 30 Kansas Expenditures by Source, General Fund Budget Per Pupil (1992-2000) ..........62 Table 31 Kansas Expenditures by Source, Supplemental General Fund Budget Per Pupil (1992-2000) ..................................................................................................63 Table 32 Kansas Expenditures by Source, General + Supplemental Fund Budget Per Pupil (1992-2000) ..................................................................................................63 Table 33 Kansas Total Expenditures Per Pupil (1997-1999) ......................................................64 Table 34 Trends in National Per-Pupil Spending in Actual Dollars (1986-2001) ......................64 Table 35 National Spending Per Pupil (1920-1997) ...................................................................65 Table 36 Trends in School Budgets in Kansas (1990-1994) .......................................................66 Table 37 Kansas Average Teacher Salary (1964-2000)..............................................................67 Table 38 National Average Annual Salary for Teachers (1970-2000)........................................68

1
Introduction
The history of Kansas public education closely parallels that of the nation. It is difficult to understand why events happened in the state environment without some understanding of what was occurring in the nation during the same time period. Therefore, in this report, four questions important to education are asked. Historical answers to the questions are then given: first for the nation and then for the state. At the end of the report, a chronology of important events with a rationale for each event is given. This section is divided into Kansas School Governance, Kansas Teacher Preparation/Certification, Kansas School Accreditation/Improvement, Kansas Special Education, Kansas School Unification/Finance Issues, Kansas Postsecondary Education, National Scene, and Technology. The report ends with an appendix of historical data tables.
In the year 2000, one in four Americans was involved in formal education as a
student, teacher, administrator, or support staff member. Hundreds of billions of dollars were spent for education. This report attempts to explain why education has been and is valued so highly in Kansas and the nation.
Question 1: What should be the mission of the public school system?
Mission In the Nation's History
The founders of this country realized how important a public education system could be to the country's social well-being. Education could be used to transform a diverse group of immigrants and persons with beliefs that varied greatly from the majority norms into citizens who more nearly conformed to the norms. In the beginning, the potential economic benefits of education were not fully understood. Before long, however, leaders began to see the benefits of keeping children in school and out of the labor market during times of economic depression and of using public schools to provide students with vocational skills as well as with basic literacy and citizenship skills. During this early period, memorization of a common knowledge base, not creative thinking, was the goal of education. Thus, the first schools were established to teach English, reading, writing, arithmetic and values essential to a democratic society. Through the years, as society became more complex, a number of additional responsibilities were assigned to schools.
• Health programs and health education, • Physical education, • Breakfast and lunch programs, • Driver education, • Foreign language education, • Science education, • Consumer education, • Career education, • Drug and alcohol abuse education, • Character education,

2
• Parent education, • Special education, • Technology, • English-as-a-Second Language and migrant education, • Early childhood education, • Counseling and social work services, • Before and after school programs, and • Safety education.
With changes in responsibilities came changes in the expected outcomes of schooling. Until the 1900s, only a select group of students were expected to complete a secondary school education, let alone college. Variance in educational opportunities afforded different student groups and the appropriateness of the education provided were never studied. Educators and the public were satisfied if most students gained basic literacy, vocational, and citizenship skills before leaving elementary school for the workplace. Then, in the first half of the twentieth century, there were two world wars separated by a lengthy economic depression. These events led policy makers to heighten, for economic and national defense reasons, the importance of keeping more children in school until high school graduation. As a result, more money was earmarked for schools, the years of compulsory attendance were extended, school attendance laws were enforced, and the high school graduation rate rose from 6 percent in 1900 to 59 percent by 1950.
Even though student numbers rose dramatically in the 1950s, 1960s, and 1970s,
communities managed to increase the percentage of young people who remained in school until high school graduation. This was, after all, the period of the cold war and the space program. In 1969, Neil Armstrong walked on the moon; in 1957 Sputnik was launched; and in 1971, the first microcomputer was developed. Jobs for unskilled workers were disappearing and the economic base was shifting away from manufacturing into an information management and technological era. There was a knowledge explosion as well as a population explosion and creative thinkers were needed. Education--especially in the areas of math, science, and technology--was thought to be key to the nation's survival.
Throughout the 1960s and 1970s, school and government leaders promoted
programs to ensure equality of education opportunities for all students, including disabled and economically disadvantaged students. The Civil Rights Act and first Elementary and Secondary Education Act were passed. Federal funds were given to districts to assist them in providing special assistance programs for educationally deprived students, and school districts were forced to desegregate and to offer the same level of education to minority students as they did to majority students. For the first time, a national assessment was given to evaluate how students were achieving across districts and states. With the Goss vs. Lopez decision in 1975, education became recognized as an important property right because it could be used to grant adults more equal access to economic opportunities. Also that year, The Education for All Handicapped Children Act mandated free, appropriate public education for all children, regardless of the degree or severity of their handicap.

3
A direction change occurred in the 1980s after "A Nation At Risk" was published and created a national furor. The report suggested that the public education system was performing poorly and needed a massive overhaul. Policy makers vowed to hold students and the schools to higher standards. Efforts of education and government leaders shifted from ensuring equity to ensuring excellence and international ranking in student achievement. This movement was accompanied by standards and increased graduation requirements in an attempt to raise average student achievement to first in the world. States added assessments to other criteria for determining if students should be promoted or allowed to graduate. Because these high stakes requirements could be more detrimental to some student groups than to others, states had to prove that they had a unitary system of education and that the graduation requirements were culturally neutral (Debra P. vs. Turlington).
By the end of the 1980s, school reformers, discouraged by the slow progress in
raising student achievement levels, attempted to change the basic structure of the education system. Such things as site based decision-making--which included teacher, parent, and community member involvement in managing schools-- and school choice programs were encouraged. Standards, such as those developed by the National Council of Teachers of Mathematics, were used as models for state and district curricular frameworks. President Bush presented the nation with six national goals for education to help focus and unify school improvement efforts; and the Goals 2000 Educate American Act provided a framework and funding for meeting the national goals.
Systemic reform, which began in the 1990s, was based on an integrated use of
goals, standards, and techniques for achieving high standards and the national goals. Its purpose was to overcome the fragmentation of the education system and to hold all students (combining equity with quality) to a common list of high standards. Recently, high stakes accountability has been added to the systemic reform effort. Graduation rates continued to increase during the reform period. In the year 2000, over 84 percent of Americans age 25 and older were high school graduates.
Although teaching students about and through the use of technology has been a
goal of schools for over two decades, the Internet and the World Wide Web have been the most influential technological innovations for education. Especially since 1995, schools have dramatically increased the resources that they dedicate to teaching students to use technology. "E-Rates" became available to schools to assist with the cost of Internet access, beginning in 1997.
Mission In the History of Kansas Education
Early Kansas settlers believed that parents had a responsibility to provide basic literacy and citizenship education for their children. Log schools, built by communities, began appearing across Kansas in the 1870s to accomplish that goal. The Territorial Legislature believed education was key to the state's growth and development, since a literate and skilled citizenry could help build business and industry. Therefore, the state,
4
too, had a responsibility to support education. When it was ratified, the Kansas Constitution acknowledged the responsibility of the state to provide a uniform system of common schools and schools of higher grades for its people. To make sure that Kansans would take advantage of the opportunity for education, in 1874 the Legislature passed a compulsory school attendance law for children ages 8-14. By 1885, the state wanted to provide more than an elementary education to a greater percentage of its children. County high schools were authorized and supported in the state. Elementary courses of study and a sequence of courses for high schools were developed and a school textbook adoption committee was established to promote the teaching of a common knowledge base.
When young people enlisted in the Armed Forces to serve in the world wars, their
standardized test scores showed high levels of illiteracy. In 1943, the Kansas State Board, concerned about the academic skill level of Kansas students, began requiring students to pass a standardized achievement test before graduating from the eighth grade to ensure a basic literacy level among Kansas adults.
Although not all Kansas school districts were segregated, some were. After the
Brown vs. Topeka Board of Education ruling in 1954, districts were told to integrate schools and to provide equal education opportunities to all children. Some districts drew school boundary lines in order to continue to segregate children. By the 1970s, mini-courses, basic courses, assignment of students to special programs, and multiple academic tracks were common practices that often separated children by race and/or economic status. Research indicated that academic achievement was suffering, especially for the most at-risk students, from many of these practices. In an attempt to encourage schools to provide equal education opportunities to their students, a minimum-competency bill was passed in 1981 that required the development of minimum competency objectives and assessments in reading and mathematics. All regular education students, regardless of the track into which they were placed, were to take the assessments; and assessment results were to be analyzed by school to check the level of mastery of all student groups.
By the late 1980s, the State Board and the Legislature were not satisfied with
guaranteeing that students would leave Kansas schools with minimum competencies. Society was becoming more complex; therefore, students needed higher skill levels if they were to be successful adults. As part of the School District Finance and Quality Performance Act (1992), a system of performance accreditation of schools was adopted. "World-class" curriculum standards and state assessments based on the standards were developed in mathematics, science, communications, and social studies. Schools were accredited based on student improvement in achievement of the standards. Assessment data were disaggregated by gender, race, and socioeconomic status to ensure equity as well as quality of a school's academic programs. When new standards and assessments were developed, beginning in 1997, alternate, modified, and simple English assessments were included in the design in order to measure the achievement gains of handicapped and limited-English-proficient students. By doing so, the state made it clear that these students, too, were expected to achieve to high standards.

5
Quality Performance Accreditation (QPA) is a comprehensive school improvement process based on effective schools research. A school's practices and staff development are to be in keeping with the school's improvement plan, which is developed through the QPA process. To encourage systemic thinking, the Department provides technical assistance in the process and requires schools that request Department grants to describe how the grants will align with the school's improvement plan. Visiting teams, composed of educators trained in the QPA process, make accreditation recommendations, based on a school's success in achieving continuous improvement. Continuous improvement monitoring of special education is a systemic improvement process that has been recently added by the Department. The State Board is currently researching ways to make the school improvement process more effective in Kansas so that more children achieve at high levels.
Question 2: Who is being provided a public school education?
Student Population In the Nation's History
The United States has been relatively successful throughout its history in welcoming new immigrants and in providing most with the educational and economic opportunities that allow them to successfully assimilate into society. Until the 1900s, however, only a small percentage of children finished more than a rudimentary education, and some children, such as disabled and black children, were excluded from public schools. In addition, compulsory attendance laws were usually ignored, which left decisions about school attendance up to parents and children. The world wars made leaders more concerned about the level of adult literacy in the nation. As a result, more money was devoted to education and compulsory attendance laws were strengthened. Black children began attending school in higher numbers, but many attended segregated schools. Disabled students were still not included in public education to a great extent.
The first wave of the baby boom hit schools in 1951. Since school buildings and
teacher education had been neglected during the war, building and teacher needs created by the baby boom were very serious. In addition, in 1954 the United States Supreme Court ruled, in Brown vs. the Topeka Board of Education, that schools segregated by race were unequal and unconstitutional and would not be allowed. In 1958, the National Defense Education Act provided money to train teachers to work with mentally handicapped students and many of these students were allowed to attend public schools. Mentally handicapped students and black students from schools that were closed due to Brown added to the numbers pouring into public school buildings.
School populations began to decrease steadily in the early 1980s. However, births
to baby boomers and a rise in the immigration rates in the 1980s set up another boom in school population in the late 1980s and into the 1990s. In this boom, immigration and differences in birth rates among racial groups impacted the population of schools in more ways than enrollment size. In the 1980s, immigration was at its highest point since the decade beginning in 1905, and by the year 2024, the number of school-aged children will

6
not reflect a majority of any particular ethnic or racial group. Federal funding has been made available to help meet the challenges of educating the new wave of immigrants, but state resources are being strained in attempts to provide quality education opportunities to them.
In 1975, the Education of All Handicapped Children Act was passed. It mandated
free, appropriate public education for all children, so public schools began taking responsibility for educating many more handicapped children than they had in the past. Federal funds also assist with the education of handicapped children, but the funds are far from adequate.
The percent of American children living in poverty, based on eligibility for free
school meals, was nearly 35 percent in 1997. Historically, the average achievement level of children from the poorest families is at the bottom of the continuum, and these children leave school early. Although Title I and other federal programs to assist schools with educating the disadvantaged have been around since the 1960s, the gap in achievement and in graduation rates between students from lower and higher socioeconomic status families has persisted. Schools have begun to implement preschool and all-day kindergarten programs in an attempt to reduce the gap. Thus, these programs have added another group to the public school population.
Student Population In the History of Kansas Education
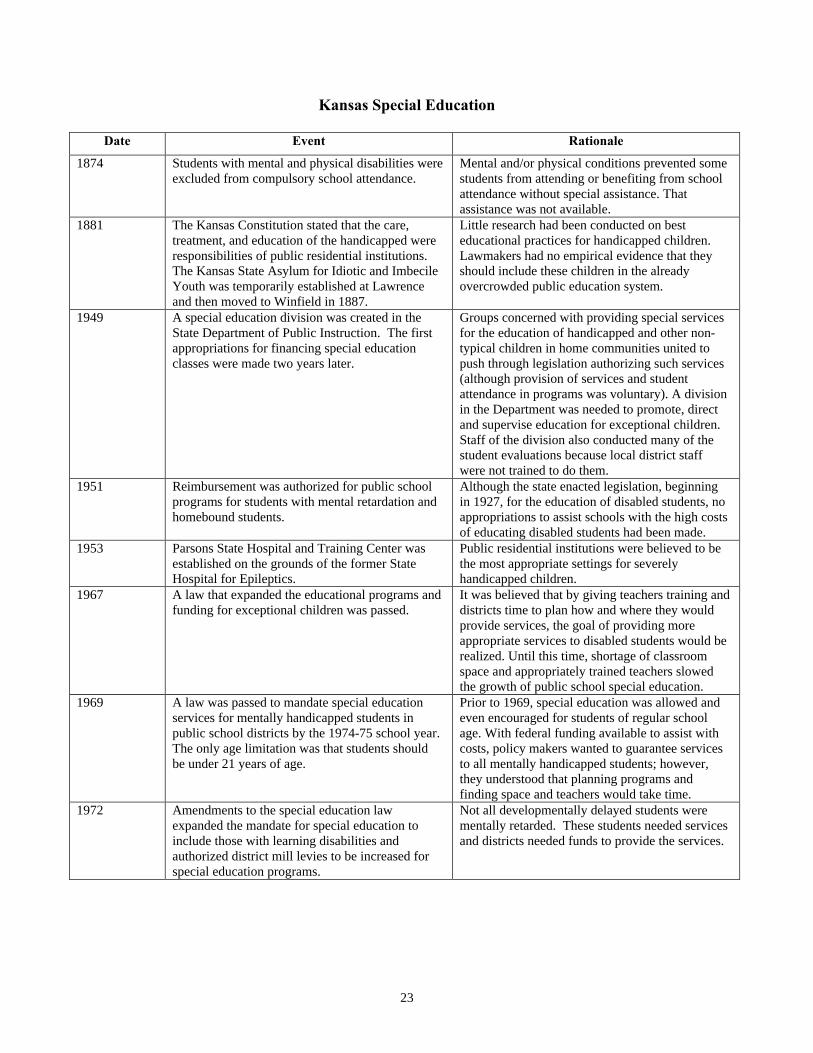
Kansas education has its roots in Council Grove, where the first free school for white children of government employees, traders, and others along the Santa Fe Trail was established in 1851. It was not until the 1870s, however, that many log schools appeared in Kansas. In 1874, the first compulsory school attendance law was passed. Students ages 8-14 were required to attend school during the 3-4 month school year, unless they were exempted by the local school board. Students with mental and physical disabilities were automatically excluded.
Beginning in 1881, with the opening of the Kansas State Asylum for Idiotic and
Imbecile Youth, care, treatment, and education of handicapped individuals was made available at residential institutions. The last of these residential centers, Parsons State Hospital and Training Center, was opened in 1953. Although some reimbursement was given to districts who extended learning opportunities to handicapped children during the 1950s and 1960s, providing special education for mentally handicapped students was not a mandate until 1969. Because special education laws were approved in a piecemeal fashion, only 50 percent of the students who needed special education services were receiving them in 1974. Therefore, the Legislature passed the Special Education for Exceptional Children Act that year. School districts were given until July of 1979 to develop education programs for all handicapped children within their jurisdictions.
Beginning with the Brown decision in 1954, Kansas began integrating all public
schools, adding racial diversity to the public school population. Immigration has also

7
impacted public school enrollments. The non- and limited-English proficient (LEP) population in Kansas has increased steadily in the last decade. During the 1999-2000 school year, 19,403 LEP students were served in Kansas public schools. The number of children assisted under the Immigrant Education Program rose from 2,195 in 1992 to 4,653 in 1996 and continues to grow.
The percent of Kansas children who live in poverty, based on eligibility for free
school lunches, was over 32 percent in 2000. To help these children succeed in school, many are being offered public school, preschool programs. Beginning in 1990, state funds were allocated for a Parents As Teachers Program for children ages birth to three and their parents. One of the goals of the program is to prepare children for school success by supporting parents in their role as their children's first and most important teachers. The program has grown from 4,190 children served in 1990 to 11,924 children served in 1997. Since 1998, the Legislature has also provided funding for a public school preschool program for at-risk four-year-olds. Last year 2,263 children participated in the program and next year nearly 4,000 students will participate. In the 2000-2001 school year, 51 schools offered public school preschool.
Kindergarten attendance is not required, but almost all Kansas children attend
kindergarten. Although the state funds half day kindergarten only, during the 2000-2001 school year, 238 schools in the state used Title I and other school funding to provide all-day, every day kindergarten to 9,534 children, giving them more time to gain the skills needed to be successful in first grade.
Question 3: Who should be allowed to teach in the public schools?
Teaching In the Nation's History
Initially, there were no federal guidelines about teacher qualifications. Each state regulated the qualifications of teachers and the subjects to be taught. The National Council for Accreditation of Teacher Education (NCATE) was founded in 1954 to be an independent accrediting body for teacher preparation programs. NCATE gave the nation a set of quality standards, but states were not required to adopt the standards. With Title II of the Higher Education Act of 1998, postsecondary institutions were required by the federal government to report annually on the quality of their teacher preparation programs.
Beginning in 1958 with the National Defense Education Act, federal funds have
been made available for teacher training. Since then, programs such as ESEA and Goals 2000 have also provided money for teacher training. Federal and international studies, such as the Schools and Staffing Survey and the Third International Mathematics and Science Study, make information about teaching available to policy makers and teacher trainers in order to improve the teaching profession.
There have been periods of teacher shortages since the early 1900s. The current
national shortage began in the mid-1990s, when a booming job market lured teachers and

8
potential teachers into other professions. The combination of an aging teaching force, increases in student enrollment, smaller class sizes, and a strong labor market has created severe teacher shortages in some geographic locations and in some subject areas. States have been modifying certification regulations to cope with the teacher shortage. In addition, the federal government has recently awarded grants to state education and other agencies for the study of teacher recruitment.
Teaching In the History of Kansas Education
Teachers in the first Kansas schools merely had to write their name, read a paragraph from a newspaper, and answer an oral question or two to prove that they were qualified to teach. In 1873, the State Board was given authority to grant certificates based on exams, which set minimum requirements for those teachers who received Board certification. However, a number of other entities could also grant certificates. County normal institutes, under the governance of the State Board, were established to train teachers in 1877, and the State Board was given the authority to accredit schools of education in 1893. In 1947, laws were changed so that only the Board of Education could issue a certificate to teach. A college degree became the requirement for a teaching certificate in 1959.
In 1943, the College Teacher Placement Organization met in Emporia and
discussed the teacher shortage in the fields of commerce, industrial arts, math and science. One thousand vacancies existed after school began in 1943 and a shortage of 2,000 was expected for the fall of 1944. Many teachers and potential teachers had left the profession to assist a country at war. Class sizes increased as teacher shortages continued into the 1950s, when the first wave of the baby boom hit schools. Some certification requirements were relaxed.
There were shortages in the area of special education from the 1940s, when a
special education interest group that wanted atypical children to receive education services in their home communities, successfully lobbied for appropriations for that purpose. Until 1957, a teacher was required to gain a regular teaching certificate and then complete additional specialty training in order to be certified to teach special education. Too few teachers were willing to complete the additional requirements. Finally, the Board changed standards for certification, enabling a candidate to complete a qualitatively different training program in order to receive an initial credential in special education.
The State Board increased general requirements for certification in 1985 and in
2000. The newest requirements are standards- and outcomes-based and demand that teacher candidates be able to demonstrate teaching competence. After July 1, 2003, educators will be licensed rather than certified.
Although currently a sufficient number of individuals are trained to be teachers in
Kansas schools of education, and although the majority of individuals trained in Kansas remain in Kansas, there were shortages in the following certification areas during the 2000-
9
2001 school year: music, special education, industrial arts, home economics, math, science, and foreign language. Districts expected to be short 492 teachers at the beginning of the 2001-2002 school year. As part of the licensure regulations adopted by the State Board in 2000, individuals with degrees in shortage areas may receive a restricted license to teach.
Question 4: How should public schools be governed?
Governance In the Nation's History
Local control and neighborhood schools are strongly valued in the United States. However, because of their interest in education, states began assuming more oversight of school finance, school accreditation, and teacher certification in the early 1900s. Local districts have the most control of day-to-day functioning in schools, but states must ensure adequate funding, quality schools, and quality teacher training/certification programs.
Although public schooling is not mentioned in the U.S. Constitution and is reserved
for the states, the Constitution does give the federal government the power to collect taxes and to provide for the common defense and general welfare. This power has been interpreted as authorizing federal investment in education. Especially since the 1960s, the federal government has required states to comply with specific conditions to qualify for federal funding. In this way, it has monitored equity and ensured provision of vocational education as well as programs for special populations. Education has also been influenced by the federal government through Supreme Court Cases, such as Brown vs. Topeka Board of Education and Swann vs. Charlotte-Mecklenburg Board of Education; through the development of voluntary national standards; and through Presidents who use their office to promote their views on educational issues. In fact, the federal government's level of direct involvement in education has changed many times since the 1950s, based on the philosophy of the person in the Presidency.
Governance In the History of Kansas Education
Local control of schools has always been valued in Kansas; however, the Territorial Legislature knew that communities would need school funding and other types of assistance if they were to provide education to their children. Therefore, the Territorial Legislature set aside land that could be sold to help finance education and created the offices of Territorial Superintendent of Common Schools and County Superintendent. Parents provided additional resources and served on local school boards.
The Territorial Legislature also believed that there should be a school within
walking distance of every student. Since almost every school was in its own district, by 1896 the number of school districts in Kansas had grown to 9,284. Once established, school district boundaries became rigid and citizens rejected change, even when the needs of the state were not being met. Thus, numerous small districts and district types remained in Kansas long after a new framework for schooling was needed. Eighteen different kinds

10
of districts, each requiring a special set of policies and regulations, were still functioning as late as 1960.
Thousands of small common school districts with limited enrollment and financial resources included grades K-8 only. High schools often operated under their own governing boards and encompassed several of the common school districts. Even when districts were reorganized into K-12 districts, schools were not necessarily closed. From 1963-1982, no attendance center could be closed without the consent of its patrons. Only since 1982 have school districts with enrollments above 1,600 been allowed to close buildings in order to improve the effectiveness of the school district. State Superintendent Peter MacVicar (1867-71) once commented, "More difficulties probably arise from organization and changes of school district boundaries than from all other sources." Still today, Kansas has 1 percent of the nation's students, 1.6 percent of the nation's schools, and over 2 percent of the nation's school districts.
Although the State Constitution acknowledged the responsibility of the state to
provide a uniform system of common schools and schools of higher grades in order to ensure its social and economic well-being, school governance was generally left to school administrators and boards until the 1900s. The first State Board of Education, made up of the State Superintendent and the presidents of the four state colleges/universities, was created in 1873, but it was not given policy-making authority. It was to certify teachers and to administer teaching exams; and in 1893 it was authorized to accredit schools of education. The Legislature passed a compulsory attendance law in 1874; however, local school boards set schedules and decided who could be excluded from school.
By the late 1890s, the state began playing a more active role in education, marking
the beginning of a movement to try to standardize education in Kansas. Before that time, local boards made most of the decisions about resource use, curriculum, teaching materials, and attendance and promotion requirements. Gradually, because of the growing importance of education to the future of Kansas, the state began to promote division of students into grade level classes, use of the same psychologically organized texts, and use of end of term exams to bring some uniformity across districts. However, the standardization movement was voluntary. Even though a law was passed in 1905 that authorized the State Board to prepare state courses of study, no staff, funds, or real authority over local districts accompanied the law. The University of Kansas had the most influence on secondary curriculum and the state teachers association had the most influence on elementary curriculum.
In 1915, the Legislature established the State Department of Education, consisting
of the State Superintendent and the State Board. The State Department was authorized to prescribe courses of study, make regulations to require the use of the course of study, and accredit schools. Before this time, the University of Kansas accredited high schools. When first established, the State Department had very limited power and numerous problems due to two main obstacles. First, because of the state's desire to retain local control of schools, local districts were not penalized for ignoring directives from the State Department. For example, the Department staff was given responsibility for collecting and
11
publishing school statistics. The reports were of limited value because districts sent incomplete or inaccurate data, if they sent any at all, and faced no consequence for noncompliance. Second, because the Board was politically appointed, members changed every 2-4 years with the election of a new Governor. Thus, there was little continuity in Department work. To add to the confusion, a separate Department of Vocational Education, also under the State Board, was authorized in 1917. The Superintendent had no authority over this Department and the State Board had no administrative arm to administer its new Department.
After establishing the new Department of Education, the Legislature began to pass
laws and assign responsibility for observance of the laws to the Board instead of the Superintendent. The Board made policies aligned with state law. Since individual Board members could not carry out policy, the Superintendent acted as its executive director, making sure Board policy was carried out. The division of duties worked only as long as there was a good relationship between the State Superintendent and the State Board. The Board was responsible for formulating policy, but had little authority for administering its programs. The State Superintendent was both chairman of the State Board and head of the Department staff and controlled most of the administrative tasks. When there was not mutual respect between the two entities, little was accomplished. The election of the State Superintendent also tended to create problems. Individuals were elected due to party affiliation, not due to vision for education or good working relationships with educators. The State Board had no power to replace the Superintendent and had to learn to live with his/her decisions.
In 1933, the Legislature removed the college presidents from membership on the
State Board and created a new Board, which included some Governor appointed non-educators. This was done, in part, because the animosity that existed between the Superintendent and the college presidents was interfering with the work of the State Department. The make-up of the State Board changed again with the 1945 legislation. It was now to be made up of seven lay persons to be appointed by the Governor. The elected State Superintendent remained as the chair of the Board.
In 1945, the Legislature established a State Department of Public Instruction,
consisting of the elected State Superintendent and the appointed State Board. Lines of authority were more clearly delineated in order to end role confusion and enhance collaboration. The State Board was to approve or reject plans, procedures, and rules formulated by the State Superintendent on issues related to certification, college accreditation, public school accreditation, special education, and curriculum; advise the State Superintendent; adopt textbooks; and administer vocational programs. Administrative and policy-making powers, subject to Board approval, were given to the Superintendent. The Board began electing one of its own members as chair. A more adequate budget was appropriated for the Department so that it could do the work assigned to it. Soon after the reorganization of the Department, it became the only entity authorized to issue teacher certificates.
12
The 1960's gave rise to a constitutional amendment which shifted general supervision of public schools to an elected, ten-member State Board, marking the beginning of an entirely different philosophy of school governance. The State Board was to appoint a Commissioner of Education to serve at the pleasure of the Board as its executive officer. Until this time, the office of State Superintendent was elected and the Board was politically appointed. On January 14, 1969, the ten newly-elected board members took office and appointed the first Commissioner. Now the Board could work more independently. In addition, the Department of Vocational Education was incorporated into the Department of Education. This framework for educational supervision of K-12 instruction remains today.
This shift in constitutional authority was tested by school districts in court and resulted
in clarification from the Kansas Supreme Court. In 1973, the Kansas Supreme Court determined that the State Board had "self-executing powers," which gave it the power to adopt rules, regulations, and policies concerning how schools are accredited, how teachers are certified, minimum high school graduation requirements and similar matters. This clarification of constitutional authority led the Kansas Legislature, on three occasions, to ask the voters of Kansas to consider changing these powers.
In 1974, 1986, and 1990, constitutional amendments were on the statewide ballot to
limit the board’s authority and, in some instances, change its composition. Both the 1974 and 1986 proposed amendments requested changing the level of authority of the State Board of Education over public schools. Specifically, the following changes were proposed:
Existing language:
"The legislature shall provide for a state board of education which shall have general supervision of public schools…"
Proposed changes:
1974 "The legislature shall provide for a state board of education which shall have and for its general supervision of public schools…"
1986 "The legislature shall provide for a state board of education which shall have general and for its supervision of public schools…"
The 1990 amendment removed all of the 1966 language and proposed replacing it with
the following:
"The legislature shall make suitable provision for governance of the system of public education and the schools and institutions which are part of the system. The legislature shall provide for such instrumentalities of governance as may be necessary, and such instrumentalities shall exercise such power and perform such duties as may be prescribed by law."
All of these proposed amendments failed.
13
There is a continuing struggle in Kansas with honoring local control while ensuring
the productive and efficient use of state revenues to provide quality education to the state's children. Historically the state has used school finance, school accreditation, teacher certification, and student standards-based assessment to curb wide variation in the quality of education that could result from complete local control. The Board was given total authority over school accreditation in 1915 and over teacher certification in 1947. In 1981, the State Board was charged with development of minimum-competency objectives and assessments in reading and mathematics and with requiring all schools to participate in the minimum competency program. In 1989, convinced that setting the floor for student achievement was not good enough, the State Board directed the State Department to develop curriculum standards and state assessments to measure student accomplishment of the standards in mathematics, followed the next year by communication arts. Picking up on the Board's philosophy, the Legislature passed the School District Finance and Quality Performance Act of 1992, which included a performance accreditation of schools based on student outcomes, including state assessments.
The first state financial aid began with $2.1 million allocated for the 1937-38
school year. Following World War II, state aid to schools was increased and school districts were reorganized to more optimally use the funds. Beginning in 1951, funds were made available to encourage districts to implement programs for handicapped children. School finance laws were passed in 1965 and 1973 for the purpose of equalizing Kansas school districts' ability to provide all students a "basic" education. The underlying concept of the current law, known as the School District Finance and Quality Performance Act, is that the state shall provide equally for every child, taking into account unique pupil and school district characteristics. The law recognizes that providing each child in the state an equal educational opportunity is the ultimate responsibility of state government, not of local school districts.
Summary
If one were to ask about Kansas, “What year was this? teacher quality and teacher
shortages in special and vocational education were a concern; minority and poor students, and students in certain identified schools, were not achieving at the same level as other children; finding funds for education and providing equitable funding for all districts were state priorities; local districts were ready to battle against redistricting; leaders were discussing whether or not certain population groups should be served in the public schools; and there was a debate about who was ultimately responsible for the quality of education provided to the state's children;” almost any year in the state's history would be a correct answer. These themes have persisted through the nation's educational history as well. If education is the gateway to adult economic opportunity and is key to the nation's social and economic well-being, as is commonly thought, debate will continue about who should govern, who should teach, who should be taught, and what should be the mission of public schools.

14
Timeline of History of Kansas State Board of Education First Board 1873
1893
1905
1909
State Dept. of Educ. established 1915
State Dept. of Voc. Ed. established 1917
Board reconfigur-ation 1933
1937
State Dept. of Public Instruction established 1945
1957
1965
State Dept. of Educ. esta-blished 1966
1981
1989
1992
1999
Duties: -Examine prospec-tive teachers -Issue teacher certificates
Duties added: -Accredit schools of education
Duties added: -Prepare state courses of study
Duties added: -Oversee state normal training programs for high school students
Duties: -Prescribe courses of study -Make regulations to require use of courses of study -Accredit elementary and secondary schools -Examine prospective teachers -Issue teacher certificates -Accredit schools of education
Duties added: -Oversee state's vocational programs
Duties: -Same as before
Duties added: -Adopt an official list of textbooks
Duties: -Approve or reject plans, procedures, and rules formulated by the State Superinten-dent on issues related to certification, college accredita-tion, public school accredita-tion, special education & curriculum -Advise the State Superinten-dent -Adopt textbooks -Administer vocational programs
Duties removed: -Adopt textbooks
Duties added: -Govern the new state systems of com-munity colleges, vocational-technical schools, and state technical institutes
Duties: -Super-vise public schools, educa-tional institu-tions and all educa-tional interests of the state, except educa-tional functions delegated by law to the Board of Regents
Duties added: -Oversee state minimum compe-tency testing program
Duties added: -Develop curriculum standards and state assessments to measure accomplish-ment of standards
Duties added: -Adopt a system of perfor-mance accredi-tation of schools, based particularly on measures of student academic improve-ment
Duties removed: -Govern com-munity colleges and technical schools
Appointed profes-sional educators (college heads)
Three members added
Appointed professional educators (college heads)
Appointed profes-sional educators and lay members (no college heads)
Seven appointed lay members
Ten elected members
15
Kansas School Governance
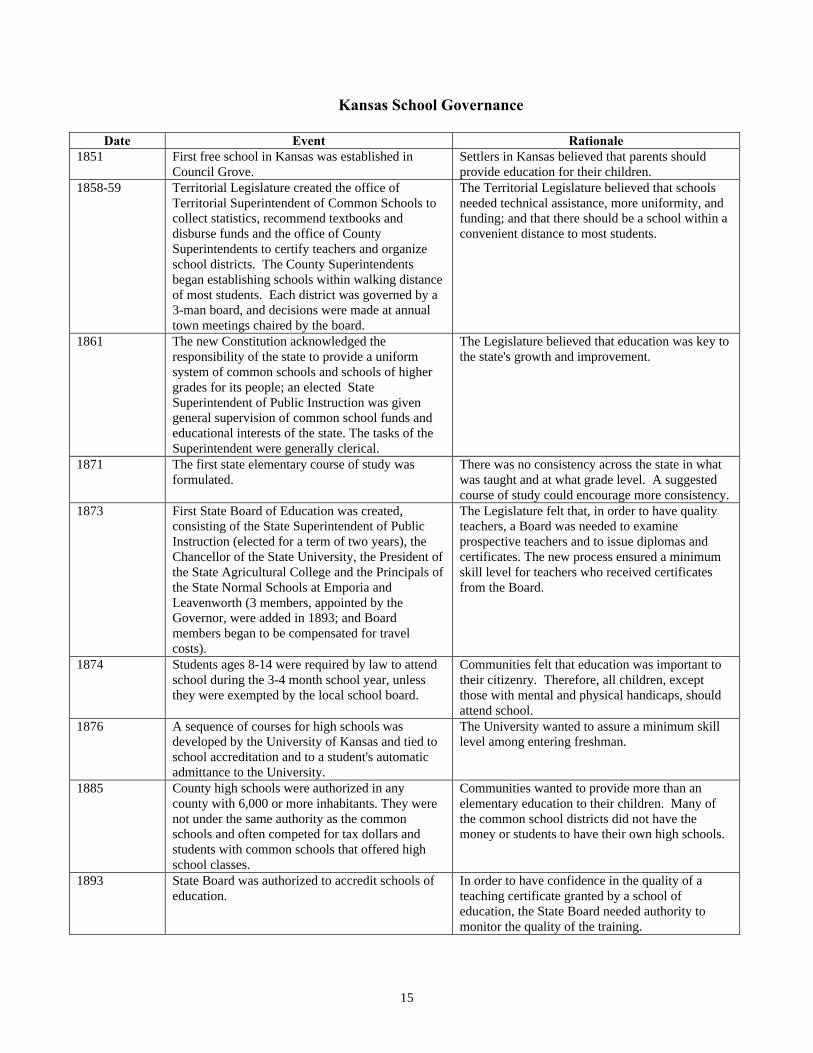
Date Event Rationale 1851 First free school in Kansas was established in
Council Grove. Settlers in Kansas believed that parents should provide education for their children.
1858-59 Territorial Legislature created the office of Territorial Superintendent of Common Schools to collect statistics, recommend textbooks and disburse funds and the office of County Superintendents to certify teachers and organize school districts. The County Superintendents began establishing schools within walking distance of most students. Each district was governed by a 3-man board, and decisions were made at annual town meetings chaired by the board.
The Territorial Legislature believed that schools needed technical assistance, more uniformity, and funding; and that there should be a school within a convenient distance to most students.
1861 The new Constitution acknowledged the responsibility of the state to provide a uniform system of common schools and schools of higher grades for its people; an elected State Superintendent of Public Instruction was given general supervision of common school funds and educational interests of the state. The tasks of the Superintendent were generally clerical.
The Legislature believed that education was key to the state's growth and improvement.
1871 The first state elementary course of study was formulated.
There was no consistency across the state in what was taught and at what grade level. A suggested course of study could encourage more consistency.
1873 First State Board of Education was created, consisting of the State Superintendent of Public Instruction (elected for a term of two years), the Chancellor of the State University, the President of the State Agricultural College and the Principals of the State Normal Schools at Emporia and Leavenworth (3 members, appointed by the Governor, were added in 1893; and Board members began to be compensated for travel costs).
The Legislature felt that, in order to have quality teachers, a Board was needed to examine prospective teachers and to issue diplomas and certificates. The new process ensured a minimum skill level for teachers who received certificates from the Board.
1874 Students ages 8-14 were required by law to attend school during the 3-4 month school year, unless they were exempted by the local school board.
Communities felt that education was important to their citizenry. Therefore, all children, except those with mental and physical handicaps, should attend school.
1876 A sequence of courses for high schools was developed by the University of Kansas and tied to school accreditation and to a student's automatic admittance to the University.
The University wanted to assure a minimum skill level among entering freshman.
1885 County high schools were authorized in any county with 6,000 or more inhabitants. They were not under the same authority as the common schools and often competed for tax dollars and students with common schools that offered high school classes.
Communities wanted to provide more than an elementary education to their children. Many of the common school districts did not have the money or students to have their own high schools.
1893 State Board was authorized to accredit schools of education.
In order to have confidence in the quality of a teaching certificate granted by a school of education, the State Board needed authority to monitor the quality of the training.
16
Kansas School Governance Continued
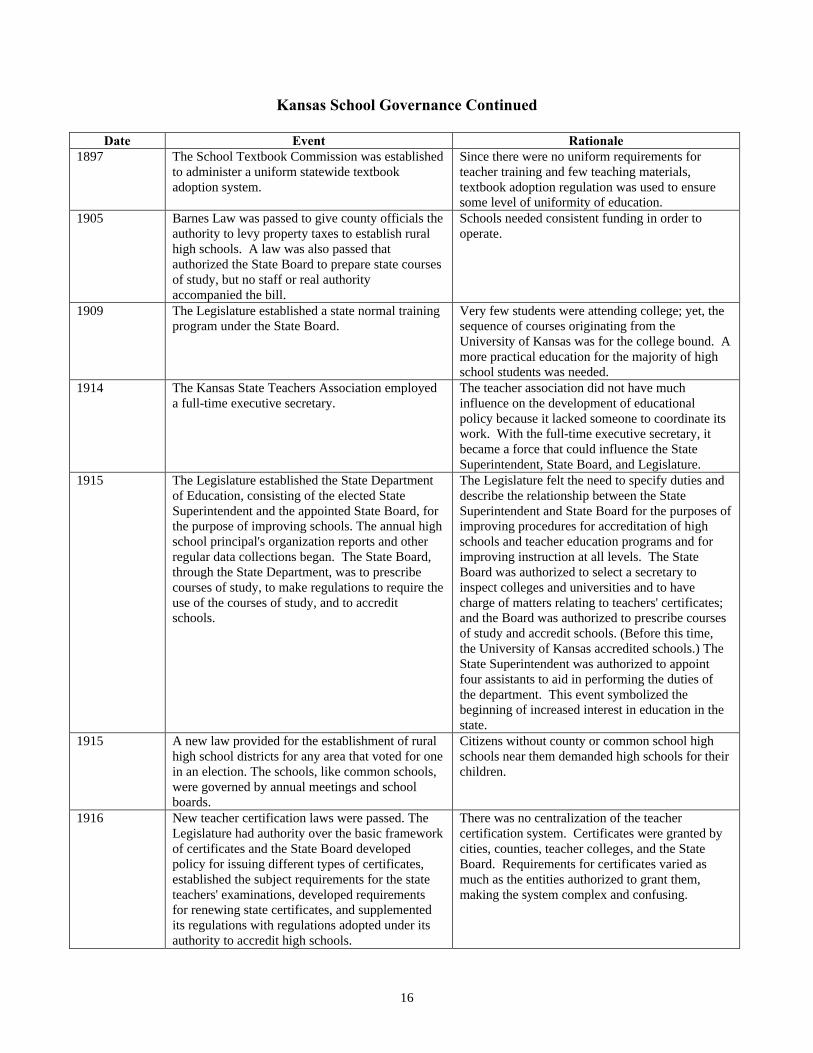
Date Event Rationale 1897 The School Textbook Commission was established
to administer a uniform statewide textbook adoption system.
Since there were no uniform requirements for teacher training and few teaching materials, textbook adoption regulation was used to ensure some level of uniformity of education.
1905 Barnes Law was passed to give county officials the authority to levy property taxes to establish rural high schools. A law was also passed that authorized the State Board to prepare state courses of study, but no staff or real authority accompanied the bill.
Schools needed consistent funding in order to operate.
1909 The Legislature established a state normal training program under the State Board.
Very few students were attending college; yet, the sequence of courses originating from the University of Kansas was for the college bound. A more practical education for the majority of high school students was needed.
1914 The Kansas State Teachers Association employed a full-time executive secretary.
The teacher association did not have much influence on the development of educational policy because it lacked someone to coordinate its work. With the full-time executive secretary, it became a force that could influence the State Superintendent, State Board, and Legislature.
1915 The Legislature established the State Department of Education, consisting of the elected State Superintendent and the appointed State Board, for the purpose of improving schools. The annual high school principal's organization reports and other regular data collections began. The State Board, through the State Department, was to prescribe courses of study, to make regulations to require the use of the courses of study, and to accredit schools.
The Legislature felt the need to specify duties and describe the relationship between the State Superintendent and State Board for the purposes of improving procedures for accreditation of high schools and teacher education programs and for improving instruction at all levels. The State Board was authorized to select a secretary to inspect colleges and universities and to have charge of matters relating to teachers' certificates; and the Board was authorized to prescribe courses of study and accredit schools. (Before this time, the University of Kansas accredited schools.) The State Superintendent was authorized to appoint four assistants to aid in performing the duties of the department. This event symbolized the beginning of increased interest in education in the state.
1915 A new law provided for the establishment of rural high school districts for any area that voted for one in an election. The schools, like common schools, were governed by annual meetings and school boards.
Citizens without county or common school high schools near them demanded high schools for their children.
1916 New teacher certification laws were passed. The Legislature had authority over the basic framework of certificates and the State Board developed policy for issuing different types of certificates, established the subject requirements for the state teachers' examinations, developed requirements for renewing state certificates, and supplemented its regulations with regulations adopted under its authority to accredit high schools.
There was no centralization of the teacher certification system. Certificates were granted by cities, counties, teacher colleges, and the State Board. Requirements for certificates varied as much as the entities authorized to grant them, making the system complex and confusing.
17
Kansas School Governance Continued
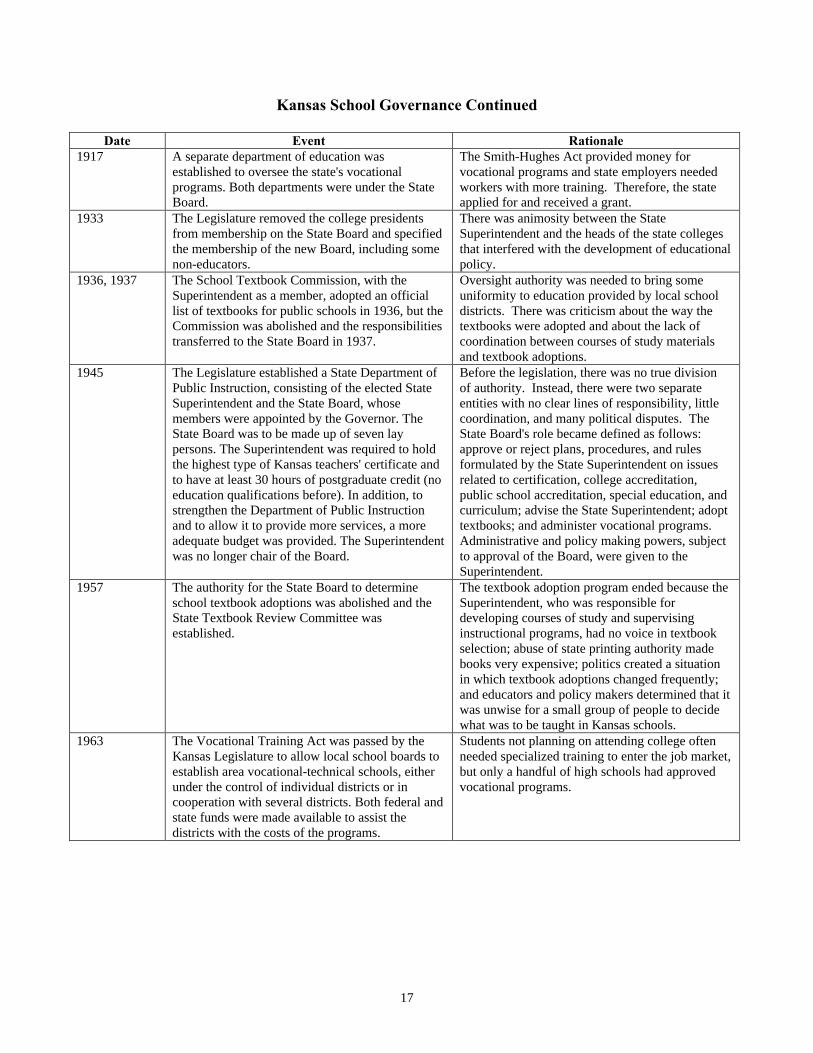
Date Event Rationale 1917 A separate department of education was
established to oversee the state's vocational programs. Both departments were under the State Board.
The Smith-Hughes Act provided money for vocational programs and state employers needed workers with more training. Therefore, the state applied for and received a grant.
1933 The Legislature removed the college presidents from membership on the State Board and specified the membership of the new Board, including some non-educators.
There was animosity between the State Superintendent and the heads of the state colleges that interfered with the development of educational policy.
1936, 1937 The School Textbook Commission, with the Superintendent as a member, adopted an official list of textbooks for public schools in 1936, but the Commission was abolished and the responsibilities transferred to the State Board in 1937.
Oversight authority was needed to bring some uniformity to education provided by local school districts. There was criticism about the way the textbooks were adopted and about the lack of coordination between courses of study materials and textbook adoptions.
1945 The Legislature established a State Department of Public Instruction, consisting of the elected State Superintendent and the State Board, whose members were appointed by the Governor. The State Board was to be made up of seven lay persons. The Superintendent was required to hold the highest type of Kansas teachers' certificate and to have at least 30 hours of postgraduate credit (no education qualifications before). In addition, to strengthen the Department of Public Instruction and to allow it to provide more services, a more adequate budget was provided. The Superintendent was no longer chair of the Board.
Before the legislation, there was no true division of authority. Instead, there were two separate entities with no clear lines of responsibility, little coordination, and many political disputes. The State Board's role became defined as follows: approve or reject plans, procedures, and rules formulated by the State Superintendent on issues related to certification, college accreditation, public school accreditation, special education, and curriculum; advise the State Superintendent; adopt textbooks; and administer vocational programs. Administrative and policy making powers, subject to approval of the Board, were given to the Superintendent.
1957 The authority for the State Board to determine school textbook adoptions was abolished and the State Textbook Review Committee was established.
The textbook adoption program ended because the Superintendent, who was responsible for developing courses of study and supervising instructional programs, had no voice in textbook selection; abuse of state printing authority made books very expensive; politics created a situation in which textbook adoptions changed frequently; and educators and policy makers determined that it was unwise for a small group of people to decide what was to be taught in Kansas schools.
1963 The Vocational Training Act was passed by the Kansas Legislature to allow local school boards to establish area vocational-technical schools, either under the control of individual districts or in cooperation with several districts. Both federal and state funds were made available to assist the districts with the costs of the programs.
Students not planning on attending college often needed specialized training to enter the job market, but only a handful of high schools had approved vocational programs.
18
Kansas School Governance Continued
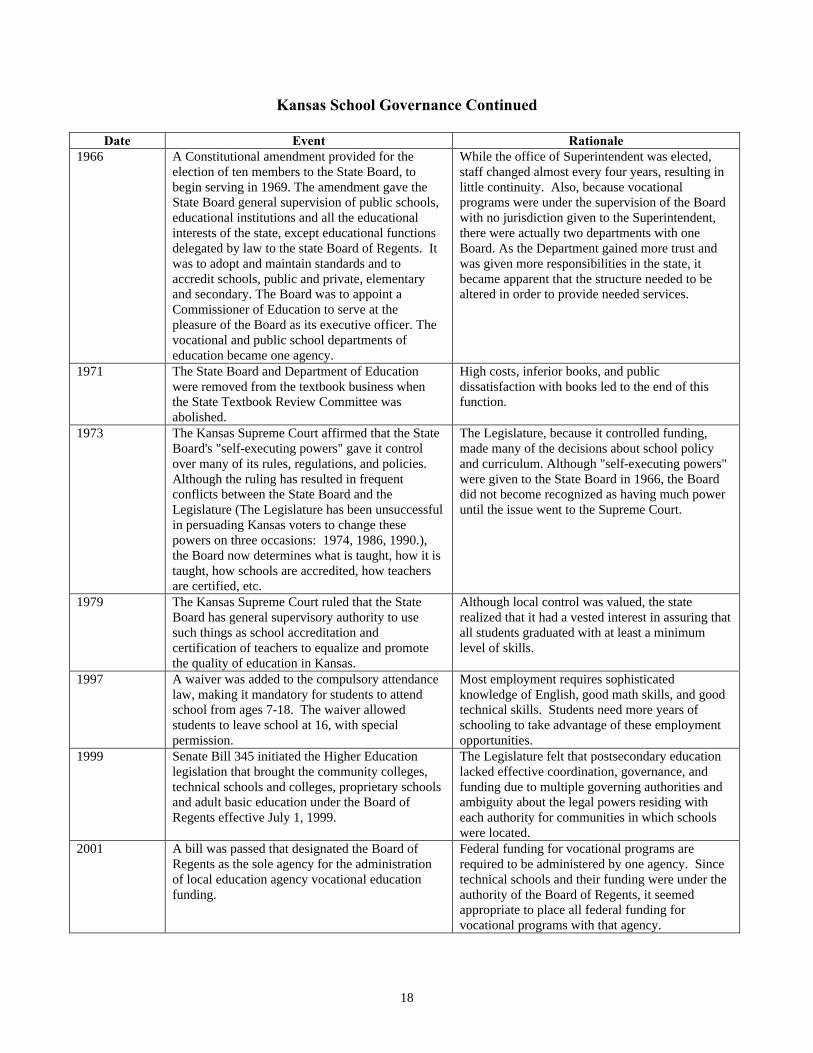
Date Event Rationale 1966 A Constitutional amendment provided for the
election of ten members to the State Board, to begin serving in 1969. The amendment gave the State Board general supervision of public schools, educational institutions and all the educational interests of the state, except educational functions delegated by law to the state Board of Regents. It was to adopt and maintain standards and to accredit schools, public and private, elementary and secondary. The Board was to appoint a Commissioner of Education to serve at the pleasure of the Board as its executive officer. The vocational and public school departments of education became one agency.
While the office of Superintendent was elected, staff changed almost every four years, resulting in little continuity. Also, because vocational programs were under the supervision of the Board with no jurisdiction given to the Superintendent, there were actually two departments with one Board. As the Department gained more trust and was given more responsibilities in the state, it became apparent that the structure needed to be altered in order to provide needed services.
1971 The State Board and Department of Education were removed from the textbook business when the State Textbook Review Committee was abolished.
High costs, inferior books, and public dissatisfaction with books led to the end of this function.
1973 The Kansas Supreme Court affirmed that the State Board's "self-executing powers" gave it control over many of its rules, regulations, and policies. Although the ruling has resulted in frequent conflicts between the State Board and the Legislature (The Legislature has been unsuccessful in persuading Kansas voters to change these powers on three occasions: 1974, 1986, 1990.), the Board now determines what is taught, how it is taught, how schools are accredited, how teachers are certified, etc.
The Legislature, because it controlled funding, made many of the decisions about school policy and curriculum. Although "self-executing powers" were given to the State Board in 1966, the Board did not become recognized as having much power until the issue went to the Supreme Court.
1979 The Kansas Supreme Court ruled that the State Board has general supervisory authority to use such things as school accreditation and certification of teachers to equalize and promote the quality of education in Kansas.
Although local control was valued, the state realized that it had a vested interest in assuring that all students graduated with at least a minimum level of skills.
1997 A waiver was added to the compulsory attendance law, making it mandatory for students to attend school from ages 7-18. The waiver allowed students to leave school at 16, with special permission.
Most employment requires sophisticated knowledge of English, good math skills, and good technical skills. Students need more years of schooling to take advantage of these employment opportunities.
1999 Senate Bill 345 initiated the Higher Education legislation that brought the community colleges, technical schools and colleges, proprietary schools and adult basic education under the Board of Regents effective July 1, 1999.
The Legislature felt that postsecondary education lacked effective coordination, governance, and funding due to multiple governing authorities and ambiguity about the legal powers residing with each authority for communities in which schools were located.
2001 A bill was passed that designated the Board of Regents as the sole agency for the administration of local education agency vocational education funding.
Federal funding for vocational programs are required to be administered by one agency. Since technical schools and their funding were under the authority of the Board of Regents, it seemed appropriate to place all federal funding for vocational programs with that agency.
19
Kansas Teacher Preparation/Certification
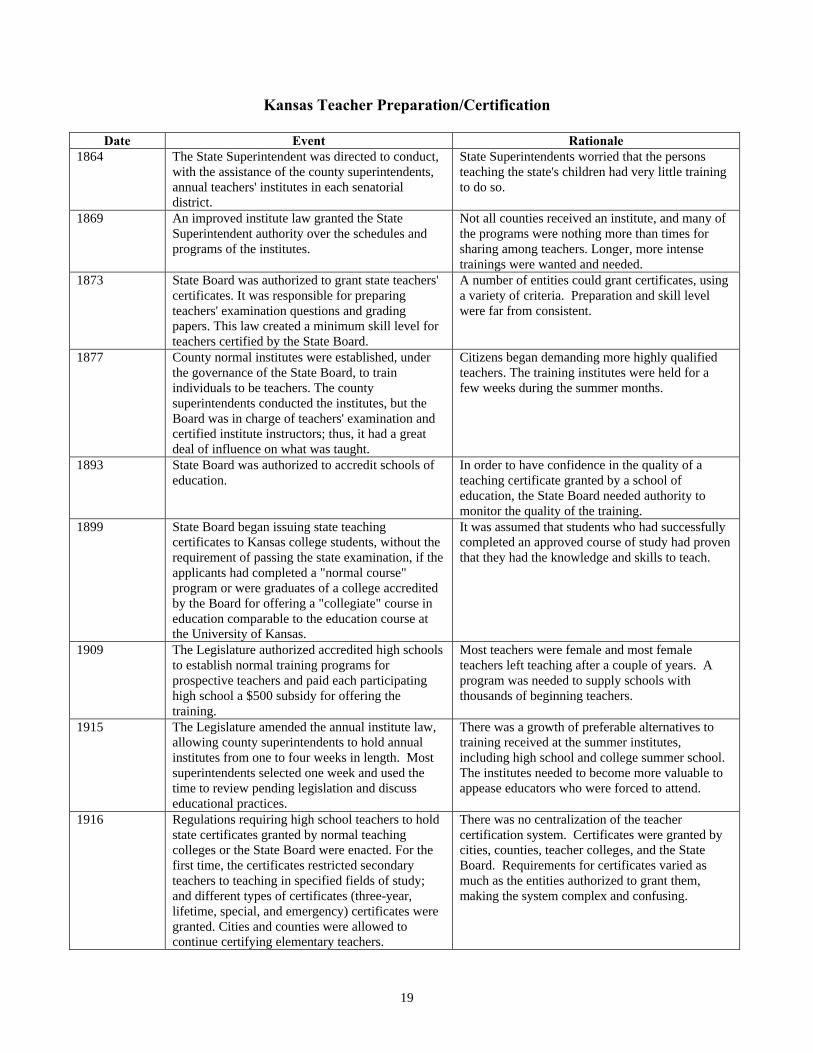
Date Event Rationale 1864 The State Superintendent was directed to conduct,
with the assistance of the county superintendents, annual teachers' institutes in each senatorial district.
State Superintendents worried that the persons teaching the state's children had very little training to do so.
1869 An improved institute law granted the State Superintendent authority over the schedules and programs of the institutes.
Not all counties received an institute, and many of the programs were nothing more than times for sharing among teachers. Longer, more intense trainings were wanted and needed.
1873 State Board was authorized to grant state teachers' certificates. It was responsible for preparing teachers' examination questions and grading papers. This law created a minimum skill level for teachers certified by the State Board.
A number of entities could grant certificates, using a variety of criteria. Preparation and skill level were far from consistent.
1877 County normal institutes were established, under the governance of the State Board, to train individuals to be teachers. The county superintendents conducted the institutes, but the Board was in charge of teachers' examination and certified institute instructors; thus, it had a great deal of influence on what was taught.
Citizens began demanding more highly qualified teachers. The training institutes were held for a few weeks during the summer months.
1893 State Board was authorized to accredit schools of education.
In order to have confidence in the quality of a teaching certificate granted by a school of education, the State Board needed authority to monitor the quality of the training.
1899 State Board began issuing state teaching certificates to Kansas college students, without the requirement of passing the state examination, if the applicants had completed a "normal course" program or were graduates of a college accredited by the Board for offering a "collegiate" course in education comparable to the education course at the University of Kansas.
It was assumed that students who had successfully completed an approved course of study had proven that they had the knowledge and skills to teach.
1909 The Legislature authorized accredited high schools to establish normal training programs for prospective teachers and paid each participating high school a $500 subsidy for offering the training.
Most teachers were female and most female teachers left teaching after a couple of years. A program was needed to supply schools with thousands of beginning teachers.
1915 The Legislature amended the annual institute law, allowing county superintendents to hold annual institutes from one to four weeks in length. Most superintendents selected one week and used the time to review pending legislation and discuss educational practices.
There was a growth of preferable alternatives to training received at the summer institutes, including high school and college summer school. The institutes needed to become more valuable to appease educators who were forced to attend.
1916 Regulations requiring high school teachers to hold state certificates granted by normal teaching colleges or the State Board were enacted. For the first time, the certificates restricted secondary teachers to teaching in specified fields of study; and different types of certificates (three-year, lifetime, special, and emergency) certificates were granted. Cities and counties were allowed to continue certifying elementary teachers.
There was no centralization of the teacher certification system. Certificates were granted by cities, counties, teacher colleges, and the State Board. Requirements for certificates varied as much as the entities authorized to grant them, making the system complex and confusing.

20
Kansas Teacher Preparation/Certification Continued
Date Event Rationale 1937 Legislation was passed which permitted only the
State Department of Education or state teachers' colleges to issue teacher certificates.
The State Board, normal schools, counties, and some cities were all issuing teacher certificates for elementary teachers. There were no consistent standards used.
1939 The Legislature made the county institutes permissive rather than mandatory.
The State Board of Education paid little attention to the county institutes after the institutes were shortened and there were fewer state controls. Quality and length of the institutes varied.
1947 Law permitting state teachers' colleges to issue certificates was repealed. Normal training at high schools was abolished.
The Legislature thought it would be best if all certificates were granted from the same entity using the same standards.
1957 Standards for certification of special education teachers and other staff were substantially changed.
Special education teacher certification required both a regular teacher certificate and additional specialty training rather than qualitatively different training. The requirement contributed to the lack of special education teachers, supervisors, and professional support personnel.
1959 The Board increased the training requirement for a certificate to a college degree and raised standards for accrediting education departments of colleges.
During World War II, hundreds of teachers left the profession to serve in the armed forces or to take more lucrative positions. Thus, standards for teachers had to be lowered in order to fill classrooms. After the war, steps were taken to increase teacher and teaching standards. The issue became more of a priority after Sputnik created doubts about the superiority of the nation's education system.
1970 The Professional Negotiations Act was passed. Teachers did not have the right to bargain with local boards of education about working conditions and salaries. Teachers lobbied for and won the right, due in part to increased certification requirements, a more diverse teacher population, and teacher shortages.
1974 Teachers received protection under the law with the passage of the Teachers Due Process Act.
Procedures were needed to protect the property rights (teaching contracts) of teachers.
1983 The State Board implemented a new recertification program, based on college credit and/or inservice points.
The Board believed that carefully structured, district sponsored inservice could provide quality training to teachers.
1985 New requirements for certification became effective. Applicants applying for certification based on completion of a state-approved program needed to have a minimum cumulative grade point average of 2.5 on a 4.0 grade point system. The following year, applicants had to also satisfactorily pass the precertification examination prescribed by the State Board.
There was concern that persons choosing to enter the education profession had weaker academic skills than persons choosing other professions. The State Board wanted to ensure that competent individuals were being certified as teachers.
2000 Incentives for national certification and mentoring of first year teachers were approved by the Legislature. New teacher licensing regulations were approved by the State Board.
The Legislature and State Board believed that teacher quality would improve if certification was standards and outcomes-based and if new teachers were mentored by skilled, experienced teachers.
21
Kansas School Accreditation/Improvement
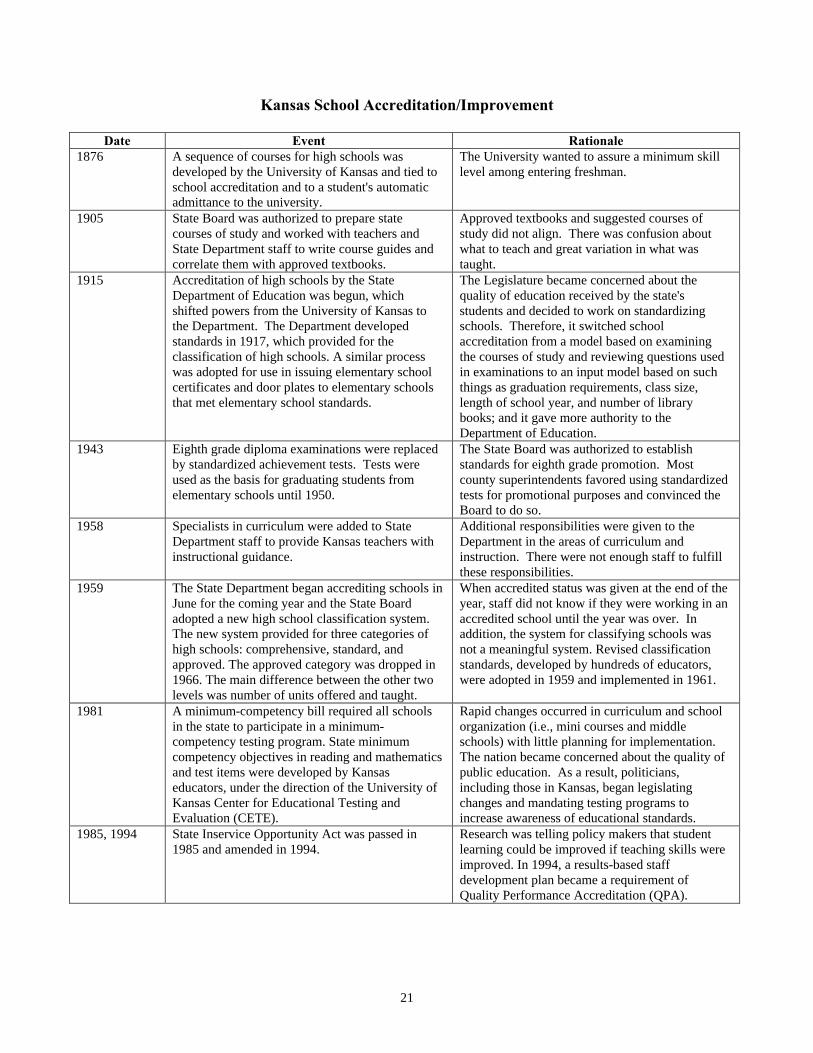
Date Event Rationale 1876 A sequence of courses for high schools was
developed by the University of Kansas and tied to school accreditation and to a student's automatic admittance to the university.
The University wanted to assure a minimum skill level among entering freshman.
1905 State Board was authorized to prepare state courses of study and worked with teachers and State Department staff to write course guides and correlate them with approved textbooks.
Approved textbooks and suggested courses of study did not align. There was confusion about what to teach and great variation in what was taught.
1915 Accreditation of high schools by the State Department of Education was begun, which shifted powers from the University of Kansas to the Department. The Department developed standards in 1917, which provided for the classification of high schools. A similar process was adopted for use in issuing elementary school certificates and door plates to elementary schools that met elementary school standards.
The Legislature became concerned about the quality of education received by the state's students and decided to work on standardizing schools. Therefore, it switched school accreditation from a model based on examining the courses of study and reviewing questions used in examinations to an input model based on such things as graduation requirements, class size, length of school year, and number of library books; and it gave more authority to the Department of Education.
1943 Eighth grade diploma examinations were replaced by standardized achievement tests. Tests were used as the basis for graduating students from elementary schools until 1950.
The State Board was authorized to establish standards for eighth grade promotion. Most county superintendents favored using standardized tests for promotional purposes and convinced the Board to do so.
1958 Specialists in curriculum were added to State Department staff to provide Kansas teachers with instructional guidance.
Additional responsibilities were given to the Department in the areas of curriculum and instruction. There were not enough staff to fulfill these responsibilities.
1959 The State Department began accrediting schools in June for the coming year and the State Board adopted a new high school classification system. The new system provided for three categories of high schools: comprehensive, standard, and approved. The approved category was dropped in 1966. The main difference between the other two levels was number of units offered and taught.
When accredited status was given at the end of the year, staff did not know if they were working in an accredited school until the year was over. In addition, the system for classifying schools was not a meaningful system. Revised classification standards, developed by hundreds of educators, were adopted in 1959 and implemented in 1961.
1981 A minimum-competency bill required all schools in the state to participate in a minimum-competency testing program. State minimum competency objectives in reading and mathematics and test items were developed by Kansas educators, under the direction of the University of Kansas Center for Educational Testing and Evaluation (CETE).
Rapid changes occurred in curriculum and school organization (i.e., mini courses and middle schools) with little planning for implementation. The nation became concerned about the quality of public education. As a result, politicians, including those in Kansas, began legislating changes and mandating testing programs to increase awareness of educational standards.
1985, 1994 State Inservice Opportunity Act was passed in 1985 and amended in 1994.
Research was telling policy makers that student learning could be improved if teaching skills were improved. In 1994, a results-based staff development plan became a requirement of Quality Performance Accreditation (QPA).
22
Kansas School Accreditation/Improvement Continued
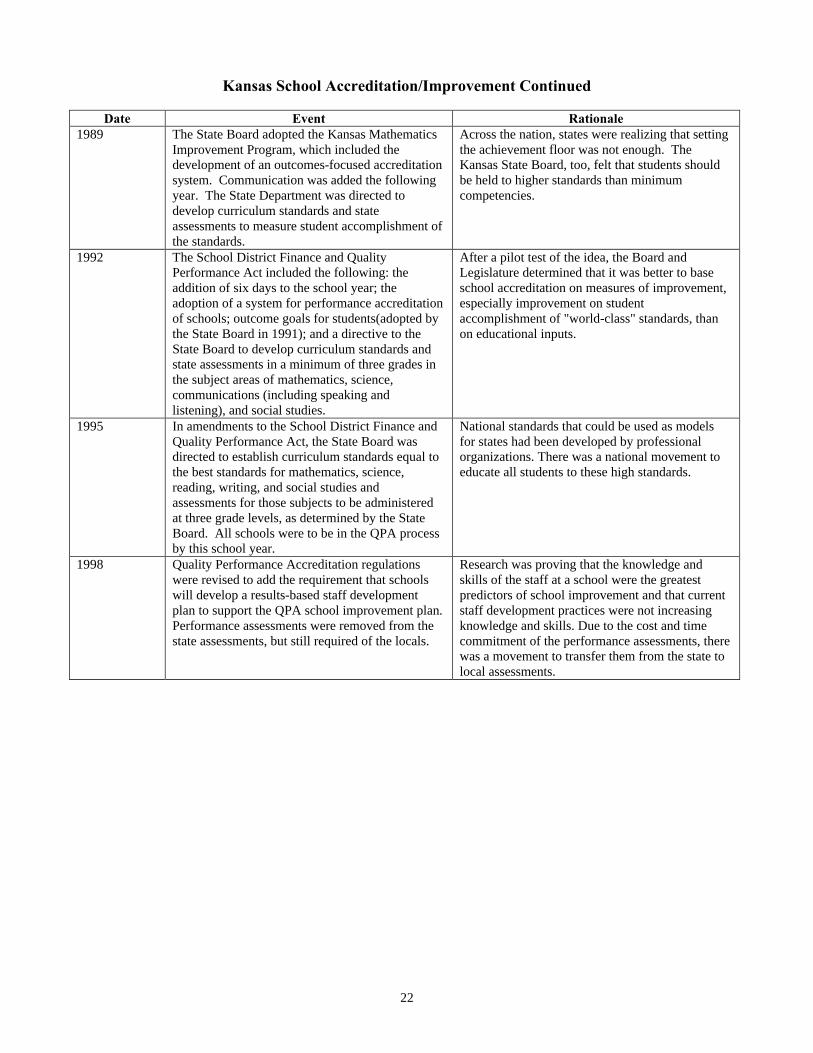
Date Event Rationale 1989 The State Board adopted the Kansas Mathematics
Improvement Program, which included the development of an outcomes-focused accreditation system. Communication was added the following year. The State Department was directed to develop curriculum standards and state assessments to measure student accomplishment of the standards.
Across the nation, states were realizing that setting the achievement floor was not enough. The Kansas State Board, too, felt that students should be held to higher standards than minimum competencies.
1992 The School District Finance and Quality Performance Act included the following: the addition of six days to the school year; the adoption of a system for performance accreditation of schools; outcome goals for students(adopted by the State Board in 1991); and a directive to the State Board to develop curriculum standards and state assessments in a minimum of three grades in the subject areas of mathematics, science, communications (including speaking and listening), and social studies.
After a pilot test of the idea, the Board and Legislature determined that it was better to base school accreditation on measures of improvement, especially improvement on student accomplishment of "world-class" standards, than on educational inputs.
1995 In amendments to the School District Finance and Quality Performance Act, the State Board was directed to establish curriculum standards equal to the best standards for mathematics, science, reading, writing, and social studies and assessments for those subjects to be administered at three grade levels, as determined by the State Board. All schools were to be in the QPA process by this school year.
National standards that could be used as models for states had been developed by professional organizations. There was a national movement to educate all students to these high standards.
1998 Quality Performance Accreditation regulations were revised to add the requirement that schools will develop a results-based staff development plan to support the QPA school improvement plan. Performance assessments were removed from the state assessments, but still required of the locals.
Research was proving that the knowledge and skills of the staff at a school were the greatest predictors of school improvement and that current staff development practices were not increasing knowledge and skills. Due to the cost and time commitment of the performance assessments, there was a movement to transfer them from the state to local assessments.
23
Kansas Special Education
Date Event Rationale
1874 Students with mental and physical disabilities were excluded from compulsory school attendance.
Mental and/or physical conditions prevented some students from attending or benefiting from school attendance without special assistance. That assistance was not available.
1881 The Kansas Constitution stated that the care, treatment, and education of the handicapped were responsibilities of public residential institutions. The Kansas State Asylum for Idiotic and Imbecile Youth was temporarily established at Lawrence and then moved to Winfield in 1887.
Little research had been conducted on best educational practices for handicapped children. Lawmakers had no empirical evidence that they should include these children in the already overcrowded public education system.
1949 A special education division was created in the State Department of Public Instruction. The first appropriations for financing special education classes were made two years later.
Groups concerned with providing special services for the education of handicapped and other non-typical children in home communities united to push through legislation authorizing such services (although provision of services and student attendance in programs was voluntary). A division in the Department was needed to promote, direct and supervise education for exceptional children. Staff of the division also conducted many of the student evaluations because local district staff were not trained to do them.
1951 Reimbursement was authorized for public school programs for students with mental retardation and homebound students.
Although the state enacted legislation, beginning in 1927, for the education of disabled students, no appropriations to assist schools with the high costs of educating disabled students had been made.
1953 Parsons State Hospital and Training Center was established on the grounds of the former State Hospital for Epileptics.
Public residential institutions were believed to be the most appropriate settings for severely handicapped children.
1967 A law that expanded the educational programs and funding for exceptional children was passed.
It was believed that by giving teachers training and districts time to plan how and where they would provide services, the goal of providing more appropriate services to disabled students would be realized. Until this time, shortage of classroom space and appropriately trained teachers slowed the growth of public school special education.
1969 A law was passed to mandate special education services for mentally handicapped students in public school districts by the 1974-75 school year. The only age limitation was that students should be under 21 years of age.
Prior to 1969, special education was allowed and even encouraged for students of regular school age. With federal funding available to assist with costs, policy makers wanted to guarantee services to all mentally handicapped students; however, they understood that planning programs and finding space and teachers would take time.
1972 Amendments to the special education law expanded the mandate for special education to include those with learning disabilities and authorized district mill levies to be increased for special education programs.
Not all developmentally delayed students were mentally retarded. These students needed services and districts needed funds to provide the services.

24
Kansas Special Education Continued
Date Event Rationale
1974 Combined efforts of both professional and parent associations led to the passage of the Special Education for Exceptional Children Act, to be operative by July 1, 1979. The Act mandated services and revised the special education funding formula.
Special education laws had been approved in a piecemeal fashion and were fragmented. School districts were meeting less than 50 percent of the need for adequate educational programs for exceptional children and needed more adequate financing, technical assistance, and staff training. In addition, Section 504 of the Rehabilitation Act made it clear that a person cannot be excluded from any program receiving federal funds on the basis of handicap alone.
1979 The special education mandate was expanded to include the gifted and talented.
Parents and professionals felt that gifted and talented students also needed specialized services in order to realize their potential. The Gifted and Talented Children's Education Act provided financial incentives for states that provided the services.
1988 Pupil was redefined to include 3-and 4-year-olds who were regularly enrolled in the district and attending special education services. Those properly enrolled were eligible for state equalization and special education funds.
Because the state did not lower its compulsory attendance age for disabled students to age 3, it was out of compliance with federal laws and in danger of losing significant funds.
1992 Kansas regulations were changed, revising the definition of "person acting as parent" and requiring local boards of education to provide special education services to exceptional children who are residents of the local school district.
There was confusion as to who was responsible for the education of an exceptional child who was living with someone other than a parent in a school district other than the one in which a parent resided.
1997 Juvenile correctional facilities at Atchison, Beloit, and Topeka were allowed payment for special education services provided at those facilities.
All children with special needs were to be provided an appropriate education, even those at correctional facilities. Correctional facilities were not able to provide services without financial assistance.
2000 Revisions to Kansas special education regulations were approved. Professionals were allowed more freedom in assessing student need for services.
Changes were needed in Kansas regulations in order to bring the regulations into compliance with 1997 amendments to IDEA. Also, research had shown that changes in regulations would assist professionals in efforts to better identify and meet the needs of students with disabilities. Before the new regulations were passed, eligibility determination was primarily a paper trail to document tests used and results obtained. Eligibility for services was a yes/no decision, often based on a cut score on a standardized test.
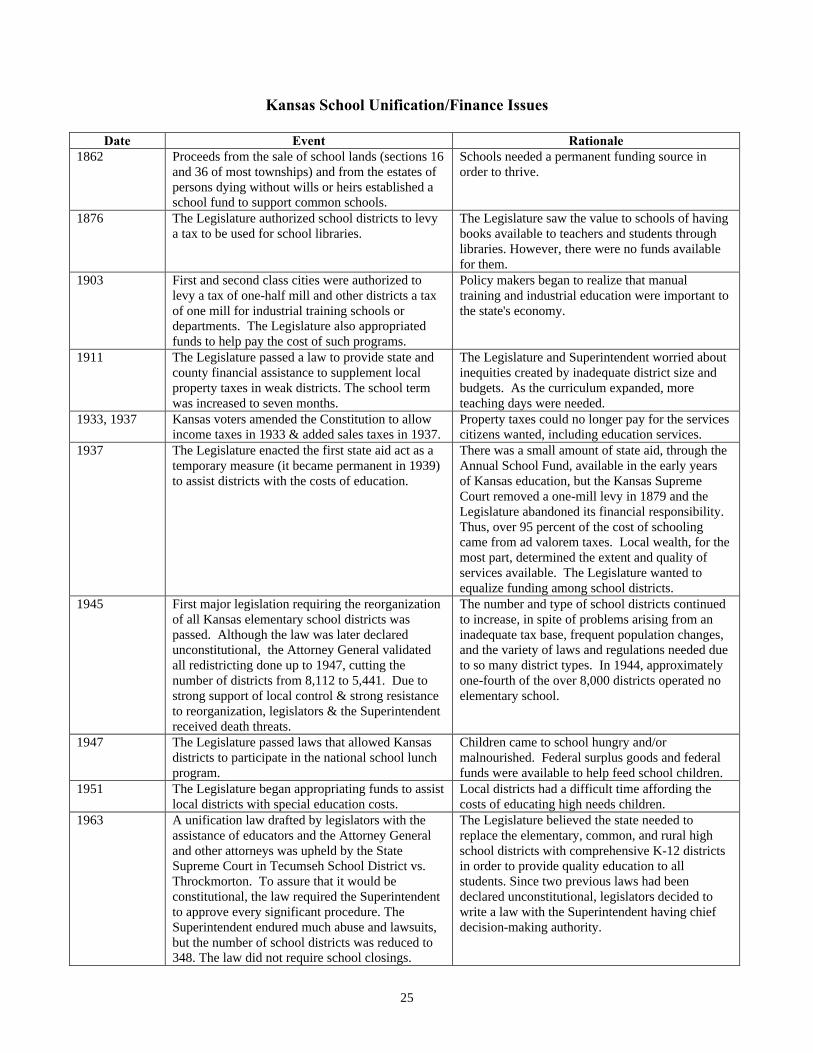
25
Kansas School Unification/Finance Issues
Date Event Rationale 1862 Proceeds from the sale of school lands (sections 16
and 36 of most townships) and from the estates of persons dying without wills or heirs established a school fund to support common schools.
Schools needed a permanent funding source in order to thrive.
1876 The Legislature authorized school districts to levy a tax to be used for school libraries.
The Legislature saw the value to schools of having books available to teachers and students through libraries. However, there were no funds available for them.
1903 First and second class cities were authorized to levy a tax of one-half mill and other districts a tax of one mill for industrial training schools or departments. The Legislature also appropriated funds to help pay the cost of such programs.
Policy makers began to realize that manual training and industrial education were important to the state's economy.
1911 The Legislature passed a law to provide state and county financial assistance to supplement local property taxes in weak districts. The school term was increased to seven months.
The Legislature and Superintendent worried about inequities created by inadequate district size and budgets. As the curriculum expanded, more teaching days were needed.
1933, 1937 Kansas voters amended the Constitution to allow income taxes in 1933 & added sales taxes in 1937.
Property taxes could no longer pay for the services citizens wanted, including education services.
1937 The Legislature enacted the first state aid act as a temporary measure (it became permanent in 1939) to assist districts with the costs of education.
There was a small amount of state aid, through the Annual School Fund, available in the early years of Kansas education, but the Kansas Supreme Court removed a one-mill levy in 1879 and the Legislature abandoned its financial responsibility. Thus, over 95 percent of the cost of schooling came from ad valorem taxes. Local wealth, for the most part, determined the extent and quality of services available. The Legislature wanted to equalize funding among school districts.
1945 First major legislation requiring the reorganization of all Kansas elementary school districts was passed. Although the law was later declared unconstitutional, the Attorney General validated all redistricting done up to 1947, cutting the number of districts from 8,112 to 5,441. Due to strong support of local control & strong resistance to reorganization, legislators & the Superintendent received death threats.
The number and type of school districts continued to increase, in spite of problems arising from an inadequate tax base, frequent population changes, and the variety of laws and regulations needed due to so many district types. In 1944, approximately one-fourth of the over 8,000 districts operated no elementary school.
1947 The Legislature passed laws that allowed Kansas districts to participate in the national school lunch program.
Children came to school hungry and/or malnourished. Federal surplus goods and federal funds were available to help feed school children.
1951 The Legislature began appropriating funds to assist local districts with special education costs.
Local districts had a difficult time affording the costs of educating high needs children.
1963 A unification law drafted by legislators with the assistance of educators and the Attorney General and other attorneys was upheld by the State Supreme Court in Tecumseh School District vs. Throckmorton. To assure that it would be constitutional, the law required the Superintendent to approve every significant procedure. The Superintendent endured much abuse and lawsuits, but the number of school districts was reduced to 348. The law did not require school closings.
The Legislature believed the state needed to replace the elementary, common, and rural high school districts with comprehensive K-12 districts in order to provide quality education to all students. Since two previous laws had been declared unconstitutional, legislators decided to write a law with the Superintendent having chief decision-making authority.

26
Kansas School Unification/Finance Issues Continued
Date Event Rationale 1965 The School Foundation Finance Act was passed
for the purpose of assuring all students a "basic" education. State funding for education increased from $29.5 million in 1960 to almost $215 million in 1970.
The various methods of financing education in the districts led to unequal funds available for education among districts and, therefore, unequal educational opportunities for students. School funding came from at least a dozen local and state sources. Legislators recognized that reliance of local school districts on ad valorem taxes created an inequitable system.
1967, 1969 Laws covering the transfer of school district territory, disorganization of school districts, and consolidation of school districts were passed.
As Kansas became more urban and industrialized, demands for persons with more education and specialized skills increased. Laws were needed to attain greater equity among school districts in their abilities to provide all children with a good education.
1973 The School District Equalization Act was passed to determine how much or how little state aid was received by a district.
Districts were not on equal financial footing when it came to providing quality education for students. A second attempt needed to be made to equalize financial ability and to give each school district power to select its level of funding.
1982 Districts with enrollments over 1,600 were allowed to close schools to improve the school system and districts with lower enrollments were allowed to close schools after allowing public hearings and possible protest referendums.
The unification law had reduced the number of districts, but there were still far too many small schools.
1992 A formula that based each district's spending on a per pupil amount with weighting to recognize higher costs associated with some district characteristics (such as 1.5 weighting for vocational education students), the School District Finance and Quality Performance Act, was passed. Districts wishing to spend more were authorized to adopt a local option budget. Although the formula was challenged, in 1994 the funding formula was declared constitutional by the Kansas Supreme Court. Providing education became more of a state responsibility, and the percent of state funding in local operating budgets increased from 44 percent in 1991 to about 76 percent in 1997.
There was not true equalization of ability to fund education among Kansas districts. Some spent three times as much as other districts for each student because of differences in property value. When 40 school districts filed suit challenging the constitutionality of the formula, a committee was appointed to draft a new formula. The committee was asked to find a way that the state could provide equally for every child, taking into account unique pupil and school district characteristics.
2000/2001 School Year
The Vision 21st Century Initiative K-12 Education: Financing for Results Task Force Report and A Comprehensive Study on the Organization of Kansas School Districts were presented. In addition, the Legislative Educational Planning Committee (LEPC) was asked to conduct a professional evaluation of school district finance to determine the cost of a suitable education in Kansas.
Problems caused by increased education costs, local option budgets, and declining student enrollments in many districts have led many policy makers to belief that the current finance and accountability formula needs to be revamped. Therefore, a task force was charged with looking at finance and accountability options, the LEPC was asked to determine the cost of a suitable education, and consultants were charged with developing alternative ways to reorganize school districts.

27
Kansas Postsecondary Education
Date Event Rationale 1917 The first junior colleges were founded, using
district-wide taxes, and schools were authorized to participate in federally reimbursed vocational education programs.
Communities wanted to have postsecondary courses that met the needs of local business and industry offered nearby and at a low cost to their citizens.
1922 The State Board of Education organized a separate department for vocational education.
There were many power disputes between the State Board and State Superintendent. Because the Federal Board of Vocational Education encouraged the separation of vocational education from other education so that vocational education would receive sufficient emphasis, the State Board took the opportunity to create the new department.
1963 The Legislature enacted the Kansas Vocational Training Act, which allowed the establishment of separate vocational-technical schools.
Students not planning on attending college often needed specialized training to enter the job market, but only a handful of high schools had approved vocational programs.
1965 A state system of community junior colleges, a state system of vocational-technical schools, and a state technical institute were established. Local school districts ceased to govern the community colleges. Governance of the postsecondary programs was given to the Board of Education.
Policy makers realized that postsecondary education for more students was important to the state's economy; and that the administration and funding of the current system were inadequate to handle additional demands.
1997 The Board of Regents made public the details of the Qualified Admissions Program, to take effect the fall semester of 2001.
The Kansas Legislature was concerned about the readiness of college freshmen for a Regents university education. It required the Board of Regents to establish admission standards for freshmen and transfer applicants to a Regents university.
1999 Governance of the state system of community colleges and vocational-technical schools was moved to the Board of Regents.
The Legislature felt that postsecondary education lacked effective coordination, governance, and funding due to multiple governing authorities and ambiguity about the legal powers residing with each authority.

28
National Scene
Date Event Rationale 1896 In Plessy vs. Ferguson, the court ruled that
equality of treatment of all races is important, but not the abolishment of distinctions among the races, such as those based on color. In other words, separate but equal treatment was allowable.
Separate conveyances were provided for blacks and for whites. The argument for the separation was that it was best for the races not to interact because interaction could lead to such things as interracial marriage; and that separation did not mean that one race was being given lesser service.
1917 The Smith-Hughes Act provided federal incentive funds for expansion of vocational-training programs.
Business and industry expressed a need for more highly trained workers. Public schools were not providing enough training to prove them with an adequate supply of skilled workers.
1925 In Pierce vs. Society of Sisters, the court determined that states may compel attendance at some school, but parents can determine if their children will attend public or private school. The government was not allowed to eliminate competition to the public schools.
Parents were concerned that the government, if compulsory attendance was enforced, could indoctrinate their children in beliefs not held by the family. The government felt it needed an educated citizenry for its social and economic well-being. A compromise was needed.
1927 In Farrington vs. Tokushige, states were told that they could regulate such things as the qualifications of teachers and the subjects to be covered in foreign language schools. They could not, however, totally control or abolish the schools.
Groups of immigrants established their own schools in order to preserve their languages and cultures. Some states feared that the schools would keep the immigrants from assimilating into the mainstream and might be teaching students values that were detrimental to the nation.
1946 The National School Lunch Act was enacted for assisting school lunch programs through grants-in-aid and food distribution.
When young people began enlisting in the armed forces, it was discovered that many were malnourished and, therefore, unhealthy. Also, American farmers often had surplus goods that, if put on the market, would depress the price of those goods. A school lunch program could use food surpluses and could provide a healthier diet to the nation's young people.
1954 In Brown vs. Topeka Board of Education, the Supreme Court ruled that the "separate but equal" clause was unconstitutional because it violated children's 14th amendment rights by separating them solely on the classification of the color of their skin. Chief Justice Warren delivered the court's opinion, stating that "segregated schools are not equal and cannot be made equal, & hence they are deprived of the equal protection of the laws."
Schools in many cities and states were segregated on the basis of race. The education provided in schools serving black students was often of poorer quality than the education provided in other schools. The separate but equal distinction provided in the Plessy vs. Ferguson case was referred to by many, including the Supreme Court members, who began to realize that it was virtually impossible to provide "separate but equal" treatment and that interaction of diverse groups was an important part of education.
1954 The National Council for Accreditation of Teacher Education (NCATE) was founded as an independent accrediting body.
There was concern about the quality of teaching and teacher preparation. A mechanism was needed to help ensure high quality teacher preparation programs.
1957 President Eisenhower sent troops and federalized the entire Arkansas National Guard, taking the Guard away from the Governor, in order to protect nine black students who were to attend Central High in Little Rock as part of a school desegregation plan. The President's actions made it clear that the Supreme Court's decision was law and would be obeyed.
The Little Rock School District planned to obey federal law and integrate schools. However, Governor Orval Faubus and a mob of citizens against integration fought the plan. The Governor used the National Guard to surround the school and prevent black students from entering.
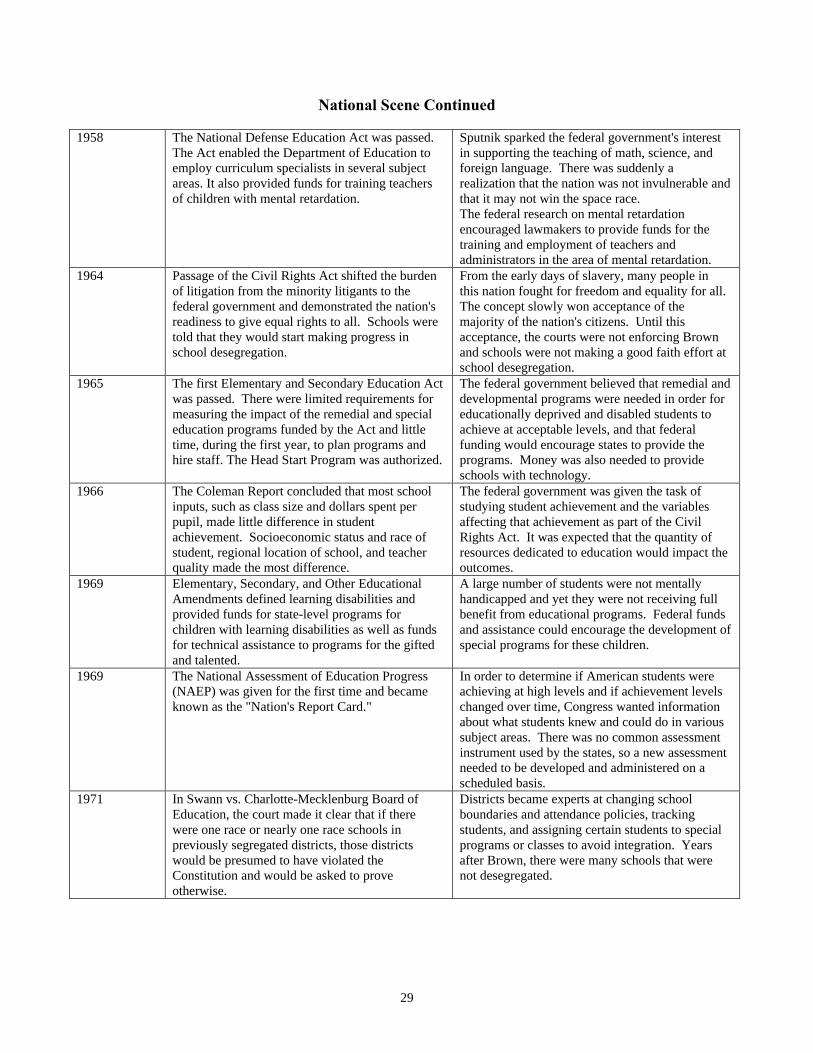
29
National Scene Continued 1958 The National Defense Education Act was passed.
The Act enabled the Department of Education to employ curriculum specialists in several subject areas. It also provided funds for training teachers of children with mental retardation.
Sputnik sparked the federal government's interest in supporting the teaching of math, science, and foreign language. There was suddenly a realization that the nation was not invulnerable and that it may not win the space race. The federal research on mental retardation encouraged lawmakers to provide funds for the training and employment of teachers and administrators in the area of mental retardation.
1964 Passage of the Civil Rights Act shifted the burden of litigation from the minority litigants to the federal government and demonstrated the nation's readiness to give equal rights to all. Schools were told that they would start making progress in school desegregation.
From the early days of slavery, many people in this nation fought for freedom and equality for all. The concept slowly won acceptance of the majority of the nation's citizens. Until this acceptance, the courts were not enforcing Brown and schools were not making a good faith effort at school desegregation.
1965 The first Elementary and Secondary Education Act was passed. There were limited requirements for measuring the impact of the remedial and special education programs funded by the Act and little time, during the first year, to plan programs and hire staff. The Head Start Program was authorized.
The federal government believed that remedial and developmental programs were needed in order for educationally deprived and disabled students to achieve at acceptable levels, and that federal funding would encourage states to provide the programs. Money was also needed to provide schools with technology.
1966 The Coleman Report concluded that most school inputs, such as class size and dollars spent per pupil, made little difference in student achievement. Socioeconomic status and race of student, regional location of school, and teacher quality made the most difference.
The federal government was given the task of studying student achievement and the variables affecting that achievement as part of the Civil Rights Act. It was expected that the quantity of resources dedicated to education would impact the outcomes.
1969 Elementary, Secondary, and Other Educational Amendments defined learning disabilities and provided funds for state-level programs for children with learning disabilities as well as funds for technical assistance to programs for the gifted and talented.
A large number of students were not mentally handicapped and yet they were not receiving full benefit from educational programs. Federal funds and assistance could encourage the development of special programs for these children.
1969 The National Assessment of Education Progress (NAEP) was given for the first time and became known as the "Nation's Report Card."
In order to determine if American students were achieving at high levels and if achievement levels changed over time, Congress wanted information about what students knew and could do in various subject areas. There was no common assessment instrument used by the states, so a new assessment needed to be developed and administered on a scheduled basis.
1971 In Swann vs. Charlotte-Mecklenburg Board of Education, the court made it clear that if there were one race or nearly one race schools in previously segregated districts, those districts would be presumed to have violated the Constitution and would be asked to prove otherwise.
Districts became experts at changing school boundaries and attendance policies, tracking students, and assigning certain students to special programs or classes to avoid integration. Years after Brown, there were many schools that were not desegregated.
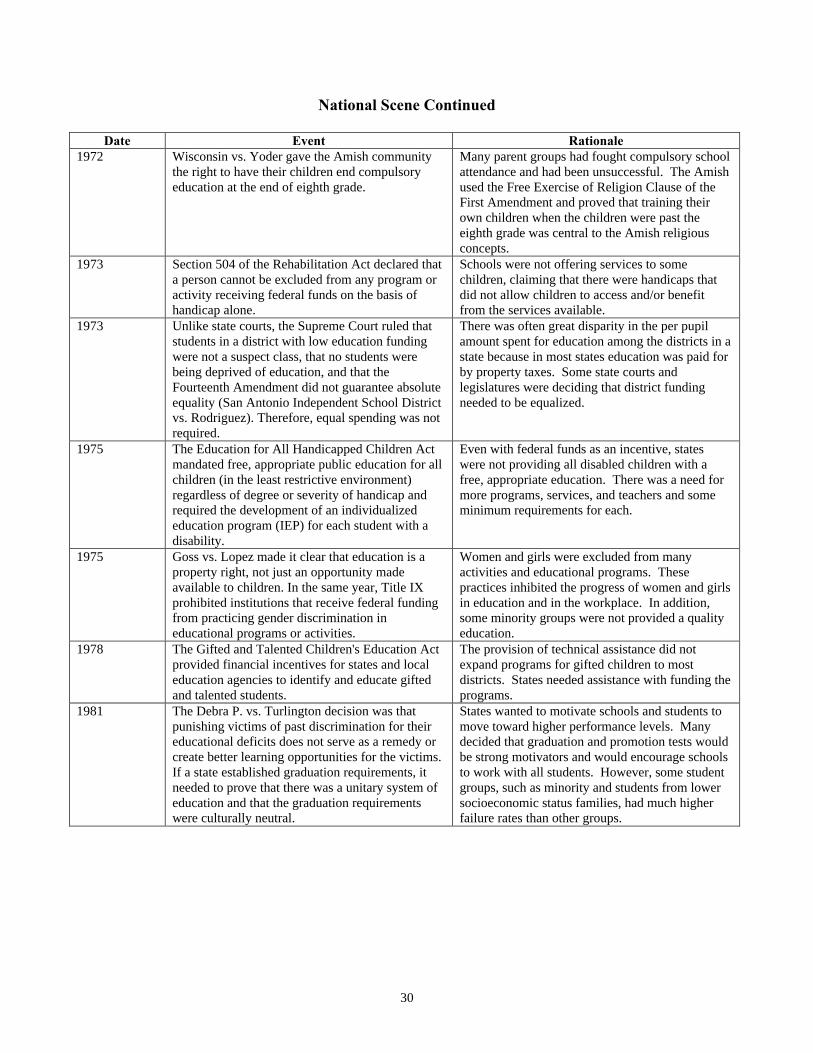
30
National Scene Continued
Date Event Rationale 1972 Wisconsin vs. Yoder gave the Amish community
the right to have their children end compulsory education at the end of eighth grade.
Many parent groups had fought compulsory school attendance and had been unsuccessful. The Amish used the Free Exercise of Religion Clause of the First Amendment and proved that training their own children when the children were past the eighth grade was central to the Amish religious concepts.
1973 Section 504 of the Rehabilitation Act declared that a person cannot be excluded from any program or activity receiving federal funds on the basis of handicap alone.
Schools were not offering services to some children, claiming that there were handicaps that did not allow children to access and/or benefit from the services available.
1973 Unlike state courts, the Supreme Court ruled that students in a district with low education funding were not a suspect class, that no students were being deprived of education, and that the Fourteenth Amendment did not guarantee absolute equality (San Antonio Independent School District vs. Rodriguez). Therefore, equal spending was not required.
There was often great disparity in the per pupil amount spent for education among the districts in a state because in most states education was paid for by property taxes. Some state courts and legislatures were deciding that district funding needed to be equalized.
1975 The Education for All Handicapped Children Act mandated free, appropriate public education for all children (in the least restrictive environment) regardless of degree or severity of handicap and required the development of an individualized education program (IEP) for each student with a disability.
Even with federal funds as an incentive, states were not providing all disabled children with a free, appropriate education. There was a need for more programs, services, and teachers and some minimum requirements for each.
1975 Goss vs. Lopez made it clear that education is a property right, not just an opportunity made available to children. In the same year, Title IX prohibited institutions that receive federal funding from practicing gender discrimination in educational programs or activities.
Women and girls were excluded from many activities and educational programs. These practices inhibited the progress of women and girls in education and in the workplace. In addition, some minority groups were not provided a quality education.
1978 The Gifted and Talented Children's Education Act provided financial incentives for states and local education agencies to identify and educate gifted and talented students.
The provision of technical assistance did not expand programs for gifted children to most districts. States needed assistance with funding the programs.
1981 The Debra P. vs. Turlington decision was that punishing victims of past discrimination for their educational deficits does not serve as a remedy or create better learning opportunities for the victims. If a state established graduation requirements, it needed to prove that there was a unitary system of education and that the graduation requirements were culturally neutral.
States wanted to motivate schools and students to move toward higher performance levels. Many decided that graduation and promotion tests would be strong motivators and would encourage schools to work with all students. However, some student groups, such as minority and students from lower socioeconomic status families, had much higher failure rates than other groups.

31
National Scene Continued
Date Event Rationale 1983 "A Nation At Risk" was published by the U.S.
Department of Education's National Commission on Excellence in Education, beginning the current school reform efforts. The Commission advanced the following recommendations: • Graduation requirements should be
strengthened so that all students establish a foundation in five new basics: English, mathematics, science, social studies, and computer science.
• Schools and colleges should adopt higher and measurable standards for academic performance.
• The amount of time students spend engaged in learning should be significantly increased.
• The teaching profession should be strengthened through higher standards for preparation and professional growth.
Policy makers continued to worry about the level of student achievement. Many believed that education in the United States was mediocre at best, and that the nation was losing ground in international comparisons.
1986 The Handicapped Children's Protection Act provided for reimbursement of attorney's fees to parents who needed to go to court to secure an appropriate education for their disabled children; and the Education of the Handicapped Act Amendments encouraged states to develop interdisciplinary services for disabled infants and toddlers and required states to provide free, appropriate education to disabled preschoolers ages 3-5.
Research was indicating that education of disabled students should begin before age 6. However, states needed guidelines and implementation funding in order to provide early education programs.
1989 NCTM Principles for Curriculum and Evaluation Standards for School Mathematics was published.
The call for higher standards led many professional educators to begin development of standards for their specialty areas.
1990 President Bush presented the American 2000 plan that included six national goals in education.
There was widespread concern about the quality of education in the United States. President Bush adopted school improvement as one of the main themes of his presidency.
1991 The Individuals with Disabilities Education Act enhanced the infants and toddlers program and extended the IDEA support program.
Disabled students who received services early in their lives made better progress than other students did. Federal funds were used to encourage the provision of early childhood programs.
1994 The Goals 2000: Educate America Act provided a framework for meeting national educational goals; the School-to-Work Opportunities Act authorized funds for programs to assist students in the transition from school to work; and the Improving America's Schools Act (reauthorization of ESEA) provided the framework of federal grants to states for elementary and secondary education programs.
As school improvement became more of a theme in this country, states were asked to develop rigorous standards and methods for determining if the standards were being met. They needed assistance in order to develop standards for what every child should know and be able to do; and support in implementing school improvement efforts focused on improving student achievement of those standards.

32
National Scene Continued
Date Event Rationale 1997 The Individuals with Disabilities Education Act
Amendments, gave teams of experts more latitude in determining eligibility for special services, extended the early intervention program and streamlined discretionary programs.
Professionals and parents complained about the inadequacy of basing a child's eligibility for special services on a standardized test score. They wanted decisions to be based on multiple assessment criteria and personal knowledge about the child and the child's peer group.
1998 Title II of the Higher Education Act required institutions to annually report on the quality of teacher preparation programs.
There was a national concern about the quality of teacher preparation. The federal government believed that more informed decisions could be made about teacher quality and teacher training if state certification requirements, institutional and state pass rates on teacher candidate assessments, information about waivers, and criteria used by the state to evaluate teacher preparation programs were known.
1998 "A Nation Still At Risk" was published. The federal government appropriated money for a number of initiatives meant to improve student learning and for studies to measure the impact of the initiatives. It also increased standards and assessment requirements tied to federal funds.

33
Technology
Date Event Rationale 1951 The Univac computer was delivered to the US
Census Bureau. Data manipulation needed for the Census required massive numbers of person hours. Persons who manipulated the data often did so inaccurately.
1955 IBM sold its first commercial computer. Technology was needed in aircraft design and weapons control during the Cold War.
1963 The Vocational Education Act passed, which gave money to schools to support the use of technology for administration and instruction.
Schools were using batch processing methods on mainframe and minicomputers for administrative tasks but were not using computers for instruction.
1965 The Elementary and Secondary Education Act brought more money into schools for technology.
Administrative and counseling tasks at schools could be more easily performed through the use of technology.
1971 Intel's first microprocessors and, therefore, the first microcomputers were developed and software companies began developing mainframe and minicomputer instructional programs.
Since schools were beginning to have money for technology, it became more practical for companies to invest in hardware and software for them.
1974 Apple I computers were marketed in kit form. Most users of technology were still a very select group of individuals who were interested in all aspects of computers and enjoyed building them. Also, companies were not mass producing personal computers.
1981 In 1981, IBM became the first mainframe manufacturer to develop a PC and drill and practice computer assisted instruction gained acceptance in schools. By 1983, the Apple II computers and PCs had found widespread acceptance in education.
There was limited memory in the first computers, but drill and practice material was easy to develop and could work in the computer environment. In addition, this use of computers fit the teacher/manager model of instructional delivery. Manufacturers began mass producing computers.
1990 Multimedia PCs were developed and could be used for simulations, educational databases, and other types of CAI programs (through CD-ROM).
In less than ten years, PC memory and knowledge about how computers could be used for instruction grew exponentially.
1995 The Internet and the World Wide Web began to catch on in businesses and schools.
The potential of the Internet for business, education, and pleasure began to be understood. In addition, business and government made funds available to schools to enable them to pay for hardware, software, and rewiring.
1996 The Schools and Libraries Universal Service Fund (E-Rate) was created as part of the Telecommunication Act of 1996 to ensure that all eligible schools and libraries in the United States had affordable access, through contract discounts, to modern telecommunication and information services.
Rewiring schools and purchasing hardware were only part of the cost of providing students, librarians, and teachers with access to the Internet. Telecommunication hookup and Internet access fees were unaffordable for many schools.
34
References
Council of State Governments (1984). The Book of the States 1984-85 (Volume 25). Lexington, Kentucky.
Drury, James W. (1997). The Government of Kansas. Lawrence, KS: KU Capitol Center, University of Kansas. Flentije, H. Edward (1990). Kansas Policy Choices Wichita, KS: Hugo Wall Center for Urban Studies, Wichita State
University. Harder, Marvin A. and Davis, Raymond G. (1979). The Legislature as an Organization: A Study of the Kansas
Legislature. Lawrence, KS: Regents Press of Kansas. Kansas Department of Education, Local Education Agency Finance (2001). Kansas USD’s Total Expenditures Per Pupil:
1999-2000. Topeka, KS: Kansas Department of Education. Kansas Department of Education, Local Education Agency Finance (2001). Public School Report: Selected School
Statistics 2000-2001. Topeka, KS: Kansas Department of Education. Kansas State Department of Education (1996). Quality Performance Accreditation Regulations. Topeka, KS: Kansas
Department of Education. Kester, D., & Kester, J. (1985). History of the Kansas State Department of Education. Topeka, KS: Kansas Department of
Education. Lewis, Dan A. and Maruna, Shadd (1999). Politics in the American States: A Comparative Analysis. Washington, D.C.:
CQ Press. Marshall, J.E. (1994). Historical Development of Special Education in Kansas: An Overview. Lawrence, KS: University
of Kansas. Silverstein, Robert (2000). Iowa Law Review: Emerging Disability Policy Framework: A Guidepost for Analyzing Public
Policy. Iowa City, Iowa: University of Iowa, College of Law. Throckmorton, A.F. (1967). Kansas Educational Progress: 1858-1967. Topeka, KS: Kansas State Department of Public
Instruction. Throckmorton, Adel F. (1960). Our Kansas System of Education. Topeka, KS: Kansas State Department of Public
Instruction. Yudof, Mark G., Kirp, David L., Tyll van Geel, and Levin, Betsy (1974). Educational Policy and the Law (Cases and
Materials). McCutrhan Publishing Corporation, Berkeley, CA.

35
APPENDIX
HISTORICAL DATA TABLES

36
Table 1
History of Kansas Building, Staff, and Enrollment Totals (1992-1999)
1992-1993
1993-1994
1994-1995
1995-1996
1996-1997
1997-1998
1998-1999
1999-2000
PUBLIC Elementary No. of Buildings 921 918 917 904 887 879 861 852 Certified Personnel 17,040.4 17,254.4 17,428.2 17,369.6 17,403.2 17,542.7 17,712.4 18,385.8 Enrollment 246,946 246,919 244,272 242,051 241,020 240,652 237,059 233,557 Middle Schools No. of Buildings 144 148 153 162 167 165 171 174 Certified Personnel 4,451.1 4,733.0 4,840.0 5,031.4 5,178.9 5,149.0 5,300.2 5,423.1 Enrollment 61,861 65,010 66,145 68,107 69,090 67,248 68,292 68,960 Junior High No. of Buildings 41 39 40 38 36 37 39 41 Certified Personnel 1,207.8 1,150.6 1,1211.4 1,130.1 1,133.7 1,187.3 1,245.4 1,257.0 Enrollment 16,029 14,995 15,507 14,442 14,111 14,413 14,584 14,876 Special Schools No. of Buildings 31 27 31 21 21 19 20 21 Certified Personnel 297.5 213.1 250.6 167.4 172.3 211.3 272.9 285.7 Enrollment 1,172 1,257 1,815 1,335 1,251 1,297 1,330 1,671 Senior High No. of Buildings 353 353 353 353 352 355 354 353 Certified Personnel 10,206.8 10,542.3 10,742.8 10,832.4 10,970.9 11,264.3 11,533.7 11,967.6 Enrollment 122,903 126,984 130,586 133,448 137,959 142,385 143,953 144,717 Central Office Certified Personnel 2,878.2 2,869.5 2,519.5 2,794.1 2,486.1 2,725.8 2,819.4 2,690.5 Enrollment not in Building Report 2,625 2,579 2,580 3,625 2,936 2,759 4,540 5,596 Totals No. of Buildings 1,490 1,485 1,494 1,478 1,463 1,455 1,445 1,441 Certified Personnel 36,081.8 36,762.9 36,992.5 37,325.0 37,345.1 38,080.4 38,784.1 40,009.7 Enrollment 451,536 457,744 460,905 463,008 466,367 468,744 469,758 469,377 NON PUBLIC ACCREDITED Elementary No. of Buildings 137 136 132 132 135 121 114 120 Enrollment 23,719 24,175 24,213 24,322 25,542 24,080 23,303 24,570 High School No. of Buildings 19 19 19 20 22 18 18 20 Enrollment 5,585 5,689 5,251 6,366 6,357 6,307 6,369 6,282 Totals No. of Buildings 156 155 151 152 157 139* 132 140 Enrollment 29,304 29,867 29,464 30,688 31,899 30,387 29,672 30,852
*Some non public schools elected not to participate in QPA accreditation and were dropped from accredited list.
DEFINITIONS Certified Personnel - the number of state certified employees who work in the Unified School Districts. Enrollment - the number of students (by headcount) enrolled in each building type.

37
Table 2
Certified Personnel Data State Totals (2001)
Position
Central Office
Elementary Middle/
Junior High
High School
Total Superintendents 278.5 278.5 Associate/Assistant Superintendents
98.4
98.4
Administrative Assistants 22.3 8.7 3.7 10.7 45.4 Principals 739.3 206.9 324.1 1,270.3 Assistant Principals 63.0 147.5 274.5 485.0 Directors/Supervisors of Special Education
101.7
5.9
1.8
4.3
113.7
Directors/Supervisors of Health 8.4
1.7
1.2
.5
11.8
Directors/Supervisors of Vocational Education
15.9
12.0
27.9
Instructional Coordinators/Supervisors
73.5
13.8
3.4
15.2
105.9
Other Directors/Supervisors 122.7
10.3
6.2
31.6
170.8
Other Curriculum Specialists 85.4
8.8
6.0
11.3
111.5
Practical Arts/Vocational Education Teachers
20.5
117.0
887.5
1,025.0
Special Education Teachers
1,605.7
804.2
1,024.5
3,434.4
Pre-Kindergarten Teachers 261.2 261.2 Kindergarten Teachers 1,167.9 1,167.9 Other Teachers 12,718.7 4,989.1 8,617.5 26,325.3 Library Media Specialists 566.2 157.5 278.7 1,002.4 School Counselors 426.3 235.4 504.8 1,166.5 Clinical/School Psychologists
171.2
107.6
43.6
46.2
368.6 Nurses 282.4 91.9 78.4 452.7 Speech Pathologists 172.0 283.7 32.6 20.7 509.0 Audiologists 9.8 3.7 13.5 Social Work Services 122.4 78.3 24.9 24.7 250.3 Reading Specialists/Teachers
459.0
51.6
17.4
528.0 Others 331.8 130.3 32.5 49.9 544.5 TOTAL 1,614.0 18,963.0 6,957.0 12,234.5 39,768.5 Teachers Only 16,233.0 5,961.9 10,546.9 32,741.8 Source: Kansas State Department of Education, Superintendent’s Organizational Report (SO66), 2001.
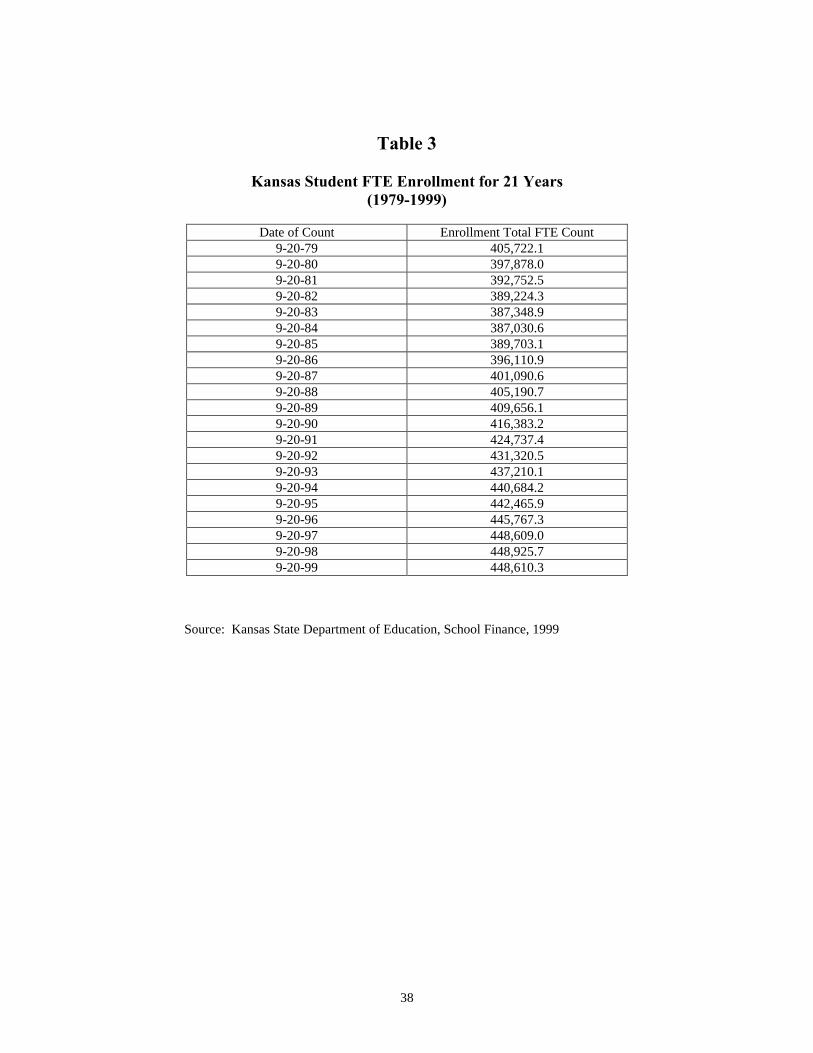
38
Table 3
Kansas Student FTE Enrollment for 21 Years (1979-1999)
Date of Count Enrollment Total FTE Count
9-20-79 405,722.1 9-20-80 397,878.0 9-20-81 392,752.5 9-20-82 389,224.3 9-20-83 387,348.9 9-20-84 387,030.6 9-20-85 389,703.1 9-20-86 396,110.9 9-20-87 401,090.6 9-20-88 405,190.7 9-20-89 409,656.1 9-20-90 416,383.2 9-20-91 424,737.4 9-20-92 431,320.5 9-20-93 437,210.1 9-20-94 440,684.2 9-20-95 442,465.9 9-20-96 445,767.3 9-20-97 448,609.0 9-20-98 448,925.7 9-20-99 448,610.3
Source: Kansas State Department of Education, School Finance, 1999

39
Table 4
Kansas Headcount Enrollment by Grade, Race, and Sex (1999-2000)
TOTAL
WHITE
BLACK
HISPANIC
AMERICAN INDIAN OR
ALASKA NATIVE
ASIAN OR PACIFIC
ISLANDER Grade Level Total All Male Female Male Female Male Female Male Female Male Female Male Female Kindergarten 30,863 15,654 15,209 11,848 11,442 1,475 1,561 1,780 1,700 207 187 344 319 1st Grade 34,618 18,004 16,614 13,835 12,654 1,775 1,637 1,800 1,700 252 246 342 377 2nd Grade 34,693 17,860 16,833 13,689 12,964 1,771 1,651 1,799 1,656 250 214 351 348 3rd Grade 35,017 18,005 17,012 13,977 13,075 1,683 1,755 1,739 1,558 234 244 372 380 4th Grade 35,712 18,444 17,268 14,501 13,594 1,733 1,609 1,625 1,481 246 232 339 352 5th Grade 35,391 18,339 17,052 14,489 13,473 1,689 1,612 1,557 1,385 243 217 361 365 6th Grade 35,788 18,383 17,405 14,664 13,974 1,654 1,481 1,427 1,356 226 237 412 357 7th Grade 36,208 18,641 17,567 15,051 14,130 1,536 1,533 1,462 1,351 190 217 402 336 8th Grade 36,850 18,953 17,897 15,463 14,509 1,551 1,494 1,351 1,304 226 221 362 369 9th Grade 39,693 20,668 19,025 16,545 15,354 1,785 1,572 1,653 1,471 262 235 423 393 10th Grade 36,798 18,814 17,984 15,580 14,744 1,429 1,415 1,258 1,192 188 199 359 434 11th Grade 34,417 17,320 17,097 14,671 14,373 1,149 1,204 944 973 178 171 378 376 12th Grade 32,522 16,447 16,075 14,057 13,673 1,057 1,014 783 783 177 180 373 425 Special Ed. - - - - - - - - - - - - - Special Ed 3 & 4 Yr. 4,097 2,703 1,394 2,207 1,155 239 102 216 121 20 8 21 8 Nongraded 4,853 3,070 1,783 2,507 1,404 245 143 259 204 24 11 32 19 4-Year Old At-Risk 1,685 844 841 454 431 178 215 155 140 18 17 39 38 TOTAL 469,205 242,149 227,056 193,538 180,949 20,949 19,998 19,808 18,375 2,941 2,836 4,910 4,896
Source: Kansas State Department of Education, School Finance, 2000

40
Table 5
Kansas Headcount Enrollment by Grade, Race, and Sex (2000-2001)
Total
White
Black
Hispanic
American Indian or Alaska Native
Asian or Pacific Islander
GRADE LEVEL TOTAL ALL Male Female Male Female Male Female Male Female Male Female Male Female
Kindergarten 30,391 15,179 15,212 11,372 11,365 1,388 1,479 1,910 1,798 183 197 325 373 1st Grade 34,128 17,859 16,269 13,451 12,161 1,742 1,673 2,012 1,848 256 225 398 362 2nd Grade 33,958 17,578 16,380 13,393 12,399 1,705 1,627 1,861 1,735 257 238 362 381 3rd Grade 34,743 17,893 16,850 13,658 12,879 1,766 1,653 1,865 1,731 246 224 358 363 4th Grade 35,165 18,079 17,087 13,926 13,082 1,693 1,759 1,822 1,610 242 249 396 386 5th Grade 35,992 18,531 17,461 14,538 13,692 1,731 1,600 1,656 1,563 269 237 337 369 6th Grade 35,662 18,500 17,162 14,529 13,503 1,717 1,620 1,629 1,431 257 235 368 373 7th Grade 36,091 18,518 17,573 14,737 14,061 1,596 1,471 1,522 1,426 241 255 422 360 8th Grade 36,085 18,512 17,573 14,857 14,093 1,532 1,515 1,488 1,392 222 245 413 328 9th Grade 39,168 20,288 18,880 16,055 14,916 1,836 1,661 1,710 1,602 264 260 423 441 10th Grade 37,229 19,263 17,966 15,617 14,698 1,557 1,390 1,425 1,258 229 212 434 409 11th Grade 34,300 17,429 16,871 14,574 13,975 1,242 1,233 1,064 1,006 171 205 378 452 12th Grade 33,085 16,501 16,584 13,983 13,871 1,081 1,202 862 901 164 174 411 436 Special Ed. 0 0 0 0 0 0 0 0 0 0 0 0 0 Special Ed 3 & 4 Yr. 4,484 2,928 1,556 2,400 1,244 226 124 243 145 27 23 32 20 Nongraded 5,646 3,422 2,225 2,814 1,827 227 125 297 236 47 24 37 13 4-Year Old At-Risk 2,207 1,109 1,098 583 577 214 230 230 221 19 15 63 55 TOTAL 468,334 241,589 226,747 190,487 178,343 21,253 20,362 21,596 19,903 3,094 3,018 5,157 5,121
Source: Kansas State Department of Education, School Finance, 2001

41
Table 6
Pupil-Teacher Ratios for Kansas And Nation (1992-2001)
Year Rank State/National Ratio 1992 44 Kansas 14.5 National 17.2 1994 41 Kansas 15.2 National 15.2 1995 38 Kansas 15.1 National 17.2 1996 Kansas 15.1 National 17.3 1997 38 Kansas 17.1 National 17.2 1998 37 Kansas 14.9 National 17.7 1999 36 Kansas 14.7 National 16.6 2000 36 Kansas 14.6 National 16.2 2001 Kansas 15.4 National
Source: U.S. Department of Education, National Center for Education Statistics and National Education Association, Washington, D.C.
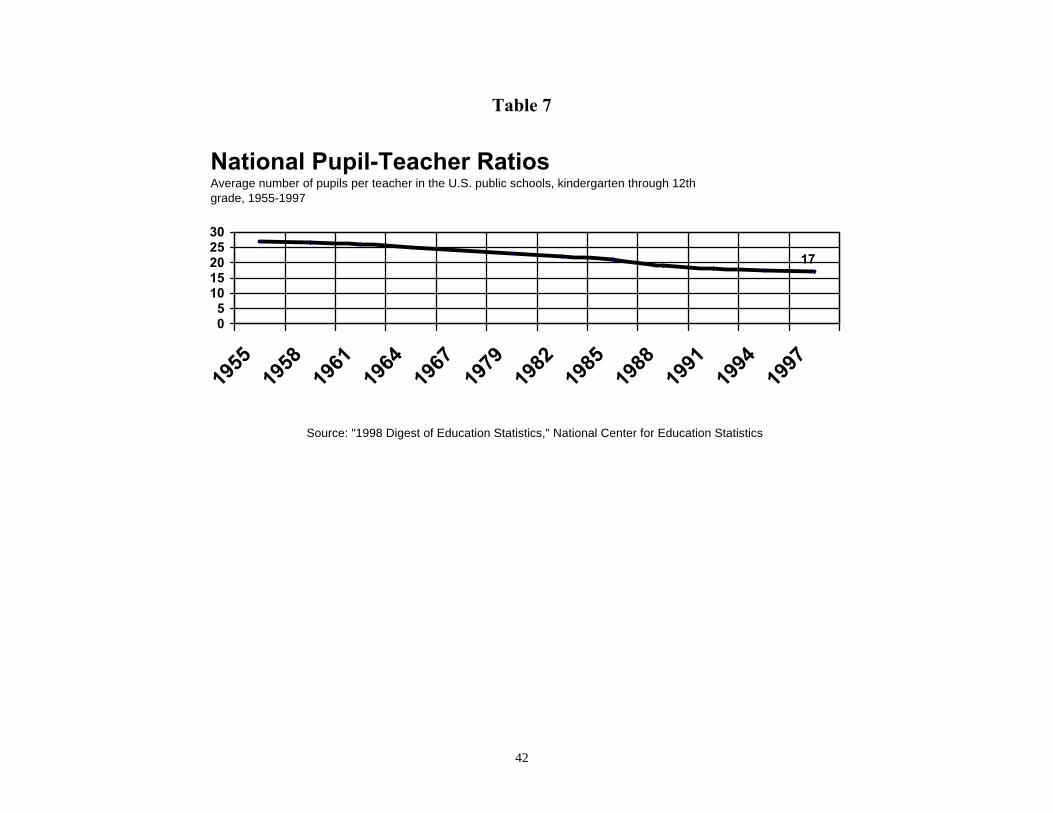
42
Table 7
National Pupil-Teacher RatiosAverage number of pupils per teacher in the U.S. public schools, kindergarten through 12th grade, 1955-1997
17
05
1015202530
1955
1958
1961
1964
1967
1979
1982
1985
1988
1991
1994
1997
Source: "1998 Digest of Education Statistics," National Center for Education Statistics
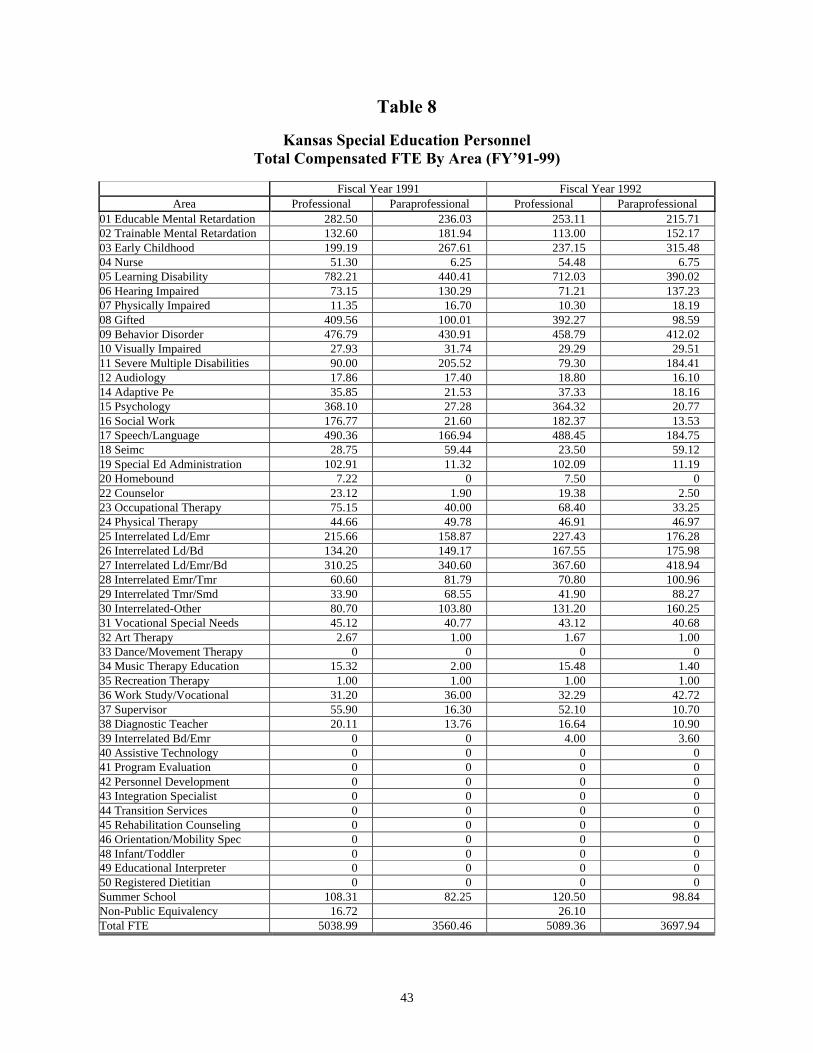
43
Table 8
Kansas Special Education Personnel Total Compensated FTE By Area (FY’91-99)
Fiscal Year 1991 Fiscal Year 1992
Area Professional Paraprofessional Professional Paraprofessional 01 Educable Mental Retardation 282.50 236.03 253.11 215.71 02 Trainable Mental Retardation 132.60 181.94 113.00 152.17 03 Early Childhood 199.19 267.61 237.15 315.48 04 Nurse 51.30 6.25 54.48 6.75 05 Learning Disability 782.21 440.41 712.03 390.02 06 Hearing Impaired 73.15 130.29 71.21 137.23 07 Physically Impaired 11.35 16.70 10.30 18.19 08 Gifted 409.56 100.01 392.27 98.59 09 Behavior Disorder 476.79 430.91 458.79 412.02 10 Visually Impaired 27.93 31.74 29.29 29.51 11 Severe Multiple Disabilities 90.00 205.52 79.30 184.41 12 Audiology 17.86 17.40 18.80 16.10 14 Adaptive Pe 35.85 21.53 37.33 18.16 15 Psychology 368.10 27.28 364.32 20.77 16 Social Work 176.77 21.60 182.37 13.53 17 Speech/Language 490.36 166.94 488.45 184.75 18 Seimc 28.75 59.44 23.50 59.12 19 Special Ed Administration 102.91 11.32 102.09 11.19 20 Homebound 7.22 0 7.50 0 22 Counselor 23.12 1.90 19.38 2.50 23 Occupational Therapy 75.15 40.00 68.40 33.25 24 Physical Therapy 44.66 49.78 46.91 46.97 25 Interrelated Ld/Emr 215.66 158.87 227.43 176.28 26 Interrelated Ld/Bd 134.20 149.17 167.55 175.98 27 Interrelated Ld/Emr/Bd 310.25 340.60 367.60 418.94 28 Interrelated Emr/Tmr 60.60 81.79 70.80 100.96 29 Interrelated Tmr/Smd 33.90 68.55 41.90 88.27 30 Interrelated-Other 80.70 103.80 131.20 160.25 31 Vocational Special Needs 45.12 40.77 43.12 40.68 32 Art Therapy 2.67 1.00 1.67 1.00 33 Dance/Movement Therapy 0 0 0 0 34 Music Therapy Education 15.32 2.00 15.48 1.40 35 Recreation Therapy 1.00 1.00 1.00 1.00 36 Work Study/Vocational 31.20 36.00 32.29 42.72 37 Supervisor 55.90 16.30 52.10 10.70 38 Diagnostic Teacher 20.11 13.76 16.64 10.90 39 Interrelated Bd/Emr 0 0 4.00 3.60 40 Assistive Technology 0 0 0 0 41 Program Evaluation 0 0 0 0 42 Personnel Development 0 0 0 0 43 Integration Specialist 0 0 0 0 44 Transition Services 0 0 0 0 45 Rehabilitation Counseling 0 0 0 0 46 Orientation/Mobility Spec 0 0 0 0 48 Infant/Toddler 0 0 0 0 49 Educational Interpreter 0 0 0 0 50 Registered Dietitian 0 0 0 0 Summer School 108.31 82.25 120.50 98.84 Non-Public Equivalency 16.72 26.10 Total FTE 5038.99 3560.46 5089.36 3697.94

44
Table 8 (cont.)
Fiscal Year 1993 Fiscal 1994 Area Professional Paraprofessional Professional Paraprofessional
01 Educable Mental Retardation 227.01 229.91 155.86 159.36 02 Trainable Mental Retardation 111.20 170.09 91.17 158.23 03 Early Childhood 271.52 378.61 270.80 386.67 04 Nurse 53.50 5.13 56.17 5.83 05 Learning Disability 635.50 398.08 473.27 350.62 06 Hearing Impaired 71.28 143.25 72.90 152.66 07 Physically Impaired 9.20 18.00 8.25 13.30 08 Gifted 397.20 111.60 403.24 112.25 09 Behavior Disorder 441.67 442.63 338.17 360.39 10 Visually Impaired 29.51 33.48 28.68 38.82 11 Severe Multiple Disabilities 80.70 183.99 77.57 181.16 12 Audiology 19.84 15.26 19.94 15.49 14 Adaptive Pe 41.76 21.58 44.09 19.17 15 Psychology 381.09 34.45 397.68 27.83 16 Social Work 188.43 19.92 188.36 19.79 17 Speech/Language 508.82 216.88 528.78 261.04 18 Seimc 21.72 52.52 20.72 52.45 19 Special Ed Administration 98.96 58.97 100.29 66.11 20 Homebound 15.74 0.07 11.73 0.20 22 Counselor 25.59 0 24.86 0 23 Occupational Therapy 74.36 49.89 74.98 49.98 24 Physical Therapy 42.36 53.32 43.37 57.24 25 Interrelated Ld/Emr 245.69 214.03 252.17 245.09 26 Interrelated Ld/Bd 165.66 203.89 152.23 185.73 27 Interrelated Ld/Emr/Bd 449.49 475.62 792.84 869.61 28 Interrelated Emr/Tmr 69.90 112.19 64.95 105.62 29 Interrelated Tmr/Smd 44.80 100.65 52.60 115.16 30 Interrelated-Other 229.57 353.41 335.38 535.55 31 Vocational Special Needs 45.01 40.82 56.67 58.63 32 Art Therapy 1.13 1.00 0.60 0.40 33 Dance/Movement Therapy 0 0 0 0 34 Music Therapy Education 14.30 1.00 10.55 1.00 35 Recreation Therapy 0 0 0 0 36 Work Study/Vocational 34.40 47.82 28.76 41.23 37 Supervisor 52.40 22.11 54.19 20.30 38 Diagnostic Teacher 13.50 4.50 11.56 1.00 39 Interrelated Bd/Emr 7.00 10.18 9.00 15.76 40 Assistive Technology 3.55 2.00 4.05 1.30 41 Program Evaluation 0.50 0 0.71 0 42 Personnel Development 5.14 2.67 4.55 1.67 43 Integration Specialist 18.51 43.93 28.13 44.65 44 Transition Services 1.00 3.60 12.1 18.67 45 Rehabilitation Counseling 0 0 0 0 46 Orientation/Mobility Spec 1.00 3.00 0.60 1.20 48 Infant/Toddler 0 0 27.98 19.04 49 Educational Interpreter 0 0 0 0 50 Registered Dietitian 0 0 0 0 Summer School 132.50 88.56 102.53 89.12 Non-Public Equivalency 40.05 47.28 Total FTE 5322.06 4368.61 5480.31 4859.32
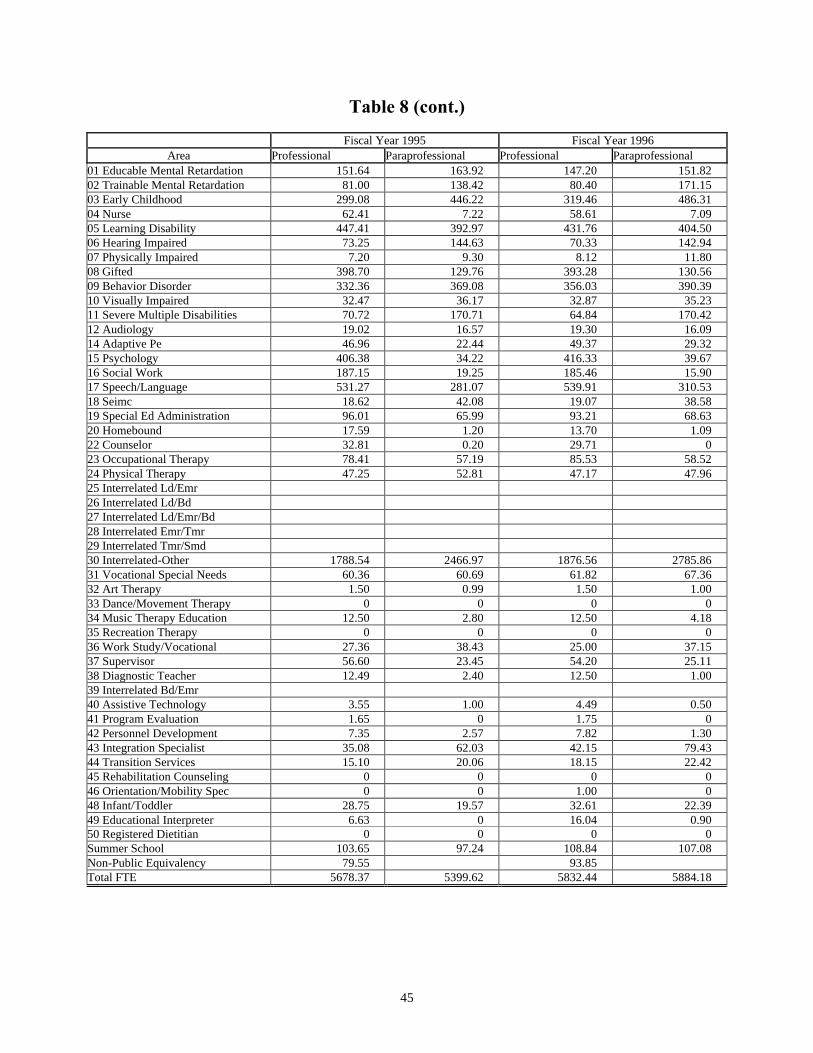
45
Table 8 (cont.)
Fiscal Year 1995 Fiscal Year 1996 Area Professional Paraprofessional Professional Paraprofessional
01 Educable Mental Retardation 151.64 163.92 147.20 151.82 02 Trainable Mental Retardation 81.00 138.42 80.40 171.15 03 Early Childhood 299.08 446.22 319.46 486.31 04 Nurse 62.41 7.22 58.61 7.09 05 Learning Disability 447.41 392.97 431.76 404.50 06 Hearing Impaired 73.25 144.63 70.33 142.94 07 Physically Impaired 7.20 9.30 8.12 11.80 08 Gifted 398.70 129.76 393.28 130.56 09 Behavior Disorder 332.36 369.08 356.03 390.39 10 Visually Impaired 32.47 36.17 32.87 35.23 11 Severe Multiple Disabilities 70.72 170.71 64.84 170.42 12 Audiology 19.02 16.57 19.30 16.09 14 Adaptive Pe 46.96 22.44 49.37 29.32 15 Psychology 406.38 34.22 416.33 39.67 16 Social Work 187.15 19.25 185.46 15.90 17 Speech/Language 531.27 281.07 539.91 310.53 18 Seimc 18.62 42.08 19.07 38.58 19 Special Ed Administration 96.01 65.99 93.21 68.63 20 Homebound 17.59 1.20 13.70 1.09 22 Counselor 32.81 0.20 29.71 0 23 Occupational Therapy 78.41 57.19 85.53 58.52 24 Physical Therapy 47.25 52.81 47.17 47.96 25 Interrelated Ld/Emr 26 Interrelated Ld/Bd 27 Interrelated Ld/Emr/Bd 28 Interrelated Emr/Tmr 29 Interrelated Tmr/Smd 30 Interrelated-Other 1788.54 2466.97 1876.56 2785.86 31 Vocational Special Needs 60.36 60.69 61.82 67.36 32 Art Therapy 1.50 0.99 1.50 1.00 33 Dance/Movement Therapy 0 0 0 0 34 Music Therapy Education 12.50 2.80 12.50 4.18 35 Recreation Therapy 0 0 0 0 36 Work Study/Vocational 27.36 38.43 25.00 37.15 37 Supervisor 56.60 23.45 54.20 25.11 38 Diagnostic Teacher 12.49 2.40 12.50 1.00 39 Interrelated Bd/Emr 40 Assistive Technology 3.55 1.00 4.49 0.50 41 Program Evaluation 1.65 0 1.75 0 42 Personnel Development 7.35 2.57 7.82 1.30 43 Integration Specialist 35.08 62.03 42.15 79.43 44 Transition Services 15.10 20.06 18.15 22.42 45 Rehabilitation Counseling 0 0 0 0 46 Orientation/Mobility Spec 0 0 1.00 0 48 Infant/Toddler 28.75 19.57 32.61 22.39 49 Educational Interpreter 6.63 0 16.04 0.90 50 Registered Dietitian 0 0 0 0 Summer School 103.65 97.24 108.84 107.08 Non-Public Equivalency 79.55 93.85 Total FTE 5678.37 5399.62 5832.44 5884.18

46
Table 8 (cont.)
Fiscal Year 1997 Fiscal Year 1998 Area Professional Paraprofessional Professional Paraprofessional
01 Educable Mental Retardation 239.78 415.97 276.56 516.40 02 Trainable Mental Retardation 03 Early Childhood 347.83 536.93 375.13 612.21 04 Nurse 64.84 9.13 76.38 10.08 05 Learning Disability 406.94 433.75 380.00 447.69 06 Hearing Impaired 71.26 135.60 72.90 128.29 07 Physically Impaired 7.60 14.00 7.00 14.53 08 Gifted 406.75 126.81 390.57 144.37 09 Behavior Disorder 361.23 417.09 365.06 443.71 10 Visually Impaired 33.90 38.25 33.37 41.39 11 Severe Multiple Disabilities 70.63 199.35 68.42 180.06 12 Audiology 18.93 20.42 19.29 20.93 14 Adaptive Pe 47.45 25.11 50.31 22.69 15 Psychology 428.03 41.70 441.99 45.61 16 Social Work 189.71 20.05 201.81 6.10 17 Speech/Language 555.83 282.90 577.71 280.71 18 Seimc 16.24 34.39 13.40 36.42 19 Special Ed Administration 92.68 74.08 91.85 84.04 20 Homebound 16.85 1.23 20.32 1.00 22 Counselor 28.12 0 33.91 0 23 Occupational Therapy 98.66 55.37 111.56 60.80 24 Physical Therapy 52.80 47.70 56.77 41.01 25 Interrelated Ld/Emr 26 Interrelated Ld/Bd 27 Interrelated Ld/Emr/Bd 28 Interrelated Emr/Tmr 29 Interrelated Tmr/Smd 30 Interrelated-Other 1948.48 3141.68 1981.08 3420.11 31 Vocational Special Needs 69.47 78.62 69.64 71.54 32 Art Therapy 1.50 0.80 1.42 1.13 33 Dance/Movement Therapy 0 0 0 0 34 Music Therapy Education 11.22 1.00 10.03 6.51 35 Recreation Therapy 0 0 1.00 0 36 Work Study/Vocational 21.90 34.52 20.70 34.17 37 Supervisor 55.58 30.76 59.11 45.52 38 Diagnostic Teacher 8.50 0 4.00 0 39 Interrelated Bd/Emr 40 Assistive Technology 5.54 1.31 5.59 2.98 41 Program Evaluation 2.07 0 3.00 0 42 Personnel Development 6.18 0 6.41 8.12 43 Integration Specialist 42.47 57.97 49.56 77.22 44 Transition Services 19.60 21.84 19.36 22.74 45 Rehabilitation Counseling 0 0 0 0 46 Orientation/Mobility Spec 1.85 0 1.21 0 48 Infant/Toddler 24.68 19.82 25.40 22.40 49 Educational Interpreter 26.80 0 45.73 0 50 Registered Dietitian 0 0 0 0 Summer School 115.70 112.00 103.08 116.05 Non-Public Equivalency 98.19 120.69 Total FTE 6015.79 6430.15 6191.32 6966.53

47
Table 8 (cont.)
Fiscal Year 1999 Fiscal 2000 Area Professional Paraprofessional Professional Paraprofessional
01 Educable Mental Retardation 281.41 522.84 275.99 545.14 02 Trainable Mental Retardation 03 Early Childhood 399.31 666.41 412.78 694.08 04 Nurse 86.47 12.29 92.21 13.42 05 Learning Disability 392.37 507.36 375.39 574.86 06 Hearing Impaired 70.03 133.90 72.45 123.46 07 Physically Impaired 6.00 14.00 6.00 14.33 08 Gifted 409.09 148.16 434.18 147.55 09 Behavior Disorder 360.65 458.34 341.58 449.88 10 Visually Impaired 35.24 43.57 35.55 40.65 11 Severe Multiple Disabilities 68.65 195.15 70.74 212.90 12 Audiology 20.58 21.82 20.53 23.22 14 Adaptive Pe 53.44 27.31 57.15 15.13 15 Psychology 455.16 45.64 470.85 45.18 16 Social Work 221.68 7.00 240.37 8.82 17 Speech/Language 611.75 290.53 653.18 291.64 18 Seimc 13.03 34.76 12.90 34.57 19 Special Ed Administration 94.13 80.96 96.69 100.36 20 Homebound 16.81 1.13 17.50 1.35 22 Counselor 35.43 0.55 39.43 0.27 23 Occupational Therapy 131.90 67.40 153.88 84.00 24 Physical Therapy 63.48 39.29 66.03 40.93 25 Interrelated Ld/Emr 26 Interrelated Ld/Bd 27 Interrelated Ld/Emr/Bd 28 Interrelated Emr/Tmr 29 Interrelated Tmr/Smd 30 Interrelated-Other 2109.11 3808.81 2209.47 4133.49 31 Vocational Special Needs 73.83 74.74 71.05 80.48 32 Art Therapy 2.30 0 3.50 1.00 33 Dance/Movement Therapy 0 0 0 0 34 Music Therapy Education 13.79 6.43 13.56 6.02 35 Recreation Therapy 1.30 0 1.00 1.00 36 Work Study/Vocational 21.70 37.81 20.70 33.87 37 Supervisor 63.24 49.74 60.55 36.63 38 Diagnostic Teacher 3.00 0 3.00 0 39 Interrelated Bd/Emr 40 Assistive Technology 5.59 3.16 7.27 4.78 41 Program Evaluation 1.50 0 0.42 0 42 Personnel Development 5.84 5.48 5.72 1.00 43 Integration Specialist 44.08 96.40 49.69 138.41 44 Transition Services 21.64 38.09 24.15 32.41 45 Rehabilitation Counseling 0 0 0 0 46 Orientation/Mobility Spec 1.15 0 1.16 0 48 Infant/Toddler 23.00 21.25 21.19 15.98 49 Educational Interpreter 47.62 0 58.22 0 50 Registered Dietitian 0 0 0.07 0 Summer School 117.26 138.94 131.56 151.11 Non-Public Equivalency 134.96 172.30 Total FTE 6517.52 7599.26 6799.96 8097.92
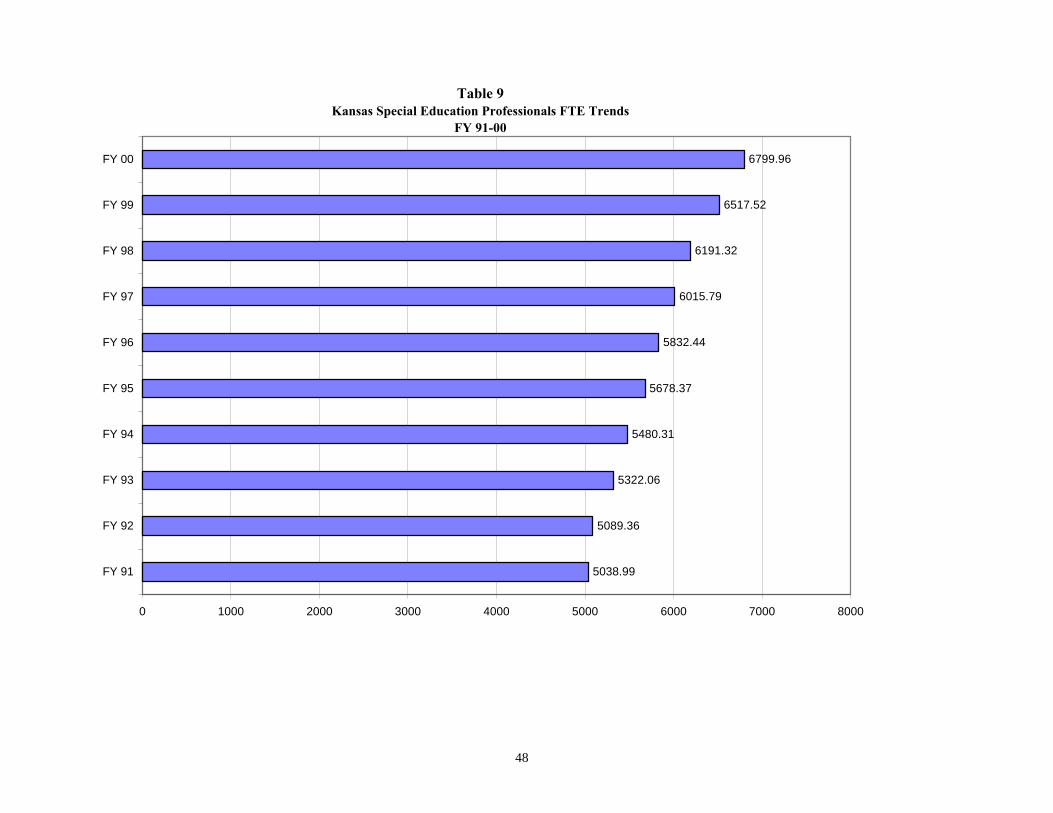
48
Table 9Kansas Special Education Professionals FTE Trends
FY 91-00
5038.99
5089.36
5322.06
5480.31
5678.37
5832.44
6015.79
6191.32
6517.52
6799.96
0 1000 2000 3000 4000 5000 6000 7000 8000
FY 91
FY 92
FY 93
FY 94
FY 95
FY 96
FY 97
FY 98
FY 99
FY 00

49
Table 10Kansas Special Education ParaProfessional Trends
FY 91 - 00
3560.46
3697.94
4368.61
4859.32
5399.62
5884.18
6430.15
6966.53
7599.26
8097.92
0 1000 2000 3000 4000 5000 6000 7000 8000 9000
FY 91
FY 92
FY 93
FY 94
FY 95
FY 96
FY 97
FY 98
FY 99
FY 00

50
Table 11
Kansas Special Education Child Count and Prevalence Trends*
(1989-2000)
December 1, Year 12/1/1989 12/1/1990 12/1/1991 12/1/1992 12/1/1993 12/1/1994 12/1/1995 12/1/1996 12/1/1997 12/1/1998 12/1/1999 12/1/2000 Special Education Disabled 43599 45287 46512 48177 49559 51665 53613 55352 56657 58433 60040 61270 Child Counts Gifted 13000 13171 13411 14010 14053 14467 14200 14015 14543 14984 15050 15562 All Exceptional 56599 58205 59569 61634 63221 65651 67387 68992 70730 72877 74534 76255 Child Counts Disabled 0.2% 3.9% 2.7% 3.6% 2.9% 4.2% 3.8% 3.2% 2.4% 3.1% 2.8% 2.0% % Change Gifted 4.4% 1.3% 1.8% 4.5% 0.3% 2.9% -1.8% -1.3% 3.8% 3.0% 0.4% 3.4% from prior year All Exceptional 1.1% 2.8% 2.3% 3.5% 2.6% 3.8% 2.6% 2.4% 2.5% 3.0% 2.3% 2.3% September 20, Year 09/20/1989 09/20/1990 09/20/1991 09/20/1992 09/20/1993 09/20/1994 09/20/1995 09/20/1996 09/20/1997 09/20/1998 09/20/1999 09/20/2000 Public School Enrollments 430864 440859 445390 450965 457614 460838 462817 465402 467682 468074 469367 469377 % Change from prior year 1.0% 2.3% 1.0% 1.2% 1.5% 0.7% 0.4% 0.6% 0.5% 0.1% 0.3% 0.0% SPED Prevalence Disabled 9.49% 9.65% 9.93% 10.20% 10.38% 11.01% 11.40% 11.72% 11.96% 12.37% 12.67% 12.94% in Kansas Gifted 3.02% 2.99% 3.01% 3.11% 3.07% 3.14% 3.07% 3.01% 3.11% 3.20% 3.21% 3.31% Public Schools All Exceptional 12.51% 12.63% 12.94% 13.18% 13.36% 14.05% 14.37% 14.65% 14.97% 15.57% 15.76% 16.13% % Change in Disabled 0.16% 0.28% 0.27% 0.18% 0.63% 0.39% 0.32% 0.24% 0.40% 0.31% 0.27% SPED Prevalence Gifted -0.03% 0.02% 0.10% -0.04% 0.07% -0.07% -0.06% 0.10% 0.09% 0.00% 0.11% from prior year All Exceptional 0.12% 0.31% 0.26% 0.18% 0.69% 0.32% 0.28% 0.32% 0.60% 0.19% 0.37%
* Audited Individual Student Counts from KSDE Web Site
Gifted students identified with a disability are counted under both the Disability and Gifted categories, but are NOT duplicated in the All Exceptional Total.

51
Table 12
Kansas Special Education Child Count Trends by Exceptionality
(1989-1998)
December 1 Year 12/1/89 12/1/90 12/1/91 12/1/92 12/1/93 12/1/94 12/1/9512/1/199612/1/199712/1/1998Part H / (ages 0-2 year old)* 383 491 650 853 1005 1200 1429 1492 1649 1884 ECH -ages 3-5 year olds 3597 3881 4472 4815 5534 5856 6135 6367 6629 6933 Autism n/a n/a n/a 79 147 185 237 252 273 341Behavior Disorders 4696 4729 4846 4969 4924 5044 5251 5271 4985 4458Developmentally Delayed n/a n/a n/a n/a n/a n/a n/a n/a n/a 102Deaf-Blind 12 15 13 14 10 31 23 28 28 12Hearing Impairments 633 717 593 592 568 580 595 619 637 581Mental Retardation 5786 5946 5390 5467 5414 5506 5621 5862 5776 5538Multiple Disabilities 640 737 589 600 572 522 585 528 548 1993Other Health Impairments 251 380 623 783 1095 1648 2262 2927 3673 3976Physical Impairments 555 577 369 417 484 498 513 445 467 459Specific Learning Disability 16557 17302 18732 19449 20021 20741 21043 21739 22076 21443Speech / Language Impairments 10630 10775 10674 10672 10416 10625 10850 10898 11179 11343Traumatic Brain Injury n/a n/a n/a 114 159 213 273 174 128 125Visual Impairments 242 228 211 206 215 216 225 242 258 207 Disabled Total 43599 45287 46512 48177 49559 51665 53613 55352 56657 58433Gifted 13000 13171 13411 14010 14053 14465 14200 14015 14543 14984All Exceptional 56599 58205 59569 61634 63221 65651 67387 68992 70730 72877
Notes: Part H child counts from KDHE and not included in State totals. Beginning with 12/1/90, gifted students identified with a disability are counted only once in the All Exceptional Total. Beginning with 12/1/94, students reported under the State Special Education non-categorical waiver were statistically distributed categorically for the Federal
reporting requirements based on historical USD and COOP distributions.

52
Table 13
Number of Personnel in the Kansas Department of Education (1978-2001)
Date
KSDE Grand Total Personnel Report
Budgeted Positions
July 1, 1978 175.0 July 1, 1979 186.0 July 1, 1980 181.0 July 1, 1981 185.0 July 1, 1982 172.0 July 1, 1983 171.0 July 1, 1984 174.0 July 1, 1985 180.0 July 1, 1986 182.0 July 1, 1987 183.0 July 1, 1988 187.0 July 1, 1989 190.0 July 1, 1990 192.0 July 1, 1991 192.0 July 1, 1992 196.0 July 1, 1993 199.0 July 1, 1994 208.0 July 1, 1995 207.0 July 1, 1996 202.0 July 1, 1997 203.0 July 1, 1998 208.5 July 1, 1999 200.0 July 1, 2000 201.5 July 1, 2001 190.5
Source: Kansas State Board of Education, compiled from various personnel reports. This chart was completed July 2001.

53
Table 14
Percent Public High School Graduation Rate (Rank)
1990 1991 1993 1994* 1995** 1999 2000 Kansas 81.99(11) 81.12 (10) 80.3 (15) 79.0 (13) 77.4 (13) 75.3 (17) 74.1 (16) National 71.2 71.19 71.1 70.1 68.6 67.5 67.0
*Calculated by comparing numbers of high school graduates in 1994 with 9th grade enrollment in fall 1990, etc. **Percent of ninth graders who graduate. Source: Morgan Quinto Corporation using data from U.S. Department of Education, National Center for Education Statistics, taken from various years’ reports.
Table 15
Status of 1999-2000 Kansas Graduates by Ethnicity and Gender as of May 2001
WHITE
BLACK
HISPANIC
AMERICAN INDIAN ALASKA NATIVE
ASIAN OR PACIFIC
ISLANDER
ALL GRADUATES Status of Graduates M F M F M F M F M F M F Total Four Year College Or University 5,048 6,346 249 367 168 188 43 44 202 215 5,710 7,160 12,870 Two Year College 3,120 3,472 274 249 169 212 31 38 50 62 3,644 4,033 7,677 Other Type College 427 227 15 29 31 28 5 4 5 7 483 295 778 Other Postsecondary (Noncollege) 517 283 41 42 12 24 12 3 8 5 590 357 947 Employment 1,809 1,162 80 81 90 78 20 28 15 15 2,014 1,364 3,378 Unemployment 58 43 - 2 - 4 1 2 - 1 59 52 111 Parenting 6 146 - 9 - 5 1 3 1 2 8 165 173 Military Service 545 130 46 36 33 12 5 4 4 2 633 184 817 All Other Graduates 309 245 26 22 12 14 3 4 6 13 356 298 654 Status Unknown 664 618 111 87 61 64 14 10 28 40 878 819 1,697 Total Graduates 12,503 12,672 842 924 576 629 135 140 319 362 14,375 14,727 29,102

54
Table 16
Kansas and National Student Dropout Rate: 1994-2000
1994 1995 1996 1997 1998 1999 2000 Kansas 3.5% 3.1% 3.0% 3.0% 2.7% 2.6% 2.2% National 11.4% 12.0% 11.1% 11.0% 11.8% 11.2%
Source: U.S. Department of Education, National Center for Education Statistics. “Dropout Rates in the U.S.” for various years. (This table was prepared July 2001.)
Table 17
Kansas ACT Scores 1993-2001
Year
Number
English
Math
Reading
Scientific Reasoning
Composite
1993-94 18,823 20.7 20.2 21.8 21.4 21.1 1994-95 20,274 20.7 20.3 21.9 21.5 21.1 1995-96 19,728 20.9 20.3 22.0 21.6 21.3 1996-97 21,162 21.1 21.1 22.2 21.8 21.7 1997-98 22,305 21.1 21.4 22.1 21.7 21.7 1998-99 23,210 21.0 21.0 21.9 21.4 21.5 1999-00 24,049 21.0 21.2 22.1 21.6 21.6 2000-01 24,380 21.0 21.2 22.1 21.7 21.6
Table 18
National ACT Scores 1993-2001
Year
Number
English
Math
Reading
Scientific Reasoning
Composite
1993-94 891,714 20.3 20.2 21.2 20.9 20.8 1994-95 945,369 20.2 20.2 21.3 21.0 20.8 1995-96 924,663 20.3 20.2 21.3 21.1 20.9 1996-97 959,301 20.3 20.6 21.3 21.1 21.0 1997-98 995,039 20.4 20.8 21.4 21.1 21.0 1998-99 1,019,053 20.5 20.7 21.4 21.0 21.0 1999-00 1,065,138 20.5 20.2 21.3 21.1 21.0 2000-01 1,069,772 20.5 20.7 21.3 21.0 21.0
Source: Kansas State Department of Education, Accountability Report, various years. (These tables created July 2001.)
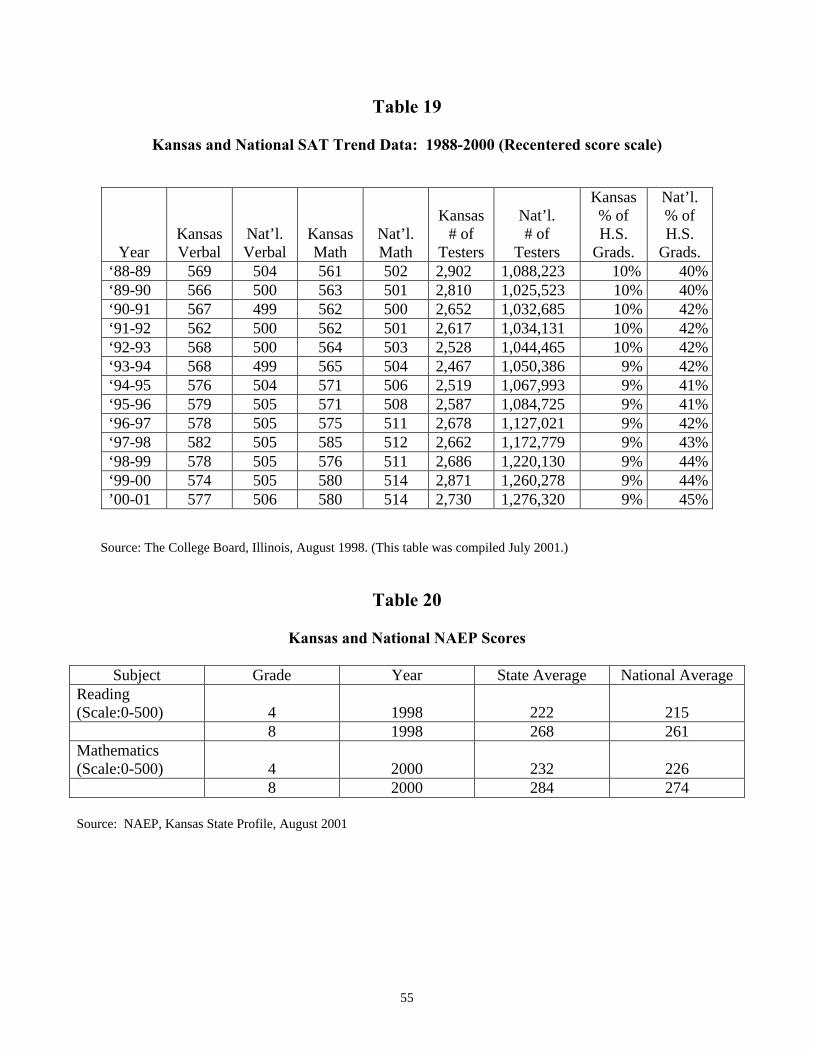
55
Table 19
Kansas and National SAT Trend Data: 1988-2000 (Recentered score scale)
Year
Kansas Verbal
Nat’l. Verbal
Kansas Math
Nat’l. Math
Kansas
# of Testers
Nat’l. # of
Testers
Kansas % of H.S.
Grads.
Nat’l. % of H.S.
Grads. ‘88-89 569 504 561 502 2,902 1,088,223 10% 40% ‘89-90 566 500 563 501 2,810 1,025,523 10% 40% ‘90-91 567 499 562 500 2,652 1,032,685 10% 42% ‘91-92 562 500 562 501 2,617 1,034,131 10% 42% ‘92-93 568 500 564 503 2,528 1,044,465 10% 42% ‘93-94 568 499 565 504 2,467 1,050,386 9% 42% ‘94-95 576 504 571 506 2,519 1,067,993 9% 41% ‘95-96 579 505 571 508 2,587 1,084,725 9% 41% ‘96-97 578 505 575 511 2,678 1,127,021 9% 42% ‘97-98 582 505 585 512 2,662 1,172,779 9% 43% ‘98-99 578 505 576 511 2,686 1,220,130 9% 44% ‘99-00 574 505 580 514 2,871 1,260,278 9% 44% ’00-01 577 506 580 514 2,730 1,276,320 9% 45%
Source: The College Board, Illinois, August 1998. (This table was compiled July 2001.)
Table 20
Kansas and National NAEP Scores
Subject Grade Year State Average National Average Reading (Scale:0-500)
4
1998
222
215
8 1998 268 261 Mathematics (Scale:0-500)
4
2000
232
226
8 2000 284 274 Source: NAEP, Kansas State Profile, August 2001
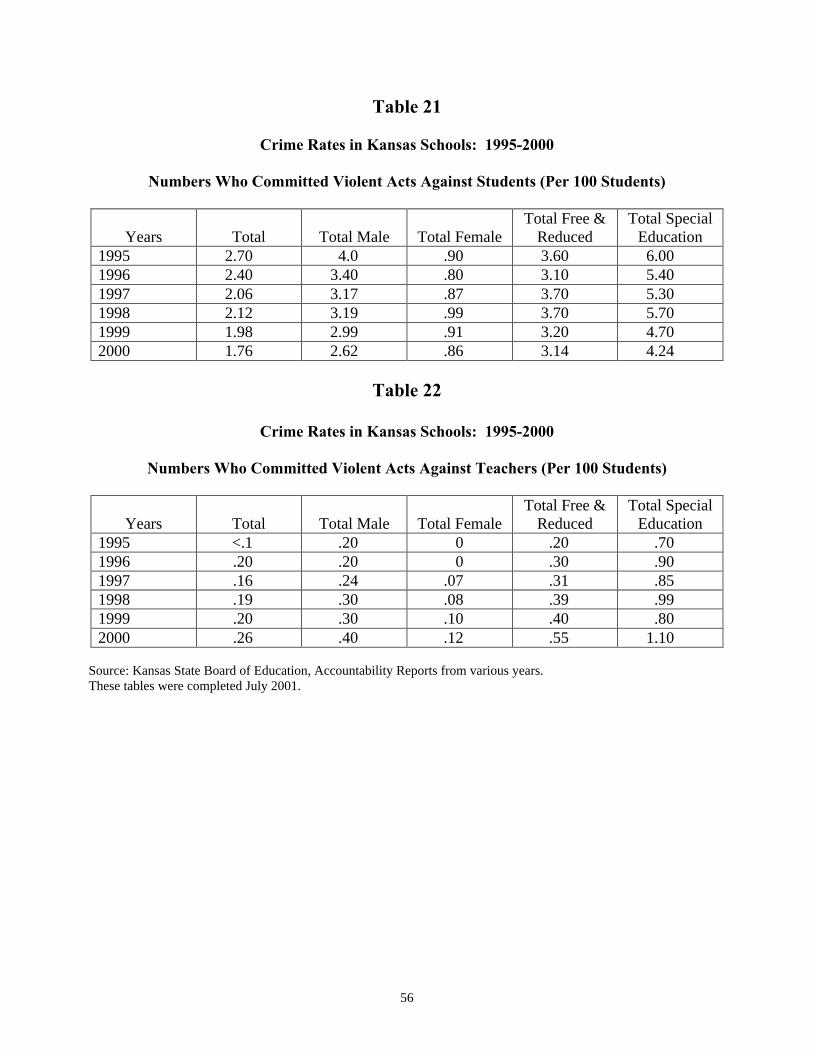
56
Table 21
Crime Rates in Kansas Schools: 1995-2000
Numbers Who Committed Violent Acts Against Students (Per 100 Students)
Years
Total
Total Male
Total Female
Total Free & Reduced
Total Special Education
1995 2.70 4.0 .90 3.60 6.00 1996 2.40 3.40 .80 3.10 5.40 1997 2.06 3.17 .87 3.70 5.30 1998 2.12 3.19 .99 3.70 5.70 1999 1.98 2.99 .91 3.20 4.70 2000 1.76 2.62 .86 3.14 4.24
Table 22
Crime Rates in Kansas Schools: 1995-2000
Numbers Who Committed Violent Acts Against Teachers (Per 100 Students)
Years
Total
Total Male
Total Female Total Free &
Reduced Total Special
Education 1995 <.1 .20 0 .20 .70 1996 .20 .20 0 .30 .90 1997 .16 .24 .07 .31 .85 1998 .19 .30 .08 .39 .99 1999 .20 .30 .10 .40 .80 2000 .26 .40 .12 .55 1.10
Source: Kansas State Board of Education, Accountability Reports from various years. These tables were completed July 2001.

57
Table 23
National Crime rate in schoolsPercentage of students in grades 9-12 who reported being victimized at school, by type of crime and race, 1997
6.2%
9.9% 9.0%
5.3%
32.6%34.0%
32.1%
27.2%
0%
10%
20%
30%
40%
White Black Hispanic AsianSource: "Youth Risk Behavior Survey, 1993, 1995, and 1997," U.S. Department of Health and Human Services
Threatened or injured with a weapon
Had property stolen or damaged

58
Table 24
Computers for Instructional Use in Public Schools in U.S. (in millions)
1994-95 1995-96 1996-97 1997-98 1998-99 1999-2000 4.9 5.0 6.3 7.4 8.2 9.8
Source: Technology in Education 2000 / Market Data Retrieval
Table 25
Intensity of Computer Use in Kansas and the Nation
% of schools with Internet
access
Internet computer
intensity (# of students per
Internet access computer)
Networked computer
intensity (# of students per networked computer)
CD-ROM intensity
(# of students per CD-ROM
drive)
Online curriculum
content subscribers (%
of schools subscribing to
fee-based content)
Teacher e-mail (% of schools where 50%+ teachers have school-based
e-mail)
% of teachers using
computers daily
Kansas 96.2 6.0 4.0 5.5 12.9 85.0 86.3 Nation 83.8 7.9 8.4 7.3 13.0 76.9 78.2
Source: Market Data Retrieval, 2000
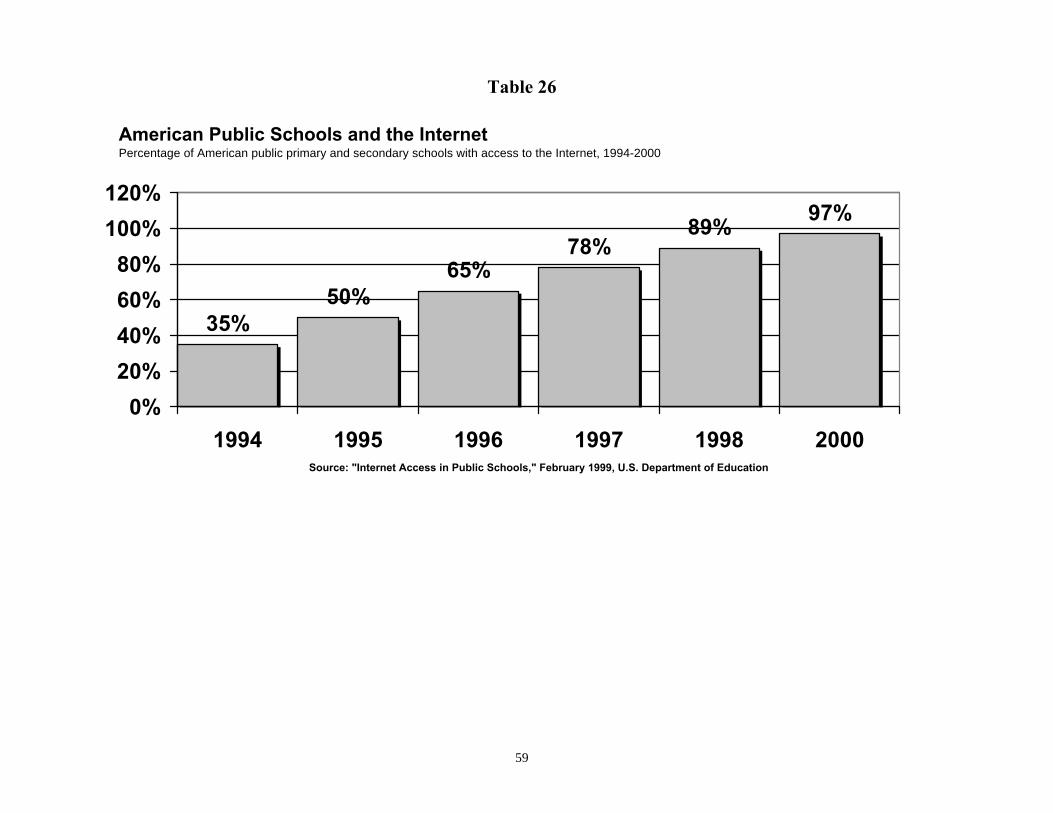
59
Table 26
American Public Schools and the InternetPercentage of American public primary and secondary schools with access to the Internet, 1994-2000
35%50%
65%78%
89%97%
0%
20%
40%
60%
80%
100%
120%
1994 1995 1996 1997 1998 2000Source: "Internet Access in Public Schools," February 1999, U.S. Department of Education

60
Table 27
Kansas School Districts with High Speed Internet ConnectivityFall 1999 survey
131
145
7
131
18
7
19
44
12
7
21
139
0 50 100 150 200
<500 Students
500-3000students
3000-9999students
10000 students
Siz
e o
f D
istr
ict
Number of School Districts
High Speed Connectivity toInternet
Number Responding to Survey
Number of School Districts thisSize
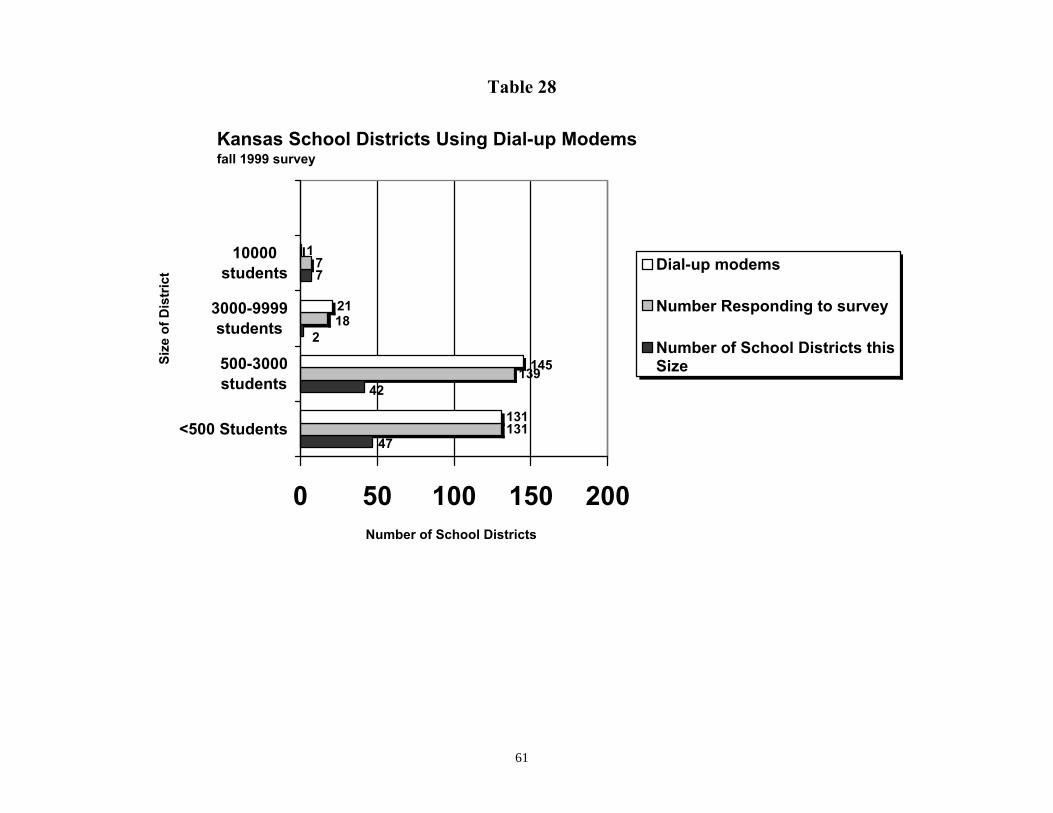
61
Table 28
Kansas School Districts Using Dial-up Modemsfall 1999 survey
7
131
139
7
131
21
1
2
42
47
18
145
0 50 100 150 200
<500 Students
500-3000students
3000-9999students
10000students
Siz
e o
f D
istr
ict
Number of School Districts
Dial-up modems
Number Responding to survey
Number of School Districts thisSize

62
Table 29
Kansas Expenditures by Source 1992-2000
Weighted FTE Enrollment
Year State Average Lowest Median Highest State Totals 1992-93 1,702.7 165.9 909.1 48,098.0 517,613.7 1993-94 1,732.0 176.7 936.1 48,081.5 526,519.4 1994-95 1,752.3 173.1 938.2 47,278.2 532,684.3 1995-96 1,772.6 166.5 943.8 46,967.9 538,860.9 1996-97 1,802.0 170.2 944.3 48,083.5 547,798.1 1997-98 1,846.3 197.7 951.3 49,571.7 561,263.4 1998-99 1,873.1 195.6 934.2 51,326.3 569,418.6 1999-00 1,885.2 173.8 918.0 52,081.8 573,095.1
Table 30
Kansas Expenditures by Source 1992-2000
General Fund Budget Per Pupil
Year State Average Lowest Median Highest State Totals 1992-93 3,543.60 2,733.18 3,582.15 3,600.00 1,834,215,942 1993-94 3,586.63 3,311.49 3,600.00 3,600.00 1,888,431,565 1994-95 3,586.37 3,276.71 3,600.00 3,600.00 1,910,400,987 1995-96 3,608.04 3,411.18 3,626.00 3,626.00 1,944,230,349 1996-97 3,629.47 3,231.3 3,646.56 3,648.00 1,988,214,358 1997-98 3,669.99 3,667.66 3,670.00 3,670.00 2,059,831,907 1998-99 3,749.96 3,714.00 3,720.00 3,720.00 2,118,212,964 1999-00 3,769.98 3,767.76 3,770.00 3,770.00 2,160,557,971
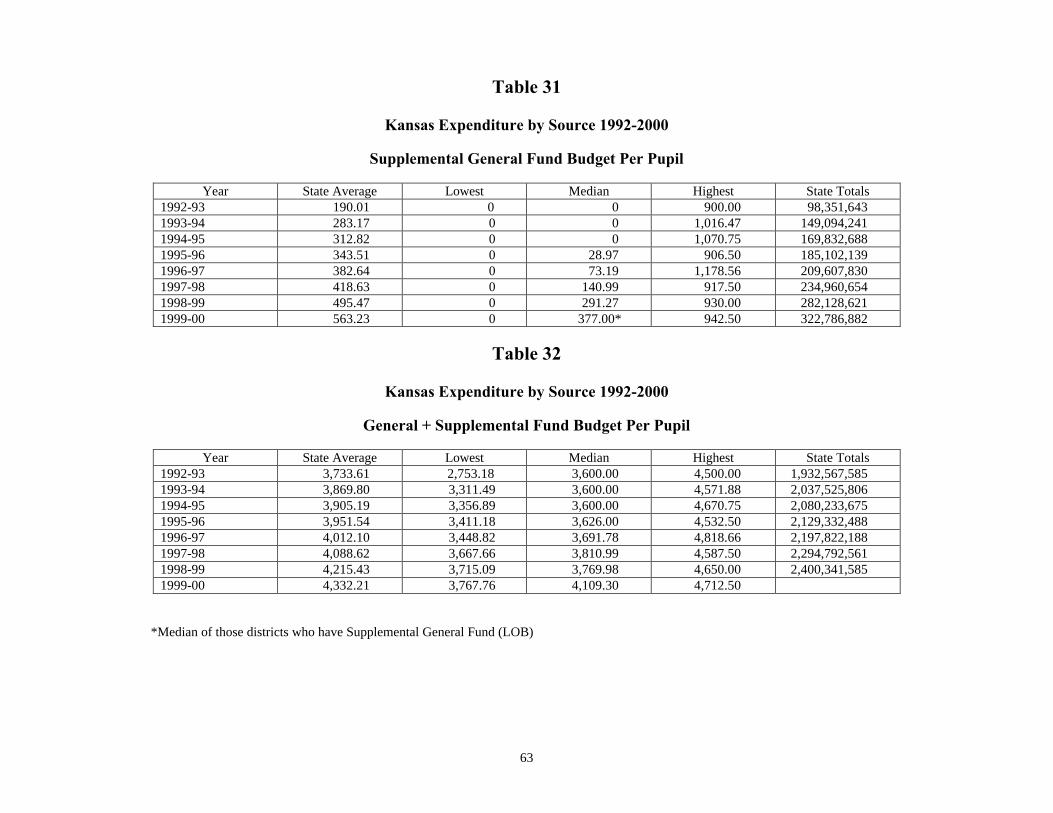
63
Table 31
Kansas Expenditure by Source 1992-2000
Supplemental General Fund Budget Per Pupil
Year State Average Lowest Median Highest State Totals 1992-93 190.01 0 0 900.00 98,351,643 1993-94 283.17 0 0 1,016.47 149,094,241 1994-95 312.82 0 0 1,070.75 169,832,688 1995-96 343.51 0 28.97 906.50 185,102,139 1996-97 382.64 0 73.19 1,178.56 209,607,830 1997-98 418.63 0 140.99 917.50 234,960,654 1998-99 495.47 0 291.27 930.00 282,128,621 1999-00 563.23 0 377.00* 942.50 322,786,882
Table 32
Kansas Expenditure by Source 1992-2000
General + Supplemental Fund Budget Per Pupil
Year State Average Lowest Median Highest State Totals 1992-93 3,733.61 2,753.18 3,600.00 4,500.00 1,932,567,585 1993-94 3,869.80 3,311.49 3,600.00 4,571.88 2,037,525,806 1994-95 3,905.19 3,356.89 3,600.00 4,670.75 2,080,233,675 1995-96 3,951.54 3,411.18 3,626.00 4,532.50 2,129,332,488 1996-97 4,012.10 3,448.82 3,691.78 4,818.66 2,197,822,188 1997-98 4,088.62 3,667.66 3,810.99 4,587.50 2,294,792,561 1998-99 4,215.43 3,715.09 3,769.98 4,650.00 2,400,341,585 1999-00 4,332.21 3,767.76 4,109.30 4,712.50
*Median of those districts who have Supplemental General Fund (LOB)

64
Table 33
Kansas Total Expenditures Per Pupil: 1997-1999
Academic Year
FTE Enrollment
Total Expenditures Expenditures
Per Pupil 1997-1998 448,609.0 $2,975,137,606 $6,631.92 1998-1999 448,925.7 $3,158,047.102 $7,034.68 1999-2000 448,610.3 $3,302,703,457 $7,362.08
Source: Kansas State Department of Education, LEA Finance, “Kansas USD’s Total Expenditures Per Pupil,” 1999-2000.
Table 34
Trends in National Per-pupil Spending in Actual Dollars
1986 1991 1996 2001 $3,479 $4,902 $5,689 $7,489
Source: National Center for Education Statistics (2001 figure is projection).

65
Table 35
National Spending per Pupil (1920-2001)
$7,489
$0
$1,000
$2,000
$3,000
$4,000
$5,000
$6,000
$7,000
$8,000
1920 1927 1934 1941 1948 1955 1962 1969 1976 1983 1990 1997 2001
Source: "1999 Digest of Education Statistics," National Center for Education Statistics, May 2000

66
Table 36
Trends in School Budgets in Kansas: 1990-94
Budget Increase
Enrollment Increase
Net Budget Increase
Inflation Rate
Teacher Salaries
1990-91 4.8% 1.6% 3.2% 5.4% 3.7% 1991-92 4.4% 2.0% 2.4% 3.2% 3.6% 1992-93 8.8% 2.0% 6.8% 3.1% 6.6% 1993-94 5.6% 1.9% 3.7% 2.6% 3.4% 1994-95* 3.6% 1.6% 2.0% NA NA *projected Source: Kansas Association of School Boards, Overview of Public Education in Kansas, 1995

67
Table 37
Kansas Average Teacher Salary
1964 – 2000
Year Average Salary %of U.S. Average Rank
1964-65 $5,587 90.0% 16 1980-81 $15,250 87.0% 37 1984-85 $21,038 89.0% 30 1986-87 $23,459 88.0% 33 1987-88 $24,647 86.0% 32 1989-90 $27,220 86.9% 33 1990-91 $28,188 85.7% 34 1991-92 $29,101 85.1% 35 1992-93 $30,713 87.0% 30 1993-94 $31,000 88.5% 28 1994-95 $32,085 87.3% 30 1995-96 $32,531 86.4% 32 1996-97 $33,150 86.2% 34 1997-98 $33,800 85.9% 34 1998-99 $31,493 85.0% 34
1999-2000 $32,240 86.8% 32

68
Table 38
National Average Annual Salary for Teachers 1970-2000Estimated average annual salary of instructional staff in public schools in constant 1998 dollars
$0
$10,000
$20,000
$30,000
$40,000
$50,000
1970 1973 1976 1979 1982 1985 1988 1991 1994 1997 1998 1999 2000Source: "Digest of Education Statistics, 2000" National Center for Education Statistics