hiv endgame ii: stopping the syndemics that drive hiv · hiv endgame ii: stopping the syndemics...
TRANSCRIPT

HIV Endgame II: Stopping the Syndemics that Drive HIVNovember 21-22, 2016, King Edward Hotel, Toronto
Sean B. Rourke, Ph.D., FCAHSScientific and Executive Director, OHTNProfessor of Psychiatry, University of TorontoDirector, CIHR Centre for REACH 2.0 in HIV/AIDSDirector, CIHR Collaborative Centre for CBR in HIV

First OHTN Conference on Syndemics
ResearchEvidenceResearchEvidence
PracticeKnowledge/Judgement
PracticeKnowledge/Judgement
LivedExperience
The Best Care

New Optimism in the HIV Sector

Ontario’s HIV Strategy to 2026
Goals:1. Improve the health and well-being of populations most affected by HIV2. Promote sexual health and prevent new HIV, STI and hepatitis C
infections3. Diagnose HIV infections early and engage people in timely care4. Improve health, longevity and quality of life for people living with HIV5. Ensure the quality, consistency and effectiveness of all provincially
funded HIV programs and services

HIV Treatment: Critical to ending the AIDS epidemic and making HIV transmissions rare

The Applied Epidemiology Unit: Strategic, Monitoring and Evaluation of HIV Epidemic in Ontario
1,1041,013
1,080
969 994 986
861798 828 842
0
200
400
600
800
1,000
1,200
1,400
2006 2007 2008 2009 2010 2011 2012 2013 2014 2015

HIV Treatment: Critical to ending the AIDS epidemic and making HIV transmissions rare

Ontario’s Prevention, Engagement and Care Cascade

How close is Ontario to Meeting the Targets?

Change in the Care Cascade, 2000-2015
0%
10%
20%
30%
40%
50%
60%
70%
80%
90%
100%
2000 2001 2002 2003 2004 2005 2006 2007 2008 2009 2010 2011 2012 2013 2014 2015
In care On treatment Suppressed
Percent of diagnosedpeople living with HIV
Data provided by the Public Health Ontario Laboratory. In Care = ≥1 VL test. On Treatment = Documented on treatment on last VL or treatment documentation missing but supressed on last VL. Supressed = VL< 200 copies/ml on last VL test
Cascade Summary, Ontario, 2000-2015

Towards an integrated primary and secondary HIV prevention continuum: Critical to making HIV transmissions rare
Tim Horn and colleagues (2016) J Int AIDS Society
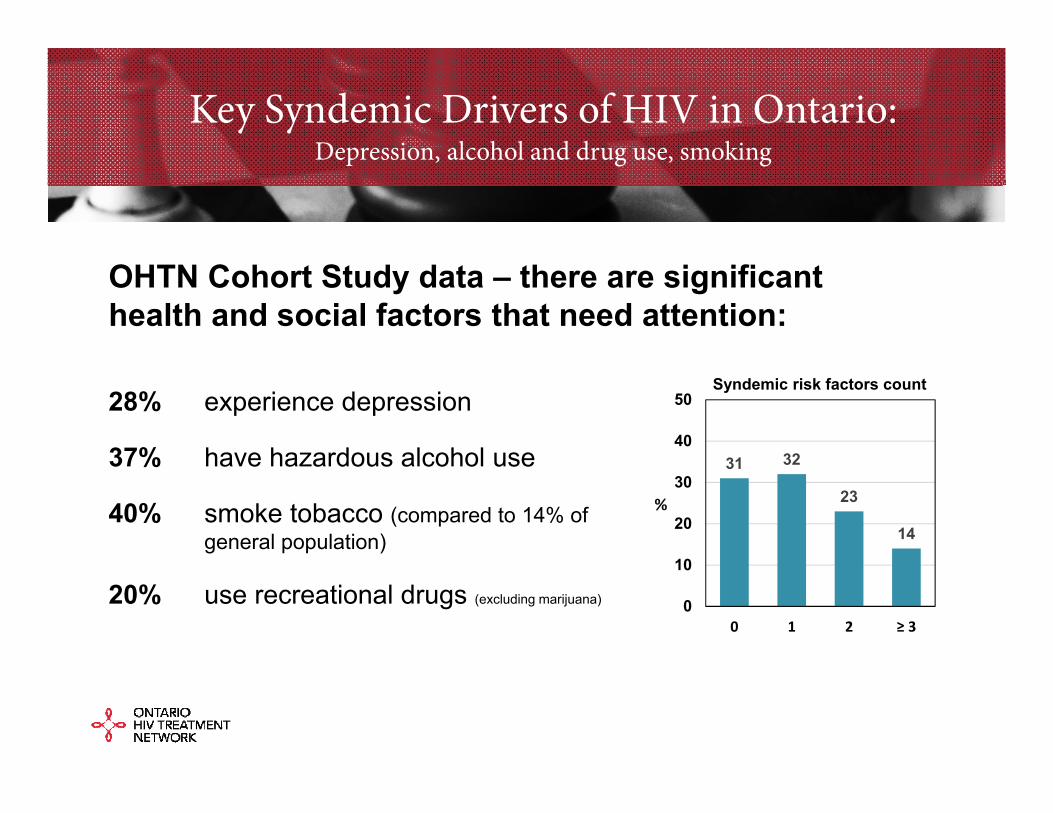
Key Syndemic Drivers of HIV in Ontario:Depression, alcohol and drug use, smoking
OHTN Cohort Study data – there are significant health and social factors that need attention:
28% experience depression
37% have hazardous alcohol use
40% smoke tobacco (compared to 14% ofgeneral population)
20% use recreational drugs (excluding marijuana)
31 32
23
14
0
10
20
30
40
50
0 1 2 ≥ 3
%
Syndemic risk factors count

Syndemic Drivers of HIV in Ontario
Other OHTN Cohort Study Syndemic Drivers:57% live on <$20,000/year
25% experienced history of trauma (sexual abuse as a child by someone close to them)
38% experienced intimate partner violence (of those, 50% were sexually abused and 89% were emotionally abused)

Syndemic Drivers of HIV in Ontario
CIHR Funded Positive Spaces Healthy Places:50% Housing instability
Overall, those who were unstably housed had:
• more substance use, higher levels of stress, higher rates of depression, and lower CD4 counts and viral loads
Indigenous participants in our study– were more likely to live in unstable housing, have a history of homelessness, experience housing discrimination and have a history of incarceration

Impact of Syndemics on Risk and Health Outcomes
Brennan et al (2012) Higher syndemic index increased sexual risk behaviour, self-reported HIV infection,
and social marginalization
Mustanski et al (2007) Increasing # of psychosocial health problems higher rate of unprotected anal intercourse
and HIV infection among young MSM
Friedman et al (2015) Higher syndemic count higher viral load and lower ART adherence in HIV+ MSM
Rourke et al (2016) Higher # of syndemic factors declining levels of HIV care engagement and poorer HIV
treatment outcomes

Impact of Syndemics
50
55
60
65
70
75
80
85
90
95
100
In continuous care
On ARVtreatment
On ART withsuppressed VL
On ART withundetectable VL
%
No risk factor One risk factor Two risk factors Three or more risk factors

Number of syndemic risk factors and HIV treatment outcomes
No. ofsyndemic
risk factors
In continuous care On ART
Unadjusted estimate
Adjustedestimate a
Unadjusted estimate
Adjusted estimate b
0 1.00 1.00 1.00 1.001 0.99 (0.97, 1.00) 0.99 (0.98, 1.00) 0.99 (0.98, 1.00) 0.99 (0.98, 1.00)2 0.96 (0.94, 0.97) 0.97 (0.95, 0.98) 0.97 (0.96, 0.99) 0.99 (0.97, 1.00)
≥3 0.95 (0.93, 0.96) 0.96 (0.94, 0.98) 0.91 (0.88, 0.93) 0.94 (0.91, 0.96)
Note: Data reported are ratio of proportions (ROP) and 95% confidence intervals
a N=4,089; PY= 13,364; Adjusted for age, gender, race/ethnicity, immigrant status, relationship status, history of IDU, region of Ontario, time since HIV diagnosis, years since ARV initiation, calendar year, and clinic. Analyses restricted to participants in care and completed a questionnaire in that year.
b N=4,009; PY= 13,228. Adjusted for age, gender, race/ethnicity, immigrant status, relationship status, history of IDU, region of Ontario, time since HIV diagnosis, calendar year, and clinic. Analyses restricted to participants in care, completed a questionnaire in that year, with non-missing prescription medication data, and non-missing VL results

No. ofsyndemic
risk factors
On ART with suppressed VL On ART with undetectable VL
Unadjusted estimate
Adjusted estimate c
Unadjusted estimate
Adjusted estimate c
0 1.00 1.00 1.00 1.00
1 1.00 (0.98, 1.01) 1.00 (0.99, 1.01) 0.98 (0.97, 1.00) 0.99 (0.97, 1.00)
2 0.96 (0.95, 0.98) 0.98 (0.96, 0.99) 0.94 (0.93, 0.96) 0.96 (0.94, 0.98)
≥3 0.91 (0.88, 0.93) 0.93 (0.91, 0.96) 0.89 (0.86, 0.92) 0.92 (0.89, 0.95)
Note: Data reported are ratio of proportions (ROP) and 95% confidence intervals
c N=3,768; PY= 12,057; Adjusted for age, gender, race/ethnicity, immigrant status, relationship status, history of IDU, region of Ontario, years since ARV initiation, ARV regimen, calendar year, and clinic. Analyses restricted to participants in care, completed a questionnaire in that year, with non-missing prescription medication data, and non-missing VL results.
Number of syndemic risk factors and HIV treatment outcomes:
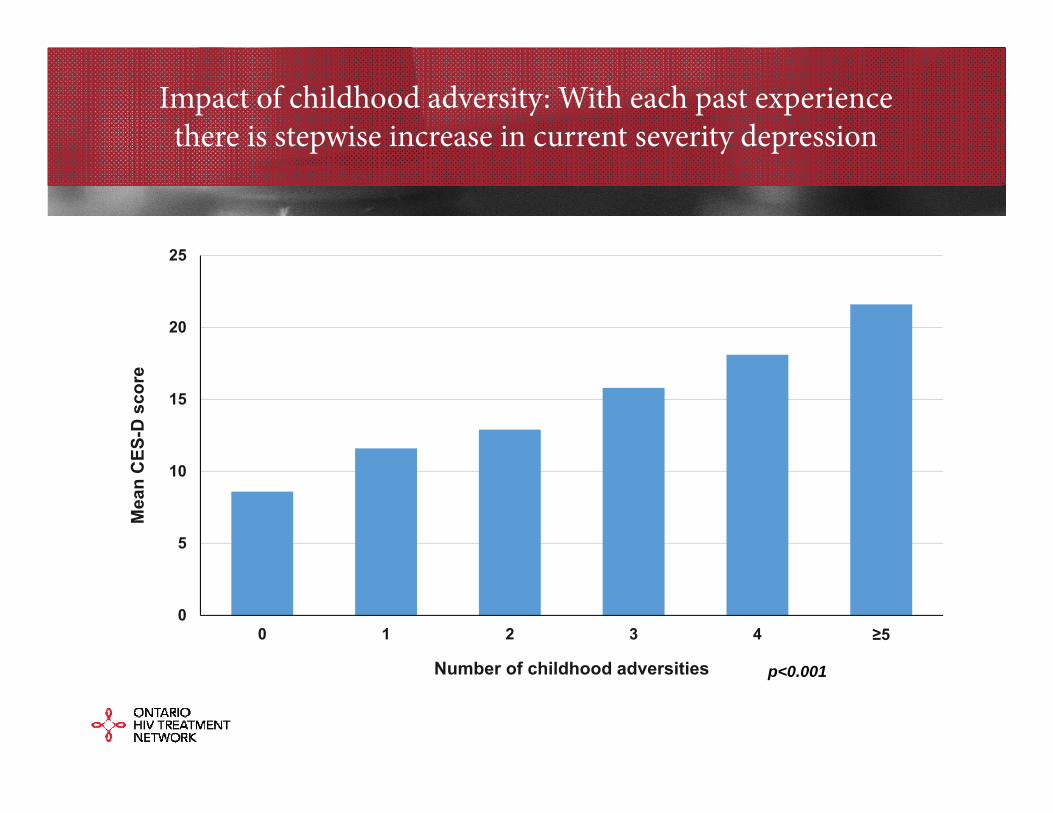
Impact of childhood adversity: With each past experience there is stepwise increase in current severity depression
0
5
10
15
20
25
0 1 2 3 4 ≥5
Mea
n C
ES-D
sco
re
Number of childhood adversities p<0.001

0
10
20
30
40
50
60
0 1 2 3 4 ≥5
SF-3
6 PC
S s
core
(mea
n)
Number of Childhood adversities
p<0.001
0
10
20
30
40
50
60
0 1 2 3 4 ≥5
SF-3
6 M
CS
sco
re (m
ean)
Number of Childhood adversities
p<0.001
Physical health QOL Mental health related QOL
Impact of childhood adversityon mental health-related quality of life (QOL)

Health Opportunities forOntarians Living with HIV
Despite these health/social challenges, many people living with and at risk of HIV demonstrate remarkable resilience
How can we build on those strengthsto stop the syndemics that drive HIV?

The OHTN gratefully acknowledges the core funding from the MOHLTC AIDS Bureau
and the support we received from our sponsors for our HIV Endgame conference series:

Thank you!
Sean B. Rourke, Ph.D., FCAHSScientific and Executive Director, OHTNProfessor of Psychiatry, University of TorontoDirector, CIHR Centre for REACH 2.0 in HIV/AIDSDirector, CIHR Collaborative Centre for CBR in HIV