hoinga: a supernova remnant discovered in the srg/erosita
TRANSCRIPT

Astronomy&AstrophysicsSpecial issue
A&A 648, A30 (2021)https://doi.org/10.1051/0004-6361/202040156© W. Becker et al. 2021
First science highlights from SRG/eROSITA
Hoinga: a supernova remnant discovered in the SRG/eROSITAAll-Sky Survey eRASS1
W. Becker1,2, N. Hurley-Walker3, Ch. Weinberger1, L. Nicastro4, M. G. F. Mayer1, A. Merloni1, and J. Sanders1
1 Max-Planck-Institut für extraterrestrische Physik, Giessenbachstraße, 85748 Garching, Germanye-mail: [email protected]
2 Max-Planck-Institut für Radioastronomie, Auf dem Hügel 69, 53121 Bonn, Germany3 International Centre for Radio Astronomy Research, Curtin University, Bentley WA 6102, Australia4 INAF – Osservatorio di Astrofisica e Scienza dello Spazio di Bologna, Via Piero Gobetti 93/3, 40129 Bologna, Italy
Received 17 December 2020 / Accepted 12 February 2021
ABSTRACT
Supernova remnants (SNRs) are observable for about (6−15)× 104 yr before they fade into the Galactic interstellar medium. With aGalactic supernova rate of approximately two per century, we can expect to have of the order of 1200 SNRs in our Galaxy. However,only about 300 of them are known to date, with the majority having been discovered in Galactic plane radio surveys. Given that theseSNRs represent the brightest tail of the distribution and are mostly located close to the plane, they are not representative of the completesample. The launch of the Russian-German observatory SRG/eROSITA in July 2019 brought a promising new opportunity to explorethe Universe. Here we report findings from the search for new SNRs in the eROSITA all-sky survey data which led to the detectionof one of the largest SNRs discovered at wavelengths other than the radio: G249.5+24.5. This source is located at a relatively highGalactic latitude, where SNRs are not usually expected to be found. The remnant, ‘Hoinga’, has a diameter of about 4.◦4 and shows acircular shaped morphology with diffuse X-ray emission filling almost the entire remnant. Spectral analysis of the remnant emissionreveals that an APEC spectrum from collisionally ionised diffuse gas and a plane-parallel shock plasma model with non-equilibriumionisation are both able to provide an adequate description of the data, suggesting a gas temperature of the order of kT = 0.1+0.02
−0.02 keVand an absorbing column density of NH = 3.6+0.7
−0.6 × 1020cm−2. Various X-ray point sources are found to be located within the remnantboundary but none seem to be associated with the remnant itself. Subsequent searches for a radio counterpart of the Hoinga remnantidentified its radio emission in archival data from the Continuum HI Parkes All-Sky Survey and the 408-MHz ‘Haslam’ all-sky survey.The radio spectral index α=−0.69± 0.08 obtained from these data definitely confirms the SNR nature of Hoinga. We also analysedINTEGRAL SPI data for fingerprints of 44Ti emission, which is an ideal candidate with which to study nucleosynthesis imprinting inyoung SNRs. Although no 44Ti emission from Hoinga was detected, we were able to set a 3σ upper flux limit of 9.2× 10⁻⁵ ph cm−2 s−1.From its size and X-ray and radio spectral properties we conclude that Hoinga is a middle-aged Vela-like SNR located at a distance ofabout twice that of the Vela SNR, i.e. at ∼500 pc.
Key words. supernovae: general – supernovae: individual: Hoinga (G249.5+24.5)
1. Introduction
A long series of observations have taught astronomers that thereare many different types of stars. Findings in atomic and nuclearphysics have made it possible to understand the developmentof these stars over the past few decades. According to this, thefate of a star at the end of its thermonuclear evolution essen-tially depends on only one parameter: the mass of a star decideswhether its death is gentle or violent. More massive stars withM ≥ 8 M� end their lives with a supernova (SN) explosion,which is not only often associated with the formation of otherexotic star types such as neutron stars (NSs) or black holes, butalso represents a new beginning of stellar evolution by enrich-ment and decompression of the surrounding interstellar medium.A prominent example for this is the Solar System itself whichshows imprints in metal abundance of a past SN which tookplace 4.567 Gyr ago (Gritschneder et al. 2012).
Supernovae are considered to be rare events which happenin our Milky Way on average every 30−50 yr (e.g. Keane &Kramer 2008), though no SN event has been directly observed in
our Galaxy in the past 400 yr. Indeed, in the past two millennia,only seven Galactic SN are the subject of historical records: SN185 (RCW 86), SN 386 (G11.2–0.3), SN 1006, SN 1054 (Crab),SN 1181 (3C58), SN 1572 (Tycho), and SN 1604 (Kepler); seealso Stephenson (2017) and references therein. However, thereare additional promising candidates discussed in the literature,such as for example CAS A (Green & Stephenson 2017) andVela-Jr (Aschenbach 1998).
Certainly, visible-band extinction of the SN emission and itsdistance to Earth plays a crucial role when it comes to recog-nising a SN with the naked eye. A prominent example of thiseffect is demonstrated by the missing reports of the CAS A SNevent which is believed to have taken place about 300 yr ago.No widespread reports of CAS A exist in the literature of the17th century (cf. Hartmann et al. 1997). A more recent exam-ple of an unrecognised SN is that of the youngest SN known inour Galaxy, G1.9+0.3, which was completely missed by opticalobservatories about 100 yr ago (Reynolds et al. 2008).
In contrast to SNe which are only observable on a timescaleof months to years, their remnants (SNRs) are detectable over a
A30, page 1 of 12Open Access article, published by EDP Sciences, under the terms of the Creative Commons Attribution License (https://creativecommons.org/licenses/by/4.0),
which permits unrestricted use, distribution, and reproduction in any medium, provided the original work is properly cited.Open Access funding provided by Max Planck Society.

A&A 648, A30 (2021)
large range of the electromagnetic bands for more than 60 000–150 000 yr. However, today only about 300 SNRe are known (cf.Green 2019), most of which were discovered in Galactic planeradio surveys. Assuming that the radio lifetime of a SNR brightenough to be detected with current radio telescopes is at leastabout 60 kyr (Frail et al. 1994), there is a discrepancy by a fac-tor of between four and six between the observed and expectednumber of SNRs. Even if one takes into account the fact thatvery massive stars may form a black hole without a luminousSN (e.g. Kochanek et al. 2008; Adams et al. 2017) there is stilla significant mismatch between the expected and known numberof SNRs. The discrepancy is possibly explained by the fact thatthe radio sample of SNRs is not complete. Reasons that may pre-vent a radio bright remnant from being detected in radio surveysare various:
– A SN shock wave may expand within the hot phase of theISM and reach a very large diameter until it has swept up suf-ficient mass from the low-density gas to form a radio shell.Density inhomogeneities in such a large volume will causedistortions in the shell and can make the identification as aSNR rather difficult, in particular in the presence of con-fusing unrelated emission from other nearby sources in thesame region of the sky.
– A SN shock wave may expand in a very dense medium,making the SNR lifetime rather short, because material isquickly swept up and decelerated. Such an environment islikely to be relevant for example for massive star membersof OB-associations that are surrounded by dense molecularclouds and warm gas. Even during their short lifetime, suchevents are difficult to identify within the strong thermal radioemission from those regions.
– There is a strong bias towards bright resolved objects inobservations towards the inner Galaxy.
– Low-surface-brightness SNRs are easily missed in radio sur-veys if they are below the sensitivity limits of the surveys orif they are confused with other objects in the same area.
– Old SNRs which are in the phase of dissolving into the ISMmay have incomplete radio shells that may then prevent thesesources from being identified as SNRs.
– SNRs located away from the Galactic plane are easily missedin radio surveys, as this area is where these events aretypically targeted.
Given these selection effects in radio surveys and the detectionof unknown SNRs in previous X-ray surveys (e.g. Pfeffermann& Aschenbach 1996; Busser et al. 1996; Asaoka & Aschenbach1994; Asaoka et al. 1996; Egger et al. 1996; Folgheraiter et al.1996), as well as the detection of more than 70 highly significantSNR candidates in our analysis of the ROSAT All-Sky-Surveydata, it was deemed worthy to start searching for undiscoveredSNRs in the first eROSITA All-Sky Survey RASS1 (Predehlet al. 2021).
In this paper we report the discovery of the SNRG249.5+24.5 in the eROSITA data. With a diameter of about4.◦4 it is among the largest SNRs discovered at wavelengths otherthan the radio. The structure of the paper is as follows: eROSITAand ROSAT observations of the remnant along with the dataanalysis are described in Sect. 2. In Sect. 3 we describe the anal-ysis of archival radio data taken from the Continuum HI ParkesAll-Sky Survey (CHIPASS) and the 408 MHz all-sky continuumsurvey in order to search for a radio counterpart to the remnantand to explore its radio emission properties. Section 4 presentsour exploration of spectrometer data from INTEGRAL in orderto search for possible 44Ti decay radiation associated with theremnant. In Sect. 5 we summarise and discuss our results.
2. X-ray observations and data analysis
2.1. Hoinga in the eROSITA All-Sky Survey
The German-built X-ray telescope eROSITA (extended Rönt-gen Survey Imaging Telescope Array) is one of two instrumentson the Russian-German observatory SRG (Spectrum Röntgen-Gamma; Sunyaev et al., in prep.). eROSITA consists of sevenaligned X-ray telescopes (TM1−TM7), each nested with 54gold-coated mirror shells which have a focal length of 1600 mm.All telescopes observe the same sky-region simultaneously inthe 0.2–8 keV band-pass though each focuses the collected X-rays on its own pn-CCD camera (Meidinger et al. 2014). Thelatter is an improved version of the pn-CCD camera aboardXMM-Newton (Strüder et al. 2001). eROSITA has a spectralresolution of ∼70 eV at 1 keV and a temporal resolution of50 ms. Its field of view (FOV) is 1◦. The on-axis effective areaof all seven telescopes combined is slightly higher than that ofthe XMM-Newton pn + MOS cameras in the key 0.5–2.0 keVband-pass. In pointing mode (on axis) the angular resolutionof eROSITA is 18′′ (HEW) whereas in survey mode it is 26′′(FOV averaged). Source location accuracy is of the order of4.′′5 (1σ). The second instrument onboard SRG is the RussianX-ray concentrator MIKHAIL PAVLINSKY ART-XC (Astronom-ical Röntgen Telescope – X-ray Concentrator) (Pavlinsky et al.2018), which is sensitive in the hard X-ray band from 4 upto 30 keV, making it complementary to the eROSITA softband.
The SRG was launched into an L2 orbit on July 13, 2019,with a Russian Proton-M launch vehicle. After a three-monthcalibration and science verification phase it started its firstall-sky survey on December 13, 2019. With a scan rate of0.025 deg s−1, a spacecraft revolution duration of 4 h and a cen-tral FOV passage time of about 40 s (Predehl et al. 2021), eachsurvey takes 6 months to complete. eROSITA is supposed to takeeight all-sky surveys over a time period of 4 yr.
The X-ray data we report here were taken during the firsteROSITA all-sky survey eRASS1, completed on June 12, 2020.As the main science driver of the SGR mission is to explore thenature of dark energy, its orbit was chosen so that the Eclipticpoles get the deepest exposure, leading to an exposure of theGalactic plane which is of the order of ∼200−300 seconds persurvey.
First results of eRASS1, including a fascinating, detail-rich,three-energy-band colour-coded image of the 0.3–8.0 keV X-raysky, were recently released. The survey represents the deepestview of the whole X-ray sky today and led to the discovery ofthe large-scale symmetric hot-gas structures in the Milky Wayhalo, called ‘eROSITA Bubbles’ (Predehl et al. 2020), amongmany other exciting results.
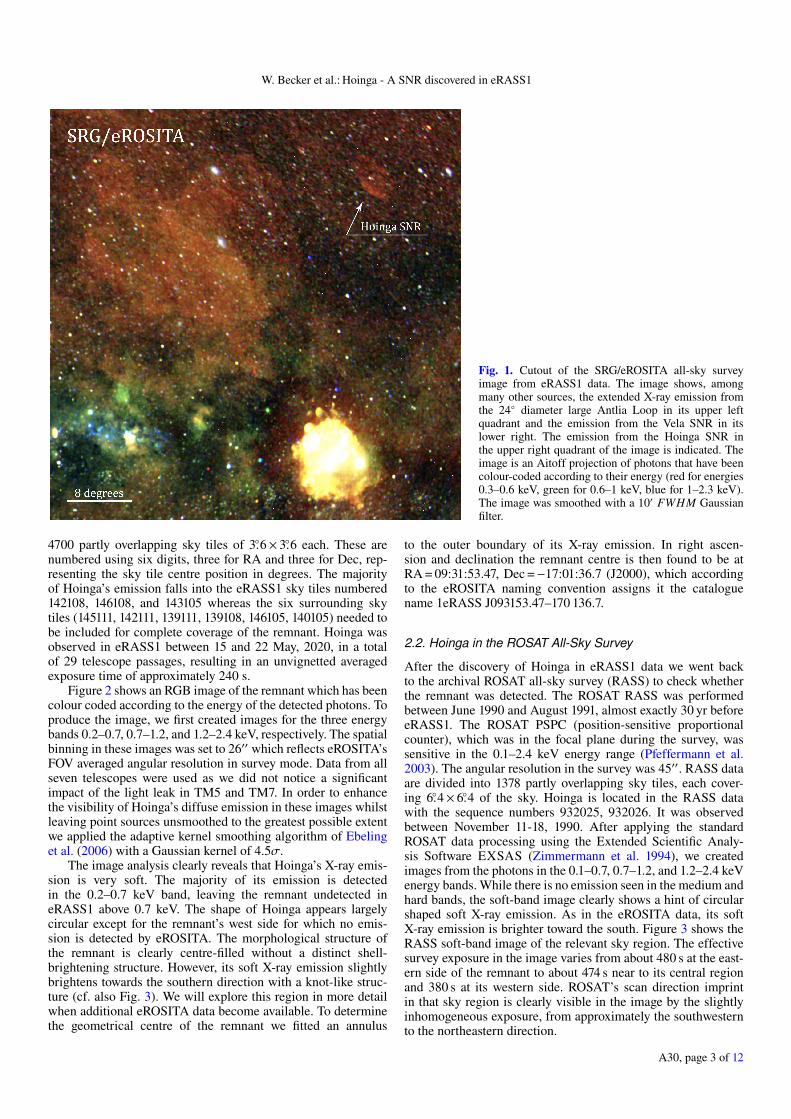
Searching this survey map for unknown extended sourcesrevealed the existence of a new SNR at Galactic coordinatesl= 249.◦5 and b= 24.◦5, labelled G249.5+24.5 which we dubHoinga1. Figure 1 depicts a colour-coded image of the relevantsky region which shows Hoinga with its neighbours the AntliaLoop and the Vela SNR.
The data we use in our analysis were processed by the eSASS(eROSITA Standard Analysis Software) pipeline and have theprocessing number #946. For the data analysis we used eSASSversion 201009 (released on October 9th, 2020)2. Within theeSASS pipeline, X-ray data of the eRASS sky are divided into
1 In honor of the first author’s hometown Bad Hönningen am Rhein:Hoinga was its medieval name.2 cf. https://erosita.mpe.mpg.de/
A30, page 2 of 12
W. Becker et al.: Hoinga - A SNR discovered in eRASS1
Fig. 1. Cutout of the SRG/eROSITA all-sky surveyimage from eRASS1 data. The image shows, amongmany other sources, the extended X-ray emission fromthe 24◦ diameter large Antlia Loop in its upper leftquadrant and the emission from the Vela SNR in itslower right. The emission from the Hoinga SNR inthe upper right quadrant of the image is indicated. Theimage is an Aitoff projection of photons that have beencolour-coded according to their energy (red for energies0.3–0.6 keV, green for 0.6–1 keV, blue for 1–2.3 keV).The image was smoothed with a 10′ FWHM Gaussianfilter.
4700 partly overlapping sky tiles of 3.◦6× 3.◦6 each. These arenumbered using six digits, three for RA and three for Dec, rep-resenting the sky tile centre position in degrees. The majorityof Hoinga’s emission falls into the eRASS1 sky tiles numbered142108, 146108, and 143105 whereas the six surrounding skytiles (145111, 142111, 139111, 139108, 146105, 140105) needed tobe included for complete coverage of the remnant. Hoinga wasobserved in eRASS1 between 15 and 22 May, 2020, in a totalof 29 telescope passages, resulting in an unvignetted averagedexposure time of approximately 240 s.
Figure 2 shows an RGB image of the remnant which has beencolour coded according to the energy of the detected photons. Toproduce the image, we first created images for the three energybands 0.2–0.7, 0.7–1.2, and 1.2–2.4 keV, respectively. The spatialbinning in these images was set to 26′′ which reflects eROSITA’sFOV averaged angular resolution in survey mode. Data from allseven telescopes were used as we did not notice a significantimpact of the light leak in TM5 and TM7. In order to enhancethe visibility of Hoinga’s diffuse emission in these images whilstleaving point sources unsmoothed to the greatest possible extentwe applied the adaptive kernel smoothing algorithm of Ebelinget al. (2006) with a Gaussian kernel of 4.5σ.
The image analysis clearly reveals that Hoinga’s X-ray emis-sion is very soft. The majority of its emission is detectedin the 0.2–0.7 keV band, leaving the remnant undetected ineRASS1 above 0.7 keV. The shape of Hoinga appears largelycircular except for the remnant’s west side for which no emis-sion is detected by eROSITA. The morphological structure ofthe remnant is clearly centre-filled without a distinct shell-brightening structure. However, its soft X-ray emission slightlybrightens towards the southern direction with a knot-like struc-ture (cf. also Fig. 3). We will explore this region in more detailwhen additional eROSITA data become available. To determinethe geometrical centre of the remnant we fitted an annulus
to the outer boundary of its X-ray emission. In right ascen-sion and declination the remnant centre is then found to be atRA = 09:31:53.47, Dec =−17:01:36.7 (J2000), which accordingto the eROSITA naming convention assigns it the cataloguename 1eRASS J093153.47–170 136.7.
2.2. Hoinga in the ROSAT All-Sky Survey
After the discovery of Hoinga in eRASS1 data we went backto the archival ROSAT all-sky survey (RASS) to check whetherthe remnant was detected. The ROSAT RASS was performedbetween June 1990 and August 1991, almost exactly 30 yr beforeeRASS1. The ROSAT PSPC (position-sensitive proportionalcounter), which was in the focal plane during the survey, wassensitive in the 0.1–2.4 keV energy range (Pfeffermann et al.2003). The angular resolution in the survey was 45′′. RASS dataare divided into 1378 partly overlapping sky tiles, each cover-ing 6.◦4× 6.◦4 of the sky. Hoinga is located in the RASS datawith the sequence numbers 932025, 932026. It was observedbetween November 11-18, 1990. After applying the standardROSAT data processing using the Extended Scientific Analy-sis Software EXSAS (Zimmermann et al. 1994), we createdimages from the photons in the 0.1–0.7, 0.7–1.2, and 1.2–2.4 keVenergy bands. While there is no emission seen in the medium andhard bands, the soft-band image clearly shows a hint of circularshaped soft X-ray emission. As in the eROSITA data, its softX-ray emission is brighter toward the south. Figure 3 shows theRASS soft-band image of the relevant sky region. The effectivesurvey exposure in the image varies from about 480 s at the east-ern side of the remnant to about 474 s near to its central regionand 380 s at its western side. ROSAT’s scan direction imprintin that sky region is clearly visible in the image by the slightlyinhomogeneous exposure, from approximately the southwesternto the northeastern direction.
A30, page 3 of 12

A&A 648, A30 (2021)
Fig. 2. Hoinga SNR as seen in the eROSITA all-sky sur-vey eRASS1. Photons to produce this 7.◦5× 7.◦5 imagewere colour coded according to their energy (red forenergies 0.2–0.7 keV, green for 0.7–1.2 keV, blue for1.2–2.4 keV). An adaptive kernel smoothing algorithmwas applied to the images in each energy band.
Fig. 3. Hoinga SNR as seen in the ROSAT all-sky survey. Photons toproduce this image have been selected from within the 0.1–0.7 keVenergy band. A Gaussian smoothing filter with x,y-σ= 3 image pixelwas applied in order to enhance the visibility of the diffuse emission.The gray scale colors are distributed so that white corresponds to apixel intensity value of 0.09 and black to 0.45 cts pixel−1. The image isvignetting and deadtime corrected though no exposure correction wasapplied. The inset in the lower right corner shows a 40′ × 40′ zoom tothe region of the X-ray sources located slightly to east of the remnant’sgeometrical centre.
2.3. X-ray point sources within the Hoinga SNR
In order to identify a possible compact remnant associatedwith Hoinga we applied a source detection to the ROSAT andeROSITA survey data. The point sources detected in both sur-veys along with their properties are summarised in Table 1. TheeROSITA 68% position uncertainty for point sources detected inthe all-sky survey eRASS1 is 4.′′5; for the ROSAT survey it is13′′ (Voges et al. 1999). In Figs. 2 and 3, three point sources canbe seen slightly to the east of the remnant geometrical centre,though rather centred with respect to the diffuse X-ray emis-sion. While the positions of sources #2 and #3 remain unchangedwithin the errors in ROSAT and eROSITA data, source #1 isfound to have an offset towards the southeast of almost 20′′. Forthe purpose of a further source identification, we correlated theeROSITA positions with various radio and optical catalogues,for example NVSS (Condon et al. 1998) and Gaia DR2 (GaiaCollaboration 2018).
For the eROSITA sources #2, #3, #5, #6 we found a con-vincing positional match to a radio counterpart in the NVSScatalogue3. For all sources, we find a close overlap with opti-cal sources from the Gaia DR2 catalogue4. From the propermotion and parallax information for the potential counterparts,it seems likely that sources #1, #2, #3, #5, and #6 are of extra-galactic nature. In contrast, sources #4, #7, #8, #9, #10, and #11appear to be likely of Galactic origin, in agreement with theirbrighter optical appearance.
Assuming the identification of the eROSITA source #1 withan extragalactic optical source is correct, it seems more likelyto us that the computed ROSAT RASS position of this faint
3 https://www.cv.nrao.edu/nvss4 https://gea.esac.esa.int/archive
A30, page 4 of 12

W. Becker et al.: Hoinga - A SNR discovered in eRASS1
Table 1. X-ray sources detected within the Hoinga SNR in eROSITAeRASS1 and ROSAT RASS data.
Source RA (J2000) Dec (J2000) Obs. timeh:m:s d:m:s 〈MJD〉
eROSITA eRASS1
1 09:33:41.096 −17:09:18.932 58 987.402822 09:33:18.088 −17:14:41.741 58 987.319463 09:34:30.071 −17:21:21.224 58 987.652744 09:37:57.489 −17:10:14.453 58 988.236305 09:27:29.469 −18:06:20.653 58 986.485506 09:27:50.522 −16:40:01.672 58 985.986147 09:36:25.814 −18:21:05.829 58 988.402578 09:28:45.469 −15:24:10.805 58 985.736679 09:28:38.097 −15:21:08.361 58 985.7368210 09:40:02.199 −17:09:55.614 58 988.6531011 09:26:58.572 −16:30:06.584 58 985.73626
ROSAT RASS
1 09:33:41.421 −17:08:59.602 48 210.593652 09:33:18.151 −17:14:39.386 48 210.526873 09:34:30.177 −17:21:17.739 48 210.860654 09:37:57.671 −17:10:07.991 48 211.727997 09:36:26.231 −18:21:05.791 48 211.8279310 09:40:02.494 −17:09:58.469 48 212.2621511 09:26:58.256 −16:30:01.930 48 208.55845
Notes. The detection significance of the listed sources is ≥5σ. Theposition uncertainty of eROSITA point sources is 4.′′5 (1σ confidence).〈MJD〉 is the Modified Julian Date of the observation in eRASS1 andRASS, respectively. The numbering for the centrally located sources#1 − #3 is reported in the lower-right inset of Fig. 3.
X-ray source has a larger uncertainty than the 13′′ found on aver-age (68% confidence) for ROSAT RASS sources (Voges et al.1999). Assuming a real offset for source #1 would imply a propermotion of ∼20′′/30 yr, which seems unlikely to us as we did notfind a nearby bright star as optical counterpart. Indeed, of the11 X-ray sources detected within the Hoinga SNR, none have anoptical counterpart fainter than the twentieth magnitude in theGaia G-band. Similarly, in the infrared band where the fainterobject is found, H ' 16 and W2 (4.6µm) '14 in 2MASS andWISE catalogues, respectively. We therefore conclude that all 11X-ray sources are either foreground or background objects whichare not associated with Hoinga.
2.4. Spectral analysis
In order to properly correct the source spectrum and energy fluxfor contributions from the instrument- and sky-background, weanalysed a sky field of about 8◦ × 8◦ centred on the remnant.Hoinga’s energy spectrum was extracted from the eROSITAeRASS1 data by selecting all events recorded within an ellip-tical region of semi-minor and major axis of 2.◦0 and 2.◦35,respectively. The elliptical region was centred at the positionRA = 9:32:57.30, Dec =−16:51:41.00 and tilted by 14.◦5. SAOIM-AGE DS9 (Joye & Mandel 2003) was used for the definitionof the event-selection regions. The background spectrum wasextracted from a surrounding elliptical ring for which we chosethe axes so that it did not include events from the remnant itself.The ring had a difference between its inner and outer regionof 0.◦3. Events from unrelated X-ray sources located within the
Fig. 4. Energy spectrum of the Hoinga SNR as observed with theeROSITA TM1, 2, 3, 4, and 6 telescope and detector units and simulta-neously fitted to an absorbed APEC spectral model (upper panel). Thespectra have been binned for visual clarity and plotting purposes. Thesignal-to-noise ratio in each bin is 15σ. The folded best-fit APEC spec-tral model is plotted as a solid black line. Fit residuals are shown in thelower panel.
source or background regions were excluded from the spectralanalysis.
In total, the extracted spectra included 43 910 and 28 930counts from the source and background regions, respectively,resulting in about 15 000 net events. To model Hoinga’s X-ray spectrum, we used only events from the telescope unitsTM1, 2, 3, 4, and 6. Events from the two telescopes TM5and TM7 were excluded from the spectral analysis as bothunits suffer light leaks related to the sun–satellite angle, mak-ing their soft-response calibration quite uncertain at that earlystage of the mission. Model spectra were simultaneously fit-ted to Hoinga’s source and background spectra. We used Xspec12.10.1f (Dorman et al. 2003) and applied the C-statistics tothe fits in which we modelled the source and backgroundspectra independently. Of the fitted model spectra, the APECspectrum from collisionally ionised diffuse gas (Foster et al.2012) and the PSHOCK model (Plane-parallel SHOCK plasmamodel with non-equilibrium ionisation; Borkowski et al. 2001)were found to provide fits of equal goodness and with similarspectral parameters to the observed spectrum. We used theabundance table and the TBabs absorption model from Wilmset al. (2000). For the meaning of the fitted spectral parame-ters, we refer the reader to the Xspec manual5 and referencestherein.
Figure 4 depicts the best-fit APEC model. The model spec-trum folded through the detector response is shown with a
5 https://heasarc.gsfc.nasa.gov/xanadu/xspec/XspecManual.pdf
A30, page 5 of 12

A&A 648, A30 (2021)
Table 2. Best-fit parameters from the fit of APEC and PSHOCK modelsto the spectrum of Hoinga.
Parameter APEC PSHOCK
NH (1020cm−2) 3.6+0.7−0.6 3.6+0.6
−1.0
kT (keV) 0.111+0.004−0.004 0.108+0.012
−0.008
τ (1011s cm−3) ... >1.1 (a)
Normalization 0.17+0.03−0.03 0.13+0.06
−0.06C Statistic / d.o.f. 7625.1/7347 7625.1/7346
Notes. Errors represent the 68% confidence range. (a)The ionisationtimescale τ is only weakly constrained by the fitted spectrum, whichis why we only give a 95% lower limit.
Fig. 5. Contour plot showing the relative parameter dependence of thefitted spectral parameters kT (temperature) vs. NH (column absorp-tion) for the APEC model fit to the energy spectrum of Hoinga. Thethree contours represent the 1σ, 2σ, and 3σ confidence levels for twoparameters of interest. The small red dot marks the best-fit position.
black solid line. Table 2 lists the best-fit spectral parameters ofboth models. Due to the preliminary calibration status of theeROSITA instruments at the time of writing, we refrain from giv-ing absolute energy fluxes as obtained from the best-fit models.The contour plot shown in Fig. 5 gives the parameter dependenceof the temperature versus the column absorption for the APECmodel.
3. Radio observations and data analysis
3.1. The Murchison Widefield Array
The Murchison Widefield Array (MWA; Tingay et al. 2013;Wayth et al. 2018) is a low-frequency radio telescope operat-ing in Western Australia, and is a precursor to the low-frequencycomponent of the Square Kilometre Array. The GaLactic andExtragalactic All-sky MWA (GLEAM; Wayth et al. 2015) sur-vey observed the whole sky south of declination (Dec) +30◦
from 2013 to 2015 between 72 and 231 MHz. A major datarelease covering 24 402 square degrees of extragalactic skywas published by Hurley-Walker et al. (2017), while individualstudies have published smaller regions such as the MagellanicClouds (For et al. 2018) and parts of the Galactic plane (Hurley-Walker et al. 2019a). An important feature of this radio survey isits sensitivity to large-scale (1◦−15◦) features, which has enabledstudies of SNRs and HII regions across a wide range of sizes andthe full range of frequencies, independent of resolution biases(see e.g. Hindson et al. 2016; Su et al. 2018; Hurley-Walker et al.2019b).
Hoinga is visible in the public GLEAM images6 but is con-taminated by the presence of hundreds of radio sources, themajority of which are likely unrelated radio galaxies (left panelof Fig. 6). To accurately measure the radio flux density ofHoinga, we reprocessed 13 two-minute observations spanning103–231 MHz from a drift scan centred at Dec −13◦ taken on2014-03-04, with three or four observations in each 30.72-MHzband, yielding integration times of ≈10 min per band. For eachobservation, we performed the following steps, in each caseattenuating the brightness of modelled sources using the MWAprimary beam model of Sokolowski et al. (2017):
– download the data from the All-Sky Virtual Observatory7 instandard measurement set format, averaged to 40 kHz and 2 sfrequency and time resolution;
– calculate a first-pass amplitude and phase calibration foreach antenna using a sky model comprised of the brightnearby source Hydra A and the GLEAM catalogue, via thesoftware CALIBRATE, an implementation of the MITCHCALalgorithm (Offringa et al. 2016);
– apply the derived calibration solutions;– use the PEEL software to remove Hydra A from the visibili-
ties, with a solution interval of 4 s;– directly subtract the GLEAM sources from the visibilities
using SUBTRMODEL;– use the widefield radio imaging package WSCLEAN
(Offringa et al. 2014) to image the data using natural weight-ing and multi-scale multi-frequency synthesis over the full30.72-MHz band down to a threshold of three times the localimage noise, and then clean the data down to the local imagenoise in regions found to contain brightness.
The ionosphere was found to be in a relatively quiescentstate, with minor (≈arcsec) position shifts imparted to theradio sources; the images were corrected using FITS_WARP(Hurley-Walker & Hancock 2018). For each 30.72-MHz band,the primary-beam-corrected images were then mosaicked usingSWARP (Bertin et al. 2002). The resulting image is shown inthe right panel of Fig. 6. Hoinga is visible as a pair of arcs ofwidth ≈1◦, 5◦ apart from one another. The local diffuse Galacticsynchrotron is also visible as a fainter series of filaments with asimilar colour (i.e. spectral index).
We used the software POLY_FLUX (Hurley-Walker et al.2019c) to measure the total flux densities of Hoinga in eachband, estimating and subtracting a mean background level. Asthe selection of the boundaries of the SNR is somewhat subjec-tive, we used the tool ten times and recorded the average result.The results are shown in Table 3. The uncertainties are estimatedat 20%, dominated by the difficulty in selecting the true boundsof the SNR and calculating the true background level of theGalactic cirrus.
6 http://gleam-vo.icrar.org/gleam_postage/q/form7 https://asvo.mwatelescope.org/
A30, page 6 of 12

W. Becker et al.: Hoinga - A SNR discovered in eRASS1
Fig. 6. ∼10◦ × 10◦ of the region surrounding Hoinga as seen by GLEAM at 103-134 MHz (R), 139-170 MHz (G), and 170-200 MHz (B). Left panel:image from the data release of Hurley-Walker et al. (2017), and right panel: region after reprocessing to subtract sources and highlight large-scalestructure (see Sect. 3.1). Hoinga is visible as an ellipse in the centre of the image; steep-spectrum Galactic cirrus becomes a strong contaminant atthese low frequencies and is visible as large-scale filaments around the remnant. The bright source in the northwest is Hydra A.
Table 3. Integrated flux densities of Hoinga measured from the radiodata described in Sect. 3.
Survey Frequency Resolution Flux density(MHz) (′) (Jy)
GLEAM 118 7.8× 6.6 115± 23GLEAM 154 6.0× 5.0 100± 20GLEAM 185 5.0× 4.2 90± 18GLEAM 215 4.2× 3.6 80± 16Haslam 408 51 60± 10
CHIPASS 1400 14.4 19.7± 1.0SPASS 2300 8.9 15.2± 0.3
Notes. Measurements were made on images where contaminat-ing sources and background had been removed using the softwarePOLY_FLUX.
3.2. Haslam
The all-sky 408-MHz ‘Haslam’ survey was performed with theGreen Bank and Parkes Radio telescopes and remains the lowest-frequency total-power measurement of the full sky (Haslam et al.1982). The Hoinga SNR is visible in the Haslam images (Fig. 7)but the scanning pattern of Parkes is visible as a series of verti-cal lines of varying brightness throughout the image. As this isa total power measurement, the largest scale Galactic cirrus fea-tures are much brighter than Hoinga, leading to a large increasein brightness between the east and west parts of the image. Theimages are also invisibly contaminated by the same radio sourcesresolved in the GLEAM data (Sect. 3.1). To mitigate these issues,we used the following steps:
– model and subtract the GLEAM extragalactic catalogue forthis region, extrapolating the source spectra to 408 MHz,
either via their spectral index α as measured by GLEAM orfor the fainter sources, by an assumed value of −0.75;
– determine the average brightness profile over the lower por-tion of the image (south of Hoinga) as a function of rightascension, and subtract this profile from the full image.
This resulted in the right-hand panel of Fig. 7, where the arte-facts and contaminating sources have largely been removed.Similarly to the GLEAM data, we ran POLY_FLUX and foundthat the uncertainty on the final results was dominated by thedifficulty in subtracting the background, which still has largescan artefacts. We therefore conservatively estimate the errorat 20%.
We also attempted to use the ‘de-striped’ ‘de-sourced’ ver-sion of the Haslam image produced by Remazeilles et al. (2015),but Hoinga was invisible in this version, possibly because ithas similar angular scale to the scanning artefacts, and so wasremoved by the clean-up algorithms employed.
3.3. CHIPASS
The continuum map of the HI Parkes All-Sky Survey (CHIPASS;Calabretta et al. 2014) maps the radio sky at 1.4 GHz south ofDec +25◦. We downloaded the data8, and cropped and regrid-ded it to match the MWA mosaics (left panel of Fig. 8). Weselected sources within 15◦ of Hoinga from the NRAO VLA SkySurvey (NVSS; Condon et al. 1998), convolved them to matchthe CHIPASS resolution, and produced an output FITS image inthe same sky frame as the regridded CHIPASS data. We sub-tracted the NVSS model from the CHIPASS image, producingthe right panel of Fig. 8. We used POLY_FLUX to measure the
8 https://www.atnf.csiro.au/people/mcalabre/CHIPASS/index.html
A30, page 7 of 12

A&A 648, A30 (2021)
Fig. 7. 100 deg2 of the region surrounding the Hoinga SNR as seen at 408 MHz by the survey by Haslam et al. (1982), after conversion from K toJy beam−1. Left panel: original image, and right panel: image after source-subtraction and backgrounding, discussed in Sect. 3.2. Hoinga is visibleas an ellipse in the centre of the image, while Galactic cirrus and scan line artefacts from the Parkes observing strategy dominate the surroundings.The bright source in the northwest is Hydra A, and subtraction of this source has not been performed.
Fig. 8. 100 deg2 of the region surrounding Hoinga as seen at 1.4 GHz by CHIPASS, after conversion from K to Jy beam−1. Left panel: originalimage, and right panel: image after source subtraction, discussed in Sect. 3.3. Hoinga is clearly visible as a crescent-moon in the centre of theimage, while Galactic cirrus and residuals around poorly subtracted diffuse sources are visible in the surroundings. The bright source in thenorthwest is Hydra A. Faint scan lines are visible from the Parkes observing strategy.
flux density of Hoinga, shown in Table 3. The errors are dom-inated by the selection of the region for subtraction, and afterrepeated measurements, we estimate this at about 5%, which is1 Jy.
3.4. S-PASS
The S-Band Polarization All Sky Survey (SPASS ; Carretti et al.2019) is a survey of polarized radio emission over the southern
sky at Dec < −1◦ using the Parkes radio telescope at 2.3 GHz.Unlike for CHIPASS (Sect. 3.3) there is no independent cata-logue of extragalactic radio sources at 2.3 GHz. Meyers et al.(2017) derived a catalogue of radio sources from a version of theS-PASS images where the large-scale emission had been filteredout, with slightly worse resolution (10.′75) than the publishedimages (8.′9). This catalogue is not as sensitive as and is moreconfused than NVSS yielding a source density equal to 3% thatof NVSS.
A30, page 8 of 12

W. Becker et al.: Hoinga - A SNR discovered in eRASS1
Fig. 9. 100 deg2 of the region surrounding Hoinga as seen at 2.3 GHz by SPASS. Top-left panel: Stokes I image, and top-right panel: image aftersource subtraction, discussed in Sect. 3.4. Hoinga is clearly visible as a filled ellipse in the centre of the image, while Galactic cirrus and residualsaround poorly subtracted diffuse sources are visible in the surroundings. Bottom left and bottom right panels: Stokes Q and U images, respectively.
We therefore use NVSS to create the local model of sourcesto subtract. To obtain spectral indices for each source, we usethe catalogue produced by de Gasperin et al. (2018); for sourceswithout a listed spectral index, we use the median local value ofα=−0.75. Subtracting this model from the S-PASS data resultsin the right-hand panel of Fig. 9. Running POLY_FLUX repeat-edly we find more consistent results than for CHIPASS; theuncertainty is most likely dominated by the less clean sourcesubtraction. The residual RMS after source subtraction in a givenbeam is ≈20 mJy beam−1; Hoinga subtends 256 SPASS beams;the error is therefore estimated as 0.32 Jy.
As S-PASS is a polarisation survey, we can also examinethe Stokes Q and U images of the region, which indicate thedegree of linear polarisation at angles of ±90◦ and ±45◦, respec-tively. Figure 9 shows that the brightest parts of the shell (leftand right ‘limbs’) show clear linear polarisation, which is whatwould be expected from a middle-aged SNR shell with a largeshock compression ratio. These also correspond to flatter partsof the SNR shell, perhaps indicating a local increase in gasdensity.
4. Constraints on 44 Ti emission from INTEGRAL
Explosive nucleosynthesis in SNe is considered the main driverof Galactic, chemical evolution. Its imprints can be readily inves-tigated by observing the γ-rays emitted in the decay from freshlysynthesized, radioactive nuclei. With a half-life of 58.9 yr, theabundantly produced 44Ti is an ideal candidate with which tostudy nucleosynthesis imprinting in young SNRs.
In core collapse supernovae (ccSN) 44Ti is mainly producedduring the α-rich freeze-out (Woosley et al. 1973) deep in thecentral region, where the nucleosynthesis yields are stronglydependent on the thermodynamic conditions (Magkotsios et al.2010; Hermansen et al. 2020). While models of ccSN fail torobustly produce explosions in a wide stellar mass range so far,it appears safe to assume that asymmetries are required to drivesuccessful explosions. Depending on the applied, simplifiedexplosion scheme, the predicted 44Ti ejecta yield can vary in therange 10−5−10−4 M�, depending also on the initial mass of theexploding star (Timmes et al. 1996; Wanajo et al. 2018; Limongi& Chieffi 2018).
A30, page 9 of 12

A&A 648, A30 (2021)
In contrast, thermonuclear SNe (type Ia) show a larger diver-sity in the predicted 44Ti ejecta masses. Multiple scenariosleading to the disruption of a white dwarf star are consideredviable, as the progenitors of these explosions have not yet beenunambiguously identified. For the standard model, involvinga centrally ignited Chandrasekhar-mass white dwarf star, 44Tiejecta masses range between 10−6 and 10−5 M� (Maeda et al.2010; Seitenzahl et al. 2013; Fink et al. 2014). However, in thedouble-detonation scenario, ejecta masses of 10−3−10−2 M� arepossible (Fink et al. 2010; Woosley & Kasen 2011; Moll &Woosley 2013), where some exotic models even predict 44Timasses of up to 0.1 M� (Perets et al. 2010; Waldman et al. 2011).
Evidence for the production of 44Ti can be obtained bymeasuring the decay radiation in the decay chain of 44Ti →44Sc → 44Ca. The dominant decay lines are emitted at 68and 78 keV during the 44Ti decay with a half life of 58.9 yr(Ahmad et al. 2006) and at 1157 keV in the subsequent 44Scdecay with a half life of 4 h (Audi et al. 2003). Photons are emit-ted with a probability (branching ratio) of 93.0, 96.4, and 99.9%per decay, respectively (Chen et al. 2011)
Here, the spectrometer SPI (Vedrenne et al. 2003) on INTE-GRAL (Winkler et al. 2003) is used to search for the decayradiation in both subsequent decay steps in the Hoinga SNR. Weuse the spimodfit analysis tool (Strong et al. 2005; Halloin 2009)to extract the spectrum in the relevant energy ranges 50–100 and1100–1200 keV from the raw SPI data. The spectrum is extractedassuming an extended source of emission modelled by a circu-lar region of 2.◦2 radius with a constant surface brightness. Adetailed description of SPI analysis and robust background mod-elling can be found in Diehl et al. (2018), Siegert et al. (2019)and Weinberger et al. (2020).
The extracted spectrum is modelled with a general contin-uum and a variable number of Gaussian-shaped decay linesgiven by
LS(E; E0, F0, σ)=F0√2πσ
· exp(
(E − E0)2
2σ2
)+ A0 ·
(E
EC
)α, (1)
where F0 is the measured line flux, E0 is the energy of theDoppler-shifted line centroid, and σ is the line width. As weexpect a low signal-to-noise ratio for the decay lines, we searchfor a combined signal in all lines simultaneously, that is weassume that the branching ratio corrected fluxes, Doppler shifts,and broadening are identical in all lines. Due to the presence ofa complex of strong background lines between 50 and 65 keVinduced by germanium, we excluded the 68 keV line in theanalysis.
We find no significant flux excess in the vicinity of the 78 or1157 keV line or in the combined line analysis. As the broad-ening of the 78 or 1157 keV lines is related to the expansionvelocity of the 44Ti-containing ejecta and determines the size ofthe selected background region, we deduce a 3σ upper flux limitof 9.2× 10⁻⁵ ph cm−2 s−1 by assuming an expansion velocity of4000 km s−1 (Nagataki et al. 1998; Diehl et al. 2015). This expan-sion velocity translates into a line broadening of ≈2 keV FWHMat 78 keV and ≈20 keV FWHM at 1157 keV, respectively.
5. Summary and discussion
Using data from the first SRG/eROSITA observatory all-sky sur-vey we discovered one of the largest SNRs in the sky. Despite95% of SNR discoveries being made at radio wavelengths, andits clear existence in multiple radio surveys, we conclude thatHoinga was missed by previous searches for several reasons.
Fig. 10. Radio SED of the total flux density of Hoinga as measuredby the surveys discussed in Sect. 3. Black points show the data fromTable 3; the blue line shows a least-squares weighted fit to the data,yielding S 1GHz = 26.85± 0.03 Jy and α=−0.69± 0.08 for S ν ∝ να.
Firstly, its location at high Galactic latitudes; most radio searcheshave focused on low latitudes, where the density of SNRs isexpected to be highest. Another reason for not noticing it in pre-vious X-ray and radio surveys is its total flux density. Althoughit is large, its surface brightness is relatively low. As it hasvery little fine-scale structure, it also does not appear at all inmost interferometric maps. In single-dish radio images, it is vis-ibly contaminated by about 100 extragalactic radio sources, withmany more below the sensitivity and confusion limits, mean-ing that its diffuse radio emission remained uncovered. Hoingais nearly the largest SNR ever detected at radio wavelengths,subtending ≈275′ × 265′, and comparable in size to the largestdetected object, G 65.3+5.7: it was therefore outside the boundsof what was expected and was therefore not visually detected.Finally, its similar angular scale and structure to the diffuseGalactic synchrotron makes it less obvious than smaller andbrighter sources.
The clear shell structure, particularly evident in Figs. 1 and 8,indicates it is likely to be a classic shell-type SNR that is not cen-trally powered, and its highly circular nature indicates that it isexpanding into a region of relatively uniform density. Figure 10shows the radio flux densities plotted as a function of fre-quency, with a fitted spectral index of α=−0.69± 0.08, for S ν ∝να. This radio spectral energy distribution indicates that non-thermal synchrotron emission dominates the radio spectrum,again consistent with a shell-type SNR.
A distance to the SNR would enable transformation of ourmeasurements into physical properties. Dubner & Giacani (2015)discuss the challenge of estimating the distance of radio-detectedSNRs; a method that does not rely on additional observationsis to search for nearby neutron stars that appear as pulsars andmay have formed at the same time as the SNR, and using theirdispersion measure in combination with electron density modelsof the Galaxy to determine their distance.
A30, page 10 of 12

W. Becker et al.: Hoinga - A SNR discovered in eRASS1
We used the Australia Telescope National Facility pulsar cat-alogue v1.59 (Manchester et al. 2005)9 to search for known radiopulsars within 20◦ of Hoinga’s geometrical centre, but foundnone with attributes that would indicate a clear association. Fromthe group of pulsars located in the region of interest we excludedpossible matches on the basis of:
– period P < 10 ms, indicating a recycled origin;– characteristic ages ( P
2P ) > 45 Myr, which would be extremelyinconsistent with a SNR age of <0.5 Myr;
– measured proper motion inconsistent with having a commoncentre of origin;
– measured dispersion measure inconsistent with a nearbylocation.
This avenue is therefore unpromising, but because the cover-age of pulsar surveys is denser at low Galactic latitude, a pulsarcould have been missed by existing observations, and follow-upobservations within the SNR shell may yet reveal a counterpart.Assuming a distance of ∼500 pc, a remnant NS with a transversalspeed of the order of 1000 km s−1 would have by now reached theSN shell if the explosion happened ∼17000 yr ago. This speedis not unrealistic, albeit at the far side of the velocity distribution(see e.g. Cordes et al. 1993; Chatterjee et al. 2005; Becker 2009).We will investigate this possibility in future work.
In the absence of a measured distance, we can use the mor-phological and brightness properties of the SNR to infer limitson the physical characteristics. Studies of the Magellanic Cloudsand other Local Group galaxies show that SNR 1.4-GHz lumi-nosities typically have values in the range 5× 10¹⁴ < L1.4GHz <1017 W Hz−1 (e.g. Case & Bhattacharya 1998). Assuming thatHoinga is more luminous than 5× 10¹⁴ W Hz−1, we can obtain a
limit on its distance from Earth by√
L1.4GHz4πS 1.4GHz
, i.e. D > 450 pc.Additionally, radio SNRs do not typically have diameters greaterthan 100 pc (Badenes et al. 2010). If we assume that Hoingahas a diameter <100 pc, by geometry its distance from Earthmust be D < 1.2 kpc. This also gives rise to a luminositylimit of L1.4GHz < 1.3× 10¹⁶ W Hz−1, which puts Hoinga on thelower end of the SNR luminosity distribution. We note thatother high-latitude SNRs have also been found to have unusu-ally low brightness compared to those at low latitudes; see e.g.G181.1+9.5 (Kothes et al. 2017) and G 0.1−9.7 (Hurley-Walkeret al. 2019b).
If we compare the remnant with other nearby SNRs suchas the Vela SNR, which is also known to have an extent of8.◦8 and a thermal X-ray spectrum with gas temperatures inthe range of 0.2–0.7 keV, a simple scaling law puts Hoingaat twice the distance of the Vela SNR, which is about 500 pc.The column absorption through the Galaxy into the directionof Hoinga is 6× 1020 cm−2 (Dickey & Lockman 1990). Thevalues found from our X-ray spectral fits are of the orderof NH = 3.6+0.7
−0.6 × 1020 cm−2 which gives another indication forHoinga being a nearby SNR.
If we assume that the column density derived in Sect. 2.4is representative along the entire line of sight, we can derive arange of local ISM densities by dividing by the distance lim-its. For a column density of NH = 6× 1020 cm−2, and distancesof 0.45–1.2 kpc, the resulting local density nH = 0.42–0.16 cm−3.Inputting these into the SNR evolutionary model calculator pro-vided by Leahy & Williams (2017), with otherwise standardmodel and input values, we calculate the range of possible agesas 21–150 kyr. However, the morphology of the SNR suggests a
9 atnf.csiro.au/research/pulsar/psrcat/
much lower age, and therefore we suggest the SNR is likely tobe at the closer, younger, and higher nH ends of the allowableranges.
Taking into account the fact that no pulsar has been asso-ciated with the object so far, it is highly possible that Hoingais the remnant of a type Ia SN. This would also be consistentwith the high latitude of the SNR, as the massive star progeni-tors of core-collapse SNe are expected to be more concentratedin the Galactic plane (Taylor et al. 1993; Cordes & Lazio 2002;Faucher-Giguere & Kaspi 2006).
eROSITA will perform a total of eight all-sky surveys. Withfurther surveys completed, more data from the Hoinga remnantwill become available in the next few years. This will allow usto study the remnants fine structure and spectral properties inmore detail, hopefully allowing us to further constrain its dis-tance, age, chemical composition, and SN type. The findings ofHoinga represent a highlight of the beginning of a wider programsetup by the authors WB and NHW as part of an eROSITA-Australian-based joint-venture collaboration defined to explorethe X-ray-radio-sky in order to uncover further exciting surprisesin the SNR sphere.
Acknowledgements. We thank Bernd Aschenbach and Nicholas Pingel for fruitfuldiscussions and the anonymous referee for valuable comments. eROSITA is theprimary instrument aboard SRG, a joint Russian-German science mission sup-ported by the Russian Space Agency (Roskosmos), in the interests of the RussianAcademy of Sciences represented by its Space Research Institute (IKI), and theDeutsches Zentrum für Luft- und Raumfahrt (DLR). The SRG spacecraft wasbuilt by Lavochkin Association (NPOL) and its subcontractors, and is operatedby NPOL with support from IKI and the Max Planck Institute for Extraterres-trial Physics (MPE). The development and construction of the eROSITA X-rayinstrument was led by MPE, with contributions from the Dr. Karl Remeis Obser-vatory Bamberg & ECAP (FAU Erlangen-Nürnberg), the University of HamburgObservatory, the Leibniz Institute for Astrophysics Potsdam (AIP), and the Insti-tute for Astronomy and Astrophysics of the University of Tübingen, with thesupport of DLR and the Max Planck Society. The Argelander Institute for Astron-omy of the University of Bonn and the Ludwig Maximilians Universität Munichalso participated in the science preparation for eROSITA. The eROSITA datashown here were processed using the eSASS/NRTA software system developedby the German eROSITA consortium. N.H.W. is supported by an AustralianResearch Council Future Fellowship (project number FT190100231) funded bythe Australian Government. This scientific work makes use of the MurchisonRadio-astronomy Observatory, operated by CSIRO. We acknowledge the WajarriYamatji people as the traditional owners of the Observatory site. Support for theoperation of the MWA is provided by the Australian Government (NCRIS), undera contract to Curtin University administered by Astronomy Australia Limited.Establishment of the Murchison Radio-astronomy Observatory and the PawseySupercomputing Centre are initiatives of the Australian Government, with sup-port from the Government of Western Australia and the Science and IndustryEndowment Fund. We acknowledge the Pawsey Supercomputing Centre whichis supported by the Western Australian and Australian Governments. Access toPawsey Data Storage Services is governed by a Data Storage and ManagementPolicy (DSMP). ASVO has received funding from the Australian Common-wealth Government through the National eResearch Collaboration Tools andResources (NeCTAR) Project, the Australian National Data Service (ANDS),and the National Collaborative Research Infrastructure Strategy. This researchhas made use of NASA’s Astrophysics Data System Bibliographic Services.M.G.F.M. acknowledges support by the International Max-Planck ResearchSchool on Astrophysics at the Ludwig-Maximilians University, IMPRS. Thiswork has made use of data from the European Space Agency (ESA) mission Gaia(https://www.cosmos.esa.int/gaia), processed by the Gaia Data Process-ing and Analysis Consortium (DPAC, https://www.cosmos.esa.int/web/gaia/dpac/consortium). Funding for the DPAC has been provided by nationalinstitutions, in particular the institutions participating in the Gaia MultilateralAgreement. The following 3rd-party software was used in this work: AOFLAG-GER and COTTER (Offringa et al. 2015); WSCLEAN (Offringa et al. 2014;Offringa & Smirnov 2017); AEGEAN (Hancock et al. 2018); MIRIAD (Sault et al.1995); TOPCAT (Taylor 2005) NUMPY v1.11.3 (Dubois et al. 1996; Harris et al.2020); ASTROPY v2.0.6 (Astropy Collaboration 2013); SCIPY v0.17.0 (Oliphant2007), MATPLOTLIB v1.5.3 (Hunter 2007). The manuscript was prepared on theweb-based LATEX editor, Overleaf.
A30, page 11 of 12

A&A 648, A30 (2021)
ReferencesAdams, S. M., Kochanek, C. S., Gerke, J. R., Stanek, K. Z., & Dai, X. 2017,
MNRAS, 468, 4968Ahmad, I., Greene, J. P., Moore, E. F., et al. 2006, Phys. Rev. C, 74, 065803Asaoka, I., & Aschenbach, B. 1994, A&A, 284, 573Asaoka, I., Egger, R., & Aschenbach, B. 1996, Röntgenstrahlung from the
Universe, eds. H. U. Zimmermann, J. Trümper, & H. Yorke, 233Aschenbach, B. 1998, Nature, 396, 141Astropy Collaboration (Robitaille, T. P., et al.) 2013, A&A, 558, A33Audi, G., Bersillon, O., Blachot, J., & Wapstra, A. H. 2003, Nucl. Phys. A, 729,
3Badenes, C., Maoz, D., & Draine, B. T. 2010, MNRAS, 407, 1301Becker, W. 2009, Astrophys. Space Sci. Lib., 357, 91Bertin, E., Mellier, Y., Radovich, M., et al. 2002, ASP Conf. Ser., 281, 228Borkowski, K. J., Lyerly, W. J., & Reynolds, S. P. 2001, ApJ, 548, 820Busser, J.-U., Egger, R., & Aschenbach, B. 1996, Röntgenstrahlung from the
Universe, eds. H. U. Zimmermann, J. Trümper, & H. Yorke, 239Calabretta, M. R., Staveley-Smith, L., & Barnes, D. G. 2014, PASA, 31, e007Carretti, E., Haverkorn, M., Staveley-Smith, L., et al. 2019, MNRAS, 489, 2330Case, G. L., & Bhattacharya, D. 1998, ApJ, 504, 761Chatterjee, S., Vlemmings, W. H. T., Brisken, W. F., et al. 2005, ApJ, 630, L61Chen, J., Singh, B., & Cameron, J. A. 2011, Nucl. Data Sheets, 112, 2357Condon, J. J., Cotton, W. D., Greisen, E. W., et al. 1998, AJ, 115, 1693Cordes, J. M., & Lazio, T. J. W. 2002 ArXiv e-prints
[arXiv:astro-ph/0207156]Cordes, J. M., Romani, R. W., & Lundgren, S. C. 1993, Nature, 362, 133de Gasperin, F., Intema, H. T., & Frail, D. A. 2018, MNRAS, 474, 5008Dickey, J. M., & Lockman, F. J. 1990, ARA&A, 28, 215Diehl, R., Siegert, T., Hillebrandt, W., et al. 2015, A&A, 574, A72Diehl, R., Siegert, T., Greiner, J., et al. 2018, A&A, 611, A12Dorman, B., Arnaud, K. A., & Gordon, C. A. 2003, AAS/High Energy Astro-
physics Division, 7, AAS/High Energy Astrophysics Division, 22.10Dubner, G., & Giacani, E. 2015, A&ARv, 23, 3Dubois, P. F., Hinsen, K., & Hugunin, J. 1996, Comput. Phys. Commun., 10, 262Ebeling, H., White, D. A., & Rangarajan, F. V. N. 2006, MNRAS, 368, 65Egger, R., Greiner, J., & Aschenbach, B. 1996, Röntgenstrahlung from the
Universe, eds. H. U. Zimmermann, J. Trümper, & H. Yorke, 247Faucher-Giguere, C.-A., & Kaspi, V. M. 2006, ApJ, 643, 332Fink, M., Röpke, F. K., Hillebrandt, W., et al. 2010, A&A, 514, A53Fink, M., Kromer, M., Seitenzahl, I. R., et al. 2014, MNRAS, 438, 1762Folgheraiter, E. L., Watson, M. G., & Warwick, R. S. 1996, Röntgenstrahlung
from the Universe, eds. H. U. Zimmermann, J. Trümper, & H. Yorke, 253For, B. Q., Staveley-Smith, L., Hurley-Walker, N., et al. 2018, MNRAS, 480,
2743Foster, A. R., Ji, L., Smith, R. K., & Brickhouse, N. S. 2012, ApJ, 756, 128Frail, D. A., Goss, W. M., & Whiteoak, J. B. Z. 1994, ApJ, 437, 781Gaia Collaboration (Brown, A. G. A., et al.) 2018, A&A, 616, A1Green, D. A. 2019, JApA, 40, 36Green, D. A., & Stephenson, F. R. 2017, Handbook of Supernovae, eds. A. W.
Alsabti, & P. Murdin (Berlin: Springer), 179Gritschneder, M., Lin, D. N. C., Murray, S. D., Yin, Q. Z., & Gong, M. N. 2012,
ApJ, 745, 22Halloin, H. 2009, |spimodfit| Explanatory Guide and Users Manual, version 2.9
edn. (Garching: Max Planck Institut für extraterrestrische Physik)Hancock, P. J., Trott, C. M., & Hurley-Walker, N. 2018, PASA, 35, e011Harris, C. R., Millman, K. J., van der Walt, S. J., et al. 2020, Nature, 585, 357Hartmann, D. H., Predehl, P., Greiner, J., et al. 1997, Nucl. Phys. A, 621, 83Haslam, C. G. T., Salter, C. J., Stoffel, H., & Wilson, W. E. 1982, A&AS, 47, 1Hermansen, K., Couch, S. M., Roberts, L. F., Schatz, H., & Warren, M. L. 2020,
ApJ, 901, 77Hindson, L., Johnston-Hollitt, M., Hurley-Walker, N., et al. 2016, PASA, 33, e020Hunter, J. D. 2007, Comput. Sci. Eng., 9, 90Hurley-Walker, N., & Hancock, P. J. 2018, Astron. Comput., 25, 94Hurley-Walker, N., Callingham, J. R., Hancock, P. J., et al. 2017, MNRAS, 464,
1146
Hurley-Walker, N., Hancock, P. J., Franzen, T. M. O., et al. 2019a, PASA, 36,e047
Hurley-Walker, N., Filipovic, M. D., Gaensler, B. M., et al. 2019b, PASA, 36,e045
Hurley-Walker, N., Gaensler, B. M., Leahy, D. A., et al. 2019c, PASA, 36, e048Joye, W. A., & Mandel, E. 2003, ASP Conf. Ser., 295, 489Keane, E. F., & Kramer, M. 2008, MNRAS, 391, 2009Kochanek, C. S., Beacom, J. F., Kistler, M. D., et al. 2008, ApJ, 684, 1336Kothes, R., Reich, P., Foster, T. J., & Reich, W. 2017, A&A, 597, A116Leahy, D. A., & Williams, J. E. 2017, AJ, 153, 239Limongi, M., & Chieffi, A. 2018, ApJS, 237, 13Maeda, K., Röpke, F. K., Fink, M., et al. 2010, ApJ, 712, 624Magkotsios, G., Timmes, F. X., Hungerford, A. L., et al. 2010, ApJS, 191, 66Manchester, R. N., Hobbs, G. B., Teoh, A., & Hobbs, M. 2005, AJ, 129,
1993Meidinger, N., Andritschke, R., Bornemann, W., et al. 2014, SPIE Conf. Se.,
9144, 91441WMeyers, B. W., Hurley-Walker, N., Hancock, P. J., et al. 2017, PASA, 34, e013Moll, R., & Woosley, S. E. 2013, ApJ, 774, 137Nagataki, S., Shimizu, T. M., & Sato, K. 1998, ApJ, 495, 413Offringa, A. R., & Smirnov, O. 2017, MNRAS, 471, 301Offringa, A. R., McKinley, B., Hurley-Walker, N., et al. 2014, MNRAS, 444, 606Offringa, A. R., Wayth, R. B., Hurley-Walker, N., et al. 2015, PASA, 32, e008Offringa, A. R., Trott, C. M., Hurley-Walker, N., et al. 2016, MNRAS, 458, 1057Oliphant, T. E. 2007, Comput. Sci. Eng., 9, 10Pavlinsky, M., Levin, V., Akimov, V., et al. 2018, SPIE Conf. Ser., 10699,
106991YPerets, H. B., Gal-Yam, A., Mazzali, P. A., et al. 2010, Nature, 465, 322Pfeffermann, E., & Aschenbach, B. 1996, Röntgenstrahlung from the Universe,
eds. H. U. Zimmermann, J. Trümper, & H. Yorke, 267Pfeffermann, E., Briel, U. G., & Freyberg, M. J. 2003, Nucl. Instrum. Methods
Phys. Res. A, 515, 65Predehl, P., Sunyaev, R., Becker, W., et al. 2020, Nature, 588, 227Predehl, P., Andritschke, R., Arefiev, V., et al. 2021, A&A, 647, A1
(eROSITA SI)Remazeilles, M., Dickinson, C., Banday, A. J., Bigot-Sazy, M. A., & Ghosh, T.
2015, MNRAS, 451, 4311Reynolds, S. P., Borkowski, K. J., Green, D. A., et al. 2008, ApJ, 680, L41Sault, R. J., Teuben, P. J., & Wright, M. C. H. 1995, ASP Conf. Ser., 77, 433Seitenzahl, I. R., Ciaraldi-Schoolmann, F., Röpke, F. K., et al. 2013, MNRAS,
429, 1156Siegert, T., Diehl, R., Weinberger, C., et al. 2019, A&A, 626, A73Sokolowski, M., Colegate, T., Sutinjo, A. T., et al. 2017, PASA, 34, e062Stephenson, F. R. 2017, Historical Records of Supernovae, eds. A. W. Alsabti, &
P. Murdin (Berlin: Springer), 49Strong, A. W., Diehl, R., Halloin, H., et al. 2005, A&A, 444, 495Strüder, L., Briel, U., Dennerl, K., et al. 2001, A&A, 365, L18Su, H., Macquart, J. P., Hurley-Walker, N., et al. 2018, MNRAS, 479, 4041Taylor, M. B. 2005, ASP Conf. Ser., 347, 29Taylor, J. H., Manchester, R. N., & Lyne, A. G. 1993, ApJS, 88, 529Timmes, F. X., Woosley, S. E., Hartmann, D. H., & Hoffman, R. D. 1996, ApJ,
464, 332Tingay, S. J., Goeke, R., Bowman, J. D., et al. 2013, PASA, 30, 7Vedrenne, G., Roques, J.-P., Schönfelder, V., et al. 2003, A&A, 411, L63Voges, W., Aschenbach, B., Boller, T., et al. 1999, A&A, 349, 389Waldman, R., Sauer, D., Livne, E., et al. 2011, ApJ, 738, 21Wanajo, S., Müller, B., Janka, H.-T., & Heger, A. 2018, ApJ, 852, 40Wayth, R. B., Lenc, E., Bell, M. E., et al. 2015, PASA, 32, e025Wayth, R. B., Tingay, S. J., Trott, C. M., et al. 2018, PASA, 35, e033Weinberger, C., Diehl, R., Pleintinger, M. M. M., Siegert, T., & Greiner, J. 2020,
A&A, 638, A83Wilms, J., Allen, A., & McCray, R. 2000, ApJ, 542, 914Winkler, C., Courvoisier, T. J.-L., Di Cocco, G., et al. 2003, A&A, 411, L1Woosley, S. E., & Kasen, D. 2011, ApJ, 734, 38Woosley, S. E., Arnett, W. D., & Clayton, D. D. 1973, ApJS, 26, 231Zimmermann, H. U., Becker, W., Belloni, T., et al. 1994, EXSAS User’s Guide
A30, page 12 of 12