holcim_2009
TRANSCRIPT

Holcim is a worldwide leading producer of cement and aggregates.Further activities include the provision of ready-mix concreteand asphalt as well as other services. The Group works in around70 countries and employs some 80,000 people.
Annual Report 2009 Holcim Ltd
Strength. Performance. Passion.
An
nu
alR
epo
rt2
00
9H
olc
imLt
d

Annual Report 2009 Holcim Ltd
Strength. Performance. Passion.


Holcim is more globally spread than any other building
materials group and with around 2,000 locations
throughout the world has a large footprint. The
consistently realized strategy of geographic diver-
sification strengthens the Group during difficult
economic times.
Founded in Switzerland in 1912, Holcim is committed
to setting global industry standards not only in pro-
duction and distribution but also in environmental
and social responsibility. Local Group companies focus
on optimum customer service, which includes innova-
tive product-specific solutions.
Holcim had been confirmed as a member of the Dow
Jones Sustainability World Index (DJSI) for the seventh
year in succession. This means that it is recognized
as one of the companies with a strong commitment
to sustainability in our industry. Holcim also remains
listed in the FTSE4Good sustainability index.
Holcim is one of the world’s leading producers of cement
and aggregates. The Group also supplies ready-mix
concrete, concrete products, asphalt and a range of services.
Holcim operates in around 70 countries and employs some
80,000 people.

Key figures Group Holcim
2009 2008 ±% ±%
like-for-like
Annual cement production capacity million t 202.9 194.4 +4.4 +3.7
Sales of cement million t 131.9 143.4 –8.0 –6.8
Sales of mineral components million t 3.5 4.8 –27.1 –31.3
Sales of aggregates million t 143.4 167.7 –14.5 –19.6
Sales of ready-mix concrete million m3 41.8 48.5 –13.8 –17.5
Sales of asphalt million t 11.0 13.5 –18.5 –18.5
Net sales million CHF 21,132 25,157 –16.0 –10.0
Operating EBITDA million CHF 4,630 5,333 –13.2 –5.1
Operating EBITDA margin % 21.9 21.2
EBITDA million CHF 5,229 5,708 –8.4
Operating profit million CHF 2,781 3,360 –17.2 –7.3
Operating profit margin % 13.2 13.4
Net income million CHF 1,958 2,226 –12.0 –5.8
Net income margin % 9.3 8.8
Net income – shareholders of Holcim Ltd million CHF 1,471 1,782 –17.5 –11.2
Cash flow from operating activities million CHF 3,888 3,703 +5.0 +12.0
Cash flow margin % 18.4 14.7
Net financial debt million CHF 13,833 15,047 –8.1 –7.1
Funds from operations1/net financial debt % 27.6 28.0
Total shareholders’ equity million CHF 22,044 17,974 +22.6
Gearing2 % 62.8 83.7
Personnel 31.12. 81,498 86,713 –6.0 –9.9
Basic earnings per share3 CHF 4.93 6.27 –21.4
Fully diluted earnings per share3 CHF 4.93 6.26 –21.2
Total dividend million CHF 4804 594 –19.2
Dividend per share CHF 1.504 2.25 –33.3
Principal key figures in USD (illustrative)5
Net sales million USD 19,387 23,294 –16.8
Operating EBITDA million USD 4,248 4,938 –14.0
Operating profit million USD 2,551 3,111 –18.0
Net income – shareholders of Holcim Ltd million USD 1,350 1,650 –18.2
Cash flow from operating activities million USD 3,567 3,429 +4.0
Net financial debt million USD 13,430 14,195 –5.4
Total shareholders’ equity million USD 21,402 16,957 +26.2
Basic earnings per share3 USD 4.52 5.81 –22.2
Principal key figures in EUR (illustrative)5
Net sales million EUR 13,995 15,822 –11.5
Operating EBITDA million EUR 3,066 3,354 –8.6
Operating profit million EUR 1,842 2,113 –12.8
Net income – shareholders of Holcim Ltd million EUR 974 1,121 –13.1
Cash flow from operating activities million EUR 2,575 2,329 +10.6
Net financial debt million EUR 9,284 10,099 –8.1
Total shareholders’ equity million EUR 14,795 12,063 +22.6
Basic earnings per share3 EUR 3.26 3.94 –17.3
1 Net income plusdepreciation,amortization andimpairment.
2 Net financial debtdivided by totalshareholders’equity.
3 EPS calculationbased on netincome attribut-able to share-holders of HolcimLtd weightedby the averagenumber of shares.Based on IAS 33,the weightedaverage number ofshares outstandingwas retrospectivelyincreased by 5 per-cent to reflect the1:20 ratio of thestock dividend andby an additional3.6 percent toreflect the discountfor existing share-holders in therights issue for allperiods presented.
4 Proposed by theBoard of Directors.
5 Income statementfigures translatedat average rate;balance sheetfigures at year-endrate.

Annual Review 2009 6
Shareholders’ Letter 10
Value-Driven Corporate Management
Key Success Factors 16
Organization and Management 25
Innovation 30
Capital Market Information 34
Sustainable Development
Environmental Commitment and Social Responsibility 44
Human Resources 48
Business Review
Group Region Europe 54
Group Region North America 60
Group Region Latin America 66
Group Region Africa Middle East 72
Group Region Asia Pacific 76
Corporate Governance 80
Remuneration Report 87
Financial Information
MD & A 104
Consolidated Financial Statements 113
Key Management Compensation 173
Company Data 185
Holding Company Results 192
5-Year-Review 201
Contents
Holcim LtdCorporate CommunicationsRoland WalkerPhone +41 58 858 87 10Fax +41 58 858 87 [email protected]
Holcim LtdInvestor RelationsBernhard A. FuchsPhone +41 58 858 87 87Fax +41 58 858 80 [email protected]
The German version is binding.

6
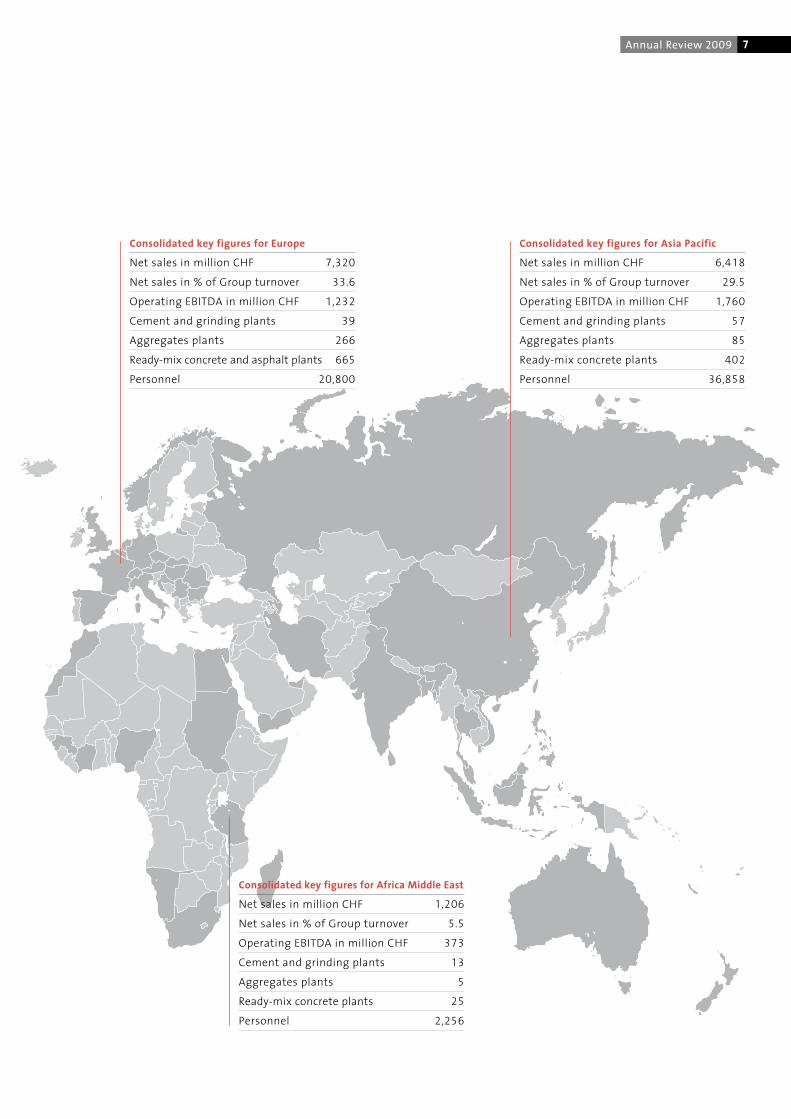
Consolidated key figures for North America
Net sales in million CHF 3,480
Net sales in % of Group turnover 16.0
Operating EBITDA in million CHF 400
Cement and grinding plants 19
Aggregates plants 105
Ready-mix concrete and asphalt plants 245
Personnel 8,016
Consolidated key figures for Latin America
Net sales in million CHF 3,348
Net sales in % of Group turnover 15.4
Operating EBITDA in million CHF 1,076
Cement and grinding plants 26
Aggregates plants 24
Ready-mix concrete plants 234
Personnel 12,626
Holcim responded to the adverse economic environment
with rigorous cost management. The acquisition in Australia
will strengthen the Group.
7Annual Review 2009
Consolidated key figures for Europe
Net sales in million CHF 7,320
Net sales in % of Group turnover 33.6
Operating EBITDA in million CHF 1,232
Cement and grinding plants 39
Aggregates plants 266
Ready-mix concrete and asphalt plants 665
Personnel 20,800
Consolidated key figures for Asia Pacific
Net sales in million CHF 6,418
Net sales in % of Group turnover 29.5
Operating EBITDA in million CHF 1,760
Cement and grinding plants 57
Aggregates plants 85
Ready-mix concrete plants 402
Personnel 36,858
Consolidated key figures for Africa Middle East
Net sales in million CHF 1,206
Net sales in % of Group turnover 5.5
Operating EBITDA in million CHF 373
Cement and grinding plants 13
Aggregates plants 5
Ready-mix concrete plants 25
Personnel 2,256

8
Profile
Cement is manufactured through a large-scale, complex
and capital-intensive process. At the core of the produc-
tion process is a rotary kiln, in which limestone and clay
are heated to approximately 1,450 degrees Celsius.
The semifinished product, called clinker, is created by
sintering. In the cement mill, gypsum is added to the
clinker and the mixture is ground to a fine powder –
traditional Portland cement. Other high-grade materials
such as granulated blast furnace slag, fly ash, pozzolan
and limestone are added in order to modify the proper-
ties of the cement. Holcim offers customers a very
wide range of cements and also develops customized
solutions for special applications.
Developments
In 2009, sales of cement decreased by 8 percent to
131.9 million tonnes. Additionally, 3.5 million tonnes of
other mineral components were sold. The decline in
sales is primarily due to weak construction activity in
North America and Europe. In Latin America, sales
were also below the previous year’s level – mainly as
a result of the deconsolidation of Holcim Venezuela
and the sale of business activities in Panama and
the Caribbean. Group region Africa Middle East main-
tained sales on a like-for-like basis. Group region Asia
Pacific reported an increase in volumes thanks to solid
organic growth in India and additions to the scope of
consolidation.
Profile
Aggregates include crushed stone, gravel and sand.
The production process centers around quarrying,
preparing and sorting the raw material as well as
quality testing. Aggregates are mainly used in the
manufacturing of ready-mix concrete, concrete
products and asphalt as well as for road building
and railway track beds. The recycling of aggregates
from concrete material is an alternative that is
gaining importance at Holcim.
Developments
Deliveries of aggregates declined by 14.5 percent to
143.4 million tonnes. This segment also faced a strong
fall-off in demand, above all in Europe and North
America. Asia Pacific was the only Holcim Group region
to sell higher volumes. This positive development is
directly connected with the purchase of nationwide
active aggregates company Cemex Australia. It owns
around 80 aggregates plants and has raw material
reserves of more than 1 billion tonnes. Renamed
Holcim Australia, the company has been fully consoli-
dated since October 1, 2009.
Profile
Globally, concrete is the secondmost consumed com-
modity by volume after water. One cubic meter consists
of approximately 300 kilograms of cement, 150 liters of
water and 2 tonnes of aggregates. Concrete is a very envi-
ronmentally friendly energy-efficient buildingmaterial.
Asphalt is a bituminous constructionmaterial used pri-
marily for road paving. It consists mainly of aggregates
of differing grain size. Holcim’s service offering also
includes construction services and international trading.
Following the acquisition in Australia, this segment has
gained in significance. Holcim Australia operates around
250 ready-mix concrete plants as well as 16 plants pro-
ducing concrete pipes and other concrete products.
Developments
Sales of ready-mix concrete declined by 13.8 percent
to 41.8 million cubic meters. The severest drop was in
North America, followed by Europe. Project delays
also led to a decrease in deliveries in other Group
regions. However, deliveries were up in Group region
Asia Pacific on account of the first-time consolidation
of Holcim Australia. Asphalt sales decreased by
18.5 percent to 11 million tonnes.
Cement
Aggregates
Other construction materials and services

9
Consolidated key figures for cement in 2009
Production capacity cement in million t 202.9
Cement and grinding plants 154
Sales of cement in million t 131.9
Net sales1 in million CHF 13,808
Operating EBITDA1 in million CHF 3,924
Personnel 50,3351 Includes all other cementitious materials.
Consolidated sales of cement 2009 per region1 enEurope 26.9 million t
North America 10.7 million t
Latin America 22.8 million t
Africa Middle East 8.8 million t
Asia Pacific 67.3 million t1 Intra-region sales – 4.6 million t
Consolidated key figures for aggregates in 2009
Aggregates plants 485
Sales of aggregates in million t 143.4
Net sales in million CHF 2,136
Operating EBITDA in million CHF 421
Personnel 6,850
Consolidated key figures
for other construction materials and services in 2009
Ready-mix concrete plants 1,457
Asphalt plants 114
Sales of ready-mix concrete in million m3 41.8
Sales of asphalt in million t 11.0
Net sales in million CHF 7,642
Operating EBITDA in million CHF 285
Personnel 23,725
Consolidated sales of aggregates 2009 per region
Europe 78.4 million t
North America 40.2 million t
Latin America 11.8 million t
Africa Middle East 2.6 million t
Asia Pacific 10.4 million t
Annual Review 2009
Sales of cement
Million t
2006 2008 200920072005
160
140
120
100
80
60
40
20
0
Sales of aggregates
Million t
2006 2008 200920072005
200
180
160
140
120
100
80
60
40
20
0
Sales of ready-mix concrete
Million m3
2006 2008 200920072005
50
40
30
20
10
0
Holcim improved its efficiency in a difficult environment.
Extensive cost-cutting measures and good levels of business
in most emerging markets made a significant contribution
to its success. The second half of 2009 saw operating
margins exceed the previous year’s figures in all segments.
Dear Shareholder
Recessionary environment in Europe and North America
In economic terms, 2009 will be remembered as a year of crisis. The construction industry suffered a significant
slump, particularly in Europe and North America. The situation was especially acute in the US, the UK and Spain, but
the construction sector also underwent a severe recession in Eastern and Southeastern Europe as well as Russia.
Better position in the growth markets
Asia started out in a better position, as did much of Latin America and Africa. Led by India and China,many of
the countries remained on a growth trajectory. This proved beneficial for Holcim, as the Group has an emerging
markets presence like no other international producer of building materials.
Robust cost management makes up for falling volumes
Volumes fell once again across all segments. In some cases, prices too came under greater pressure. Holcim
nevertheless generated operating EBITDA of CHF 4.6 billion on consolidated net sales of CHF 21.1 billion.
This was only possible because Holcim put the brakes on costs at the right time. The goal of streamlining processes
and structures as well as lowering fixed costs by at least CHF 600 million was significantly exceeded, reaching
like-for-like CHF 857 million. This demonstrates the extent to which the cost-cutting measures were systematically
implemented. These measures obviously applied to the headquarters in Switzerland too. A highly cautious
approach was taken toward maintenance investment; only investments in efficiency improvements that would
pay off very quickly were approved.
The increasing impact of the cost-cutting measures is reflected in the organic growth in operating EBITDA:
still strongly negative in the first half of 2009, it improved significantly in the second part of the year.
The steepest fall in the Group’s operating EBITDA occurred in Europe, followed by North America. Latin America
held up well. If we factor out the deconsolidations due to the nationalization in Venezuela, the region continued to
grow – despite some setbacks in Mexico and Central America. Group region Africa Middle East also performed
slightly better in year-on-year terms. In Asia Pacific, operating EBITDA showed a considerable increase. This positive
result was due in particular to a strong performance by ACC and Ambuja Cements in India, but also to the perfor-
mance in the Philippines and Indonesia as well as the new consolidations in Australia.
10
11Shareholders’ Letter
Strong liquidity, lower net debt, balance sheet further strengthened
Amid the somewhat unclear situation that prevailed at the start of 2009, a high priority was given to securing
liquidity as well as refinancing and extending the term of existing debt. A series of capital market transactions and
a capital increase raised a combined CHF 7.8 billion, thus successfully covering all the financing needs. Encourag-
ingly, cash flow from operating activities showed an above-average increase. Net financial debt was reduced by
CHF 1.2 billion despite ongoing capacity expansion and equity-financed acquisition, thus further strengthening
liquidity and the balance sheet. This was only possible thanks to the rigorous cost and cash management.
Plant closures in all product segments
Holcim reacted swiftly in the second half of 2008, when a fall in demand became apparent in a series of markets.
Far-reaching measures were taken in the cement sector. Plants in Europe and North America in particular were
shut down permanently or mothballed. All in all, 23 kiln lines with a production capacity of some 10 million tonnes
were closed. More than 100 aggregates and ready-mix concrete plants were also closed temporarily. This was
accompanied by substantial job losses of 6 percent per the end of 2009; these were conducted in such a way as
to minimize social impact.
Capacity expansion and acquisition create new potential
The Group’s solid financial position enabled the 2009–2012 capacity expansion program targeted at strategically
important areas to be continued, apart from some exceptions. The plant expansions and new facilities in the
cement sector were concentrated on growth markets, in particular the Indian subcontinent.
The new Ste. Genevieve cement plant in the US state of Missouri,which had been under construction since 2005,
deserves a particular mention.The plant was commissioned in July, as planned. Situated right on theMississippi and
equippedwith its own port facility, the plant – which has a capacity of 4million tonnes – is the largest andmost modern
in the US. Built to state-of-the-art technological and ecological standards, it improves energy efficiency by around
40 percent compared with the US sites that have been closed.The plant boosts Holcim’s market presence throughout
the river system of theMidwest, right down to the Gulf of Mexico.
The successful acquisition of Cemex Australia – now Holcim Australia – is a significant achievement. The transaction
also included the increase in the shareholding in Cement Australia from 50 to 75 percent. Both Group companies
have been fully consolidated since October 2009. This means Holcim can now offer not only cement but also aggre-
gates, ready-mix concrete and concrete elements in a strategically important, mature market.
The planned capital increase at Huaxin Cement in China, which is aimed at financing further growth, has not yet
been completed.
No cutting corners when it comes to sustainable development
Sustainability is an integral part of the Group strategy. Even in difficult times, Holcim takes its environmental
and social responsibilities as seriously as before. Programs to strengthen the safety culture across the Group were
continued without exception. Although impressive progress was made on this front, target has not yet been
achieved as unfortunately 2009 also saw the occurrence of accidents which had fatal consequences. The Board
of Directors and Executive Committee are therefore doing everything in their power to achieve the objective of
worldwide comprehensive workplace safety.

12
In partnership with the International Union for Conservation of Nature (IUCN), the basis was laid for a comprehen-
sive management system in the biodiversity field.
With a view to reducing CO2, Holcim is acting on a number of different fronts. The focus of its attention is on
reducing its own emissions. In 2009, CO2 emissions per tonne of cement were more than 20 percent lower than
in the reference year of 1990. The corresponding target was therefore achieved earlier than planned.
The Holcim Foundation for Sustainable Construction successfully concluded the second global competition cycle
for sustainable building projects. In 2010, the third international Holcim Forum will mark the start of the next
competition cycle. Around 300 experts from across the world will meet in Mexico City for three days to discuss
how building activities can be brought better into line with sustainability principles.
Holcim was recognized for the work it has done to promote sustainability: the Group once again received
the “SAM Gold Class” accolade from the Sustainable Asset Management Group (SAM) in cooperation with
PricewaterhouseCoopers.
Innovation drive to ensure new products and services
The development of new products and services is of high priority. The rapid, application-driven dissemination of
existing expertise and new findings is being heavily encouraged, while experiences gained in the market place
are being systematically incorporated into research. This networking, as well as close cooperation with leading
universities and research institutes, has helped accelerate the pace of innovation. This enabled Holcim to gain
new competitive advantages in the year under review; it paid off, for instance, in terms of the Group’s successful
bidding for end-to-end solutions at major construction sites.
A word of thanks for the trust placed in us
The fact that Holcim performed well in the difficult year of 2009 is not least due to its loyal and valued customers
as well as its partners across the globe.We would like to take this opportunity to thank them for the trust they
have placed in us. This year, as always, the Group will be fully committed to supplying the market with high-value
products and services.
A very special word of thanks goes to our employees. For many,market pressures and future uncertainties have not
made their work any easier. It is the motivation of our staff at all levels, together with their willingness to address
change in a constructive manner and their innovative skills, that lies behind the success of the Group.
Proposed dividend and non-binding advisory vote on the remuneration report
Holcim is showing its respect for its shareholders in two different, concrete ways: first, as in previous years, the
Board of Directors will propose at the annual general meeting that one-third of the net income attributable to
shareholders of Holcim Ltd of CHF 1.5 billion be distributed to the company’s shareholders. This will give a cash
dividend of CHF 1.50 per registered share.
Also at this year’s annual general meeting, the shareholders will be consulted for the first time on the Board of
Directors’ remuneration report. Holcim firmly believes that its compensation system is competitive and its
managers are motivated by a proper set of objectives, but also that the system stands up to public scrutiny.

13Shareholders’ Letter
Outlook for 2010
It is unclear how the building materials markets will perform in the current financial year. Uncertainty is at a high
level, especially with regard to developments in Europe and North America.Much depends on whether the stimulus
programs designed to expand infrastructure will indeed be implemented as proposed. Any revival in construction
activity across a broad front will also be contingent upon stimuli from residential and commercial construction.
Many emerging markets start off from a better position. In particular, Holcim’s Group region Asia Pacific – also
thanks to the acquisition in Australia – is likely to continue growing. Group regions Latin America and Africa Middle
East are also likely to experience a stable business performance.
Despite their confidence in the Group’s strength and solid positions in important markets, the Board of Directors
and Executive Committee refrain from communicating any detailed forecasts. The cost advantages gained in 2009
will be retained, and in 2010 the Group will continue to do whatever is required to strengthen the efficiency of its
processes and competitiveness. Holcim will therefore start the next upturn from a stronger position and will be
able to get back on track toward achieving its long-term growth targets.
Rolf Soiron Markus Akermann
Chairman of the Board of Directors Chief Executive Officer
March 3, 2010

14 Holcim Awards for Sustainable Construction

15Introduction
Every three years, the Holcim Foundation
for Sustainable Construction seeks innova-
tive building projects around the world –
and acknowledges the best of them
with Holcim Awards. This Annual Report
presents one Award-winning project from
each Group region.
In 2009, an international jury led by
renowned Indian architect Charles Correa
identified the winners of the main prizes.
The Global Holcim Awards Gold was con-
ferred for a plan to restore a river and
neighboring urban district in Morocco
(pictured above: huge media interest at
the hand-over ceremony of the Global
Holcim Awards Gold 2009 in Fez). A new
university campus in Vietnam won Silver,
a concept for rural community develop-
ment in China won Bronze, and the
design of a shelter for day laborers in
the USA won the “Innovation” prize.
The jury considers these projects the
best of some 5,000 competition entries
from 121 countries.
Higher quality of life – now and in the future
Creating a high-profile platform for
sustainable construction is one of the
main objectives of the Holcim Founda-
tion which conducts the competition.
Through it, the Group seeks to promote
the use of building materials in a way
that is not only economical but socially
and environmentally responsible. The
Foundation seeks and supports building
projects that combine sustainability with
outstanding architectural design and
thereby enhance quality of life today and
tomorrow. It also supports worldwide
technical exchange among building pro-
fessionals and contributes to discourse
in politics and society.
Competition as multiplier
Sustainable construction is a complex and
challenging endeavor. The needs range
from developing better materials to new
technology for technical systems and
innovative concepts of city planning.
During recent years, enormous advance-
ments in every field of construction have
been achieved around the world.
The Holcim Foundation fosters worldwidediscourse on sustainable construction throughpublications and events. The 220-page book“Second Holcim Awards” presents all projectsthat earned acknowledgment in the secondcompetition cycle.
Promoting sustainable construction
worldwide

16 Value-Driven Corporate Management
Clear strategy proves effective even in difficult times
The Group’s strategy is based on three pillars: concen-
trating on the core business, geographical diversifica-
tion and balancing business responsibility between
local and global leadership. This formula holds good
even during difficult economic times. High priority is
also given to rigorous cost management and a strong
balance sheet.
Global presence with focus on growth markets
Holcim is a globally active company. The Group oper-
ates in around 70 countries on all continents, employs
a workforce of some 80,000 and has production facili-
ties at around 2,000 locations. This broad-based pres-
ence helps stabilize earnings by evening out cyclical
fluctuations in individual markets more effectively.
Our sound revenue streams from Asia and Latin America
confirm that this compensatory effect operates well
even during recessionary phases.With the acquisition
in Australia, Holcim has once again succeeded in ex-
panding its geographical presence.
Key success factors
Holcim has held its own in a difficult economic environment,
gaining strength. This means that the Group will be among
the winners in the next upturn.
In 2009, the Group companies in the emerging mar-
kets, i.e. in Eastern and Southeastern Europe, Latin
America, Africa, the Middle East and Asia, accounted
for 52.4 percent of Group net sales.
Net sales per region 2009 2008
Million CHF
Europe 7,320 33.6% 10,043 38.3%
North America 3,480 16.0% 4,527 17.3%
Latin America 3,348 15.4% 4,170 15.9%
Africa Middle East 1,206 5.5% 1,354 5.2%
Asia Pacific 6,418 29.5% 6,109 23.3%
2005 2006 2007 2008
Net sales mature versus emerging markets
100%
90%
80%
70%
60%
50%
40%
30%
20%
10%
0%
Emerging markets
Mature markets
41.1% 45.7% 48.3%
58.9% 54.3% 51.7%
50.8%
49.2%
52.4%
47.6%2009

17Key Success Factors
Cement and aggregates are the core business
Holcim is one of the world’s leading building materials
groups. Our success over decades is founded on a
clear product strategy. At its heart are the production
and distribution of cement and aggregates (crushed
stone, gravel and sand) – key basic materials for the
construction industry. Our investment activities and
value creation focus on processing natural resources.
This is by its nature highly capital-intensive and ties
up assets over the long term.
However, Holcim also produces ready-mix concrete,
concrete elements and concrete products as well as
asphalt, albeit mainly in mature markets and major
conurbations. Alongside product-specific advice, its
services also include innovative sales concepts and
system solutions for major projects.
Madrid-based Holcim Trading occupies a leading mar-
ket position in the international trading in cement,
clinker, mineral components and fuels and helps
Group companies buy and sell such products outside
their market areas.
Extracting raw materials, operating cement plants and
distributing building materials to local or regional
markets call for a strong presence in the respective
environment and an awareness of corporate responsi-
bility this entails.
Cement and building materials are a cyclical business
and in 2009, this was reflected in a sharp decline in
demand which was most pronounced in the mature
markets. Over the longer term, though, global popula-
tion growth and rising expectations will lead to
growth across the board. Many countries, particularly
in the emerging markets, still have major quantitative
and qualitative deficits in their infrastructure and
housing sectors. In future, Holcim stands to benefit
from this in all segments.
Central pillars of value creation
Creating added value is Holcim’s paramount objective, an objectivethat is based on the three strategic pillars and determines guide-lines in the functional sectors. The most important foundation onwhich everything rests is a workforce that gives its best on a dailybasis.
Creation of value
Product focusGeographicdiversification
Local managementGlobal standards
Goal
Mindsets
Base People
Sustainableenviron-mentalperformance
Better costmanage-ment
Permanentmarketinginnovation
Humanresourcesexcellence
Corporatesocialrespon-sibility
Strategy
© Holcim Ltd

18 Value-Driven Corporate Management
Holcim increases efficiency along the value chain
The recession in North America and Europe and the
decline in growth in several emerging markets already
prompted Holcim to launch an extensive cost-cutting
program in the second half of 2008. During the year
under review, additional measures were taken in criti-
cal markets along the value chain.
Major corrections were undertaken in the cement seg-
ment, where capacity was reduced by some 10 million
tonnes through permanent and temporary plant clo-
sures. In other segments too, production was reduced
to match lower demand. In total, more than 100 aggre-
gates and ready-mix concrete plants were mothballed.
The cost-cutting measures also extended to sales and
administration, including corporate staff units.
At the beginning of 2009, Holcim was already aiming
to substantially reduce its fixed costs for fiscal 2009 as
a whole and the savings actually achieved came to an
impressive CHF 857 million on a like-for-like basis.
Cost cuts in all Group regions
Whereas the previous year’s cost reductions in Europe
focused on the two difficult building materials mar-
kets Spain and the UK, the year under review saw
other countries, mainly in Eastern Europe (including
Russia), come under economic pressure. Holcim re-
sponded swiftly in the cement segment, permanently
closing the Torredonjimeno plant in Spain and moth-
balling the Lábatlan plant in Hungary. The Pleven plant
in Bulgaria now only operates as a grinding station.
Two old kilns at the Shurovo plant in Russia were
decommissioned. Until the new kiln line comes on
stream in the second half of 2010, this plant will
source the necessary quantities of clinker from its sis-
ter plant in Volsk. The network of ready-mix concrete
and asphalt plants was also streamlined, and quarries
were temporarily closed. Maintenance investment was
cut to a minimum. In addition, the marketing and
sales operations of HolcimWhite Ltd were integrated
into the two Group companies which produce white
cement in Slovakia and Russia.
The economic environment in the US remained very
difficult, and conditions in Canada’s construction mar-
kets were not easy either. The Group companies there-
fore continued implementing cost-cutting measures.
Having already announced the closure of the Dundee
and Clarksville plants in 2008, Holcim US also had to
mothball the Artesia and Mason City plants in 2009.
In North America, the cost-cutting package included
temporary plant closures in the areas of aggregates,
ready-mix concrete and asphalt.
In Latin America, the economy held up relatively well,
but cost-cutting measures were nonetheless required.
One kiln line in each of Mexico, El Salvador, Brazil and
Argentina was mothballed. In Chile, a rotary kiln line
was closed down. Operations in aggregates plants and
ready-mix concrete facilities in several Group markets
were also shut down temporarily. There were welcome
reliefs in energy costs thanks to a combination of
lower input costs and measures to optimize the fuel
mix, mainly by making greater use of petcoke. The
largely stable price environment also had a positive
impact.
The Group companies in Group region Africa Middle
East also implemented cost-cutting programs, despite
predominantly brisk demand for building materials
there.
As demand in Asia Pacific mostly remained sound, the
potential for savings was limited. In India in particular,
the building materials market continued to grow
dynamically leading to a high rate of plant utilization.
Demand was also brisk in the markets of Vietnam
and the Philippines. Thailand’s construction sector
experienced a slight uptrend, and the Saraburi plant’s
four big kiln lines were running at full capacity on the
strength of export orders.

19Key Success Factors
Economic situation necessitates substantial job losses
Declining demand and the ensuing restructuring
measures had an impact on the Group’s headcount.
Whereas at the end of 2008 the Group had 86,713 em-
ployees, by the end of 2009 the figure had decreased
to 81,498. The staff cuts were made in such a way as to
minimize the social impact.
Strategic expansion program continuing
in growth markets
From a longer term point of view, the Group is prima-
rily aiming to establish and grow cement capacity in
the emerging markets, where some 74 percent of pro-
duction capacity is currently located. Regardless of
short-term requirements, capacity there will need
to be increased by expanding existing plants and
building new facilities in line with the anticipated
trend in cement consumption.
The strategically important capacity expansion pro-
gram launched in 2008 continued with few exceptions.
The main focus of these projects is on the US, Asia,
Latin America, Russia and Azerbaijan.
In 2009, Holcim commissioned 9.8 million tonnes
of cement capacity Group-wide. This includes the
Ste. Genevieve plant in the US state of Missouri, which
opened in July and has an annual capacity of 4 million
tonnes of cement.With its own port and loading
facilities on the Mississippi, the factory is a model
facility in every respect and is highly energy-efficient.
Compared with the US plants shut down, the improve-
ment per tonne of cement equals around 40 percent.
As of the end of 2009, out of the total of 25.9 million
tonnes of capacity expansion originally embarked
upon, only 16 million tonnes were still under con-
struction. The new capacity meets the highest techno-
logical standards in terms of costs and environmental
efficiency. In many instances, it is being installed at
existing sites, where Group companies have robust
market positions and secured reserves of raw materials.
Change in personnel by Group region
2009 2008 ±%
Europe 20,800 23,557 –11.7
North America 8,016 9,825 –18.4
Latin America 12,626 13,548 –6.8
Africa Middle East 2,256 2,477 –8.9
Asia Pacific 36,858 36,196 +1.8
Corporate 942 1,110 –15.1
Total Group 81,498 86,713 –6.0
As expected, staff numbers declined sharply in
Group regions Europe and North America, which both
bore the brunt of the crisis. The Group’s headcount
remained comparatively stable in Group region Asia
Pacific, where the economy was strong.

Approved capacity expansion within the Group in million tonnes 2010 to 2012
Company 2010 2011 2012 Total
Alpha Cement (Russia) 2.1 2.1
Garadagh Cement (Azerbaijan) 1.7 1.7
Total Europe 2.1 1.7 3.8
Holcim Apasco (Mexico) 1.6 1.6
Holcim Colombia 0.7 0.7
Holcim Ecuador 1.8 1.8
Total Latin America 2.3 1.8 4.1
ACC (India) 2.1 2.1
Ambuja Cements (India) 6.0 6.0
Total Asia Pacific 8.1 8.1
Total Group 12.5 3.5 16.0
20 Value-Driven Corporate Management
In 2009, Huaxin Cement, Holcim’s associated company
in China, increased its cement capacity by 12 million
tonnes to over 50 million tonnes. Furthermore, with
the proceeds from an anticipated capital increase
and ongoing reinvestment, capacity will be further
increased.
Investments are also being made in aggregates
and concrete
As an economy becomes more mature, vertical inte-
gration becomes increasingly important for Holcim.
In this type of market, major infrastructure projects
and residential and commercial construction activity
raise demand for high-quality aggregates and ready-
mix concrete. At the same time, secured reserves of raw
materials are always of major strategic importance
because of the high degree of regulation.
Holcim therefore took the opportunity to move toward
vertical integration in Australia, a market with attrac-
tive future prospects. For AUD 2.02 billion (equivalent
to CHF 1.73 billion), the Group took over Cemex Australia,
which has around 80 aggregates plants and 1 billion
tonnes of raw material reserves, around 250 ready-mix
concrete facilities and 16 plants producing concrete
products. The transaction also included a 25 percent
interest in the Group company Cement Australia.
Cemex Australia, now renamed Holcim Australia,
has been fully consolidated since October 1, 2009.
The holding in Cement Australia, which has risen
to 75 percent, is now also fully consolidated.
Holcim is increasingly offering system solutions for
new construction projects. Large construction groups
opt more and more for efficient total solutions which
include sophisticated logistics, particularly in the
case of complex construction projects.
Concrete is an indispensable, environmentally friendly
building material
Concrete is an energy and CO2-efficient building
material which is used on a huge scale in construction
projects worldwide. It is the world’s second most
sought-after commodity after water. Modern infra-
structure would be inconceivable without concrete.
To meet customers’ high-quality requirements, Holcim
employs innovative, customer-focused solutions.
Our expertise is intended to help customers increase
their productivity and gain competitive advantages
through differentiated product offerings.
Holcim is committed to using building materials that
are more competitive and sustainable than other prod-
ucts. In the production of concrete, Holcim is therefore
stepping up its use of composite cements containing
special mineral components in addition to clinker and
gypsum. In recent years, the Group has seen a steady
increase in the proportion of overall sales of hydraulic
binders accounted for by these cements (end of 2009:
more than 70 percent).
21Key Success Factors
1 Excluding cash and cash equivalents.2 WACC before tax of 11.76 percent.3 Excluding the majority sale in South Africa.
Holcim Value Added (HVA)1
22 Value-Driven Corporate Management
Margin targets per segment
In 2006, Holcim defined specific operating EBITDA
margin targets for each segment. Various programs
designed to cut costs and increase efficiency have
been implemented in all areas of the company. How-
ever, the challenging economic situation in various
markets and the resulting decline in volumes means
there will be some delay in achieving the margins
targeted. Holcim nonetheless continues to aim for
further improvements in margins with a view to
exceeding the Group’s after-tax weighted average cost
of capital (WACC) of 8 percent on a sustainable basis.
This is also confirmed by the cost reductions and
progress achieved during the year under review.
In 2009, the cement margin was weighed down by up-
ward pressure on costs, changes in the scope of consol-
idation and the still relatively high cost of energy and
resources. However, the pressure on costs was coun-
tered somewhat by efficiency gains in the production
sector and price adjustments. On balance, the operating
EBITDA margin in the cement segment was at 28.4 per-
cent, up on the previous year’s figure of 27.3 percent.
In Group regions Latin America and Africa Middle East,
the margin target of 33 percent was exceeded. In the
case of aggregates, the operating EBITDA margin
increased to 19.7 percent (2008: 19.5). The margin
target of 27 percent was exceeded in Latin America.
The operating EBITDA margin of the other construction
materials and services segment declined to 3.7 percent
(2008: 4.3).
Operating
EBITDA margin Target 2009 2008
Cement 33% 28.4% 27.3%
Aggregates 27% 19.7% 19.5%
Other construction
materials and services 8% 3.7% 4.3%
Sustainable value creation as paramount objective
Holcim’s goal is to be the most attractive company in
the building materials industry. The Group’s appeal
also includes its return on invested capital, which
should exceed its after-tax weighted average cost of
capital (WACC) of 8 percent on a sustainable basis.
Measured according to Holcim Value Added (EBIT –
standard capital costs � invested capital), the Group
has, over many years, created substantial added value
above theWACC of 11.76 percent before taxes. Owing
to the difficult economic situation, the Group return
on invested capital (ROIC) declined to 9.1 percent in
2009. Measures were taken in all areas with a view
to restoring the desired rates of return as quickly as
possible.
HVA before taxes in million CHF ROIC before tax in %
1,200
1,000
800
600
400
200
02
–200
–400
–600
–800
–1,000
–1,200
24%
22%
20%
18%
16%
14%
12%
10%
8%
6%
4%
2%
0%
2005 2006 20073 2008 2009
14.2 14.3 14.6 10.2 9.1
23Key Success Factors
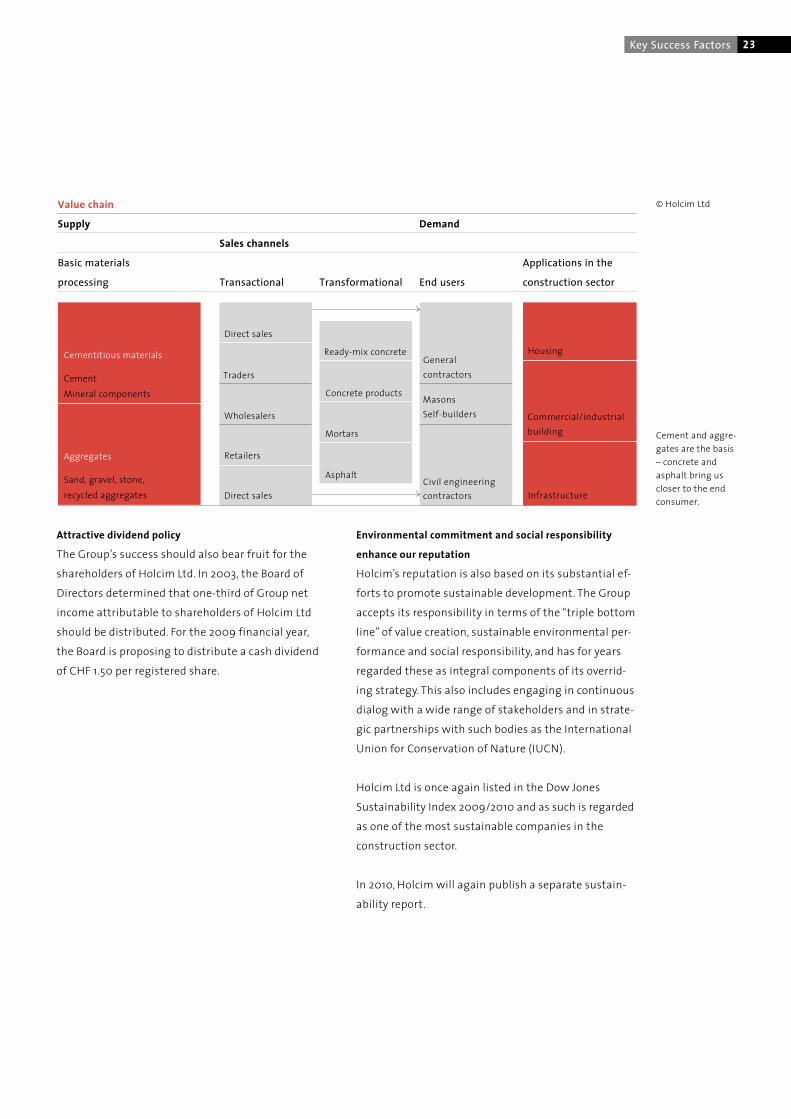
Cement and aggre-gates are the basis– concrete andasphalt bring uscloser to the endconsumer.
Cementitious materials
CementMineral components
Traders
Wholesalers
Retailers
Direct sales
Generalcontractors
MasonsSelf-builders
Civil engineeringcontractors
Aggregates
Sand, gravel, stone,recycled aggregates
Housing
Commercial/industrialbuilding
Infrastructure
© Holcim Ltd
Ready-mix concrete
Direct sales
Concrete products
Mortars
Asphalt
Attractive dividend policy
The Group’s success should also bear fruit for the
shareholders of Holcim Ltd. In 2003, the Board of
Directors determined that one-third of Group net
income attributable to shareholders of Holcim Ltd
should be distributed. For the 2009 financial year,
the Board is proposing to distribute a cash dividend
of CHF 1.50 per registered share.
Value chain
Supply Demand
Sales channels
Basic materials Applications in the
processing Transactional Transformational End users construction sector
Environmental commitment and social responsibility
enhance our reputation
Holcim’s reputation is also based on its substantial ef-
forts to promote sustainable development. The Group
accepts its responsibility in terms of the “triple bottom
line” of value creation, sustainable environmental per-
formance and social responsibility, and has for years
regarded these as integral components of its overrid-
ing strategy. This also includes engaging in continuous
dialog with a wide range of stakeholders and in strate-
gic partnerships with such bodies as the International
Union for Conservation of Nature (IUCN).
Holcim Ltd is once again listed in the Dow Jones
Sustainability Index 2009/2010 and as such is regarded
as one of the most sustainable companies in the
construction sector.
In 2010, Holcim will again publish a separate sustain-
ability report.
Globally active foundation for sustainable construction
Holcim wishes to take the issue of sustainability be-
yond the sphere of products, production and processes
over which it can exert a direct influence. Underpinning
this objective, it established the Holcim Foundation for
Sustainable Construction in 2003. The Foundation’s
task is to promote worldwide dialog on sustainable
construction between architects, planners, construction
engineers, investors and the public.
Since its establishment, the Foundation has cooper-
ated closely with the companies of the Holcim Group
and with leading technical universities, with a view
to promoting sustainable construction solutions in
the technological, environmental, socio-economic and
cultural context.
In the second competition cycle, which ended in 2009,
some 5,000 sustainable projects from 121 countries
were submitted.Within Group region Asia Pacific in
particular, the number of entries increased signifi-
cantly compared with the first cycle. The Foundation’s
wide range of activities, illustrated in this Annual
Report, is meeting with broad acceptance in specialist
circles.
The Foundation will begin its third three-year cycle by
holding another forum for architects, urban planners
and other interested groups at the Universidad
Iberoamericana (UIA) in Mexico City. Moreover, the
third cycle of five regional Holcim Awards competi-
tions for sustainable construction projects and visions
is to be launched on July 1, 2010.
24 Value-Driven Corporate Management
25Organization and Management
Efficient management and control
The aim of corporate governance, which defines the
management processes, the organization and moni-
toring of the highest corporate management levels
as well as business policy principles and internal and
external control mechanisms, is to ensure responsible
management and control of the company with the
focus on sustainable value creation. It is the precondi-
tion for the Group’s credibility and good reputation
and strengthens confidence among investors, busi-
ness partners, employees and the public at large.
The principles of corporate governance developed in
recent years are continuously being adjusted to
requirements. The internal control system (ICS) intro-
duced in 2007 and 2008 for the presentation of the
annual financial statements conforming with the
requirements of Art. 728a of the Swiss Code of Obli-
gations and Swiss Auditing Standard 890 continued
to prove itself in 2009.
The Group’s management and line responsibility is
structured by regions. A broad Code of Conduct ensures
that all employees know what rights and obligations
apply in the work environment.
Value creation in a competitive environment
The Code of Conduct defines Group-wide standards
of behavior expected of all staff and it underscores
our responsibility as entrepreneurs and employers.
The current Code of Conduct can be found on our
website under www.holcim.com. The Code of Con-
duct, which is binding on all Holcim Group companies
and their employees, was issued by the Board of
Directors and the Executive Committee in 2003.
It requires in particular compliance with the rules
of fair competition and explicitly prohibits any anti-
competitive conduct or abuse of dominant market
positions. Non-compliance will result in disciplinary
measures, which could go as far as termination of the
employment relationship. To ensure that the princi-
ples are firmly established in the Group, Holcim has
introduced a centrally coordinated training program.
In addition, the Group companies undergo regular
checks in this regard which are carried out by inde-
pendent lawyers. In 2009, all training and support
materials concerned with fair competition were
brought into line with the latest developments in
competition law. A new manual on the subject of
good commercial practices reflects current European
and US competition legislation.
Organization and management
Executive Committee
Markus Akermann
Chief Executive Officer
Urs Böhlen
Eastern & Southeastern Europe,
CIS/Caspian region
Tom Clough
Until June 30, 2010 responsible for
East Asia incl. Philippines, Oceania
and South and East Africa
Patrick Dolberg
Belgium, France, Netherlands,
Germany, Switzerland, Italy
Paul Hugentobler
South Asia & ASEAN excl. Philippines
Thomas Knöpfel
Latin America
Benoît-H. Koch
North America, UK, Norway,
Mediterranean incl. Iberian
Peninsula, International Trade
Theophil H. Schlatter
Chief Financial Officer
Ian Thackwray
As of January 1, 2010 member of
the Executive Committee; effective
July 1, 2010 responsible for East
Asia incl. Philippines, Oceania and
South and East Africa
Board of Directors
Rolf Soiron
Chairman, Chairman
of the Governance, Nomination &
Compensation Committee
Andreas von Planta
Deputy Chairman
Markus Akermann
Christine Binswanger
Erich Hunziker
Peter Küpfer
Chairman of the Audit Committee
Adrian Loader
H. Onno Ruding
Thomas Schmidheiny
Wolfgang Schürer
Dieter Spälti
Robert F. Spoerry
Secretary of the Board of Directors
Peter Doerr
Area Management
Bill Bolsover
Javier de Benito
Andreas Leu
Aidan Lynam (as of January 1, 2010)
Corporate Functional Managers
Bill Bolsover
Jacques Bourgon
Roland Köhler
Stefan Wolfensberger
Auditors
Ernst & Young Ltd
Management Structure
See organizational chart on page 29
Changes
See Corporate Governance page 80 ff.
The ExecutiveCommittee fromleft to right:Ian ThackwrayUrs BöhlenBenoît-H. KochThomas KnöpfelTheophil H. SchlatterPatrick DolbergMarkus AkermannTom CloughPaul Hugentobler
Status as atMarch 3, 2010
26 Value-Driven Corporate Management

27Organization and Management
Line and functional management responsibility
Holcim is a globally active group with some 80,000
employees on all continents.We manufacture and
distribute our core products cement and aggregates
in a large number of local markets, along with prod-
ucts and services based on these core products in the
ready-mix concrete, asphalt and concrete products
sectors.
The key to the Group’s success lies in the competence
of our local management teams. The operating units in
around 70 countries fall under the line responsibility
of individual Executive Committee members assisted
by Area Managers and Corporate Functional Managers.
In addition, each Executive Committee member has
functional responsibility for specific corporate areas
such as Cement Manufacturing, Commercial or Human
Resources.
If our Group companies are to strengthen their local
cost and market leadership, they need entrepreneur-
ial room for maneuver as well as support from the
Group in the form of specific know-how and prede-
fined parameters.We are convinced that success in
our business depends on striking a balance between
local power and autonomy on the one hand and the
right degree of support and control from Group head-
quarters on the other. A coherent program of basic
and continuing management training as well as sys-
tematic succession planning to develop candidates
with executive potential at both national company
and corporate level are factors which will strengthen
the Group on a lasting basis.
At the 2009 ordinary general meeting, Lord Norman
Fowler, who has been a member of the Board of Direc-
tors since 2006, retired from the Board on having
reached the prescribed age limit. The Board of Direc-
tors would like to thank him for his valuable service.
This fall, the Board of Directors elected Ian Thackwray,
CEO of Holcim Philippines since 2006, to serve on the
Executive Committee of Holcim Ltd from the begin-
ning of 2010. As of July 1, he will take over responsibil-
ity for East Asia including the Philippines, Oceania
and South and East Africa from Tom Clough, who will
be retiring on this date.
At the beginning of 2010, Gérard Letellier, Area
Manager for Bangladesh, Malaysia, Singapore and
Vietnam, took over as CEO of Holcim France. As a
result, he has stepped down from senior manage-
ment of Holcim Ltd.
Effective the same date, Aidan Lynam, CEO of Holcim
Vietnam since 2006, took over as the new Area
Manager responsible for the Group companies in
Bangladesh, Malaysia, Singapore, Sri Lanka and
Vietnam and was appointed to senior management
of Holcim Ltd.
Holcim’s hierarchical structures are flat and its divi-
sions of responsibility clearly defined – both at Group
level and in the individual Group companies. This
ensures that decisions are based on expert knowl-
edge and cost awareness and that new processes or
standards can be implemented without delay.
The Group’s managers, the regions and the countries
as well as the local sites are assisted by service cen-
ters at regional level and by central corporate staff
units at global level. Holcim has well structured man-
agement systems in place. Group companies are
given clear guidelines in all key areas of the business,
from technology and environmentally friendly pro-
duction to human resources and finance.

28 Value-Driven Corporate Management
Business Risk Management identifies risks
and opportunities
Business Risk Management supports the Executive
Committee and the management teams of the Group
companies in their strategic decisions. Business Risk
Management aims systematically to recognize major
risks – as well as opportunities – facing the company.
Potential risks are identified and evaluated at an early
stage. Countermeasures are then proposed and
implemented at the appropriate level. Risk manage-
ment looks at a wide range of different internal and
external risk types in the strategic, operating and
financial sectors.
In addition to the Group companies, the Executive
Committee and the Board of Directors are also
involved in the assessment process. The Group’s risk
profile is assessed from both top-down and bottom-
up angles. This not only entails identifying threats,
but also opportunities along the entire value chain.
The Executive Committee reports regularly to the
Board of Directors on important risk analysis findings
and provides updates on the measures taken (see also
pages 85 and 86).
Internal Audit as an important monitoring instrument
Internal Audit is an independent body which reports
directly to the Chairman of the Board of Directors
and submits regular reports to the Audit Committee.
Internal Audit does not confine itself to financial
audits, but also monitors compliance with external
and internal guidelines.
Particular attention is paid to the effectiveness
and efficiency of internal management and control
systems, including:
Examining the reliability and completeness
of financial and operational information;
Examining the systems for controlling compliance
with internal and external directives such as plans,
processes, laws and ordinances;
Examining whether business assets are secure.
Focus on joint objectives
To achieve the added value it is aiming for, Holcim
systematically measures performance and operates
systems to motivate management to perform to
consistently high standards.
Since 2003, a standardized, variable compensation
system has been in place for our most senior execu-
tives. As previously mentioned, salaries are calculated
not only on the basis of the Group’s objectives, but
also in light of the specific circumstances of the local
Group companies. A significant proportion of the
variable compensation is paid in the form of Holcim
shares which are locked in for a period of three to
five years. This system strengthens the focus on the
common target of a sustainable increase in the
Group’s performance and value.
Schlüsselfaktoren zum ErfolgOrganization and Management 29
Organizational chart
Strategy & RiskManagement,Communi-cations,InvestorRelations
Aggregates &ConstructionMaterials,SustainableDevelopment
CementManufacturing
Commercial,IT
HumanResources,Branding
Finance &Controlling
North AmericaUK, NorwayMediterranean3
InternationalTrade
BelgiumFranceNetherlandsGermanySwitzerlandItaly
Latin America South AsiaASEAN4
East Asia5
OceaniaSouth&East Africa
AndreasLeuArea Manager
AidanLynamArea Manager
BillBolsover,Javierde BenitoArea Manager
RolandKöhlerStrategy & RiskManagement
StefanWolfensbergerCommercialServices
JacquesBourgonCementManufacturingServices
BillBolsoverAggregates &ConstructionMaterialsServices
Legal &Compliance,OH&S
Benoît-H.Koch
PatrickDolberg
UrsBöhlen
ThomasKnöpfel
PaulHugentobler
Tom Clough/Ian Thackwray2
Theophil H.SchlatterCFO
MarkusAkermannCEO
Audit Committee Governance, Nomination &Compensation Committee
Internal Audit 1
Board of Directors Holcim Ltd
Regional Line Responsibility
Executive Committee
Eastern &SoutheasternEuropeCIS/Caspianregion
Procurement
1 Internal Audit reports to theChairman of the Board of Directors.
2 Tom Clough until June 30, 2010,Ian Thackwray as of July 1, 2010.
3 Including Iberian Peninsula.4 Excluding Philippines.5 Including Philippines.
Status as at March 3, 2010.
Area Managers
Functional Responsibility
Corporate Functional Managers

30 Value-Driven Corporate Management
More than ever, innovation is assuming great impor-
tance along the whole value chain. Holcim has long
systematically focused on building materials that
enhance each other and create attractive added value
for customers. To ensure that it is at the very forefront
of developments, Holcim gives a very high priority to
the development of new products and services. This
also applies to production processes: cost pressures,
coupled with the need to conserve scarce resources
and address climate protection issues, are compelling
the Group to make continuous improvements. At the
same time, Holcim attaches great importance to the
rapid dissemination of knowledge throughout the
Group.
Jointly strengthening innovation
Holcim continued to expand its innovative activities
during the year under review. The main focus of its
research and development work was on sustainability
and solutions offering added value.With eco-efficient
products and customer-specific solutions, Holcim is
positioning itself as an innovative supplier of con-
struction materials.
Throughout the Group, the emphasis is increasingly
on networking, sharing knowledge and experience,
and delivering innovation. Cooperation with external
partners such as customers, universities and suppliers
has also been further expanded. By intensifying inter-
nal and external teamwork, Holcim is able to mobilize
joint strengths and tap into innovative potential
more effectively. “Open Innovation” thus becomes a
collaborative achievement.
Holcim’s innovation is underscored by new sales concepts,
customer-specific system solutions primarily for major
projects, and continuous process optimization.
Knowledge transfer and exchange of experience
Innovation is promoted both at corporate level and at
the level of the individual Group companies. Central
research and development work focusing on the iden-
tification of fundamental principles complements
decentralized market-based innovative activities in
the production companies. The networking of these
activities and the exchange of knowledge has advan-
tages for all concerned.
Efficient Group-wide know-how transfer
The aim is to achieve a faster and more effective
Group-wide roll-out of innovations through sound
internal cooperation. In 2009, Holcim began imple-
menting a newly developed knowledge management
system (iShare). The key business knowledge con-
tained in the Group companies and corporate staff
units is captured on this platform and made available
in readily accessible form. The system currently al-
ready contains around 10,000 important documents
covering a very wide range of topics. The search sys-
tem allows iShare users to quickly filter out the infor-
mation relevant to them. In addition to the corporate
staff units, a dozen Group companies are already
connected: the aim is to transfer the know-how held
decentrally within the Group to the knowledge data-
base and have the exchange of information up and
running by the end of 2010.
Innovation
31Innovation
One of Holcim Romania’s cement plants encountered
a recurring technical problem. Via iShare, the techni-
cian in charge quickly discovered that a Holcim plant
in Mexico had been faced with the same difficulties
some time ago. Thanks to the help this source provided,
Holcim Romania was immediately able to remedy the
situation and avoid expensive repairs.
Holcim Vietnam has a rapidly expanding fleet of
trucks. It is imperative that these vehicles and their
drivers set an example in terms of safety. By keeping
its trucks spotless, the Group company also aims to
contribute to the image of a clean, environmentally
aware industry, which is why a special high-pressure
wash station was to be installed. Holcim Vietnam
quickly found all the necessary specifications via
iShare, saving themselves several weeks of work.
iShare is essential because it is difficult to keep
records of either documented knowledge or the know-
how of individual employees by traditional means.
This is where virtual knowledge communities or
iShare networks come in. Experts can exchange views
on a given topic and benefit from the knowledge of
colleagues. In the important area of alternative fuels
and raw materials, for example, the Group has an
impressive number of specialists with very specific
areas of expertise.
An internal competition was organized to promote
knowledge transfer in the area of near-to-market in-
novation. Successful examples of innovative products,
services and solutions were singled out and publicized
throughout the Group. This created incentives for
further market innovations and paved the way for the
successful multiplication and advancement of the
ideas at local level.
The forward-looking “Cirkelstad” project of Holcim
Netherlands is an example of a successful solution.
It breaks new ground in the field of sustainable
construction as sustainability becomes increasingly
important when it comes to awarding public contracts.
In cooperation with selected partners, the Group
company therefore offers a sustainable alternative for
urban development projects which involves reusing
most materials when existing buildings are demol-
ished. Holcim Netherlands reprocesses the materials
into recycled concrete aggregates for use in the new
building. Long-term unemployed have been trained
and deployed on various tasks. Emissions are reduced
by using local materials and switching to transporta-
tion via waterways.
In Costa Rica, recent years have seen a decline in tradi-
tional bricklaying practices using cement mortar and
concrete blocks, which are characterized by low pro-
ductivity and quality problems. Holcim Costa Rica has
developed “Integra”, a novel system of modular build-
ing blocks which revolutionizes traditional bricklaying.
This means that developers can reduce their wastage
of materials as well as increasing their productivity
and significantly speeding up the construction
process.
House builders in India often have no experience of
building and little specialist knowledge. ACC bridges
this gap with its “ACC Help” program offering nation-
wide technical support for house builders, marking
a first for the subcontinent. At information centers
and through advice provided directly on the building
site, they are given assistance in selecting and using
products and in quality control. In this way, ACC is
helping enable numerous people to realize their
dream of having a secure, durable home of their own.

In cooperation with selected Red Minetti channel
partners, Minetti in Argentina is also offering added-
value services in addition to high-grade cement.
A construction materials trader in Mendoza advises
his customers on the planning of house building
projects, on product selection and on financing.
Among the benefits he derives are improved logistics
and attractive purchasing terms on various products.
Innovation network
Holcim is stepping up its “Open Innovation” efforts
and continuing to expand its innovation network with
external partners. At Group level, Holcim cooperates
on various projects with universities such as the
Federal Institute of Technology Zurich (Switzerland),
the Ecole Polytechnique Fédérale de Lausanne
(Switzerland) and the Technical University of
Clausthal (Germany) as well as with suppliers on
research and development projects.
The Group companies also work closely with external
partners on innovative activities – whether those
partners be customers, engineers, planners or univer-
sities and research institutes.
Large-scale projects are becoming more important in
the emerging markets in particular and often require
high standards in terms of products and logistics as
well as calling for additional services. Holcim offers
its services here as a provider of all-in-one solutions.
Product-specific solutions are developed in close
cooperation with customers. Holcim enjoys a growing
reputation as an innovative partner for integrated
solutions.
Holcim Vietnam acts as just such a partner for made-
to-measure total solutions. In Ho Chi Minh City, the
BBBH consortium completed the 700-meter long
Phu-My suspension bridge in August 2009. The project
made heavy demands in terms of product properties
and punctual delivery. Holcim Vietnam supplied vari-
ous cements tailored to the specific requirements of
the individual structural components. The Vietnamese
Group company is also supplying high-strength con-
crete for the construction of the 185-meter high M&C
Tower in Ho Chi Minh City. The formula used was
specially developed for the purpose. In both cases,
Holcim Vietnam’s technical support team worked
closely with the customer throughout the project
from the planning phase to implementation.
A 128-megawatt hydroelectric power plant with a dam
wall that is 113 meters high and 270 meters wide is be-
ing built on the Pirris River in Costa Rica. The structure
will require more than 1 million cubic meters of roller
compacted concrete, and the application must fulfill
demanding requirements in terms of hydration heat.
Cement with a high resistance to harmful ground-
water is used for the 11-kilometer long tunnel. For
both applications, Holcim Costa Rica has developed
special grades of cement and concrete in close cooper-
ation with the customer. The Holcim Technological
Center monitors the project from product development
through to the on-site training of specialists and
strict quality control.
In cooperation with leading New Zealand construc-
tion company Mainzeal, Holcim New Zealand devel-
oped a special type of concrete based on recycled
glass which is used as a substitute for natural stone
aggregates. The glass concrete is being used in the
construction of a new brewery in East Tamaki. In 2008,
the project won the Concrete3 Sustainability Award.
In the Greater Zurich area, 2009 saw the completion
of a section of motorway designed to divert transit
traffic away from the city and surrounding urban areas.
In a consortium, Holcim Switzerland took a leading
role. The core component of the customized total
solution was the delivery of 1 million cubic meters
of concrete. In five mobile concrete plants, special
concretes were produced around the clock, some in
the form of self-compacting concrete. The greatest
challenge doubtless lay in the logistics of handling
the 8 million tonnes of excavated material. This was
transported on a kilometer-long conveyor belt and
32 Value-Driven Corporate Management

then by rail to a green disposal site. Some of the mate-
rial excavated from the tunnel was reused to stabilize
the tunnel in combination with the specialist binding
agent GEOROC.
Added value through innovative solutions
in process technology
Research and development in the field of sustainable
and energy-efficient manufacturing is essential to
Holcim’s long-term success as a company. The chal-
lenges ahead include the rising cost of electrical and
thermal energy, ensuring their availability worldwide,
improving the emissions of cement kilns and increas-
ing plant reliability. Holcim’s program of innovation in
the process sector addresses these challenges.
Innovative solutions are systematically disseminated by
involving the Group companies at an early stage from
the development of ideas through to pilot projects and
large-scale technical implementation Group-wide.
New technologies as the answer to long-term increasing
energy prices
To improve the eco-balance and thermal energy costs,
the fuel mix is continuously optimized based on the
availability of local energy sources. Holcim has been a
leader in the use of alternative fuels and raw materi-
als for many years. The development of new enabling
technologies for the thermo-chemical preparation of
low-grade fuels with a low calorific value is of high
strategic importance with regard to sustainable
production and product quality.
Successful partnerships with leading research institutes
Holcim systematically seeks collaborations with
leading experts outside the Group with a view to
achieving outstanding objectives in joint projects.
One example is the successful partnership with the
Paul Scherrer Institute (Switzerland) and the Federal
Institute of Technology Zurich (Switzerland) in the
area of solar technology. Expert resources from the
three partners are exploring new ways of using highly
concentrated solar energy to upgrade low-grade fuels
to high-grade synthetic fuels. The feasibility of pro-
ducing synthetic gas in a semi-industrial reactor is
currently being reviewed.
This project shows how Holcim is making a contribu-
tion to promoting sustainable production processes
and how cutting-edge approaches to reduce CO2
emissions in the cement industry are being sought
out.
Holcim protects promising future technologies
with patents, sometimes together with its research
partners.
Initiatives to promote sustainable manufacturing
processes
New collaborative ventures are also being sought at
European or international level. For example, Holcim
is a core partner of the European Union’s IMS2020
project, which seeks to shape global research and
development priorities for future sustainable and
energy-efficient manufacturing. From these networks
and partnerships, Holcim hopes to find new process
solutions for its needs.
33Innovation

34 Value-Driven Corporate Management
In the first few months of the year 2009, the negative
trend in global equity markets continued. As a cyclical
stock, Holcim shares further declined largely because
insolvency fears across the industry. Although these
concerns were unfounded in the case of Holcim, they
continued to put pressure on the stock.
In the course of an improved business outlook, with
the announcement of the acquisition in Australia
and the first signs that implemented cost saving
measures started to bear fruit, Holcim share price
recovered and eventually outperformed the Swiss
Market Index and other relevant benchmarks.
Holcim managed the turbulent business conditions well
during the last year and took advantage of opportunities
that arose. The Group has a healthy balance sheet including
excellent liquidity reserves.
Capital market information
SMI (adjusted)Holcim registered share
Performance of Holcim share versus Swiss Market Index (SMI)
CHF 100
CHF 80
CHF 60
CHF 40
CHF 20
CHF 0
CHF 140
CHF 120
2005 2006 2007 2008 2009 2010

35Capital Market Information
The share closed at year-end 2009 at CHF 80.50
(2008: 55.161) which is equal to an increase of approxi-
mately 46 percent compared to the 2008 year-end
close.
Listings
Holcim is listed on the SIX Swiss Exchange. Its shares
are traded on the Main Standard of SIX Swiss Exchange.
Each share carries one voting right. As at year-end 2009,
the company’s market capitalization stood at approxi-
mately CHF 26.3 billion.
Additional data
ISIN CH0012214059
Security code number 1221405
Telekurs code HOLN
Bloomberg code HOLN VX
Reuters code HOLN.VX
Major shareholders
Information on major shareholders can be found on
page 196 of this report.
Distribution of Holcim shares
and breakdown of shareholders
The majority of shares held in other countries are
owned by shareholders in the UK and the US.
Geographical distribution
Switzerland 48%
Other countries 24%
Shares pending registration of transfer 28%
Breakdown of shareholders
by number of registered shares held
1–100 11,405
101–1,000 34,703
1,001–10,000 7,058
10,001–100,000 623
> 100,000 115
Free float
The free float as defined by the SIX Swiss Exchange
stands at 82 percent.
Dividend policy
Dividends are distributed annually. In 2003, the Board
of Directors determined that one-third of Group net
income attributable to shareholders of Holcim Ltd
should be distributed. For the 2009 financial year,
the Board is proposing to distribute a cash dividend
of CHF 1.50 per registered share. The next dividend is
scheduled for May 14, 2010.
Weighting of the Holcim registered share
in selected share indices
Index Weighting in %
SMI, Swiss Market Index 2.75
SPI, Swiss Performance Index 2.35
SLI, Swiss Leader Index 4.55
BEBULDM, BE500 Building Materials Index 17.37
SXOP, Dow Jones STOXX 600 Construction 9.37
DJSI World, Dow Jones Sustainability Index 0.22
FTSE4Good Europe Index 0.36
Sources: Bloomberg, Dow Jones Sustainability Indexes,FTSE Index Company, end-December 2009.
1 Adjusted for the stock dividend for the year 2008 and the capital increase carried out in 2009.

36 Value-Driven Corporate Management
Key data Holcim registered share1
Par value CHF 2 2009 2008 2007 2006 20052
Number of shares issued 327,086,376 263,586,090 263,586,090 255,348,625 229,925,518
Number of dividend-bearing shares 327,086,376 263,586,090 263,586,090 255,348,625 229,925,518
Number of shares conditional capital3 1,422,350 1,422,350 1,422,350 9,659,815 14,007,875
Number of treasury shares 6,905,384 5,132,061 668,849 679,912 828,998
Stock market prices in CHF
High 81 111 126 103 81
Low 28 40 102 78 62
Earnings per dividend-bearing share in CHF4 4.93 6.27 13.66 7.95 6.07
Cash earnings per share in CHF4 13.04 13.02 18.81 16.70 13.69
Consolidated shareholders’ equity
per share in CHF5 59.44 59.42 71.44 59.60 50.05
Dividend per share in CHF 1.506 2.25 3.30 2.00 1.65
11 Adjusted for stock dividend 2008 and/or capital increases.12 Restated in line with IAS 21 amended.13 Shares reserved for convertible bonds.14 EPS calculation based on net income attributable to shareholders of Holcim Ltd weighted by the average number of shares outstanding(see note 16).
15 Based on shareholders’ equity – attributable to shareholders of Holcim Ltd – and the number of dividend-bearing shares(less treasury shares) as per December 31.
16 Proposed by the Board of Directors.
Information on Holcim registered shares
Further information on Holcim registered shares
can be found at www.holcim.com/investors.

37Capital Market Information
Financial reporting calendar
Results for the first quarter of 2010 May 4, 2010
General meeting of shareholders May 6, 2010
Ex date May 10, 2010
Dividend distribution May 14, 2010
Half-year results for 2010 August 19, 2010
Press and analyst conference for the third quarter of 2010 November 10, 2010
Press and analyst conference on annual results for 2010 March 2, 2011
Current rating (February 2010)
Standard & Poor’s Fitch Moody’s
Long-term rating BBB, outlook stable BBB, outlook stable Baa2, outlook stable
Short-term rating A-2 F2 P-2
Disclosure of shareholdings
Under Art. 20 of the Swiss Federal Act on Stock
Exchanges and Securities Trading (Stock Exchange
Act), whosoever, directly, indirectly or in concert
with third parties, acquires or disposes of shares,
for his own account, in a company incorporated in
Switzerland whose equity securities are listed, in
whole or in part, in Switzerland and thereby attains,
falls below or exceeds the threshold of 3, 5, 10, 15,
20, 25, 331/3, 50 or 662/3 percent of the voting rights,
whether or not such rights may be exercised, shall
notify the company and the stock exchanges on
which the equity securities in question are listed.
Important shareholders are disclosed on page 196.
Registration in the share register
and restrictions on voting rights
On request, purchasers of registered shares are en-
tered in the share register as voting shareholders pro-
vided that they expressly declare that they acquired
the shares in their own name and for their own
account. The Board of Directors will enter individuals
whose requests for registration do not include an
express declaration that they hold the shares for their
own account (nominees) in the share register as
shareholders with voting rights, provided that such
nominees have concluded an agreement with the
company concerning their status and are subject to
recognized banking or financial market supervision.
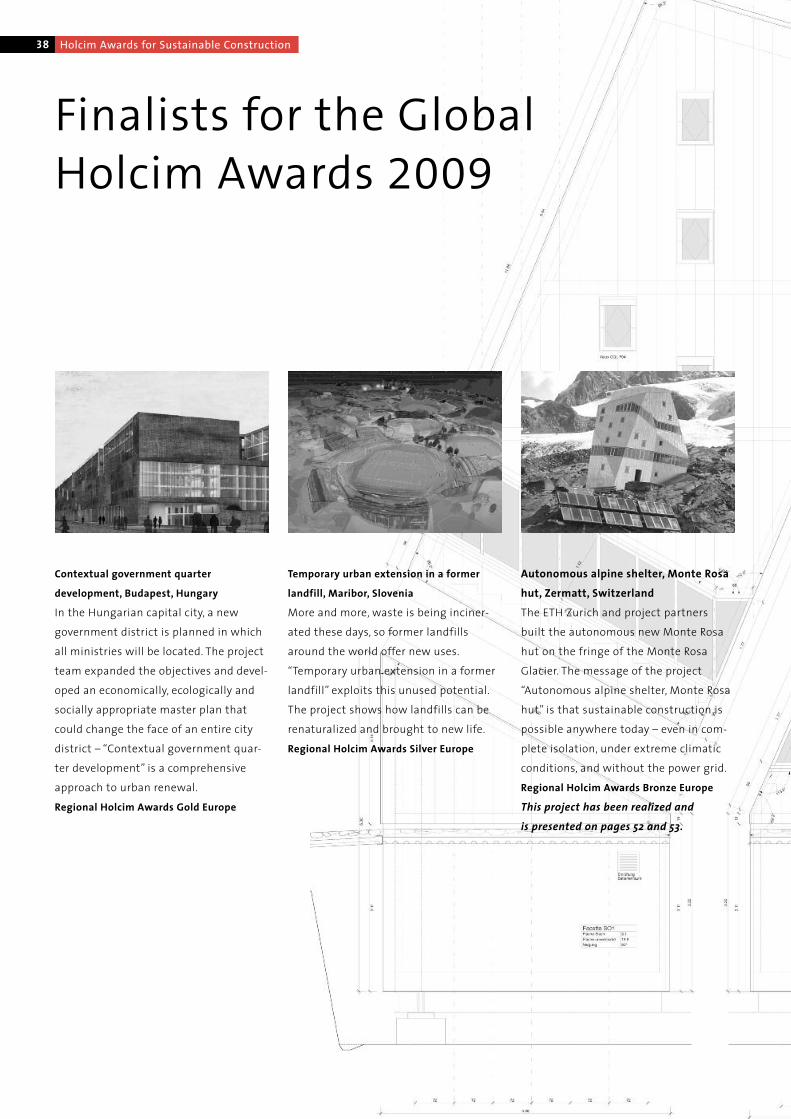
38 Holcim Awards for Sustainable Construction
Finalists for the GlobalHolcim Awards 2009
Contextual government quarter
development, Budapest, Hungary
In the Hungarian capital city, a new
government district is planned in which
all ministries will be located. The project
team expanded the objectives and devel-
oped an economically, ecologically and
socially appropriate master plan that
could change the face of an entire city
district – “Contextual government quar-
ter development” is a comprehensive
approach to urban renewal.
Regional Holcim Awards Gold Europe
Temporary urban extension in a former
landfill, Maribor, Slovenia
More and more, waste is being inciner-
ated these days, so former landfills
around the world offer new uses.
“Temporary urban extension in a former
landfill” exploits this unused potential.
The project shows how landfills can be
renaturalized and brought to new life.
Regional Holcim Awards Silver Europe
Autonomous alpine shelter, Monte Rosa
hut, Zermatt, Switzerland
The ETH Zurich and project partners
built the autonomous new Monte Rosa
hut on the fringe of the Monte Rosa
Glacier. The message of the project
“Autonomous alpine shelter, Monte Rosa
hut” is that sustainable construction is
possible anywhere today – even in com-
plete isolation, under extreme climatic
conditions, and without the power grid.
Regional Holcim Awards Bronze Europe
This project has been realized and
is presented on pages 52 and 53.
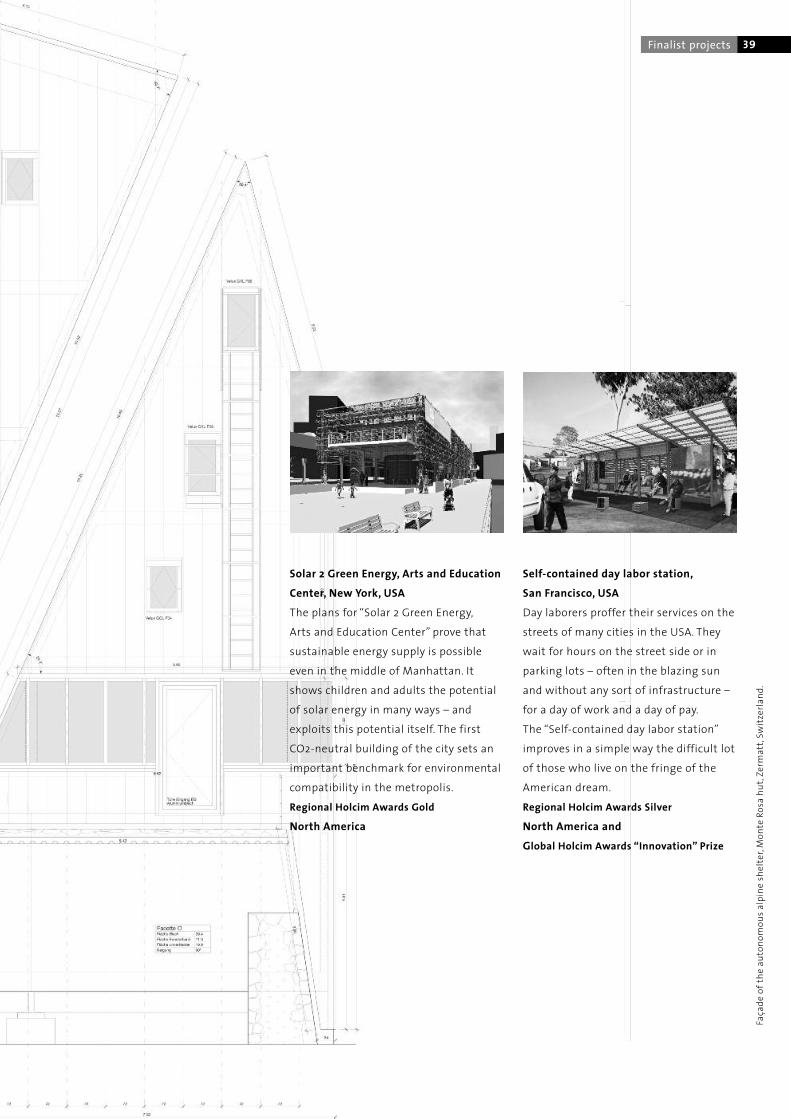
Façade
oftheau
tono
mou
salpine
shelter,Mon
teRosa
hut,Zerm
att,Sw
itzerla
nd.
39Finalist projects
Solar 2 Green Energy, Arts and Education
Center, New York, USA
The plans for “Solar 2 Green Energy,
Arts and Education Center” prove that
sustainable energy supply is possible
even in the middle of Manhattan. It
shows children and adults the potential
of solar energy in many ways – and
exploits this potential itself. The first
CO2-neutral building of the city sets an
important benchmark for environmental
compatibility in the metropolis.
Regional Holcim Awards Gold
North America
Self-contained day labor station,
San Francisco, USA
Day laborers proffer their services on the
streets of many cities in the USA. They
wait for hours on the street side or in
parking lots – often in the blazing sun
and without any sort of infrastructure –
for a day of work and a day of pay.
The “Self-contained day labor station”
improves in a simple way the difficult lot
of those who live on the fringe of the
American dream.
Regional Holcim Awards Silver
North America and
Global Holcim Awards “Innovation” Prize

40 Holcim Awards for Sustainable Construction
Center for freshwater restoration
and research, Sudbury, Canada
A wide range of actions has been taken
to repair the worst of the environmental
damage caused by acid rain. One sign of
renewal is the “Living with Lakes Center
for freshwater restoration and research”,
where an interdisciplinary team is con-
ducting high-quality research.
Regional Holcim Awards Bronze
North America
This project is under construction
and presented on pages 58 and 59.
Low-energy university mediatheque,
Rio de Janeiro, Brazil
Pontifical Catholic University Rio is
planning a “Low-energy university
mediatheque”. The building is to
become an architectural landmark
for Rio de Janeiro and will motivate
residents of the surrounding squatter
district to visit. The building is equipped
with state-of-the-art technology.
Regional Holcim Awards Silver
Latin America
Urban integration of an informal area,
Medellín, Colombia
Violence in Medellín was a great problem
for many years, but much has changed
since then. One reason for the change
is the project “Urban integration of an
informal area”. Countless measures are
being taken to improve the urban infra-
structure for the poorest of the poor.
Regional Holcim Awards Gold
Latin America
This project is partially realized
and presented on pages 64 and 65.

Plan
forthe
riverremediation
andurbandevelopm
ent,Fez,Morocco.
41Finalist projects
Solar water heating and rainwater
tower, Florianópolis, Brazil
Brazil lacks sufficient housing for the
poor. State-supported housing associa-
tions are fighting the deficit with simple
standardized houses. Professionals are
using this initiative to create a break-
through for sustainable technologies
such as the “Solar water heating and
rainwater tower”, which is a sustainable
way of supplying water to the houses.
Regional Holcim Awards Bronze
Latin America
River remediation and urban
development scheme, Fez, Morocco
The medina of the Moroccan imperial
city of Fez is a UNESCOWorld Heritage
site. The project “River remediation and
urban development scheme” rehabili-
tates the polluted and now hardly visible
River Fez, winning back the soul of
the old city center – and preserving the
district as a place to live.
Regional Holcim Awards Gold
Africa Middle East and
Global Holcim Awards Gold
This project is under construction
and presented on pages 70 and 71.
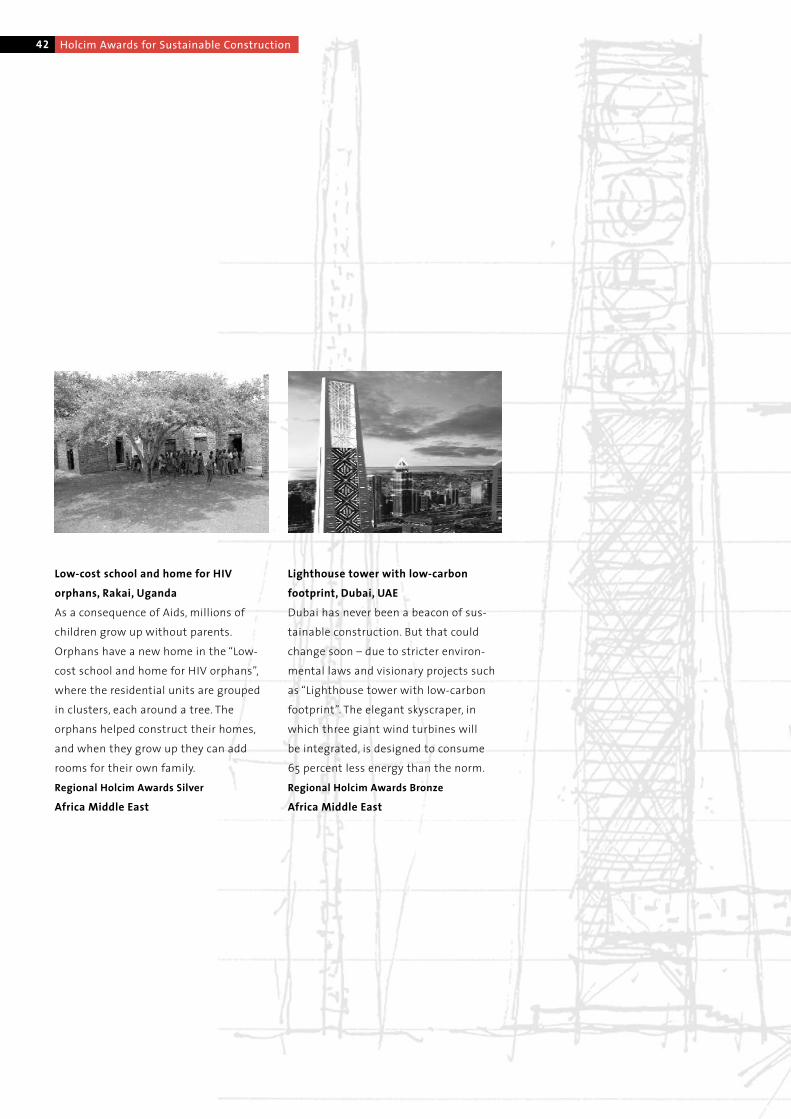
42 Holcim Awards for Sustainable Construction
Lighthouse tower with low-carbon
footprint, Dubai, UAE
Dubai has never been a beacon of sus-
tainable construction. But that could
change soon – due to stricter environ-
mental laws and visionary projects such
as “Lighthouse tower with low-carbon
footprint”. The elegant skyscraper, in
which three giant wind turbines will
be integrated, is designed to consume
65 percent less energy than the norm.
Regional Holcim Awards Bronze
Africa Middle East
Low-cost school and home for HIV
orphans, Rakai, Uganda
As a consequence of Aids, millions of
children grow up without parents.
Orphans have a new home in the “Low-
cost school and home for HIV orphans”,
where the residential units are grouped
in clusters, each around a tree. The
orphans helped construct their homes,
and when they grow up they can add
rooms for their own family.
Regional Holcim Awards Silver
Africa Middle East

43Finalist projects
Low-impact greenfield university
campus, Ho Chi Minh City, Vietnam
The new “Low-impact greenfield univer-
sity campus” is arising amid the Mekong
Delta in Vietnam. The project addresses
the needs of both man and nature; the
unusual layout of the building is based
on state-of-the-art computer analysis of
flows of wind and people. The unique
natural surrounding is integrated into
the innovative concept. The building
disappears in lush greenery.
Regional Holcim Awards Silver
Asia Pacific and
Global Holcim Awards Silver
Sketch
ofskyscraperwithlow-carbo
nfootprint,Dub
ai,UAE
.
Energy-efficient office complex,
Hyderabad, India
Unreliable power supply and inadequate
infrastructure are serious problems
for the booming IT industry in India.
The “Energy-efficient office complex”
provides a sustainable answer to the
current infrastructure challenges. It uses
a resource that is plentiful in India –
sunlight.
Regional Holcim Awards Bronze
Asia Pacific
This project is under construction
and presented on pages 74 and 75.
Sustainable planning for a rural
community, Beijing, China
Poor living conditions are driving millions
of Chinese farmers into cities, while much
farmland is being lost to development.
The pilot project “Sustainable planning for
a rural community” near Beijing shows
that much must be done to keep people in
villages – and it shows how much can be
done.
Regional Holcim Awards Gold
Asia Pacific and
Global Holcim Awards Bronze
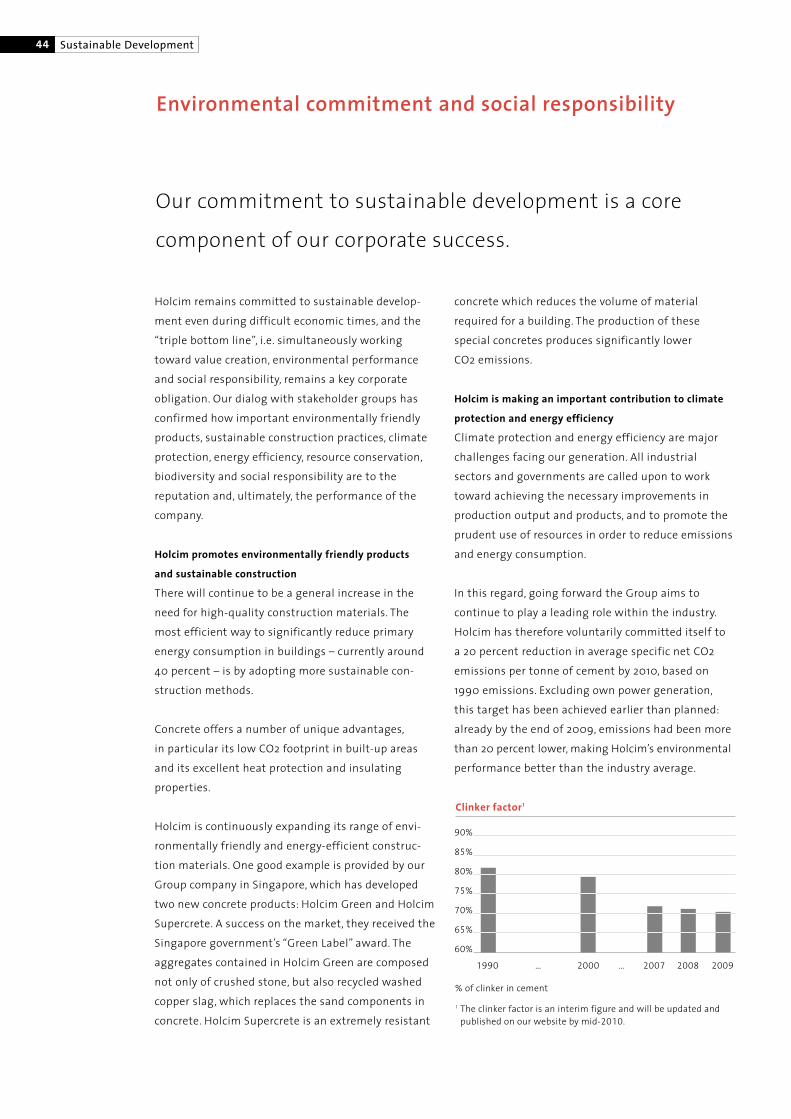
44
concrete which reduces the volume of material
required for a building. The production of these
special concretes produces significantly lower
CO2 emissions.
Holcim is making an important contribution to climate
protection and energy efficiency
Climate protection and energy efficiency are major
challenges facing our generation. All industrial
sectors and governments are called upon to work
toward achieving the necessary improvements in
production output and products, and to promote the
prudent use of resources in order to reduce emissions
and energy consumption.
In this regard, going forward the Group aims to
continue to play a leading role within the industry.
Holcim has therefore voluntarily committed itself to
a 20 percent reduction in average specific net CO2
emissions per tonne of cement by 2010, based on
1990 emissions. Excluding own power generation,
this target has been achieved earlier than planned:
already by the end of 2009, emissions had been more
than 20 percent lower, making Holcim’s environmental
performance better than the industry average.
Sustainable Development
Our commitment to sustainable development is a core
component of our corporate success.
Environmental commitment and social responsibility
Holcim remains committed to sustainable develop-
ment even during difficult economic times, and the
“triple bottom line”, i.e. simultaneously working
toward value creation, environmental performance
and social responsibility, remains a key corporate
obligation. Our dialog with stakeholder groups has
confirmed how important environmentally friendly
products, sustainable construction practices, climate
protection, energy efficiency, resource conservation,
biodiversity and social responsibility are to the
reputation and, ultimately, the performance of the
company.
Holcim promotes environmentally friendly products
and sustainable construction
There will continue to be a general increase in the
need for high-quality construction materials. The
most efficient way to significantly reduce primary
energy consumption in buildings – currently around
40 percent – is by adopting more sustainable con-
struction methods.
Concrete offers a number of unique advantages,
in particular its low CO2 footprint in built-up areas
and its excellent heat protection and insulating
properties.
Holcim is continuously expanding its range of envi-
ronmentally friendly and energy-efficient construc-
tion materials. One good example is provided by our
Group company in Singapore, which has developed
two new concrete products: Holcim Green and Holcim
Supercrete. A success on the market, they received the
Singapore government’s “Green Label” award. The
aggregates contained in Holcim Green are composed
not only of crushed stone, but also recycled washed
copper slag, which replaces the sand components in
concrete. Holcim Supercrete is an extremely resistant
Clinker factor1
% of clinker in cement
1 The clinker factor is an interim figure and will be updated andpublished on our website by mid-2010.
90%
85%
80%
75%
70%
65%
60%
20081990 … …2000 2007 2009
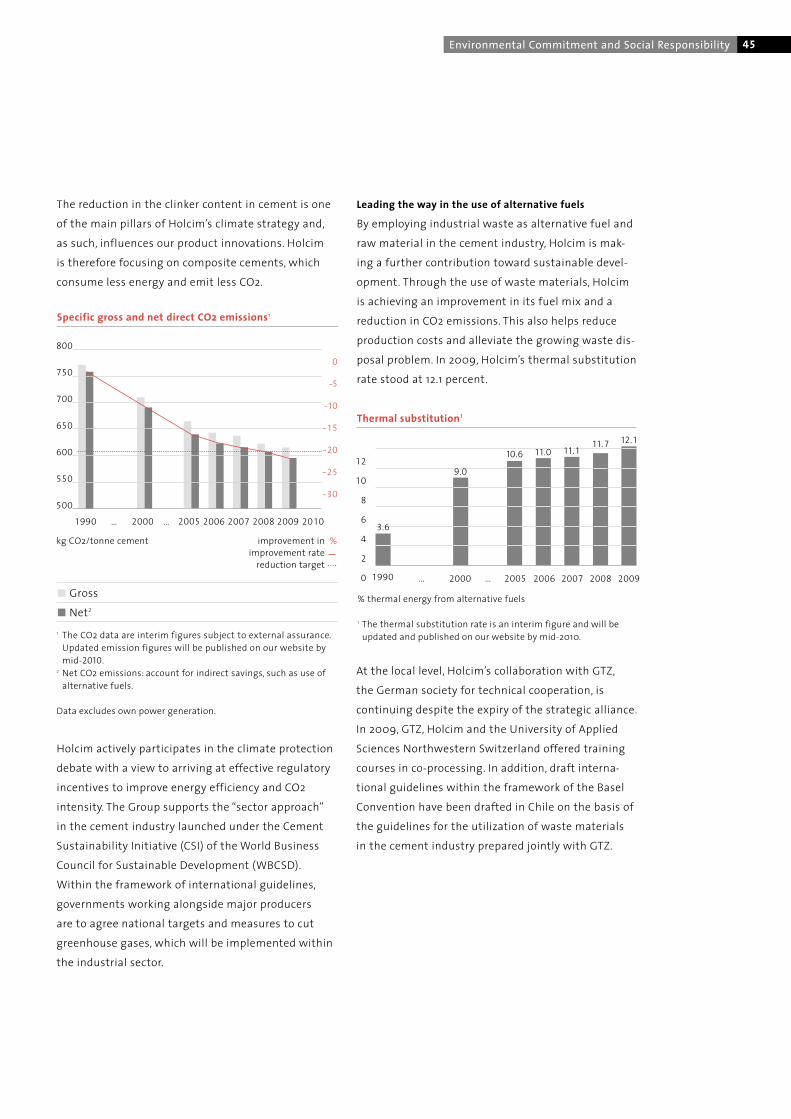
Environmental Commitment and Social Responsibility 45
Leading the way in the use of alternative fuels
By employing industrial waste as alternative fuel and
raw material in the cement industry, Holcim is mak-
ing a further contribution toward sustainable devel-
opment. Through the use of waste materials, Holcim
is achieving an improvement in its fuel mix and a
reduction in CO2 emissions. This also helps reduce
production costs and alleviate the growing waste dis-
posal problem. In 2009, Holcim’s thermal substitution
rate stood at 12.1 percent.
Gross
Net2
Holcim actively participates in the climate protection
debate with a view to arriving at effective regulatory
incentives to improve energy efficiency and CO2
intensity. The Group supports the “sector approach”
in the cement industry launched under the Cement
Sustainability Initiative (CSI) of the World Business
Council for Sustainable Development (WBCSD).
Within the framework of international guidelines,
governments working alongside major producers
are to agree national targets and measures to cut
greenhouse gases, which will be implemented within
the industrial sector.
1 The CO2 data are interim figures subject to external assurance.Updated emission figures will be published on our website bymid-2010.
2 Net CO2 emissions: account for indirect savings, such as use ofalternative fuels.
Data excludes own power generation.
kg CO2/tonne cement improvement in %improvement ratereduction target
Thermal substitution1
% thermal energy from alternative fuels
1 The thermal substitution rate is an interim figure and will beupdated and published on our website by mid-2010.
Specific gross and net direct CO2 emissions1
At the local level, Holcim’s collaboration with GTZ,
the German society for technical cooperation, is
continuing despite the expiry of the strategic alliance.
In 2009, GTZ, Holcim and the University of Applied
Sciences Northwestern Switzerland offered training
courses in co-processing. In addition, draft interna-
tional guidelines within the framework of the Basel
Convention have been drafted in Chile on the basis of
the guidelines for the utilization of waste materials
in the cement industry prepared jointly with GTZ.
The reduction in the clinker content in cement is one
of the main pillars of Holcim’s climate strategy and,
as such, influences our product innovations. Holcim
is therefore focusing on composite cements, which
consume less energy and emit less CO2.
12
10
8
6
4
2
0 20071990 2000 2006 20082005……
3.6
9.0
10.6 11.0 11.111.7
2009
12.1
800
750
700
650
600
550
500
0
-5
-10
-15
-20
-25
-30
2006 20101990 2000 2007 2008 20092005… …

Importance of protecting resources and biodiversity
The raw materials essential for the production of
cement and aggregates are, as a rule, extracted
through quarrying. In order to maintain biodiversity
in the areas surrounding quarries, Holcim signed an
agreement with the International Union for Conserva-
tion of Nature (IUCN) in 2007. The main focus is on
the management of ecosystems at Holcim’s sites.
A committee of independent experts is monitoring
the Group’s practices. In 2008 and 2009, it visited
plants and quarries in Spain, Indonesia, Hungary,
Belgium, the US, the UK and China. Its findings
form the foundation for the preparation of a Holcim
biodiversity strategy and a biodiversity management
system.
Since the signing of the global agreement with the
IUCN, Group companies in Sri Lanka, Vietnam, Costa
Rica, Nicaragua and Spain have entered into project
agreements with local IUCN branches to promote
quarry restoration, sustainable natural resources and
raising awareness.
Safety at work still takes top priority
The health and safety at work of all staff, suppliers
and service providers remains one of Holcim’s key
concerns. The objective of preventing accidents is still
being pursued with vigor. Training for staff and con-
tractors is of the utmost importance in this context.
In addition to the establishment of five basic rules
and the Passion for Safety initiative, the numerous
measures taken by the Group also include the intro-
duction of a safety-at-work and health management
system, and directives designed to prevent accidents
and ensure the safety of suppliers. All Group compa-
nies are required to implement these measures.
Under the aegis of the World Business Council for
Sustainable Development, regular exchanges of expe-
riences revolving around these questions take place
with members of the Cement Sustainability Initiative.
46 Sustainable Development
2009 saw a further decrease in the incidence of
accident-related absences, but the defined target has
not yet been reached. The Board of Directors and the
Executive Committee deeply regret that despite every
effort, 21 Holcim employees and contractors met with
fatal accidents in the course of daily operations, and
7 Holcim employees and contractors lost their lives
during assignments at major building sites for new
plant construction and plant extension.
Where alternative fuels are prepared and utilized for
cement production, particularly strict safety mea-
sures are required. Consequently, supplementing the
relevant statutory provisions, Holcim has issued a
specific directive for safety in the workplace when
handling alternative fuels and has rolled out the
comprehensive ACert (Alternative Fuels and Raw
Materials Certification) verification system. Here too
the aim is to improve safety in the workplace and
promote the implementation of a quality and envi-
ronmental management system. By the end of 2009,
26 Group companies had begun introducing ACert.
1 The lost time injury frequency rate (LTIFR) is calculated as:number of lost time injuries × 1,000,000 : total number ofhours worked. Data includes all cement, aggregates as well asready-mix concrete operations.
2 Data for LTIFR are regrouped to reflect the CSI reporting stan-dards. Direct employees include own and subcontracted person-nel under direct Holcim supervision.
Lost time injury frequency rate1
8
7
6
5
4
3
2
1
0
2005 2007 20082006 2009
Threshold<2
Direct employees2
Target
2.7 1.97.1 5.6 3.9
2.72.1
6.9
5.2
3.9

47Environmental Commitment and Social Responsibility
Commitment to plant communities bearing fruit
The motivation behind Holcim’s social engagement is
strategic. Holcim sees an active commitment to social
responsibility and a continuous dialog with its stake-
holder groups as essential preconditions for a stable
corporate and business environment.
This is why Holcim supports projects in the fields of
education and training, infrastructure and sustainable
community development. 56 percent of Group compa-
nies have validated their most important social projects
on the basis of the Social Engagement Scorecard
developed by Holcim. The aim is to ensure that the
projects effectively contribute toward achieving the
Group’s objectives, while at the same time improving
the quality of life of the local population. Using this
scorecard has also given greater emphasis to strategi-
cally important social projects, such as solutions for
social house building.
In 2009, Holcim spent around 1 percent of consoli-
dated profit before taxes on social projects worldwide,
with some 3 million people benefiting from the
Group’s engagement in this area.
Community spending 2009
Community development projects 18%
Education projects 15%
Infrastructure community projects 18%
Donations and charity 27%
CSR overhead 16%
Others 6%
Total in million CHF 36
Since January 2010, Holcim has been a member of
the Corporate Support Group of the International
Committee of the Red Cross (ICRC). The aim of this
cooperation is to provide joint support for specific
humanitarian projects in selected countries in
conflict situations, such as water projects in Sudan.
Listed in leading sustainability indices
In September 2009, the Group was confirmed as a
member of the Dow Jones Sustainability World Index
(DJSI) for the seventh year in succession. This means
that it is recognized as one of the companies with
the strongest commitment to sustainability in our
industry. Holcim received top marks for its recycling
strategy, its career development provision, its corpo-
rate citizen approach and its dialog with stakeholder
groups. Holcim also remains listed in the FTSE4Good
sustainability index.
In 2010, Holcim will be publishing its fifth sustainabil-
ity report in accordance with the guidelines of the
Global Reporting Initiative. This serves as a progress
report for the UN Global Compact.
Holcim Foundation promotes sustainable construction
The Holcim Foundation for Sustainable Construction
has been working to promote sustainability in the
construction sector since 2003. Further information
can be found in the section headed “Key success
factors” on page 24 and at www.holcimfoundation.org.
48 Sustainable Development
Holcim invests in the targeted training and development of
employees and leaders at all levels – this is the key to success.
Human resources
To execute the Holcim strategy successfully, employees
at Group companies need management as well
as leadership skills. Only the combination of both
qualities can deliver the desired results. This is why
management training has been a top priority for
many years. Despite the difficult economic environ-
ment, all planned executive seminars were conducted
in 2009.
Group-wide management education
The Core Curriculum defines the level of manage-
ment and leadership skills that the Group is striving
to achieve worldwide. The learning objectives have
been set by Corporate Human Resources, but each
Group company is free to decide how best to system-
atically implement them. Standard packages are
available that Group companies can adapt to local
requirements. Occasionally, Group companies
collaborate on training measures, as the example
of two Holcim companies in Eastern Europe shows.
They trained their staff in joint sessions, alternating
between Croatia and Serbia and in close cooperation
with a renowned local university.
Enhancing technical trade skills
Technical trade skills are required to optimally per-
form maintenance jobs in cement, aggregates and
ready-mix concrete plants. A new guide focuses on
the eleven main basic skills that are usually gained in
apprenticeships or vocational programs for mainte-
nance staff. The learning objectives for each trade skill
were specified for shop-floor and supervisor levels.
The Group companies in Costa Rica and Italy decided
to enhance the basic skills of the maintenance shop-
floor staff by piloting the implementation of the
trade skills guide in their cement plants. In a first
phase of the pilot, these companies decided to
address pneumatic, hydraulic and welding skills. In
Costa Rica, the training was conducted in collabora-
tion with the National Institute of Learning, with
whom the company has closely cooperated over a
long period. The Group company in Italy decided to
carry out the training with equipment suppliers.
The final objectives, established by both companies,
were to reduce third party activities and main-
tenance costs. Equally important is the increased
employee motivation encouraged by these measures.

49Human Resources
Interaction skills training
Employee surveys show that targeted training can
have a positive impact on management behavior.
“Dialogue” is the name of the Holcim process for per-
formance management and individual development
planning. Its success rests on open and effective
interactions between employees and their super-
visors. To strengthen interaction and feedback skills,
Holcim has rolled out a training program available to
all Group companies.
Awards for the best plants and commercial excellence
Rewarding excellence is part of the Holcim culture.
If the Group’s values of “Strength. Performance.
Passion.” are to be lived, recognition of achievements
and dedication that goes beyond what might reason-
ably be expected is a must.
Awards for the best plants
2009 marked the second year that Holcim conferred
awards for the best performing and fastest improv-
ing cement plants. To determine the best plants,
performance was measured and analyzed using a set
of indicators such as OH&S, product quality, energy
efficiency, cost, and environmental track record.
These awards, first and foremost, recognize staff
achievements.While the right technical equipment is
necessary, it is people who make the difference when
it comes to delivering excellence at a plant. In 2009,
awards were given to plants in Costa Rica, Ecuador,
France, Mexico and Switzerland.
Commercial awards
A similar competition was launched in the commer-
cial area. It contributes to publicizing successful
concepts and activities throughout the entire Group.
These awards also generate strong motivation in and
among the participating teams.
The commercial awards recognize successful com-
mercialization of products and services along the
Holcim Value Chain (see page 23). The jury named
Gold, Silver and Bronze winners for the main category
“Excellence along the Holcim Value Chain”. Prizes
were also awarded in the categories “Excellence in
Channel Management” and “Next Generation”.
The five awards were given to Group companies in
Argentina, Costa Rica, Germany, the Netherlands and
Singapore. These awards recognize initiatives that
will help Holcim to secure commercial success in the
future.
Systematic succession management for the future
The Group employs a standard process for identifying
and assessing talents. A uniform global approach is
also applied to succession planning. It is built on a
system of continually locating a pool of potential
managers and technical experts at the individual
Group companies and consolidating these pools at
Group level. During the 2009 cycle, the parameters of
the statistical analysis were extended.
To better accommodate the Group’s internationality
and be able to offer senior managers more attractive
offers, Holcim enhanced the Internal Mobility Program.
The aim of the program is to provide talents with
ideal opportunities for development and so retain
them within the Group. A further objective is to be
able to fill as many vacancies as possible with high-
caliber internal candidates.
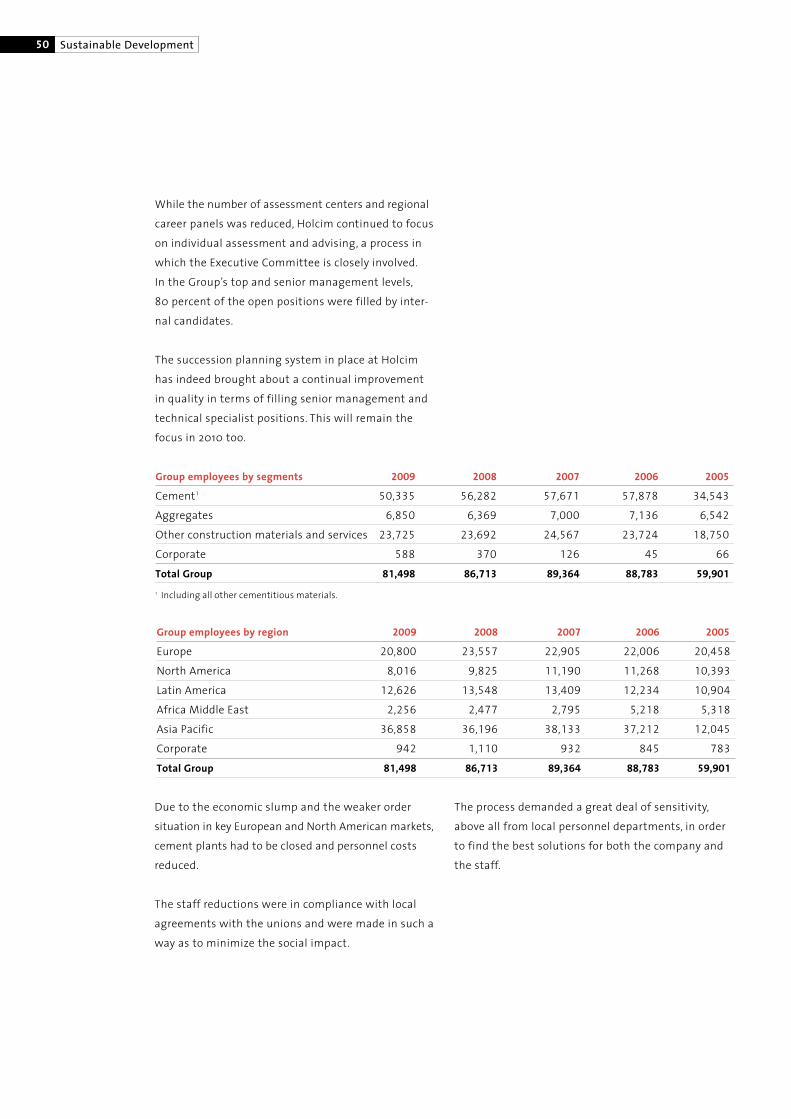
50 Sustainable Development
While the number of assessment centers and regional
career panels was reduced, Holcim continued to focus
on individual assessment and advising, a process in
which the Executive Committee is closely involved.
In the Group’s top and senior management levels,
80 percent of the open positions were filled by inter-
nal candidates.
The succession planning system in place at Holcim
has indeed brought about a continual improvement
in quality in terms of filling senior management and
technical specialist positions. This will remain the
focus in 2010 too.
The process demanded a great deal of sensitivity,
above all from local personnel departments, in order
to find the best solutions for both the company and
the staff.
Due to the economic slump and the weaker order
situation in key European and North American markets,
cement plants had to be closed and personnel costs
reduced.
The staff reductions were in compliance with local
agreements with the unions and were made in such a
way as to minimize the social impact.
Group employees by region 2009 2008 2007 2006 2005
Europe 20,800 23,557 22,905 22,006 20,458
North America 8,016 9,825 11,190 11,268 10,393
Latin America 12,626 13,548 13,409 12,234 10,904
Africa Middle East 2,256 2,477 2,795 5,218 5,318
Asia Pacific 36,858 36,196 38,133 37,212 12,045
Corporate 942 1,110 932 845 783
Total Group 81,498 86,713 89,364 88,783 59,901
Group employees by segments 2009 2008 2007 2006 2005
Cement1 50,335 56,282 57,671 57,878 34,543
Aggregates 6,850 6,369 7,000 7,136 6,542
Other construction materials and services 23,725 23,692 24,567 23,724 18,750
Corporate 588 370 126 45 66
Total Group 81,498 86,713 89,364 88,783 59,9011 Including all other cementitious materials.

51Human Resources
Origin of senior managers
From Europe: 24 nationalities 36% of all senior management
From North America: 2 nationalities 13% of all senior management
From Latin America: 12 nationalities 19% of all senior management
From Africa Middle East: 8 nationalities 3% of all senior management
From Asia Pacific: 14 nationalities 29% of all senior management
Personnel expenses in 2009 by function and region
Million CHF Production Marketing Administration Total
and distribution and sales
Europe 1,113 180 284 1,577
North America 719 66 133 918
Latin America 312 64 95 471
Africa Middle East 59 9 24 92
Asia Pacific 432 61 139 632
Corporate 52 27 170 249
Total Group 2,687 407 845 3,939
Composition of senior managers
Male Female Total Percentage
of women
Top management level 329 24 353 7%
Senior management level 1,478 126 1,604 8%
Middle management level 6,227 903 7,130 13%
Total 8,034 1,053 9,087 12%

“This building proves that survival
is possible without relying on
public networks – by using solar energy,
which is available everywhere
in the world.” Andrea Deplazes
Andrea Deplazesstudied architecture atthe ETH Zurich. In 1988,he and Valentin Bearthfounded the architecturalfirm Bearth + DeplazesArchitekten AG. Amongthe firm’s most impor-tant works are the newMonte Rosa hut (fulldesign team package),the ÖKK HeadquartersEast Switzerland inLandquart, the Artist’sHouse in Marktoberdorfnear Munich, theTeachers’ Seminar inChur and the newFederal Court building inBellinzona (executionaldesign). Andrea Deplazeshas been Professor ofArchitecture and Con-struction at the SwissFederal Institute ofTechnology (ETH Zurich)since 1997.
52 Autonomous alpine shelter, Monte Rosa hut, Zermatt, Switzerland

53Regional Holcim Awards Bronze Europe
Andrea Deplazes, architecture professor at
the Swiss Federal Institute of Technology
(ETH Zurich), and a team of students
realized a spectacular vision – and built
a sustainable and nearly completely
autonomous mountain lodge at an altitude
of 2,883 meters above sea level. The build-
ing, which rests on a foundation of
concrete, opened in 2009 and won a
Holcim Award.
The mission was as clear as it was chal-
lenging. For its 150th anniversary, the
ETH Zurich aimed to realize a pioneering
achievement by designing a sustainable
new mountain lodge for the Swiss Alpine
Club (SAC). Andrea Deplazes, Professor
of Architecture and Construction at the
Architecture Department, accepted the
challenge.
Deplazes set up the “Studio Monte Rosa”
at the ETH Zurich and asked master’s
students to collaborate. During the first
semester, ten young people, working alone
or in pairs, developed design proposals for
a new lodge. During the next semester,
twelve other students developed the six
most interesting designs further. Of these
twelve designs, two were selected and de-
veloped with the assistance of specialists.
Finally, there arose, as Andrea Deplazes
says, “a castle in the air in visualized form
that already combined all criteria and
components which were relevant for the
building”.
The students designed a five-story build-
ing that is isolated in the mountains and
almost completely autonomous. On the
one hand, the lodge is designed to use as
little energy as possible, and on the other,
it produces up to 90 percent of its energy
itself. It retains warmth generated by solar
radiation, and equipment and occupants
in the building, and it captures additional
solar energy by means of photovoltaic
panels and thermal collectors.Wastewater
is treated in an in-house system and
reused for flushing toilets. Solar energy
warms water collected from snow. Smart
systems evaluate climate and building
data, and visitor and weather forecasts,
and consider usage cycles; the overall sys-
tem can thus be controlled to anticipate
loads.
In spite of the innovation, Andrea Deplazes
is convinced that the new Monte Rosa hut
is not a special case – it realistically
demonstrates the present possibilities
of sustainable construction. “If we can
achieve such a high degree of autonomy
in this very difficult environment, we prove
that autonomy is possible anywhere.”
Holcim Switzerland is the most important
private sponsor of this project.
Harry Gugger, architect and professor at theEPFL Lausanne, was head of the Holcim Awardsjury for the region Europe.
“A very intelligent solution –
and a very beautiful building.” Harry Gugger

54 Business Review
GroupCement plantCapacity expansionGrinding plant/Cement terminalAggregates
ParticipationAggregates
54
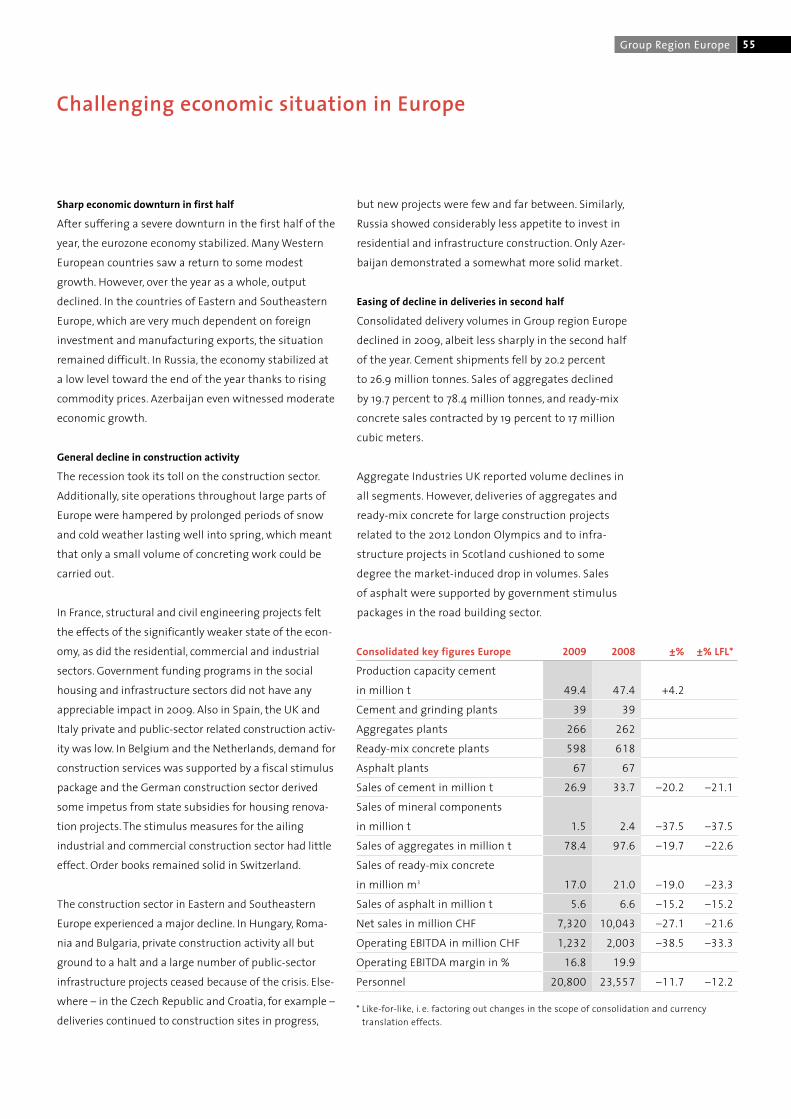
55Group Region Europe
Sharp economic downturn in first half
After suffering a severe downturn in the first half of the
year, the eurozone economy stabilized. ManyWestern
European countries saw a return to some modest
growth. However, over the year as a whole, output
declined. In the countries of Eastern and Southeastern
Europe, which are very much dependent on foreign
investment and manufacturing exports, the situation
remained difficult. In Russia, the economy stabilized at
a low level toward the end of the year thanks to rising
commodity prices. Azerbaijan even witnessed moderate
economic growth.
General decline in construction activity
The recession took its toll on the construction sector.
Additionally, site operations throughout large parts of
Europe were hampered by prolonged periods of snow
and cold weather lasting well into spring, which meant
that only a small volume of concreting work could be
carried out.
In France, structural and civil engineering projects felt
the effects of the significantly weaker state of the econ-
omy, as did the residential, commercial and industrial
sectors. Government funding programs in the social
housing and infrastructure sectors did not have any
appreciable impact in 2009. Also in Spain, the UK and
Italy private and public-sector related construction activ-
ity was low. In Belgium and the Netherlands, demand for
construction services was supported by a fiscal stimulus
package and the German construction sector derived
some impetus from state subsidies for housing renova-
tion projects. The stimulus measures for the ailing
industrial and commercial construction sector had little
effect. Order books remained solid in Switzerland.
The construction sector in Eastern and Southeastern
Europe experienced a major decline. In Hungary, Roma-
nia and Bulgaria, private construction activity all but
ground to a halt and a large number of public-sector
infrastructure projects ceased because of the crisis. Else-
where – in the Czech Republic and Croatia, for example –
deliveries continued to construction sites in progress,
Challenging economic situation in Europe
but new projects were few and far between. Similarly,
Russia showed considerably less appetite to invest in
residential and infrastructure construction. Only Azer-
baijan demonstrated a somewhat more solid market.
Easing of decline in deliveries in second half
Consolidated delivery volumes in Group region Europe
declined in 2009, albeit less sharply in the second half
of the year. Cement shipments fell by 20.2 percent
to 26.9 million tonnes. Sales of aggregates declined
by 19.7 percent to 78.4 million tonnes, and ready-mix
concrete sales contracted by 19 percent to 17 million
cubic meters.
Aggregate Industries UK reported volume declines in
all segments. However, deliveries of aggregates and
ready-mix concrete for large construction projects
related to the 2012 London Olympics and to infra-
structure projects in Scotland cushioned to some
degree the market-induced drop in volumes. Sales
of asphalt were supported by government stimulus
packages in the road building sector.
Consolidated key figures Europe 2009 2008 ±% ±% LFL*
Production capacity cement
in million t 49.4 47.4 +4.2
Cement and grinding plants 39 39
Aggregates plants 266 262
Ready-mix concrete plants 598 618
Asphalt plants 67 67
Sales of cement in million t 26.9 33.7 –20.2 –21.1
Sales of mineral components
in million t 1.5 2.4 –37.5 –37.5
Sales of aggregates in million t 78.4 97.6 –19.7 –22.6
Sales of ready-mix concrete
in million m3 17.0 21.0 –19.0 –23.3
Sales of asphalt in million t 5.6 6.6 –15.2 –15.2
Net sales in million CHF 7,320 10,043 –27.1 –21.6
Operating EBITDA in million CHF 1,232 2,003 –38.5 –33.3
Operating EBITDA margin in % 16.8 19.9
Personnel 20,800 23,557 –11.7 –12.2
* Like-for-like, i. e. factoring out changes in the scope of consolidation and currencytranslation effects.

56 Business Review
In Northern France, Holcim France Benelux sold less
cement for housing and commercial buildings. In the
east of the country, sales were depressed by an increase
in imports. Sales of aggregates also declined following
the completion of the TGV Est high-speed rail line.
As a result of acquisitions, ready-mix concrete volumes
developed better than the market as a whole.While
major projects softened the declining demand for
construction materials in Belgium, ready-mix concrete
prices continued to come under increasing pressure.
Our Group company in the Netherlands benefited
from projects to expand the road network and coastal
defenses.
Due to a rise in exports, Holcim Germany saw a slight
increase in cement sales. Shipments were positively
impacted by the start of construction work on the
Nord Stream gas pipeline and the widening of the
Bremen–Hamburg motorway to six lanes. Cement sales
in Southern Germany were virtually stable due to road
and infrastructure construction. The increase in sales
of aggregates posted by Holcim Southern Germany
was due to acquisitions. The purchase of additional
ready-mix concrete facilities by the two German Group
companies served to counter the negative market trend.
Holcim Switzerland’s cement deliveries virtually
matched the high level of the previous year and volumes
of gravel, sand and ready-mix concrete were even higher.
The Group company benefited from a continued solid
level of orders for the residential construction sector,
and various large commercial and motorway expansion
projects. Despite delivering sizable orders of construc-
tion materials for the expansion of the Milan metro and
inner-city housing projects, Holcim Italy suffered from
the generally weak state of construction activity in the
north of the country. Holcim Spain was only partly able
to compensate for the precipitous decline in residential
construction through increased deliveries in the infra-
structure sector. Through the successful integration
of Tarmac Iberia’s aggregates and ready-mix concrete
business, the Group company has strengthened its
market position.
In Eastern and Southeastern Europe, the cement sales
of all Group companies were severely impacted by the
economic crisis. Domestic sales of Holcim Bulgaria
and Holcim Slovakia suffered greatly, in part because
of massive cement imports. Volumes decreased signifi-
cantly in Hungary, the Czech Republic and Romania.
Holcim Croatia and Holcim Serbia fared slightly better.
The continuation of transport related infrastructure
projects, some of which benefited from EU financial
support, led to a certain degree of stabilization in certain
places. For instance, progress on the construction of
Prague’s orbital motorway dampened the impact of
the decline in volumes experienced by Holcim Czech
Republic, while bridge building works on the River Sava
supported deliveries by Holcim Serbia.
After the massive decline in the first half of the year,
sales at Russian-based Alpha Cement stabilized near the
end of the year due to demand for construction materi-
als in and around Moscow. Export shipments toWestern
Kazakhstan also picked up. However, in comparison with
2008, the Group company posted a significant decline in
cement sales and sales prices. In Azerbaijan, Garadagh
Cement saw volumes and prices depressed by a combi-
nation of market factors and a rise in cement imports.
Market-related capacity adjustments
Multiple efforts were undertaken by all European Group
companies to adjust capacity to the market trend. The
Torredonjimeno cement plant in Spain was permanently
closed. Holcim Hungary mothballed a kiln line at its
Lábatlan site, and the Pleven plant in Bulgaria will tem-
porarily be operated only as a grinding station, receiving
supplies of clinker from the Beli Izvor site. At the Shurovo
cement plant in Russia, no grey cement is to be pro-
duced until the commissioning of the new production
facility in the second half of 2010. The network of ready-
mix concrete plants was streamlined including the
closing of quarries in Spain in particular.

57Group Region Europe
As part of its long-term strategy, Holcim France commis-
sioned a new grinding station in Rouen harbor, ideally
located to supply the greater Paris and Normandie mar-
kets. Holcim Italy bought a cement grinding station in
the port of Ravenna. The Group is thus securing suffi-
cient potential for the next upturn in important sales
areas. Garadagh Cement began work on the construc-
tion of an ultramodern kiln line in Azerbaijan which will
more than double its existing clinker capacity.
Holcim Trading activities include a higher proportion
of mineral components
Madrid-based Holcim Trading posted a trading volume
of 19 million tonnes – down 18 percent on the previous
year.While there was a decline in cement and clinker
deliveries to the Middle East, Europe’s Mediterranean
region and Australia, trade in mineral components
remained robust. The consolidation of blast furnace slag
specialists Ecotrade enabled a significant increase in
sales in this segment.
Significantly lower operating result
Operating EBITDA for Group region Europe decreased by
38.5 percent to CHF 1,232 million as a result of market
conditions and currency factors. The systematic broad-
based implementation of cost-cuttingmeasures increas-
ingly eased the pressure on the income statement dur-
ing the course of the year. Holcim Switzerland was the
only Group company to post an improved result. All other
companies reported amuch weaker performance com-
pared with the previous year. This was particularly true
of Holcim Spain, the companies in Eastern and South-
eastern Europe, and Alpha Cement. At –33.3 percent,
internal operating EBITDA development was negative.
Alternative fuels and raw materials increase environmental
efficiency
At the Lägerdorf site in Germany, decommissioned wind
turbine rotor blades were used as alternative fuels in
clinker production for the first time, thus combining re-
newable energy with sustainable recycling.The Obourg
plant in Belgium reached particularly high rates of fuel
substitution. In Spain, the environmentally friendly and
cost-efficient recycling of defective or date-expired con-
sumer products and cosmetics was initiated under the
Group’s umbrella brand Geocycle. For Group companies
in Eastern and Southeastern Europe, regional waste
disposal company Ecorec has expanded the supply
sources for alternative fuels. At the Romanian plant in
Campulung, an additional processing platform for waste
materials ismaking a contribution toward the nationwide
disposal of old tires and refinery residuals.The Croatian
Group company actively participated in the preparation
of national directives for improved plastic recycling.
The use of alternative raw materials focused mainly
on the production of composite cements whose lower
clinker content facilitates a reduction in the amount of
CO2 emitted per tonne of cement produced. There has
been an increase in the use of fly ash in particular; the
availability of blast furnace cement was limited because
of the fall in steel production. In Northern Germany,
Slovakia and Romania, the proportion of high-grade
limestone in cement grinding operations increased.
In Southern Germany and Switzerland, the production
of composite cements based on oil shale rose.
Recognition for responsible management of resources
Acknowledging the responsible activities in sourcing of
construction materials, Aggregate Industries UK was cer-
tified compliant to the procurement industry standard
BES 6001. This makes it the first company in the British
construction industry to receive certification for the
responsible conduct in the selection of suppliers.
Market situation still difficult
Within Europe, the construction sector is unlikely to
make significant progress in the UK, Spain or Italy. The
situation will also remain challenging in most of the
countries of Eastern and Southeastern Europe, including
Russia. In the other markets supplied by Holcim, a more
stable recovery is emerging. At present, it is difficult to
assess the speed with which it will impact demand for
construction materials and whether it is sustainable.
The programs to cut costs and adjust capacity will be
systematically pursued.
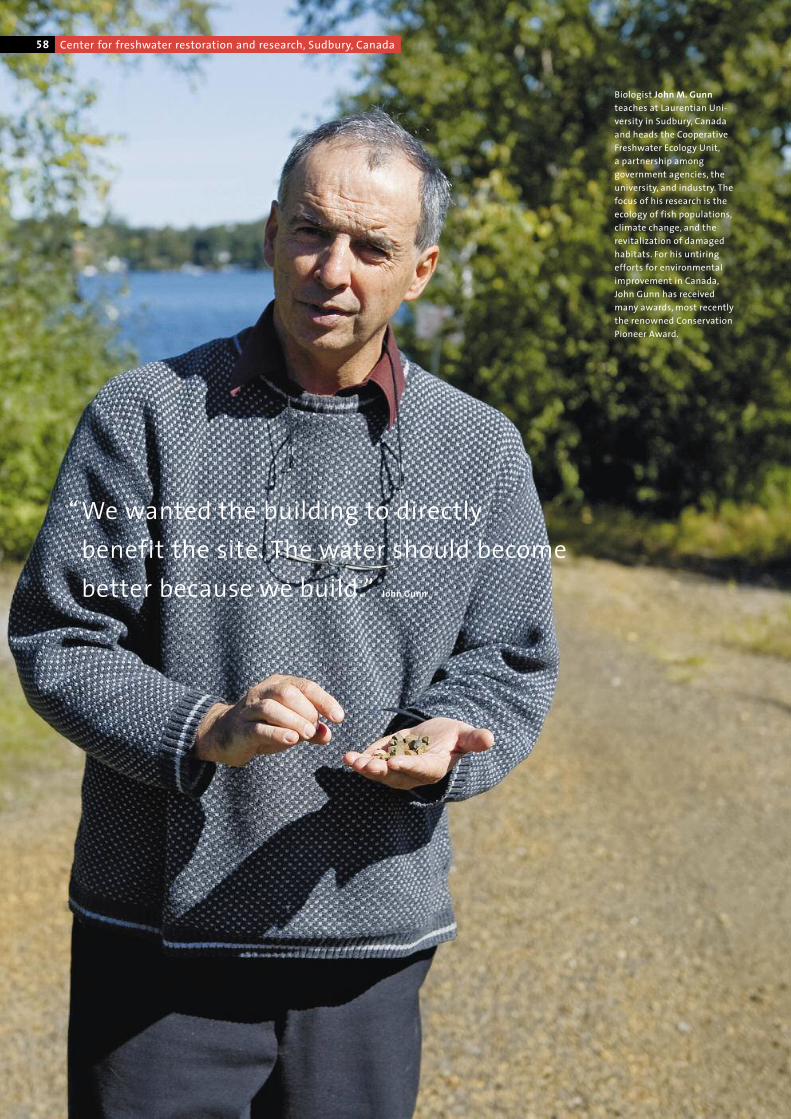
58 Center for freshwater restoration and research, Sudbury, Canada
“We wanted the building to directly
benefit the site. The water should become
better because we build.” John Gunn
Biologist John M. Gunnteaches at Laurentian Uni-versity in Sudbury, Canadaand heads the CooperativeFreshwater Ecology Unit,a partnership amonggovernment agencies, theuniversity, and industry. Thefocus of his research is theecology of fish populations,climate change, and therevitalization of damagedhabitats. For his untiringefforts for environmentalimprovement in Canada,John Gunn has receivedmany awards, most recentlythe renowned ConservationPioneer Award.
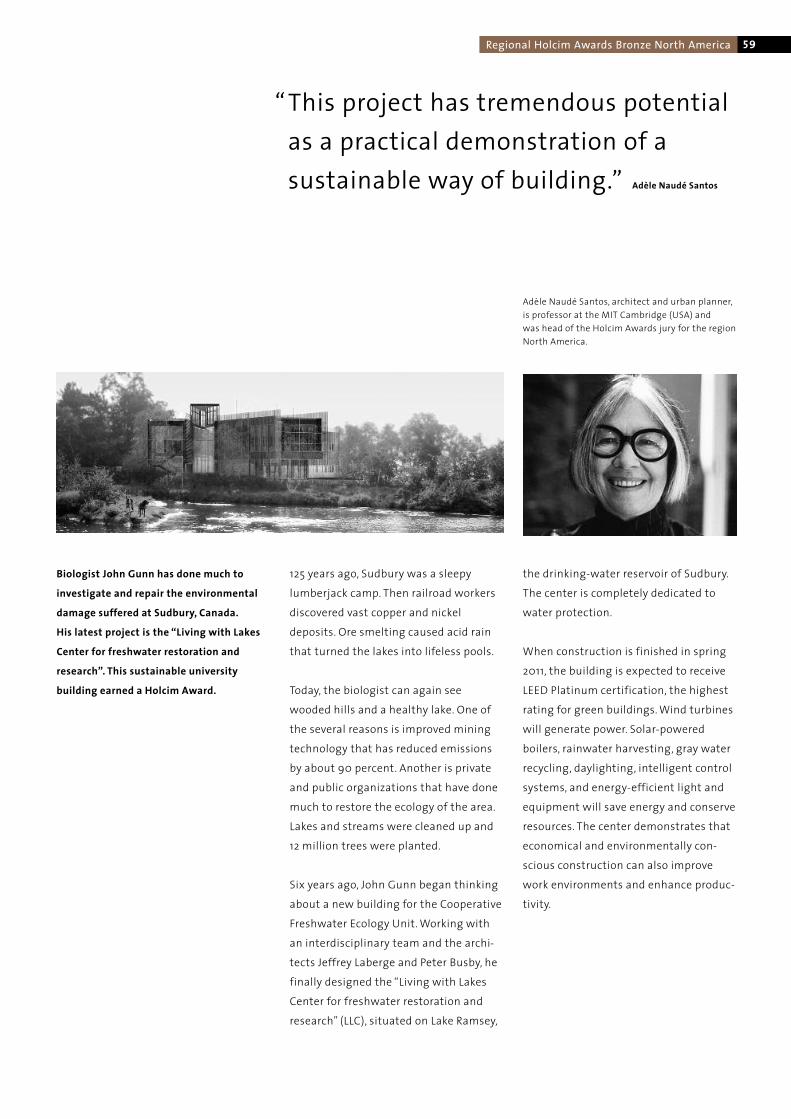
59Regional Holcim Awards Bronze North America
Biologist John Gunn has done much to
investigate and repair the environmental
damage suffered at Sudbury, Canada.
His latest project is the “Living with Lakes
Center for freshwater restoration and
research”. This sustainable university
building earned a Holcim Award.
125 years ago, Sudbury was a sleepy
lumberjack camp. Then railroad workers
discovered vast copper and nickel
deposits. Ore smelting caused acid rain
that turned the lakes into lifeless pools.
Today, the biologist can again see
wooded hills and a healthy lake. One of
the several reasons is improved mining
technology that has reduced emissions
by about 90 percent. Another is private
and public organizations that have done
much to restore the ecology of the area.
Lakes and streams were cleaned up and
12 million trees were planted.
Six years ago, John Gunn began thinking
about a new building for the Cooperative
Freshwater Ecology Unit.Working with
an interdisciplinary team and the archi-
tects Jeffrey Laberge and Peter Busby, he
finally designed the “Living with Lakes
Center for freshwater restoration and
research” (LLC), situated on Lake Ramsey,
the drinking-water reservoir of Sudbury.
The center is completely dedicated to
water protection.
When construction is finished in spring
2011, the building is expected to receive
LEED Platinum certification, the highest
rating for green buildings.Wind turbines
will generate power. Solar-powered
boilers, rainwater harvesting, gray water
recycling, daylighting, intelligent control
systems, and energy-efficient light and
equipment will save energy and conserve
resources. The center demonstrates that
economical and environmentally con-
scious construction can also improve
work environments and enhance produc-
tivity.
Adèle Naudé Santos, architect and urban planner,is professor at the MIT Cambridge (USA) andwas head of the Holcim Awards jury for the regionNorth America.
“This project has tremendous potential
as a practical demonstration of a
sustainable way of building.” Adèle Naudé Santos
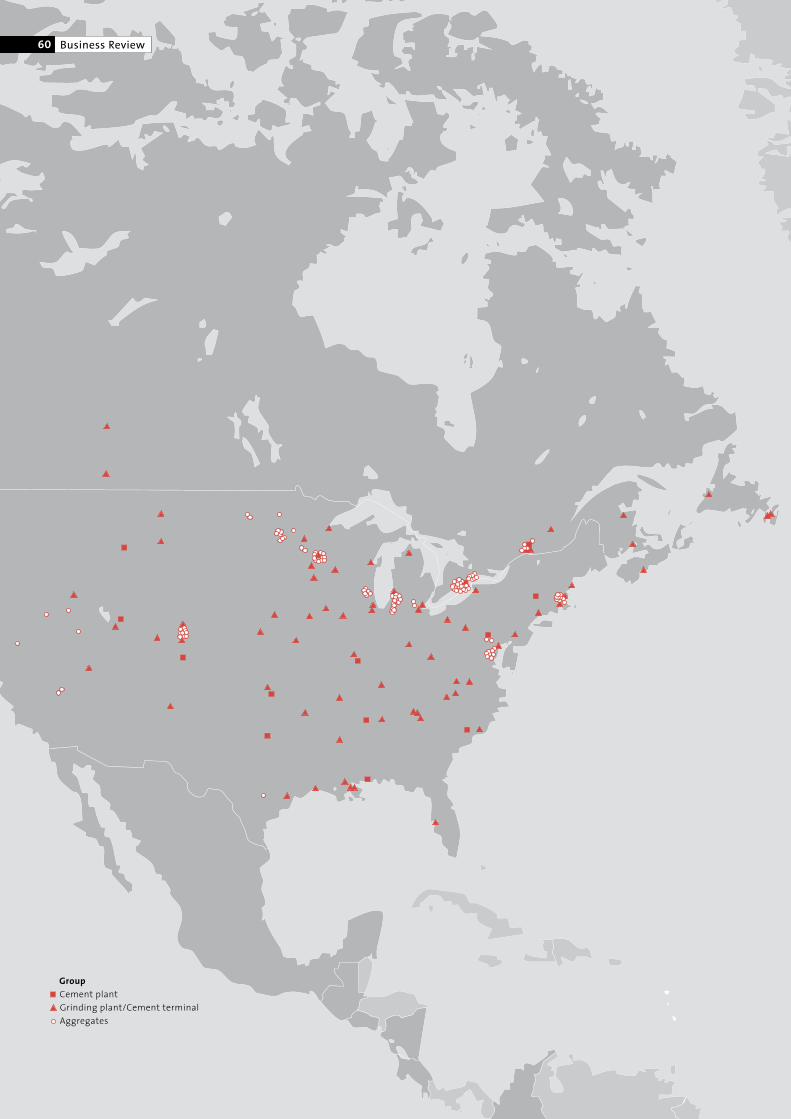
60 Business Review
GroupCement plantGrinding plant/Cement terminalAggregates
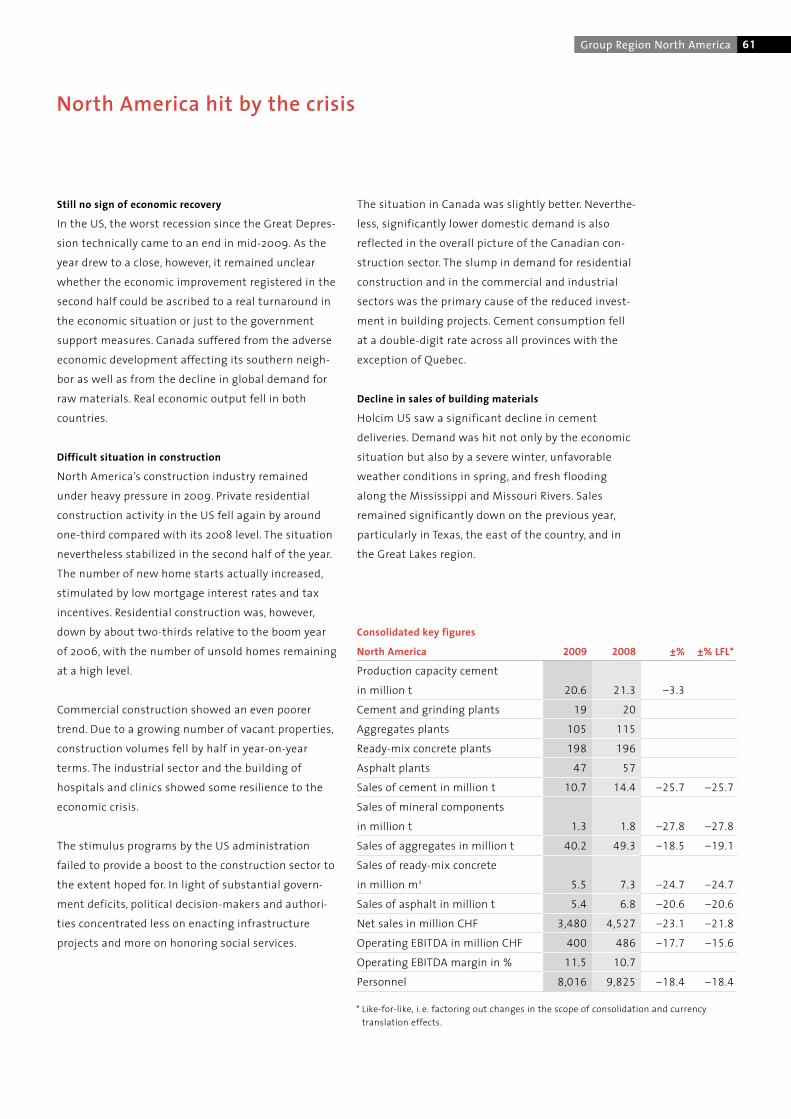
Still no sign of economic recovery
In the US, the worst recession since the Great Depres-
sion technically came to an end in mid-2009. As the
year drew to a close, however, it remained unclear
whether the economic improvement registered in the
second half could be ascribed to a real turnaround in
the economic situation or just to the government
support measures. Canada suffered from the adverse
economic development affecting its southern neigh-
bor as well as from the decline in global demand for
raw materials. Real economic output fell in both
countries.
Difficult situation in construction
North America’s construction industry remained
under heavy pressure in 2009. Private residential
construction activity in the US fell again by around
one-third compared with its 2008 level. The situation
nevertheless stabilized in the second half of the year.
The number of new home starts actually increased,
stimulated by low mortgage interest rates and tax
incentives. Residential construction was, however,
down by about two-thirds relative to the boom year
of 2006, with the number of unsold homes remaining
at a high level.
Commercial construction showed an even poorer
trend. Due to a growing number of vacant properties,
construction volumes fell by half in year-on-year
terms. The industrial sector and the building of
hospitals and clinics showed some resilience to the
economic crisis.
The stimulus programs by the US administration
failed to provide a boost to the construction sector to
the extent hoped for. In light of substantial govern-
ment deficits, political decision-makers and authori-
ties concentrated less on enacting infrastructure
projects and more on honoring social services.
North America hit by the crisis
The situation in Canada was slightly better. Neverthe-
less, significantly lower domestic demand is also
reflected in the overall picture of the Canadian con-
struction sector. The slump in demand for residential
construction and in the commercial and industrial
sectors was the primary cause of the reduced invest-
ment in building projects. Cement consumption fell
at a double-digit rate across all provinces with the
exception of Quebec.
Decline in sales of building materials
Holcim US saw a significant decline in cement
deliveries. Demand was hit not only by the economic
situation but also by a severe winter, unfavorable
weather conditions in spring, and fresh flooding
along the Mississippi and Missouri Rivers. Sales
remained significantly down on the previous year,
particularly in Texas, the east of the country, and in
the Great Lakes region.
61Group Region North America
* Like-for-like, i. e. factoring out changes in the scope of consolidation and currencytranslation effects.
Consolidated key figures
North America 2009 2008 ±% ±% LFL*
Production capacity cement
in million t 20.6 21.3 –3.3
Cement and grinding plants 19 20
Aggregates plants 105 115
Ready-mix concrete plants 198 196
Asphalt plants 47 57
Sales of cement in million t 10.7 14.4 –25.7 –25.7
Sales of mineral components
in million t 1.3 1.8 –27.8 –27.8
Sales of aggregates in million t 40.2 49.3 –18.5 –19.1
Sales of ready-mix concrete
in million m3 5.5 7.3 –24.7 –24.7
Sales of asphalt in million t 5.4 6.8 –20.6 –20.6
Net sales in million CHF 3,480 4,527 –23.1 –21.8
Operating EBITDA in million CHF 400 486 –17.7 –15.6
Operating EBITDA margin in % 11.5 10.7
Personnel 8,016 9,825 –18.4 –18.4
Holcim Canada experienced a slump in cement
exports to the US from its Mississauga plant. In the
Ontario region, weak private construction activity and
project cancellations in the commercial and industri-
al sectors also affected the Group company’s sales
volumes. As it is home to fewer recession-prone
industries, Quebec experienced a slightly milder fall
in cement volumes. Added to that, the provincial gov-
ernment was early in initiating stimulation programs
designed to counter the economic crisis. Projects in
the energy sector, as well as construction of dams
and dikes, supported sales of construction materials.
Holcim Canada’s ability to deliver efficient logistics in
remote regions was one of the key factors behind its
success in tendering for the supply of these major
construction sites.
On balance, cement deliveries in Group region North
America fell by 25.7 percent to 10.7 million tonnes.
Aggregate Industries US recorded a decline in deliver-
ies across all segments. Sales of aggregates and
ready-mix concrete were adversely affected not only
by weak construction activity but also by the fact
that weather conditions proved difficult for construc-
tion. However, government road building programs
supported sales of asphalt in the east of the country
during the second half of the year. As a supplier of
integrated multi-product solutions, the Group com-
pany was in a position to deliver significant quanti-
ties of aggregates and ready-mix concrete for the
construction of highways.
Sales of aggregates and ready-mix concrete also fell
at Holcim Canada, due to lower demand for construc-
tion materials for house building in Ontario and in
the west of the country. Government support mea-
sures positively impacted the volumes of asphalt sold.
All in all, shipments of aggregates fell 18.5 percent to
40.2 million tonnes. Sales of ready-mix concrete were
down 24.7 percent at 5.5 million cubic meters. Asphalt
saw a decline of 20.6 percent.
Rigorous cost management
Holcim US decommissioned its plants in Dundee
(Michigan) and Clarksville (Missouri). In addition,
the Artesia (Mississippi) and Mason City (Iowa)
plants were mothballed in the first quarter of 2009.
As a result, annual cement capacity fell by a total
of 3.6 million tonnes.
In July, Holcim US brought on stream its new Ste.
Genevieve plant in the state of Missouri. With an
annual capacity of 4 million tonnes of cement, the
new plant has its own port and loading facilities on
the Mississippi. Production at the cement factory,
which is exemplary in all respects – for instance, ener-
gy efficiency per tonne of cement has been improved
by around 40 percent versus the older plants in
Dundee and Clarksville – was gradually ramped
up during the second half of the year. The ability to
cost-effectively service customers along the entire
Mississippi River network was created.
Aggregate Industries US continued the measures
introduced in the previous year to lower costs and
increase efficiency. Numerous aggregates operations
and ready-mix concrete plants were mothballed.
The fleet of mixer and pump trucks was reduced
further. Holcim Canada also reduced capacity in
aggregates and ready-mix concrete.
All three Group companies pared maintenance costs
to a minimum and implemented various organiza-
tional cost management measures. As part of this,
the refocusing of operational management on four
market regions has already proved a success at
Aggregate Industries US.
Business Review62

63Group Region North America
Significantly lower operating result
Operating EBITDA for Group region North America
fell by 17.7 percent to CHF 400 million. Internal
operating EBITDA development was negative at
–15.6 percent.
The difficult market environment adversely impacted
the results of Holcim US in particular. Despite cost
savings, the Group company was only able to offset
a limited amount of the decline in volumes through
efficiency improvements. In contrast, Aggregate
Industries US achieved a remarkable improvement
in its results, also in Swiss franc terms, and Holcim
Canada likewise raised its operating EBITDA in local
currency. Overall, Holcim achieved slightly higher
operating margins in this Group region.
Continued focus on sustainable development
The company objective of environmentally sustain-
able business operations was pursued despite the
difficult market situation. Priority was given to the
substitution of conventional fuels and greater use
of alternative raw materials.
Holcim US and Holcim Canada increased the propor-
tion of petcoke used in their production of clinker.
In many instances, the Group companies had to
respond to a changing alternative fuel supply situa-
tion. The increased use of kiln exhaust heat for drying
granulated blast furnace slag enabled significant
quantities of natural gas to be saved.
Several US and Canadian cement plants were given
official approval to expand the range of alternative
fuels that can be used in the production process,
thereby further optimizing their fuel consumption.
The Joliette plant is now at the heart of a fully inte-
grated system for the collection and recycling of
asphalt shingles. Besides alternative fuels, the plant’s
own recycling platform produces good quality asphalt
that is reused as a raw material in the production of
asphalt.
Due to significantly lower steel production, less gran-
ulated blast furnace slag was available in 2009. In
Canada, growing market acceptance of composite
cements containing a higher proportion of limestone
countered this to some extent. Products of this kind,
with a low clinker factor and reduced CO2 emissions,
are in increasing demand in the market place.
Aggregate Industries US was awarded a total of 18
Green Star Certifications by the National Ready Mixed
Concrete Association in 2009. These prestigious
awards are a reflection of the high environmental
standards upheld in the production and distribution
of ready-mix concrete. Aggregate Industries US is the
first company in the sector to be awarded this recog-
nition in seven states simultaneously.
Demand for building materials remains subdued
Despite the brighter economic situation, the North
American construction industry is not expected to
enjoy a rapid recovery. In light of the economic uncer-
tainties and high real estate vacancy rates, private
construction activity in the US is likely to remain sub-
dued. The Obama administration’s stimulus program
promises to provide some help for infrastructure con-
struction in the second half of the year. In Canada,
a rather positive trend is expected for the economy
as a whole. Similarly to the US, a modest growth in
nationwide construction spending is expected.

64 Urban integration of an informal area, Medellín, Colombia
“We want to give the poor people the best –
because public space can be won back for the
people only through quality.” Gustavo Restrepo
One of the creative minds of the governmentagency is architect Gustavo Restrepo. He worksin poor and in rich quarters because “excitingchallenges are everywhere”. The governmentagency Empresa de Dessarrollo Urbano (EDU),or Urban Development Association, is conductingurban redevelopment projects in Medellín toimprove the quality of life for local residents.The 26 staff of the EDU are supported by some400 consultants.

65Regional Holcim Awards Gold Latin America
Colombian city architect Gustavo Restrepo
achieved something that hardly anyone
thought was possible. Together with his
team and local citizens, he transformed the
problematic district Comuna 13 in Medellín
into an urban quarter that offers good
quality of life. For this accomplishment,
the city official received a Holcim Award.
Violence was a great problem for many
years in Medellín. Much has changed
since then. Living conditions have per-
ceptibly improved, even in Comuna 13.
The transformation of this urban quarter
was achieved through close cooperation
among government agencies, planners,
architects, NGOs, private companies, and
local citizens.
One of the creative minds at this civic
agency is the architect Gustavo Restrepo.
He explains his concept: “We want to give
the poor people the best – for example,
schools that compare with any private
school”. Restrepo is convinced that public
space can be won back for the people
only through quality.
The start of urban renewal was not
easy. For months, the team analyzed
every conceivable aspect of the quarter.
Brochures were disseminated to invite
the local people to public orientations
and meetings. First, only few people
came, then 100, and finally 400 ap-
peared. Confidence was established,
and the citizenry began to participate
in the process.
The EDU gradually succeeded in getting
the formal and informal leaders of the
quarter on board. The architect lists the
needs: “There were too few streets, no
public spaces, no meeting places where
social life could occur. Many quarters had
not even a single tree. There were also
not enough schools and daycare centers
for small children.”
Multi-story apartment buildings for up
to ten families replaced old one-story
buildings, creating room for carefully
designed spaces in which public life can
take place.
Sustainable urban renewal is a process of
many small steps. The EDU professionals
are currently working on 180 projects,
many of which make use of Holcim prod-
ucts. The most spectacular subproject
is the new line of the Metrocable. The
aerial cableway passes directly over the
quarter. This greatly enhances the value
of the quarter and makes the residents
what they are – an important part of a
city that has started to blossom again.
José Luis Cortés, architect and urban planner,is professor at the UIA in Mexico City and washead of the Holcim Awards jury for the region La-tin America.
“This concept sustainably
changes the city – and gives people
their dignity again.” José Luis Cortés

Business Review66
GroupCement plantCapacity expansionGrinding plant/Cement terminalAggregates
ParticipationCement plantGrinding plant/Cement terminal
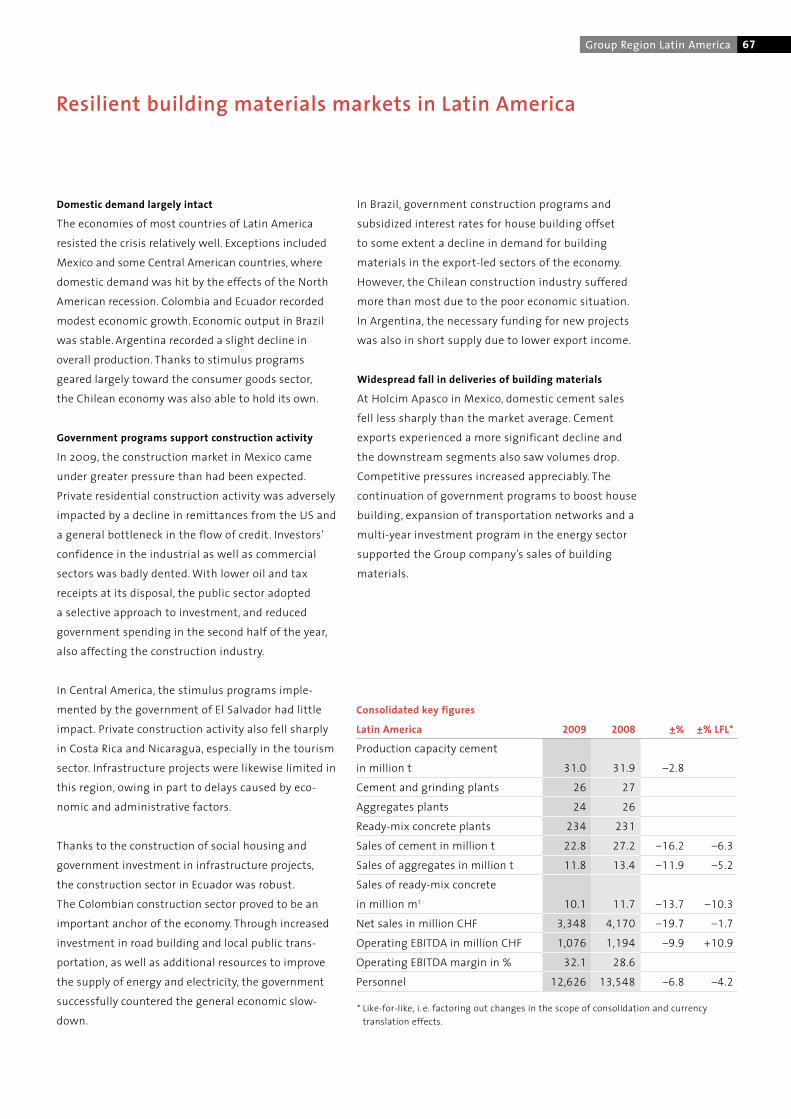
67Group Region Latin America
Domestic demand largely intact
The economies of most countries of Latin America
resisted the crisis relatively well. Exceptions included
Mexico and some Central American countries, where
domestic demand was hit by the effects of the North
American recession. Colombia and Ecuador recorded
modest economic growth. Economic output in Brazil
was stable. Argentina recorded a slight decline in
overall production. Thanks to stimulus programs
geared largely toward the consumer goods sector,
the Chilean economy was also able to hold its own.
Government programs support construction activity
In 2009, the construction market in Mexico came
under greater pressure than had been expected.
Private residential construction activity was adversely
impacted by a decline in remittances from the US and
a general bottleneck in the flow of credit. Investors’
confidence in the industrial as well as commercial
sectors was badly dented.With lower oil and tax
receipts at its disposal, the public sector adopted
a selective approach to investment, and reduced
government spending in the second half of the year,
also affecting the construction industry.
In Central America, the stimulus programs imple-
mented by the government of El Salvador had little
impact. Private construction activity also fell sharply
in Costa Rica and Nicaragua, especially in the tourism
sector. Infrastructure projects were likewise limited in
this region, owing in part to delays caused by eco-
nomic and administrative factors.
Thanks to the construction of social housing and
government investment in infrastructure projects,
the construction sector in Ecuador was robust.
The Colombian construction sector proved to be an
important anchor of the economy. Through increased
investment in road building and local public trans-
portation, as well as additional resources to improve
the supply of energy and electricity, the government
successfully countered the general economic slow-
down.
Resilient building materials markets in Latin America
In Brazil, government construction programs and
subsidized interest rates for house building offset
to some extent a decline in demand for building
materials in the export-led sectors of the economy.
However, the Chilean construction industry suffered
more than most due to the poor economic situation.
In Argentina, the necessary funding for new projects
was also in short supply due to lower export income.
Widespread fall in deliveries of building materials
At Holcim Apasco in Mexico, domestic cement sales
fell less sharply than the market average. Cement
exports experienced a more significant decline and
the downstream segments also saw volumes drop.
Competitive pressures increased appreciably. The
continuation of government programs to boost house
building, expansion of transportation networks and a
multi-year investment program in the energy sector
supported the Group company’s sales of building
materials.
* Like-for-like, i. e. factoring out changes in the scope of consolidation and currencytranslation effects.
Consolidated key figures
Latin America 2009 2008 ±% ±% LFL*
Production capacity cement
in million t 31.0 31.9 –2.8
Cement and grinding plants 26 27
Aggregates plants 24 26
Ready-mix concrete plants 234 231
Sales of cement in million t 22.8 27.2 –16.2 –6.3
Sales of aggregates in million t 11.8 13.4 –11.9 –5.2
Sales of ready-mix concrete
in million m3 10.1 11.7 –13.7 –10.3
Net sales in million CHF 3,348 4,170 –19.7 –1.7
Operating EBITDA in million CHF 1,076 1,194 –9.9 +10.9
Operating EBITDA margin in % 32.1 28.6
Personnel 12,626 13,548 –6.8 –4.2

The devastation caused by Hurricane Ida coupled
with general market weakness depressed cement
sales at Cemento de El Salvador in the final four
months of the year. The Group company also supplied
fewer building materials to neighboring countries.
Holcim Nicaragua sold less cement and ready-mix
concrete. By contrast, significant cement deliveries
for the major Pirris dam project resulted in a positive
volume trend at its sister company in Costa Rica.
Concrete road building supported sales of ready-mix
concrete.
Thanks to transportation projects such as the con-
struction of a new bus station in Quito and refurbish-
ment of the highway infrastructure in the northwest
of the country, Holcim Ecuador lifted sales across its
entire product range. Cement deliveries at Holcim
Colombia fell slightly, consistent with overall domes-
tic demand. Volumes of aggregates and ready-mix
concrete increased thanks to commercial and indus-
trial building projects and expansion of the local
public transportation network in Bogotá. The Brazilian
Group company concentrated on high-margin sales
segments and so sold less cement. Volumes of ready-
mix concrete more or less matched the previous
year despite administrative construction delays and
unfavorable weather.
Cemento Polpaico in Chile saw lower volumes across
all product categories. Aside from the market factors,
the arrival of new competitors also weighed on sales.
The Group company nevertheless succeeded in estab-
lishing a foothold in the ready-mix concrete market
for large-scale projects, thus limiting the sales decline.
Though cement shipments fell short of the previous
year’s level, Minetti in Argentina succeeded in gener-
ating strong growth in aggregates and ready-mix
concrete. The commissioning of an additional quarry
in 2008 ensured that it was prepared to meet the
demand for high-quality materials.
Consolidated cement sales in Group region Latin
America fell 16.2 percent to 22.8 million tonnes. Ship-
ments of aggregates fell by 11.9 percent to 11.8 million
tonnes, while deliveries of ready-mix concrete were
down 13.7 percent at 10.1 million cubic meters. Much
of the decline in volumes was attributable to sub-
stantial changes in the scope of consolidation in all
three segments.
Sale of shareholdings in the Caribbean and Panama
Due to the nationalization of Holcim Venezuela in
the previous year, it was no longer economically
viable to supply grinding stations and terminals in
Panama and the Caribbean with Holcim-produced
clinker and cement. For this reason, effective July 30,
2009, Holcim sold holdings in Panama, the Domini-
can Republic and Haiti, as well as terminals in the
Caribbean, to long-standing joint venture partner
Argos.
Selective capacity adjustment in individual markets
Cost-cutting measures also became inevitable in
Group region Latin America. One kiln line in each of
Mexico, El Salvador, Brazil and Argentina was moth-
balled. In Chile, a rotary kiln was closed down. Opera-
tions in aggregates plants and ready-mix concrete
facilities in several Group markets were also shut
down temporarily. All Group companies optimized
their administrative processes and implemented vari-
ous organizational measures aimed at reducing costs.
Organic growth in operating results
Operating EBITDA for Group region Latin America fell
by 9.9 percent to CHF 1,076 million. This was exclu-
sively due to the strength of the Swiss currency and
to changes in the scope of consolidation. On a like-
for-like basis, however, operating EBITDA increased
by 10.9 percent. The improvement in the results was
due in particular to a strong performance by Holcim
Ecuador, Holcim Brazil and Minetti in Argentina.
Business Review68

69Group Region Latin America
Committed to environmental protection
All Group companies systematically pursued projects
to curb emissions. Several Group companies intensi-
fied their partnerships with GTZ, the German society
for technical cooperation. In the course of drawing
up a national set of rules for integrated waste
management, Cemento de El Salvador and GTZ are
together looking at which residual materials should
be co-processed in cement kilns. Holcim Colombia
improved wastewater recycling at its ready-mix
concrete plants, and reduced its consumption of
freshwater.
Market outlook intact
Building activity will remain largely solid in Latin
America in 2010. Overall, a moderately positive
economic trend is expected. Further growth is possible
in Brazil thanks to the robust state of the domestic
economy. In Ecuador, Colombia and Argentina too,
Holcim expects the market situation to be stable.
However, in the Chilean construction sector, a recovery
is not expected in the immediate future.
Arbitration proceedings over nationalization
of Holcim Venezuela
With the decree of the Venezuelan government of
June 18, 2008, Holcim Venezuela was nationalized. To
date, Holcim has not received a legally or financially
acceptable offer of compensation from the Republic
of Venezuela. For that reason, the arbitration proceed-
ings which commenced in March 2009 continue
before the International Centre for Settlement of
Investment Disputes (ICSID) in Washington D.C.
Alternative fuels and raw materials gaining ground
The proportion of alternative fuels used in clinker
production increased in Group region Latin America,
resulting in improvements in terms of both operating
costs and environmental impact.
At its Macuspana plant, Holcim Apasco used a greater
number of the drilling cores produced by the oil
industry as an alternative fuel. The recycling of old
tires increased at the Tecomán site. At other Mexican
production sites, there was also a decline in the
proportion of traditional energy sources used in
the fuel mix. Holcim Ecuador more or less doubled
the volume of biomass in the combustion process.
The Group companies in Costa Rica and Colombia
installed additional storage and processing capacity
for alternative fuels and stepped up their use.
Holcim Brazil disposed of more contaminated soil.
In Argentina and Chile, increased use was made of
petcoke.
Progress was also made on the use of mineral compo-
nents as alternative raw materials. Holcim Costa Rica
boosted sales of an innovative composite cement,
half of which consists of natural pozzolan. Invest-
ments made by numerous Group companies in the
expansion of grinding capacity for granulated blast
furnace slag reaped rewards, specifically in Brazil and
Argentina. Following successful testing, Holcim
Colombia also prepares for the market launch of
these low-emission types of cement.
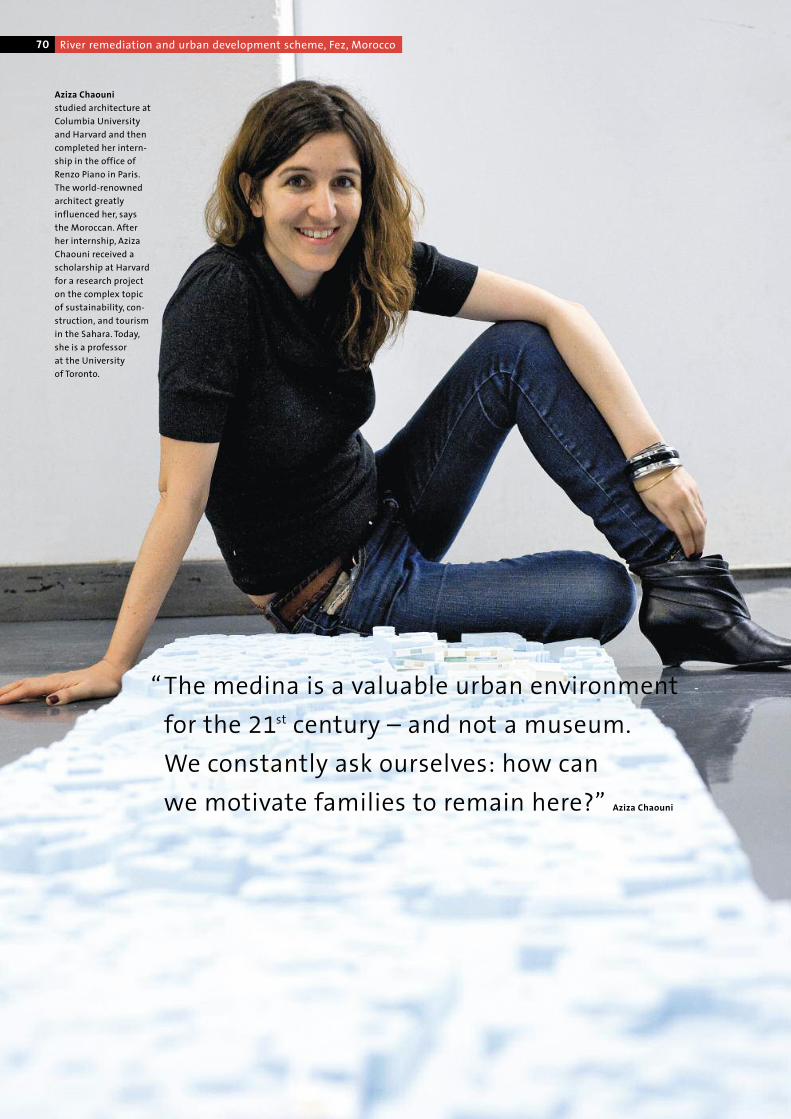
“The medina is a valuable urban environment
for the 21st century – and not a museum.
We constantly ask ourselves: how can
we motivate families to remain here?”
Aziza Chaounistudied architecture atColumbia Universityand Harvard and thencompleted her intern-ship in the office ofRenzo Piano in Paris.The world-renownedarchitect greatlyinfluenced her, saysthe Moroccan. Afterher internship, AzizaChaouni received ascholarship at Harvardfor a research projecton the complex topicof sustainability, con-struction, and tourismin the Sahara. Today,she is a professorat the Universityof Toronto.
70 River remediation and urban development scheme, Fez, Morocco
Aziza Chaouni

71Global Holcim Awards Gold
“This project is an ecological
intervention of strategic significance
and it generates countless social
improvements.” Charles Correa
Moroccan architect Aziza Chaouni will
contribute to extensive improvements.
She aims to help Fez retain its status as a
UNESCOWorld Heritage site and evolve
into a city that offers high quality of life.
Her exemplary project received a Holcim
Award at regional and global level.
Polishing the pearls of Morocco into
modern urban environments that retain
their historic character is a task that
requires care, vision, and technical
expertise. Aziza Chaouni has these
qualities. Her contribution is vitally
urgent. Because the old town of Fez
has undergone a decline that cannot
be overlooked, UNESCO threatened to
remove the city from the prestigious
World Heritage List. “That was a blow to
people’s pride”, tells Aziza Chaouni.
The project focuses on rehabilitating the
Fez River. The Fez flows right through
the medina, the old town, where some
200,000 people live. The river that once
defined the city has degenerated into a
sewage canal. It carries effluent from the
famous tanneries from Fez. Today, the
river is visible in Fez only in a few places –
as murky water and filthy banks.
But that’s changing now. A new treatment
plant provides clean water. The Fez River
is awaking to new life! In the next few
years, the slabs covering the river will be
completely removed and the Fez revital-
ized. In 2010, three more subprojects will
be conducted in the historic center, for
which Holcim will supply the concrete.
The main origin of water pollution will be
moved to an industrial zone.
For Aziza Chaouni it is clear that the
historic center must not be reduced to
a museum. Her plan aims to make the
quarter an almost completely normal
residential neighborhood for modern
urban Moroccans.
Charles Correa, architect and professor at theMIT Cambridge (USA), was head of the jury forthe Global Holcim Awards.

72
GroupCement plantGrinding plant/Cement terminalAggregates
ParticipationCement plantCapacity expansionGrinding plant/Cement terminalAggregates
Business Review
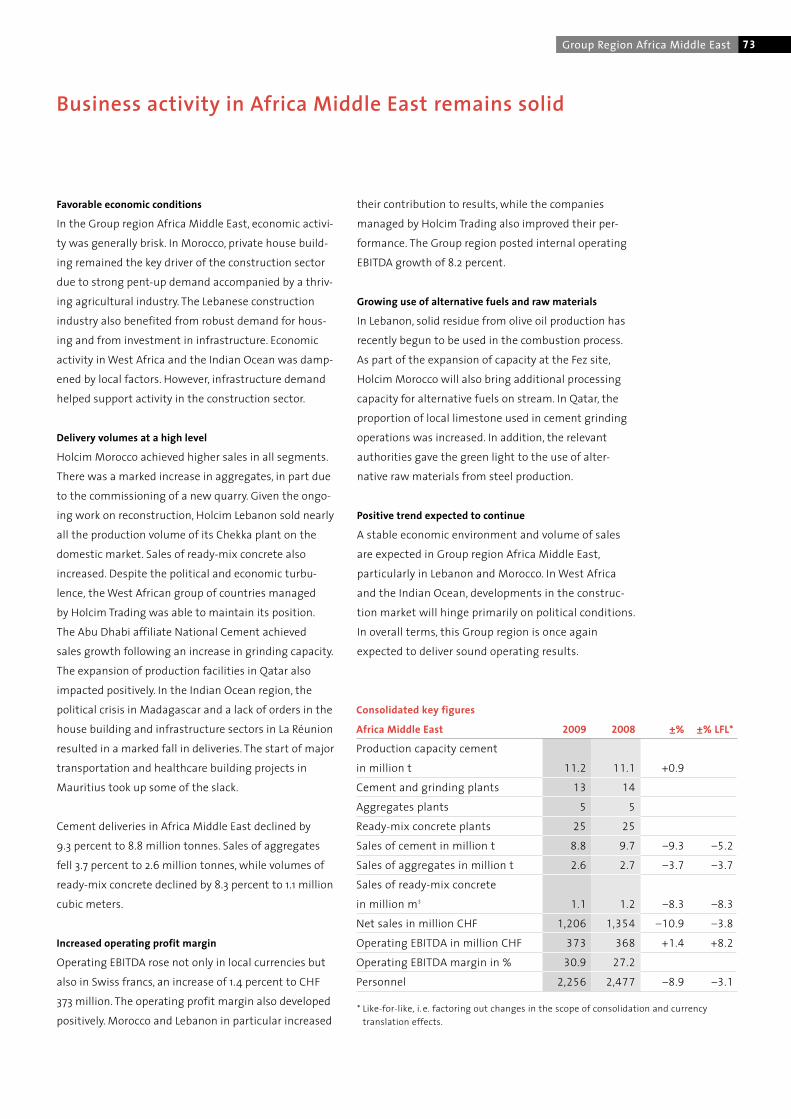
73Schlüsselfaktoren zum ErfolgGroup Region Africa Middle East
Favorable economic conditions
In the Group region Africa Middle East, economic activi-
ty was generally brisk. In Morocco, private house build-
ing remained the key driver of the construction sector
due to strong pent-up demand accompanied by a thriv-
ing agricultural industry. The Lebanese construction
industry also benefited from robust demand for hous-
ing and from investment in infrastructure. Economic
activity inWest Africa and the Indian Ocean was damp-
ened by local factors. However, infrastructure demand
helped support activity in the construction sector.
Delivery volumes at a high level
Holcim Morocco achieved higher sales in all segments.
There was a marked increase in aggregates, in part due
to the commissioning of a new quarry. Given the ongo-
ing work on reconstruction, Holcim Lebanon sold nearly
all the production volume of its Chekka plant on the
domestic market. Sales of ready-mix concrete also
increased. Despite the political and economic turbu-
lence, theWest African group of countries managed
by Holcim Trading was able to maintain its position.
The Abu Dhabi affiliate National Cement achieved
sales growth following an increase in grinding capacity.
The expansion of production facilities in Qatar also
impacted positively. In the Indian Ocean region, the
political crisis in Madagascar and a lack of orders in the
house building and infrastructure sectors in La Réunion
resulted in a marked fall in deliveries. The start of major
transportation and healthcare building projects in
Mauritius took up some of the slack.
Cement deliveries in Africa Middle East declined by
9.3 percent to 8.8 million tonnes. Sales of aggregates
fell 3.7 percent to 2.6 million tonnes, while volumes of
ready-mix concrete declined by 8.3 percent to 1.1 million
cubic meters.
Increased operating profit margin
Operating EBITDA rose not only in local currencies but
also in Swiss francs, an increase of 1.4 percent to CHF
373 million. The operating profit margin also developed
positively. Morocco and Lebanon in particular increased
Business activity in Africa Middle East remains solid
their contribution to results, while the companies
managed by Holcim Trading also improved their per-
formance. The Group region posted internal operating
EBITDA growth of 8.2 percent.
Growing use of alternative fuels and raw materials
In Lebanon, solid residue from olive oil production has
recently begun to be used in the combustion process.
As part of the expansion of capacity at the Fez site,
Holcim Morocco will also bring additional processing
capacity for alternative fuels on stream. In Qatar, the
proportion of local limestone used in cement grinding
operations was increased. In addition, the relevant
authorities gave the green light to the use of alter-
native raw materials from steel production.
Positive trend expected to continue
A stable economic environment and volume of sales
are expected in Group region Africa Middle East,
particularly in Lebanon and Morocco. InWest Africa
and the Indian Ocean, developments in the construc-
tion market will hinge primarily on political conditions.
In overall terms, this Group region is once again
expected to deliver sound operating results.
* Like-for-like, i. e. factoring out changes in the scope of consolidation and currencytranslation effects.
Consolidated key figures
Africa Middle East 2009 2008 ±% ±% LFL*
Production capacity cement
in million t 11.2 11.1 +0.9
Cement and grinding plants 13 14
Aggregates plants 5 5
Ready-mix concrete plants 25 25
Sales of cement in million t 8.8 9.7 –9.3 –5.2
Sales of aggregates in million t 2.6 2.7 –3.7 –3.7
Sales of ready-mix concrete
in million m3 1.1 1.2 –8.3 –8.3
Net sales in million CHF 1,206 1,354 –10.9 –3.8
Operating EBITDA in million CHF 373 368 +1.4 +8.2
Operating EBITDA margin in % 30.9 27.2
Personnel 2,256 2,477 –8.9 –3.1
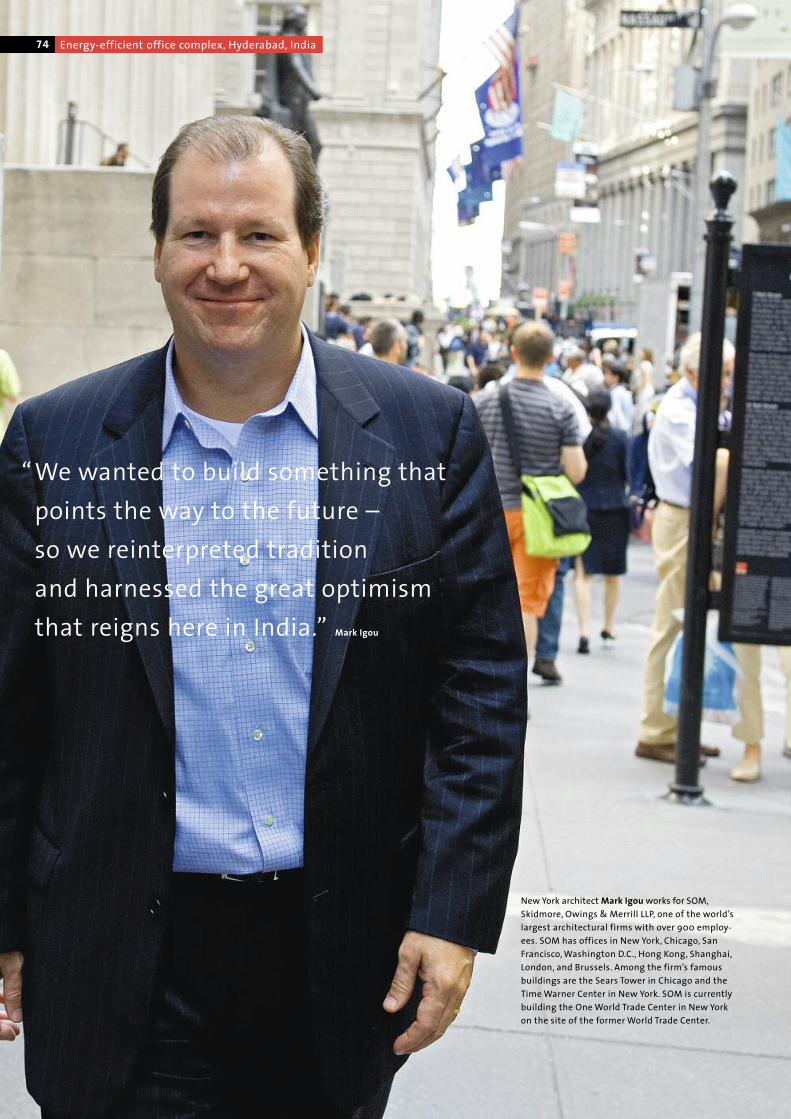
74 Energy-efficient office complex, Hyderabad, India
“We wanted to build something that
points the way to the future –
so we reinterpreted tradition
and harnessed the great optimism
that reigns here in India.”
New York architectMark Igouworks for SOM,Skidmore, Owings & Merrill LLP, one of the world’slargest architectural firms with over 900 employ-ees. SOM has offices in New York, Chicago, SanFrancisco,Washington D.C., Hong Kong, Shanghai,London, and Brussels. Among the firm’s famousbuildings are the Sears Tower in Chicago and theTimeWarner Center in New York. SOM is currentlybuilding the OneWorld Trade Center in New Yorkon the site of the former World Trade Center.
Mark Igou
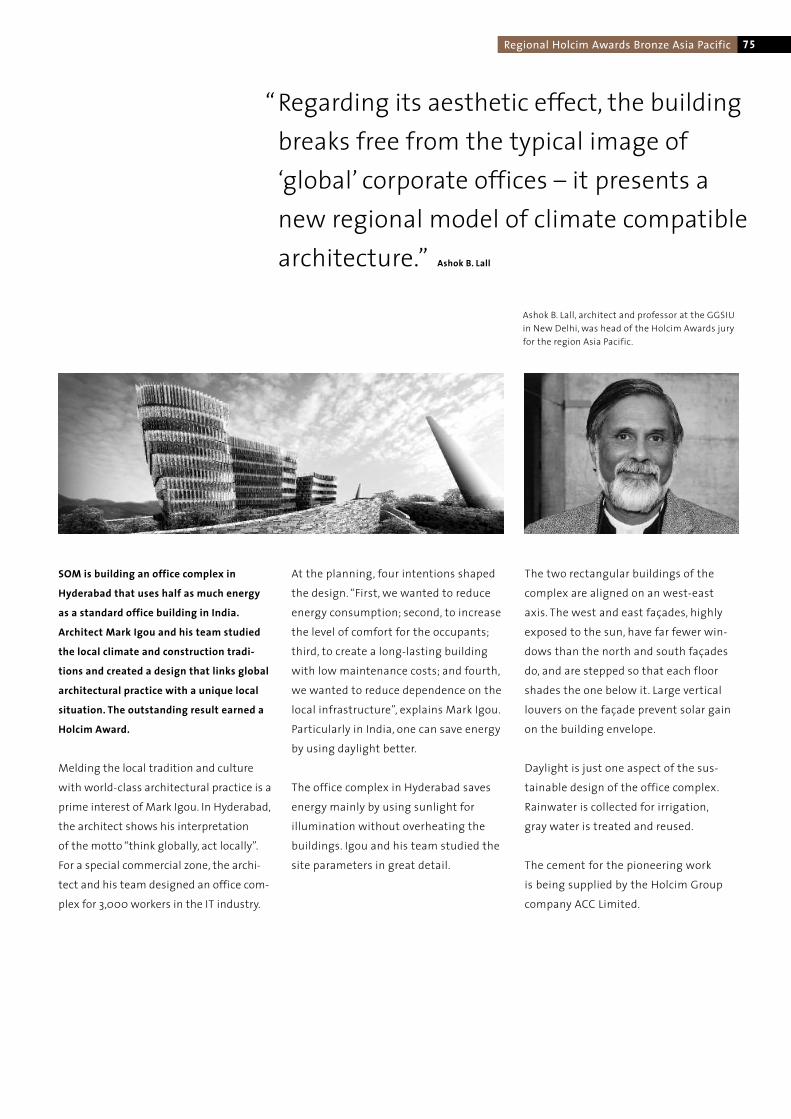
75Regional Holcim Awards Bronze Asia Pacific
SOM is building an office complex in
Hyderabad that uses half as much energy
as a standard office building in India.
Architect Mark Igou and his team studied
the local climate and construction tradi-
tions and created a design that links global
architectural practice with a unique local
situation. The outstanding result earned a
Holcim Award.
Melding the local tradition and culture
with world-class architectural practice is a
prime interest of Mark Igou. In Hyderabad,
the architect shows his interpretation
of the motto “think globally, act locally”.
For a special commercial zone, the archi-
tect and his team designed an office com-
plex for 3,000 workers in the IT industry.
At the planning, four intentions shaped
the design. “First, we wanted to reduce
energy consumption; second, to increase
the level of comfort for the occupants;
third, to create a long-lasting building
with low maintenance costs; and fourth,
we wanted to reduce dependence on the
local infrastructure”, explains Mark Igou.
Particularly in India, one can save energy
by using daylight better.
The office complex in Hyderabad saves
energy mainly by using sunlight for
illumination without overheating the
buildings. Igou and his team studied the
site parameters in great detail.
The two rectangular buildings of the
complex are aligned on an west-east
axis. The west and east façades, highly
exposed to the sun, have far fewer win-
dows than the north and south façades
do, and are stepped so that each floor
shades the one below it. Large vertical
louvers on the façade prevent solar gain
on the building envelope.
Daylight is just one aspect of the sus-
tainable design of the office complex.
Rainwater is collected for irrigation,
gray water is treated and reused.
The cement for the pioneering work
is being supplied by the Holcim Group
company ACC Limited.
Ashok B. Lall, architect and professor at the GGSIUin New Delhi, was head of the Holcim Awards juryfor the region Asia Pacific.
“Regarding its aesthetic effect, the buildingbreaks free from the typical image of‘global’ corporate offices – it presents anew regional model of climate compatiblearchitecture.” Ashok B. Lall

76
GroupCement plantCapacity expansionGrinding plant/Cement terminalCapacity expansionAggregates
ParticipationCement plantCapacity expansionGrinding plant/Cement terminal
Business Review
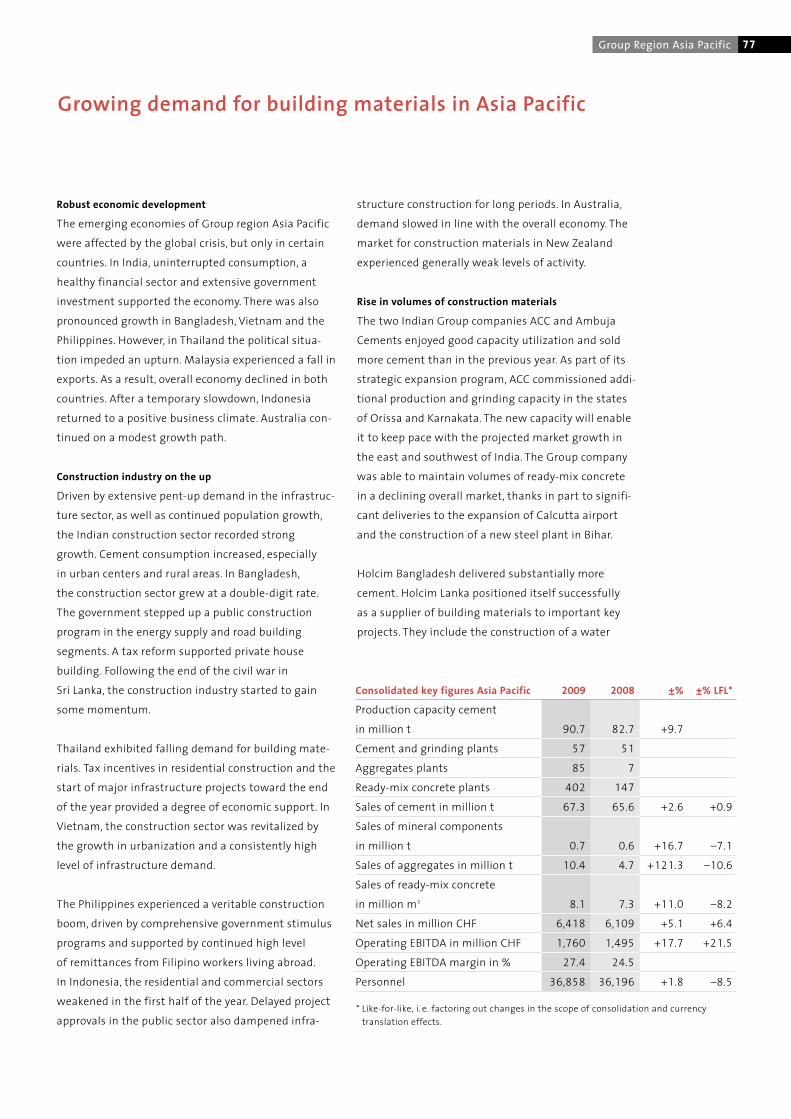
77Group Region Asia Pacific
Robust economic development
The emerging economies of Group region Asia Pacific
were affected by the global crisis, but only in certain
countries. In India, uninterrupted consumption, a
healthy financial sector and extensive government
investment supported the economy. There was also
pronounced growth in Bangladesh, Vietnam and the
Philippines. However, in Thailand the political situa-
tion impeded an upturn. Malaysia experienced a fall in
exports. As a result, overall economy declined in both
countries. After a temporary slowdown, Indonesia
returned to a positive business climate. Australia con-
tinued on a modest growth path.
Construction industry on the up
Driven by extensive pent-up demand in the infrastruc-
ture sector, as well as continued population growth,
the Indian construction sector recorded strong
growth. Cement consumption increased, especially
in urban centers and rural areas. In Bangladesh,
the construction sector grew at a double-digit rate.
The government stepped up a public construction
program in the energy supply and road building
segments. A tax reform supported private house
building. Following the end of the civil war in
Sri Lanka, the construction industry started to gain
some momentum.
Thailand exhibited falling demand for building mate-
rials. Tax incentives in residential construction and the
start of major infrastructure projects toward the end
of the year provided a degree of economic support. In
Vietnam, the construction sector was revitalized by
the growth in urbanization and a consistently high
level of infrastructure demand.
The Philippines experienced a veritable construction
boom, driven by comprehensive government stimulus
programs and supported by continued high level
of remittances from Filipino workers living abroad.
In Indonesia, the residential and commercial sectors
weakened in the first half of the year. Delayed project
approvals in the public sector also dampened infra-
Growing demand for building materials in Asia Pacific
structure construction for long periods. In Australia,
demand slowed in line with the overall economy. The
market for construction materials in New Zealand
experienced generally weak levels of activity.
Rise in volumes of construction materials
The two Indian Group companies ACC and Ambuja
Cements enjoyed good capacity utilization and sold
more cement than in the previous year. As part of its
strategic expansion program, ACC commissioned addi-
tional production and grinding capacity in the states
of Orissa and Karnakata. The new capacity will enable
it to keep pace with the projected market growth in
the east and southwest of India. The Group company
was able to maintain volumes of ready-mix concrete
in a declining overall market, thanks in part to signifi-
cant deliveries to the expansion of Calcutta airport
and the construction of a new steel plant in Bihar.
Holcim Bangladesh delivered substantially more
cement. Holcim Lanka positioned itself successfully
as a supplier of building materials to important key
projects. They include the construction of a water
* Like-for-like, i. e. factoring out changes in the scope of consolidation and currencytranslation effects.
Consolidated key figures Asia Pacific 2009 2008 ±% ±% LFL*
Production capacity cement
in million t 90.7 82.7 +9.7
Cement and grinding plants 57 51
Aggregates plants 85 7
Ready-mix concrete plants 402 147
Sales of cement in million t 67.3 65.6 +2.6 +0.9
Sales of mineral components
in million t 0.7 0.6 +16.7 –7.1
Sales of aggregates in million t 10.4 4.7 +121.3 –10.6
Sales of ready-mix concrete
in million m3 8.1 7.3 +11.0 –8.2
Net sales in million CHF 6,418 6,109 +5.1 +6.4
Operating EBITDA in million CHF 1,760 1,495 +17.7 +21.5
Operating EBITDA margin in % 27.4 24.5
Personnel 36,858 36,196 +1.8 –8.5
78
purification plant for improving supplies of drinking
water on the south of the island. Holcim Vietnam
recorded significantly higher deliveries of cement and
ready-mix concrete. Siam City Cement in Thailand
matched the previous year’s cement delivery volumes
in the domestic market and increased its clinker and
cement exports amid full utilization of its four large
kiln lines at the Saraburi plant. Shipments of aggre-
gates likewise increased. However, deliveries of ready-
mix concrete declined. In Singapore, the intense price
competition in infrastructure projects continued. The
two local Group companies therefore held back from
supplying major construction sites, focusing instead
on increasing sales in the residential sector. At Holcim
Malaysia, cement sales were supported by industrial
construction and road building on the Johor peninsula.
In the Philippines, where two Holcim cement plants
were selected to supply major road building projects
on Mindanao, volumes showed a particularly strong
increase. At the Lugait site, a kiln that had previously
been shut down was brought back into production
and exports were limited in favor of domestic demand.
Holcim Indonesia recorded stable domestic shipments.
The favorable investment climate in the region
ensured rising cement exports. Given a less dynamic
market and adverse climatic conditions, Cement
Australia – which has been fully consolidated since
the fourth quarter of 2009 – sold less cement on
the east coast in particular. Sales of aggregates by
Holcim New Zealand increased due to taking over
the management of an additional quarry, though in
overall terms volumes remained under pressure.
Cement sales in Group region Asia Pacific rose by
2.6 percent to 67.3 million tonnes. Shipments of aggre-
gates grew by 121.3 percent to 10.4 million tonnes,
and sales of ready-mix concrete rose by 11 percent
to 8.1 million cubic meters. It includes the first-time
consolidation of the newly acquired aggregates and
ready-mix concrete activities in Australia.
Marked increase in results
Operating EBITDA increased by 17.7 percent to CHF 1,760
million. The first-time inclusion of the acquisitions in
Australia had a positive impact.With few exceptions,
all Group companies beat their results for the previous
year. The improved performance of the two Indian
Group companies, as well as Holcim Philippines and
Holcim Indonesia, were remarkable achievements.
A majority of the Group companies have also signifi-
cantly improved their cost efficiency and played their
part in increasing the Group region’s operating profit
margin. The Group recorded internal operating EBITDA
growth of 21.5 percent.
Higher value creation in Australia
Following the completion of due diligence and having
received the consent of the Australian authorities,
Holcim acquired Cemex Australia effective October 1.
The purchase price of AUD 2.02 billion (equivalent to
CHF 1.73 billion) includes 100 percent of the share cap-
ital of Cemex Australia and a 25 percent shareholding
in Cement Australia, in which Holcim already held
50 percent. The new Group company, Holcim Australia,
has been fully consolidated since that date. Integrat-
ing the company, which focuses mainly on aggregates
and ready-mix concrete, into the Group proved to be a
swift process which has already largely been complet-
ed. With this acquisition, which was wholly financed
by raising share capital via a rights issue by Holcim
Ltd, the Group has made its strategy of vertical
integration in mature markets a reality in Australia.
Capital increase pending at Huaxin Cement in China
Huaxin Cement announced in spring 2009 that it
wanted to raise its share capital by means of a private
placement. The proceeds are to be used to improve
energy efficiency, reduce debt and acquire new cement
capacity. At the extraordinary general meeting on July
8, shareholders of Holcim Ltd decided to provide, in
addition to the monies for the expansion of the
Group’s presence in Australia, funds of around CHF 250
million for this private placement. At the end of 2009,
the private placement had not yet taken place.
Business Review

79Group Region Asia Pacific
Further growth expected
Population growth, major infrastructure needs and
increasing urbanization will remain key growth
drivers in Group region Asia Pacific. In a majority of
markets served by Holcim, further strong demand for
building materials can therefore be expected. In India,
expanded capacity will lay the basis for extracting
the full benefits of growing demand. The Australian
acquisition will also make a solid contribution to
the Group’s performance in 2010. In overall terms,
a further increase in volumes of building materials
can be expected in this Group region.
Geocycle extends service offering in India
The Group region made remarkable progress in its use
of alternative fuels and raw materials.
After receiving the necessary approvals, practically all
Indian plants stepped up co-processing of waste in
clinker and cement manufacturing. The service offering
comprises increased waste disposal services for
national and regional producers. The Group companies
in India also planted over two million trees in order
to increase the share of renewable energy such as
biomass in the fuel mix. Other Group companies in
Geocycle’s Asian network also increased their storage
and processing capacity for alternative heat sources.
New and highly efficient processing platforms
for environment-friendly utilization of liquid and
solid fuels came on stream in Sri Lanka, Vietnam and
Australia.
The Group companies also expanded supply sources
for mineral components for the manufacturing of low-
emission cement types. This enabled ACC in India to
secure continuous supplies of alternative raw materi-
als. Holcim Malaysia introduced innovative fly ash
based products to the market, and Siam City Cement
secured significant quantities of granulated blast fur-
nace slag for the production of composite cements via
long-term supply contracts. The Group company also
increased its reutilization of builder’s rubble in con-
crete manufacturing, while Holcim Singapore used
larger quantities of recycled copper slag in concrete
production. In Australia and New Zealand, modified
kiln feeding systems enabled the recycling of residues
from ore extraction and aluminum smelting.

80 Corporate Governance
Swiss Code of Obligations. In order to enhance the clar-
ity of this chapter, reference is made to other parts of
the Annual Report and to our website (www.holcim.com).
An overview of the duties of the Audit Committee
and the Governance, Nomination & Compensation
Committee as well as the Regulations Governing
Organization and Operations is provided on pages
82 to 85 of this report.
Group structure and shareholders
Holcim Ltd is a holding company operating under the
laws of Switzerland for an indefinite period and with its
registered office in Rapperswil-Jona (Canton of St. Gallen,
Switzerland). It has direct and indirect interests in all the
companies listed on pages 180 to 182 of the Annual Report.
The management structure as at December 31, 2009 and
its changes during 2009 are described in this chapter.
The current organizational chart is shown on page 29.
The Group is basically organized by geographical regions.
Holcim has no mutual cross-holdings in any other listed
company, nor were any shareholders’ agreements or
other agreements regarding voting or holding of Holcim
shares concluded by Holcim.
Managing responsibly
Corporate governance puts the focus not only on
business risks and the company’s reputation, but also
on corporate social responsibility for all relevant
stakeholders. As a responsible enterprise, we recognize
the significance of effective corporate governance.
We show respect for society and the environment,
communicate in an open and transparent manner
and act in accordance with legal, corporate and
ethical guidelines. To underline this, a Code of Conduct
binding on the entire Group has been part of the
mission statement since 2004.
A number of aspects merit emphasis. According to
good governance principles, at Holcim, the functions
of Chairman of the Board of Directors and CEO are
separate – a key element in ensuring a balanced
relationship between management and control.
With the exception of Markus Akermann, the CEO of
Holcim Ltd, all directors are independent within the
meaning of the Swiss Code of Best Practice for Corpo-
rate Governance. Since the introduction of a standard
registered share in 2003, the principle of “one share,
one vote” is valid.
The information published in this chapter conforms
to the Corporate Governance Directive of the SIX
Swiss Exchange (SIX) and the disclosure rules of the
Holcim has high standards when it comes to effective
corporate governance, thus ensuring responsible and
transparent company leadership and management geared
to long-term success. This is the only way to take into
consideration all the demands of our various stakeholder
groups, whether shareholders, creditors, customers, employees
or the local communities within which we operate.
Corporate Governance
81
More detailed information regarding business review,
Group structure and shareholders can be found on the
following pages of the Annual Report:
Capital structure
In 2003, the introduction of single registered shares
was a prerequisite to comply with international capi-
tal market requirements in terms of an open, trans-
parent and modern capital structure and considerably
enhanced attractiveness for institutional investors.
The share capital of Holcim Ltd is divided into the
following categories:
Share capital
The share capital is divided into 327,086,376 registered
shares of CHF 2 nominal value each. As at December
31, 2009, the nominal, fully paid-in share capital of
Holcim Ltd amounted to CHF 654,172,752.
Conditional share capital
The share capital may be raised by a nominal amount
of CHF 2,844,700 through the issuance of a maximum
of 1,422,350 fully paid-in registered shares, each with a
par value of CHF 2 (as at December 31, 2009). The con-
ditional capital may be used for exercising convertible
and/or option rights relating to bonds or similar debt
instruments of the company or one of its Group com-
panies. In the year under review, no conversion rights
have been exercised.
Authorized share capital/Certificates of participation
As at December 31, 2009, there was neither authorized
share capital nor were certificates of participation
outstanding.
Topic Page(s)
Business review
in the individual Group regions 54–79
Segment information 138–142
Principal companies 180–182
Information about
listed Group companies 35, 181
Important shareholders 196
Topic
Articles of Incorporation
Holcim Ltd www.holcim.com/corporate_governance
Code of Conduct www.holcim.com/corporate_governance
Changes in equity 194
Holcim Ltd www.holcim.com/equity
Detailed information Articles of Incorporation,
on conditional capital Art. 3bis
Key data per share 34–37, 170, 196–197
Rights pertaining Articles of Incorporation,
to the shares Art. 6, 9, 10
Regulations on 93–94
transferability of shares Articles of Incorporation,
and nominee registration Art. 4, 5
Warrants/Options 168–169
Additional information can be found as follows:

82 Corporate Governance
Board of Directors
The Board of Directors consists of 12 members, 11 of
whom are independent within the meaning of the
Swiss Code of Best Practice for Corporate Governance,
CEO Markus Akermann being the sole executive
member of the Board of Directors. According to Art. 15
of the Articles of Incorporation, all directors are share-
holders of the company.
Having reached retirement age, Lord Norman Fowler
resigned from the Board of Directors with effect from
the annual general meeting of shareholders on May 7,
2009. He has been a member of this body since 2006.
New members of the Board of Directors are introduced
in detail to the company’s areas of business.
Please see pages 96 to 99 for the biographical infor-
mation of the Board members.
The Board of Directors meets as often as business
requires, but at least four times each year. In 2009,
five regular meetings, one strategy meeting and
four meetings without the presence of the Executive
Committee were held. The Board of Directors held one
regular meeting with all members present and four
meetings each with one member excused. As a rule,
the members of the Executive Committee attended
the regular meetings of the Board as guests. The aver-
age duration of each meeting was 4.2 hours.
Composition of the Board of Directors
Rolf Soiron Chairman1
Andreas von Planta Deputy Chairman
Markus Akermann Member
Christine Binswanger Member
Erich Hunziker Member
Peter Küpfer Member2
Adrian Loader Member
H. Onno Ruding Member
Thomas Schmidheiny Member
Wolfgang Schürer Member
Dieter Spälti Member
Robert F. Spoerry Member
Elections and terms of office of the Board of Directors
The members of the Board of Directors are each
elected for a three-year term of office. Elections are
staggered such that every year approximately one-
third of the Board of Directors is standing for election.
In general, the exercise of service on the Board is
possible until the retirement age of 70 years or the
total terms of office (4 x 3 years plus additional
periods upon motion of the Governance, Nomination
& Compensation Committee) is reached.
Since 2002, the following expert committees have
been set up:
Audit Committee
The Audit Committee assists and advises the Board
of Directors in conducting its supervisory duties, in
particular with respect to the internal control systems.
It examines and reviews the reporting for the attention
of the Board of Directors and evaluates the Group’s
external and internal audit system, reviews the risk
management processes that are applied within the
Group and evaluates financing issues.
1 Governance, Nomination & Compensation Committee Chairman.2 Audit Committee Chairman.

83
Other major Swiss and foreign mandates of the Board of Directors outside the Holcim Group as at December 31, 2009
Board of Directors Mandate Position
Rolf Soiron Lonza Group Ltd, Basel* Chairman of the Board
Nobel Biocare Holding AG, Zurich* Chairman of the Board
Andreas von Planta SIX Swiss Exchange AG, Zurich Chairman of the Regulatory Board
Schweizerische National-Versicherungs-Gesellschaft, Basel* Vice Chairman of the Board
Novartis AG, Basel* Member of the Board
Christine Binswanger Herzog & de Meuron, Basel Partner
Erich Hunziker Chugai Pharmaceutical Co. Ltd., Tokyo (Japan)* Member of the Board
Genentech Inc., San Francisco (USA) Member of the Board
Peter Küpfer Julius Bär Group Ltd., Zurich* Member of the Board
Metro AG, Düsseldorf (Germany)* Member of the Supervisory Board
Adrian Loader Candax Energy Inc., Toronto (Canada)* Chairman of the Board
Air Products & Chemicals, Allentown (USA)* Member of the European
Advisory Board
GardaWorld, Montreal (Canada)* Member of the International
Advisory Board
H. Onno Ruding BNG (Bank for the Netherlands Municipalities), The Hague (Netherlands) Chairman of the Supervisory Board
Corning Inc., Corning (USA)* Member of the Board
RTL Group SA, Luxemburg* Member of the Board
Thomas Schmidheiny Schweizerische Cement-Industrie-Gesellschaft, Rapperswil-Jona Chairman of the Board
Spectrum Value Management Ltd., Rapperswil-Jona Chairman of the Board
Wolfgang Schürer Swiss Reinsurance Company, Zurich* Member of the
Swiss Re Advisory Panel
Dieter Spälti Rieter Holding AG, Winterthur* Member of the Board
Schweizerische Cement-Industrie-Gesellschaft, Rapperswil-Jona Member of the Board
Spectrum Value Management Ltd., Rapperswil-Jona Member of the Board
Robert F. Spoerry Mettler-Toledo International Inc., Greifensee* Chairman of the Board
Conzzeta Holding AG, Zurich* Member of the Board
Geberit AG, Rapperswil-Jona* Member of the Board
Schaffner Holding AG, Luterbach* Member of the Board
Sonova Holding AG, Stäfa* Member of the Board
Composition of the Audit Committee
Peter Küpfer Chairman
Andreas von Planta Member
H. Onno Ruding Member
All members are independent, which ensures the
degree of objectivity required for the Audit Committee
to exercise its function. In 2009, four regular meetings
of the Audit Committee were held. All of the meetings
were attended by all members of the committee. Three
meetings were also attended by the auditors, and at
four meetings, the Head of Group Internal Audit was
present for certain agenda items. Furthermore, the
Chairman of the Board of Directors, the CEO and the
CFO attended the meetings of the Audit Committee as
guests as well. The average duration of each meeting
was 5.3 hours. In 2009, the committee has duly taken
note of the status of the ICS (internal control system),
dealt with innovations in the field of internal direc-
tives and evaluated financing issues. The Audit
Committee’s Charter is available on our website at
www.holcim.com/corporate_governance.
Governance, Nomination & Compensation
Committee
The Governance, Nomination & Compensation
Committee supports the Board of Directors by
supervising succession planning within senior
* Listed company.

84 Corporate Governance
management and the Board of Directors and
by closely monitoring developments with regard to
financial compensation for the Board of Directors
and senior management. The committee also decides
on the compensation paid to the Executive Committee
as well as on the definition of the CEO’s targets and
the content of the latter’s performance assessment
and informs the Board of Directors as a whole of the
decisions taken.
Composition
of the Governance, Nomination & Compensation Committee
Rolf Soiron Chairman
Erich Hunziker Member
Thomas Schmidheiny Member
Wolfgang Schürer Member
The Governance, Nomination & Compensation
Committee held three regular meetings. All of the
meetings were attended by all members of the
committee. The meetings were also attended by
the CEO as a guest, insofar as he was not himself
affected by the items on the agenda. The average
duration of each meeting was 4.2 hours. The Charter
of the Governance, Nomination & Compensation
Committee may be found on our website at
www.holcim.com/corporate_governance.
Areas of responsibility
The division of responsibilities between the Board
of Directors and the Executive Committee is set out
in detail in the company’s Regulations Governing
Organization and Operations (Organizational Rules).
The Organizational Rules entered into force on May 24,
2002 and according to the Organizational Rules shall
be reviewed at least every two years and amended as
required. They were last amended in 2008.
The Organizational Rules were issued by the Board of
Directors of Holcim Ltd in accordance with the terms
of Art. 716b of the Swiss Code of Obligations and Art.
19 of the company’s Articles of Incorporation. They
stipulate the organizational structure of the Board of
Directors and the Executive Committee and govern
the tasks and powers conferred on the company’s
executive bodies. They regulate the convocation,
execution and number of meetings to be held by the
Board of Directors and the Executive Committee as
well as the requirements necessary for the passing of
respective resolutions. The Organizational Rules set
out the tasks and responsibilities of the Chairman of
the Board of Directors and the CEO. In the event that
the Chairman of the Board of Directors is not in a
position to act independently, the Organizational Rules
provide for the election of an Independent Lead Direc-
tor, such election being confirmed on a yearly basis.
The Board of Directors also has the power to estab-
lish specialist committees and, if required, ad-hoc
committees for special tasks.
As part of its non-transferable statutory tasks and
responsibilities, the Board of Directors defines the
corporate strategy, approves the consolidated budget
and reviews the professional qualifications of the
external auditors.
The Executive Committee is responsible for operational
management, preparing the business of the Board
of Directors and executing the latter’s resolutions, in
addition to development and implementation of
the corporate strategy. The Executive Committee is
empowered to issue policies and directives with
Group-wide significance; furthermore, the Executive
Committee is empowered to elect and dismiss Area
Managers, Corporate Functional Managers, Function
Heads and CEOs of Group companies as well as the
members of the Board of Directors and supervisory
bodies of the Group companies.
Under the budget approval process, the Board of
Directors defines an investment and financing ceiling.
Within this ceiling, the Executive Committee decides,
under its own authority, on financing transactions
and on one-off investments and divestments for an
amount of up to CHF 200 million. Decisions on
investments or divestments beyond this amount are
taken by the Board of Directors. The Board of Direc-
tors is periodically informed about important trans-
actions falling within the remit of the Executive
Committee.
The members of the Executive Committee may, in
concert with the CEO, delegate their tasks in relation
to their geographical areas of responsibility to Area
85
Managers or in relation to their functional areas of
responsibility to Corporate Functional Managers.
The CEO, together with the Executive Committee,
oversees Business Risk Management following
appraisal by the Audit Committee. The Board of
Directors is informed annually about the risk situation.
The CEO assesses the performance of the members
of the Executive Committee and, after advice and
assessment by the Governance, Nomination & Com-
pensation Committee, determines their objectives.
Where there is a direct conflict of interest, the
Organizational Rules require each member of the
corporate body concerned voluntarily to stand aside
prior to any discussion of the matter in question.
Members of the corporate bodies are required to
treat as confidential all information and documenta-
tion which they may obtain or view in the context of
their activities on these bodies and not to make such
information available to third parties.
All individuals vested with the power to represent the
company shall in principle have joint signatory power
at two.
Information and control instruments
of the Board of Directors
The Board of Directors determines in which manner
it is to be informed about the course of business.
Any member of the Board of Directors may demand
information on all issues relating to the Group and
the company. At meetings of the Board of Directors,
any attending members of the Executive Committee
have a duty to provide information. Outside of
meetings, any member of the Board of Directors
may request information from the CEO through the
Chairman of the Board of Directors. In addition, any
member of the Board of Directors has a right to
inspect the books and files where necessary for the
performance of his task.
1. Financial reporting
The Board of Directors receives monthly briefings on
the current course of business, adopts the quarterly
reports (with the exception of the report of the first
quarter of the year which is to be adopted and re-
leased by the Audit Committee) and releases them
for publication. The Board of Directors discusses the
Annual Report, takes note of the auditors’ reports and
submits the Annual Report to the general meeting
for approval.
With regard to Group strategy development, a strategy
plan, a five-year financial plan and an annual budget
are submitted to the Board of Directors.
2. Business Risk Management
Holcim benefits from several years of experience as
the first approach to Business Risk Management
(BRM) was implemented in 1999. Meanwhile, Holcim
has anchored the BRM process in the entire Group.
Today, it covers all consolidated Group companies and
their relevant business segments.
BRM analyzes the Group’s overall risk exposure and
supports the strategic decision-making process.
Therefore, the BRM process is closely linked with the
Group’s strategic management process. All types
of risk, from market, operations, finance and legal up
to the external business environment, are considered
including compliance and reputational aspects.
The examination of risk exposure is, however, not
restricted to an analysis of threats, but also identifies
possible opportunities.
The Group’s risk position is assessed from both top-
down and bottom-up. In addition to the Group com-
panies, senior management also conducts an annual
risk analysis. The Board of Directors analyzes the
Group’s risks at least once a year and discusses them
with the Executive Committee in the context of a
strategy meeting.
The BRM process follows a clearly defined straight
forward six step approach. In a first step, diverse
risks are assessed and prioritized regarding their
significance and likelihood. All further steps are then
focused mainly on the major risks. These top risks are
then analyzed more deeply regarding their drivers
86 Corporate Governance
through mind mapping technique. To fully complete
the assessment of the actual risk profile, a more
detailed assessment of the impact is done in the third
step. In the next two steps, decisions are made regard-
ing the treatment of individual risks, the accepted tar-
get risk profile and the necessary mitigating actions.
The last step includes continuous monitoring of the
risk and the reporting to the next higher level.
Risk information is stored in a state-of-the-art pro-
tected, centralized database which allows instant
access for all Group companies throughout the world
for effective data evaluation and fast reporting.
Within the Group companies, risk owners and respon-
sibilities for countermeasures are clearly defined.
A corporate risk management function is responsible
for the organization of the BRM process within the
Group. It assures also timeliness of the reporting on
the Group’s risk situation, which is done periodically
by the Executive Committee to the Board of Directors.
3. Internal Audit
Internal Audit provides assurance that effective
control exists to maintain process and information
integrity. For more details, see page 28. Internal Audit
reports to the Chairman of the Board of Directors and
periodically informs the Audit Committee. The mem-
bers of the Board of Directors have access to Internal
Audit at all times. The Audit Committee defines each
year audit focal points or areas of Internal Audit to be
addressed, and the Head of Internal Audit periodically
updates the Audit Committee on the activities of
Internal Audit.
Senior management
Senior management of Holcim Ltd comprises the
CEO, the members of the Executive Committee,
the Area Managers and the Corporate Functional
Managers. The tasks of senior management are
divided into different areas of responsibility in terms
of country, division and function, each of these
areas being managed by a member of the Executive
Committee. Within the scope of their field of respon-
sibility, the members of the Executive Committee
may be assisted by Area Managers and Corporate
Functional Managers.
The following changes within the Executive Commit-
tee and Area Management occurred:
The Board of Directors of Holcim Ltd has appointed
Ian Thackwray, former CEO of Holcim Philippines, a
member of the Executive Committee. He has joined
the Executive Committee at the beginning of 2010
and commenced to make himself familiar with the
regional responsibility of Executive Committee mem-
ber Tom Clough. With effect from July 1, 2010 he will
succeed Tom Clough, who will be retiring. The area of
responsibility spans the companies in East Asia, in-
cluding China, the Philippines and Oceania and South
and East Africa.
In addition, Gérard Letellier, Area Manager of Holcim
Ltd since the beginning of 2005 and responsible
for the Holcim markets in Bangladesh, Malaysia,
Singapore and Vietnam, has assumed country respon-
sibility for France within Holcim France Benelux on
January 1, 2010.
Aidan Lynam, former CEO of Holcim Vietnam, has
been appointed a new Area Manager. He has taken up
his new position on January 1, 2010, assuming country
responsibility for Bangladesh, Malaysia, Singapore,
Sri Lanka and Vietnam.

87
Executive Committee
During the year under review, the Executive Commit-
tee of Holcim Ltd comprised eight members. None of
the members of the Executive Committee has impor-
tant functions outside the Holcim Group or any other
significant commitments of interest.
Composition of the Executive Committee
Markus Akermann CEO
Urs Böhlen Member
Tom Clough Member
Patrick Dolberg Member
Paul Hugentobler Member
Thomas Knöpfel Member
Benoît-H. Koch Member
Theophil H. Schlatter CFO
Ian Thackwray1 Member1 Since the beginning of 2010.
Please see pages 100 and 101 for biographical informa-
tion on the members of the Executive Committee.
Both, regional and functional responsibility is shown
on the organizational chart on page 29.
Area Management
The individual members of the Executive Committee
are assisted by Area Managers.
Composition of the Area Management
Bill Bolsover Aggregate Industries
Javier de Benito Mediterranean,
Indian Ocean,
West Africa
Gérard Letellier1 Bangladesh,
Malaysia, Singapore,
Vietnam
Andreas Leu Colombia, Ecuador,
Argentina, Chile,
Brazil
Aidan Lynam2 Bangladesh,
Malaysia, Singapore,
Sri Lanka, Vietnam1 Until December 31, 2009.2 Since January 1, 2010.
Please see page 102 for biographical information on
Area Managers.
Corporate Functional Managers
The Corporate Functional Managers are responsible
for directing important areas of expertise and report
to the Executive Committee.
Composition of the Corporate Functional Management
Bill Bolsover Aggregates & Construction
Materials Services
Jacques Bourgon Cement Manufacturing
Services
Roland Köhler Strategy & Risk Management
Stefan Wolfensberger Commercial Services
Please see page 103 for biographical information on
Corporate Functional Managers.
Management agreements
Holcim has no management agreements in place
with companies or private individuals outside the
Group.
Remuneration report
The financial compensation for the Board of Directors
and senior management as well as compensations
for former members of governing bodies of Holcim
Ltd are published under this heading. No payments
were made to closely related parties.
Compensation policy
Board of Directors:
The members of the Board of Directors receive a fixed
fee, consisting of a set remuneration and shares in
Holcim Ltd. The Chairman and Deputy Chairman of the
Board of Directors and members of the Audit Commit-
tee or the Governance, Nomination & Compensation
Committee are paid additional compensation. The
Chairman of the Board of Directors is also insured in
the pension fund. The compensation of the Board of
Directors is defined in a set of rules which is reviewed
by the Governance, Nomination & Compensation
Committee once a year and, if necessary, adjusted.
Changes require the approval of the Board of Directors.
88 Corporate Governance
Senior management:
Senior management of Holcim Ltd includes the Execu-
tive Committee as well as the Area Managers and the
Corporate Functional Managers. The annual financial
compensation of senior management comprises a
base salary and a variable compensation with a Group
and an individual component. Members of senior
management are also insured in the pension fund.
The financial compensation of the Executive Committee
is set by the Governance, Nomination & Compensation
Committee on an annual basis and the decision is
noted by the Board of Directors as a whole. The finan-
cial compensation for the other members of senior
management is set by the CEO on an annual basis and
the decision is noted by the Governance, Nomination &
Compensation Committee. The base salary of members
of senior management is fixed and is paid in cash.
Benchmarking against the international competition is
carried out periodically on the basis of annual compen-
sation reports.
The variable compensation has a Group and an individ-
ual component and, if targets are achieved, account for
between 45 percent and 70 percent of the base salary,
depending on the function concerned. The Group com-
ponent accounts for around two thirds of the variable
compensation and depends on the Group’s financial
results. It is calculated on the basis of target attainment
in relation to operating EBITDA and the return on
invested capital (ROIC), both targets being weighted
equally. The pay-out factor comes to between 0 and 2,
depending on target attainment. The Group component
is paid in the form of registered shares of the company
(subject to a five-year sale and lease restriction period)
and a cash element of around 30 percent. Allotted shares
are valued at market price and are either taken from
treasury stock or are purchased from the market. The
individual component amounts to around one-third of
the variable salary and depends on the individual’s
performance. The individual component is paid in the
form of options on registered shares of the company
and a cash element of around 30 percent. The pay-out
factor comes to between 0 and 1, depending on target
attainment. The exercise price corresponds to the
stock market price at the grant date. The options are
restricted for a period of three years following the grant
date and have an overall maturity period of eight years.
The options are valued in accordance with the Black
Scholes model. The underlying shares are reserved on
the grant date of the options as part of treasury stock
or are purchased from the market.
The CEO’s performance is assessed annually by the
Governance, Nomination & Compensation Committee,
the Board of Directors as a whole taking due note. The
performance of the remainder of senior management
is assessed by the CEO on an annual basis, the Gover-
nance, Nomination & Compensation Committee taking
due note.
The contracts of employment of senior management
are concluded for an indefinite period of time and may
be terminated with one year’s notice. Depending on the
length of tenure with the Group, contracts concluded
before 2004 include severance compensation amount-
ing to one annual salary or two annual salaries in the
event of notice being given by the company. More
recent contracts of employment no longer include
severance compensation.
In 2009, no external advisors were consulted on the
structuring of the compensation system.
Upon appointment, members of the Executive Commit-
tee may be granted a single allocation of options on
registered shares of the company by the Governance,
Nomination & Compensation Committee. A require-
ment is that the members have been with the Group
for five years. The options are restricted for nine years
and have a maturity period of twelve years. The com-
pany reserved the underlying shares as part of treasury
stock or purchases them from the market. Single allot-
ments during the last years are shown on page 92 of
the Annual Report.
Neither shares nor options may be sold or lent until the
end of the restriction period. If a member steps down
from the Board of Directors or senior management,
the restriction period for shares and annually allocated
options remains in force without any adjustment in
terms of duration. Options allocated upon appoint-
ment to the Executive Committee and which are not
restricted shall, in principle, lapse except in the case
of retirement, death or invalidity.

89
Compensation Board of Directors/senior management 20091
Name Base salary Variable compensation Other compensation Total
Cash Shares2 Cash Shares2 Options3 Employer Others compensation
contributions
to pension plans
Rolf Soiron4 Number 1,046
CHF 595,680 80,000 33,348 50,000 759,028
Andreas von Planta5 Number 1,046
CHF 300,000 80,000 18,169 10,000 408,169
Christine Binswanger Number 1,046
CHF 80,000 80,000 5,801 10,000 175,801
Lord Norman Fowler Number 436
CHF 33,334 33,334 0 4,166 70,834
Erich Hunziker6 Number 1,046
CHF 100,000 80,000 8,069 10,000 198,069
Peter Küpfer7 Number 1,046
CHF 180,000 80,000 11,331 10,000 281,331
Adrian Loader Number 1,046
CHF 80,000 80,000 0 10,000 170,000
H. Onno Ruding8 Number 1,046
CHF 110,000 80,000 7,726 10,000 207,726
Thomas Schmidheiny6 Number 1,046
CHF 126,40012 80,000 9,401 10,000 225,801
Wolfgang Schürer6 Number 1,046
CHF 100,000 80,000 8,069 10,000 198,069
Dieter Spälti Number 1,046
CHF 80,000 80,000 7,059 10,000 177,059
Robert F. Spoerry Number 1,046
CHF 80,000 80,000 5,801 10,000 175,801
Total Board of Directors Number 11,942
(non-executive members) CHF 1,865,414 913,334 114,774 154,166 3,047,688
Markus Akermann9 10 Number 0 5,582 27,851
CHF 2,070,000 0 458,766 426,800 490,735 513,324 33,693 3,993,318
Total senior management11 Number 0 34,546 131,631
CHF 14,176,000 0 2,480,409 2,641,388 2,319,340 4,787,272 817,162 27,221,571
1 Compensation for the Board of Directors and senior management is disclosed gross of withholding tax and employee social security contributions.“Other compensation” includes employer contributions to pension plans (state old age and survivors insurance [AHV]/disability insurance [IV], pension funds)as well as a lump sum allowance, long-service benefits, government child payments, etc. The parameters for the fair value calculation of shares and optionsallocated in the year under review are disclosed on page 169 under “Share compensation plans”. Prior-year information is disclosed on page 175.
2 The shares were valued at the average market price in the period from January 1, 2010 to February 15, 2010 and are subject to a five-year sale restriction period.3 Value of the options according to the Black Scholes model at the time of allocation.4 Chairman, Chairman of the Governance, Nomination & Compensation Committee.5 Deputy Chairman and Member of the Audit Committee.6 Member of the Governance, Nomination & Compensation Committee.7 Chairman of the Audit Committee.8 Member of the Audit Committee.9 Executive member of the Board of Directors, CEO.10 Member of senior management receiving the highest compensation.11 Including executive member of the Board of Directors, CEO.12 Including director’s fees from subsidiary companies.

90 Corporate Governance
Compensation for the Board of Directors
and senior management
The table shown on page 89 discloses the compensa-
tion of the Board of Directors in 2009 in detail and
those of the 15 members of senior management in
aggregate.
Compensation for former members of governing bodies
In the year under review, an amount of CHF 1,340,400
was paid to six former members of governing bodies.
Shareholdings and loans
The details shown relate to members of the governing
bodies.
Shares and options owned by the Board of Directors
At the end of 2009, non-executive members of the
Board of Directors held a total of 59,708,758 registered
shares in Holcim Ltd. These numbers comprised
privately acquired shares and those allocated under
profit-sharing and compensation schemes. As of the
end of the 2009 financial year, non-executive mem-
bers of the Board of Directors did not hold any options
from compensation and profit-sharing schemes.
Until the disclosure or announcement of market-rele-
vant information or projects, the Board of Directors,
senior management and any employees involved are
prohibited from effecting transactions with equity
securities or other financial instruments of Holcim Ltd,
exchange-listed Group companies or potential target
companies (trade restriction period).
Stock of shares and options Board of Directors as at December 31, 20091
Name Position Total number Total number
of shares of call options
Rolf Soiron Chairman, Governance, Nomination &
Compensation Committee Chairman 34,667
Andreas von Planta Deputy Chairman 8,462
Christine Binswanger Member 1,714
Erich Hunziker Member 8,704
Peter Küpfer Member, 83,2882
Audit Committee Chairman 8,703 31,0003
Adrian Loader Member 5,468
H. Onno Ruding Member 4,595
Thomas Schmidheiny Member 59,567,887
Wolfgang Schürer Member 41,408
Dieter Spälti Member 20,017
Robert F. Spoerry Member 7,133
Total Board of Directors
(non-executive members) 59,708,758 114,288
1 From allocation, shares are subject to a five-year sale restriction period.2 Exercise price: CHF 110; Ratio: 1.0411:1; Style: European; Maturity: 21.5.2010.3 Exercise price: CHF 80; Ratio: 1:1; Style: American; Maturity: 12.11.2013.

91
Shares and options owned by senior management
As at December 31, 2009, the executive member of the
Board of Directors and the members of senior man-
agement held a total of 369,475 registered shares in
Holcim Ltd. This figure includes both privately acquired
shares and those allocated under the Group’s profit-
sharing and compensation schemes. Furthermore,
at the end of 2009, senior management held a total
of 890,685 share options; these arise as a result of the
compensation and profit-sharing schemes of various
years. Options are issued solely on registered shares
of Holcim Ltd. One option entitles to subscribe to one
registered share of Holcim Ltd.
Stock of shares and options senior management as at December 31, 20091
Name Position Total number Total number
of shares of call options
Markus Akermann Executive Member of the Board of Directors,
CEO 83,847 234,065
Urs Böhlen Member of the Executive Committee 13,052 58,545
Tom Clough Member of the Executive Committee 23,254 83,688
Patrick Dolberg Member of the Executive Committee 7,714 41,029
Paul Hugentobler Member of the Executive Committee 70,720 93,124
Thomas Knöpfel Member of the Executive Committee 31,493 89,633
Benoît-H. Koch Member of the Executive Committee 25,448 83,772
Theophil H. Schlatter Member of the Executive Committee, CFO 56,836 108,303
Bill Bolsover Area Manager
and Corporate Functional Manager 6,438 12,531
Javier de Benito Area Manager 15,256 16,618
Gérard Letellier Area Manager 10,156 17,726
Andreas Leu Area Manager 7,092 5,719
Jacques Bourgon Corporate Functional Manager 6,590 14,059
Roland Köhler Corporate Functional Manager 6,802 16,908
Stefan Wolfensberger Corporate Functional Manager 4,777 14,965
Total senior management 369,475 890,685
1 From allocation, shares are subject to a five-year and options to a three-year and nine-year sale restriction period respectively.

92 Corporate Governance
Number1 Number1
2009 2008
January 1 550,003 490,101
Decrease due to retirements 0 (78,281)
Granted and vested (individual component of variable compensation) 340,682 71,083
Granted and vested (single allotment) 0 67,100
Forfeited 0 0
Exercised 0 0
Lapsed 0 0
December 31 890,685 550,003
Of which exercisable at the end of the year 179,108 128,567
Option grant date Expiry date Exercise price1 Number1
2002 2014 CHF 67.15 201,300
2003 2012 CHF 33.85 48,775
2003 2015 CHF 67.152 33,550
2004 2013 CHF 63.35 34,341
2004 2016 CHF 67.152 33,550
2005 2014 CHF 74.54 71,423
2006 2014 CHF 100.69 58,573
2007 2015 CHF 125.34 49,674
2008 2016 CHF 104.34 71,083
2008 2020 CHF 67.152 67,100
2009 2017 CHF 38.26 385,124
Total 1,054,493
The share options outstanding held by senior
management (including former members) have the
following expiry dates and exercise prices:
1 Adjusted to reflect former share splits and/or capital increases.2 Valued according to the single allocation in 2002.
Movements in the number of share options out-
standing held by senior management are as follows:
Due to extraordinary trade restrictions in 2008, the
expiry date of the annual options granted for the
years 2003 to 2005 has been extended by one year.
In 2008, options have been allocated to two new
Executive Committee members.
93
The chair of the meeting may also have votes and
elections conducted electronically. Electronic votes and
elections are deemed equivalent to secret votes and
elections.
Convocation of the general meeting and agenda rules
The ordinary general meeting of shareholders takes
place each year, at the latest six months following the
conclusion of the financial year. It is convened by the
Board of Directors, whereby invitations are published
at least twenty days prior to the meeting and in which
details are given of the agenda and items submitted.
Shareholders representing shares with a par value
of at least one million Swiss francs may request the
addition of a particular item for discussion. A corre-
sponding application must be submitted in writing
to the Board of Directors at least forty days prior to
the annual general meeting. Such application should
indicate the items to be submitted. The invitations as
well as the minutes of the general meetings shall be
published on www.holcim.com/AGM2010.
Entries in the share register
The company maintains a share register for regis-
tered shares in which the names and addresses of
owners and beneficiaries are entered. Only those in-
cluded in the share register are deemed shareholders
or beneficial owners of the registered shares. Upon
request, purchasers of registered shares shall be
included in the share register as shareholders with
voting rights if they expressly declare that they have
acquired the shares in their own name and for their
own account. The Board of Directors shall enter in the
share register as having voting rights those persons
who have not expressly declared in their application
for registration that the shares are held for their own
account (nominees). However, this only applies if
the nominee has reached an agreement with the
company regarding this position and is subject to a
recognized banking or financial markets supervisory
authority.
Loans granted to members of governing bodies
As at December 31, 2009, there were no loans outstand-
ing, which were granted to members of senior manage-
ment. There were no loans to members of the Board
of Directors or to parties closely related to members
of governing bodies.
Shareholders’ participation
Voting rights and representation restrictions
All holders of registered shares who are entered as
shareholders with voting rights in the share register at
the date communicated in the invitation to the annual
general meeting (approximately one week prior to the
annual general meeting) are entitled to participate in,
and vote at, general meetings. Shares held by trusts
and shares for which no declaration has been made in
the context of the regulations of the Board of Directors
governing the entry of shareholders in the share regis-
ter of Holcim Ltd are entered in the share register as
having no voting rights. Shareholders not participating
in person in the annual general meeting may be repre-
sented by another shareholder, by the bank, by the
company as representative of the governing body or by
the independent voting rights representative. Voting
rights are not subject to any restrictions. Each share
carries one vote.
Statutory quorums
The annual general meeting of shareholders normally
constitutes a quorum, regardless of the number of
shares represented or shareholders present; resolu-
tions are passed by an absolute majority of the votes
allocated to the shares represented, unless Art. 704
para. 1 of the Swiss Code of Obligations provides other-
wise. In such cases, resolutions may only be passed
with a two-thirds majority of the votes represented.
According to Art. 10 para. 2 of the Articles of Incorpora-
tion and in addition to Art. 704 para. 1, the approval of
at least two-thirds of the votes represented and the
absolute majority of the par value of shares repre-
sented shall be required for resolutions of the annual
general meeting of shareholders with respect to the
removal of the restrictions set forth in Art. 5 of the
Articles of Incorporation (entries in the share register),
the removal of the mandatory bid rule (Art. 22 para. 3
of the Stock Exchange Act), the removal or amendment
of this para. 2 of Art. 10 of the Articles of Incorporation.

94 Corporate Governance
Auditors
As part of their auditing activity, the auditors inform
the Audit Committee and the Executive Committee
regularly about their findings and about proposals
for improvement. Considering the reporting and
assessments by the Group companies, the Audit
Committee estimates the performance of the auditors
and their remuneration in line with market conditions.
The Audit Committee provides recommendations to
the auditors and makes suggestions for improvement.
In 2009, the auditors participated in three meetings
of the Audit Committee to discuss individual agenda
items.
Ernst & Young Ltd, Zurich, were appointed in 2002
as auditors to Holcim Ltd. Ernst & Young partner
Christoph Dolensky (since 2004) is responsible for
managing the audit mandate supported since 2007
by partner Willy Hofstetter. The rotation of the lead
auditor will be carried out in accordance with the
statutory provisions in Art. 730a of the Swiss Code of
Obligations. The auditors are elected for a one-year
term by the annual general meeting.
The share register is closed approximately one week
prior to the date of the annual general meeting (the
exact date will be communicated in the invitation
to the annual general meeting). Shareholders’ partici-
pation and rights of protection are furthermore
governed by the Swiss Code of Obligations.
This information comprises excerpts from the Articles
of Incorporation of Holcim Ltd. The full version of
the Articles of Incorporation can be retrieved at
www.holcim.com/corporate_governance.
Changes of control and defense measures
The Articles of Incorporation contain no waiver of the
duty to make a public offer under the terms of Art. 32
and 52 of the Swiss Stock Exchange Act (“opting out”).
The result is that a shareholder who directly, indirectly
or in concert with third parties acquires shares in the
company and, together with the shares he already
possesses, thereby exceeds the 331⁄3 percent threshold
of voting rights in the company must make an offer for
all listed shares of the company.
There are no clauses relating to changes of control.

95
Information policy
Holcim Ltd reports to shareholders, the capital market,
employees and the public at large in a transparent
and timely manner concerning its corporate perfor-
mance and progress regarding sustainability targets.
We nurture an open dialog with our most important
stakeholders, based on mutual respect and trust.
This enables us to promote an understanding of our
objectives, strategy and business activities, and ensure
a high degree of awareness about our company.
As a listed company, Holcim Ltd is committed to
disclose facts that may materially affect the share
price (ad-hoc disclosure, Art. 53 and 54 of the SIX listing
rules). Members of the Board of Directors and senior
management are subject to SIX rules on the disclosure
of management transactions. These can be accessed
on the SIX website (www.six.swiss-exchange.com).
The most important information tools are the annual
and quarterly reports, the website (www.holcim.com),
media releases, press conferences, meetings for finan-
cial analysts and investors as well as the annual
general meeting.
Our commitment to sustainability is described on
pages 44 to 51 of this Annual Report. Current informa-
tion relating to sustainable development is available
at www.holcim.com/sustainable. In 2010, Holcim Ltd
will publish its fifth sustainability report.
The financial reporting calendar is shown on pages 37
and 202 of this Annual Report.
Should you have any specific queries regarding
Holcim, please contact:
Corporate Communications, Roland Walker
Phone +41 58 858 87 10, Fax +41 58 858 87 19
Investor Relations, Bernhard A. Fuchs
Phone +41 58 858 87 87, Fax +41 58 858 80 09
1 This amount includes the fees for the individual audits of Group companies carried out by Ernst & Young as well as their fees for auditingthe Group financial statements.
2 Audit-related services comprise, among other things, amounts for due diligences, comfort letters, accounting advice, informationsystems reviews and reviews on internal controls.
3 Other services include, among other things, amounts for accounting, actuarial and legal advisory services.
Million CHF 2009 2008
Audit services1 11.9 15.3
Audit-related services2 2.5 1.7
Tax services 0.6 0.5
Other services3 0.1 0.7
Total 15.1 18.2
The following fees were charged for professional
services rendered to the Group by Ernst & Young in
2009 and 2008:
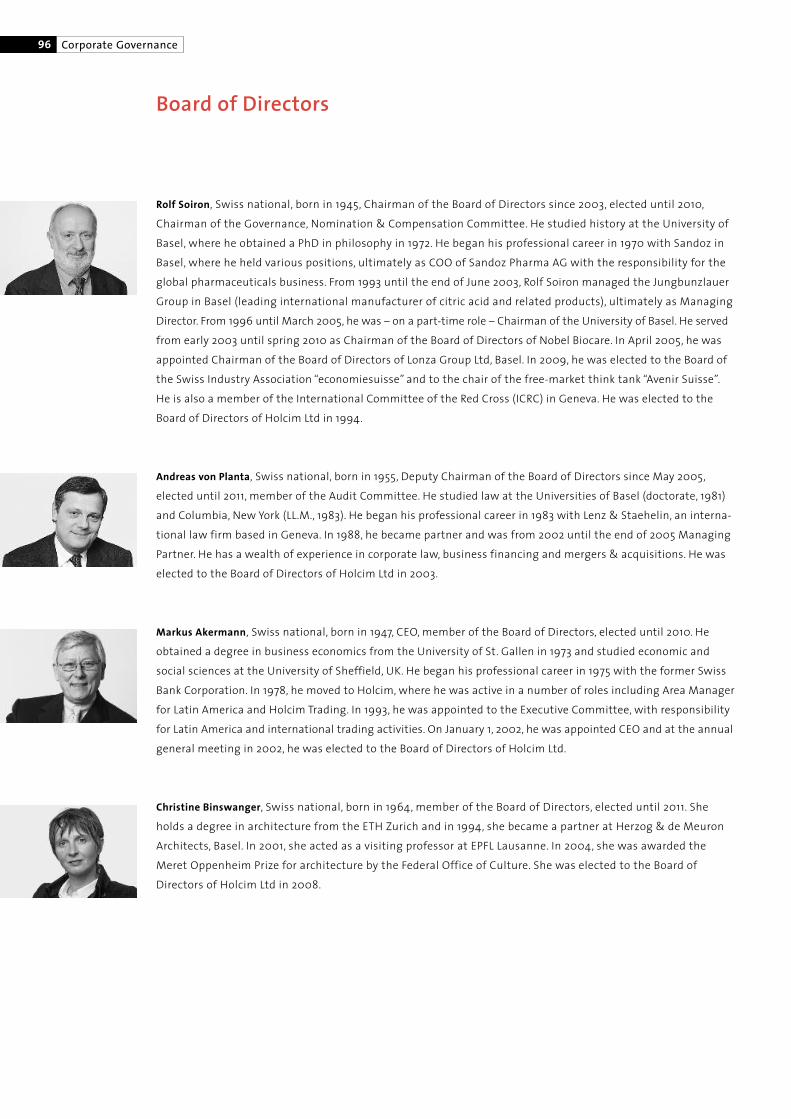
96 Corporate Governance
Rolf Soiron, Swiss national, born in 1945, Chairman of the Board of Directors since 2003, elected until 2010,
Chairman of the Governance, Nomination & Compensation Committee. He studied history at the University of
Basel, where he obtained a PhD in philosophy in 1972. He began his professional career in 1970 with Sandoz in
Basel, where he held various positions, ultimately as COO of Sandoz Pharma AG with the responsibility for the
global pharmaceuticals business. From 1993 until the end of June 2003, Rolf Soiron managed the Jungbunzlauer
Group in Basel (leading international manufacturer of citric acid and related products), ultimately as Managing
Director. From 1996 until March 2005, he was – on a part-time role – Chairman of the University of Basel. He served
from early 2003 until spring 2010 as Chairman of the Board of Directors of Nobel Biocare. In April 2005, he was
appointed Chairman of the Board of Directors of Lonza Group Ltd, Basel. In 2009, he was elected to the Board of
the Swiss Industry Association “economiesuisse” and to the chair of the free-market think tank “Avenir Suisse”.
He is also a member of the International Committee of the Red Cross (ICRC) in Geneva. He was elected to the
Board of Directors of Holcim Ltd in 1994.
Andreas von Planta, Swiss national, born in 1955, Deputy Chairman of the Board of Directors since May 2005,
elected until 2011, member of the Audit Committee. He studied law at the Universities of Basel (doctorate, 1981)
and Columbia, New York (LL.M., 1983). He began his professional career in 1983 with Lenz & Staehelin, an interna-
tional law firm based in Geneva. In 1988, he became partner and was from 2002 until the end of 2005 Managing
Partner. He has a wealth of experience in corporate law, business financing and mergers & acquisitions. He was
elected to the Board of Directors of Holcim Ltd in 2003.
Markus Akermann, Swiss national, born in 1947, CEO, member of the Board of Directors, elected until 2010. He
obtained a degree in business economics from the University of St. Gallen in 1973 and studied economic and
social sciences at the University of Sheffield, UK. He began his professional career in 1975 with the former Swiss
Bank Corporation. In 1978, he moved to Holcim, where he was active in a number of roles including Area Manager
for Latin America and Holcim Trading. In 1993, he was appointed to the Executive Committee, with responsibility
for Latin America and international trading activities. On January 1, 2002, he was appointed CEO and at the annual
general meeting in 2002, he was elected to the Board of Directors of Holcim Ltd.
Christine Binswanger, Swiss national, born in 1964, member of the Board of Directors, elected until 2011. She
holds a degree in architecture from the ETH Zurich and in 1994, she became a partner at Herzog & de Meuron
Architects, Basel. In 2001, she acted as a visiting professor at EPFL Lausanne. In 2004, she was awarded the
Meret Oppenheim Prize for architecture by the Federal Office of Culture. She was elected to the Board of
Directors of Holcim Ltd in 2008.
Board of Directors

97
Erich Hunziker, Swiss national, born in 1953, member of the Board of Directors, elected until 2011, member of the
Governance, Nomination & Compensation Committee. He studied industrial engineering at the ETH Zurich,
obtaining a PhD in 1983. In the same year, he joined Corange AG (holding company for the Boehringer Mannheim
group), where he was appointed CFO in 1997 and among other things managed a project handling the financial
aspects of the sale of the Corange group to F. Hoffmann-La Roche AG. From 1998 until 2001, he was CEO at the
Diethelm group and Diethelm Keller Holding AG. Since 2001, he has served as CFO of F. Hoffmann-La Roche AG
and is a member of the Executive Committee. In 2005, he was appointed as Deputy Head of Roche’s Corporate
Executive Committee, in addition to his function as Chief Financial Officer. Since 2004, he is a member of the
Board of Genentech Inc., USA. In 2006, he was elected to the Board of Directors of Chugai Pharmaceutical Co. Ltd.,
Japan. He was elected to the Board of Directors of Holcim Ltd in 1998.
Peter Küpfer, Swiss national, born in 1944, member of the Board of Directors, elected until 2010, Chairman of the
Audit Committee. As a Swiss Certified Accountant, he began his career with Revisuisse Pricewaterhouse AG in
Basel and Zurich, where he became a member of management. From 1985 until 1989, he was CFO at Financière
Credit Suisse First Boston and CS First Boston, New York; from 1989 until 1996, he was at CS Holding, Zurich, as
a member of the Executive Board. He has been an independent business consultant since 1997. He was elected
to the Board of Directors of Holcim Ltd in 2002.
Adrian Loader, British national, born in 1948, member of the Board of Directors, elected until 2012. Adrian
Loader holds an Honours Degree in History of Cambridge University and is a Fellow of the Chartered Institute
of Personnel and Development. He began his professional career at Bowater in 1969 and joined Shell the
following year. Until 1998, he held various management positions in Latin America, Asia, Europe and on corporate
level. In 1998, he was appointed President of Shell Europe Oil Products and became Director for Strategic
Planning, Sustainable Development and External Affairs in 2004. Since 2005, he was Director of the Strategy
and Business Development Directorate of Royal Dutch Shell and became President and CEO of Shell Canada in
2007, retiring from Shell at the end of the year. In January 2008, he joined the Board of Toronto-based Candax
Energy Inc. and was appointed Chairman. He was elected to the Board of Directors of Holcim Ltd in 2006.
H. Onno Ruding, Dutch national, born in 1939, member of the Board of Directors, elected until 2010, member of
the Audit Committee. He studied economics at the Netherlands School of Economics (now Erasmus University)
in Rotterdam (master in 1964, doctorate in 1969). He worked at the Ministry of Finance, The Hague (1965–1970),
AMRO Bank, Amsterdam (1971–1976) and, later, as a member of the Board of Managing Directors of AMRO
(1981–1982). He was elected to the Executive Board of the International Monetary Fund in Washington D.C. in
1976 and served four years. In 1982, he became the Minister of Finance in The Netherlands until the end of 1989.
He became Director of Citibank in 1990 and was from 1992 until his retirement in 2003 Vice Chairman and
Director of Citibank in New York. He is also Chairman of the Board of the Centre for European Policy Studies
(CEPS) in Brussels. He was elected to the Board of Directors of Holcim Ltd in 2004.

98 Corporate Governance
Thomas Schmidheiny, Swiss national, born in 1945, member of the Board of Directors, elected until 2012, member
of the Governance, Nomination & Compensation Committee. He studied mechanical engineering at the ETH
Zurich and complemented his studies with an MBA from the IMD Lausanne (1972). In 1999, he was awarded an
honorary doctorate for his services in the field of sustainable development from Tufts University, Massachusetts,
USA. He began his career in 1970 as Technical Director with Cementos Apasco and was appointed to the Executive
Committee of Holcim in 1976, where he held the office of Chairman from 1978 until 2001. He was elected to the
Board of Directors of Holcim Ltd in 1978 and became Chairman of the Board in 1984 until 2003.
Wolfgang Schürer, Swiss national, born in 1946, member of the Board of Directors, elected until 2012, member
of the Governance, Nomination & Compensation Committee. He studied economic and social sciences at the
University of St. Gallen, where he was awarded an honorary doctorate in 1999. He is Chairman of the Board
of Directors and CEO of MS Management Service AG, St. Gallen (international consultancy firm focusing on
strategy and risk evaluation for multinational firms in Europe, North America, the Middle East and Asia as well
as mandates in the international regulatory environment). He is also Distinguished Professor in the Practice of
International Business Diplomacy at Georgetown University, School of Foreign Service, Washington D.C. and a
regular visiting Professor for Public Affairs at the University of St. Gallen. Since 2006, he serves as a member of
Swiss Re’s Advisory Panel. He was elected to the Board of Directors of Holcim Ltd in 1997.
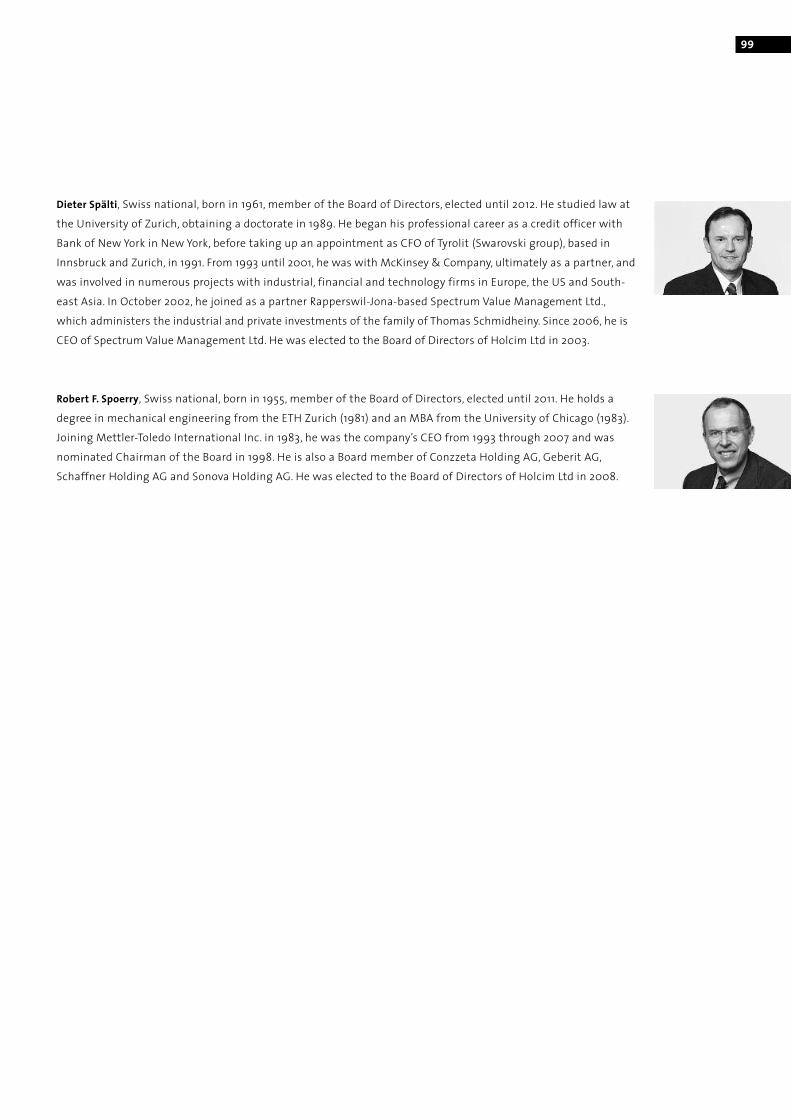
99
Dieter Spälti, Swiss national, born in 1961, member of the Board of Directors, elected until 2012. He studied law at
the University of Zurich, obtaining a doctorate in 1989. He began his professional career as a credit officer with
Bank of New York in New York, before taking up an appointment as CFO of Tyrolit (Swarovski group), based in
Innsbruck and Zurich, in 1991. From 1993 until 2001, he was with McKinsey & Company, ultimately as a partner, and
was involved in numerous projects with industrial, financial and technology firms in Europe, the US and South-
east Asia. In October 2002, he joined as a partner Rapperswil-Jona-based Spectrum Value Management Ltd.,
which administers the industrial and private investments of the family of Thomas Schmidheiny. Since 2006, he is
CEO of Spectrum Value Management Ltd. He was elected to the Board of Directors of Holcim Ltd in 2003.
Robert F. Spoerry, Swiss national, born in 1955, member of the Board of Directors, elected until 2011. He holds a
degree in mechanical engineering from the ETH Zurich (1981) and an MBA from the University of Chicago (1983).
Joining Mettler-Toledo International Inc. in 1983, he was the company’s CEO from 1993 through 2007 and was
nominated Chairman of the Board in 1998. He is also a Board member of Conzzeta Holding AG, Geberit AG,
Schaffner Holding AG and Sonova Holding AG. He was elected to the Board of Directors of Holcim Ltd in 2008.

100 Corporate Governance
Markus Akermann, please refer to the section Board of Directors on page 96 for his biographical information.
Urs Böhlen, Swiss national, born in 1950. Urs Böhlen studied business administration at the University of Berne,
graduating in 1977, and complemented his education at the Stanford Business School in 1991. From 1977 to 1979,
he served as Project Manager in the accounts division at Union Bank of Switzerland. From 1980 until 1985,
he was Head of Controlling at Autophon AG. He joined Holcim in 1985; after holding various positions, he was
entrusted with overall management of the former Cementfabrik “Holderbank” at Rekingen in 1989. From 1992
until 1998, he served as CEO of Holcim Switzerland and subsequently has been Area Manager of Holcim Ltd,
responsible for Eastern Europe and the CIS/Caspian region. As member of the Executive Committee, he has
taken over responsibility for Eastern/Southeastern Europe and the CIS/Caspian region effective November 1,
2008.
Tom Clough, British national, born in 1947. Tom Clough has a Bachelor’s degree in Mining Engineering from the
University of Leeds. Following three years working as a mining engineer, he joined Imperial Chemical Industries
(ICI) in 1974. From 1988 to 1994, he worked for global minerals and specialty chemicals group ECC International.
In 1997, after some years as an independent consultant, he joined Holcim and assumed diverse management
tasks in Asia. He was appointed CEO of Holcim’s Philippine Group company in 1998 and, following Holcim’s
entry into the Indonesian market in 2001, Chief Executive of Jakarta-based PT Holcim Indonesia Tbk. He joined
the Holcim Executive Committee in 2004, with responsibility for East Asia including the Philippines and Oceania
as well as South and East Africa.
Patrick Dolberg, Belgian national, born in 1955. Patrick Dolberg has an MBA from the Solvay Business School,
Belgium. He began his professional career with Exxon Chemical. From 1984 to 1986, he worked in sales and
marketing with the Unilever Group and Exxon Chemical. Subsequently, he held executive positions with Exxon
Chemical International and Monsanto. Patrick Dolberg joined the Holcim Group in 1991. From 1992 to the end of
1996, he was General Manager of Scoribel, a Belgian Group company of Holcim. In 1997, he assumed management
responsibility for a Holcim Group company in Australia. Patrick Dolberg was appointed CEO of St. Lawrence
Cement (now Holcim Canada) at the end of 1998 and has been CEO of Holcim US since March 2003. As member
of the Executive Committee, he has assumed responsibility for Belgium, France, the Netherlands, Germany,
Switzerland and Italy effective November 1, 2008.
Executive Committee

101
Paul Hugentobler, Swiss national, born in 1949. Paul Hugentobler has a degree in civil engineering from the ETH
Zurich and a degree in economic science from the University of St. Gallen. He joined what is now Holcim Group
Support Ltd in 1980 as Project Manager and in 1994 was appointed Area Manager for Holcim Ltd. From 1999
until 2000, he also served as CEO of Siam City Cement, headquartered in Bangkok, Thailand. He has been a
member of the Executive Committee since January 1, 2002 with the responsibility for South Asia and ASEAN
excluding the Philippines.
Thomas Knöpfel, Swiss national, born in 1951. Thomas Knöpfel obtained a doctorate in law from the University of
Zurich in 1982. He also holds a Master of Law degree in US business and financial law and is a licensed attorney.
In 1986, he joined the former Union Bank of Switzerland, before beginning his career with Holcim in 1988.
After a period as member of senior management of Holcim (España), S.A. and from 1995 as CEO of Holcim
(Colombia) S.A., he was in 1999 appointed Area Manager, with responsibility for various Group companies in
Latin America. Since January 1, 2003, he has been a member of the Executive Committee, with responsibility
for Group region Latin America.
Benoît-H. Koch, French and Brazilian national, born in 1953. Benoît-H. Koch completed his education as an
engineer at the ETH Zurich. He joined Holcim in 1977, occupying various positions at Group companies in Brazil,
France, Belgium and Switzerland until 1992. He has been a member of the Executive Committee since 1992 and
is currently responsible for North America, the UK and Norway, the Mediterranean including Iberian Peninsula
and International Trade.
Theophil H. Schlatter, Swiss national, born in 1951. Theophil H. Schlatter graduated in business economics at the
University of St. Gallen and is a Swiss Certified Accountant. He began his career as a public accountant at
STG Coopers & Lybrand. After six years, he moved to Holcim Group Support Ltd, where he was active for a
further six years in Corporate Controlling. From 1991 until 1995, he was Head of Finance and a member of the
Executive Committee of Sihl Papier AG. He then served as CFO and a member of the Management Committee
of Holcim Switzerland for two years. He has been CFO and a member of the Executive Committee of Holcim Ltd
since 1997.
Ian Thackwray, British national, born in 1958. Ian Thackwray holds an MA (Hons) in Chemistry from Oxford
University and is also a chartered accountant. After his studies, he joined Price Waterhouse and handled major
corporate accounts in Europe. In 1985, he started a career with Dow Corning Corporation, serving in various
management roles in Europe, North America and particularly in Asia. From 2004 to 2006, he served as Dow
Corning’s Asian/Pacific President based out of Shanghai. Since September 2006, he has been CEO of Holcim
Philippines. In 2009, the Board of Directors of Holcim Ltd has appointed him a member of the Executive
Committee. He has joined the Executive Committee at the beginning of 2010 and commenced to make himself
familiar with the regional responsibility of Executive Committee member Tom Clough. With effect from July 1,
2010 he will succeed Tom Clough, who will be retiring. The area of responsibility spans the companies in East
Asia including China, the Philippines and Oceania and South and East Africa.
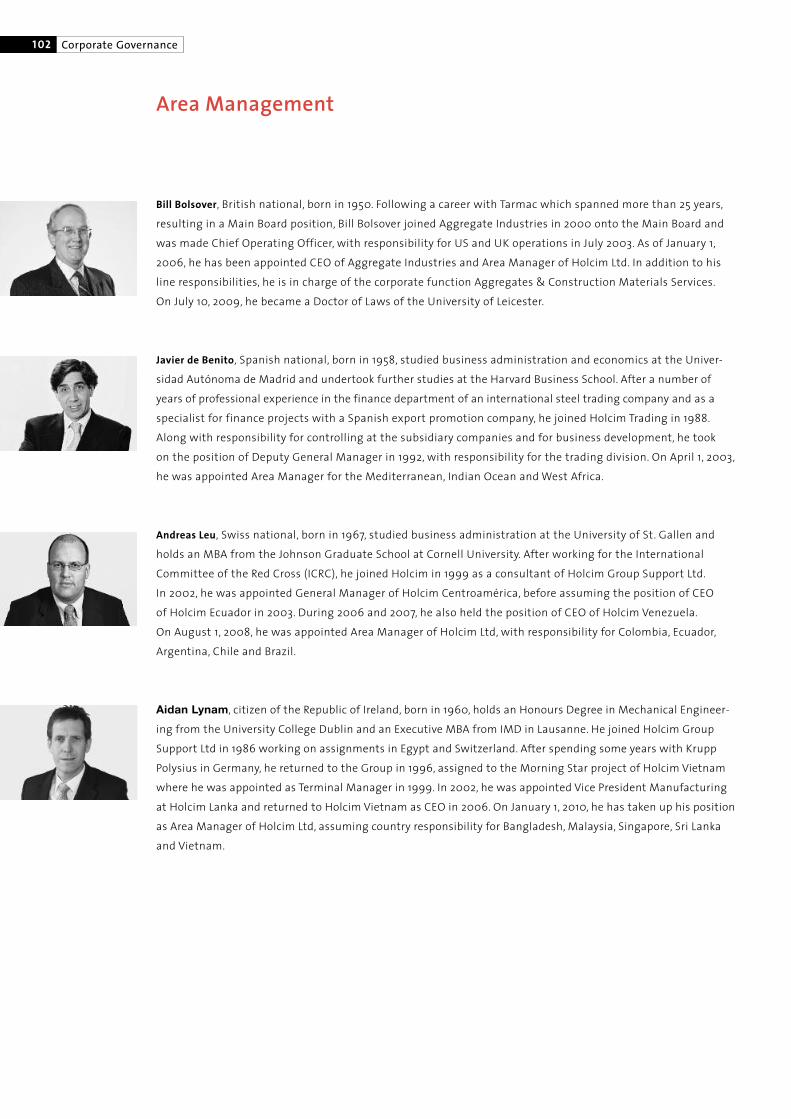
102 Corporate Governance
Area Management
Bill Bolsover, British national, born in 1950. Following a career with Tarmac which spanned more than 25 years,
resulting in a Main Board position, Bill Bolsover joined Aggregate Industries in 2000 onto the Main Board and
was made Chief Operating Officer, with responsibility for US and UK operations in July 2003. As of January 1,
2006, he has been appointed CEO of Aggregate Industries and Area Manager of Holcim Ltd. In addition to his
line responsibilities, he is in charge of the corporate function Aggregates & Construction Materials Services.
On July 10, 2009, he became a Doctor of Laws of the University of Leicester.
Javier de Benito, Spanish national, born in 1958, studied business administration and economics at the Univer-
sidad Autónoma de Madrid and undertook further studies at the Harvard Business School. After a number of
years of professional experience in the finance department of an international steel trading company and as a
specialist for finance projects with a Spanish export promotion company, he joined Holcim Trading in 1988.
Along with responsibility for controlling at the subsidiary companies and for business development, he took
on the position of Deputy General Manager in 1992, with responsibility for the trading division. On April 1, 2003,
he was appointed Area Manager for the Mediterranean, Indian Ocean and West Africa.
Andreas Leu, Swiss national, born in 1967, studied business administration at the University of St. Gallen and
holds an MBA from the Johnson Graduate School at Cornell University. After working for the International
Committee of the Red Cross (ICRC), he joined Holcim in 1999 as a consultant of Holcim Group Support Ltd.
In 2002, he was appointed General Manager of Holcim Centroamérica, before assuming the position of CEO
of Holcim Ecuador in 2003. During 2006 and 2007, he also held the position of CEO of Holcim Venezuela.
On August 1, 2008, he was appointed Area Manager of Holcim Ltd, with responsibility for Colombia, Ecuador,
Argentina, Chile and Brazil.
Aidan Lynam, citizen of the Republic of Ireland, born in 1960, holds an Honours Degree in Mechanical Engineer-
ing from the University College Dublin and an Executive MBA from IMD in Lausanne. He joined Holcim Group
Support Ltd in 1986 working on assignments in Egypt and Switzerland. After spending some years with Krupp
Polysius in Germany, he returned to the Group in 1996, assigned to the Morning Star project of Holcim Vietnam
where he was appointed as Terminal Manager in 1999. In 2002, he was appointed Vice President Manufacturing
at Holcim Lanka and returned to Holcim Vietnam as CEO in 2006. On January 1, 2010, he has taken up his position
as Area Manager of Holcim Ltd, assuming country responsibility for Bangladesh, Malaysia, Singapore, Sri Lanka
and Vietnam.
103
Bill Bolsover, please refer to the section Area Management on page 102 for his biographical information.
Jacques Bourgon, French national, born in 1958. Jacques Bourgon, a graduate in mechanical engineering of the
Ecole Catholique d’Arts et Métiers, Lyon, and a postgraduate of Harvard Business School, joined Holcim in 1990
and occupied several positions at Holcim Apasco in Mexico, mainly as Plant Manager in Tecomán and later
responsible for cement operations as member of Holcim Apasco Senior Management. He has been Head of
Corporate Engineering at Holcim Group Support Ltd in Switzerland since mid-2001 and promoted Corporate
Functional Manager, Cement Manufacturing Services, effective January 1, 2005. Jacques Bourgon is member
of the Industrial Advisory Board of the Department of Mechanical and Process Engineering of the Swiss Federal
Institute of Technology (ETH) Zurich since 2008.
Roland Köhler, Swiss national, born in 1953. Roland Köhler, a graduate in business administration from the
University of Zurich, joined building materials group Hunziker (Switzerland) in 1988 as Head of Finance and
Administration and has transferred to Holcim as a management consultant in 1994. From 1995 to 1998, he was
Head of Corporate Controlling and from 1999 to end 2001 Head of Business Risk Management. Since 2002,
he has headed Corporate Strategy & Risk Management. Effective January 1, 2005, Roland Köhler has been
promoted to Corporate Strategy & Risk Manager.
Stefan Wolfensberger, Swiss national, born in 1957. Stefan Wolfensberger has a doctorate from the ETH Zurich
and also completed postgraduate studies at Stanford University in the USA. He joined Holcim in 1987 as a
management consultant. From 1990 to 1994, he was assistant to a member of the Executive Committee. He
was subsequently appointed CEO of a Belgian construction materials group. From 1997, he headed the Mineral
Components/Product Development service function. He has been Head of Commercial Services since October
2004. Effective January 1, 2005, Stefan Wolfensberger has been promoted to Corporate Commercial Services
Manager.
Corporate Functional Managers
104 Financial Information
This discussion and analysis of the Group’s financial condition
and results of operations should be read in conjunction with
the shareholders’ letter, the individual reports for the Group
regions, the consolidated financial statements and the notes
thereon. The quarterly reports contain additional information
on the Group regions and business performance.
Overview
The ongoing turmoil in the financial sector intensified at the
beginning of the year under review and had a negative impact
on the global real economy. This had major knock-on effects on
the construction sector in most mature markets, particularly
the US, UK, Spain, Eastern Europe and Russia. However, market
development in Asia was positive, above all in India, but also the
Philippines and Indonesia benefited from a favorable economic
environment. Latin America held up well too.
The cost-cutting program and rapid reduction in capacity in
markets with weak demand – both of which were initiated in
2008 – had a positive impact on fixed costs right along the
entire value chain. Fixed costs were down CHF 857 million
on a like-for-like basis. Accordingly, Holcim has substantially
exceeded the CHF 600 million target.
Aside from the aforementioned rigorous cost-cutting drive,
lower energy costs and the generally stable price situation also
had a positive impact on the statement of income. On top of
that, some European Group companies were able to sell CO2
emission certificates for a total profit of CHF 90 million (2008:
34). In India, it was necessary to buy in clinker to meet strong
demand. Thanks to the cost savings, there was an improvement
in operating EBITDA margins in the cement and aggregates
segments. Only in the other construction materials and services
segment resulted a slight reduction. Compared to the previous
year, overall EBITDA margin increased slightly to 21.9 percent.
On the financial markets, the difficult situation eased as the
year progressed. In 2009, Holcim refinanced a volume of around
CHF 7.8 billion on the capital markets and was therefore able to
considerably extend the average term of its debt. At the end of
the year, Holcim had an extremely solid balance sheet and high
levels of liquidity.
On October 1, 2009, Holcim acquired 100 percent of the share
capital of Holcim Australia (formerly Cemex Australia) including
its 25 percent interest in Cement Australia. Following this acqui-
sition, Holcim’s shareholding in Cement Australia increased
from 50 percent to 75 percent. Correspondingly, the previously
proportionate-consolidated shareholding in Cement Australia
was fully consolidated with effect from October 1, 2009. As a
result of this acquisition, net sales increased by CHF 417 million,
operating EBITDA by CHF 87 million and cash flow from operat-
ing activities by CHF 91 million in the fourth quarter of 2009.
Egyptian Cement Company, United Cement Company of Nigeria,
Holcim Venezuela, Panamá Cement and the interests in the
Caribbean were taken out of the scope of consolidation. Egyptian
Cement Company was included in the scope of consolidation
until January 2008, while United Cement Company of Nigeria
was deconsolidated on April 1, 2009. Since these dates, the two
shareholdings have been included in the consolidated financial
2009 was defined by a difficult economic environment with a declin-
ing construction sector in mature markets but growth in emerging
markets. Thanks to the global geographic positioning and a consistent
cost and cash management, the Group is able to report a solid result.
The balance sheet and liquidity have been further strengthened and
opportunities to make acquisitions have been taken advantage of.
Management discussion and analysis 2009

105MD & A
statements using the equity method of accounting. As a result
of nationalization, Holcim Venezuela was deconsolidated on
December 31, 2008 and reclassified as assets held for sale. The
International Centre for the Settlement of Investment Disputes
(ICSID) has registered Holcim’s application of March 20, 2009
to initiate arbitration proceedings against the Republic of
Venezuela seeking full compensation for the nationalization of
the Group company Holcim Venezuela.
In 2009, the continued strength of the Swiss franc once again
put pressure on the consolidated statement of income. The
pound sterling, the Mexican peso, the Indian rupee and also the
euro depreciated substantially against the Swiss franc. The US
dollar showed a slightly positive trend. The currency effect on
operating EBITDA was –7.4 percent (2008: –8.6).
All changes in the scope of consolidation and the currency
effect reduced net sales by a total of CHF 1,515 million, operating
EBITDA by CHF 433 million and cash flow from operating activi-
ties by CHF 261 million.
Sales volumes
Cement sales declined by 8 percent in the 2009 financial year to
131.9 million tonnes. Organic growth was negative, amounting
to 6.8 percent or 9.7 million tonnes. Owing to the economic
slump and the resulting fall in demand, sales volumes on a
like-for-like basis decreased by 21.1 percent or 7.1 million tonnes
in Group region Europe. This decline is mainly attributable to
Eastern Europe, Spain and Russia. Cement sales in North America,
especially in the US, fell by 25.7 percent or 3.7 million tonnes.
Sales volumes in Latin America declined by 6.3 percent or 1.7
million tonnes, primarily on account of Mexico. Group region
Africa Middle East recorded a fall in cement sales of 5.2 percent
or 0.5 million tonnes. Asia Pacific’s sales of cement were up 0.9
percent or 0.6 million tonnes on the previous year owing to the
largely healthy state of the construction markets and numerous
infrastructure projects.
Deliveries of aggregates fell by 14.5 percent to 143.4 million
tonnes. Adjusted for changes in the scope of consolidation,
sales of aggregates dropped by 19.6 percent or 32.9 million
tonnes. On a like-for-like basis, deliveries in Europe declined
by 22.6 percent or 22.1 million tonnes and in North America by
19.1 percent or 9.4 million tonnes. Latin America and Asia Pacific
Operating results
Sales volumes and principal key figures
January–December (12 months) October–December (3 months)
2009 2008 ±% ±% 2009 2008 ±% ±%
like-for- like-for-
like like
Sales of cement million t 131.9 143.4 –8.0 –6.8 32.8 34.6 –5.2 –5.2
Sales of mineral components million t 3.5 4.8 –27.1 –31.3 1.0 1.1 –9.1 –27.3
Sales of aggregates million t 143.4 167.7 –14.5 –19.6 40.2 40.4 –0.5 –16.6
Sales of ready-mix concrete million m3 41.8 48.5 –13.8 –17.5 11.4 11.5 –0.9 –11.2
Sales of asphalt million t 11.0 13.5 –18.5 –18.5 2.9 3.2 –9.4 –9.4
Net sales million CHF 21,132 25,157 –16.0 –10.0 5,358 5,817 –7.9 –8.8
– Mature markets million CHF 10,063 12,357 –18.6 –18.1 2,709 2,763 –2.0 –14.0
– Emerging markets million CHF 11,069 12,800 –13.5 –2.1 2,649 3,054 –13.3 –4.0
Operating EBITDA million CHF 4,630 5,333 –13.2 –5.1 1,016 968 +5.0 +4.9
– Mature markets million CHF 1,377 1,704 –19.2 –20.2 324 223 +45.3 +9.4
– Emerging markets million CHF 3,253 3,629 –10.4 +2.0 692 745 –7.1 +3.5
Operating EBITDA margin % 21.9 21.2 19.0 16.6
Operating profit million CHF 2,781 3,360 –17.2 –7.3 444 273 +62.6 +64.5
Net income million CHF 1,958 2,226 –12.0 –5.8 381 119 +220.2 +184.9
Net income –
shareholders of Holcim Ltd million CHF 1,471 1,782 –17.5 –11.2 271 43 +530.2 +437.2
Cash flow
from operating activities million CHF 3,888 3,703 +5.0 +12.0 1,696 2,045 –17.1 –16.5

106 Financial Information
recorded decreases of 0.7 and 0.5 million tonnes respectively.
In Group region Africa Middle East, sales virtually maintained
the previous year’s level.
Ready-mix concrete volumes declined by 13.8 percent to 41.8
million cubic meters. On a like-for-like basis, the decrease
came to 17.5 percent. In Europe and North America, organic
sales development declined by 4.9 and 1.8 million cubic meters
respectively, while Latin America and Asia Pacific recorded
decreases of 1.2 and 0.6 million cubic meters respectively.
The quarterly key figures are subject to strong seasonal fluctua-
tions. Particularly in Europe and North America, the early arrival
of winter had a negative impact on construction activity in the
fourth quarter and, thus, on the consolidated results.
In the fourth quarter, cement deliveries decreased by 5.2 percent
or 1.8 million tonnes year-on-year to 32.8 million tonnes. New
consolidations and deconsolidations balanced one another.
On a like-for-like basis, Asia Pacific was the only region able to
report a slight rise in volumes, posting an increase of 0.2 million
tonnes.
Thanks to the first-time inclusion of Holcim Australia, sales of
aggregates in the last quarter could be virtually held at 40.2
million tonnes. On a like-for-like basis, the decrease amounted
to 16.6 percent or 6.7 million tonnes and was largely accounted
for by the two Group regions Europe and North America. In the
southern hemisphere, sales volumes in the fourth quarter fell
only marginally by 0.5 million tonnes.
In the last quarter, 11.4 million cubic meters of ready-mix con-
crete were delivered, just 0.1 million cubic meters less than in
the same quarter in the previous year. On a like-for-like basis,
sales fell by 11.3 percent or 1.3 million cubic meters, again largely
impacted by Europe and North America. In all other Group
regions, sales of ready-mix concrete were stable.
Net sales
Net sales by region
January–December (12 months) October–December (3 months)
Million CHF 2009 2008 ±% ±% 2009 2008 ±% ±%
like-for- like-for-
like like
Europe 7,320 10,043 –27.1 –21.6 1,656 2,116 –21.7 –19.9
North America 3,480 4,527 –23.1 –21.8 854 1,154 –26.0 –19.8
Latin America 3,348 4,170 –19.7 –1.7 821 1,007 –18.5 –2.7
Africa Middle East 1,206 1,354 –10.9 –3.8 289 364 –20.6 –13.5
Asia Pacific 6,418 6,109 +5.1 +6.4 1,880 1,510 +24.5 +2.5
Corporate/Eliminations (640) (1,046) (142) (334)
Total Group 21,132 25,157 –16.0 –10.0 5,358 5,817 –7.9 –8.8
In 2009, net sales decreased by 16 percent to CHF 21,132 million.
The organic decline in sales amounted to 10 percent or CHF
2,510 million. In Europe, on a like-for-like basis, net sales fell by
21.6 percent or CHF 2,174 million. Lower sales were generated in
most European countries, although positive results were record-
ed in Switzerland and Southern Germany. In North America, net
sales were down by 21.8 percent or CHF 989 million, primarily on
account of the US. Sales in Latin America also fell by 1.7 percent
or CHF 70 million, mainly due to Mexico. Africa Middle East
recorded a fall in sales of 3.8 percent or CHF 52 million. At 6.4
percent or CHF 388 million, Asia Pacific showed an increase in
net sales. This rise was due in particular to the strong growth in
India, the Philippines and Indonesia.
Compared to the previous year, there was only a slight shift in
individual regional weightings. In 2009, the breakdown of net
sales was as follows: Europe 33.6 percent (2008: 38.3), North
America 16 percent (2008: 17.3), Latin America 15.4 percent
(2008: 15.9), Africa Middle East 5.5 percent (2008: 5.2) and Asia
Pacific 29.5 percent (2008: 23.3).
The contribution of the emerging markets to net sales rose
again in 2009. The emerging markets accounted for 52.4 per-
cent (2008: 50.8) of consolidated net sales and the mature
markets for 47.6 percent (2008: 49.2).

Thanks to the Group’s sound geographical diversification,
improved results in emerging markets compensated in part for
local falls in earnings in mature markets. In the year under re-
view, operating EBITDA fell by 13.2 percent to CHF 4,630 million.
On a like-for-like basis, operating EBITDA fell by only 5.1 percent
or CHF 270 million. The cost of plant closures in Spain and the
US, which was included in operating EBITDA in 2008, amounted
to CHF 120 million.
Thanks to rigorous cost management, Holcim saved CHF 857
million in fixed costs in 2009, thereby substantially exceeding
its stated target of CHF 600 million. A total of 23 kiln lines with
a capacity of more than 10 million tonnes and over 100 gravel
pits and ready-mix concrete plants were closed permanently or
temporarily. As these measures inevitably involved job losses,
they were implemented in such a way as to minimize the social
impact. As a result of reduced demand in Europe, CO2 emission
certificates were sold for a total of CHF 90 million; proceeds
in 2008 amounted to CHF 34 million. Thanks to the early
implementation of the drastic savings measures and the rapid
reduction in capacity, earnings losses were held to reasonable
levels.
As a percentage of net sales, distribution and selling expenses
fell from 23.5 percent the previous year to 22.8 percent. The
reduction is mainly due to lower transport costs caused by
reduced energy costs and savings on purchases of third party
services. Administration expenses decreased from 7 percent the
previous year to 6.9 percent of net sales.
On a like-for-like basis, Group region Europe posted a drop in
operating EBITDA of 33.3 percent or CHF 667 million. This
decrease was mainly due to the sharp decline in volumes in
Eastern Europe, France, Belgium, Spain, the UK and Russia.
The decline in revenues resulting from the fall in volumes was
partially offset by a relatively stable price environment – with
the exception of Russia –, slightly lower energy costs and
savings in fixed costs. North America was also hit by a sharp
decline in volumes, but was able to partially offset these by
substantial savings in fixed costs and stable variable production
costs thanks to the new Ste. Genevieve cement plant that came
on stream mid-year. This helped to keep the fall in operating
EBITDA to 15.6 percent or CHF 76 million. In Latin America, oper-
ating EBITDA rose by 10.9 percent or CHF 130 million, with Brazil
and Argentina making the largest contributions to this growth.
Mainly due to Morocco, operating EBITDA in Group region Africa
Middle East increased by 8.2 percent or CHF 30 million. The in-
crease in Asia Pacific was 21.5 percent or CHF 322 million. Most
of this figure was attributable to India, and was primarily due to
higher selling prices and volumes, which were in some cases re-
duced by higher external clinker purchases at Ambuja Cements.
The Philippines and Indonesia also recorded very good results,
with organic growth rates of more than 20 percent.
Fourth-quarter operating EBITDA increased by 5 percent to CHF
1,016 million compared with the same period in the previous
year. On a like-for-like basis, the Group posted positive growth
of 4.9 percent or CHF 47 million. In Europe, lower sales volumes
and prices in Eastern Europe and Russia were largely responsible
for the decrease of 32.3 percent in operating EBITDA. The cost of
plant closures in Spain, which was included in operating EBITDA
in 2008, amounted to CHF 65 million. North America posted an
increase of 90.5 percent. In the previous year, the cost of US
plant closures in particular had negatively impacted operating
EBITDA by a total of CHF 55 million. Latin America posted a 17.8
percent increase in operating EBITDA mainly thanks to Brazil.
With 59 percent, growth in Group region Africa Middle East was
clearly positive. On a like-for-like basis, Asia Pacific showed an
107MD & A
Operating EBITDA
Operating EBITDA by region
January–December (12 months) October–December (3 months)
Million CHF 2009 2008 ±% ±% 2009 2008 ±% ±%
like-for- like-for-
like like
Europe 1,232 2,003 –38.5 –33.3 197 288 –31.6 –32.3
North America 400 486 –17.7 –15.6 72 42 +71.4 +90.5
Latin America 1,076 1,194 –9.9 +10.9 258 270 –4.4 +17.8
Africa Middle East 373 368 +1.4 +8.2 94 61 +54.1 +59.0
Asia Pacific 1,760 1,495 +17.7 +21.5 454 358 +26.8 +8.4
Corporate/Eliminations (211) (213) (59) (51)
Total Group 4,630 5,333 –13.2 –5.1 1,016 968 +5.0 +4.9

108 Financial Information
increase of 8.4 percent, which was mainly attributable to higher
sales volumes and selling prices in Indonesia.
The shift in the regional weighting of operating EBITDA was
most pronounced in Europe and Asia Pacific. In 2009, Europe
accounted for 25.4 percent (2008: 36.1), North America 8.3 per-
cent (2008: 8.8), Latin America 22.2 percent (2008: 21.5), Africa
Middle East 7.7 percent (2008: 6.6) and Asia Pacific 36.4 percent
(2008: 27).
There was a shift in the weighting between emerging and
mature markets compared with the previous year primarily
as a result of the positive economic environment in the Far East.
In 2009, the emerging markets accounted for 70.3 percent
(2008: 68) of operating EBITDA and the mature markets for
29.7 percent (2008: 32).
Operating EBITDA margin
The operating EBITDA margin for the Group as a whole rose
by 0.7 percentage points from 21.2 percent to 21.9 percent.
The margin increased in all Group regions apart from Europe.
On a like-for-like basis, the EBITDA margin was up by 1.2 per-
centage points. The 2.9 percentage point reduction in Europe
was very much shaped by the development in Russia. In North
America, the operating EBITDA margin improved by 0.9 percent-
age points, as lower sales – caused by the ongoing recession in
the US – were more than offset by cost savings. Latin America
achieved a 3.7 percentage point increase in margins, mainly
because of the higher selling prices in Brazil. Group region
Africa Middle East saw its margin widen by 3.4 percentage
points. Asia Pacific recorded a 3.5 percentage point increase
in margin, mainly thanks to India.
In the cement segment, the operating EBITDA margin rose
by 1.1 percentage points from 27.3 percent the previous year
to 28.4 percent. Latin America, Africa Middle East and Asia
Pacific were able to increase their margins. The margin in the
aggregates segment improved by 0.2 percentage points to
19.7 percent. All Group regions aside from Europe and Africa
Middle East reported higher margins in this segment. The other
construction materials and services segment saw margin shrink
by 0.6 percentage points to 3.7 percent; margins in Europe and
Africa Middle East were lower than in the previous year.
Operating profit
In the year under review, operating profit fell by 17.2 percent
to CHF 2,781 million. On a like-for-like basis, the development in
operating profit was a negative 7.3 percent or CHF 245 million.
The reduction was a result of the lower operating EBITDA of
CHF 270 million, offset to some extent by lower depreciation
of CHF 25 million. The cost of plant closures, including deprecia-
tion, in Spain and the US, which was included in operating profit
in 2008, amounted to CHF 308 million in total.
Group net income
Group net income fell by 12 percent or CHF 268 million to
CHF 1,958 million. On a like-for-like basis, the decrease in Group
net income came to 5.8 percent. Given the adverse economic
environment, this performance may be regarded as a success
and is primarily attributable to consistent capacity adjustments
and rigorous cost-cutting measures.
The decrease in Group net income is largely a consequence of
lower operating profit, partially offset by an increase of CHF 187
million in other income attributable to writing back the anti-
trust provision in Germany and to the profit on the sale of
Panamá Cement and the positions in the Caribbean. In 2009,
the effective tax rate stood at 24 percent (2008: 23). The tax
rate for the past financial year was affected by the increase
in the profit contribution from Asia Pacific, where tax rates
are higher than the average Group tax rate. The decrease in
European profits subject to lower tax rates also contributed
to the increase in the effective tax rate.
Group net income attributable to shareholders of Holcim Ltd
declined by 17.5 percent or CHF 311 million to CHF 1,471 million.
They shared 75.1 percent of Group net income, compared to
80.1 percent in the previous year. The decrease is mainly attrib-
utable to the higher profit contributions of Group companies
with minority interests such as the Indian company ACC, Holcim
Morocco, Juan Minetti and Cement Australia (fully consolidated
from October 1, 2009, stating 25 percent minority interests).
On a like-for-like basis, the share of Group net income attribut-
able to shareholders of Holcim Ltd decreased by 11.2 percent.
Basic earnings per share of Holcim Ltd fell 21.4 percent from
CHF 6.27 in the previous year to CHF 4.93. The weighted number
of shares increased in the 2009 financial year as a result of the
stock dividend and the capital increase. To comply with IFRS
provisions, the weighted number of shares for previous years
was increased retrospectively.

Cash flow from operating activities
Cash flow from operating activities rose by CHF 185 million or
5 percent to CHF 3,888 million. On a like-for-like basis, there
was an increase of CHF 446 million or 12 percent. The lower
operating EBITDA was more than offset in particular by a drop
of CHF 773 million in net working capital and a decrease of CHF
162 million in income taxes paid. The consistent focus on cash
management resulted in a reduction in net current assets and
in particular in lower inventories throughout the year. In the
year under review, the cash flow margin came to 18.4 percent
(2008: 14.7).
Investment activities
The financial year under review saw cash flow from investment
activity decrease by CHF 885 million to CHF 4,590 million.
Holcim invested a net CHF 2,305 million in production and other
fixed assets in the last financial year. Compared to the previous
year’s figure of CHF 4,391 million, this represents a decrease of
47.5 percent. This decrease reflects on the one hand specific
reductions in net capital expenditures to maintain productive
capacity and secure competitiveness. On the other hand,
the strategic expansion program to increase cement capacity
in existing and new markets continued; only in a few cases
projects have been postponed. All in all, in the year under review
9.8 million tonnes of cement capacity came on stream, most
of it in the growth market of India, but also some in the US.
As all the new operations are equipped with state-of-the-art
technology, they help to further improve the Group’s overall
cost and environmental efficiency. The most important current
investment projects include the systematic expansion of capac-
ities in the emerging market of India, expansion of a cement
plant in Russia and Azerbaijan, and the construction of a new
cement plant in Mexico.
Through its purchase in Australia, which was financed with
equity, Holcim has substantially strengthened its cement
position with operations in aggregates, ready-mix concrete
and concrete products and is, thus, optimally represented in
all segments in a market that is already growing again. Further
information on investment in financial assets can be found on
pages 135 and 136 of the Annual Report.
Key investment projects
Ste. Genevieve – new cement plant in the US
In July 2009, the new state-of-the-art cement plant in
Ste. Genevieve County, Missouri, came on stream. It is the
largest cement plant in the US and has an annual capacity
of 4 million tonnes. The site includes its own port and fleet
facilities on the Mississippi. Although clinker production
started on schedule, the official opening of the plant will take
place only in spring 2010 once the commissioned works and
performance tests have been completed.
109MD & A
Financing activities, investments and liquidity
Cash flow
January–December (12 months) October–December (3 months)
Million CHF 2009 2008 ±% 2009 2008 ±%
Cash flow from operating activities 3,888 3,703 +5.0 1,696 2,045 –17.1
Net capital expenditures on property, plant and equipment
to maintain productive capacity and to secure competitiveness (376) (1,104) +65.9 (195) (412) +52.7
Free cash flow 3,512 2,599 +35.1 1,501 1,633 –8.1
Investments in property, plant and equipment for expansion (1,929) (3,287) +41.3 (469) (1,144) +59.0
Financial investments net (2,285) (1,084) –110.8 (1,805) (155) –1,064.5
Dividends paid (192) (1,105) +82.6 (19) (14) –35.7
Financing (requirement) surplus (894) (2,877) +68.9 (792) 320 –347.5
Cash flow from financing activities (excl. dividends) 1,548 3,772 –59.0 (432) (72) –500.0
Increase in cash and cash equivalents 654 895 –26.9 (1,224) 248 –593.5

110 Financial Information
Shurovo – capacity expansion in Russia
In order to create a stable Russian base called for in Holcim’s
fundamental strategy, work began on the modernization and
expansion of the Shurovo cement plant, near Moscow, in the
first quarter of 2007. The plant will be commissioned in the
second half of 2010. This will double Holcim’s annual capacity
to 2.1 million tonnes of cement and enable the Group to partici-
pate in Russia’s vigorous long-term economic growth. At the
same time, the modernization of the plant will make a major
contribution to improving environmental protection and occu-
pational safety.
Hermosillo – new cement plant in Mexico
In view of Mexico’s growth potential, Holcim has decided to
build a new cement plant near Hermosillo in the northwest of
the country with an annual capacity of 1.6 million tonnes of
cement. Beginning in 2010, the new plant will serve as an ideal
complement to the existing production network in Mexico –
further strengthening Holcim Apasco’s national position.
As of the end of 2009, around 85 percent of the construction
work had been completed; the remaining work is proceeding
according to plan.
India – expanding our market position
Our two Indian companies, ACC and Ambuja Cements, are
reinforcing their position in the rapidly growing Indian market
with a number of major investment projects scheduled for
completion in 2010. As a result of the planned projects, ACC’s
capacity will be expanded by 6.3 million tonnes of cement and
that of Ambuja Cements by 6 million tonnes of cement.
Azerbaijan – modernization
As part of the long-term growth strategy for the region, the
Garadagh cement plant will be modernized in a program that
will take about two years. The key element of the moderniza-
tion is the replacement of the existing wet process with
dry-process production. This will be less energy-intensive
and improve efficiency. Besides the modernization of the
production process, the program will also focus on improving
the plant’s environmental sustainability by reducing the level
of emissions.
Investments in rationalizing and improving processes and in
environmental and occupational safety measures amounted to
CHF 578 million (2008: 1,231).
Group ROIC
The Group return on invested capital (ROIC) measures the
profitability of the capital employed. It is regarded as a
measure of operating profitability. It is calculated by expressing
EBIT as a percentage of the average invested capital (excluding
cash, cash equivalents and securities).
Group ROIC
Million CHF
EBIT 1 Invested capital ROIC in %
Previous Business Average
year year
2008 3,723 37,934 35,371 36,653 10.2
2009 3,371 35,371 38,438 36,905 9.11 Earnings before interest and taxes.
In the past financial year, the ROIC fell by 1.1 percentage points
from 10.2 percent to 9.1 percent. The negative growth over the
past financial year is attributable to the decline in EBIT and the
simultaneous increase in average invested capital. The invest-
ment activity, which normally only starts to generate EBIT after
a construction phase of two to three years, will be charged to
invested capital.
Financing activity
The strong cash flow from operating activities and additional
debt capital were used to fund investments and refinance exist-
ing borrowings. A capital increase of CHF 2.1 billion was used
to fund the acquisition of Holcim Australia and participate in
the planned private placement of Huaxin Cement. To improve
liquidity, in May Holcim became one of the first companies in
the Swiss capital market to distribute a stock dividend in the
amount of CHF 594 million. In the year under review, Holcim
placed bonds totaling CHF 5.1 billion on the capital markets.
By this means, the average maturity of financial liabilities was
increased significantly. Mention should be made of the follow-
ing significant transactions:
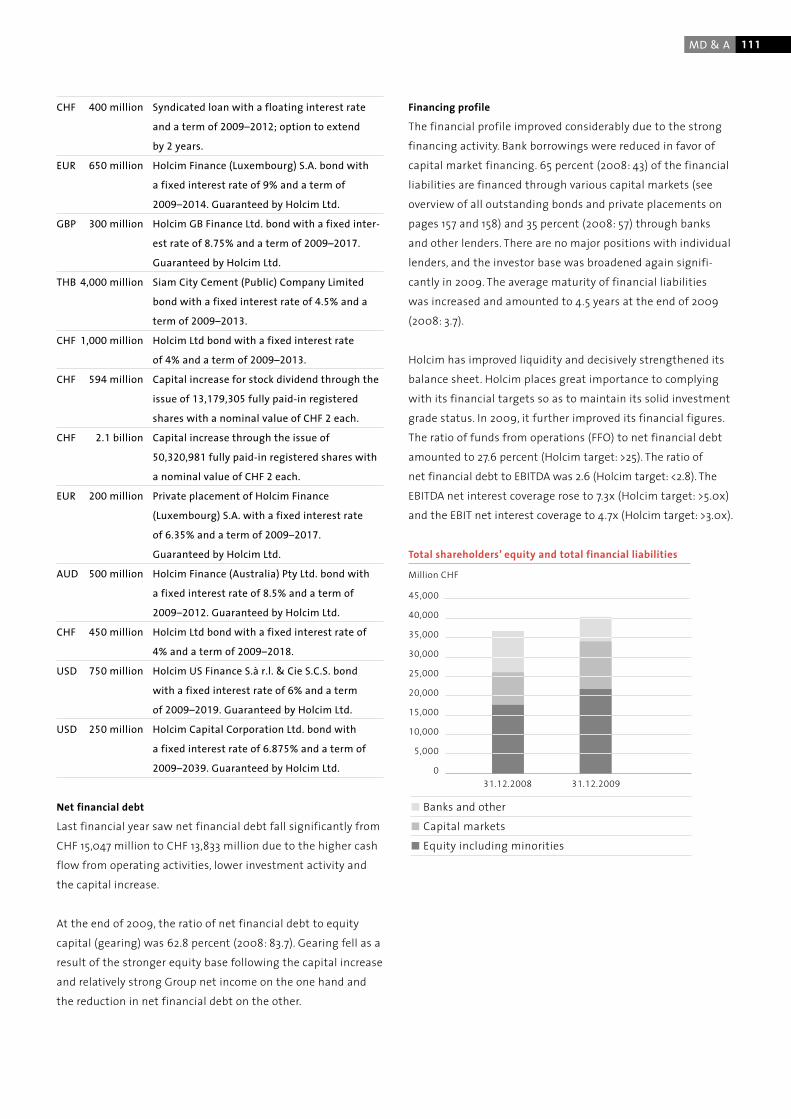
111MD & A
CHF 400 million Syndicated loan with a floating interest rate
and a term of 2009–2012; option to extend
by 2 years.
EUR 650 million Holcim Finance (Luxembourg) S.A. bond with
a fixed interest rate of 9% and a term of
2009–2014. Guaranteed by Holcim Ltd.
GBP 300 million Holcim GB Finance Ltd. bond with a fixed inter-
est rate of 8.75% and a term of 2009–2017.
Guaranteed by Holcim Ltd.
THB 4,000 million Siam City Cement (Public) Company Limited
bond with a fixed interest rate of 4.5% and a
term of 2009–2013.
CHF 1,000 million Holcim Ltd bond with a fixed interest rate
of 4% and a term of 2009–2013.
CHF 594 million Capital increase for stock dividend through the
issue of 13,179,305 fully paid-in registered
shares with a nominal value of CHF 2 each.
CHF 2.1 billion Capital increase through the issue of
50,320,981 fully paid-in registered shares with
a nominal value of CHF 2 each.
EUR 200 million Private placement of Holcim Finance
(Luxembourg) S.A. with a fixed interest rate
of 6.35% and a term of 2009–2017.
Guaranteed by Holcim Ltd.
AUD 500 million Holcim Finance (Australia) Pty Ltd. bond with
a fixed interest rate of 8.5% and a term of
2009–2012. Guaranteed by Holcim Ltd.
CHF 450 million Holcim Ltd bond with a fixed interest rate of
4% and a term of 2009–2018.
USD 750 million Holcim US Finance S.à r.l. & Cie S.C.S. bond
with a fixed interest rate of 6% and a term
of 2009–2019. Guaranteed by Holcim Ltd.
USD 250 million Holcim Capital Corporation Ltd. bond with
a fixed interest rate of 6.875% and a term of
2009–2039. Guaranteed by Holcim Ltd.
Net financial debt
Last financial year saw net financial debt fall significantly from
CHF 15,047 million to CHF 13,833 million due to the higher cash
flow from operating activities, lower investment activity and
the capital increase.
At the end of 2009, the ratio of net financial debt to equity
capital (gearing) was 62.8 percent (2008: 83.7). Gearing fell as a
result of the stronger equity base following the capital increase
and relatively strong Group net income on the one hand and
the reduction in net financial debt on the other.
Financing profile
The financial profile improved considerably due to the strong
financing activity. Bank borrowings were reduced in favor of
capital market financing. 65 percent (2008: 43) of the financial
liabilities are financed through various capital markets (see
overview of all outstanding bonds and private placements on
pages 157 and 158) and 35 percent (2008: 57) through banks
and other lenders. There are no major positions with individual
lenders, and the investor base was broadened again signifi-
cantly in 2009. The average maturity of financial liabilities
was increased and amounted to 4.5 years at the end of 2009
(2008: 3.7).
Holcim has improved liquidity and decisively strengthened its
balance sheet. Holcim places great importance to complying
with its financial targets so as to maintain its solid investment
grade status. In 2009, it further improved its financial figures.
The ratio of funds from operations (FFO) to net financial debt
amounted to 27.6 percent (Holcim target: >25). The ratio of
net financial debt to EBITDA was 2.6 (Holcim target: <2.8). The
EBITDA net interest coverage rose to 7.3x (Holcim target: >5.0x)
and the EBIT net interest coverage to 4.7x (Holcim target: >3.0x).
Total shareholders’ equity and total financial liabilities
Banks and other
Capital markets
Equity including minorities
31.12.2008 31.12.2009
45,000
40,000
35,000
30,000
25,000
20,000
15,000
10,000
5,000
0
Million CHF
112 Financial Information
dated statement of income; in the last financial year, these
were, on balance, slightly negative. Because a large part of the
foreign capital is financed with matching currencies in local
currency, the effects of the foreign currency translation of local
balance sheets into the consolidated statement of financial
position have not, as a rule, resulted in significant distortions
in the consolidated statement of financial position.
The currency effect of the US dollar and the euro on the most
important key figures in the consolidated financial statements
and cash flow from operating activities is presented on the
basis of the following sensitivity analyses. The sensitivity analy-
sis only factors in those effects caused by the translation of
local financial statements into Swiss francs (translation effect).
Currency effects from transactions conducted locally in foreign
currencies cannot be reflected in the analysis. As a result of
local business activity, this type of transaction involves only
very small amounts or is individually hedged.
The impact of a hypothetical decline in the value of the US
dollar or the euro against the Swiss franc by CHF 0.01 would be
as follows:
Liquidity
To secure liquidity, the Group holds liquid funds of CHF 4,474
million (2008: 3,605). This cash is invested in time deposits held
with a large number of banks on a broadly diversified basis.
The counterparty risk is constantly monitored as part of the
risk management process. As of December 31, 2009, unutilized
credit lines amounting to CHF 8,188 million (2008: 3,985) were
also available (see also page 155). This includes unused commit-
ted credit lines of CHF 5,365 million (2008: 2,027). The latter do
not include any material adverse change clauses.
Currency sensitivity
The Group operates in around 70 countries, generating by
far the largest part of its results in currencies other than the
Swiss franc. Only about 3 percent of net sales are generated
in Swiss francs.
Foreign currency fluctuation has little effect on the consolidat-
ed statement of income. As the Group produces a very high
proportion of its products locally, most sales and costs are
incurred in the same respective local currencies. The effects of
foreign exchange movements are therefore largely restricted to
the translation of local financial statements into the consoli-
Sensitivity analysis euro
EUR/CHF EUR/CHF ± in
at 1.51 at 1.50 million CHF
Million CHF
Net sales 21,132 21,111 (21)
Operating EBITDA 4,630 4,627 (3)
Net income 1,958 1,961 3
Cash flow from operating activities 3,888 3,886 (2)
Sensitivity analysis US dollar
USD/CHF USD/CHF ± in
at 1.09 at 1.08 million CHF
Million CHF
Net sales 21,132 21,118 (14)
Operating EBITDA 4,630 4,627 (3)
Net income 1,958 1,956 (2)
Cash flow from operating activities 3,888 3,886 (2)

113Consolidated Financial Statements
1 EPS calculation based on net income attributable to shareholders of Holcim Ltd weighted by the average number of shares. Based on IAS 33, the weightedaverage number of shares outstanding was retrospectively increased by 5 percent to reflect the 1:20 ratio of the stock dividend (note 16) and by anadditional 3.6 percent to reflect the discount for existing shareholders in the rights issue (note 35) for all periods presented.
2 Operating profit CHF 2,781 million (2008: 3,360) before depreciation, amortization and impairment of operating assets CHF 1,849 million (2008: 1,973).3 Net income CHF 1,958 million (2008: 2,226) before interest earned on cash and marketable securities CHF 91 million (2008: 156), financial expensesCHF 881 million (2008: 990), income taxes CHF 623 million (2008: 663) and depreciation, amortization and impairment CHF 1,858 million (2008: 1,985).
Consolidated statement of income of Group Holcim
Million CHF Notes 2009 2008 ±%
Net sales 5, 6 21,132 25,157 –16.0
Production cost of goods sold 7 (12,072) (14,116)
Gross profit 9,060 11,041 –17.9
Distribution and selling expenses 8 (4,828) (5,921)
Administration expenses (1,451) (1,760)
Operating profit 2,781 3,360 –17.2
Other income 11 206 19
Share of profit of associates 22 302 229
Financial income 12 173 271
Financial expenses 13 (881) (990)
Net income before taxes 2,581 2,889 –10.7
Income taxes 14 (623) (663)
Net income 1,958 2,226 –12.0
Attributable to:
Shareholders of Holcim Ltd 1,471 1,782 –17.5
Minority interest 487 444 +9.7
Earnings per share in CHF
Basic earnings per share1 16 4.93 6.27 –21.4
Fully diluted earnings per share1 16 4.93 6.26 –21.2
Million CHF
Operating EBITDA2 10 4,630 5,333 –13.2
EBITDA3 5,229 5,708 –8.4

114 Financial Information
Consolidated statement of comprehensive earnings of Group Holcim
Million CHF 2009 2008
Net income 1,958 2,226
Other comprehensive earnings
Currency translation effects 345 (4,687)
– Tax expense (34)
Available-for-sale securities
– Change in fair value (7) (6)
– Realized loss through statement of income 9
– Tax expense
Cash flow hedges
– Change in fair value (18) 16
– Realized gain through statement of income
– Tax expense
Net investment hedges
– Change in fair value (4)
– Tax expense
Total other comprehensive earnings1 291 (4,677)
Total comprehensive earnings2 2,249 (2,451)
Attributable to:
Shareholders of Holcim Ltd 1,734 (2,214)
Minority interest 515 (237)
1 Per Annual Report 2008: Net income (loss) recognized directly in equity.2 Per Annual Report 2008: Total recognized net income (loss).
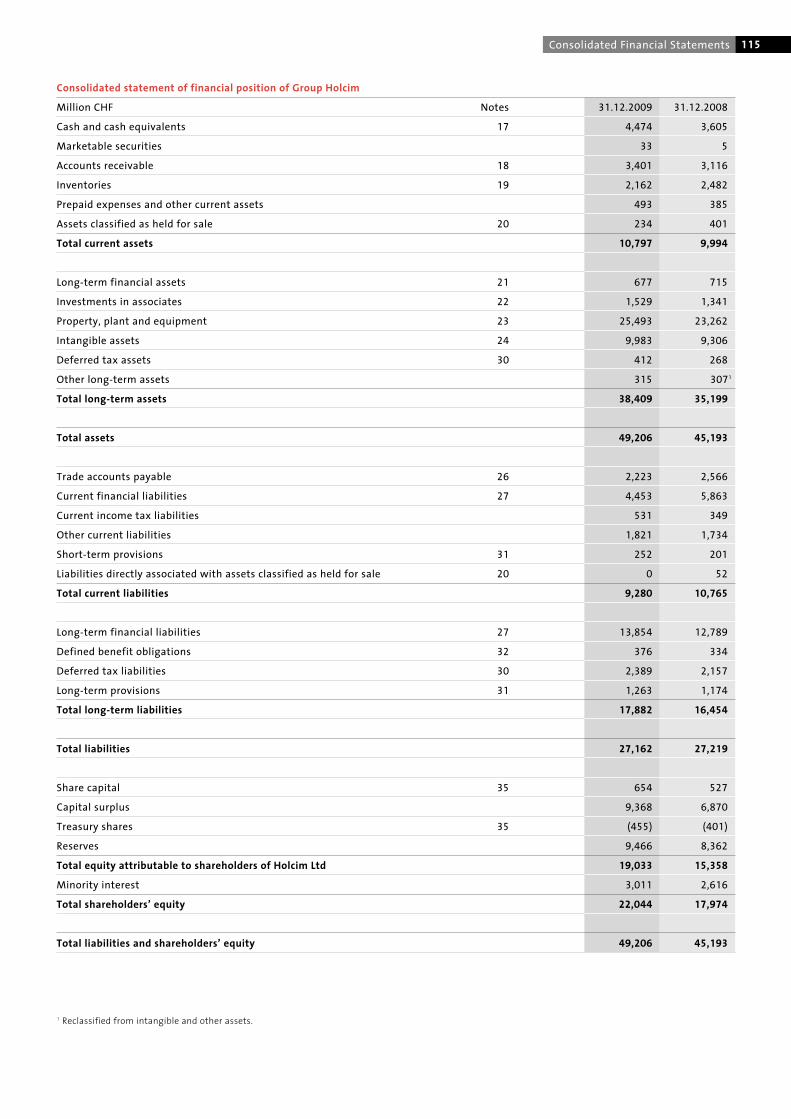
115Consolidated Financial Statements
Consolidated statement of financial position of Group Holcim
Million CHF Notes 31.12.2009 31.12.2008
Cash and cash equivalents 17 4,474 3,605
Marketable securities 33 5
Accounts receivable 18 3,401 3,116
Inventories 19 2,162 2,482
Prepaid expenses and other current assets 493 385
Assets classified as held for sale 20 234 401
Total current assets 10,797 9,994
Long-term financial assets 21 677 715
Investments in associates 22 1,529 1,341
Property, plant and equipment 23 25,493 23,262
Intangible assets 24 9,983 9,306
Deferred tax assets 30 412 268
Other long-term assets 315 3071
Total long-term assets 38,409 35,199
Total assets 49,206 45,193
Trade accounts payable 26 2,223 2,566
Current financial liabilities 27 4,453 5,863
Current income tax liabilities 531 349
Other current liabilities 1,821 1,734
Short-term provisions 31 252 201
Liabilities directly associated with assets classified as held for sale 20 0 52
Total current liabilities 9,280 10,765
Long-term financial liabilities 27 13,854 12,789
Defined benefit obligations 32 376 334
Deferred tax liabilities 30 2,389 2,157
Long-term provisions 31 1,263 1,174
Total long-term liabilities 17,882 16,454
Total liabilities 27,162 27,219
Share capital 35 654 527
Capital surplus 9,368 6,870
Treasury shares 35 (455) (401)
Reserves 9,466 8,362
Total equity attributable to shareholders of Holcim Ltd 19,033 15,358
Minority interest 3,011 2,616
Total shareholders’ equity 22,044 17,974
Total liabilities and shareholders’ equity 49,206 45,193
1 Reclassified from intangible and other assets.
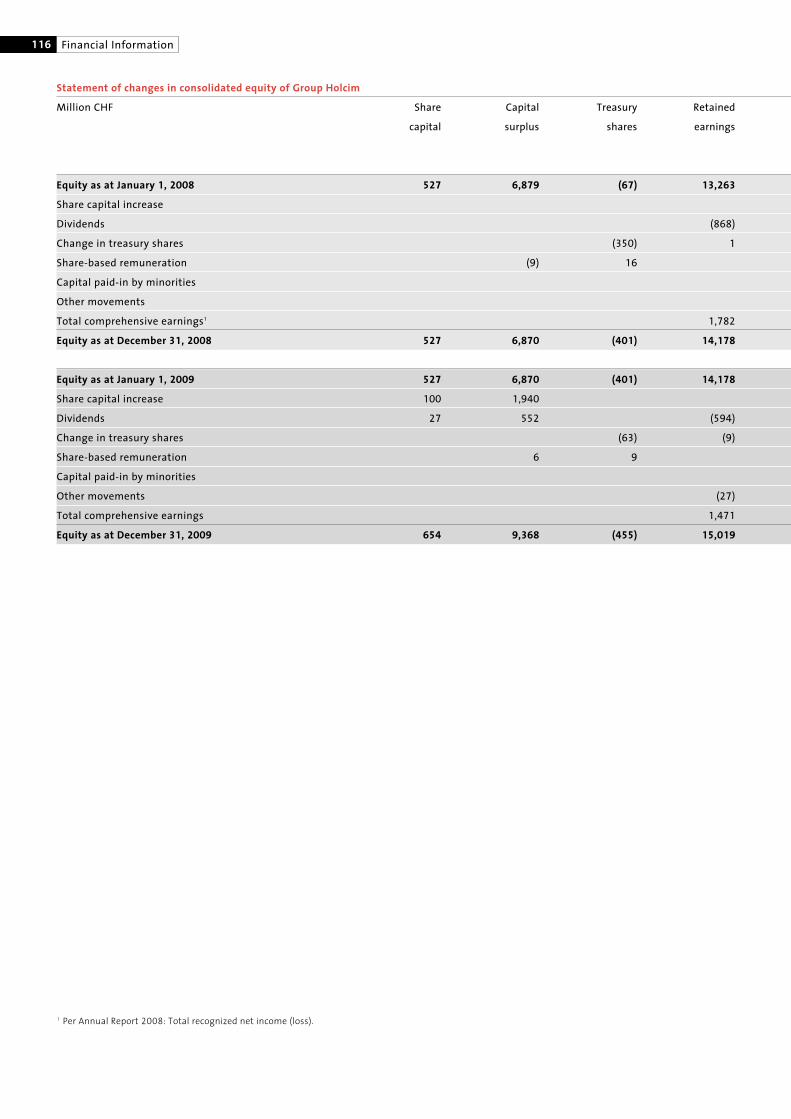
116 Financial Information
Statement of changes in consolidated equity of Group Holcim
Million CHF Share Capital Treasury Retained
capital surplus shares earnings
Equity as at January 1, 2008 527 6,879 (67) 13,263
Share capital increase
Dividends (868)
Change in treasury shares (350) 1
Share-based remuneration (9) 16
Capital paid-in by minorities
Other movements
Total comprehensive earnings1 1,782
Equity as at December 31, 2008 527 6,870 (401) 14,178
Equity as at January 1, 2009 527 6,870 (401) 14,178
Share capital increase 100 1,940
Dividends 27 552 (594)
Change in treasury shares (63) (9)
Share-based remuneration 6 9 1
Capital paid-in by minorities
Other movements (27)
Total comprehensive earnings 1,471
Equity as at December 31, 2009 654 9,368 (455) 15,019
1 Per Annual Report 2008: Total recognized net income (loss).

117Consolidated Financial Statements
Available-for-sale Cash flow Currency Total Total equity Minority Total
equity reserve hedging translation reserves attributable to interest shareholders’
reserve reserve shareholders equity
of Holcim Ltd
3 1 (1,824) 11,443 18,782 3,163 21,945
(868) (868) (217) (1,085)
1 (349) (349)
7 1 8
2 2
(96) (96)
(6) 16 (4,006) (2,214) (2,214) (237) (2,451)
(3) 17 (5,830) 8,362 15,358 2,616 17,974
(3) 17 (5,830) 8,362 15,358 2,616 17,974
2,040 2,040
(594) (15) (218) (233)
(9) (72) (72)
15 1 16
2 2
(27) (27) 95 68
1 (19) 281 1,734 1,734 515 2,249
(2) (2) (5,549) 9,466 19,033 3,011 22,044

118 Financial Information
Consolidated statement of cash flows of Group Holcim
Million CHF Notes 2009 2008
Net income before taxes 2,581 2,889
Other income 11 (206) (19)
Share of profit of associates 22 (302) (229)
Financial expenses net 12,13 708 719
Operating profit 2,781 3,360
Depreciation, amortization and impairment of operating assets 9 1,849 1,973
Other non-cash items 315 265
Change in net working capital 159 (603)
Cash generated from operations 5,104 4,995
Dividends received 94 206
Interest received 145 284
Interest paid (726) (861)
Income taxes paid (639) (877)
Other expenses (90) (44)
Cash flow from operating activities (A) 3,888 3,703
Purchase of property, plant and equipment (2,507) (4,518)
Disposal of property, plant and equipment 202 127
Acquisition of participation in Group companies (1,782) (534)
Disposal of participation in Group companies 139 (97)
Purchase of financial assets, intangible and other assets (904) (1,352)
Disposal of financial assets, intangible and other assets 262 899
Cash flow used in investing activities (B) 38 (4,590) (5,475)
Dividends paid on ordinary shares 0 (868)
Dividends paid to minority shareholders (192) (237)
Capital increase 35 2,040 0
Capital paid-in by minority interests 2 2
Movements of treasury shares (72) (349)
Proceeds from current financial liabilities 12,170 7,401
Repayment of current financial liabilities (13,433) (5,282)
Proceeds from long-term financial liabilities 11,234 8,580
Repayment of long-term financial liabilities (10,393) (6,580)
Cash flow from financing activities (C) 1,356 2,667
Increase in cash and cash equivalents (A+B+C) 654 895
Cash and cash equivalents as at January 1 17 3,611 3,345
Increase in cash and cash equivalents 654 895
Currency translation effects (4) (629)
Cash and cash equivalents as at December 31 17 4,261 3,611

119Consolidated Financial Statements
Basis of preparation
The consolidated financial statements have been prepared in
accordance with International Financial Reporting Standards
(IFRS).
Adoption of revised and new International Financial Reporting
Standards and new interpretations
In 2009, Group Holcim adopted the following new and revised
standards and interpretations relevant to the Group which
became effective from January 1, 2009:
IAS 1 (revised) Presentation of Financial StatementsIAS 23 (amended) Borrowing CostsIFRS 2 (amended) Share-based PaymentIFRS 7 (amended) Financial Instruments: DisclosuresIFRS 8 Operating SegmentsIFRIC 16 Hedges of a Net Investment
in a Foreign OperationImprovements to IFRSs Clarifications of existing IFRSs
The revised IAS 1, the new IFRS 8 and amended IFRS 7 are pre-
sentation and disclosure related only. IAS 1 (revised) separates
owner and non-owner changes in equity. The statement of
changes in consolidated equity includes only details of trans-
actions with owners, with non-owner changes in equity pre-
sented as a single line. In addition, the standard introduced
a consolidated statement of comprehensive earnings and
Holcim elected to present all items of recognized income and
expense in two statements. Consequently, the consolidated
statement of income has been retained. With respect to IFRS 8,
the Group concluded that the operating segments determined
in accordance with that standard are the same as those previ-
ously identified under IAS 14. The amendment to IAS 23 has
no impact on the consolidated financial statements as the ac-
counting policy already specifies capitalization of attributable
interest costs. The amendment to IFRS 2 clarifies that vesting
conditions are either service conditions or performance condi-
tions. IFRIC 16 provides guidance in respect of hedges of foreign
currency risks on net investments in foreign operations. The
amendments have no material impact on the Group. The im-
provements to IFRSs relate largely to clarification issues only.
Therefore, the effect of applying these amendments have no
material impact on the Group’s financial statements.
In 2010, Group Holcim will adopt the following revised
standards relevant to the Group:
IAS 27 (revised) Consolidatedand Separate Financial Statements
IFRS 3 (revised) Business CombinationsIFRS 2 (amended) Share-based PaymentImprovements to IFRSs Clarifications of existing IFRSs
According to IAS 27 (revised), changes in the ownership interest
of a subsidiary that do not result in a loss of control will be
accounted for as an equity transaction. The amendment to IFRS 3
(revised) introduces several changes such as the choice to mea-
sure a non-controlling interest in the acquiree either at fair value
or at its proportionate interest in the acquiree’s identifiable
net assets, the accounting for step acquisitions requiring the
remeasurement of a previously held interest to fair value
through profit or loss as well as the expensing of acquisition
costs directly to the income statement. The effect of applying
IFRS 2 (amended) clarifying the accounting of group cash-
settled shared-based payment transactions will have no impact
on the Group. The improvements to IFRSs relate largely to
clarification issues only. Therefore, the effect of applying these
amendments have no material impact on the Group’s financial
statements.
In 2011, Group Holcim will adopt the following revised
standard relevant to the Group:
IAS 24 (amended) Related Party Disclosures
The amendments to IAS 24 are disclosure related only and will
have no impact on the Group’s financial statements.
In 2013, Group Holcim will adopt the following new standard
relevant to the Group:
IFRS 9 Financial Instruments
The new IFRS 9, which represents the first part of Phase 1 of the
IASB’s project to replace IAS 39, relates to classification and
measurement of financial assets only. The new standard will
require financial assets to be classified on initial recognition at
either amortized cost or fair value. The Group is in the process
of evaluating any impact this new standard may have on its
consolidated financial statements.
Accounting policies

120 Financial Information
Use of estimates
The preparation of financial statements in conformity with
IFRS requires management to make estimates and assump-
tions that affect the reported amounts of revenues, expenses,
assets, liabilities and related disclosures at the date of the
financial statements. These estimates are based on manage-
ment’s best knowledge of current events and actions that the
Group may undertake in the future. However, actual results
could differ from those estimates.
Critical estimates and assumptions
Estimates and judgments are continually evaluated and are
based on historical experience and other factors, including
expectations of future events that are believed to be reason-
able under the circumstances.
The Group makes estimates and assumptions concerning the
future. The resulting accounting estimates will, by definition,
seldom equal the related actual results. The estimates and
assumptions that may have a significant risk of causing a
material adjustment to the carrying amounts of assets within
the next financial year relate primarily to goodwill and to a
lesser extent defined benefit obligations, deferred tax assets,
long-term provisions, depreciation of property, plant and
equipment and disclosure of contingent liabilities at the end
of the reporting period. The cost of defined benefit pension
plans and other post-employment benefits is determined
using actuarial valuations. The actuarial valuation involves
making assumptions about discount rates, expected rates of
return on plan assets, future salary increases, mortality rates
and future pension increases. Due to the long-term nature of
these plans, such estimates are subject to significant uncer-
tainty (note 32). The Group tests annually whether goodwill
has suffered any impairment in accordance with its account-
ing policy. The recoverable amounts of cash generating units
have been determined based on value-in-use calculations.
These calculations require the use of estimates (note 24).
All other estimates mentioned above are further detailed
in the corresponding disclosures.
Scope of consolidation
The consolidated financial statements comprise those of
Holcim Ltd and of its subsidiaries, including joint ventures.
The list of principal companies is presented in the section
“Principal companies of the Holcim Group”.
Principles of consolidation
Subsidiaries, which are those entities in which the Group has
an interest of more than one half of the voting rights or other-
wise has the power to exercise control over the operations,
are consolidated. Business combinations are accounted for
using the purchase method. The cost of an acquisition is
measured at the fair value of the consideration given at the
date of exchange plus any costs directly attributable to the
acquisition. Identifiable assets acquired and liabilities and
contingent liabilities assumed in a business combination
are measured initially at fair value at the date of acquisition,
irrespective of the extent of any minority interest assumed.
Subsidiaries are consolidated from the date on which control
is transferred to the Group and are no longer consolidated
from the date that control ceases.
All intercompany transactions and balances between Group
companies are eliminated.
It is common practice for the Group to write put options and
acquire call options in connection with the remaining shares
held by the minority shareholders both as part of and outside
a business combination. In such cases, the present value of the
redemption amount of the put option is recognized as a finan-
cial liability with any excess over the carrying amount of the
minority interest recognized as goodwill. To the extent that
the Group has a present ownership interest, no earnings are
attributed to minority interests. The financial liability is sub-
sequently measured at amortized cost. Effects of changes in
expected cash flows are charged against goodwill.
The Group’s interest in jointly controlled entities is consolidated
using the proportionate method of consolidation. Under this
method, the Group records its share of the joint ventures’
individual income and expenses, assets and liabilities and cash
flows in the consolidated financial statements on a line-by-
line basis. All transactions and balances between the Group
and joint ventures are eliminated to the extent of the Group’s
interest in the joint ventures.
Investments in associated companies are accounted for using
the equity method of accounting. These are companies over
which the Group generally holds between 20 and 50 percent
of the voting rights and has significant influence but does
not exercise control. Goodwill arising on the acquisition is in-
cluded in the carrying amount of the investment in associated
companies. Equity accounting is discontinued when the carry-
ing amount of the investment together with any long-term
121Consolidated Financial Statements
interest in an associated company reaches zero, unless the
Group has in addition either incurred or guaranteed additional
obligations in respect of the associated company.
Foreign currency translation
Income statements of foreign entities are translated into the
Group’s reporting currency at average exchange rates for
the year and statements of financial position are translated at
exchange rates ruling on December 31.
Goodwill arising on the acquisition of a foreign entity is ex-
pressed in the functional currency of the foreign operation
and is translated at the closing rate.
Foreign currency transactions are accounted for at the ex-
change rates prevailing at the date of the transactions; gains
and losses resulting from the settlement of such transactions
and from the translation of monetary assets and liabilities
denominated in foreign currencies are recognized in the in-
come statement, except when deferred outside the statement
of income as qualifying cash flow hedges.
Exchange differences arising on monetary items that form
part of an entity’s net investment in a foreign operation are
reclassified to equity (currency translation adjustment) in the
consolidated financial statements and are only released to
the income statement on the disposal of the foreign operation.
The individual financial statements of each of the Group’s
entities are measured using the currency of the primary
economic environment in which the entity operates (“the
functional currency”).
Segment information
Segment information is presented in respect of the Group’s
reportable segments.
For management purposes, the Group is organized by geo-
graphical areas and has five reportable segments based on
location of assets as follows:
Europe
North America
Latin America
Africa Middle East
Asia Pacific
Each of the reportable segments derives its revenues from the
sale of cement, aggregates and other construction materials
and services.
The Group has three product lines:
Cement, which comprises clinker and cement, mineral
components and other cementitious materials
Aggregates
Other construction materials and services, which comprises
ready-mix concrete, concrete products, asphalt, construction
and paving, trading and other products and services
Group financing (including financing costs and financing
income) and income taxes are managed on a Group basis and
are not allocated to any reportable segments.
Transfer prices between segments are set on an arm-length
basis in a manner similar to transactions with third parties.
Segment revenue and segment result include transfers between
segments. Those transfers are eliminated on consolidation.
Cash and cash equivalents
Cash and cash equivalents are financial assets. Cash equivalents
are readily convertible into a known amount of cash with original
maturities of three months or less. For the purpose of the state-
ment of cash flows, cash and cash equivalents comprise cash at
banks and in hand, deposits held on call with banks and other
short-term highly liquid investments, net of bank overdrafts.
Marketable securities
Marketable securities consist primarily of debt and equity
securities which are traded in liquid markets and are classified
as available-for-sale. They are carried at fair value with all fair
value changes recorded in other comprehensive earnings until
the financial asset is either impaired or disposed of at which
time the cumulative gain or loss previously recognized in
other comprehensive earnings is reclassified from equity to
the statement of income.
Accounts receivable
Trade accounts receivable are carried at original invoice amount
less an estimate made for doubtful debts based on a review of
all outstanding amounts of the financial asset at the year end.

122 Financial Information
Inventories
Inventories are stated at the lower of cost and net realizable
value. Cost is determined by using the weighted average cost
method. The cost of finished goods and work in progress com-
prises raw materials and additives, direct labor, other direct
costs and related production overheads. Cost of inventories
includes transfers from equity of gains or losses on qualifying
cash flow hedges relating to inventory purchases.
Long-term financial assets
Long-term financial assets consist of (a) investments in third
parties, (b) long-term receivables from associates, (c) long-
term receivables from third parties and (d) long-term deriva-
tive assets. Investments in third parties are classified as avail-
able-for-sale and long-term receivables from associates and
third parties are classified as loans and receivables. Long-term
derivative assets are regarded as held for hedging unless they
do not meet the strict hedging criteria under IAS 39 FinancialInstruments: Recognition and Measurement, in which case
they will be classified as held for trading.
All purchases and sales of investments are recognized on trade
date, which is the date that the Group commits to purchase
or sell the asset. Purchase cost includes transaction costs,
except for derivative instruments. Loans and receivables are
measured at amortized cost. Available-for-sale investments
are carried at fair value, while held-to-maturity investments
are carried at amortized cost using the effective interest
method. Gains and losses arising from changes in the fair
value of available-for-sale investments are included in other
comprehensive earnings until the financial asset is either
impaired or disposed of, at which time the cumulative gain
or loss previously recognized in other comprehensive earnings
is reclassified from equity to the statement of income.
Property, plant and equipment
Property, plant and equipment is valued at acquisition or con-
struction cost less depreciation and impairment loss. Cost in-
cludes transfers from equity of any gains or losses on qualifying
cash flow hedges. Depreciation is charged so as to write off the
cost of property, plant and equipment over their estimated useful
lives, using the straight-line method, on the following bases:
Land No depreciation except on land
with raw material reserves
Buildings and installations 20 to 40 years
Machinery 10 to 30 years
Furniture, vehicles and tools 3 to 10 years
Costs are only included in the asset’s carrying amount when
it is probable that economic benefits associated with the item
will flow to the Group in future periods and the cost of the
item can be measured reliably. Costs include the initial esti-
mate of the costs of dismantling and removing the item and
restoring the site on which it is located. All other repairs and
maintenance expenses are charged to the income statement
during the period in which they are incurred.
Mineral reserves, which are included in the class “land” of
property, plant and equipment, are valued at cost and are
depreciated based on the physical unit-of-production method
over their estimated commercial lives.
Costs incurred to gain access to mineral reserves are capital-
ized and depreciated over the life of the quarry, which is based
on the estimated tonnes of raw material to be extracted from
the reserves.
Interest cost on borrowings to finance construction projects
which necessarily takes a substantial period of time to get
ready for their intended use are capitalized during the
period of time that is required to complete and prepare
the asset for its intended use. All other borrowing costs are
expensed in the period in which they are incurred.
Government grants received are deducted from property, plant
and equipment and reduce the depreciation charge accordingly.
Leases of property, plant and equipment where the Group has
substantially all the risks and rewards of ownership are classi-
fied as finance leases. Property, plant and equipment acquired
through a finance lease is capitalized at the date of the com-
mencement of the lease term at the present value of the mini-
mum future lease payments as determined at the inception
of the lease. The corresponding lease obligations, excluding
finance charges, are included in either current or long-term
financial liabilities.
For sale-and-lease-back transactions, the book value of the
related property, plant or equipment remains unchanged.
Proceeds from a sale are included as a financing liability and
the financing costs are allocated over the term of the lease in
such a manner that the costs are reported over the relevant
periods.

123Consolidated Financial Statements
Non-current assets (or disposal groups) classified
as held for sale
Non-current assets (or disposal groups) are classified as held
for sale and stated at the lower of carrying amount and
fair value less costs to sell if their carrying amount is to be
recovered principally through a sale transaction rather than
through continuing use.
Goodwill
Goodwill represents the excess of the cost of an acquisition
over the Group’s interest in the fair value of the identifiable
assets, liabilities and contingent liabilities of a subsidiary,
associate or joint venture at the date of acquisition. Goodwill
on acquisitions of subsidiaries and interests in joint ventures
is included in intangible assets. Goodwill on acquisitions of
associates is included in investments in associates. Goodwill
that is recognized as an intangible asset is tested annually
for impairment or whenever there are impairment indicators
and carried at cost less accumulated impairment losses.
On disposal of a subsidiary, associate or joint venture, the
related goodwill is included in the determination of profit or
loss on disposal.
Goodwill on acquisitions of subsidiaries and interests in joint
ventures is allocated to cash generating units for the purpose
of impairment testing (note 24). Impairment losses relating to
goodwill cannot be reversed in future periods.
In the event that Holcim acquires a minority interest in a
subsidiary, goodwill is measured at cost, which represents
the excess of the purchase consideration given over Holcim’s
additional interest in the book value of the net assets acquired.
If the cost of acquisition is less than the fair value of the net
assets of the subsidiary acquired, the difference is recognized
directly in the income statement.
Computer software
Costs associated with developing or maintaining computer
software programs are recognized as an expense as incurred.
Costs that are directly associated with identifiable and unique
software products controlled by the Group and which will
probably generate economic benefits exceeding costs beyond
one year are recognized as intangible assets.
Expenditures which enhance or extend the performance of
computer software programs beyond their original specifica-
tions are capitalized and added to the original cost of the
software. Computer software development costs recognized
as assets are amortized using the straight-line method over
their useful lives, but not exceeding a period of three years.
Other intangible assets
Expenditure on acquired patents, trademarks and licenses is
capitalized and amortized using the straight-line method
over their estimated useful lives, but not exceeding 20 years.
Impairment of non-financial assets
At each reporting date, the Group assesses whether there is
any indication that a non-financial asset may be impaired.
If any such indication exists, the recoverable amount of the
non-financial asset is estimated in order to determine the
extent of the impairment loss, if any. Where it is not possible
to estimate the recoverable amount of an individual non-
financial asset, the Group estimates the recoverable amount
of the smallest cash generating unit to which the non-finan-
cial asset belongs.
If the recoverable amount of a non-financial asset or cash gen-
erating unit is estimated to be less than its carrying amount,
the carrying amount of the non-financial asset or cash gener-
ating unit is reduced to its recoverable amount. Impairment
losses are recognized immediately in the income statement.
Where an impairment loss subsequently reverses, the carrying
amount of the non-financial asset or cash generating unit is
increased to the revised estimate of its recoverable amount.
However, this increased amount cannot exceed the carrying
amount that would have been determined had no impairment
loss been recognized for that non-financial asset or cash gen-
erating unit in prior periods. A reversal of an impairment loss
is recognized immediately in the income statement.

124 Financial Information
Impairment of financial assets
At each reporting date, the Group assesses whether there is
any indication that a financial asset may be impaired.
An impairment loss in respect of a financial asset measured
at amortized cost is calculated as the difference between its
carrying amount and the present value of the future estimated
cash flows discounted at the original effective interest rate.
The carrying amount of the asset is reduced through
the use of an allowance account. The amount of the loss is
recognized in profit or loss.
If, in a subsequent period, the amount of the impairment loss
decreases and the decrease can be related objectively to an
event occurring after the impairment was recognized, the
previously recognized impairment loss is reversed to the
extent that the carrying value of the asset does not exceed
its amortized cost at the reversal date. Any reversal of an
impairment loss is recognized in profit or loss.
An impairment loss in respect of an available-for-sale financial
asset is recognized in the income statement and is calculated
by reference to its fair value. Individually significant financial
assets are tested for impairment on an individual basis.
Reversals of impairment losses on equity instruments classi-
fied as available-for-sale are recognized in other comprehen-
sive earnings while reversals of impairment losses on debt
instruments are recognized in profit or loss if the increase in
fair value of the instrument can be objectively related to an
event occurring after the impairment loss was recognized in
the income statement.
In relation to accounts receivable, a provision for impairment is
made when there is objective evidence (such as the probability
of insolvency or significant financial difficulties of the debtor)
that the Group will not be able to collect all of the amounts
due under the original terms of the invoice. The carrying
amount of the receivable is reduced through use of an
allowance account. Impaired receivables are derecognized
when they are assessed as uncollectible.
Long-term financial liabilities
Bank loans acquired and non-convertible bonds issued are
recognized initially at the proceeds received, net of transaction
costs incurred. Subsequently, bank loans and non-convertible
bonds are stated at amortized cost using the effective interest
method with any difference between proceeds (net of trans-
action costs) and the redemption value being recognized in the
income statement over the term of the borrowings.
Upon issuance of convertible bonds, the fair value of the
liability portion is determined using a market interest rate
for an equivalent non-convertible bond; this amount is carried
as a long-term liability on the amortized cost basis using the
effective interest method until extinguishment on conversion
or maturity of the bonds. The remainder of the proceeds is
allocated to the conversion option which is recognized and
included in shareholders’ equity; the value of the conversion
option is not changed in subsequent periods.
Long-term derivative liabilities are regarded as held for hedging
unless they do not meet the strict hedging criteria under
IAS 39 Financial Instruments: Recognition and Measurement,in which case they will be classified as held for trading.
Financial liabilities that are due within 12 months after the end
of the reporting period are classified as current liabilities unless
the Group has an unconditional right to defer settlement of the
liability until more than 12 months after the reporting period.
Deferred taxes
Deferred tax is provided, using the balance sheet liability
method, on temporary differences arising between the tax
bases of assets and liabilities and their carrying amounts
in the financial statements. Tax rates enacted or substantially
enacted by the end of the reporting period are used to deter-
mine the deferred tax expense.
Deferred tax assets are recognized to the extent that it is
probable that future taxable profit will be available against
which temporary differences or unused tax losses can be utilized.
Deferred tax liabilities are recognized for taxable temporary
differences arising from investments in subsidiaries, associates
and joint ventures except where the Group is able to control
the distribution of earnings from these respective entities
and where dividend payments are not expected to occur in the
foreseeable future.
125Consolidated Financial Statements
Deferred tax is charged or credited in the income statement,
except when it relates to items credited or charged outside
the statement of income, in which case the deferred tax is
treated accordingly.
Site restoration and other environmental provisions
The Group provides for the costs of restoring a site where a legal
or constructive obligation exists. The cost of raising a provision
before exploitation of the raw materials has commenced is
included in property, plant and equipment and depreciated
over the life of the site. The effect of any adjustments to the
provision due to further environmental damage is recorded
through operating costs over the life of the site to reflect the
best estimate of the expenditure required to settle the obliga-
tion at the end of the reporting period. Changes in the measure-
ment of a provision that result from changes in the estimated
timing or amount of cash outflows, or a change in the discount
rate, are added to, or deducted from, the cost of the related
asset as appropriate in the current period. All provisions are dis-
counted to their present value based on a long-term borrowing
rate.
Emission rights
The initial allocation of emission rights granted is recognized
at nominal amount (nil value). Where a Group company has
emissions in excess of the emission rights granted, it will
recognize a provision for the shortfall based on the market
price at that date. The emission rights are held for compliance
purposes only and therefore the Group does not intend to
speculate with these in the open market.
Other provisions
A provision is recognized when there exists a legal or con-
structive obligation arising from past events and it is probable
that an outflow of resources embodying economic benefits
will be required to settle the obligation and a reliable estimate
can be made of this amount.
Employee benefits – Defined benefit plans
Some Group companies provide defined benefit pension plans
for employees. Professionally qualified independent actuaries
value the defined benefit obligations on a regular basis. The
obligation and costs of pension benefits are determined using
the projected unit credit method. The projected unit credit
method considers each period of service as giving rise to an
additional unit of benefit entitlement and measures each unit
separately to build up the final obligation. Past service costs
are recognized on a straight-line basis over the average period
until the amended benefits become vested. Gains or losses on
the curtailment or settlement of pension benefits are recog-
nized when the curtailment or settlement occurs.
Actuarial gains or losses are amortized based on the expected
average remaining working lives of the participating employ-
ees, but only to the extent that the net cumulative unrecog-
nized amount exceeds 10 percent of the greater of the present
value of the defined benefit obligation and the fair value of
plan assets at the end of the previous year. The pension obli-
gation is measured at the present value of estimated future
cash flows using a discount rate that is similar to the interest
rate on high-quality corporate bonds where the currency and
terms of the corporate bonds are consistent with the currency
and estimated terms of the defined benefit obligation.
A net pension asset is recorded only to the extent that it does
not exceed the present value of any economic benefits avail-
able in the form of refunds from the plan or reductions in
future contributions to the plan and any unrecognized net
actuarial losses and past service costs.
Employee benefits – Defined contribution plans
In addition to the defined benefit plans described above, some
Group companies sponsor defined contribution plans based
on local practices and regulations. The Group’s contributions
to defined contribution plans are charged to the income state-
ment in the period to which the contributions relate.
Employee benefits – Other long-term employment benefits
Other long-term employment benefits include long-service
leave or sabbatical leave, medical aid, jubilee or other long-
service benefits, long-term disability benefits and, if they are
not payable wholly within twelve months after the year end,
profit sharing, variable and deferred compensation.
126 Financial Information
The measurement of these obligations differs from defined
benefit plans in that all actuarial gains and losses are recog-
nized immediately and no corridor approach is applied.
Employee benefits – Equity compensation plans
The Group operates various equity-settled share-based com-
pensation plans. The fair value of the employee services
received in exchange for the grant of the options or shares is
recognized as an expense. The total amount to be expensed
is determined by reference to the fair value of the equity
instruments granted. The amounts are charged to the income
statement over the relevant vesting periods and adjusted to
reflect actual and expected levels of vesting (note 32).
Minority interests
Minority interests represent the portion of profit or loss and
net assets not held by the Group and are presented separately
in the consolidated statement of income, in the consolidated
statement of comprehensive earnings and within equity in the
consolidated statement of financial position.
Revenue recognition
Revenue is recognized when it is probable that the economic
benefits associated with the transaction will flow to the enter-
prise and the amount of the revenue can be measured reliably.
Revenue is measured at the fair value of the consideration re-
ceived net of sales taxes and discounts. Revenue from the sale
of goods is recognized when delivery has taken place and the
transfer of risks and rewards of ownership has been completed.
Interest is recognized on a time proportion basis that reflects
the effective yield on the asset. Dividends are recognized when
the shareholder’s right to receive payment is established.
Certain activities of the Group are construction contract
driven. Consequently, contract revenue and contract costs
are recognized in the income statement on the percentage
of completion method, with the stage of completion being
measured by reference to actual work performed to date.
Contingent liabilities
Contingent liabilities arise from conditions or situations
where the outcome depends on future events. They are
disclosed in the notes to the financial statements.
Financial instruments
Information about accounting for derivative financial
instruments and hedging activities is included in the section
“Risk management”.

127Consolidated Financial Statements
Business risk management
Business Risk Management supports the Executive Committee
and the management teams of the Group companies in their
strategic decisions. Business Risk Management aims to systemati-
cally recognize major risks facing the company. Potential risks are
identified and evaluated at an early stage and constantly moni-
tored. Countermeasures are then proposed and implemented at
the appropriate level. All types of risk, from market, operations,
finance and legal up to the external business environment, are
considered including compliance and reputational aspects.
In addition to the Group companies, the Executive Committee
and the Board of Directors are also involved in the assessment.
The Group’s risk profile is assessed from a variety of top-down
and bottom-up angles. The Executive Committee reports regu-
larly to the Board of Directors on important risk analysis findings
and provides updates on the measures taken.
Financial risk management
The Group’s activities expose it to a variety of financial risks,
including the effect of changes in debt structure and equity
market prices, foreign currency exchange rates and interest
rates. The Group’s overall risk management program focuses
on the unpredictability of financial markets and seeks to mini-
mize potential adverse effects on the financial performance
of the Group. The Group uses derivative financial instruments
such as foreign exchange contracts and interest rate swaps to
hedge certain exposures. Therefore, the Group does not enter
into derivative or other financial transactions which are unre-
lated to its operating business. As such, a risk-averse approach
is pursued.
Financial risk management within the Group is governed by
policies approved by Group management. It provides princi-
ples for overall risk management as well as policies covering
specific areas such as interest rate risk, foreign exchange risk,
counterparty risk, use of derivative financial instruments and
investing excess liquidity.
Market risk
Holcim is exposed to market risk, primarily relating to foreign
exchange and interest rate risk. Management actively moni-
tors these exposures. To manage the volatility relating to
these exposures, Holcim enters into a variety of derivative
financial instruments. The Group’s objective is to reduce,
where appropriate, fluctuations in earnings and cash flows
associated with changes in foreign exchange and interest rate
risk. To manage liquid funds, it might write call options on
assets it has or it might write put options on positions it wants
to acquire and has the liquidity to acquire. Holcim, therefore,
expects that any loss in value of those instruments generally
would be offset by increases in the value of the underlying
transactions.
Liquidity risk
Group companies need a sufficient availability of cash to meet
their obligations. Individual companies are responsible for
their own cash surpluses and the raising of loans to cover cash
deficits, subject to guidance by the Group and, in certain
cases, for approval at Group level.
The Group monitors its liquidity risk by using a recurring
liquidity planning tool and maintains sufficient reserves of
cash, unused credit lines and readily realizable marketable
securities to meet its liquidity requirements at all times.
In addition, the strong international creditworthiness of the
Group allows it to make efficient use of international financial
markets for financing purposes.
Risk management

128 Financial Information
Contractual maturity analysis
Contractual cash flows
Within Within Within Within Within Thereafter Total
Million CHF 1 year 2 years 3 years 4 years 5 years
2009
Trade accounts payable 2,223 2,223
Loans from financial institutions 3,347 666 752 1,150 107 236 6,258
Bonds and private placements 1,392 682 1,062 2,454 2,166 4,098 11,854
Interest payments 738 627 615 482 384 1,255 4,101
Finance leases 35 28 28 11 11 73 186
Derivative financial instruments
held for hedging net1 (40) (26) (16) (64) (13) (65) (224)
Total 7,695 1,977 2,441 4,033 2,655 5,597 24,398
2008
Trade accounts payable 2,566 2,566
Loans from financial institutions 4,649 755 623 611 3,023 682 10,343
Bonds and private placements 1,127 1,195 669 564 1,345 2,994 7,894
Interest payments 693 473 375 352 259 547 2,699
Finance leases 42 30 29 23 10 84 218
Derivative financial instruments
held for hedging net1 (62) (59) (48) (41) 37 (20) (193)
Total 9,015 2,394 1,648 1,509 4,674 4,287 23,527
The maturity profile is based on the contractual undiscounted
amounts including both interest and principal cash flows
and on the basis of the earliest date on which Holcim can be
required to pay.
Contractual interest cash flows relating to a variable interest
rate are calculated based on the rates prevailing as of Decem-
ber 31.
1 The contractual cash flows for derivative financial instruments held for hedging include both cash in- and outflows. Additional information is disclosed in note 29.
129Consolidated Financial Statements
Interest rate risk
The Group is exposed to fluctuations in financing costs and
market value movements of its debt portfolio related to
changes in market interest rates. Given the Group’s substan-
tial borrowing position, interest rate exposure is mainly
addressed through the steering of the fixed/floating ratio of
debt. To manage this mix, Holcim may enter into interest rate
swap agreements, in which it exchanges periodic payments,
based on notional amounts and agreed-upon fixed and vari-
able interest rates.
Interest rate sensitivity
The Group’s exposure to the risk of changes in market interest
rates relates primarily to the Group’s financial liabilities at
variable interest rates on a post hedge basis.
The Group’s sensitivity analysis has been determined based
on the interest rate exposure as at December 31. A 1 percent
change is used when the interest rate risk is reported internally
to key management personnel and represents management’s
assessment of a reasonably possible change in interest rates.
At December 31, a ±1 percent shift in interest rates, with all
other assumptions held constant, would result in approxi-
mately CHF 68 million (2008: 92) of annual additional/lower
financial expenses before tax on a post hedge basis. The
Group’s sensitivity to interest rates is lower than last year
mainly due to the fact that the ratio of financial liabilities
at variable rates to total financial liabilities has decreased
from 69 percent to 49 percent.
Impacts on equity due to derivative instruments are con-
sidered as not material based on the shareholders’ equity
of Group Holcim.
Foreign currency risk
The Group operates internationally and therefore is exposed
to foreign currency risks arising primarily from USD, GBP and
EUR but also from various currency exposures in currencies
from Europe, North America, Latin America, Africa Middle East
and Asia Pacific.
The translation of foreign operations into the Group reporting
currency leads to currency translation effects. The Group may
hedge certain net investments in foreign entities with foreign
currency borrowings or other instruments. Hedges of net
investments in foreign entities are accounted for similarly to
cash flow hedges. To the extent that the net investment hedge
is effective, all foreign exchange gains or losses are recognized
in equity and included in cumulative translation differences.
Due to the local nature of the construction materials business,
transaction risk is limited. However, for many Group compa-
nies, income will be primarily in local currency whereas debt
servicing and a significant amount of capital expenditures
may be in foreign currencies. As a consequence thereof,
subsidiaries may enter into derivative contracts which are
designated as either cash flow hedges or fair value hedges,
as appropriate, but which does not include the hedging of
forecasted transactions as it is not considered economical.

130 Financial Information
Foreign currency sensitivity
Transaction exposure arises on monetary financial assets and
liabilities that are denominated in a foreign currency other
than the functional currency in which they are measured.
The Group’s sensitivity analysis has been determined based
on the Group’s net transaction exposure as at December 31.
A 5 percent change is used when the net foreign currency
transaction risk is reported internally to key management
personnel and represents management’s assessment of a
reasonably possible change in foreign exchange rates.
At December 31, a ±5 percent shift in the USD against the cur-
rencies the Group operates in would result in approximately
CHF 0.5 million (2008: 10) of annual additional/lower foreign
exchange losses before tax on a post hedge basis in the state-
ment of income.
A ±5 percent change in the CHF, EUR and GBP against the
respective currencies would only have an immaterial impact
on foreign exchange losses before tax on a post hedge basis
in both the current and prior year.
Impacts on equity due to derivative instruments are consid-
ered as not material based on the shareholders’ equity of
Group Holcim.
Equities and securities risk
In general, the Group does not hold or acquire any shares
or options on shares or other equity products, which are not
directly related to the business of the Group.
Capital structure
The Group’s objectives when managing capital are to secure the
Group’s ongoing financial needs to continue as a going concern
as well as to cater for its growth targets in order to provide
returns to shareholders and benefits for other stakeholders and
to maintain a cost-efficient and risk-optimized capital structure.
The Group manages the capital structure and makes adjust-
ments to it in the light of changes in economic conditions, its
business activities, investment and expansion program and the
risk characteristics of the underlying assets. In order to main-
tain or adjust the capital structure, the Group may adjust the
amount of dividends paid to shareholders, return capital to
shareholders, issue new shares, increase debt or sell assets to
reduce debt.
The Group monitors capital, among others, on the basis of both
the ratio of funds from operations as a percentage of net finan-
cial debt and gearing.
Funds from operations is calculated as net income plus
depreciation, amortization and impairment as shown in
the consolidated statement of income. Net financial debt is
calculated as financial liabilities less cash and cash equivalents
as shown in the consolidated statement of financial position.
Gearing is calculated as net financial debt divided by total
shareholders’ equity as shown in the consolidated statement of
financial position.
During 2009, the Group’s target, which was unchanged from
2008, was to maintain a ratio of funds from operations as a
percentage of net financial debt of at least 25 percent and
a gearing in the range of no more than 100 percent in order
to maintain a solid investment grade rating.
Despite a decrease in net income, the ratio funds from
operations/net financial debt was kept stable as a result
of decreasing net financial debt.
The decrease in gearing arose due to decreased net financial
debt as well as increased total shareholders’ equity. Share-
holders’ equity increased by 22.6 percent during 2009 mainly
as a result of the capital increase which took place in 2009.

131Consolidated Financial Statements
Million CHF 2009 2008
Net income 1,958 2,226
Depreciation, amortization and impairment (note 9) 1,858 1,985
Funds from operations 3,816 4,211
Financial liabilities (note 27) 18,307 18,652
Cash and cash equivalents (note 17) (4,474) (3,605)
Net financial debt 13,833 15,047
Funds from operations/net financial debt 27.6% 28.0%
Million CHF 2009 2008
Net financial debt 13,833 15,047
Total shareholders’ equity 22,044 17,974
Gearing 62.8% 83.7%
132 Financial Information
Credit risk
Credit risks arise from the possibility that customers may not
be able to settle their obligations as agreed. To manage this
risk, the Group periodically assesses the financial reliability
of customers.
Credit risks, or the risk of counterparties defaulting, are con-
stantly monitored. Counterparties to financial instruments
consist of a large number of major financial institutions.
The Group does not expect any counterparties to fail to meet
their obligations, given their high credit ratings. In addition,
Holcim has no significant concentration of credit risk with any
single counterparty or group of counterparties.
The maximum exposure to credit risk is represented by the
carrying amount of each financial asset, including derivative
financial instruments, in the statement of financial position.
Accounting for derivative financial instruments
and hedging activities
Derivatives are initially recognized at fair value on the date
a derivative contract is entered into and are subsequently
remeasured at their fair value. The method of recognizing the
resulting gain or loss is dependent on the nature of the item
being hedged. On the date a derivative contract is entered
into, the Group designates certain derivatives as either (a)
a hedge of the fair value of a recognized asset or liability
(fair value hedge) or (b) a hedge of a particular risk associated
with a recognized asset or liability, such as future interest
payments on floating rate debt (cash flow hedge) or (c) a hedge
of a foreign currency risk of a firm commitment (cash flow
hedge) or (d) a hedge of a net investment in a foreign entity.
Changes in the fair value of derivatives that are designated
and qualify as fair value hedges and that are highly effective
are recorded in the income statement, along with any changes
in the fair value of the hedged asset or liability that is attrib-
utable to the hedged risk.
Changes in the fair value of derivatives that are designated
and qualify as cash flow hedges and that are highly effective
are recognized outside the statement of income. Where the
firm commitment results in the recognition of an asset, for
example, property, plant and equipment, or a liability, the
gains or losses previously deferred in equity are transferred
from equity and included in the initial measurement of the
non-financial asset or liability. Otherwise, amounts deferred in
equity are transferred to the income statement and classified
as revenue or expense in the same periods during which the
cash flows, such as interest payments, or hedged firm commit-
ments, affect the income statement.
Changes in the fair value of derivatives that are designated
and qualify as net investment hedges and that are highly
effective are recognized outside the statement of income and
included in cumulative translation differences. The amounts
deferred in equity are transferred to the income statement on
disposal of the foreign entity.
Certain derivative transactions, while providing effective eco-
nomic hedges under the Group’s risk management policies,
may not qualify for hedge accounting under the specific rules
in IAS 39. Changes in the fair value of any derivative instru-
ments that do not qualify for hedge accounting under IAS 39
are recognized immediately in the income statement.
When a hedging instrument is sold, or when a hedge no
longer meets the criteria for hedge accounting under IAS 39,
any cumulative gain or loss recognized in equity at that time
remains in equity until the committed transaction occurs.
However, if a committed transaction is no longer expected to
occur, the cumulative gain or loss that was reported in equity
is immediately transferred to the income statement. In the case
of a fair value hedge, however, the adjustment to the carrying
amount of the hedged item is amortized to net profit or loss
from the moment it ceases to be adjusted for in changes to
fair value, with it being fully amortized by maturity date.

133Consolidated Financial Statements
The Group documents at the inception of the transaction the
relationship between hedging instruments and hedged items
as well as its risk management objective and strategy for
undertaking various hedge transactions. This process includes
linking all derivatives designated as hedges to specific assets
and liabilities or to specific firm commitments or to investments
in foreign entities. The Group also documents its assessment,
both at hedge inception and on an ongoing basis, of whether
the derivatives that are used in hedging transactions are
highly effective in offsetting changes in fair values or cash
flows of hedged items including translation gains and losses
in hedged foreign investments.
The fair values of various derivative instruments used for
hedging purposes are disclosed in note 29. Movements in the
cash flow hedging reserve and available-for-sale equity re-
serve are shown in the statement of changes in consolidated
equity of Group Holcim.
Fair value estimation
The fair value of publicly traded derivatives and available-for-
sale assets is generally based on quoted market prices at
the end of the reporting period. The fair value of interest rate
swaps is calculated as the present value of the estimated
future cash flows. The fair value of forward foreign exchange
contracts is determined using forward exchange market rates
at the end of the reporting period.
In assessing the fair value of non-traded derivatives and other
financial instruments, the Group uses a variety of methods
and makes assumptions that are based on market conditions
existing at the end of the reporting period. Other techniques,
such as option pricing models and estimated discounted value
of future cash flows, are used to determine fair values for the
remaining financial instruments.
The amortized cost for financial assets and liabilities with a
maturity of less than one year are assumed to approximate
their fair values.
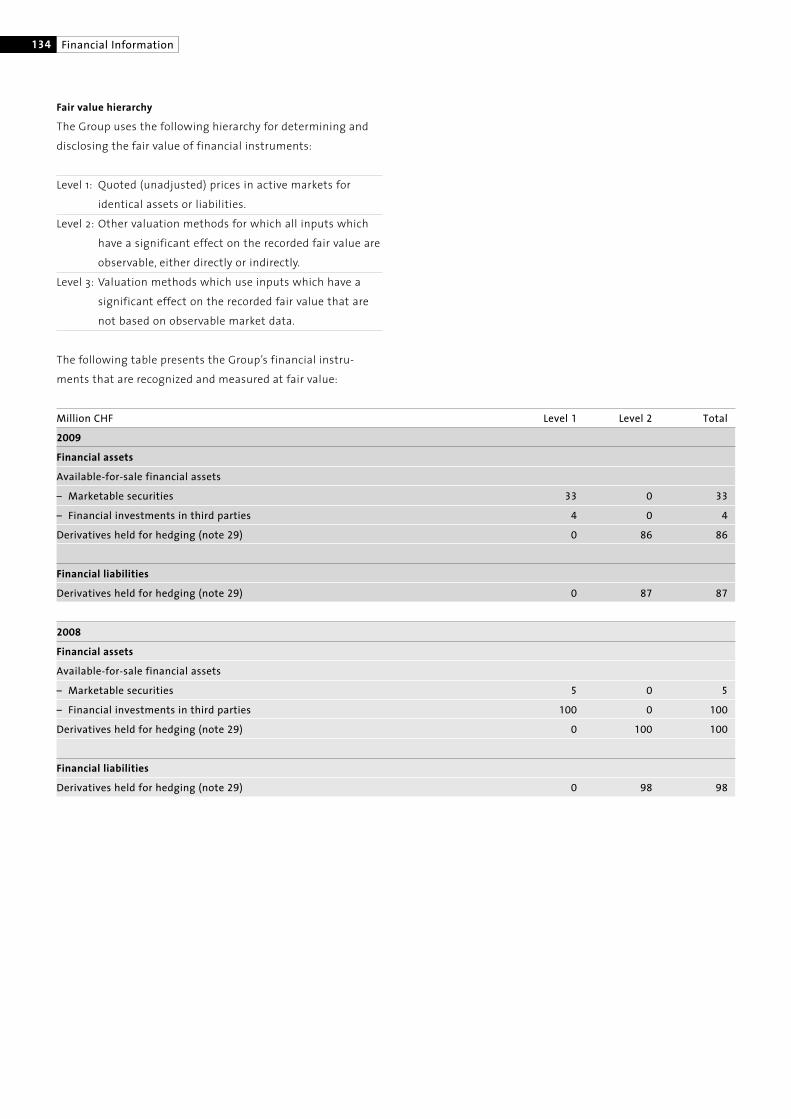
134 Financial Information
2008
Financial assets
Available-for-sale financial assets
– Marketable securities 5 0 5
– Financial investments in third parties 100 0 100
Derivatives held for hedging (note 29) 0 100 100
Financial liabilities
Derivatives held for hedging (note 29) 0 98 98
Million CHF Level 1 Level 2 Total
2009
Financial assets
Available-for-sale financial assets
– Marketable securities 33 0 33
– Financial investments in third parties 4 0 4
Derivatives held for hedging (note 29) 0 86 86
Financial liabilities
Derivatives held for hedging (note 29) 0 87 87
Fair value hierarchy
The Group uses the following hierarchy for determining and
disclosing the fair value of financial instruments:
Level 1: Quoted (unadjusted) prices in active markets for
identical assets or liabilities.
Level 2: Other valuation methods for which all inputs which
have a significant effect on the recorded fair value are
observable, either directly or indirectly.
Level 3: Valuation methods which use inputs which have a
significant effect on the recorded fair value that are
not based on observable market data.
The following table presents the Group’s financial instru-
ments that are recognized and measured at fair value:

135Consolidated Financial Statements
Newly included in 2009 Effective as at
Holcim Australia October 1, 2009
Cement Australia (50 percent) October 1, 2009
Deconsolidated in 2009 Effective as at
United Cement Company of Nigeria Ltd April 1, 2009
Deconsolidated in 2008 Effective as at
Holcim Venezuela December 31, 2008
Egyptian Cement Company January 23, 2008
The scope of consolidation has been affected mainly by the
following additions and deconsolidations made during 2009
and 2008:
1 Changes in the scope of consolidation
Notes to the consolidated financial statements
On October 1, 2009, Holcim acquired 100 percent of the share
capital of Holcim Australia (formerly Cemex Australia), including
its 25 percent interest in Cement Australia.
As a result of the acquisition of Holcim Australia, Holcim’s
interest in Cement Australia increased from 50 percent to
75 percent. Until September 30, 2009, Holcim accounted for
Cement Australia as a joint venture and proportionately
consolidated its 50 percent interest. As from October 1, 2009,
Cement Australia has been fully consolidated.
The identifiable assets and liabilities arising from the acquisition
are as follows:
Assets and liabilities arising from the acquisition
of Holcim Australia and Cement Australia (consolidated)
Million CHF Fair Carrying
value amount1
Current assets 648 648
Property, plant and equipment 1,852 1,635
Other assets 227 304
Short-term liabilities (492) (479)
Long-term provisions (238) (148)
Other long-term liabilities (372) (383)
Net assets 1,625 1,577
Previously held net assets
of Cement Australia (50 percent) (201)
Minority interest in Cement Australia
(25 percent) (100)
Net assets acquired 1,324
Total purchase consideration (cash) 1,725
Fair value of net assets acquired (1,324)
Goodwill 401
1 Excluding goodwill previously included in the accounts of Cement Australia.
The amounts disclosed above were determined provisionally.
Further adjustments may be made to the fair values assigned
to the identifiable assets acquired and liabilities assumed up to
twelve months from the date of acquisition.
136 Financial Information
On January 23, 2008, a competitor acquired 100 percent of the
outstanding shares of Orascom Cement, an affiliated company
of Orascom Construction Industries (OCI). Orascom Cement
owns 53.7 percent of the shares in Egyptian Cement Company.
As a result of a joint venture agreement with OCI, Holcim pro-
portionately consolidated its 43.7 percent interest in Egyptian
Cement Company. Given the acquisition of Orascom Cement by
a competitor, the joint venture agreement between OCI and
Holcim became void and Holcim applies equity accounting
in accordance with IAS 28 to its investment as of this date.
Since Holcim’s stake remains unchanged, the above event will
therefore have no impact on consolidated net income.
The impact of the above resulted in Group Holcim derecognizing
its proportionate interest of total assets and liabilities amount-
ing to CHF 933 million and CHF 605 million respectively including
the derecognition of attributable goodwill of CHF 80 million
and the recognition of an investment in an associate of CHF 223
million (note 22).
Business combinations individually not material are included
in aggregate in note 38. If the acquisitions had occured on
January 1, 2009, Group net sales and net income would have
remained substantially unchanged.
An overview of the subsidiaries, joint ventures and associated
companies is included in the section “Principal companies of
the Holcim Group” on pages 180 to 182.
The total goodwill arising from this transaction is CHF 401 mil-
lion of which CHF 98 million had been previously recognized
in the accounts of the former joint venture Cement Australia.
The goodwill is attributable to the favorable presence that
both Holcim Australia and Cement Australia enjoy in Australia,
including the good location and strategic importance of mineral
reserves.
Holcim Australia and Cement Australia (50 percent) contributed
net income of CHF 40 million to the Group for the period from
October 1, 2009 to December 31, 2009. If the acquisition had
occurred on January 1, 2009, Group net sales and net income
would have been CHF 1,268 million and CHF 123 million higher
respectively.
On April 1, 2009, United Cement Company of Nigeria Ltd was
deconsolidated as joint control ceased and recognized as an
investment in associate as a result of retaining significant
influence. The impact of the above resulted in Group Holcim
derecognizing its proportionate interest of total assets and
liabilities amounting to CHF 476 million and CHF 533 million
respectively and the recognition of an investment in an asso-
ciate at zero cost.
At December 31, 2008, Holcim Venezuela was deconsolidated
and classified as assets held for sale.
The impact of the above resulted in Group Holcim derecognizing
assets and liabilities amounting to CHF 313 million and CHF 96
million respectively including the derecognition of attributable
goodwill of CHF 3 million and the recognition of an investment
in an associate of CHF 220 million (note 20).

137Consolidated Financial Statements
2 Foreign currenciesStatement of income Statement of financial position
Average exchange rates in CHF Year-end exchange rates in CHF
2009 2008 ±% 31.12.2009 31.12.2008 ±%
1 EUR 1.51 1.59 –5.0 1.49 1.49 –
1 GBP 1.70 1.99 –14.6 1.66 1.53 +8.5
1 USD 1.09 1.08 +0.9 1.03 1.06 –2.8
1 CAD 0.95 1.01 –5.9 0.98 0.87 +12.6
100 MXN 8.02 9.72 –17.5 7.88 7.68 +2.6
100 INR 2.24 2.48 –9.7 2.21 2.18 +1.4
100 THB 3.15 3.22 –2.2 3.08 3.02 +2.0
1,000 IDR 0.11 0.11 – 0.11 0.10 +10.0
100 PHP 2.28 2.43 –6.2 2.23 2.25 –0.9
1 AUD 0.86 0.91 –5.5 0.93 0.73 +27.4
The following table summarizes the principal exchange rates
that have been used for translation purposes.
2 Foreign currencies
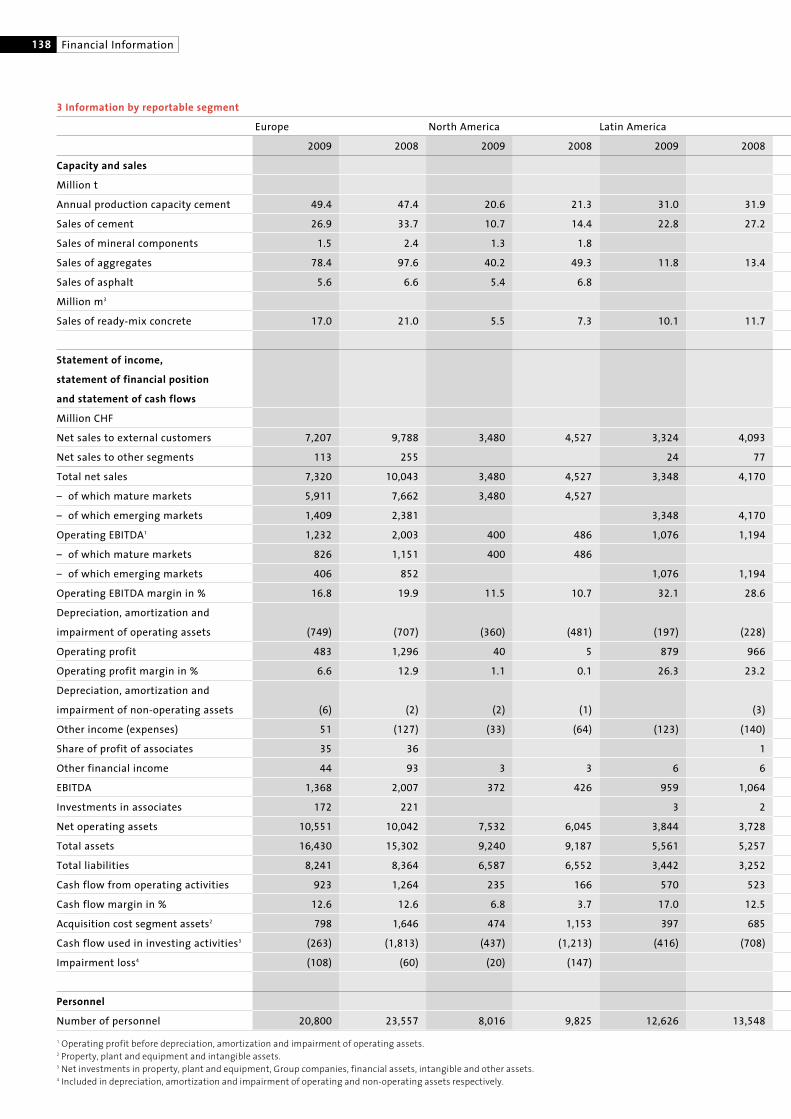
138 Financial Information
1 Operating profit before depreciation, amortization and impairment of operating assets.2 Property, plant and equipment and intangible assets.3 Net investments in property, plant and equipment, Group companies, financial assets, intangible and other assets.4 Included in depreciation, amortization and impairment of operating and non-operating assets respectively.
3 Information by reportable segment
Europe North America Latin America
2009 2008 2009 2008 2009 2008
Capacity and sales
Million t
Annual production capacity cement 49.4 47.4 20.6 21.3 31.0 31.9
Sales of cement 26.9 33.7 10.7 14.4 22.8 27.2
Sales of mineral components 1.5 2.4 1.3 1.8
Sales of aggregates 78.4 97.6 40.2 49.3 11.8 13.4
Sales of asphalt 5.6 6.6 5.4 6.8
Million m3
Sales of ready-mix concrete 17.0 21.0 5.5 7.3 10.1 11.7
Statement of income,
statement of financial position
and statement of cash flows
Million CHF
Net sales to external customers 7,207 9,788 3,480 4,527 3,324 4,093
Net sales to other segments 113 255 24 77
Total net sales 7,320 10,043 3,480 4,527 3,348 4,170
– of which mature markets 5,911 7,662 3,480 4,527
– of which emerging markets 1,409 2,381 3,348 4,170
Operating EBITDA1 1,232 2,003 400 486 1,076 1,194
– of which mature markets 826 1,151 400 486
– of which emerging markets 406 852 1,076 1,194
Operating EBITDA margin in % 16.8 19.9 11.5 10.7 32.1 28.6
Depreciation, amortization and
impairment of operating assets (749) (707) (360) (481) (197) (228)
Operating profit 483 1,296 40 5 879 966
Operating profit margin in % 6.6 12.9 1.1 0.1 26.3 23.2
Depreciation, amortization and
impairment of non-operating assets (6) (2) (2) (1) (3)
Other income (expenses) 51 (127) (33) (64) (123) (140)
Share of profit of associates 35 36 1
Other financial income 44 93 3 3 6 6 1 1 2
EBITDA 1,368 2,007 372 426 959 1,064
Investments in associates 172 221 3 2 2 2 5
Net operating assets 10,551 10,042 7,532 6,045 3,844 3,728
Total assets 16,430 15,302 9,240 9,187 5,561 5,257
Total liabilities 8,241 8,364 6,587 6,552 3,442 3,252
Cash flow from operating activities 923 1,264 235 166 570 523
Cash flow margin in % 12.6 12.6 6.8 3.7 17.0 12.5
Acquisition cost segment assets2 798 1,646 474 1,153 397 685
Cash flow used in investing activities3 (263) (1,813) (437) (1,213) (416) (708)
Impairment loss4 (108) (60) (20) (147)
Personnel
Number of personnel 20,800 23,557 8,016 9,825 12,626 13,548

139Consolidated Financial Statements
Africa Middle East Asia Pacific Corporate/Eliminations Total Group
2009 2008 2009 2008 2009 2008 2009 2008
11.2 11.1 90.7 82.7 202.9 194.4
8.8 9.7 67.3 65.6 (4.6) (7.2) 131.9 143.4
0.7 0.6 3.5 4.8
2.6 2.7 10.4 4.7 143.4 167.7
0.1 11.0 13.5
1.1 1.2 8.1 7.3 41.8 48.5
1,204 1,336 5,917 5,413 21,132 25,157
2 18 501 696 (640) (1,046)
1,206 1,354 6,418 6,109 (640) (1,046) 21,132 25,157
977 683 (305) (515) 10,063 12,357
1,206 1,354 5,441 5,426 (335) (531) 11,069 12,800
373 368 1,760 1,495 (211) (213) 4,630 5,333
214 136 (63) (69) 1,377 1,704
373 368 1,546 1,359 (148) (144) 3,253 3,629
30.9 27.2 27.4 24.5 21.9 21.2
(56) (65) (459) (474) (28) (18) (1,849) (1,973)
317 303 1,301 1,021 (239) (231) 2,781 3,360
26.3 22.4 20.3 16.7 13.2 13.4
(2) (6) 1 (9) (12)
(28) (28) (55) (6) 394 384 206 19
1 12 7 255 184 302 229
1 1 24 15 4 (3) 82 115
346 342 1,743 1,517 441 352 5,229 5,708
2 2 59 41 1,293 1,075 1,529 1,341
842 861 9,331 7,254 275 375 32,375 28,305
1,407 1,878 14,434 11,219 2,134 2,350 49,206 45,193
739 1,294 3,860 3,444 4,293 4,313 27,162 27,219
294 147 1,680 1,079 186 524 3,888 3,703
24.4 10.9 26.2 17.7 18.4 14.7
90 241 819 1,129 3 72 2,581 4,926
(110) (322) (492) (1,140) (2,872) (279) (4,590) (5,475)
(1) (7) (7) (2) (136) (216)
2,256 2,477 36,858 36,196 942 1,110 81,498 86,713
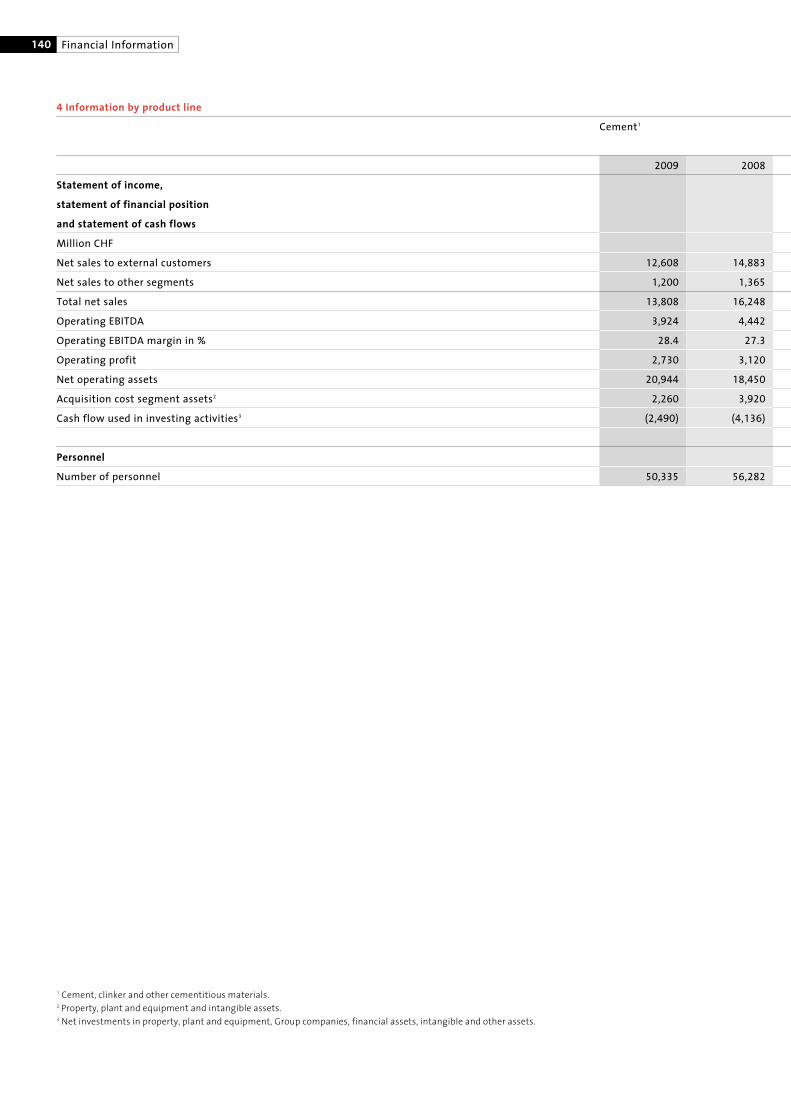
140 Financial Information
4 Information by product line
Cement1
2009 2008
Statement of income,
statement of financial position
and statement of cash flows
Million CHF
Net sales to external customers 12,608 14,883
Net sales to other segments 1,200 1,365
Total net sales 13,808 16,248
Operating EBITDA 3,924 4,442
Operating EBITDA margin in % 28.4 27.3
Operating profit 2,730 3,120
Net operating assets 20,944 18,450
Acquisition cost segment assets2 2,260 3,920
Cash flow used in investing activities3 (2,490) (4,136)
Personnel
Number of personnel 50,335 56,282
1 Cement, clinker and other cementitious materials.2 Property, plant and equipment and intangible assets.3 Net investments in property, plant and equipment, Group companies, financial assets, intangible and other assets.

141Consolidated Financial Statements
Aggregates Other construction materials Corporate/Eliminations Total Group
and services
2009 2008 2009 2008 2009 2008 2009 2008
1,391 1,702 7,133 8,572 21,132 25,157
745 816 509 847 (2,454) (3,028)
2,136 2,518 7,642 9,419 (2,454) (3,028) 21,132 25,157
421 490 285 401 4,630 5,333
19.7 19.5 3.7 4.3 21.9 21.2
102 165 (51) 75 2,781 3,360
6,723 5,714 4,708 4,141 32,375 28,305
140 409 179 587 2 10 2,581 4,926
(1,620) (587) (138) (715) (342) (37) (4,590) (5,475)
6,850 6,369 23,725 23,692 588 370 81,498 86,713

142 Financial Information
6 Change in consolidated net sales
Million CHF 2009 2008
Volume and price (2,510) 1,157
Change in structure 195 (303)
Currency translation effects (1,710) (2,749)
Total (4,025) (1,895)
Net sales to external customers are based primarily on the
location of assets (origin of sales).
Non-current assets for this purpose consist of property, plant
and equipment and intangible assets.
5 Information by country
Net sales Non-current assets
to external customers
Million CHF 2009 2008 2009 2008
Switzerland 737 709 1,034 1,082
United Kingdom 2,071 2,894 3,010 2,876
USA 2,289 3,197 6,628 6,682
India 3,317 3,207 5,550 4,615
Remaining countries 12,718 15,150 19,254 17,313
Total Group 21,132 25,157 35,476 32,568
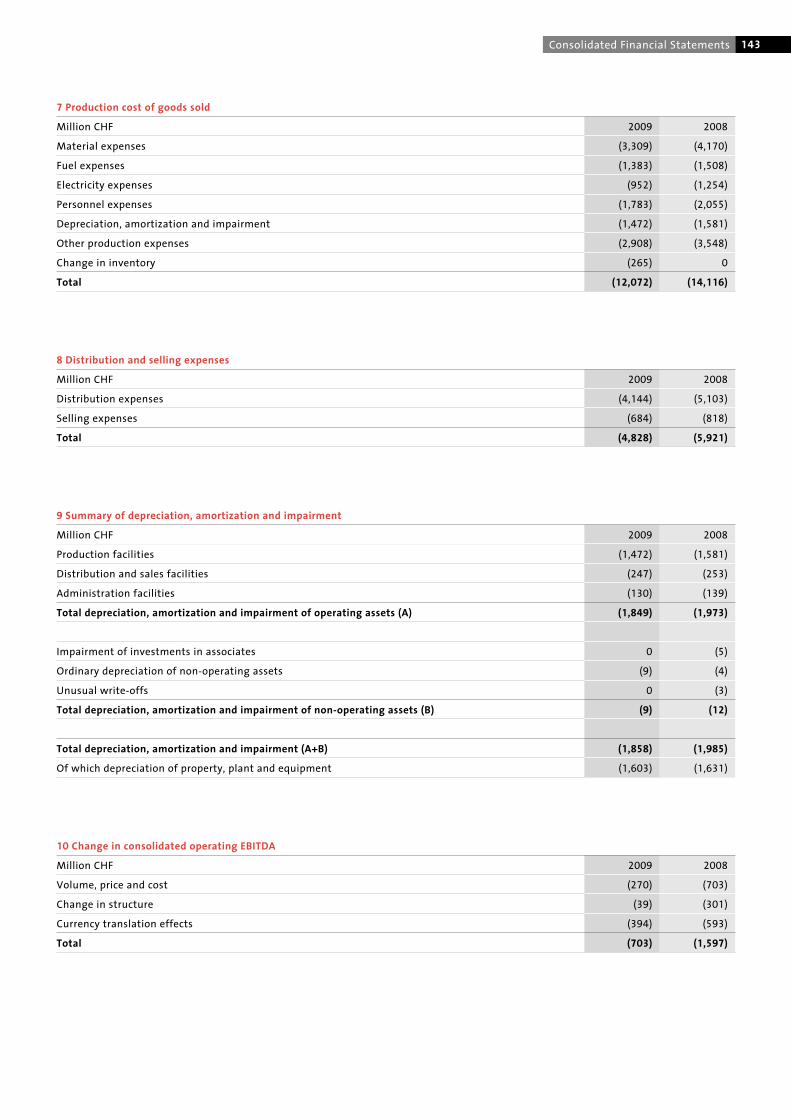
143Consolidated Financial Statements
9 Summary of depreciation, amortization and impairment
Million CHF 2009 2008
Production facilities (1,472) (1,581)
Distribution and sales facilities (247) (253)
Administration facilities (130) (139)
Total depreciation, amortization and impairment of operating assets (A) (1,849) (1,973)
Impairment of investments in associates 0 (5)
Ordinary depreciation of non-operating assets (9) (4)
Unusual write-offs 0 (3)
Total depreciation, amortization and impairment of non-operating assets (B) (9) (12)
Total depreciation, amortization and impairment (A+B) (1,858) (1,985)
Of which depreciation of property, plant and equipment (1,603) (1,631)
7 Production cost of goods sold
Million CHF 2009 2008
Material expenses (3,309) (4,170)
Fuel expenses (1,383) (1,508)
Electricity expenses (952) (1,254)
Personnel expenses (1,783) (2,055)
Depreciation, amortization and impairment (1,472) (1,581)
Other production expenses (2,908) (3,548)
Change in inventory (265) 0
Total (12,072) (14,116)
8 Distribution and selling expenses
Million CHF 2009 2008
Distribution expenses (4,144) (5,103)
Selling expenses (684) (818)
Total (4,828) (5,921)
10 Change in consolidated operating EBITDA
Million CHF 2009 2008
Volume, price and cost (270) (703)
Change in structure (39) (301)
Currency translation effects (394) (593)
Total (703) (1,597)
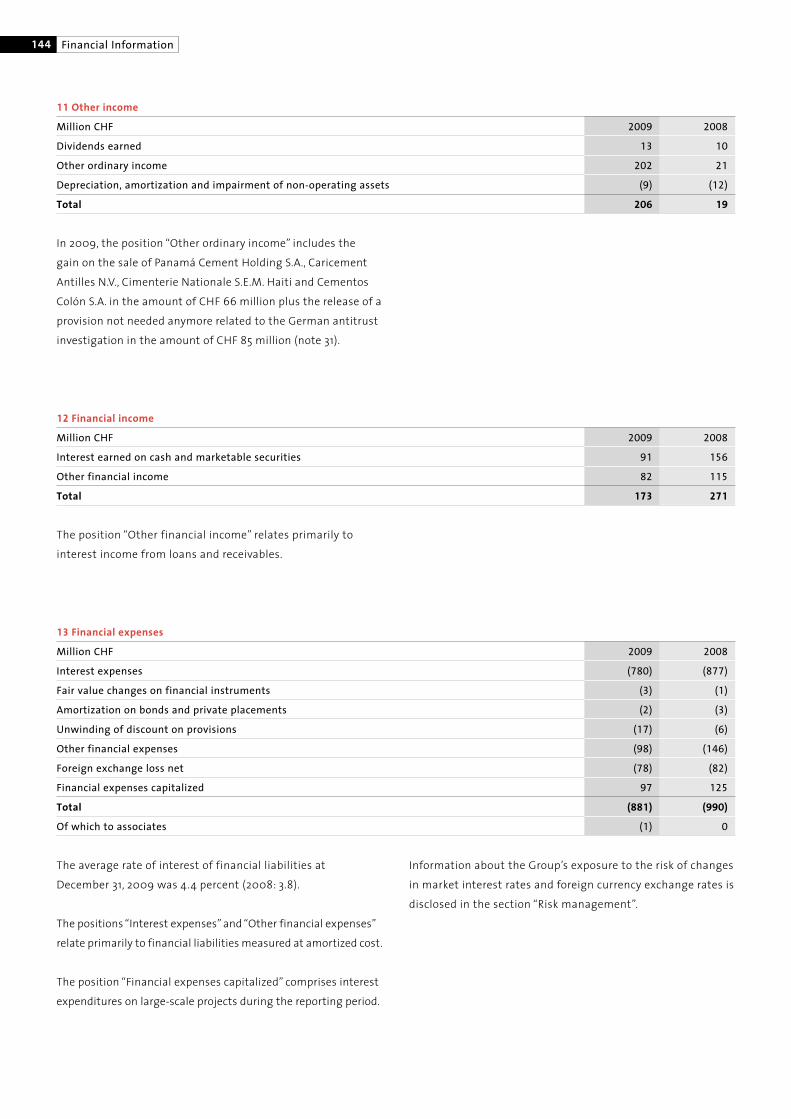
144 Financial Information
13 Financial expenses
Million CHF 2009 2008
Interest expenses (780) (877)
Fair value changes on financial instruments (3) (1)
Amortization on bonds and private placements (2) (3)
Unwinding of discount on provisions (17) (6)
Other financial expenses (98) (146)
Foreign exchange loss net (78) (82)
Financial expenses capitalized 97 125
Total (881) (990)
Of which to associates (1) 0
The average rate of interest of financial liabilities at
December 31, 2009 was 4.4 percent (2008: 3.8).
The positions “Interest expenses” and“Other financial expenses”
relate primarily to financial liabilities measured at amortized cost.
The position “Financial expenses capitalized” comprises interest
expenditures on large-scale projects during the reporting period.
Information about the Group’s exposure to the risk of changes
in market interest rates and foreign currency exchange rates is
disclosed in the section “Risk management”.
11 Other income
Million CHF 2009 2008
Dividends earned 13 10
Other ordinary income 202 21
Depreciation, amortization and impairment of non-operating assets (9) (12)
Total 206 19
In 2009, the position “Other ordinary income” includes the
gain on the sale of Panamá Cement Holding S.A., Caricement
Antilles N.V., Cimenterie Nationale S.E.M. Haiti and Cementos
Colón S.A. in the amount of CHF 66 million plus the release of a
provision not needed anymore related to the German antitrust
investigation in the amount of CHF 85 million (note 31).
The position “Other financial income” relates primarily to
interest income from loans and receivables.
12 Financial income
Million CHF 2009 2008
Interest earned on cash and marketable securities 91 156
Other financial income 82 115
Total 173 271

145Consolidated Financial Statements
14 Income taxes
Million CHF 2009 2008
Current taxes (742) (883)
Deferred taxes 119 220
Total (623) (663)
Reconciliation of tax rate
2009 2008
Group’s expected tax rate 30% 27%
Effect of non-deductible or non-taxable items and income taxed at different tax rates (6%) (4%)
Net change of unrecognized tax loss carryforwards 0% (1%)
Prior year and other items 0% 1%
Group’s effective tax rate 24% 23%
15 Research and development
Research and development projects are carried out with a
view to generate added value for customers through end user
oriented products and services. Additionally, process innovation
aims at environmental protection and production system
improvements. Research and development costs of CHF 17
million (2008: 24) were charged directly to the consolidated
statement of income. No significant costs were incurred
for licenses obtained from third parties, nor was any major
revenue generated from licenses granted.
The Group’s expected tax rate is a weighted average tax rate
based on profits (losses) before taxes of the Group companies.
The increase in 2009 is largely based on a change of the relative
weight of the profit at the Group companies.
Deferred tax by type
Million CHF 2009 2008
Property, plant and equipment (45) 92
Intangible and other assets (8) (13)
Provisions 60 42
Tax losses carryforward 135 46
Other (23) 53
Total 119 220

146 Financial Information
Cash and cash equivalents comprise cash at banks and
in hand, deposits held on call with banks and other short-
term highly liquid investments.
Bank overdrafts are included in current financial liabilities.
17 Cash and cash equivalents
Million CHF 2009 2008
Cash at banks and in hand 871 659
Short-term deposits 3,603 2,946
Total 4,474 3,605
Cash and cash equivalents classified as assets held for sale (note 20) 0 6
Bank overdrafts (213) 0
Cash and cash equivalents for the purpose of the consolidated cash flow statement 4,261 3,611
16 Earnings per share
2009 2008
Basic earnings per share in CHF 4.93 6.27
Net income – shareholders of Holcim Ltd – as per statement of income (in million CHF) 1,471 1,782
Weighted average number of shares outstanding 298,137,630 284,351,794
Fully diluted earnings per share in CHF 4.93 6.26
Net income used to determine diluted earnings per share (in million CHF) 1,471 1,782
Weighted average number of shares outstanding 298,137,630 284,351,794
Adjustment for assumed exercise of share options 153,751 89,033
Weighted average number of shares for diluted earnings per share 298,291,381 284,440,827
In conformity with the decision taken at the annual general
meeting on May 7, 2009, a stock dividend related to 2008 of
CHF 2.25 per registered share has been paid. This resulted in a
total ordinary dividend payment of CHF 594 million.
Based on IAS 33, the weighted average number of shares out-
standing was retrospectively increased by 5 percent to reflect
the 1:20 ratio of the stock dividend (note 35) and by an additional
3.6 percent to reflect the discount for existing shareholders in
the rights issue for all periods presented.
A cash dividend in respect of the financial year 2009 of CHF 1.50
per registered share, amounting to a total ordinary dividend of
CHF 480 million, is to be proposed at the annual general meeting
of shareholders on May 6, 2010. These consolidated financial
statements do not reflect this dividend payable.

147Consolidated Financial Statements
19 Inventories
Million CHF 2009 2008
Raw materials and additives 310 312
Semifinished and finished products 1,022 1,109
Fuels 287 461
Parts and supplies 504 544
Unbilled services 39 56
Total 2,162 2,482
In 2009, the Group recognized inventory write-downs to net
realizable value of CHF 12 million (2008: 9). The carrying
amount of inventories carried at net realizable value was
CHF 63 million (2008: 59).
Due to the local nature of the business, specific terms and
conditions for accounts receivable trade exist for local Group
companies and as such Group guidelines are not required.
The overdue amounts relate to receivables where payment
terms specified in the terms and conditions established with
Holcim customers have been exceeded.
Allowance for doubtful accounts
Million CHF 2009 2008
January 1 (179) (171)
Change in structure (5) (3)
Allowance recognized (52) (63)
Amounts used during the year 3 5
Unused amounts reversed during the year 4 21
Currency translation effects 12 32
December 31 (217) (179)
18 Accounts receivable
Million CHF 2009 2008
Trade accounts receivable – associates 84 64
Trade accounts receivable – third parties 2,276 2,449
Other receivables – associates 539 118
Other receivables – third parties 497 467
Derivative assets 5 18
Total 3,401 3,116
Of which pledged/restricted 112 137
Overdue accounts receivable
Million CHF 2009 2008
Not overdue 2,879 2,486
Overdue 1 to 89 days 368 475
Overdue 90 to 180 days 126 134
Overdue more than 180 days 245 200
./. Allowances for doubtful accounts (217) (179)
Total 3,401 3,116
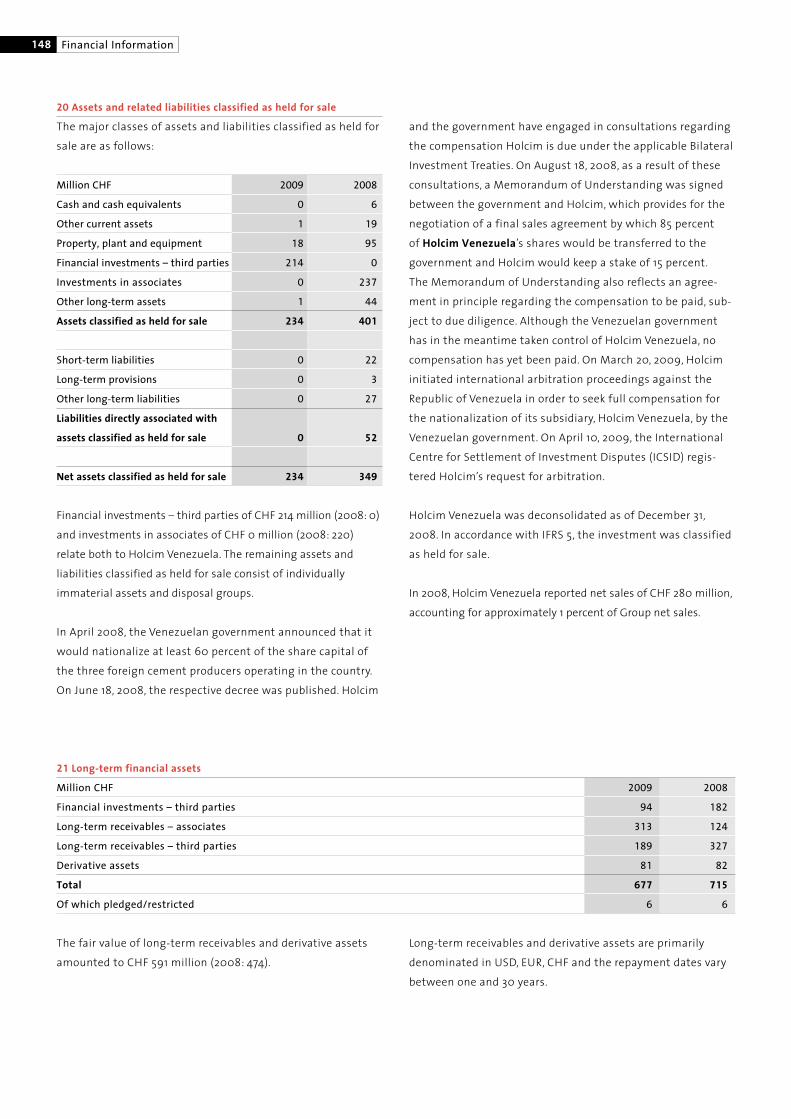
148 Financial Information
21 Long-term financial assets
Million CHF 2009 2008
Financial investments – third parties 94 182
Long-term receivables – associates 313 124
Long-term receivables – third parties 189 327
Derivative assets 81 82
Total 677 715
Of which pledged/restricted 6 6
The fair value of long-term receivables and derivative assets
amounted to CHF 591 million (2008: 474).
Long-term receivables and derivative assets are primarily
denominated in USD, EUR, CHF and the repayment dates vary
between one and 30 years.
20 Assets and related liabilities classified as held for sale
The major classes of assets and liabilities classified as held for
sale are as follows:
Million CHF 2009 2008
Cash and cash equivalents 0 6
Other current assets 1 19
Property, plant and equipment 18 95
Financial investments – third parties 214 0
Investments in associates 0 237
Other long-term assets 1 44
Assets classified as held for sale 234 401
Short-term liabilities 0 22
Long-term provisions 0 3
Other long-term liabilities 0 27
Liabilities directly associated with
assets classified as held for sale 0 52
Net assets classified as held for sale 234 349
Financial investments – third parties of CHF 214 million (2008: 0)
and investments in associates of CHF 0 million (2008: 220)
relate both to Holcim Venezuela. The remaining assets and
liabilities classified as held for sale consist of individually
immaterial assets and disposal groups.
In April 2008, the Venezuelan government announced that it
would nationalize at least 60 percent of the share capital of
the three foreign cement producers operating in the country.
On June 18, 2008, the respective decree was published. Holcim
and the government have engaged in consultations regarding
the compensation Holcim is due under the applicable Bilateral
Investment Treaties. On August 18, 2008, as a result of these
consultations, a Memorandum of Understanding was signed
between the government and Holcim, which provides for the
negotiation of a final sales agreement by which 85 percent
of Holcim Venezuela’s shares would be transferred to the
government and Holcim would keep a stake of 15 percent.
The Memorandum of Understanding also reflects an agree-
ment in principle regarding the compensation to be paid, sub-
ject to due diligence. Although the Venezuelan government
has in the meantime taken control of Holcim Venezuela, no
compensation has yet been paid. On March 20, 2009, Holcim
initiated international arbitration proceedings against the
Republic of Venezuela in order to seek full compensation for
the nationalization of its subsidiary, Holcim Venezuela, by the
Venezuelan government. On April 10, 2009, the International
Centre for Settlement of Investment Disputes (ICSID) regis-
tered Holcim’s request for arbitration.
Holcim Venezuela was deconsolidated as of December 31,
2008. In accordance with IFRS 5, the investment was classified
as held for sale.
In 2008, Holcim Venezuela reported net sales of CHF 280 million,
accounting for approximately 1 percent of Group net sales.

149Consolidated Financial Statements
22 Investments in associates
Million CHF 2009 2008
January 1 1,341 809
Share of profit of associates 302 229
Dividends earned (89) (196)
Acquisitions net 24 402
Reclassifications net (43) 203
Currency translation effects (6) (106)
December 31 1,529 1,341
In 2008, the item “Acquisitions net” includes the subscription
to the private placement of shares amounting to USD 282 mil-
lion (CHF 305) in its associated company Huaxin Cement Co.
Ltd. which resulted in an increase in its participation from 26.1
percent to 39.9 percent.
In 2008, the item “Reclassification net” mainly includes an
increase of CHF 223 million relating to the deconsolidation of
Egyptian Cement Company when the joint venture agreement
between OCI and Holcim became void and Holcim applied
equity accounting to its investment (note 1).
Sales to and purchases from associates amounted to CHF 210
million (2008: 202) and CHF 19 million (2008: 18) respectively.
The following amounts represent the Group’s share of assets,
liabilities, net sales and net income of associates:
Aggregated financial information – associates
Million CHF 2009 2008
Assets 3,715 2,685
Liabilities (2,330) (1,403)
Net assets 1,385 1,282
Net sales 1,853 1,528
Net income 138 207
Net income and net assets also reflect the unrecognized share
of losses of associates where equity accounting is discontinued
as the carrying amount of the investment reached zero. The
unrecognized share of losses of associates amounts to CHF
102 million (2008: 36). The accumulated unrecognized share of
losses of associates amounts to CHF 107 million (2008: 59).
Aggregated assets and liabilities mainly increased due to the
deconsolidation and recognition of United Cement Company
of Nigeria Ltd as an investment in associate (note 1) and
increased assets and liabilities in existing associates.

150 Financial Information
23 Property, plant and equipment
Land Buildings, Machines Furniture, Construction Total
installations vehicles, in progress
tools
Million CHF
2009
Net book value as at January 1 4,684 4,303 8,169 1,419 4,687 23,262
Change in structure 707 52 218 130 63 1,170
Additions 32 59 168 39 2,209 2,507
Disposals (40) (32) (35) (39) (1) (147)
Transferred from construction in progress 167 1,539 2,006 239 (3,951) 0
Depreciation (118) (298) (875) (312) 0 (1,603)
Impairment loss (charged to statement of income) (15) (13) (21) (3) (80) (132)
Currency translation effects 168 23 135 39 71 436
Net book value as at December 31 5,585 5,633 9,765 1,512 2,998 25,493
At cost of acquisition 6,602 9,746 19,659 3,615 3,079 42,701
Accumulated depreciation/impairment (1,017) (4,113) (9,894) (2,103) (81) (17,208)
Net book value as at December 31 5,585 5,633 9,765 1,512 2,998 25,493
Net asset value of leased property, plant and equipment 0 55 31 91 0 177
Of which pledged/restricted 333
2008
Net book value as at January 1 5,390 5,075 9,845 1,558 3,143 25,011
Change in structure 233 (130) (257) 63 (39) (130)
Additions 82 90 206 113 4,027 4,518
Disposals (43) (22) (19) (25) (2) (111)
Transferred from construction in progress 130 421 942 294 (1,787) 0
Depreciation (140) (292) (885) (314) 0 (1,631)
Impairment loss (charged to statement of income) (22) (50) (131) (9) (3) (215)
Currency translation effects (946) (789) (1,532) (261) (652) (4,180)
Net book value as at December 31 4,684 4,303 8,169 1,419 4,687 23,262
At cost of acquisition 5,508 7,934 16,982 3,297 4,687 38,408
Accumulated depreciation/impairment (824) (3,631) (8,813) (1,878) 0 (15,146)
Net book value as at December 31 4,684 4,303 8,169 1,419 4,687 23,262
Net asset value of leased property, plant and equipment 0 60 40 81 0 181
Of which pledged/restricted 275
The net book value of CHF 25,493 million (2008: 23,262)
represents 59.7 percent (2008: 60.6) of the original cost of
all assets. At December 31, 2009, the fire insurance value of
property, plant and equipment amounted to CHF 36,144 million
(2008: 34,207). Net gains on sale of property, plant and equip-
ment amounted to CHF 55 million (2008: 16).
In 2009, the impairment loss relates primarily to plants in
Hungary, Russia, Serbia and the US and is included in produc-
tion cost of goods sold in the income statement.
Included in land, buildings and installations is investment
property with a net book value of CHF 94 million (2008: 48).
The fair value of this investment property amounted to
CHF 117 million (2008: 71). Rental income related to investment
property amounted to CHF 3 million (2008: 3).
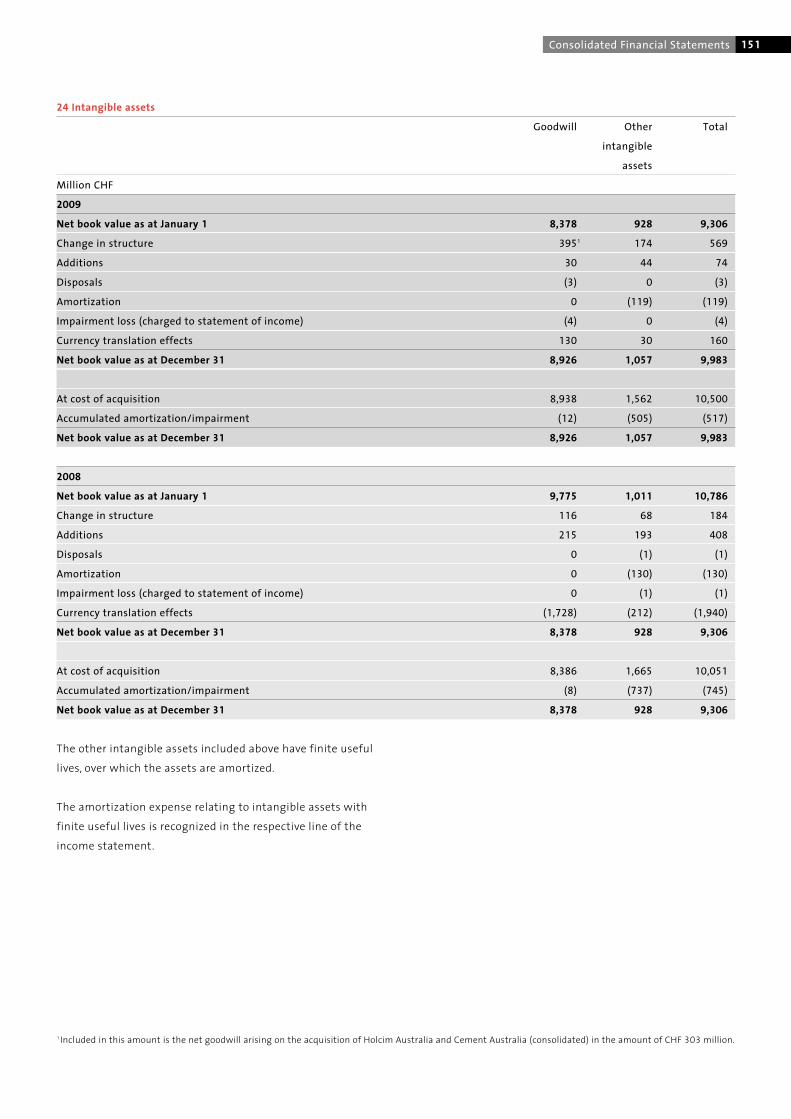
151Consolidated Financial Statements
24 Intangible assets
Goodwill Other Total
intangible
assets
Million CHF
2009
Net book value as at January 1 8,378 928 9,306
Change in structure 3951 174 569
Additions 30 44 74
Disposals (3) 0 (3)
Amortization 0 (119) (119)
Impairment loss (charged to statement of income) (4) 0 (4)
Currency translation effects 130 30 160
Net book value as at December 31 8,926 1,057 9,983
At cost of acquisition 8,938 1,562 10,500
Accumulated amortization/impairment (12) (505) (517)
Net book value as at December 31 8,926 1,057 9,983
2008
Net book value as at January 1 9,775 1,011 10,786
Change in structure 116 68 184
Additions 215 193 408
Disposals 0 (1) (1)
Amortization 0 (130) (130)
Impairment loss (charged to statement of income) 0 (1) (1)
Currency translation effects (1,728) (212) (1,940)
Net book value as at December 31 8,378 928 9,306
At cost of acquisition 8,386 1,665 10,051
Accumulated amortization/impairment (8) (737) (745)
Net book value as at December 31 8,378 928 9,306
The other intangible assets included above have finite useful
lives, over which the assets are amortized.
The amortization expense relating to intangible assets with
finite useful lives is recognized in the respective line of the
income statement.
1 Included in this amount is the net goodwill arising on the acquisition of Holcim Australia and Cement Australia (consolidated) in the amount of CHF 303 million.
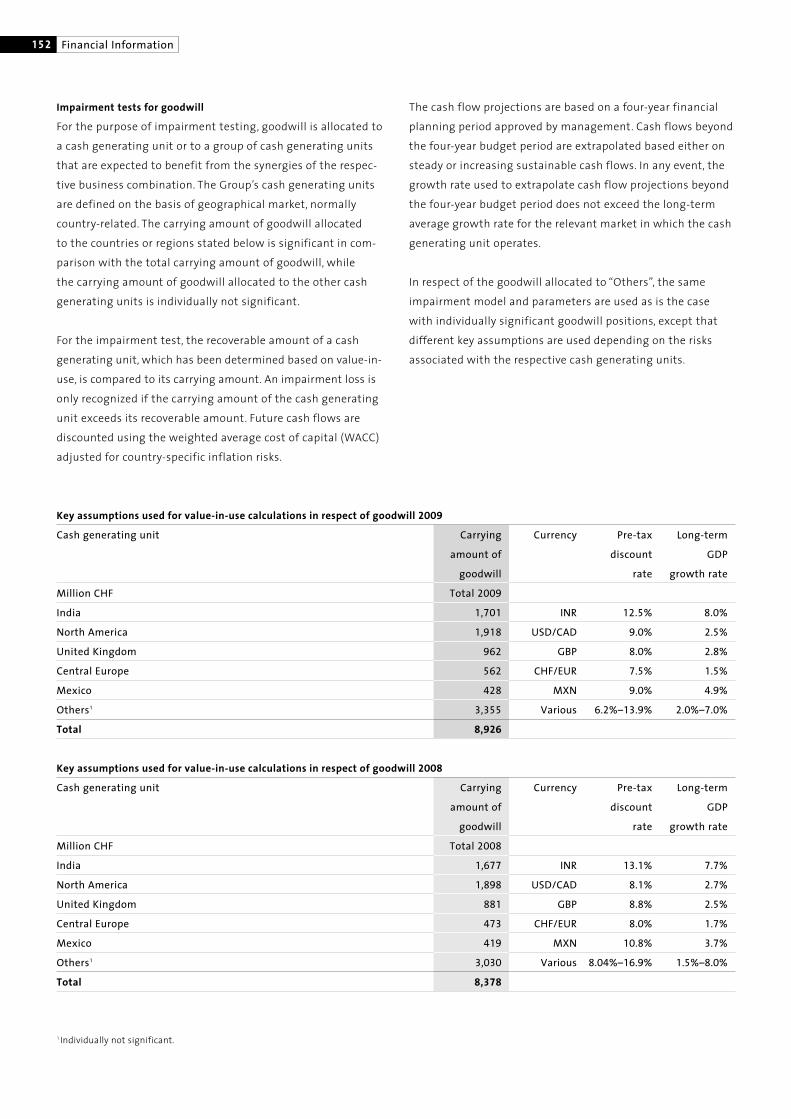
Key assumptions used for value-in-use calculations in respect of goodwill 2009
Cash generating unit Carrying Currency Pre-tax Long-term
amount of discount GDP
goodwill rate growth rate
Million CHF Total 2009
India 1,701 INR 12.5% 8.0%
North America 1,918 USD/CAD 9.0% 2.5%
United Kingdom 962 GBP 8.0% 2.8%
Central Europe 562 CHF/EUR 7.5% 1.5%
Mexico 428 MXN 9.0% 4.9%
Others1 3,355 Various 6.2%–13.9% 2.0%–7.0%
Total 8,926
152 Financial Information
Impairment tests for goodwill
For the purpose of impairment testing, goodwill is allocated to
a cash generating unit or to a group of cash generating units
that are expected to benefit from the synergies of the respec-
tive business combination. The Group’s cash generating units
are defined on the basis of geographical market, normally
country-related. The carrying amount of goodwill allocated
to the countries or regions stated below is significant in com-
parison with the total carrying amount of goodwill, while
the carrying amount of goodwill allocated to the other cash
generating units is individually not significant.
For the impairment test, the recoverable amount of a cash
generating unit, which has been determined based on value-in-
use, is compared to its carrying amount. An impairment loss is
only recognized if the carrying amount of the cash generating
unit exceeds its recoverable amount. Future cash flows are
discounted using the weighted average cost of capital (WACC)
adjusted for country-specific inflation risks.
The cash flow projections are based on a four-year financial
planning period approved by management. Cash flows beyond
the four-year budget period are extrapolated based either on
steady or increasing sustainable cash flows. In any event, the
growth rate used to extrapolate cash flow projections beyond
the four-year budget period does not exceed the long-term
average growth rate for the relevant market in which the cash
generating unit operates.
In respect of the goodwill allocated to “Others”, the same
impairment model and parameters are used as is the case
with individually significant goodwill positions, except that
different key assumptions are used depending on the risks
associated with the respective cash generating units.
1 Individually not significant.
Key assumptions used for value-in-use calculations in respect of goodwill 2008
Cash generating unit Carrying Currency Pre-tax Long-term
amount of discount GDP
goodwill rate growth rate
Million CHF Total 2008
India 1,677 INR 13.1% 7.7%
North America 1,898 USD/CAD 8.1% 2.7%
United Kingdom 881 GBP 8.8% 2.5%
Central Europe 473 CHF/EUR 8.0% 1.7%
Mexico 419 MXN 10.8% 3.7%
Others1 3,030 Various 8.04%–16.9% 1.5%–8.0%
Total 8,378

153Consolidated Financial Statements
25 Joint ventures
The following amounts represent the effect of proportionately
consolidated assets, liabilities and sales and results of
significant joint ventures disclosed on pages 180 and 181.
The amounts are included in the consolidated statement of
financial position and consolidated statement of income.
Statement of income
Million CHF 2009 2008
Net sales 617 899
Operating profit 102 156
Net income from joint ventures 64 106
23 Trade Accounts PayableStatement of financial position
Million CHF 2009 2008
Current assets 93 334
Long-term assets 368 1,098
Total assets 461 1,432
Short-term liabilities 49 250
Long-term liabilities 102 662
Total liabilities 151 912
Net assets 310 520
Sales to and purchases from significant joint ventures
amounted to CHF 29 million (2008: 144) and CHF 64
million (2008: 106) respectively.
As from October 1, 2009, the formerly proportionately consoli-
dated interest in Cement Australia has been fully consolidated
(note 1). Mainly due to this reason, the proportionately consoli-
dated assets, liabilities and sales and results of significant
joint ventures have decreased compared to the prior year.
Sensitivity to changes in assumptions
With regard to the assessment of value-in-use of a cash gener-
ating unit or a group of cash generating units, management
believes that a reasonably possible change in the pre-tax dis-
count rate of 1 percentage point would not cause the carrying
amount of a cash generating unit or a group of cash generating
units to materially exceed its recoverable amount.

154 Financial Information
26 Trade accounts payable
Million CHF 2009 2008
Trade accounts payable – associates 8 10
Trade accounts payable – third parties 2,087 2,431
Advance payments from customers 128 125
Total 2,223 2,566
27 Financial liabilities
Million CHF 2009 2008
Current financial liabilities – associates 1 3
Current financial liabilities – third parties 2,928 3,917
Current portion of long-term financial liabilities 1,520 1,939
Derivative liabilities 4 4
Total current financial liabilities 4,453 5,863
Long-term financial liabilities – associates 10 11
Long-term financial liabilities – third parties 13,761 12,684
Derivative liabilities 83 94
Total long-term financial liabilities 13,854 12,789
Total 18,307 18,652
Of which secured 206 325
The fair values of current financial liabilities are not materially
different from their carrying amounts.
The fair values of long-term financial liabilities amount to
CHF 15,313 million (2008: 13,411).
The fair values of accounts payable are not materially different
from their carrying amounts.

155Consolidated Financial Statements
Loans from financial institutions include amounts due to
banks and other financial institutions. Repayment dates vary
between one and 15 years. CHF 3,207 million (2008: 4,563) are
due within one year.
Unutilized credit lines totaled CHF 8,188 million (2008: 3,985)
at year-end 2009, of which CHF 5,365 million (2008: 2,027)
are committed.
Currency 2009 2008
Million CHF In % Interest rate1 Million CHF In % Interest rate1
CHF 3,240 17.7 2.8 5,350 28.7 1.9
USD 5,037 27.5 3.2 5,440 29.2 3.3
EUR 4,822 26.3 4.3 4,404 23.6 4.3
GBP 893 4.9 7.0 695 3.7 6.1
AUD 1,402 7.7 6.0 352 1.9 6.2
INR 296 1.6 6.4 278 1.5 5.4
THB 234 1.3 5.7 237 1.3 6.0
NZD 112 0.6 3.6 100 0.5 6.0
Others 2,271 12.4 7.2 1,796 9.6 8.1
Total 18,307 100.0 4.4 18,652 100.0 3.8
Financial liabilities by currency
1 Weighted average nominal interest rate on financial liabilities at December 31.
Details of total financial liabilities
Million CHF 2009 2008
Loans from financial institutions 6,264 10,328
Bonds and private placements 11,818 8,072
Total loans and bonds 18,082 18,400
Obligations under finance leases (note 28) 138 154
Derivative liabilities (note 29) 87 98
Total 18,307 18,652

156 Financial Information
The maturity information is based on the carrying amounts
and shows the remaining contractual maturities.
Additional information on the maturity of financial instru-
ments is disclosed in the section “Risk management”.
Interest rate structure of total financial liabilities
Million CHF 2009 2008
Financial liabilities at fixed rates 9,312 5,809
Financial liabilities at variable rates 8,995 12,843
Total 18,307 18,652
Financial liabilities that are hedged to a fixed or floating rate
are disclosed on a post hedge basis.
Maturity schedule of loans and bonds
Million CHF 2009 2008
Within 1 year 4,416 5,821
Within 2 years 1,412 1,955
Within 3 years 1,842 1,311
Within 4 years 3,590 1,170
Within 5 years 2,276 4,391
Thereafter 4,546 3,752
Total 18,082 18,400

157Consolidated Financial Statements
Bonds and private placements as at December 31
Nominal Nominal Effective Term Description Net Net
value interest interest book book
rate rate value value
Million CHF 2009 2008
Holcim Ltd
CHF 500 4.00% 1998–2009 Bonds with fixed interest rate 0 499
CHF 500 2.50% 2.69% 2005–2012 Bonds with fixed interest rate 498 497
CHF 250 3.00% 3.19% 2006–2015 Bonds with fixed interest rate 248 247
CHF 400 3.13% 0.50% 2007–2017 Bonds swapped into floating interest rates at inception 431 422
CHF 1,000 4.00% 4.33% 2009–2013 Bonds with fixed interest rate 988 0
CHF 450 4.00% 4.19% 2009–2018 Bonds with fixed interest rate 444 0
Holcim Capital Corporation Ltd.
USD 150 7.05% 2.06% 2001–2011 Private placement guaranteed by Holcim Ltd,
swapped into floating interest rates at inception 169 176
USD 208 7.05% 7.08% 2001–2011 Private placement guaranteed by Holcim Ltd 215 220
USD 50 7.65% 7.65% 2001–2031 Private placement guaranteed by Holcim Ltd 51 53
USD 105 5.93% 2002–2009 Private placement guaranteed by Holcim Ltd 0 111
USD 65 6.59% 6.60% 2002–2014 Private placement guaranteed by Holcim Ltd 67 69
USD 100 6.59% 6.59% 2002–2014 Private placement guaranteed by Holcim Ltd 103 106
USD 250 6.88% 7.28% 2009–2039 Bonds guaranteed by Holcim Ltd 249 0
Holcim Overseas Finance Ltd.
CHF 300 2.75% 2.79% 2006–2011 Bonds guaranteed by Holcim Ltd 300 300
CHF 250 3.00% 0.49% 2007–2013 Bonds guaranteed by Holcim Ltd,
swapped into floating interest rates at inception 269 266
Holcim Finance (Canada) Inc.
CAD 10 6.91% 6.92% 2002–2017 Private placement guaranteed by Holcim Ltd 10 9
CAD 300 5.90% 6.10% 2007–2013 Bonds guaranteed by Holcim Ltd 293 259
Holcim Finance (Luxembourg) S.A.
EUR 450 4.38% 4.48% 2003–2010 Bonds guaranteed by Holcim Ltd 669 670
EUR 300 4.38% 1.91% 2003–2010 Bonds guaranteed by Holcim Ltd,
swapped into floating interest rates at inception 450 452
EUR 600 4.38% 4.45% 2004–2014 Bonds guaranteed by Holcim Ltd 889 891
EUR 650 9.00% 8.92% 2009–2014 Bonds guaranteed by Holcim Ltd 969 0
EUR 200 6.35% 6.40% 2009–2017 Private placement guaranteed by Holcim Ltd 296 0
Holcim Finance (Australia) Pty Ltd
AUD 175 6.50% 2006–2009 Bonds guaranteed by Holcim Ltd 0 128
AUD 85 3.49% 2006–2009 Bonds guaranteed by Holcim Ltd, floating interest rates 0 62
AUD 500 8.50% 8.90% 2009–2012 Bonds guaranteed by Holcim Ltd 461 0
Holcim Capital (Thailand) Ltd.
THB 2,150 6.48% 6.59% 2005–2010 Bonds guaranteed by Holcim Ltd 66 65
THB 2,450 6.69% 6.78% 2005–2012 Bonds guaranteed by Holcim Ltd 75 74
Subtotal 8,210 5,576
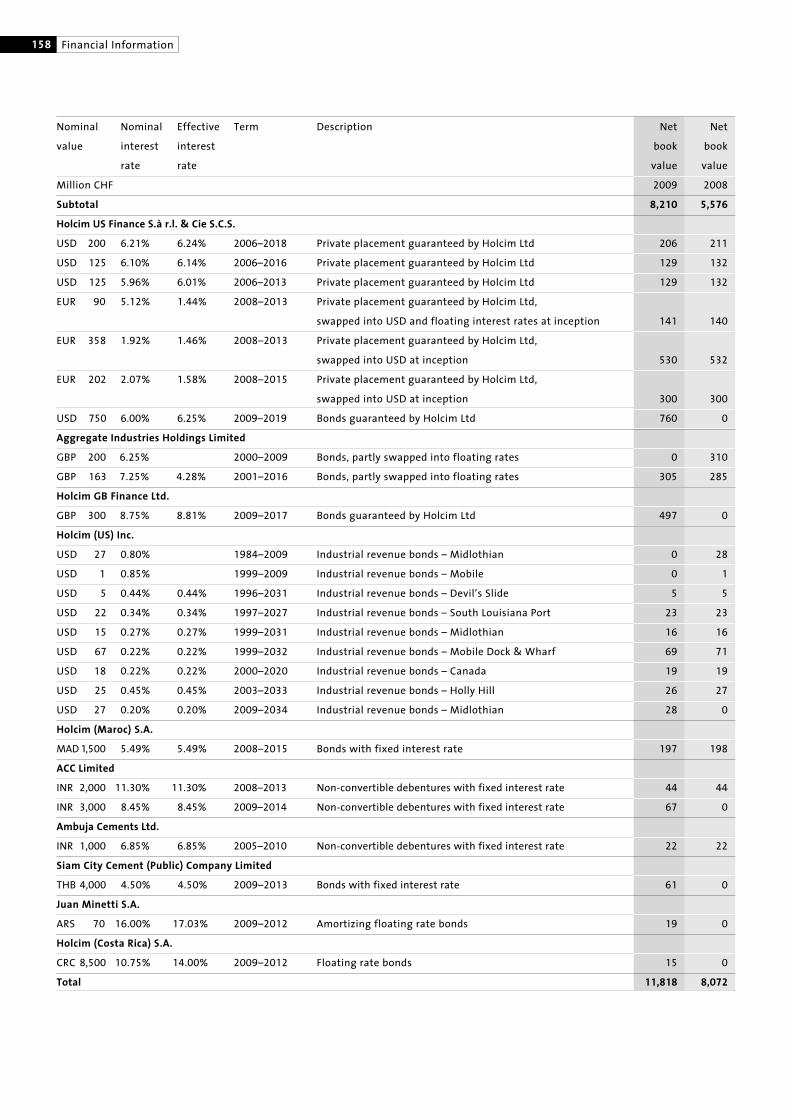
Nominal Nominal Effective Term Description Net Net
value interest interest book book
rate rate value value
Million CHF 2009 2008
Subtotal 8,210 5,576
Holcim US Finance S.à r.l. & Cie S.C.S.
USD 200 6.21% 6.24% 2006–2018 Private placement guaranteed by Holcim Ltd 206 211
USD 125 6.10% 6.14% 2006–2016 Private placement guaranteed by Holcim Ltd 129 132
USD 125 5.96% 6.01% 2006–2013 Private placement guaranteed by Holcim Ltd 129 132
EUR 90 5.12% 1.44% 2008–2013 Private placement guaranteed by Holcim Ltd,
swapped into USD and floating interest rates at inception 141 140
EUR 358 1.92% 1.46% 2008–2013 Private placement guaranteed by Holcim Ltd,
swapped into USD at inception 530 532
EUR 202 2.07% 1.58% 2008–2015 Private placement guaranteed by Holcim Ltd,
swapped into USD at inception 300 300
USD 750 6.00% 6.25% 2009–2019 Bonds guaranteed by Holcim Ltd 760 0
Aggregate Industries Holdings Limited
GBP 200 6.25% 2000–2009 Bonds, partly swapped into floating rates 0 310
GBP 163 7.25% 4.28% 2001–2016 Bonds, partly swapped into floating rates 305 285
Holcim GB Finance Ltd.
GBP 300 8.75% 8.81% 2009–2017 Bonds guaranteed by Holcim Ltd 497 0
Holcim (US) Inc.
USD 27 0.80% 1984–2009 Industrial revenue bonds – Midlothian 0 28
USD 1 0.85% 1999–2009 Industrial revenue bonds – Mobile 0 1
USD 5 0.44% 0.44% 1996–2031 Industrial revenue bonds – Devil’s Slide 5 5
USD 22 0.34% 0.34% 1997–2027 Industrial revenue bonds – South Louisiana Port 23 23
USD 15 0.27% 0.27% 1999–2031 Industrial revenue bonds – Midlothian 16 16
USD 67 0.22% 0.22% 1999–2032 Industrial revenue bonds – Mobile Dock & Wharf 69 71
USD 18 0.22% 0.22% 2000–2020 Industrial revenue bonds – Canada 19 19
USD 25 0.45% 0.45% 2003–2033 Industrial revenue bonds – Holly Hill 26 27
USD 27 0.20% 0.20% 2009–2034 Industrial revenue bonds – Midlothian 28 0
Holcim (Maroc) S.A.
MAD1,500 5.49% 5.49% 2008–2015 Bonds with fixed interest rate 197 198
ACC Limited
INR 2,000 11.30% 11.30% 2008–2013 Non-convertible debentures with fixed interest rate 44 44
INR 3,000 8.45% 8.45% 2009–2014 Non-convertible debentures with fixed interest rate 67 0
Ambuja Cements Ltd.
INR 1,000 6.85% 6.85% 2005–2010 Non-convertible debentures with fixed interest rate 22 22
Siam City Cement (Public) Company Limited
THB 4,000 4.50% 4.50% 2009–2013 Bonds with fixed interest rate 61 0
Juan Minetti S.A.
ARS 70 16.00% 17.03% 2009–2012 Amortizing floating rate bonds 19 0
Holcim (Costa Rica) S.A.
CRC 8,500 10.75% 14.00% 2009–2012 Floating rate bonds 15 0
Total 11,818 8,072
158 Financial Information
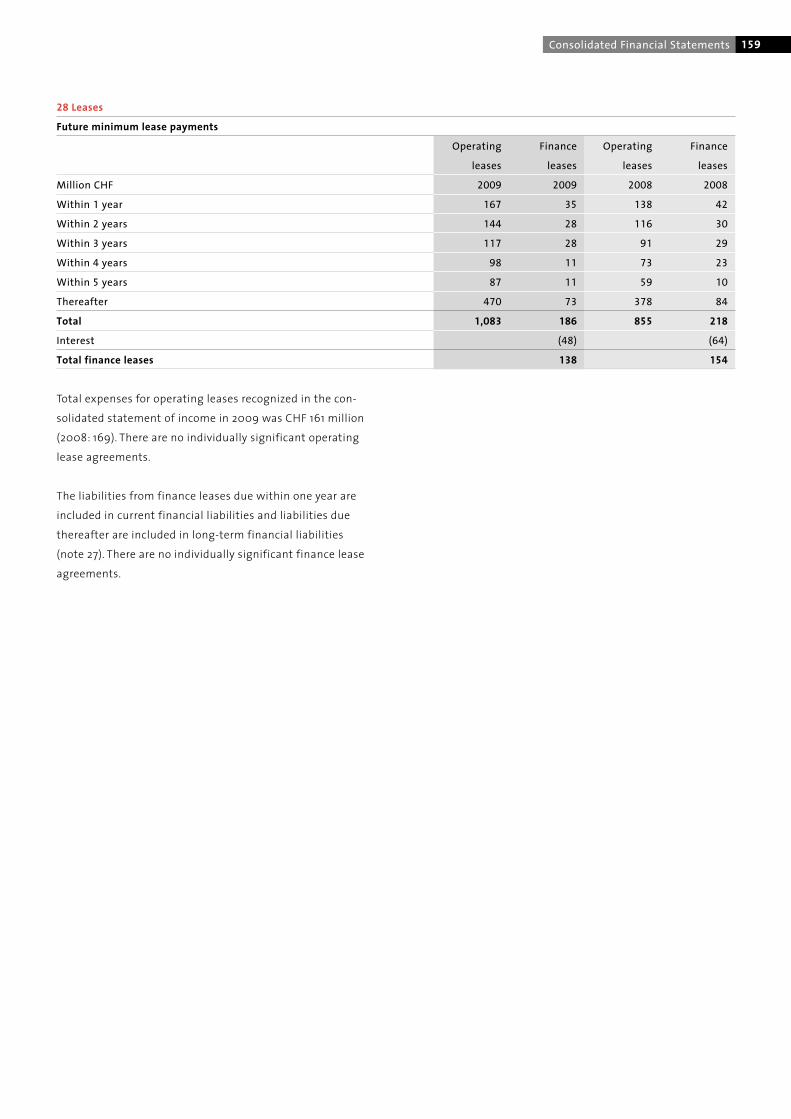
159Consolidated Financial Statements
28 Leases
Future minimum lease payments
Operating Finance Operating Finance
leases leases leases leases
Million CHF 2009 2009 2008 2008
Within 1 year 167 35 138 42
Within 2 years 144 28 116 30
Within 3 years 117 28 91 29
Within 4 years 98 11 73 23
Within 5 years 87 11 59 10
Thereafter 470 73 378 84
Total 1,083 186 855 218
Interest (48) (64)
Total finance leases 138 154
Total expenses for operating leases recognized in the con-
solidated statement of income in 2009 was CHF 161 million
(2008: 169). There are no individually significant operating
lease agreements.
The liabilities from finance leases due within one year are
included in current financial liabilities and liabilities due
thereafter are included in long-term financial liabilities
(note 27). There are no individually significant finance lease
agreements.
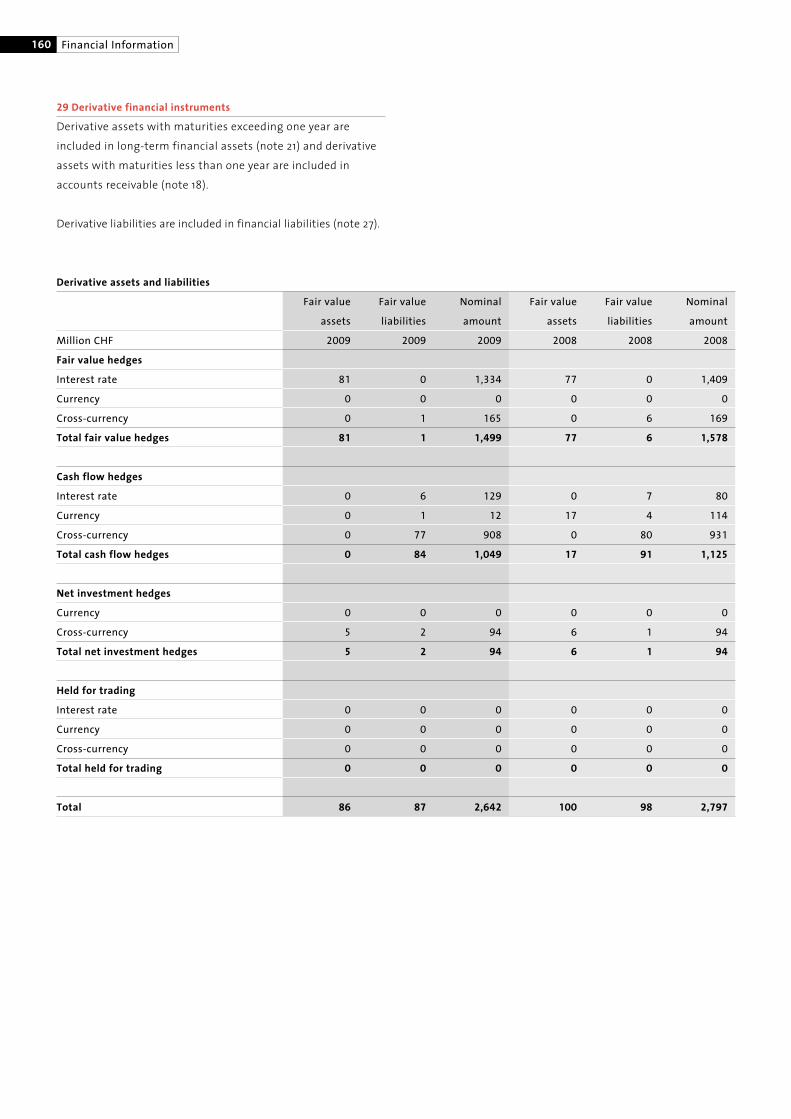
160 Financial Information
29 Derivative financial instruments
Derivative assets with maturities exceeding one year are
included in long-term financial assets (note 21) and derivative
assets with maturities less than one year are included in
accounts receivable (note 18).
Derivative liabilities are included in financial liabilities (note 27).
Derivative assets and liabilities
Fair value Fair value Nominal Fair value Fair value Nominal
assets liabilities amount assets liabilities amount
Million CHF 2009 2009 2009 2008 2008 2008
Fair value hedges
Interest rate 81 0 1,334 77 0 1,409
Currency 0 0 0 0 0 0
Cross-currency 0 1 165 0 6 169
Total fair value hedges 81 1 1,499 77 6 1,578
Cash flow hedges
Interest rate 0 6 129 0 7 80
Currency 0 1 12 17 4 114
Cross-currency 0 77 908 0 80 931
Total cash flow hedges 0 84 1,049 17 91 1,125
Net investment hedges
Currency 0 0 0 0 0 0
Cross-currency 5 2 94 6 1 94
Total net investment hedges 5 2 94 6 1 94
Held for trading
Interest rate 0 0 0 0 0 0
Currency 0 0 0 0 0 0
Cross-currency 0 0 0 0 0 0
Total held for trading 0 0 0 0 0 0
Total 86 87 2,642 100 98 2,797
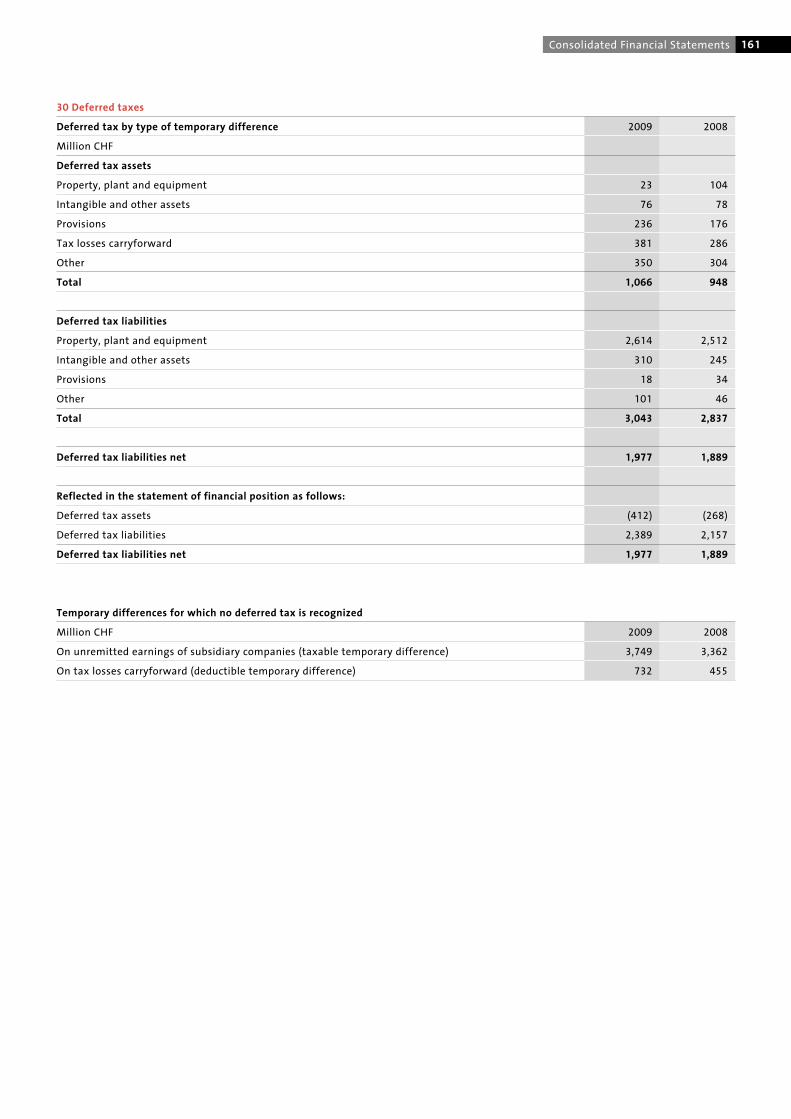
161Consolidated Financial Statements
30 Deferred taxes
Deferred tax by type of temporary difference 2009 2008
Million CHF
Deferred tax assets
Property, plant and equipment 23 104
Intangible and other assets 76 78
Provisions 236 176
Tax losses carryforward 381 286
Other 350 304
Total 1,066 948
Deferred tax liabilities
Property, plant and equipment 2,614 2,512
Intangible and other assets 310 245
Provisions 18 34
Other 101 46
Total 3,043 2,837
Deferred tax liabilities net 1,977 1,889
Reflected in the statement of financial position as follows:
Deferred tax assets (412) (268)
Deferred tax liabilities 2,389 2,157
Deferred tax liabilities net 1,977 1,889
Temporary differences for which no deferred tax is recognized
Million CHF 2009 2008
On unremitted earnings of subsidiary companies (taxable temporary difference) 3,749 3,362
On tax losses carryforward (deductible temporary difference) 732 455
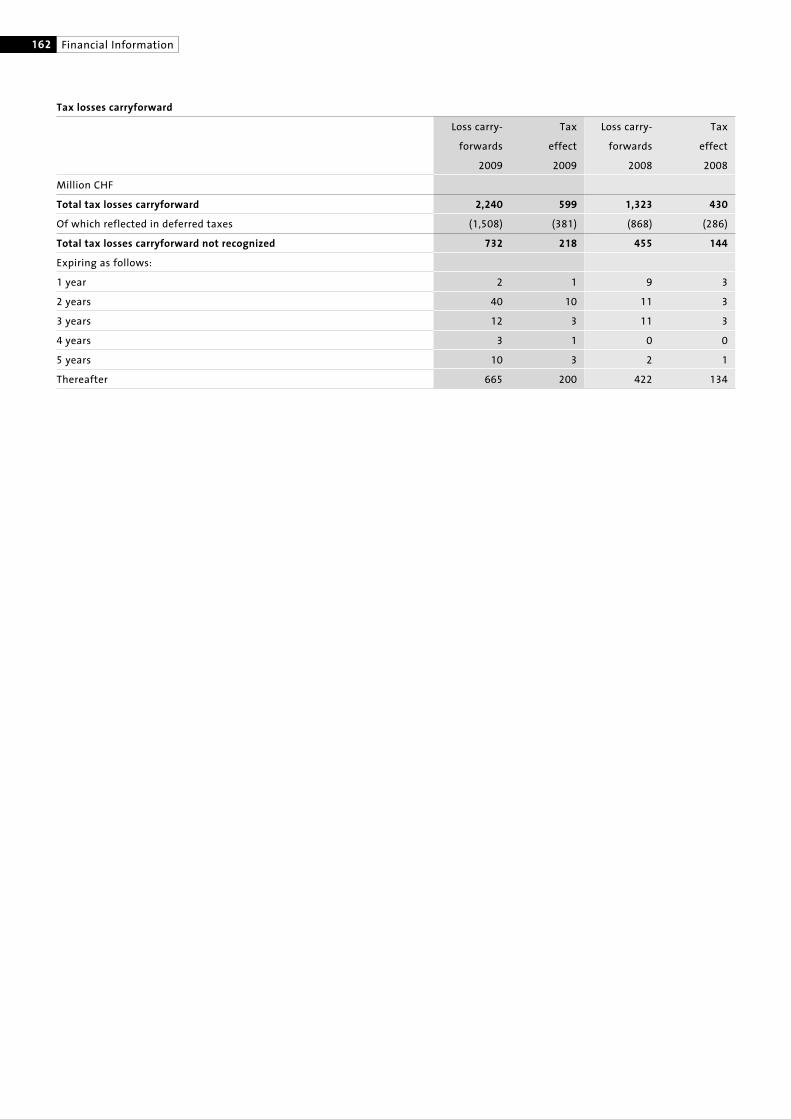
162 Financial Information
Tax losses carryforward
Loss carry- Tax Loss carry- Tax
forwards effect forwards effect
2009 2009 2008 2008
Million CHF
Total tax losses carryforward 2,240 599 1,323 430
Of which reflected in deferred taxes (1,508) (381) (868) (286)
Total tax losses carryforward not recognized 732 218 455 144
Expiring as follows:
1 year 2 1 9 3
2 years 40 10 11 3
3 years 12 3 11 3
4 years 3 1 0 0
5 years 10 3 2 1
Thereafter 665 200 422 134
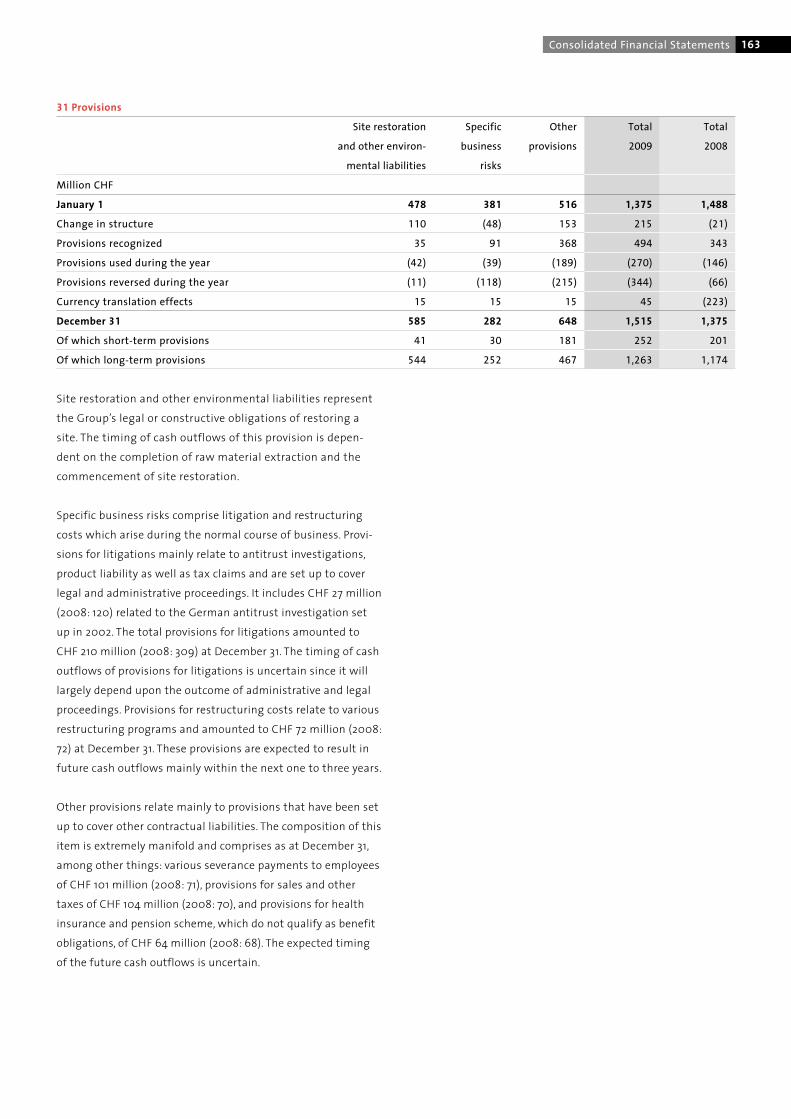
163Consolidated Financial Statements
31 Provisions
Site restoration Specific Other Total Total
and other environ- business provisions 2009 2008
mental liabilities risks
Million CHF
January 1 478 381 516 1,375 1,488
Change in structure 110 (48) 153 215 (21)
Provisions recognized 35 91 368 494 343
Provisions used during the year (42) (39) (189) (270) (146)
Provisions reversed during the year (11) (118) (215) (344) (66)
Currency translation effects 15 15 15 45 (223)
December 31 585 282 648 1,515 1,375
Of which short-term provisions 41 30 181 252 201
Of which long-term provisions 544 252 467 1,263 1,174
Site restoration and other environmental liabilities represent
the Group’s legal or constructive obligations of restoring a
site. The timing of cash outflows of this provision is depen-
dent on the completion of raw material extraction and the
commencement of site restoration.
Specific business risks comprise litigation and restructuring
costs which arise during the normal course of business. Provi-
sions for litigations mainly relate to antitrust investigations,
product liability as well as tax claims and are set up to cover
legal and administrative proceedings. It includes CHF 27 million
(2008: 120) related to the German antitrust investigation set
up in 2002. The total provisions for litigations amounted to
CHF 210 million (2008: 309) at December 31. The timing of cash
outflows of provisions for litigations is uncertain since it will
largely depend upon the outcome of administrative and legal
proceedings. Provisions for restructuring costs relate to various
restructuring programs and amounted to CHF 72 million (2008:
72) at December 31. These provisions are expected to result in
future cash outflows mainly within the next one to three years.
Other provisions relate mainly to provisions that have been set
up to cover other contractual liabilities. The composition of this
item is extremely manifold and comprises as at December 31,
among other things: various severance payments to employees
of CHF 101 million (2008: 71), provisions for sales and other
taxes of CHF 104 million (2008: 70), and provisions for health
insurance and pension scheme, which do not qualify as benefit
obligations, of CHF 64 million (2008: 68). The expected timing
of the future cash outflows is uncertain.

164 Financial Information
Personnel expenses and number of personnel
The Group’s total personnel expenses, including social charges,
are recognized in the relevant expenditure line by function
of the consolidated statement of income and amounted to
CHF 3,939 million (2008: 4,497). As at December 31, 2009, the
Group employed 81,498 people (2008: 86,713).
Defined benefit pension plans
Some Group companies provide pension plans for their
employees which under IFRS are considered as defined benefit
pension plans. Provisions for pension obligations are estab-
lished for benefits payable in the form of retirement, disability
and surviving dependent’s pensions. The benefits offered vary
according to the legal, fiscal and economic conditions of each
country. Benefits are dependent on years of service and the
respective employee’s compensation and contribution. A net
pension asset is recorded only to the extent that it does not
exceed the present value of any economic benefits available
in the form of refunds from the plan or reductions in future
contributions to the plan and any unrecognized actuarial
losses and past service costs. The obligation resulting from
the defined benefit pension plans is determined using the
projected unit credit method. Unrecognized gains and losses
resulting from changes in actuarial assumptions are recog-
nized as income (expense) over the expected average remain-
ing working lives of the participating employees, but only to
the extent that the net cumulative unrecognized amount
exceeds 10 percent of the greater of the present value of the
defined benefit obligation and the fair value of plan assets at
the end of the previous year.
Other post-employment benefit plans
The Group operates a number of other post-employment
benefit plans. The method of accounting for these provisions is
similar to the one used for defined benefit pension schemes.
A number of these plans are not externally funded, but are
covered by provisions in the statements of financial position
of the respective Group companies.
The following table reconciles the funded, partially funded
and unfunded status of defined benefit pension plans
and other post-employment benefit plans to the amounts
recognized in the statement of financial position.
Reconciliation of retirement benefit plans to the statement of financial position
Million CHF 2009 2008
Net liability arising from defined benefit pension plans 287 245
Net liability arising from other post-employment benefit plans 74 79
Net liability 361 324
Reflected in the statement of financial position as follows:
Other long-term assets (15) (10)
Defined benefit obligations 376 334
Net liability 361 324
32 Employee benefits
Personnel expenses 2009 2008
Million CHF
Production and distribution 2,687 3,079
Marketing and sales 407 458
Administration 845 960
Total 3,939 4,497
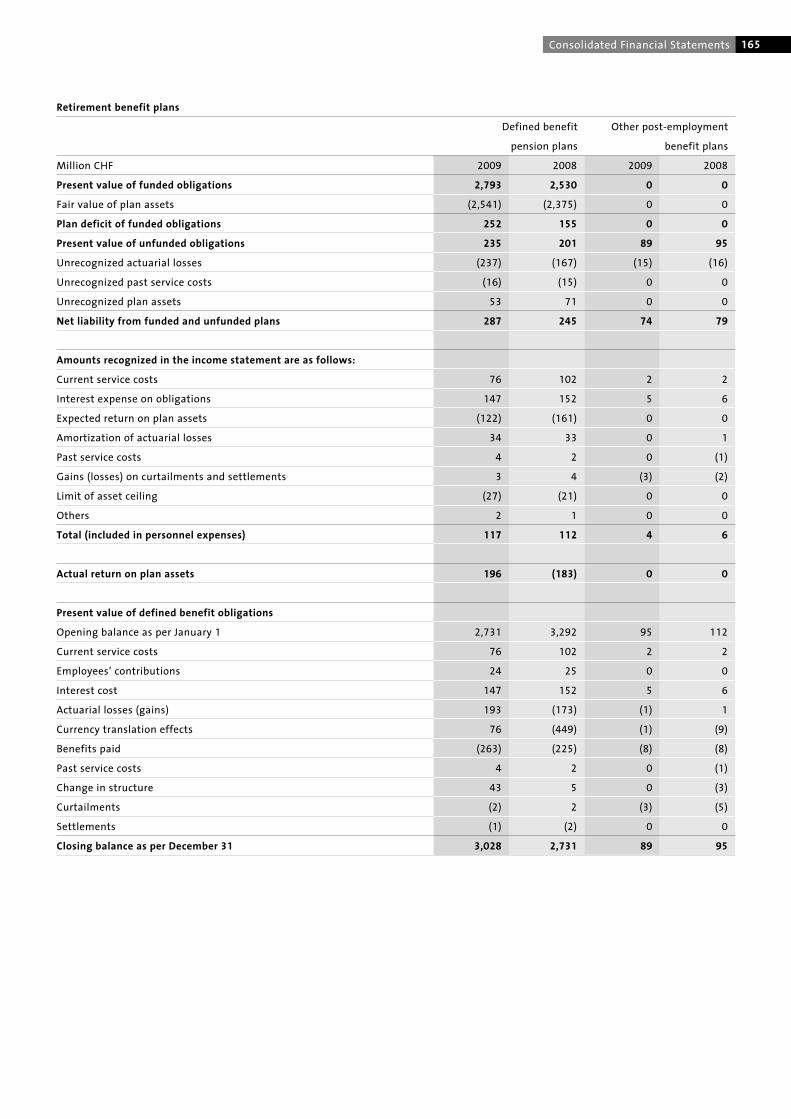
165Consolidated Financial Statements
Retirement benefit plans
Defined benefit Other post-employment
pension plans benefit plans
Million CHF 2009 2008 2009 2008
Present value of funded obligations 2,793 2,530 0 0
Fair value of plan assets (2,541) (2,375) 0 0
Plan deficit of funded obligations 252 155 0 0
Present value of unfunded obligations 235 201 89 95
Unrecognized actuarial losses (237) (167) (15) (16)
Unrecognized past service costs (16) (15) 0 0
Unrecognized plan assets 53 71 0 0
Net liability from funded and unfunded plans 287 245 74 79
Amounts recognized in the income statement are as follows:
Current service costs 76 102 2 2
Interest expense on obligations 147 152 5 6
Expected return on plan assets (122) (161) 0 0
Amortization of actuarial losses 34 33 0 1
Past service costs 4 2 0 (1)
Gains (losses) on curtailments and settlements 3 4 (3) (2)
Limit of asset ceiling (27) (21) 0 0
Others 2 1 0 0
Total (included in personnel expenses) 117 112 4 6
Actual return on plan assets 196 (183) 0 0
Present value of defined benefit obligations
Opening balance as per January 1 2,731 3,292 95 112
Current service costs 76 102 2 2
Employees’ contributions 24 25 0 0
Interest cost 147 152 5 6
Actuarial losses (gains) 193 (173) (1) 1
Currency translation effects 76 (449) (1) (9)
Benefits paid (263) (225) (8) (8)
Past service costs 4 2 0 (1)
Change in structure 43 5 0 (3)
Curtailments (2) 2 (3) (5)
Settlements (1) (2) 0 0
Closing balance as per December 31 3,028 2,731 89 95

166 Financial Information
Retirement benefit plans
Defined benefit Other post-employment
pension plans benefit plans
Million CHF 2009 2008 2009 2008
Fair value of plan assets
Opening balance as per January 1 2,375 3,068 0 12
Expected return on plan assets 122 161 0 0
Actuarial gains (losses) 73 (345) 0 0
Currency translation effects 85 (444) 0 0
Contribution by the employer 79 115 7 7
Contribution by the employees 24 25 0 0
Benefits paid (243) (203) (7) (7)
Change in structure 27 0 0 (12)
Settlements (1) (2) 0 0
Closing balance as per December 31 2,541 2,375 0 0
Plan assets consist of:
Equity instruments of Holcim Ltd or subsidiaries 2 1 0 0
Equity instruments of third parties 754 745 0 0
Debt instruments of Holcim Ltd or subsidiaries 25 24 0 0
Debt instruments of third parties 1,031 958 0 0
Land and buildings occupied or used by third parties 321 308 0 0
Other 408 339 0 0
Total fair value of plan assets 2,541 2,375 0 0
Principal actuarial assumptions used at the end of the reporting period
Discount rate 4.9% 5.3% 5.4% 6.0%
Expected return on plan assets 5.1% 5.4%
Future salary increases 2.8% 2.8%
Medical cost trend rate 8.1% 8.2%
The overall expected rate of return on plan assets is deter-
mined based on the market prices prevailing on that date
applicable to the period over which the obligation is to
be settled.

167Consolidated Financial Statements
Change in assumed medical cost trend rate
A 1 percentage point change in the assumed medical cost trend Increase Increase Decrease Decrease
rate would have the following effects: Million CHF Million CHF Million CHF Million CHF
2009 2008 2009 2008
– On the aggregate of the current service cost and interest cost
components of net periodic post-employment medical costs 0 1 0 1
– On the accumulated post-employment benefit obligations
for medical costs 4 5 3 4
Expected contributions by the employer to be paid to
the post-employment benefit plans during the annual
period beginning after the end of the reporting period
are CHF 111 million (2008: 103).
Experience adjustments
Defined benefit Other post-employment
pension plans benefit plans
Million CHF 2009 2008 2007 2006 2005 2009 2008 2007 2006 2005
Present value
of defined
benefit obligation 3,028 2,731 3,292 3,435 3,085 89 95 112 143 162
Fair value of
plan assets (2,541) (2,375) (3,068) (2,939) (2,470) 0 0 (12) (28) (12)
Deficit 487 356 224 496 615 89 95 100 115 150
Experience
adjustments:
On plan liabilities 0 24 (17) 57 112 (6) (3) 3 0 1
On plan assets 75 (341) 13 76 150 0 0 0 0 0
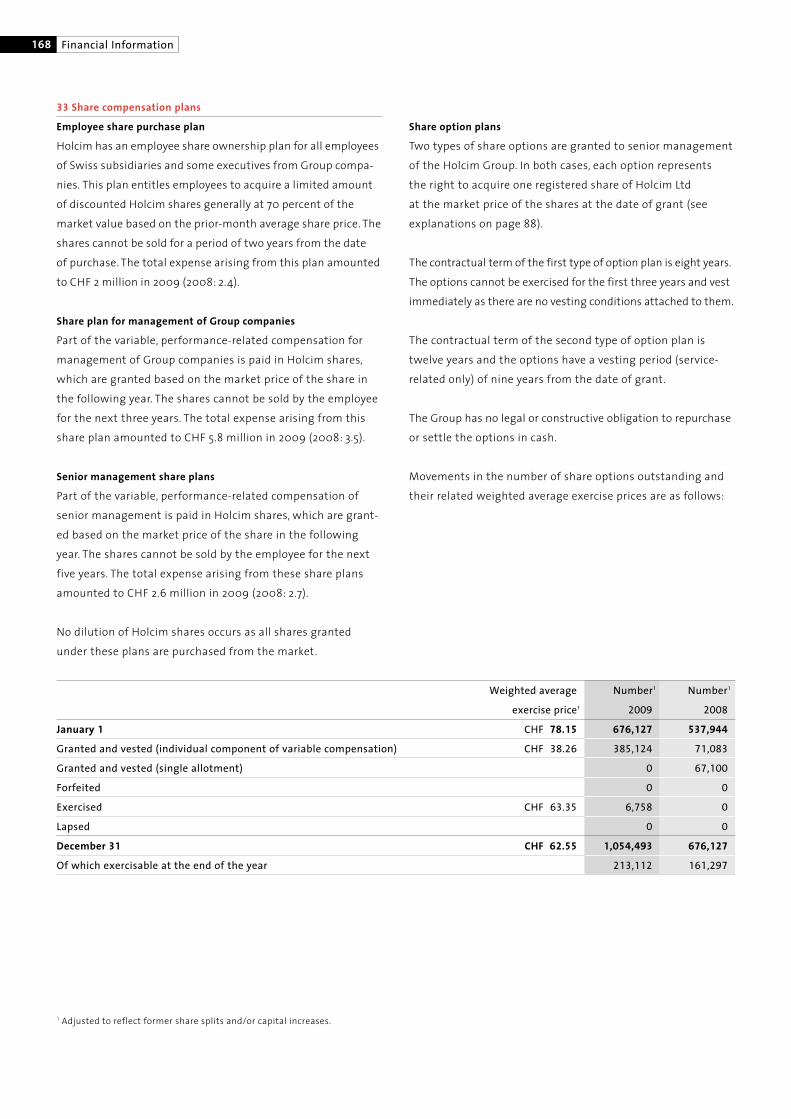
168 Financial Information
1 Adjusted to reflect former share splits and/or capital increases.
Weighted average Number1 Number1
exercise price1 2009 2008
January 1 CHF 78.15 676,127 537,944
Granted and vested (individual component of variable compensation) CHF 38.26 385,124 71,083
Granted and vested (single allotment) 0 67,100
Forfeited 0 0
Exercised CHF 63.35 6,758 0
Lapsed 0 0
December 31 CHF 62.55 1,054,493 676,127
Of which exercisable at the end of the year 213,112 161,297
33 Share compensation plans
Employee share purchase plan
Holcim has an employee share ownership plan for all employees
of Swiss subsidiaries and some executives from Group compa-
nies. This plan entitles employees to acquire a limited amount
of discounted Holcim shares generally at 70 percent of the
market value based on the prior-month average share price. The
shares cannot be sold for a period of two years from the date
of purchase. The total expense arising from this plan amounted
to CHF 2 million in 2009 (2008: 2.4).
Share plan for management of Group companies
Part of the variable, performance-related compensation for
management of Group companies is paid in Holcim shares,
which are granted based on the market price of the share in
the following year. The shares cannot be sold by the employee
for the next three years. The total expense arising from this
share plan amounted to CHF 5.8 million in 2009 (2008: 3.5).
Senior management share plans
Part of the variable, performance-related compensation of
senior management is paid in Holcim shares, which are grant-
ed based on the market price of the share in the following
year. The shares cannot be sold by the employee for the next
five years. The total expense arising from these share plans
amounted to CHF 2.6 million in 2009 (2008: 2.7).
No dilution of Holcim shares occurs as all shares granted
under these plans are purchased from the market.
Share option plans
Two types of share options are granted to senior management
of the Holcim Group. In both cases, each option represents
the right to acquire one registered share of Holcim Ltd
at the market price of the shares at the date of grant (see
explanations on page 88).
The contractual term of the first type of option plan is eight years.
The options cannot be exercised for the first three years and vest
immediately as there are no vesting conditions attached to them.
The contractual term of the second type of option plan is
twelve years and the options have a vesting period (service-
related only) of nine years from the date of grant.
The Group has no legal or constructive obligation to repurchase
or settle the options in cash.
Movements in the number of share options outstanding and
their related weighted average exercise prices are as follows:
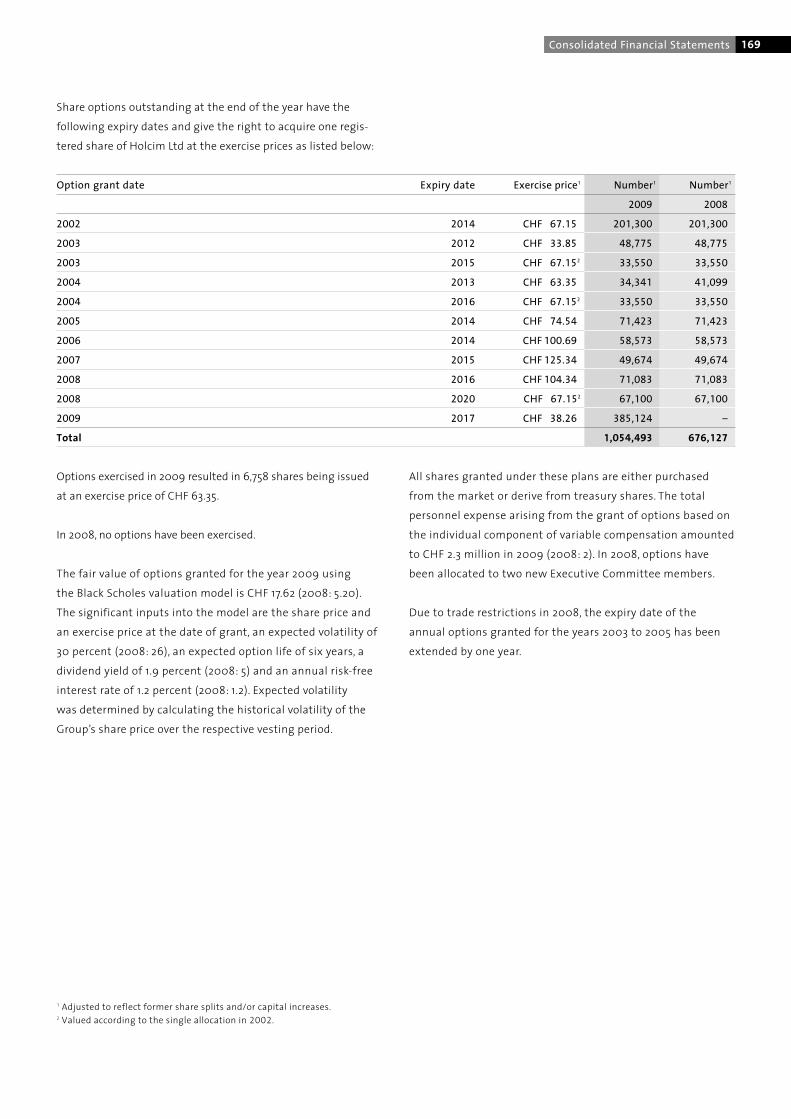
169Consolidated Financial Statements
Share options outstanding at the end of the year have the
following expiry dates and give the right to acquire one regis-
tered share of Holcim Ltd at the exercise prices as listed below:
Option grant date Expiry date Exercise price1 Number1 Number1
2009 2008
2002 2014 CHF 67.15 201,300 201,300
2003 2012 CHF 33.85 48,775 48,775
2003 2015 CHF 67.152 33,550 33,550
2004 2013 CHF 63.35 34,341 41,099
2004 2016 CHF 67.152 33,550 33,550
2005 2014 CHF 74.54 71,423 71,423
2006 2014 CHF 100.69 58,573 58,573
2007 2015 CHF 125.34 49,674 49,674
2008 2016 CHF 104.34 71,083 71,083
2008 2020 CHF 67.152 67,100 67,100
2009 2017 CHF 38.26 385,124 –
Total 1,054,493 676,127
1 Adjusted to reflect former share splits and/or capital increases.2 Valued according to the single allocation in 2002.
Options exercised in 2009 resulted in 6,758 shares being issued
at an exercise price of CHF 63.35.
In 2008, no options have been exercised.
The fair value of options granted for the year 2009 using
the Black Scholes valuation model is CHF 17.62 (2008: 5.20).
The significant inputs into the model are the share price and
an exercise price at the date of grant, an expected volatility of
30 percent (2008: 26), an expected option life of six years, a
dividend yield of 1.9 percent (2008: 5) and an annual risk-free
interest rate of 1.2 percent (2008: 1.2). Expected volatility
was determined by calculating the historical volatility of the
Group’s share price over the respective vesting period.
All shares granted under these plans are either purchased
from the market or derive from treasury shares. The total
personnel expense arising from the grant of options based on
the individual component of variable compensation amounted
to CHF 2.3 million in 2009 (2008: 2). In 2008, options have
been allocated to two new Executive Committee members.
Due to trade restrictions in 2008, the expiry date of the
annual options granted for the years 2003 to 2005 has been
extended by one year.

170 Financial Information
35 Details of shares
Number of registered shares
December 31 2009 2008
Total outstanding shares 320,180,992 258,454,029
Treasury shares
Shares reserved for convertible bonds 5,785,824 4,441,733
Shares reserved for call options 1,054,493 676,127
Unreserved treasury shares 65,067 14,201
Total treasury shares 6,905,384 5,132,061
Total issued shares 327,086,376 263,586,090
– of which issued on May 26, 2009 13,179,305
– of which issued on July 20, 2009 50,320,981
Shares out of conditional share capital
Reserved for convertible bonds 1,422,350 1,422,350
Unreserved 0 0
Total shares out of conditional share capital 1,422,350 1,422,350
Total shares 328,508,726 265,008,440
The par value per share is CHF 2. The share capital amounts
to nominal CHF 654 million (2008: 527) and the acquisition
price of treasury shares amounts to CHF 455 million (2008:
401).
The annual general meeting of shareholders of May 7, 2009
approved a CHF 26,358,610 capital increase (5 percent of the
previous share capital) through the issuance of 13,179,305 fully
paid-in registered shares with a par value of CHF 2. The new
shares were paid by the conversion of freely disposable equity
capital into share capital. The new Holcim shares were paid as
a stock dividend at a ratio of 1:20 to the shareholders of Holcim
Ltd (note 16).
On July 8, 2009, the extraordinary shareholders’ meeting of
Holcim Ltd resolved to increase the company’s share capital
through a rights issue from CHF 553,530,790 to CHF 654,172,752
by issuing 50,320,981 fully paid-in registered shares with a par
value of CHF 2 each. The subscription price for the new regis-
tered shares was CHF 42, which corresponded to gross proceeds
of CHF 2,113 million. Transaction costs amounted to CHF 73 mil-
lion, which were recognized directly in equity. The cash pro-
ceeds were used to finance the acquisition of Cemex Australia
Holdings Pty Ltd (note 1). In addition, Holcim wants to affirm
its strategic partnership in China through the participation
in the planned private placement of Huaxin Cement. The new
registered shares were listed on July 20, 2009 under the Main
Standard of the SIX Swiss Exchange.
34 Construction contracts
Million CHF 2009 2008
Contract revenue recognized during the year 1,487 1,691
Contract costs incurred and recognized profits (less recognized losses) to date 3,127 2,550
Progress billings to date (3,151) (2,578)
Due to contract customers at the end of the reporting period (24) (28)
Of which:
Due from customers for contract work 26 37
Due to customers for contract work (50) (65)

171Consolidated Financial Statements
37 Monetary net current assets by currency
Cash and Accounts Trade Current Other Total Total
marketable receivable accounts financial current 2009 2008
securities payable liabilities liabilities
Million CHF
EUR 987 694 502 2,003 499 (1,323) (720)
GBP 237 278 383 81 161 (110) (444)
CHF 959 105 71 45 219 729 (1,054)
USD 872 449 284 446 354 237 (828)
CAD 2 164 116 2 99 (51) (135)
MXN 84 108 113 199 32 (152) (72)
INR 799 163 155 108 630 69 (12)
THB 30 27 31 78 18 (70) (62)
IDR 33 60 36 0 53 4 42
PHP 25 34 16 0 32 11 (94)
AUD 157 313 147 656 204 (537) (181)
Others 322 1,006 369 835 303 (179) (427)
Total 4,507 3,401 2,223 4,453 2,604 (1,372) (3,987)
Contingencies
In the ordinary course of business, the Group is involved in
lawsuits, claims, investigations and proceedings, including
product liability, commercial, environmental, health and
safety matters, etc. There are no single matters pending that
the Group expects to be material in relation to the Group’s
business, financial position or results of operations.
At December 31, 2009, the Group’s contingencies amounted to
CHF 436 million (2008: 347). It is possible, but not probable,
that the respective legal cases will result in future liabilities.
The Group operates in countries where political, economic,
social and legal developments could have an impact on the
Group’s operations. The effects of such risks which arise in the
normal course of business are not foreseeable and are there-
fore not included in the accompanying consolidated financial
statements.
Guarantees
At December 31, 2009, guarantees issued to third parties in
the ordinary course of business amounted to CHF 335 million
(2008: 330).
Commitments
In the ordinary course of business, the Group enters into
purchase commitments for goods and services, buys and sells
investments, associated companies and Group companies or
portions thereof. It is common practice that the Group makes
offers or receives call or put options in connection with such
acquisitions and divestitures.
At December 31, 2009, the Group’s commitments amounted to
CHF 1,775 million (2008: 1,752), of which CHF 532 million (2008:
666) relate to the purchase of property, plant and equipment.
In 2008, Holcim has agreed, subject to certain conditions, to
participate at market rates in a financing of AfriSam, in which
it holds a 15 percent interest. As a result, Holcim’s maximum
exposure amounted to ZAR 2.7 billion (CHF 310 million), which
were also included in commitments in 2008. In 2009, Holcim
subscribed to loan notes, and with this subscription, Holcim
has substantially fulfilled its commitments relating to the
financing of AfriSam.
Holcim has agreed to subscribe to a private placement issued
by its associated company Huaxin Cement Co. Ltd. amounting
to CNY 1 billion (CHF 151 million) and so confirms its commit-
ment to further deepen the strategic relationship with Huaxin.
36 Contingencies, guarantees and commitments
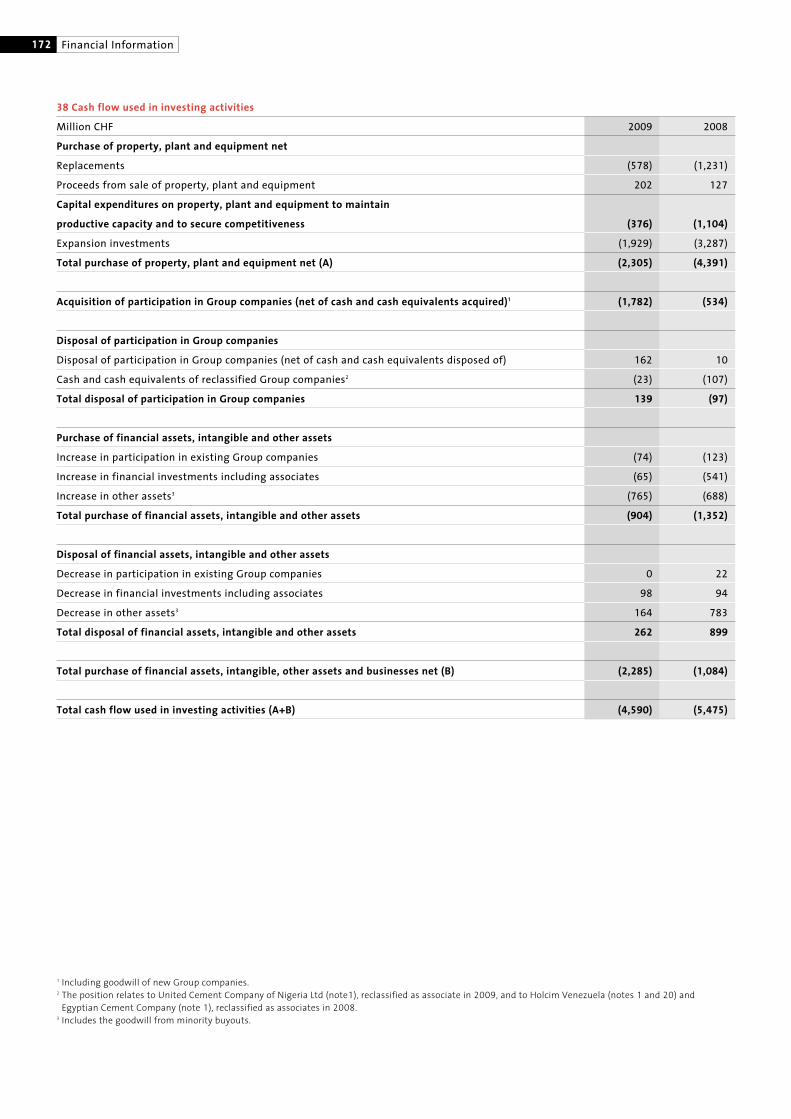
172 Financial Information
38 Cash flow used in investing activities
Million CHF 2009 2008
Purchase of property, plant and equipment net
Replacements (578) (1,231)
Proceeds from sale of property, plant and equipment 202 127
Capital expenditures on property, plant and equipment to maintain
productive capacity and to secure competitiveness (376) (1,104)
Expansion investments (1,929) (3,287)
Total purchase of property, plant and equipment net (A) (2,305) (4,391)
Acquisition of participation in Group companies (net of cash and cash equivalents acquired)1 (1,782) (534)
Disposal of participation in Group companies
Disposal of participation in Group companies (net of cash and cash equivalents disposed of) 162 10
Cash and cash equivalents of reclassified Group companies2 (23) (107)
Total disposal of participation in Group companies 139 (97)
Purchase of financial assets, intangible and other assets
Increase in participation in existing Group companies (74) (123)
Increase in financial investments including associates (65) (541)
Increase in other assets3 (765) (688)
Total purchase of financial assets, intangible and other assets (904) (1,352)
Disposal of financial assets, intangible and other assets
Decrease in participation in existing Group companies 0 22
Decrease in financial investments including associates 98 94
Decrease in other assets3 164 783
Total disposal of financial assets, intangible and other assets 262 899
Total purchase of financial assets, intangible, other assets and businesses net (B) (2,285) (1,084)
Total cash flow used in investing activities (A+B) (4,590) (5,475)
1 Including goodwill of new Group companies.2 The position relates to United Cement Company of Nigeria Ltd (note1), reclassified as associate in 2009, and to Holcim Venezuela (notes 1 and 20) and3 Egyptian Cement Company (note 1), reclassified as associates in 2008.3 Includes the goodwill from minority buyouts.
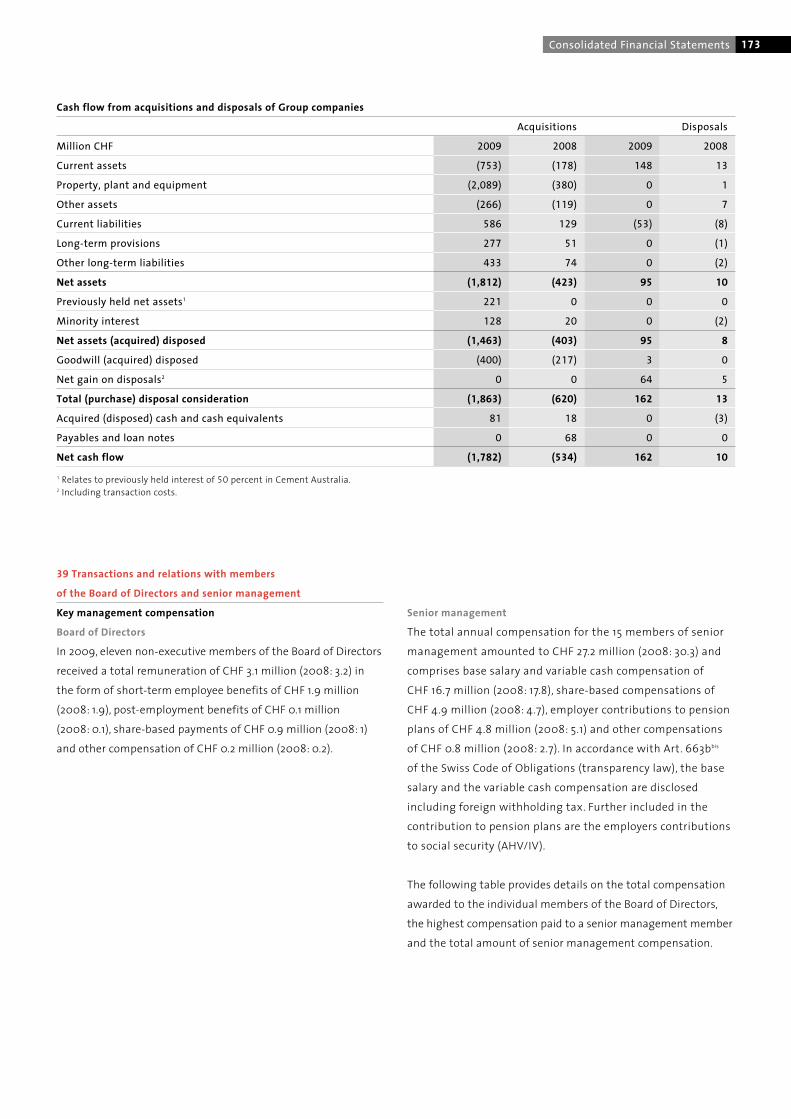
173Consolidated Financial Statements
39 Transactions and relations with members
of the Board of Directors and senior management
Key management compensation
Board of Directors
In 2009, eleven non-executive members of the Board of Directors
received a total remuneration of CHF 3.1 million (2008: 3.2) in
the form of short-term employee benefits of CHF 1.9 million
(2008: 1.9), post-employment benefits of CHF 0.1 million
(2008: 0.1), share-based payments of CHF 0.9 million (2008: 1)
and other compensation of CHF 0.2 million (2008: 0.2).
Cash flow from acquisitions and disposals of Group companies
Acquisitions Disposals
Million CHF 2009 2008 2009 2008
Current assets (753) (178) 148 13
Property, plant and equipment (2,089) (380) 0 1
Other assets (266) (119) 0 7
Current liabilities 586 129 (53) (8)
Long-term provisions 277 51 0 (1)
Other long-term liabilities 433 74 0 (2)
Net assets (1,812) (423) 95 10
Previously held net assets1 221 0 0 0
Minority interest 128 20 0 (2)
Net assets (acquired) disposed (1,463) (403) 95 8
Goodwill (acquired) disposed (400) (217) 3 0
Net gain on disposals2 0 0 64 5
Total (purchase) disposal consideration (1,863) (620) 162 13
Acquired (disposed) cash and cash equivalents 81 18 0 (3)
Payables and loan notes 0 68 0 0
Net cash flow (1,782) (534) 162 10
1 Relates to previously held interest of 50 percent in Cement Australia.2 Including transaction costs.
Senior management
The total annual compensation for the 15 members of senior
management amounted to CHF 27.2 million (2008: 30.3) and
comprises base salary and variable cash compensation of
CHF 16.7 million (2008: 17.8), share-based compensations of
CHF 4.9 million (2008: 4.7), employer contributions to pension
plans of CHF 4.8 million (2008: 5.1) and other compensations
of CHF 0.8 million (2008: 2.7). In accordance with Art. 663bbis
of the Swiss Code of Obligations (transparency law), the base
salary and the variable cash compensation are disclosed
including foreign withholding tax. Further included in the
contribution to pension plans are the employers contributions
to social security (AHV/IV).
The following table provides details on the total compensation
awarded to the individual members of the Board of Directors,
the highest compensation paid to a senior management member
and the total amount of senior management compensation.
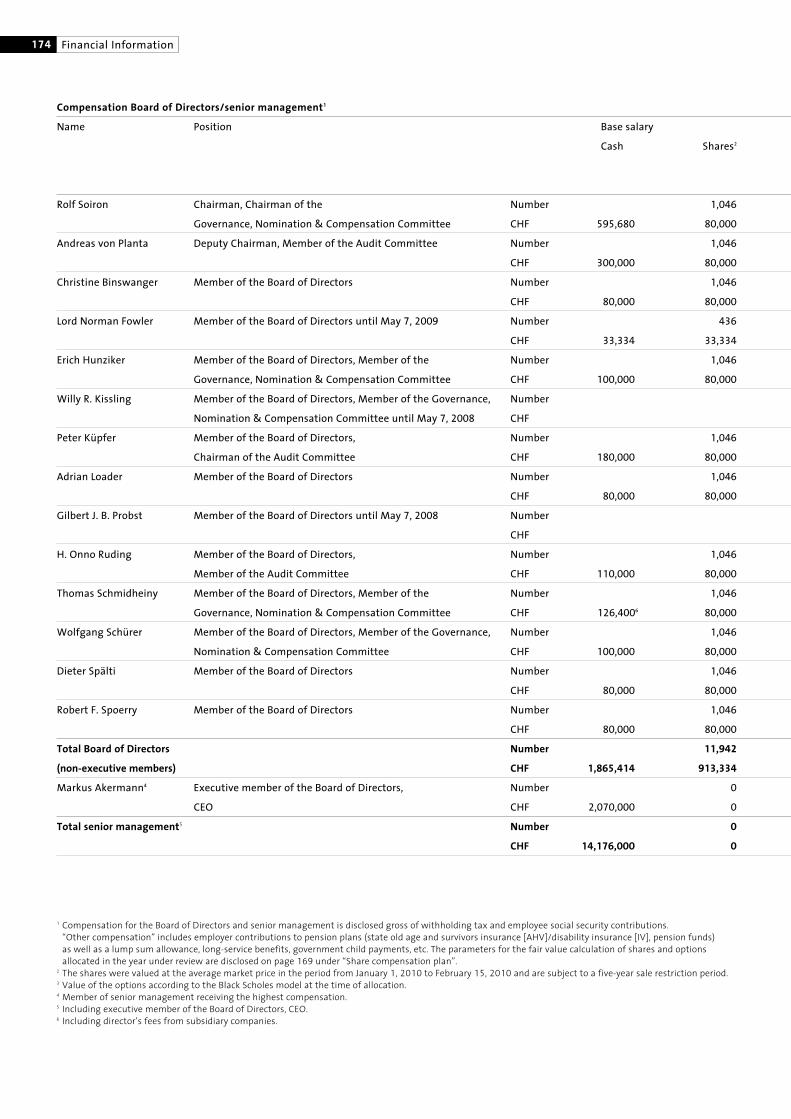
174 Financial Information
1 Compensation for the Board of Directors and senior management is disclosed gross of withholding tax and employee social security contributions.“Other compensation” includes employer contributions to pension plans (state old age and survivors insurance [AHV]/disability insurance [IV], pension funds)as well as a lump sum allowance, long-service benefits, government child payments, etc. The parameters for the fair value calculation of shares and optionsallocated in the year under review are disclosed on page 169 under “Share compensation plan”.
2 The shares were valued at the average market price in the period from January 1, 2010 to February 15, 2010 and are subject to a five-year sale restriction period.3 Value of the options according to the Black Scholes model at the time of allocation.4 Member of senior management receiving the highest compensation.5 Including executive member of the Board of Directors, CEO.6 Including director’s fees from subsidiary companies.
Compensation Board of Directors/senior management1
Name Position Base salary
Cash Shares2
Rolf Soiron Chairman, Chairman of the Number 1,046
Governance, Nomination & Compensation Committee CHF 595,680 80,000
Andreas von Planta Deputy Chairman, Member of the Audit Committee Number 1,046
CHF 300,000 80,000
Christine Binswanger Member of the Board of Directors Number 1,046
CHF 80,000 80,000
Lord Norman Fowler Member of the Board of Directors until May 7, 2009 Number 436
CHF 33,334 33,334
Erich Hunziker Member of the Board of Directors, Member of the Number 1,046
Governance, Nomination & Compensation Committee CHF 100,000 80,000
Willy R. Kissling Member of the Board of Directors, Member of the Governance, Number
Nomination & Compensation Committee until May 7, 2008 CHF
Peter Küpfer Member of the Board of Directors, Number 1,046
Chairman of the Audit Committee CHF 180,000 80,000
Adrian Loader Member of the Board of Directors Number 1,046
CHF 80,000 80,000
Gilbert J. B. Probst Member of the Board of Directors until May 7, 2008 Number
CHF
H. Onno Ruding Member of the Board of Directors, Number 1,046
Member of the Audit Committee CHF 110,000 80,000
Thomas Schmidheiny Member of the Board of Directors, Member of the Number 1,046
Governance, Nomination & Compensation Committee CHF 126,4006 80,000
Wolfgang Schürer Member of the Board of Directors, Member of the Governance, Number 1,046
Nomination & Compensation Committee CHF 100,000 80,000
Dieter Spälti Member of the Board of Directors Number 1,046
CHF 80,000 80,000
Robert F. Spoerry Member of the Board of Directors Number 1,046
CHF 80,000 80,000
Total Board of Directors Number 11,942
(non-executive members) CHF 1,865,414 913,334
Markus Akermann4 Executive member of the Board of Directors, Number 0
CEO CHF 2,070,000 0
Total senior management5 Number 0
CHF 14,176,000 0
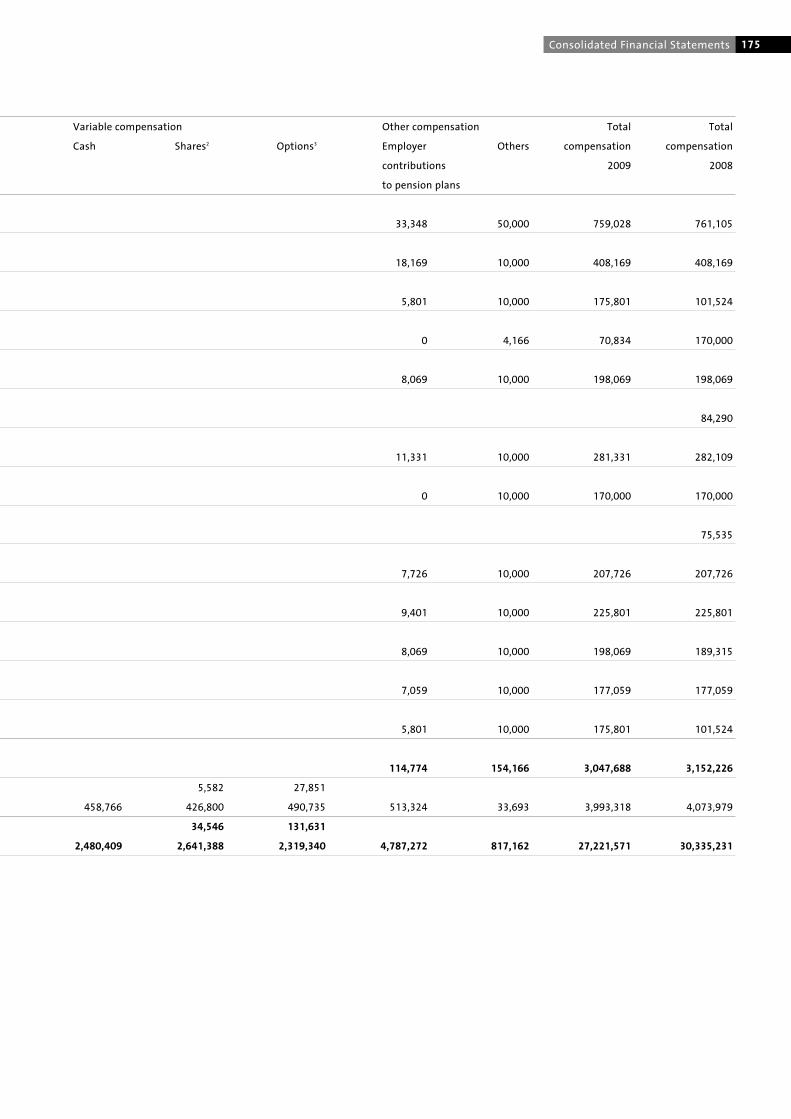
175Consolidated Financial Statements
Variable compensation Other compensation Total Total
Cash Shares2 Options3 Employer Others compensation compensation
contributions 2009 2008
to pension plans
33,348 50,000 759,028 761,105
18,169 10,000 408,169 408,169
5,801 10,000 175,801 101,524
0 4,166 70,834 170,000
8,069 10,000 198,069 198,069
84,290
11,331 10,000 281,331 282,109
0 10,000 170,000 170,000
75,535
7,726 10,000 207,726 207,726
9,401 10,000 225,801 225,801
8,069 10,000 198,069 189,315
7,059 10,000 177,059 177,059
5,801 10,000 175,801 101,524
114,774 154,166 3,047,688 3,152,226
5,582 27,851
458,766 426,800 490,735 513,324 33,693 3,993,318 4,073,979
34,546 131,631
2,480,409 2,641,388 2,319,340 4,787,272 817,162 27,221,571 30,335,231

176 Financial Information
Compensation for former members of governing bodies
In the year under review, compensation of CHF 1,340,400
(2008: 503,500) was paid to six (2008: three) former members
of governing bodies.
Loans
As at December 31, 2009, there were no loans outstanding, which
were granted to members of senior management. There were no
loans to members of the Board of Directors outstanding.
As at December 31, 2008, there were loans outstanding, which
were granted to five members of senior management. There
were no loans to members of the Board of Directors outstanding.
The table provides details on the loans granted.
Borrower Position Original Loan amount Interest Maturity Collateral
currency in CHF rate date
Urs Böhlen Member of the Executive Committee CHF 51,000 variable 31.12.15 yes
Thomas Knöpfel Member of the Executive Committee CHF 16,000 variable 31.12.09 yes
Benoît-H. Koch Member of the Executive Committee CHF 1,450,000 3.25% 31.01.10 yes
Benoît-H. Koch Member of the Executive Committee EUR 200,662 variable open yes
Roland Köhler Corporate Functional Manager CHF 300,000 variable 31.12.15 yes
Stefan Wolfensberger Corporate Functional Manager CHF 438,100 variable 31.12.22 yes
Total CHF 2,455,762

177Consolidated Financial Statements
Shares and options owned by senior executives
The tables show the number of shares and options held by
senior executives as at December 31, 2009 and December 31,
2008 respectively.
The total number of shares and call options comprise privately
acquired shares and call options, and shares allocated under
profit-sharing and compensation schemes. Non-executive
members of the Board of Directors did not receive any options
from compensation and profit-sharing schemes.
Board of Directors
Name Position Total number Total number
of shares 2009 of call options 2009
Rolf Soiron Chairman, Governance, Nomination &
Compensation Committee Chairman 34,667 –
Andreas von Planta Deputy Chairman 8,462 –
Christine Binswanger Member 1,714 –
Erich Hunziker Member 8,704 –
Peter Küpfer Member, 83,2881
Audit Committee Chairman 8,703 31,0002
Adrian Loader Member 5,468 –
H. Onno Ruding Member 4,595 –
Thomas Schmidheiny Member 59,567,887 –
Wolfgang Schürer Member 41,408 –
Dieter Spälti Member 20,017 –
Robert F. Spoerry Member 7,133 –
Total Board of Directors
(non-executive members) 59,708,758 114,288
1 Exercise price: CHF 110; Ratio 1.0411:1; Style: European; Maturity: 21.5.2010.2 Exercise price: CHF 80; Ratio 1:1; Style: American; Maturity: 12.11.2013.
Board of Directors
Name Position Total number Total number
of shares 2008 of call options 2008
Rolf Soiron Chairman, Governance, Nomination &
Compensation Committee Chairman 28,917 –
Andreas von Planta Deputy Chairman 5,306 –
Christine Binswanger Member 500 –
Lord Norman Fowler Member 1,827 –
Erich Hunziker Member 5,503 –
Peter Küpfer Member, Audit Committee Chairman 5,502 80,000
Adrian Loader Member 2,894 –
H. Onno Ruding Member 2,864 –
Thomas Schmidheiny Member 54,292,690 –
Wolfgang Schürer Member 31,821 –
Dieter Spälti Member 7,842 –
Robert F. Spoerry Member 5,000 –
Total Board of Directors
(non-executive members) 54,390,666 80,000
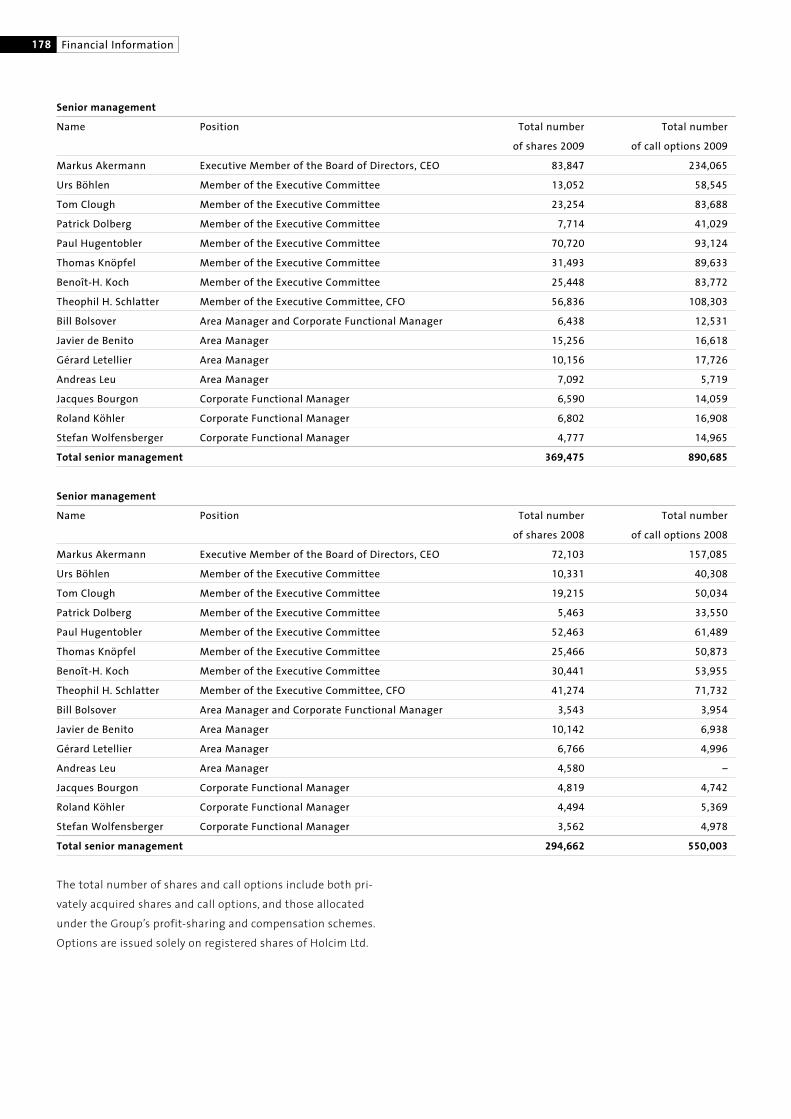
Senior management
Name Position Total number Total number
of shares 2009 of call options 2009
Markus Akermann Executive Member of the Board of Directors, CEO 83,847 234,065
Urs Böhlen Member of the Executive Committee 13,052 58,545
Tom Clough Member of the Executive Committee 23,254 83,688
Patrick Dolberg Member of the Executive Committee 7,714 41,029
Paul Hugentobler Member of the Executive Committee 70,720 93,124
Thomas Knöpfel Member of the Executive Committee 31,493 89,633
Benoît-H. Koch Member of the Executive Committee 25,448 83,772
Theophil H. Schlatter Member of the Executive Committee, CFO 56,836 108,303
Bill Bolsover Area Manager and Corporate Functional Manager 6,438 12,531
Javier de Benito Area Manager 15,256 16,618
Gérard Letellier Area Manager 10,156 17,726
Andreas Leu Area Manager 7,092 5,719
Jacques Bourgon Corporate Functional Manager 6,590 14,059
Roland Köhler Corporate Functional Manager 6,802 16,908
Stefan Wolfensberger Corporate Functional Manager 4,777 14,965
Total senior management 369,475 890,685
178 Financial Information
Senior management
Name Position Total number Total number
of shares 2008 of call options 2008
Markus Akermann Executive Member of the Board of Directors, CEO 72,103 157,085
Urs Böhlen Member of the Executive Committee 10,331 40,308
Tom Clough Member of the Executive Committee 19,215 50,034
Patrick Dolberg Member of the Executive Committee 5,463 33,550
Paul Hugentobler Member of the Executive Committee 52,463 61,489
Thomas Knöpfel Member of the Executive Committee 25,466 50,873
Benoît-H. Koch Member of the Executive Committee 30,441 53,955
Theophil H. Schlatter Member of the Executive Committee, CFO 41,274 71,732
Bill Bolsover Area Manager and Corporate Functional Manager 3,543 3,954
Javier de Benito Area Manager 10,142 6,938
Gérard Letellier Area Manager 6,766 4,996
Andreas Leu Area Manager 4,580 –
Jacques Bourgon Corporate Functional Manager 4,819 4,742
Roland Köhler Corporate Functional Manager 4,494 5,369
Stefan Wolfensberger Corporate Functional Manager 3,562 4,978
Total senior management 294,662 550,003
The total number of shares and call options include both pri-
vately acquired shares and call options, and those allocated
under the Group’s profit-sharing and compensation schemes.
Options are issued solely on registered shares of Holcim Ltd.
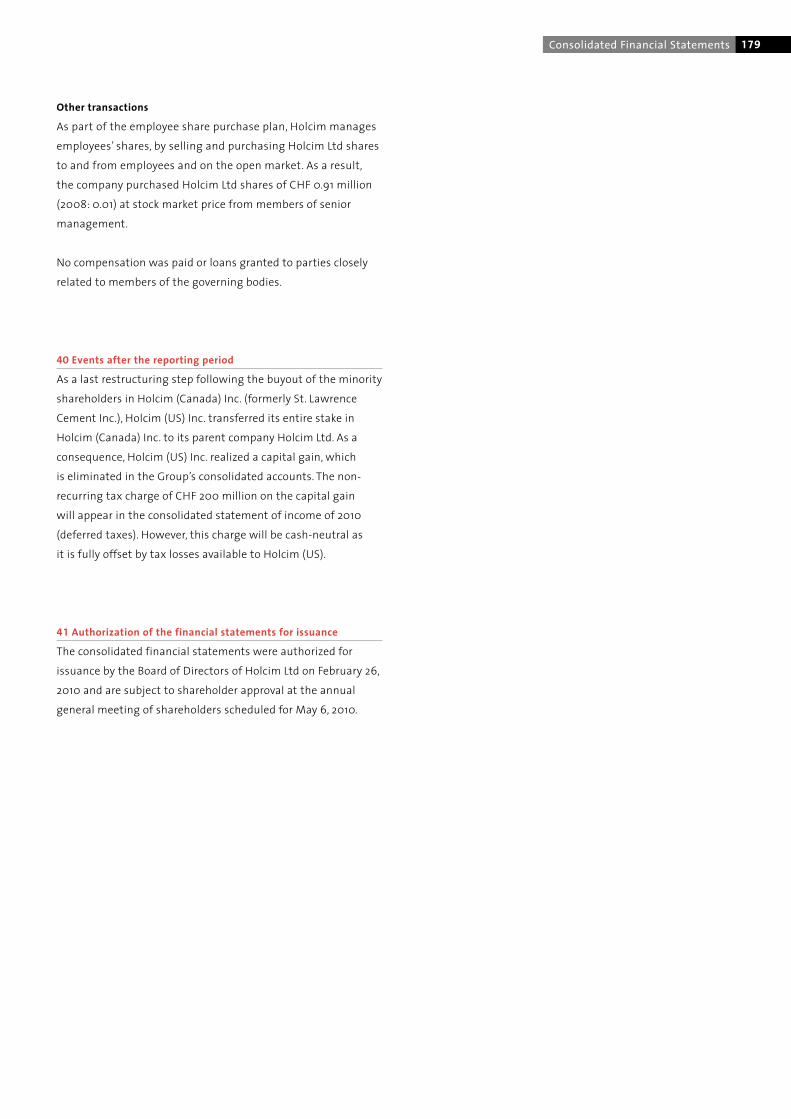
179Consolidated Financial Statements
Other transactions
As part of the employee share purchase plan, Holcim manages
employees’ shares, by selling and purchasing Holcim Ltd shares
to and from employees and on the open market. As a result,
the company purchased Holcim Ltd shares of CHF 0.91 million
(2008: 0.01) at stock market price from members of senior
management.
No compensation was paid or loans granted to parties closely
related to members of the governing bodies.
40 Events after the reporting period
As a last restructuring step following the buyout of the minority
shareholders in Holcim (Canada) Inc. (formerly St. Lawrence
Cement Inc.), Holcim (US) Inc. transferred its entire stake in
Holcim (Canada) Inc. to its parent company Holcim Ltd. As a
consequence, Holcim (US) Inc. realized a capital gain, which
is eliminated in the Group’s consolidated accounts. The non-
recurring tax charge of CHF 200 million on the capital gain
will appear in the consolidated statement of income of 2010
(deferred taxes). However, this charge will be cash-neutral as
it is fully offset by tax losses available to Holcim (US).
41 Authorization of the financial statements for issuance
The consolidated financial statements were authorized for
issuance by the Board of Directors of Holcim Ltd on February 26,
2010 and are subject to shareholder approval at the annual
general meeting of shareholders scheduled for May 6, 2010.

180 Financial Information
Region Company Place Nominal share capital Participation
in 000 (voting right)
Europe Holcim France Benelux S.A.S. France EUR 192,253 100.0%
Holcim (España), S.A. Spain EUR 345,787 99.9%
Holcim Trading SA Spain EUR 19,600 100.0%
Aggregate Industries Ltd United Kingdom GBP – 100.0%
Holcim (Deutschland) AG Germany EUR 47,064 88.9%
Holcim (Süddeutschland) GmbH Germany EUR 6,450 100.0%
Holcim (Schweiz) AG Switzerland CHF 71,100 100.0%
Holcim Gruppo (Italia) S.p.A. Italy EUR 67,000 100.0%
Holcim Group Support Ltd Switzerland CHF 1,000 100.0%
Holcim (Cesko) a.s. Czech Republic CZK 486,297 100.0%
Holcim (Slovensko) a.s. Slovakia EUR 42,320 98.0%
Holcim Hungária Zrt. Hungary HUF 3,176,805 99.7%
Holcim (Hrvatska) d.o.o. Croatia HRK 94,000 99.8%
Holcim (Srbija) a.d. Serbia CSD 2,300,000 100.0%
Holcim (Romania) S.A. Romania RON 274,243 99.7%
Holcim (Bulgaria) AD Bulgaria BGN 1,093 100.0%
Alpha Cement J.S.C. Russia RUB 8,298 80.8%
“Garadagh” Sement O.T.J.S.C. Azerbaijan AZN 31,813 69.6%
North America Holcim (US) Inc. USA USD – 100.0%
Aggregate Industries Management Inc. USA USD 194,058 100.0%
Holcim (Canada) Inc. Canada CAD 171,201 100.0%
Latin America Holcim Apasco S.A. de C.V. Mexico MXN 5,843,086 100.0%
Cemento de El Salvador S.A. de C.V. El Salvador USD 78,178 91.6%
Holcim (Nicaragua) S.A. Nicaragua NIO 19,469 80.0%
Holcim (Costa Rica) S.A. Costa Rica CRC 8,604,056 59.8%
Holcim (Colombia) S.A. Colombia COP 72,536,776 99.8%
Holcim (Ecuador) S.A. Ecuador USD 102,405 92.2%
Holcim (Brasil) S.A. Brazil BRL 455,675 99.9%
Juan Minetti S.A. Argentina ARS 352,057 79.6%
Cemento Polpaico S.A. Chile CLP 7,498,731 54.3%
Principal companies of the Holcim Group
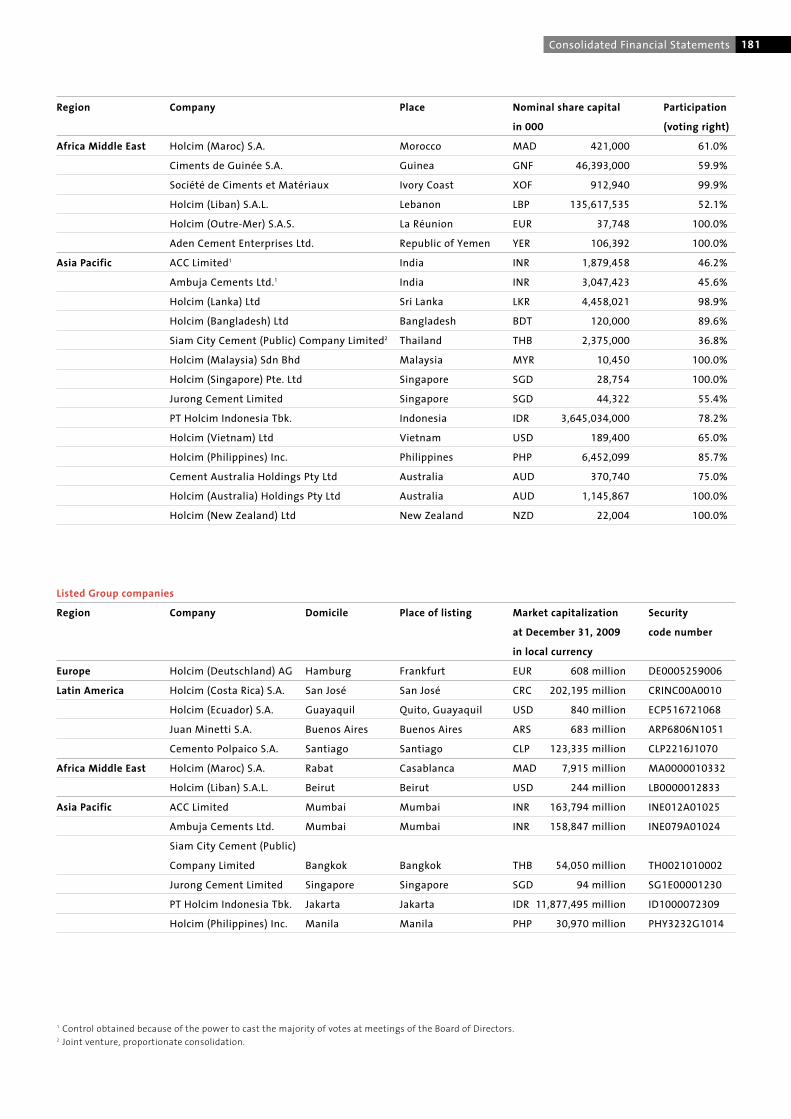
181Consolidated Financial Statements
Region Company Place Nominal share capital Participation
in 000 (voting right)
Africa Middle East Holcim (Maroc) S.A. Morocco MAD 421,000 61.0%
Ciments de Guinée S.A. Guinea GNF 46,393,000 59.9%
Société de Ciments et Matériaux Ivory Coast XOF 912,940 99.9%
Holcim (Liban) S.A.L. Lebanon LBP 135,617,535 52.1%
Holcim (Outre-Mer) S.A.S. La Réunion EUR 37,748 100.0%
Aden Cement Enterprises Ltd. Republic of Yemen YER 106,392 100.0%
Asia Pacific ACC Limited1 India INR 1,879,458 46.2%
Ambuja Cements Ltd.1 India INR 3,047,423 45.6%
Holcim (Lanka) Ltd Sri Lanka LKR 4,458,021 98.9%
Holcim (Bangladesh) Ltd Bangladesh BDT 120,000 89.6%
Siam City Cement (Public) Company Limited2 Thailand THB 2,375,000 36.8%
Holcim (Malaysia) Sdn Bhd Malaysia MYR 10,450 100.0%
Holcim (Singapore) Pte. Ltd Singapore SGD 28,754 100.0%
Jurong Cement Limited Singapore SGD 44,322 55.4%
PT Holcim Indonesia Tbk. Indonesia IDR 3,645,034,000 78.2%
Holcim (Vietnam) Ltd Vietnam USD 189,400 65.0%
Holcim (Philippines) Inc. Philippines PHP 6,452,099 85.7%
Cement Australia Holdings Pty Ltd Australia AUD 370,740 75.0%
Holcim (Australia) Holdings Pty Ltd Australia AUD 1,145,867 100.0%
Holcim (New Zealand) Ltd New Zealand NZD 22,004 100.0%
Region Company Domicile Place of listing Market capitalization Security
at December 31, 2009 code number
in local currency
Europe Holcim (Deutschland) AG Hamburg Frankfurt EUR 608 million DE0005259006
Latin America Holcim (Costa Rica) S.A. San José San José CRC 202,195 million CRINC00A0010
Holcim (Ecuador) S.A. Guayaquil Quito, Guayaquil USD 840 million ECP516721068
Juan Minetti S.A. Buenos Aires Buenos Aires ARS 683 million ARP6806N1051
Cemento Polpaico S.A. Santiago Santiago CLP 123,335 million CLP2216J1070
Africa Middle East Holcim (Maroc) S.A. Rabat Casablanca MAD 7,915 million MA0000010332
Holcim (Liban) S.A.L. Beirut Beirut USD 244 million LB0000012833
Asia Pacific ACC Limited Mumbai Mumbai INR 163,794 million INE012A01025
Ambuja Cements Ltd. Mumbai Mumbai INR 158,847 million INE079A01024
Siam City Cement (Public)
Company Limited Bangkok Bangkok THB 54,050 million TH0021010002
Jurong Cement Limited Singapore Singapore SGD 94 million SG1E00001230
PT Holcim Indonesia Tbk. Jakarta Jakarta IDR 11,877,495 million ID1000072309
Holcim (Philippines) Inc. Manila Manila PHP 30,970 million PHY3232G1014
Listed Group companies
1 Control obtained because of the power to cast the majority of votes at meetings of the Board of Directors.2 Joint venture, proportionate consolidation.

182 Financial Information
Region Company Country of incorporation Participation
or residence (voting right)
North America Lattimore Materials Company, L.P. USA 49.0%
Latin America Cementos Progreso S.A. Guatemala 20.0%
Africa Middle East AfriSam (Pty) Ltd1 South Africa 15.0%
Lafarge Cement Egypt S.A.E. Egypt 43.7%
(formerly Egyptian Cement Company S.A.E.)
United Cement Company of Nigeria Ltd Nigeria 35.9%
Asia Pacific Espandar Cement Investment Co. (P.J.S.) Iran 49.9%
Huaxin Cement Co. Ltd. China 39.9%
Principal associated companies
Place Nominal share capital Participation
in 000 (voting right)
Holcim Ltd Switzerland CHF 654,173 100.0%
Aggregate Industries Holdings Limited United Kingdom GBP 505,581 100.0%
Cemasco B.V. Netherlands USD 1,030 100.0%
Holcibel S.A. Belgium EUR 831,000 100.0%
Holcim Auslandbeteiligungs GmbH (Deutschland) Germany EUR 2,556 100.0%
Holcim Beteiligungs GmbH (Deutschland) Germany EUR 102,000 100.0%
Holcim Capital Corporation Ltd. Bermuda USD 2,630 100.0%
Holcim Capital (Thailand) Ltd. Thailand THB 1,100 100.0%
Holcim (Centroamérica) B.V. Netherlands USD 3,855 100.0%
Holcim European Finance Ltd. Bermuda EUR 25 100.0%
Holcim Finance (Australia) Pty Ltd Australia AUD 0 100.0%
Holcim Finance (Belgium) S.A. Belgium EUR 62 100.0%
Holcim Finance (Canada) Inc. Canada CAD 0 100.0%
Holcim Finance (Luxembourg) S.A. Luxemburg EUR 1,900 100.0%
Holcim GB Finance Ltd. Bermuda GBP 8 100.0%
Holcim (India) Private Limited India INR 19,317,267 100.0%
Holcim Investments (France) SAS France EUR 15,551 100.0%
Holcim Investments (Spain) S.L. Spain EUR 87,798 100.0%
Holcim Overseas Finance Ltd. Bermuda CHF 16 100.0%
Holcim Participations (UK) Limited United Kingdom GBP 690,000 100.0%
Holcim Participations (US) Inc. USA USD 67 100.0%
Holcim Reinsurance Ltd. Bermuda CHF 1,453 100.0%
Holcim US Finance S.à r.l. & Cie S.C.S. Luxemburg USD 10 100.0%
Holderfin B.V. Netherlands EUR 3,772 100.0%
Principal finance and holding companies
1 Due to significant influence.

183Consolidated Financial Statements
To the General Meeting of Holcim Ltd, Jona
Zurich, February 26, 2010
Report of the statutory auditor on the consolidated financial statements
As statutory auditor, we have audited the consolidated financial statements of Holcim Ltd, which comprise the consolidated statement
of income, consolidated statement of comprehensive earnings, consolidated statement of financial position, statement of changes
in consolidated equity, consolidated statement of cash flows and notes on pages 113 to 182 for the year ended December 31, 2009.
Board of Directors’ responsibility
The Board of Directors is responsible for the preparation of the consolidated financial statements in accordance with International
Financial Reporting Standards (IFRS) and the requirements of Swiss law. This responsibility includes designing, implementing and
maintaining an internal control system relevant to the preparation and fair presentation of consolidated financial statements that
are free from material misstatement, whether due to fraud or error. The Board of Directors is further responsible for selecting and
applying appropriate accounting policies and making accounting estimates that are reasonable in the circumstances.
Auditor’s responsibility
Our responsibility is to express an opinion on these consolidated financial statements based on our audit. We conducted our audit
in accordance with Swiss law, Swiss Auditing Standards and International Standards on Auditing. Those standards require that we
plan and perform the audit to obtain reasonable assurance whether the consolidated financial statements are free from material
misstatement. An audit involves performing procedures to obtain audit evidence about the amounts and disclosures in the consoli-
dated financial statements. The procedures selected depend on the auditor’s judgment, including the assessment of the risks of
material misstatement of the consolidated financial statements, whether due to fraud or error. In making those risk assessments, the
auditor considers the internal control system relevant to the entity’s preparation and fair presentation of the consolidated financial
statements in order to design audit procedures that are appropriate in the circumstances, but not for the purpose of expressing an
opinion on the effectiveness of the entity’s internal control system. An audit also includes evaluating the appropriateness of the
accounting policies used and the reasonableness of accounting estimates made as well as evaluating the overall presentation of the
consolidated financial statements. We believe that the audit evidence we have obtained is sufficient and appropriate to provide a
basis for our audit opinion.
Opinion
In our opinion, the consolidated financial statements for the year ended December 31, 2009 give a true and fair view of the financial
position, the results of operations and the cash flows in accordance with the International Financial Reporting Standards (IFRS) and
comply with Swiss law.
Report on other legal requirements
We confirm that we meet the legal requirements on licensing according to the Auditor Oversight Act (AOA) and independence
(Art. 728 Code of Obligations (CO) and Art. 11 AOA) and that there are no circumstances incompatible with our independence. In
accordance with Art. 728a para. 1 item 3 CO and Swiss Auditing Standard 890, we confirm that an internal control system exists,
which has been designed for the preparation of consolidated financial statements according to the instructions of the Board of
Directors. We recommend that the consolidated financial statements submitted to you be approved.
Ernst & Young Ltd
Christoph Dolensky Willy Hofstetter
Licensed Audit Expert Licensed Audit Expert
Auditor in charge


185Company Data
Cement
Aggregates�Other constructionmaterialsand services
Holcim France Benelux S.A.S., France
Chief Executive: Vincent Bichet
Country Manager France: Gérard Letellier
Country Manager Belgium/Netherlands: Lukas Epple
Personnel: 3,218
Production capacity: 8.2 million t of cement
Altkirch plant
Dannes plant
Héming plant
Lumbres plant
Obourg plant
Rochefort plant
Dunkerque grinding plant
Ebange grinding plant
Grand-Couronne grinding plant
Haccourt grinding plant
Shareholdings:
Dijon Béton Soc �Geocycle S.A.
Holcim Betonproducten B.V. �Holcim Bétons (Belgique) S.A. �Holcim Bétons (France) S.A.S. �Holcim Granulats (Belgique) S.A.
Holcim Granulats (France) S.A.S.
Holcim Grondstoffen B.V. �
Holcim (España), S.A., Spain
Chief Executive: Vincent Lefebvre
Personnel: 1,566
Production capacity: 5.5 million t of cement
Carboneras plant
Gádor plant
Jerez plant
Lorca plant
Yeles plant
Shareholdings:
Holcim Aridos S.L.
Holcim Hormigones S.A. �Holcim Morteros S.A. �
Holcim Trading SA, Spain
Chief Executive: José Cantillana
Personnel: 96
Seaborne clinker and cement trading
and others �
Aggregate Industries Ltd, United Kingdom
Chief Executive: Bill Bolsover
Personnel: 5,636
Aggregate Industries Scotland �Aggregate Supplies �Ash Solutions �Bardon Aggregates
Bardon Asphalt �Bardon Concrete �Bardon Contracting �Bradstone/Stone Flair �Charcon �Express Asphalt �London Concrete �Masterblock �Moxon Traffic Management �Paragon Materials �Ronez �Yeoman Aggregates
Shareholdings:
Aggregate Industries UK Ltd. �Halsvik Aggregates AS
Spadeoak Construction Co Limited �Yeoman Asphalt Ltd �Yeoman Baumineralien GmbH
Yeoman Poland sp Zoo
Holcim (Deutschland) AG, Germany
Chief Executive: Leo Mittelholzer
Personnel: 1,404
Production capacity: 3.3 million t of cement
Höver plant
Lägerdorf plant
Bremen grinding plant
Shareholdings:
Hannoversche Silo-Gesellschaft mbH �Holcim Beton und Zuschlagsstoffe
(NRW) GmbH �
Hüttensand Salzgitter GmbH & Co. KG
SBU Kieswerk Zeithain GmbH & Co. KG
Vereinigte Transportbetonwerke
GmbH & Co. KG �
Principal companies of the Holcim Group

186 Financial Information
Cement
Aggregates�Other constructionmaterialsand services
Holcim (Süddeutschland) GmbH, Germany
Regional General Manager: Carlo Gervasoni
Country Manager: Reto Willimann
Personnel: 319
Production capacity: 1.6 million t of cement
Dotternhausen plant
Shareholding:
Holcim Kies und Beton GmbH �
Holcim (Schweiz) AG, Switzerland
Regional General Manager: Carlo Gervasoni
Country Manager: Kaspar Wenger
Personnel: 1,210
Production capacity: 3.5 million t of cement
Eclépens plant
Siggenthal plant
Untervaz plant
Lorüns grinding plant, Austria
Shareholdings:
Holcim BF+P SA �Holcim Kies und Beton AG �Holcim (Vorarlberg) GmbH, Austria
Holcim Gruppo (Italia) S.p.A., Italy
Regional General Manager: Carlo Gervasoni
Country Manager: Domenico Salvadore
Personnel: 681
Production capacity: 4.8 million t of cement
Merone plant
Ternate plant
Morano grinding plant
Ravenna grinding plant
Shareholdings:
Eurofuels
Holcim Aggregati S.r.l.
Holcim Calcestruzzi S.r.l. �
Holcim Group Support Ltd, Switzerland
Personnel: 832
Management services �Shareholding:
Ceprocim Engineering S.r.l., Romania �
Holcim (Cesko) a.s., Czech Republic
Regional General Manager: Kurt Habersatter
Country Manager: Patrick Stapfer
Personnel: 396
Production capacity: 1.4 million t of cement
Prachovice plant
Aggregates operations
Ready-mix concrete operations �Shareholdings:
Lom Klecany s.r.o �Transbeton Skanska s.r.o �
Holcim (Slovensko) a.s., Slovakia
Regional General Manager: Kurt Habersatter
Country Manager: Alan Sisinacki
Personnel: 560
Production capacity: 2.2 million t of cement
Rohozník plant
Aggregates operations
Ready-mix concrete operations �Shareholding:
Holcim Wien GmbH, Austria
Holcim Hungária Zrt., Hungary
Regional General Manager: Kurt Habersatter
Country Manager: Richard Skene
Personnel: 642
Production capacity: 2.1 million t of cement
Hejöcsaba plant
Lábatlan plant
Aggregates operations
Ready-mix concrete operations �
Holcim (Hrvatska) d.o.o., Croatia
Regional General Manager: Kurt Habersatter
Country Manager: Mario Grassl
Personnel: 335
Production capacity: 1.0 million t of cement
Koromacno plant
Aggregates operations
Ready-mix concrete operations �Shareholdings:
Holcim mineralni agregati d.o.o. Nedescina
Holcim mineralni agregati d.o.o. Ocura

Holcim (Srbija) a.d., Serbia
Regional General Manager: Kurt Habersatter
Country Manager: Gustavo Navarro
Personnel: 414
Production capacity: 1.4 million t of cement
Novi Popovac plant
Ready-mix concrete operations �
Holcim (Romania) S.A., Romania
Regional General Manager: Kurt Habersatter
Country Manager: Markus Wirth
Personnel: 1,226
Production capacity: 5.7 million t of cement
Alesd plant
Campulung plant
Turda grinding plant
Aggregates operations
Ready-mix concrete operations �Shareholdings:
AgroComp International SRL
Estagre SRL
Romest Betoane si Agregate SA Bacau
Holcim (Bulgaria) AD, Bulgaria
Regional General Manager: Kurt Habersatter
Country Manager: Todor Kostov
Personnel: 670
Production capacity: 2.4 million t of cement
Beli Izvor plant
Pleven plant
Aggregates operations
Ready-mix concrete operations �Shareholdings:
Holcim Beton Plovdiv AD �Holcim Karierni Materiali AD
Holcim Karierni Materiali Plovdiv AD
Holcim Karierni Materiali Rudinata AD
Alpha Cement J.S.C., Russia
Regional General Manager: Gareth Babbs
Country Manager: Gareth Babbs
Personnel: 1,770
Production capacity: 4.4 million t of cement
Shurovo plant
Volsk plant
“Garadagh” Sement O.T.J.S.C., Azerbaijan
Regional General Manager: Gareth Babbs
Country Manager: Horia Adrian
Personnel: 582
Production capacity: 2.0 million t of cement
Garadagh plant
Holcim (US) Inc., USA
Chief Executive: Bernard Terver
Personnel: 2,072
Production capacity: 17.3 million t of cement
Ada plant
Artesia plant
Catskill plant
Devil’s Slide plant
Hagerstown plant
Holly Hill plant
Mason City plant
Midlothian plant
Portland plant
Ste Genevieve plant
Theodore plant
Trident plant
Birmingham grinding plant
Camden grinding plant
Chicago grinding plant
Aggregate Industries Management Inc., USA
Chief Executive: Will Glusac
Personnel: 3,371
Mid Atlantic Region �Mid West Region �North East Region �Western Region �
187Company Data

188 Financial Information
Cement
Aggregates�Other constructionmaterialsand services
Holcim (Canada) Inc., Canada
Chief Executive: Paul Ostrander
Personnel: 2,573
Production capacity: 3.3 million t of cement
Joliette plant
Mississauga plant
Shareholdings:
Demix group �Dufferin group �
Holcim Apasco S.A. de C.V., Mexico
Chief Executive: Eduardo Kretschmer
Personnel: 3,966
Production capacity: 10.6 million t of cement
Acapulco plant
Apaxco plant
Macuspana plant
Orizaba plant
Ramos Arizpe plant
Tecomán plant
Shareholdings:
Cementos Apasco S.A. de C.V.
Concretos Apasco S.A. de C.V. �Ecoltec S.A. de C.V.
Gravasa S.A. de C.V.
Cemento de El Salvador S.A. de C.V., El Salvador
Chief Executive: Ricardo A. Chavez Caparroso
Personnel: 719
Production capacity: 1.7 million t of cement
El Ronco plant
Maya plant
Shareholdings:
Bolsas de Centroamérica S.A. de C.V. �Geocycle S.A. de C.V.
Promix S.A. de C.V. �
Holcim (Nicaragua) S.A., Nicaragua
Chief Executive: Sergio Egloff
Personnel: 123
Production capacity: 0.3 million t of cement
Nagarote grinding plant
Holcim (Costa Rica) S.A., Costa Rica
Chief Executive: Sergio Egloff
Personnel: 1,200
Production capacity: 1.5 million t of cement
Cartago plant
Shareholdings:
Hidroeléctrica Aguas Zarcas S.A. �Productos de Concreto S.A. �Servicios Ambientales Geocycle SAG, S.A.
Holcim (Colombia) S.A., Colombia
Chief Executive: Moisés Pérez
Personnel: 1,011
Production capacity: 1.4 million t of cement
Nobsa plant
Aggregates operations
Ready-mix concrete operations �Shareholding:
Eco-procesamiento Ltda
Holcim (Ecuador) S.A., Ecuador
Chief Executive: Rodolfo Montero
Personnel: 993
Production capacity: 3.5 million t of cement
Guayaquil plant
Latacunga grinding plant
Aggregates operations
Ready-mix concrete operations �Shareholdings:
Construmercado S.A. �Generadora Rocafuerte S.A. �
Holcim (Brasil) S.A., Brazil
Chief Executive: Carlos Bühler
Personnel: 2,092
Production capacity: 5.3 million t of cement
Barroso plant
Cantagalo plant
Pedro Leopoldo plant
Sorocaba grinding plant
Vitória grinding plant
Aggregates operations
Ready-mix concrete operations �

Juan Minetti S.A., Argentina
Chief Executive: Otmar Hübscher
Personnel: 1,382
Production capacity: 4.2 million t of cement
Capdeville plant
Malagueño plant
Puesto Viejo plant
Yocsina plant
Campana grinding plant
Aggregates operations
Ready-mix concrete operations �Shareholding:
Ecoblend S.A.
Cemento Polpaico S.A., Chile
Chief Executive: Louis Beauchemin
Personnel: 1,130
Production capacity: 2.5 million t of cement
Cerro Blanco plant
Coronel grinding plant
Mejillones grinding plant
Shareholdings:
Compañia Minera Polpaico Ltd.
Pétreos S.A. �Planta Polpaico del Pacifico Ltd.
Polpaico Inversiones Ltd.
Holcim (Maroc) S.A., Morocco
Chief Executive: Dominique Drouet
Personnel: 672
Production capacity: 5.2 million t of cement
Oujda plant
Ras El Ma plant
Settat plant
Nador grinding plant
Shareholdings:
Ecoval
Holcim AOZ
Holcim Bétons �Holcim Granulats
Ciments de Guinée S.A., Guinea
Chief Executive: Mohamed Ali Bensaid
Personnel: 142
Production capacity: 0.6 million t of cement
Conakry grinding plant
Société de Ciments et Matériaux, Ivory Coast
Chief Executive: Johan Pachler
Personnel: 207
Production capacity: 0.8 million t of cement
Abidjan grinding plant
Holcim (Liban) S.A.L., Lebanon
Chief Executive: Urs Spillmann
Personnel: 442
Production capacity: 2.9 million t of cement
Chekka plant
Shareholdings:
Holcim Béton S.A.L. �Société Libanaise des Ciments Blancs
Bogaz Endustri ve Madencilik,
Northern Cyprus
Holcim (Outre-Mer) S.A.S., La Réunion
Chief Executive: Vincent Bouckaert
Personnel: 556
Production capacity: 0.9 million t of cement
Ibity plant
Le Port grinding plant
Nouméa grinding plant
Shareholdings:
Holcim Madagascar S.A.
Holcim (Mauritius) Ltd
Holcim (Nouvelle Calédonie) S.A.
Holcim Précontraint S.A. �Holcim (Réunion) S.A.
SAS Group Ouest Concassage
Aden Cement Enterprises Ltd., Republic of Yemen
Chief Executive: Jaafar Skalli
Personnel: 81
Aden terminal
189Company Data
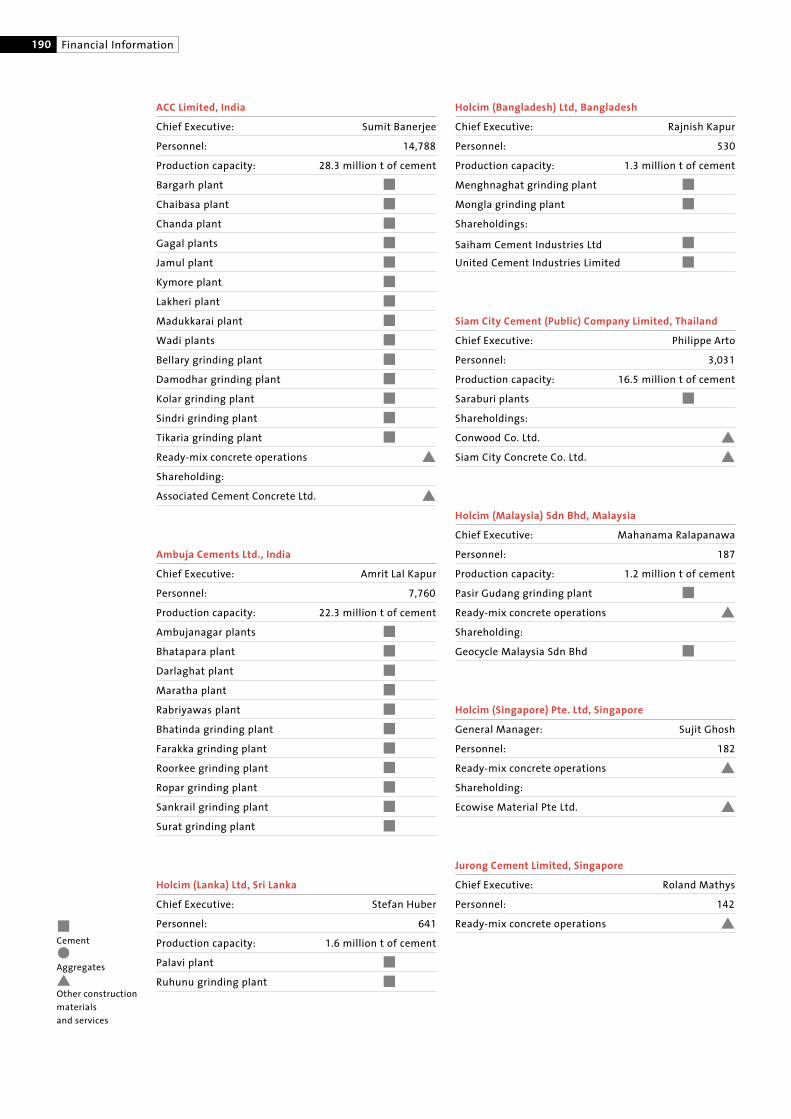
190 Financial Information
Cement
Aggregates�Other constructionmaterialsand services
ACC Limited, India
Chief Executive: Sumit Banerjee
Personnel: 14,788
Production capacity: 28.3 million t of cement
Bargarh plant
Chaibasa plant
Chanda plant
Gagal plants
Jamul plant
Kymore plant
Lakheri plant
Madukkarai plant
Wadi plants
Bellary grinding plant
Damodhar grinding plant
Kolar grinding plant
Sindri grinding plant
Tikaria grinding plant
Ready-mix concrete operations �Shareholding:
Associated Cement Concrete Ltd. �
Ambuja Cements Ltd., India
Chief Executive: Amrit Lal Kapur
Personnel: 7,760
Production capacity: 22.3 million t of cement
Ambujanagar plants
Bhatapara plant
Darlaghat plant
Maratha plant
Rabriyawas plant
Bhatinda grinding plant
Farakka grinding plant
Roorkee grinding plant
Ropar grinding plant
Sankrail grinding plant
Surat grinding plant
Holcim (Lanka) Ltd, Sri Lanka
Chief Executive: Stefan Huber
Personnel: 641
Production capacity: 1.6 million t of cement
Palavi plant
Ruhunu grinding plant
Holcim (Bangladesh) Ltd, Bangladesh
Chief Executive: Rajnish Kapur
Personnel: 530
Production capacity: 1.3 million t of cement
Menghnaghat grinding plant
Mongla grinding plant
Shareholdings:
Saiham Cement Industries Ltd
United Cement Industries Limited
Siam City Cement (Public) Company Limited, Thailand
Chief Executive: Philippe Arto
Personnel: 3,031
Production capacity: 16.5 million t of cement
Saraburi plants
Shareholdings:
Conwood Co. Ltd. �Siam City Concrete Co. Ltd. �
Holcim (Malaysia) Sdn Bhd, Malaysia
Chief Executive: Mahanama Ralapanawa
Personnel: 187
Production capacity: 1.2 million t of cement
Pasir Gudang grinding plant
Ready-mix concrete operations �Shareholding:
Geocycle Malaysia Sdn Bhd
Holcim (Singapore) Pte. Ltd, Singapore
General Manager: Sujit Ghosh
Personnel: 182
Ready-mix concrete operations �Shareholding:
Ecowise Material Pte Ltd. �
Jurong Cement Limited, Singapore
Chief Executive: Roland Mathys
Personnel: 142
Ready-mix concrete operations �
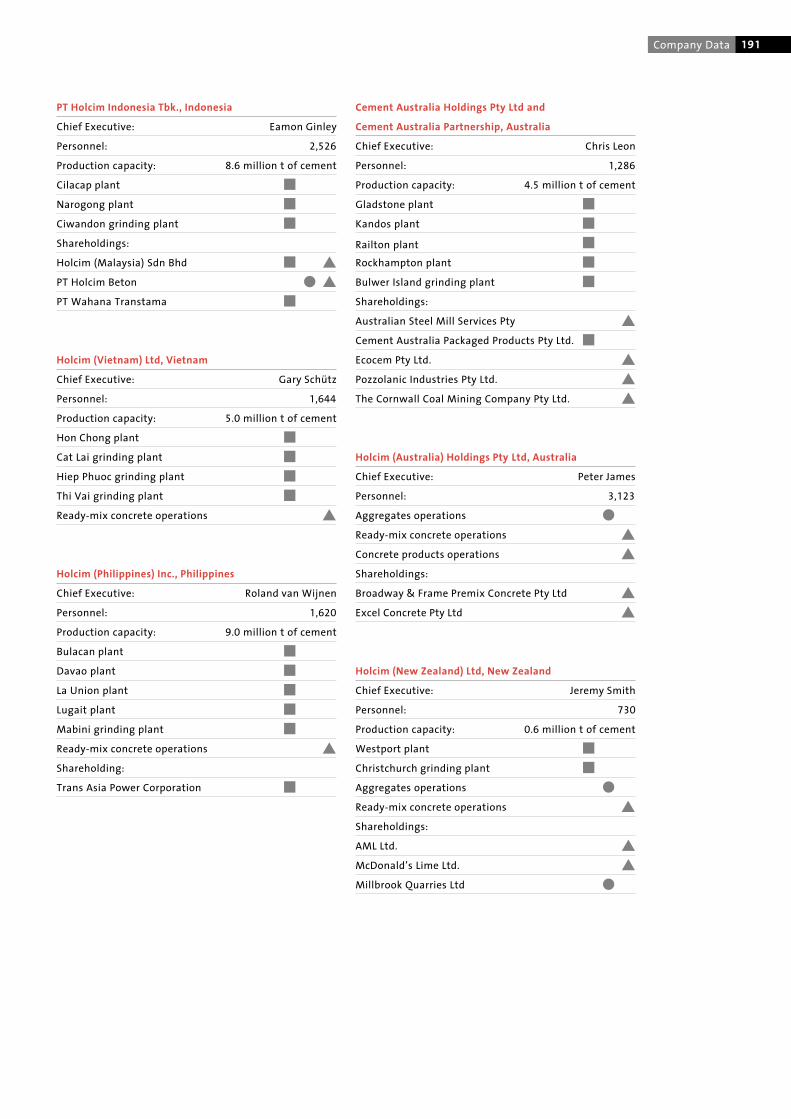
PT Holcim Indonesia Tbk., Indonesia
Chief Executive: Eamon Ginley
Personnel: 2,526
Production capacity: 8.6 million t of cement
Cilacap plant
Narogong plant
Ciwandon grinding plant
Shareholdings:
Holcim (Malaysia) Sdn Bhd �PT Holcim Beton �PT Wahana Transtama
Holcim (Vietnam) Ltd, Vietnam
Chief Executive: Gary Schütz
Personnel: 1,644
Production capacity: 5.0 million t of cement
Hon Chong plant
Cat Lai grinding plant
Hiep Phuoc grinding plant
Thi Vai grinding plant
Ready-mix concrete operations �
Holcim (Philippines) Inc., Philippines
Chief Executive: Roland van Wijnen
Personnel: 1,620
Production capacity: 9.0 million t of cement
Bulacan plant
Davao plant
La Union plant
Lugait plant
Mabini grinding plant
Ready-mix concrete operations �Shareholding:
Trans Asia Power Corporation
Cement Australia Holdings Pty Ltd and
Cement Australia Partnership, Australia
Chief Executive: Chris Leon
Personnel: 1,286
Production capacity: 4.5 million t of cement
Gladstone plant
Kandos plant
Railton plant
Rockhampton plant
Bulwer Island grinding plant
Shareholdings:
Australian Steel Mill Services Pty �Cement Australia Packaged Products Pty Ltd.
Ecocem Pty Ltd. �Pozzolanic Industries Pty Ltd. �The Cornwall Coal Mining Company Pty Ltd. �
Holcim (Australia) Holdings Pty Ltd, Australia
Chief Executive: Peter James
Personnel: 3,123
Aggregates operations
Ready-mix concrete operations �Concrete products operations �Shareholdings:
Broadway & Frame Premix Concrete Pty Ltd �Excel Concrete Pty Ltd �
Holcim (New Zealand) Ltd, New Zealand
Chief Executive: Jeremy Smith
Personnel: 730
Production capacity: 0.6 million t of cement
Westport plant
Christchurch grinding plant
Aggregates operations
Ready-mix concrete operations �Shareholdings:
AML Ltd. �McDonald’s Lime Ltd. �Millbrook Quarries Ltd
191Company Data

192 Financial Information
Statement of income Holcim Ltd
Million CHF 2009 2008
Financial income 834.6 859.1
Other ordinary income 76.8 22.8
Total income 911.4 881.9
Financial expenses (96.5) (145.3)
Other ordinary expenses (54.8) (47.1)
Taxes (3.6) (6.6)
Total expenses (154.9) (199.0)
Net income 756.5 682.9
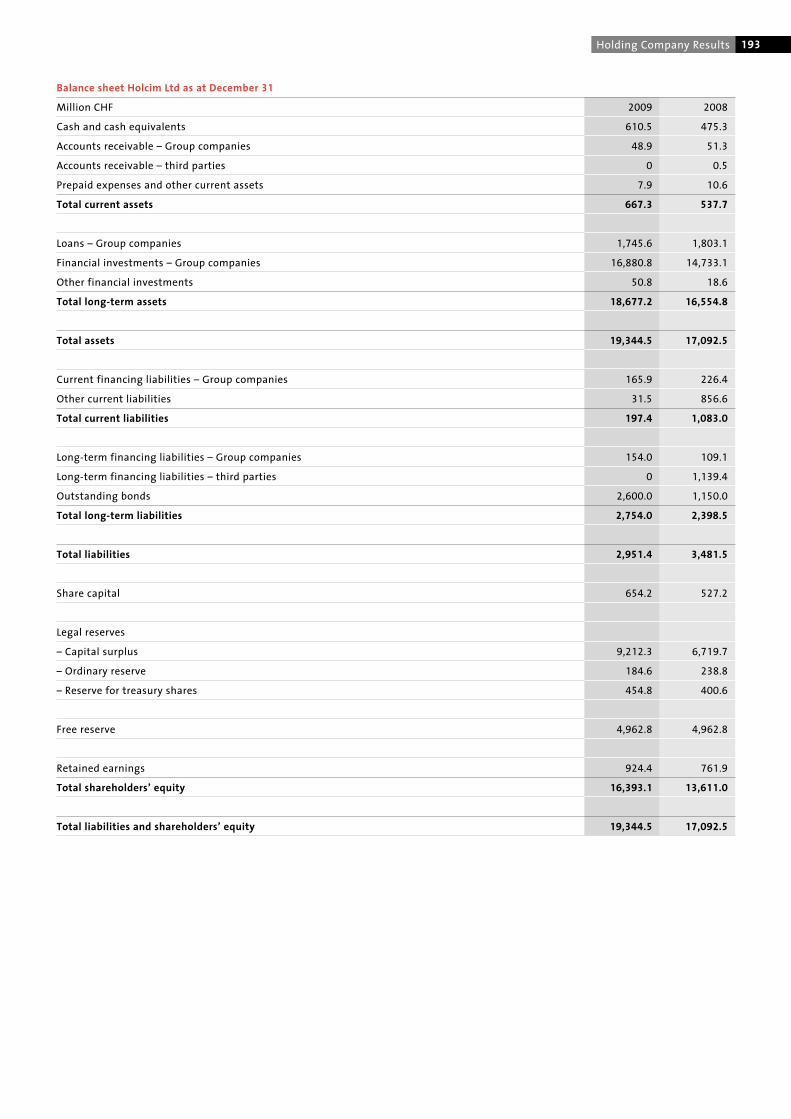
193Holding Company Results
Balance sheet Holcim Ltd as at December 31
Million CHF 2009 2008
Cash and cash equivalents 610.5 475.3
Accounts receivable – Group companies 48.9 51.3
Accounts receivable – third parties 0 0.5
Prepaid expenses and other current assets 7.9 10.6
Total current assets 667.3 537.7
Loans – Group companies 1,745.6 1,803.1
Financial investments – Group companies 16,880.8 14,733.1
Other financial investments 50.8 18.6
Total long-term assets 18,677.2 16,554.8
Total assets 19,344.5 17,092.5
Current financing liabilities – Group companies 165.9 226.4
Other current liabilities 31.5 856.6
Total current liabilities 197.4 1,083.0
Long-term financing liabilities – Group companies 154.0 109.1
Long-term financing liabilities – third parties 0 1,139.4
Outstanding bonds 2,600.0 1,150.0
Total long-term liabilities 2,754.0 2,398.5
Total liabilities 2,951.4 3,481.5
Share capital 654.2 527.2
Legal reserves
– Capital surplus 9,212.3 6,719.7
– Ordinary reserve 184.6 238.8
– Reserve for treasury shares 454.8 400.6
Free reserve 4,962.8 4,962.8
Retained earnings 924.4 761.9
Total shareholders’ equity 16,393.1 13,611.0
Total liabilities and shareholders’ equity 19,344.5 17,092.5
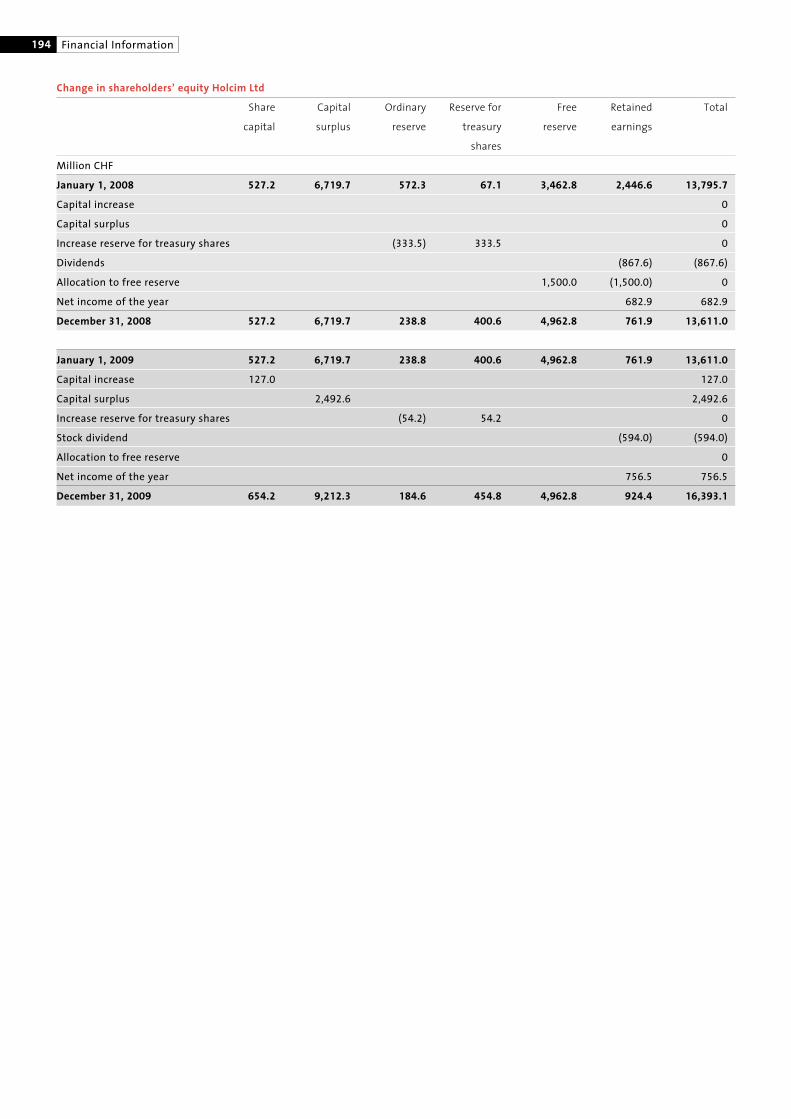
194 Financial Information
Change in shareholders’ equity Holcim Ltd
Share Capital Ordinary Reserve for Free Retained Total
capital surplus reserve treasury reserve earnings
shares
Million CHF
January 1, 2008 527.2 6,719.7 572.3 67.1 3,462.8 2,446.6 13,795.7
Capital increase 0
Capital surplus 0
Increase reserve for treasury shares (333.5) 333.5 0
Dividends (867.6) (867.6)
Allocation to free reserve 1,500.0 (1,500.0) 0
Net income of the year 682.9 682.9
December 31, 2008 527.2 6,719.7 238.8 400.6 4,962.8 761.9 13,611.0
January 1, 2009 527.2 6,719.7 238.8 400.6 4,962.8 761.9 13,611.0
Capital increase 127.0 127.0
Capital surplus 2,492.6 2,492.6
Increase reserve for treasury shares (54.2) 54.2 0
Stock dividend (594.0) (594.0)
Allocation to free reserve 0
Net income of the year 756.5 756.5
December 31, 2009 654.2 9,212.3 184.6 454.8 4,962.8 924.4 16,393.1

195Holding Company Results
Data as required under Art. 663b and c of the Swiss Code of Obligations
Contingent liabilities 31.12.2009 31.12.2008Million CHFHolcim Capital Corporation Ltd.Guarantees in respect of holders of5.93% USD 105 million private placement due in 2009 0 1177.05% USD 358 million private placement due in 2011 4201 4476.59% USD 165 million private placement due in 2014 2051 2227.65% USD 50 million private placement due in 2031 731 906.88% USD 250 million bonds due in 2039 2841 0Holcim Capital (Thailand) Ltd.Guarantees in respect of holders of6.48% THB 2,150 million bonds due in 2010 662 656.69% THB 2,450 million bonds due in 2012 752 74Holcim Finance (Australia) Pty LtdGuarantees in respect of holders of6.50% AUD 175 million bonds due in 2009 0 1283.49% AUD 85 million bonds due in 2009 0 628.50% AUD 500 million bonds due in 2012 4633 0Holcim Finance (Belgium) SACommercial Paper Program, guarantee based on utilization, EUR 500 million maximum 0 321Holcim Finance (Canada) Inc.Guarantees in respect of holders of6.91% CAD 10 million private placement due in 2017 124 115.90% CAD 300 million bonds due in 2013 3244 287Holcim Finance (Luxembourg) SAGuarantees in respect of holders of4.38% EUR 750 million bonds due in 2010 1,2275 1,2304.38% EUR 600 million bonds due in 2014 9815 9849.00% EUR 650 million bonds due in 2014 1,0635 06.35% EUR 200 million private placement due in 2017 3275 0Holcim GB Finance Ltd.Guarantees in respect of holders of8.75% GBP 300 million bonds due in 2017 5496 0Holcim Overseas Finance Ltd.Guarantees in respect of holders of2.75% CHF 300 million notes due in 2011 330 3303.00% CHF 250 million notes due in 2013 275 275Holcim US Finance S.à r.l. & Cie S.C.S.Guarantees in respect of holders of5.96% USD 125 million private placement due in 2013 1291 1326.10% USD 125 million private placement due in 2016 1291 1326.21% USD 200 million private placement due in 2018 2061 2125.12% EUR 90 million private placement due in 2013 1475 1481.92% EUR 358 million private placement due in 2013 5865 5872.07% EUR 202 million private placement due in 2015 3305 3316.00% USD 750 million bonds due in 2019 8521 0
Guarantees for committed credit lines, utilization CHF 2,018 million 5,896 4,317Other guarantees 241 329
Holcim Ltd is part of a value added tax group and therefore jointly liable to the Swiss Federal Tax Administration for the value added taxliabilities of the other members.1 Exchange rate USD: CHF 1.0324.2 Exchange rate THB: CHF 0.0308.3 Exchange rate AUD: CHF 0.9268.
4 Exchange rate CAD: CHF 0.9808.5 Exchange rate EUR: CHF 1.4870.6 Exchange rate GBP: CHF 1.6632.
196 Financial Information
Treasury shares Number Price per share in CHF Million CHF
01.01.08 Treasury shares 668,849 100.27 67.1
01.01. to 31.12.08 Purchases 4,685,219 75.52 353.8
01.01. to 31.12.08 Sales (222,007) 98.42 (20.3)
31.12.08 Treasury shares 5,132,061 78.05 400.6
01.01.09 Treasury shares 5,132,061 78.05 400.6
01.01. to 31.12.09 Purchases 2,075,762 37.29 77.4
01.01. to 31.12.09 Sales (302,439) 46.90 (23.2)
31.12.09 Treasury shares 6,905,384 65.86 454.8
Conditional share capital Number Price per share in CHF Million CHF
01.01.08 Conditional shares par value 1,422,350 2.00 2.8
01.01. to 31.12.08 Movement 0 0 0
31.12.08 Conditional shares par value 1,422,350 2.00 2.8
01.01.09 Conditional shares par value 1,422,350 2.00 2.8
01.01. to 31.12.09 Movement 0 0 0
31.12.09 Conditional shares par value 1,422,350 2.00 2.8
1 Shareholding of more than 3 percent.2 Included in share interests of Board of Directors and senior management.
Share interests of Board of Directors and senior management
As of December 31, 2009, the members of the Board of
Directors and senior management of Holcim held directly
and indirectly in the aggregate 60,078,233 registered shares
(2008: 54,685,328) and no rights to acquire further registered
shares and 1,004,973 call options on registered shares (2008:
630,003).
Important shareholders1
As of December 31, 2009, Thomas Schmidheiny directly and
indirectly held 59,567,887 or 18.21 percent registered shares
(2008: 54,292,690 or 20.60 percent)2, and Eurocement
Holding AG held 21,326,032 or 6,52 percent registered shares.
Capital Group Companies Inc. held 13,181,456 or 5 percent
registered shares as of August 15, 2008.
The information disclosed complies with all Swiss legal
requirements. Further information can be found in the notes
to the consolidated financial statements on pages 135 to 179.
Specific information in accordance with Art. 663b para 12 (risk
assessment), Art. 663bbis and Art. 663c para 3 (transparency
law) of the Swiss Code of Obligations are disclosed in the
section “Risk management” on pages 127 to 134 and note 39
on pages 173 to 179 respectively.
Issued bonds
The outstanding bonds and private placements as at Decem-
ber 31, 2009 are listed on pages 157 and 158.
Principal investments
The principal direct and indirect investments of Holcim Ltd
are listed under the heading “Principal companies of the
Holcim Group” on pages 180 to 182.

197Holding Company Results
Dividend-bearing share capital 2009 2008
Shares Number Million CHF Number Million CHF
Registered shares of CHF 2 par value 327,086,376 654.2 263,586,090 527.2
Total 327,086,376 654.2 263,586,090 527.2
Appropriation of retained earnings 2009 2008
CHF CHF
Retained earnings brought forward 167,911,488 78,957,743
Net income of the year 756,468,355 682,953,745
Retained earnings 924,379,843 761,911,488
The Board of Directors proposes to the annual general
meeting of shareholders of May 6, 2010 in Dübendorf
the following appropriation:
Gross dividend1 (480,271,488)
Stock dividend
– Appropriation to share capital (26,358,610)
– Appropriation to ordinary reserve (553,448,292)
– Withholding tax on stock dividend (14,193,098)
Total dividend (480,271,488) (594,000,000)
Appropriation to free reserves 0 0
Balance to be carried forward 444,108,355 167,911,488
2009 2008
Cash dividend gross Stock dividend
Dividend per share CHF 1.50 CHF 2.25
1 No dividend is paid on treasury shares held by Holcim. On January 1, 2010, treasury holdings amounted to 6,905,384 registered shares.

199Holding Company Results
To the General Meeting of Holcim Ltd, Jona
Zurich, February 26, 2010
Report of the statutory auditor on the financial statements
As statutory auditor, we have audited the accompanying financial statements of Holcim Ltd, which comprise the statement of
income, balance sheet, change in shareholders’ equity and notes presented on pages 192 to 197 for the year ended December 31, 2009.
Board of Directors’ responsibility
The Board of Directors is responsible for the preparation of the financial statements in accordance with the requirements of Swiss
law and the company’s Articles of Incorporation. This responsibility includes designing, implementing and maintaining an internal
control system relevant to the preparation of financial statements that are free from material misstatement, whether due to fraud
or error. The Board of Directors is further responsible for selecting and applying appropriate accounting policies and making
accounting estimates that are reasonable in the circumstances.
Auditor’s responsibility
Our responsibility is to express an opinion on these financial statements based on our audit. We conducted our audit in accordance
with Swiss law and Swiss Auditing Standards. Those standards require that we plan and perform the audit to obtain reasonable
assurance whether the financial statements are free from material misstatement. An audit involves performing procedures to
obtain audit evidence about the amounts and disclosures in the financial statements. The procedures selected depend on the
auditor’s judgment, including the assessment of the risks of material misstatement of the financial statements, whether due
to fraud or error. In making those risk assessments, the auditor considers the internal control system relevant to the entity’s
preparation of the financial statements in order to design audit procedures that are appropriate in the circumstances, but not for
the purpose of expressing an opinion on the effectiveness of the entity’s internal control system. An audit also includes evaluating
the appropriateness of the accounting policies used and the reasonableness of accounting estimates made as well as evaluating
the overall presentation of the financial statements. We believe that the audit evidence we have obtained is sufficient and appro-
priate to provide a basis for our audit opinion.
Opinion
In our opinion, the financial statements for the year ended December 31, 2009 comply with Swiss law and the company’s Articles
of Incorporation.
Report on other legal requirements
We confirm that we meet the legal requirements on licensing according to the Auditor Oversight Act (AOA) and independence
(Art. 728 Code of Obligations (CO) and Art. 11 AOA) and that there are no circumstances incompatible with our independence.
In accordance with Art. 728a para. 1 item 3 CO and Swiss Auditing Standard 890, we confirm that an internal control system exists,
which has been designed for the preparation of financial statements according to the instructions of the Board of Directors.
We further confirm that the proposed appropriation of available earnings complies with Swiss law and the company’s Articles
of Incorporation. We recommend that the financial statements submitted to you be approved.
Ernst & Young Ltd
Christoph Dolensky Willy Hofstetter
Licensed Audit Expert Licensed Audit Expert
Auditor in charge


2015-Year-Review
5-year-review Group Holcim
2009 2008 2007 2006 20051
Statement of income
Net sales Million CHF 21,132 25,157 27,052 23,969 18,468
Gross profit Million CHF 9,060 11,041 12,979 11,353 8,729
Operating EBITDA Million CHF 4,630 5,333 6,930 6,086 4,627
Operating EBITDA margin % 21.9 21.2 25.6 25.4 25.1
EBITDA Million CHF 5,229 5,708 8,468 6,333 4,757
Operating profit Million CHF 2,781 3,360 5,024 4,385 3,316
Operating profit margin % 13.2 13.4 18.6 18.3 18.0
Depreciation, amortization and impairment Million CHF 1,858 1,985 1,919 1,723 1,339
EBIT Million CHF 3,371 3,723 6,549 4,610 3,418
Income taxes Million CHF 623 663 1,201 1,078 865
Tax rate % 24 23 21 28 33
Net income Million CHF 1,958 2,226 4,545 2,719 1,789
Net income margin % 9.3 8.8 16.8 11.3 9.7
Net income – shareholders of Holcim Ltd Million CHF 1,471 1,782 3,865 2,104 1,511
Statement of cash flows
Cash flow from operating activities Million CHF 3,888 3,703 5,323 4,423 3,405
Cash flow margin % 18.4 14.7 19.7 18.5 18.4
Investments in property, plant and equipment for maintenance Million CHF 376 1,104 1,043 1,062 879
Investments in property, plant and equipment for expansion Million CHF 1,929 3,287 2,245 1,265 607
Financial investments in financial assets,
intangible, other assets and businesses net Million CHF 2,285 1,084 2,277 2,054 4,853
Statement of financial position
Current assets Million CHF 10,797 9,994 10,372 9,747 8,849
Long-term assets Million CHF 38,409 35,199 37,839 34,955 29,262
Total assets Million CHF 49,206 45,193 48,211 44,702 38,111
Current liabilities Million CHF 9,280 10,765 9,025 8,621 6,782
Long-term liabilities Million CHF 17,882 16,454 17,241 17,356 17,079
Total shareholders’ equity Million CHF 22,044 17,974 21,945 18,725 14,250
Shareholders’ equity as % of total assets 44.8 39.8 45.5 41.9 37.4
Minority interest Million CHF 3,011 2,616 3,163 3,548 2,783
Net financial debt Million CHF 13,833 15,047 12,873 12,837 12,693
Capacity, sales and personnel
Annual production capacity cement Million t 202.9 194.4 197.8 197.8 160.4
Sales of cement Million t 131.9 143.4 149.6 140.7 110.6
Sales of mineral components Million t 3.5 4.8 5.5 6.0 5.5
Sales of aggregates Million t 143.4 167.7 187.9 187.6 169.3
Sales of ready-mix concrete Million m3 41.8 48.5 45.2 44.2 38.2
Personnel 31.12. 81,498 86,713 89,364 88,783 59,901
Financial ratios
Return on equity2 % 8.6 10.4 22.8 15.8 15.1
Gearing3 % 62.8 83.7 58.7 68.6 89.1
Funds from operations4/net financial debt % 27.6 28.0 50.2 34.6 24.6
EBITDA net interest coverage � 7.3 7.6 11.0 6.8 6.0
EBIT net interest coverage � 4.7 4.9 8.5 5.0 4.3
1 Restated in line with IAS 21 amended.2 Excludes minority interest.3 Net financial debt divided by total shareholders’ equity.4 Net income plus depreciation, amortization and impairment.
202
Cautionary statement regarding forward-looking statements
This document may contain certain forward-looking state-
ments relating to the Group’s future business, development
and economic performance. Such statements may be subject
to a number of risks, uncertainties and other important
factors, such as but not limited to (1) competitive pressures;
(2) legislative and regulatory developments; (3) global, macro-
economic and political trends; (4) fluctuations in currency
exchange rates and general financial market conditions;
(5) delay or inability in obtaining approvals from authorities;
(6) technical developments; (7) litigation; (8) adverse publicity
and news coverage, which could cause actual development
and results to differ materially from the statements made in
this document. Holcim assumes no obligation to update or
alter forward-looking statements whether as a result of new
information, future events or otherwise.
Holcim LtdZürcherstrasse 156CH-8645 Jona/SwitzerlandPhone +41 58 858 86 [email protected]
© 2010 Holcim Ltd – Printed in Switzerland on FSC paper
Financial reporting calendar
Results for the first quarter of 2010 May 4, 2010
General meeting of shareholders May 6, 2010
Ex date May 10, 2010
Dividend distribution May 14, 2010
Half-year results for 2010 August 19, 2010
Press and analyst conference for the third quarter of 2010 November 10, 2010
Press and analyst conference on annual results for 2010 March 2, 2011

Holcim is a worldwide leading producer of cement and aggregates.Further activities include the provision of ready-mix concreteand asphalt as well as other services. The Group works in around70 countries and employs some 80,000 people.
Annual Report 2009 Holcim Ltd – Preprint
Strength. Performance. Passion.
An
nu
alR
epo
rt2
00
9H
olc
imLt
d
GB_09_Umschlag d+e_2farbig:Layout 1 25.2.2010 10:59 Uhr Seite 2