hold (no change) fy20 bumped up by overseas profits
TRANSCRIPT
Company Note Construction │ Malaysia │ April 1, 2021
IMPORTANT DISCLOSURES, INCLUDING ANY REQUIRED RESEARCH CERTIFICATIONS, ARE PROVIDED AT THE END OF THIS REPORT. IF THIS REPORT IS DISTRIBUTED IN THE UNITED STATES IT IS DISTRIBUTED BY CGS-CIMB SECURITIES (USA), INC. AND IS CONSIDERED THIRD-PARTY AFFILIATED RESEARCH.
Powered by the EFA Platform
Insert Insert
Sunway Bhd FY20 bumped up by overseas profits
■ FY20 results were above expectations; core net profit fell 37% yoy.
■ 4Q20 earnings were boosted by deferred profit recognition from overseas property ventures, while property investment reported losses in FY20.
■ Reiterate Hold due to limited upside to share price, which ran ahead of the strong results. TP is raised to RM1.79.
FY20 above expectations; core net profit fell 37% yoy FY20 core net profit of RM400m (excluding RM64.4m total fair value loss, among others)
exceeded ours and consensus full-year forecasts by 10-42%. The results were above our
expectations due to higher-than-expected deferred profit (due to MFRS 15) recognition
from property development ventures in Singapore and China in 4Q20, amounting to
RM182.5m. This increased 4Q20 core net profit by 47% yoy, offsetting the 5.5% yoy drop
in revenue due to the Conditional Movement Control Order (CMCO). FY20 revenue also
came in above our projections (at 112%) while EBITDA margin of 13.4% was slightly
higher than our forecast of 13%. Overall FY20 core net profit fell 37% yoy, due to the
disruptions caused by Covid-19 in all operating divisions (particularly property investment
and construction) in FY20. The group declared a single-tier DPS of 1.5 sen vs. our full-
year forecast of 4 sen.
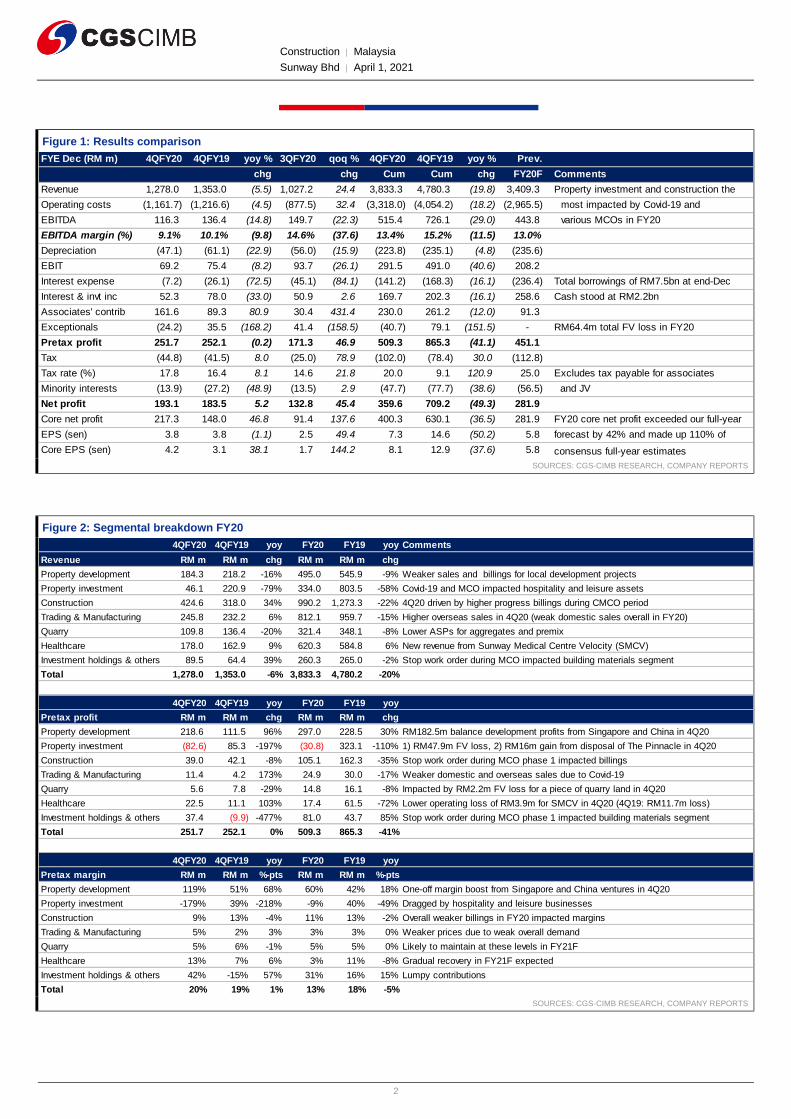
Covid-19 impacted all segments; losses for property investments Property investment and construction recorded the biggest drop in revenue in FY20, with
a 22-58% yoy decline due to the stop-work order in 2Q20 for construction and weaker
retail/hotel revenue due to rental rebates/assistance and subdued occupancy rates.
Construction pretax profit fell 35% yoy in FY20 due to weaker billings while pretax margin
slipped 2% pts yoy to 11%; pretax margin should stabilise at these levels in FY21F as
billings improve. Property investment division reported a pretax loss of RM31m in FY20
(FY19: RM323m pretax profit), dragged by RM47.9m fair value loss but partially offset by
RM16m gain from the disposal of the Pinnacle Sunway. Healthcare division’s 72% yoy
fall in pretax profit in FY20 was due to sustained operating losses at Sunway Medical
Centre Velocity (SMCV); losses narrowed to RM3.9m in 4Q20 (4Q19: RM11.7m).
FY21-22F EPS raised by 32-34%; Hold retained with higher TP We raise FY21-22F EPS by 32-34% as we have been too conservative in our revenue
assumptions, backed by RM5.1bn outstanding construction order book and RM1.9bn in
effective unbilled sales. We project a higher EBITDA margin of 13-14% (9-10%
previously), raise associate earnings and lower tax rates to reflect the performance in
FY20. We also introduce FY23F. We raise our RNAV-based TP to RM1.79 (unchanged
30% discount) as we update for balance sheet items (lower borrowings) and market cap
of listed units. Reiterate Hold rating due to limited upside to share price, which ran ahead
of the strong results. Upside risks: a recovery in job flows and stronger property earnings.
Downside risk: sustained losses for the property investment division.
SOURCES: CGS-CIMB RESEARCH, COMPANY REPORTS
Malaysia
HOLD (no change)
Consensus ratings*: Buy 8 Hold 3 Sell 0
Current price: RM1.70
Target price: RM1.79
Previous target: RM1.44
Up/downside: 5.3%
CGS-CIMB / Consensus: 2.6%
Reuters: SWAY.KL
Bloomberg: SWB MK
Market cap: US$2,005m
RM8,311m
Average daily turnover: US$0.92m
RM3.74m
Current shares o/s: 4,934m
Free float: 29.9% *Source: Bloomberg
Key changes in this note
We raise FY21-22F EPS by 32-34%. We project higher EBITDA margin of 13-14% (9-10% previously), raise associate earnings and lower tax rates to reflect the performance in FY20. We introduce FY23F.
Source: Bloomberg
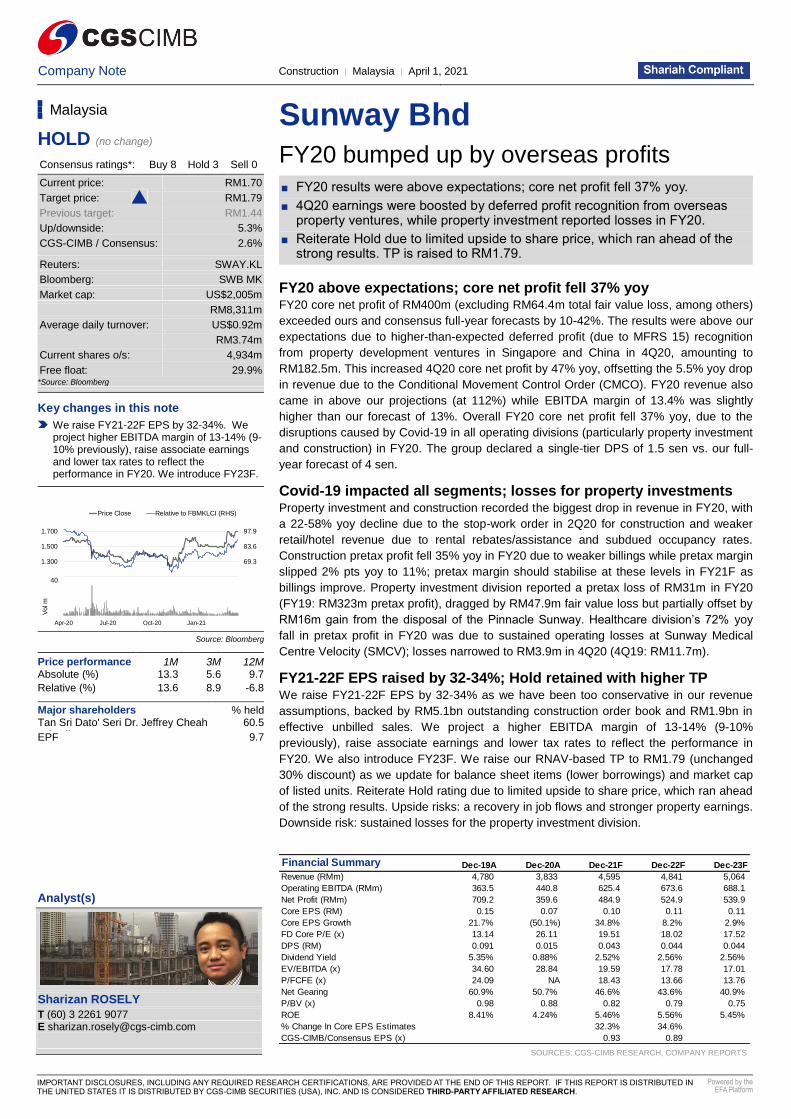
Price performance 1M 3M 12M Absolute (%) 13.3 5.6 9.7
Relative (%) 13.6 8.9 -6.8
Major shareholders % held Tan Sri Dato' Seri Dr. Jeffrey Cheah & family
60.5
EPF 9.7
Insert
Analyst(s)
Sharizan ROSELY
T (60) 3 2261 9077 E [email protected]
Financial Summary Dec-19A Dec-20A Dec-21F Dec-22F Dec-23F
Revenue (RMm) 4,780 3,833 4,595 4,841 5,064
Operating EBITDA (RMm) 363.5 440.8 625.4 673.6 688.1
Net Profit (RMm) 709.2 359.6 484.9 524.9 539.9
Core EPS (RM) 0.15 0.07 0.10 0.11 0.11
Core EPS Growth 21.7% (50.1%) 34.8% 8.2% 2.9%
FD Core P/E (x) 13.14 26.11 19.51 18.02 17.52
DPS (RM) 0.091 0.015 0.043 0.044 0.044
Dividend Yield 5.35% 0.88% 2.52% 2.56% 2.56%
EV/EBITDA (x) 34.60 28.84 19.59 17.78 17.01
P/FCFE (x) 24.09 NA 18.43 13.66 13.76
Net Gearing 60.9% 50.7% 46.6% 43.6% 40.9%
P/BV (x) 0.98 0.88 0.82 0.79 0.75
ROE 8.41% 4.24% 5.46% 5.56% 5.45%
% Change In Core EPS Estimates 32.3% 34.6%
CGS-CIMB/Consensus EPS (x) 0.93 0.89
55.0
69.3
83.6
97.9
1.100
1.300
1.500
1.700
Price Close Relative to FBMKLCI (RHS)
10
20
30
40
Apr-20 Jul-20 Oct-20 Jan-21
Vo
l m
Construction │ Malaysia
Sunway Bhd │ April 1, 2021
2
Figure 1: Results comparison
SOURCES: CGS-CIMB RESEARCH, COMPANY REPORTS
Figure 2: Segmental breakdown FY20
SOURCES: CGS-CIMB RESEARCH, COMPANY REPORTS
FYE Dec (RM m) 4QFY20 4QFY19 yoy % 3QFY20 qoq % 4QFY20 4QFY19 yoy % Prev.
chg chg Cum Cum chg FY20F Comments
Revenue 1,278.0 1,353.0 (5.5) 1,027.2 24.4 3,833.3 4,780.3 (19.8) 3,409.3 Property investment and construction the
Operating costs (1,161.7) (1,216.6) (4.5) (877.5) 32.4 (3,318.0) (4,054.2) (18.2) (2,965.5) most impacted by Covid-19 and
EBITDA 116.3 136.4 (14.8) 149.7 (22.3) 515.4 726.1 (29.0) 443.8 various MCOs in FY20
EBITDA margin (%) 9.1% 10.1% (9.8) 14.6% (37.6) 13.4% 15.2% (11.5) 13.0%
Depreciation (47.1) (61.1) (22.9) (56.0) (15.9) (223.8) (235.1) (4.8) (235.6)
EBIT 69.2 75.4 (8.2) 93.7 (26.1) 291.5 491.0 (40.6) 208.2
Interest expense (7.2) (26.1) (72.5) (45.1) (84.1) (141.2) (168.3) (16.1) (236.4) Total borrowings of RM7.5bn at end-Dec
Interest & invt inc 52.3 78.0 (33.0) 50.9 2.6 169.7 202.3 (16.1) 258.6 Cash stood at RM2.2bn
Associates' contrib 161.6 89.3 80.9 30.4 431.4 230.0 261.2 (12.0) 91.3
Exceptionals (24.2) 35.5 (168.2) 41.4 (158.5) (40.7) 79.1 (151.5) - RM64.4m total FV loss in FY20
Pretax profit 251.7 252.1 (0.2) 171.3 46.9 509.3 865.3 (41.1) 451.1
Tax (44.8) (41.5) 8.0 (25.0) 78.9 (102.0) (78.4) 30.0 (112.8)
Tax rate (%) 17.8 16.4 8.1 14.6 21.8 20.0 9.1 120.9 25.0 Excludes tax payable for associates
Minority interests (13.9) (27.2) (48.9) (13.5) 2.9 (47.7) (77.7) (38.6) (56.5) and JV
Net profit 193.1 183.5 5.2 132.8 45.4 359.6 709.2 (49.3) 281.9
Core net profit 217.3 148.0 46.8 91.4 137.6 400.3 630.1 (36.5) 281.9 FY20 core net profit exceeded our full-year
EPS (sen) 3.8 3.8 (1.1) 2.5 49.4 7.3 14.6 (50.2) 5.8 forecast by 42% and made up 110% of
Core EPS (sen) 4.2 3.1 38.1 1.7 144.2 8.1 12.9 (37.6) 5.8 consensus full-year estimates
4QFY20 4QFY19 yoy FY20 FY19 yoy Comments
Revenue RM m RM m chg RM m RM m chg
Property development 184.3 218.2 -16% 495.0 545.9 -9% Weaker sales and billings for local development projects
Property investment 46.1 220.9 -79% 334.0 803.5 -58% Covid-19 and MCO impacted hospitality and leisure assets
Construction 424.6 318.0 34% 990.2 1,273.3 -22% 4Q20 driven by higher progress billings during CMCO period
Trading & Manufacturing 245.8 232.2 6% 812.1 959.7 -15% Higher overseas sales in 4Q20 (weak domestic sales overall in FY20)
Quarry 109.8 136.4 -20% 321.4 348.1 -8% Lower ASPs for aggregates and premix
Healthcare 178.0 162.9 9% 620.3 584.8 6% New revenue from Sunway Medical Centre Velocity (SMCV)
Investment holdings & others 89.5 64.4 39% 260.3 265.0 -2% Stop work order during MCO impacted building materials segment
Total 1,278.0 1,353.0 -6% 3,833.3 4,780.2 -20%
4QFY20 4QFY19 yoy FY20 FY19 yoy
Pretax profit RM m RM m chg RM m RM m chg
Property development 218.6 111.5 96% 297.0 228.5 30% RM182.5m balance development profits from Singapore and China in 4Q20
Property investment (82.6) 85.3 -197% (30.8) 323.1 -110% 1) RM47.9m FV loss, 2) RM16m gain from disposal of The Pinnacle in 4Q20
Construction 39.0 42.1 -8% 105.1 162.3 -35% Stop work order during MCO phase 1 impacted billings
Trading & Manufacturing 11.4 4.2 173% 24.9 30.0 -17% Weaker domestic and overseas sales due to Covid-19
Quarry 5.6 7.8 -29% 14.8 16.1 -8% Impacted by RM2.2m FV loss for a piece of quarry land in 4Q20
Healthcare 22.5 11.1 103% 17.4 61.5 -72% Lower operating loss of RM3.9m for SMCV in 4Q20 (4Q19: RM11.7m loss)
Investment holdings & others 37.4 (9.9) -477% 81.0 43.7 85% Stop work order during MCO phase 1 impacted building materials segment
Total 251.7 252.1 0% 509.3 865.3 -41%
4QFY20 4QFY19 yoy FY20 FY19 yoy
Pretax margin RM m RM m %-pts RM m RM m %-pts
Property development 119% 51% 68% 60% 42% 18% One-off margin boost from Singapore and China ventures in 4Q20
Property investment -179% 39% -218% -9% 40% -49% Dragged by hospitality and leisure businesses
Construction 9% 13% -4% 11% 13% -2% Overall weaker billings in FY20 impacted margins
Trading & Manufacturing 5% 2% 3% 3% 3% 0% Weaker prices due to weak overall demand
Quarry 5% 6% -1% 5% 5% 0% Likely to maintain at these levels in FY21F
Healthcare 13% 7% 6% 3% 11% -8% Gradual recovery in FY21F expected
Investment holdings & others 42% -15% 57% 31% 16% 15% Lumpy contributions
Total 20% 19% 1% 13% 18% -5%
Construction │ Malaysia
Sunway Bhd │ April 1, 2021
3
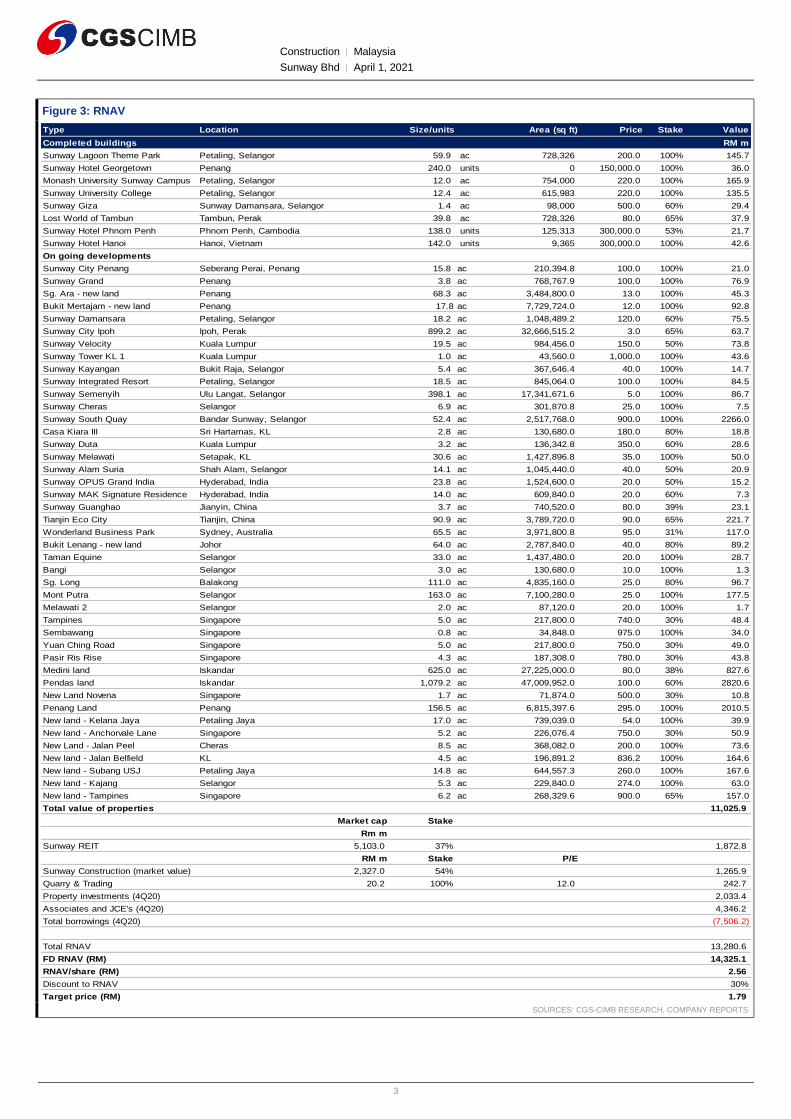
Figure 3: RNAV
SOURCES: CGS-CIMB RESEARCH, COMPANY REPORTS
Type Location Size/units Area (sq ft) Price Stake Value
Completed buildings RM m
Sunway Lagoon Theme Park Petaling, Selangor 59.9 ac 728,326 200.0 100% 145.7
Sunway Hotel Georgetown Penang 240.0 units 0 150,000.0 100% 36.0
Monash University Sunway Campus Petaling, Selangor 12.0 ac 754,000 220.0 100% 165.9
Sunway University College Petaling, Selangor 12.4 ac 615,983 220.0 100% 135.5
Sunway Giza Sunway Damansara, Selangor 1.4 ac 98,000 500.0 60% 29.4
Lost World of Tambun Tambun, Perak 39.8 ac 728,326 80.0 65% 37.9
Sunway Hotel Phnom Penh Phnom Penh, Cambodia 138.0 units 125,313 300,000.0 53% 21.7
Sunway Hotel Hanoi Hanoi, Vietnam 142.0 units 9,365 300,000.0 100% 42.6
On going developments
Sunway City Penang Seberang Perai, Penang 15.8 ac 210,394.8 100.0 100% 21.0
Sunway Grand Penang 3.8 ac 768,767.9 100.0 100% 76.9
Sg. Ara - new land Penang 68.3 ac 3,484,800.0 13.0 100% 45.3
Bukit Mertajam - new land Penang 17.8 ac 7,729,724.0 12.0 100% 92.8
Sunway Damansara Petaling, Selangor 18.2 ac 1,048,489.2 120.0 60% 75.5
Sunway City Ipoh Ipoh, Perak 899.2 ac 32,666,515.2 3.0 65% 63.7
Sunway Velocity Kuala Lumpur 19.5 ac 984,456.0 150.0 50% 73.8
Sunway Tower KL 1 Kuala Lumpur 1.0 ac 43,560.0 1,000.0 100% 43.6
Sunway Kayangan Bukit Raja, Selangor 5.4 ac 367,646.4 40.0 100% 14.7
Sunway Integrated Resort Petaling, Selangor 18.5 ac 845,064.0 100.0 100% 84.5
Sunway Semenyih Ulu Langat, Selangor 398.1 ac 17,341,671.6 5.0 100% 86.7
Sunway Cheras Selangor 6.9 ac 301,870.8 25.0 100% 7.5
Sunway South Quay Bandar Sunway, Selangor 52.4 ac 2,517,768.0 900.0 100% 2266.0
Casa Kiara III Sri Hartamas, KL 2.8 ac 130,680.0 180.0 80% 18.8
Sunway Duta Kuala Lumpur 3.2 ac 136,342.8 350.0 60% 28.6
Sunway Melawati Setapak, KL 30.6 ac 1,427,896.8 35.0 100% 50.0
Sunway Alam Suria Shah Alam, Selangor 14.1 ac 1,045,440.0 40.0 50% 20.9
Sunway OPUS Grand India Hyderabad, India 23.8 ac 1,524,600.0 20.0 50% 15.2
Sunway MAK Signature Residence Hyderabad, India 14.0 ac 609,840.0 20.0 60% 7.3
Sunway Guanghao Jianyin, China 3.7 ac 740,520.0 80.0 39% 23.1
Tianjin Eco City Tianjin, China 90.9 ac 3,789,720.0 90.0 65% 221.7
Wonderland Business Park Sydney, Australia 65.5 ac 3,971,800.8 95.0 31% 117.0
Bukit Lenang - new land Johor 64.0 ac 2,787,840.0 40.0 80% 89.2
Taman Equine Selangor 33.0 ac 1,437,480.0 20.0 100% 28.7
Bangi Selangor 3.0 ac 130,680.0 10.0 100% 1.3
Sg. Long Balakong 111.0 ac 4,835,160.0 25.0 80% 96.7
Mont Putra Selangor 163.0 ac 7,100,280.0 25.0 100% 177.5
Melawati 2 Selangor 2.0 ac 87,120.0 20.0 100% 1.7
Tampines Singapore 5.0 ac 217,800.0 740.0 30% 48.4
Sembawang Singapore 0.8 ac 34,848.0 975.0 100% 34.0
Yuan Ching Road Singapore 5.0 ac 217,800.0 750.0 30% 49.0
Pasir Ris Rise Singapore 4.3 ac 187,308.0 780.0 30% 43.8
Medini land Iskandar 625.0 ac 27,225,000.0 80.0 38% 827.6
Pendas land Iskandar 1,079.2 ac 47,009,952.0 100.0 60% 2820.6
New Land Novena Singapore 1.7 ac 71,874.0 500.0 30% 10.8
Penang Land Penang 156.5 ac 6,815,397.6 295.0 100% 2010.5
New land - Kelana Jaya Petaling Jaya 17.0 ac 739,039.0 54.0 100% 39.9
New land - Anchorvale Lane Singapore 5.2 ac 226,076.4 750.0 30% 50.9
New Land - Jalan Peel Cheras 8.5 ac 368,082.0 200.0 100% 73.6
New land - Jalan Belfield KL 4.5 ac 196,891.2 836.2 100% 164.6
New land - Subang USJ Petaling Jaya 14.8 ac 644,557.3 260.0 100% 167.6
New land - Kajang Selangor 5.3 ac 229,840.0 274.0 100% 63.0
New land - Tampines Singapore 6.2 ac 268,329.6 900.0 65% 157.0
Total value of properties 11,025.9
Market cap Stake
Rm m
Sunway REIT 5,103.0 37% 1,872.8
RM m Stake P/E
Sunway Construction (market value) 2,327.0 54% 1,265.9
Quarry & Trading 20.2 100% 12.0 242.7
Property investments (4Q20) 2,033.4
Associates and JCE's (4Q20) 4,346.2
Total borrowings (4Q20) (7,506.2)
Total RNAV 13,280.6
FD RNAV (RM) 14,325.1
RNAV/share (RM) 2.56
Discount to RNAV 30%
Target price (RM) 1.79
Construction │ Malaysia
Sunway Bhd │ April 1, 2021
4
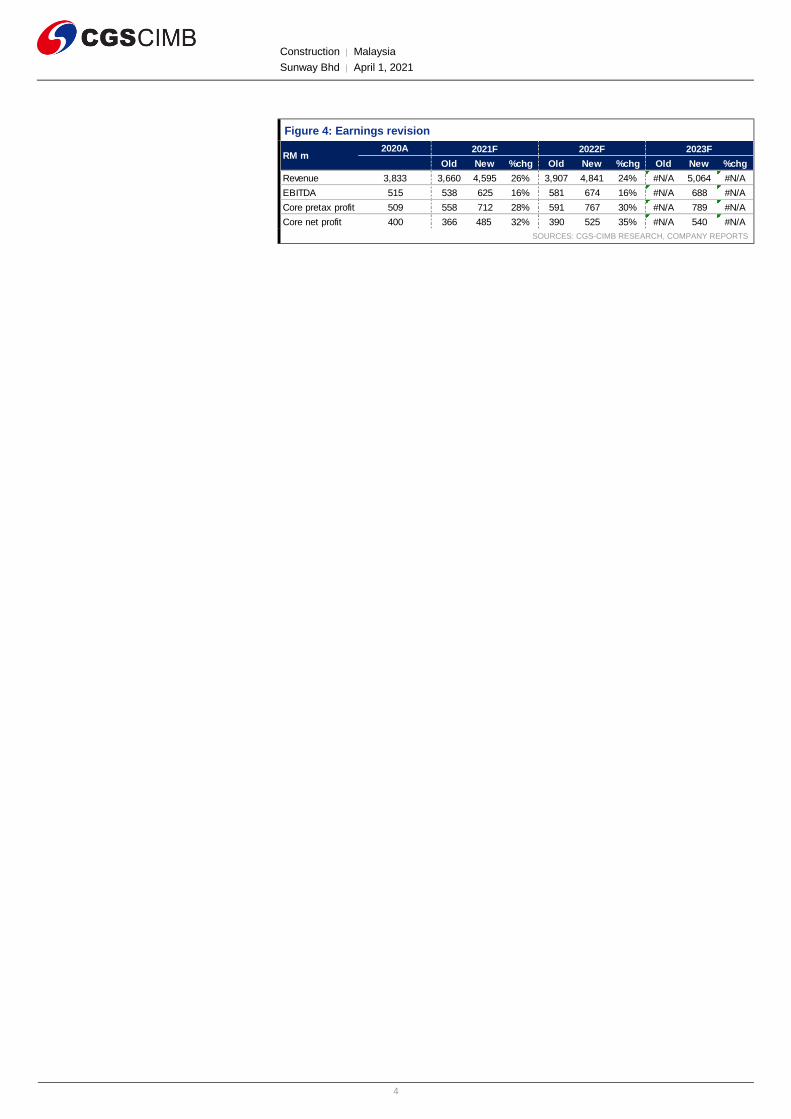
Figure 4: Earnings revision
SOURCES: CGS-CIMB RESEARCH, COMPANY REPORTS
2020A
Old New %chg Old New %chg Old New %chg
Revenue 3,833 3,660 4,595 26% 3,907 4,841 24% #N/A 5,064 #N/A
EBITDA 515 538 625 16% 581 674 16% #N/A 688 #N/A
Core pretax profit 509 558 712 28% 591 767 30% #N/A 789 #N/A
Core net profit 400 366 485 32% 390 525 35% #N/A 540 #N/A
RM m2021F 2022F 2023F
Construction │ Malaysia
Sunway Bhd │ April 1, 2021
5
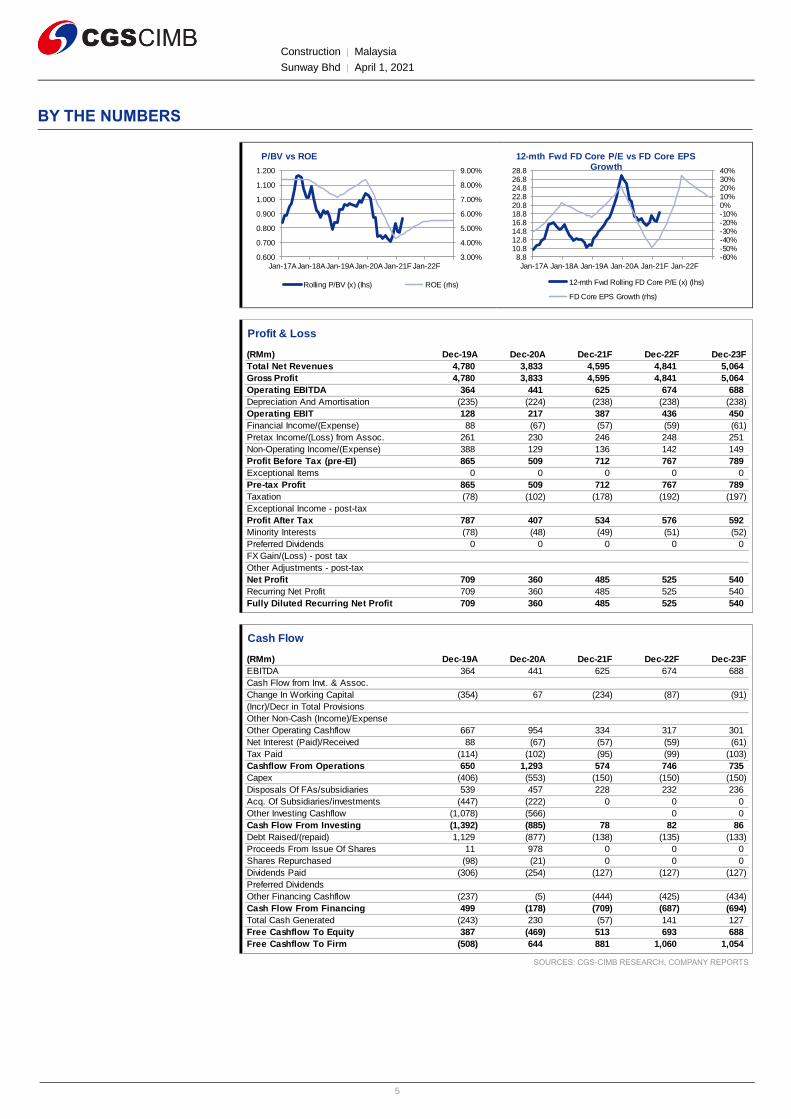
BY THE NUMBERS
SOURCES: CGS-CIMB RESEARCH, COMPANY REPORTS
3.00%
4.00%
5.00%
6.00%
7.00%
8.00%
9.00%
0.600
0.700
0.800
0.900
1.000
1.100
1.200
Jan-17AJan-18AJan-19AJan-20AJan-21F Jan-22F
P/BV vs ROE
Rolling P/BV (x) (lhs) ROE (rhs)
-60%-50%-40%-30%-20%-10%0%10%20%30%40%
8.810.812.814.816.818.820.822.824.826.828.8
Jan-17A Jan-18A Jan-19A Jan-20A Jan-21F Jan-22F
12-mth Fwd FD Core P/E vs FD Core EPS Growth
12-mth Fwd Rolling FD Core P/E (x) (lhs)
FD Core EPS Growth (rhs)
Profit & Loss
(RMm) Dec-19A Dec-20A Dec-21F Dec-22F Dec-23F
Total Net Revenues 4,780 3,833 4,595 4,841 5,064
Gross Profit 4,780 3,833 4,595 4,841 5,064
Operating EBITDA 364 441 625 674 688
Depreciation And Amortisation (235) (224) (238) (238) (238)
Operating EBIT 128 217 387 436 450
Financial Income/(Expense) 88 (67) (57) (59) (61)
Pretax Income/(Loss) from Assoc. 261 230 246 248 251
Non-Operating Income/(Expense) 388 129 136 142 149
Profit Before Tax (pre-EI) 865 509 712 767 789
Exceptional Items 0 0 0 0 0
Pre-tax Profit 865 509 712 767 789
Taxation (78) (102) (178) (192) (197)
Exceptional Income - post-tax
Profit After Tax 787 407 534 576 592
Minority Interests (78) (48) (49) (51) (52)
Preferred Dividends 0 0 0 0 0
FX Gain/(Loss) - post tax
Other Adjustments - post-tax
Net Profit 709 360 485 525 540
Recurring Net Profit 709 360 485 525 540
Fully Diluted Recurring Net Profit 709 360 485 525 540
Cash Flow
(RMm) Dec-19A Dec-20A Dec-21F Dec-22F Dec-23F
EBITDA 364 441 625 674 688
Cash Flow from Invt. & Assoc.
Change In Working Capital (354) 67 (234) (87) (91)
(Incr)/Decr in Total Provisions
Other Non-Cash (Income)/Expense
Other Operating Cashflow 667 954 334 317 301
Net Interest (Paid)/Received 88 (67) (57) (59) (61)
Tax Paid (114) (102) (95) (99) (103)
Cashflow From Operations 650 1,293 574 746 735
Capex (406) (553) (150) (150) (150)
Disposals Of FAs/subsidiaries 539 457 228 232 236
Acq. Of Subsidiaries/investments (447) (222) 0 0 0
Other Investing Cashflow (1,078) (566) 0 0
Cash Flow From Investing (1,392) (885) 78 82 86
Debt Raised/(repaid) 1,129 (877) (138) (135) (133)
Proceeds From Issue Of Shares 11 978 0 0 0
Shares Repurchased (98) (21) 0 0 0
Dividends Paid (306) (254) (127) (127) (127)
Preferred Dividends
Other Financing Cashflow (237) (5) (444) (425) (434)
Cash Flow From Financing 499 (178) (709) (687) (694)
Total Cash Generated (243) 230 (57) 141 127
Free Cashflow To Equity 387 (469) 513 693 688
Free Cashflow To Firm (508) 644 881 1,060 1,054
Construction │ Malaysia
Sunway Bhd │ April 1, 2021
6
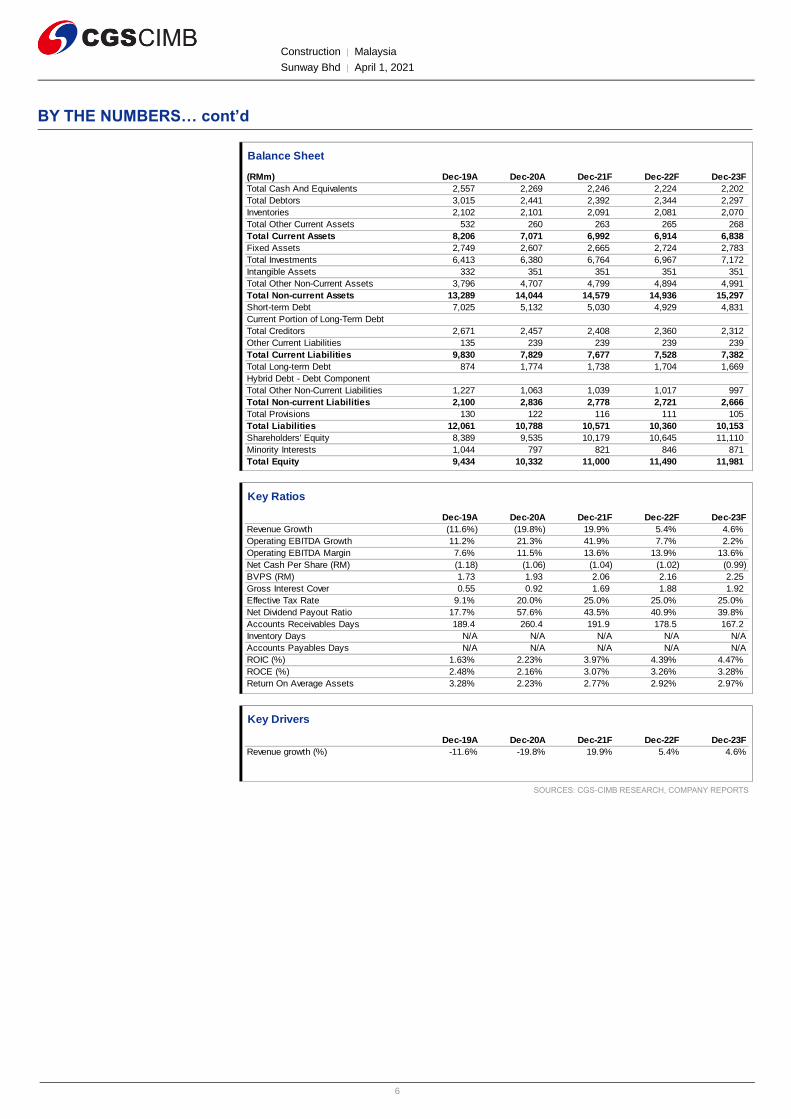
BY THE NUMBERS… cont’d
SOURCES: CGS-CIMB RESEARCH, COMPANY REPORTS
Balance Sheet
(RMm) Dec-19A Dec-20A Dec-21F Dec-22F Dec-23F
Total Cash And Equivalents 2,557 2,269 2,246 2,224 2,202
Total Debtors 3,015 2,441 2,392 2,344 2,297
Inventories 2,102 2,101 2,091 2,081 2,070
Total Other Current Assets 532 260 263 265 268
Total Current Assets 8,206 7,071 6,992 6,914 6,838
Fixed Assets 2,749 2,607 2,665 2,724 2,783
Total Investments 6,413 6,380 6,764 6,967 7,172
Intangible Assets 332 351 351 351 351
Total Other Non-Current Assets 3,796 4,707 4,799 4,894 4,991
Total Non-current Assets 13,289 14,044 14,579 14,936 15,297
Short-term Debt 7,025 5,132 5,030 4,929 4,831
Current Portion of Long-Term Debt
Total Creditors 2,671 2,457 2,408 2,360 2,312
Other Current Liabilities 135 239 239 239 239
Total Current Liabilities 9,830 7,829 7,677 7,528 7,382
Total Long-term Debt 874 1,774 1,738 1,704 1,669
Hybrid Debt - Debt Component
Total Other Non-Current Liabilities 1,227 1,063 1,039 1,017 997
Total Non-current Liabilities 2,100 2,836 2,778 2,721 2,666
Total Provisions 130 122 116 111 105
Total Liabilities 12,061 10,788 10,571 10,360 10,153
Shareholders' Equity 8,389 9,535 10,179 10,645 11,110
Minority Interests 1,044 797 821 846 871
Total Equity 9,434 10,332 11,000 11,490 11,981
Key Ratios
Dec-19A Dec-20A Dec-21F Dec-22F Dec-23F
Revenue Growth (11.6%) (19.8%) 19.9% 5.4% 4.6%
Operating EBITDA Growth 11.2% 21.3% 41.9% 7.7% 2.2%
Operating EBITDA Margin 7.6% 11.5% 13.6% 13.9% 13.6%
Net Cash Per Share (RM) (1.18) (1.06) (1.04) (1.02) (0.99)
BVPS (RM) 1.73 1.93 2.06 2.16 2.25
Gross Interest Cover 0.55 0.92 1.69 1.88 1.92
Effective Tax Rate 9.1% 20.0% 25.0% 25.0% 25.0%
Net Dividend Payout Ratio 17.7% 57.6% 43.5% 40.9% 39.8%
Accounts Receivables Days 189.4 260.4 191.9 178.5 167.2
Inventory Days N/A N/A N/A N/A N/A
Accounts Payables Days N/A N/A N/A N/A N/A
ROIC (%) 1.63% 2.23% 3.97% 4.39% 4.47%
ROCE (%) 2.48% 2.16% 3.07% 3.26% 3.28%
Return On Average Assets 3.28% 2.23% 2.77% 2.92% 2.97%
Key Drivers
Dec-19A Dec-20A Dec-21F Dec-22F Dec-23F
Revenue growth (%) -11.6% -19.8% 19.9% 5.4% 4.6%
Construction │ Malaysia
Sunway Bhd │ April 1, 2021
7
DISCLAIMER The content of this report (including the views and opinions expressed therein, and the information comprised therein) has been prepared by and belongs to CGS-CIMB. Reports relating to a specific geographical area are produced and distributed by the corresponding CGS-CIMB entity as listed in the table below.
This report is not directed to, or intended for distribution to or use by, any person or entity who is a citizen or resident of or located in any locality, state, country or other jurisdiction where such distribution, publication, availability or use would be contrary to law or regulation.
By accepting this report, the recipient hereof represents and warrants that he is entitled to receive such report in accordance with the restrictions set forth below and agrees to be bound by the limitations contained herein (including the “Restrictions on Distributions” set out below). Any failure to comply with these limitations may constitute a violation of law. This publication is being supplied to you strictly on the basis that it will remain confidential. No part of this report may be (i) copied, photocopied, duplicated, stored or reproduced in any form by any means; or (ii) redistributed or passed on, directly or indirectly, to any other person in whole or in part, for any purpose without the prior written consent of CGS-CIMB.
The information contained in this research report is prepared from data believed to be correct and reliable at the time of issue of this report. CGS-CIMB may or may not issue regular reports on the subject matter of this report at any frequency and may cease to do so or change the periodicity of reports at any time. CGS-CIMB has no obligation to update this report in the event of a material change to the information contained in this report. CGS-CIMB does not accept any obligation to (i) check or ensure that the contents of this report remain current, reliable or relevant, (ii) ensure that the content of this report constitutes all the information a prospective investor may require, (iii) ensure the adequacy, accuracy, completeness, reliability or fairness of any views, opinions and information, and accordingly, CGS-CIMB, its affiliates and related persons including China Galaxy International Financial Holdings Limited (“CGIFHL”) and CIMB Group Sdn. Bhd. (“CIMBG”) and their respective related corporations (and their respective directors, associates, connected persons and/or employees) shall not be liable in any manner whatsoever for any consequences (including but not limited to any direct, indirect or consequential losses, loss of profits and damages) of any reliance thereon or usage thereof. In particular, CGS-CIMB disclaims all responsibility and liability for the views and opinions set out in this report.
Unless otherwise specified, this report is based upon sources which CGS-CIMB considers to be reasonable. Such sources will, unless otherwise specified, for market data, be market data and prices available from the main stock exchange or market where the relevant security is listed, or, where appropriate, any other market. Information on the accounts and business of company(ies) will generally be based on published statements of the company(ies), information disseminated by regulatory information services, other publicly available information and information resulting from our research.
Whilst every effort is made to ensure that statements of facts made in this report are accurate, all estimates, projections, forecasts, expressions of opinion and other subjective judgments contained in this report are based on assumptions considered to be reasonable as of the date of the document in which they are contained and must not be construed as a representation that the matters referred to therein will occur. Past performance is not a reliable indicator of future performance. The value of investments may go down as well as up and those investing may, depending on the investments in question, lose more than the initial investment. No report shall constitute an offer or an invitation by or on behalf of CGS-CIMB or any of its affiliates (including CGIFHL, CIMBG and their respective related corporations) to any person to buy or sell any investments.
CGS-CIMB, its affiliates and related corporations (including CGIFHL, CIMBG and their respective related corporations) and/or their respective directors, associates, connected parties and/or employees may own or have positions in securities of the company(ies) covered in this research report or any securities related thereto and may from time to time add to or dispose of, or may be materially interested in, any such securities. Further, CGS-CIMB, its affiliates and their respective related corporations (including CGIFHL, CIMBG and their respective related corporations) do and seek to do business with the company(ies) covered in this research report and may from time to time act as market maker or have assumed an underwriting commitment in securities of such company(ies), may sell them to or buy them from customers on a principal basis and may also perform or seek to perform significant investment banking, advisory, underwriting or placement services for or relating to such company(ies) as well as solicit such investment, advisory or other services from any entity mentioned in this report.
CGS-CIMB or its affiliates (including CGIFHL, CIMBG and their respective related corporations) may enter into an agreement with the company(ies) covered in this report relating to the production of research reports. CGS-CIMB may disclose the contents of this report to the company(ies) covered by it and may have amended the contents of this report following such disclosure.
The analyst responsible for the production of this report hereby certifies that the views expressed herein accurately and exclusively reflect his or her personal views and opinions about any and all of the issuers or securities analysed in this report and were prepared independently and autonomously. No part of the compensation of the analyst(s) was, is, or will be directly or indirectly related to the inclusion of specific recommendations(s) or view(s) in this report. The analyst(s) who prepared this research report is prohibited from receiving any compensation, incentive or bonus based on specific investment banking transactions or for providing a specific recommendation for, or view of, a particular company. Information barriers and other arrangements may be established where necessary to prevent conflicts of interests arising. However, the analyst(s) may receive compensation that is based on his/their coverage of company(ies) in the performance of his/their duties or the performance of his/their recommendations and the research personnel involved in the preparation of this report may also participate in the solicitation of the businesses as described above. In reviewing this research report, an investor should be aware that any or all of the foregoing, among other things, may give rise to real or potential conflicts of interest. Additional information is, subject to the duties of confidentiality, available on request.
Reports relating to a specific geographical area are produced by the corresponding CGS-CIMB entity as listed in the table below. The term “CGS-CIMB” shall denote, where appropriate, the relevant entity distributing or disseminating the report in the particular jurisdiction referenced below, or, in every other case except as otherwise stated herein, CGS-CIMB Securities International Pte. Ltd. and its affiliates, subsidiaries and related corporations.
Construction │ Malaysia
Sunway Bhd │ April 1, 2021
8
Country CGS-CIMB Entity Regulated by
Hong Kong CGS-CIMB Securities (Hong Kong) Limited Securities and Futures Commission Hong Kong
India CGS-CIMB Securities (India) Private Limited Securities and Exchange Board of India (SEBI)
Indonesia PT CGS-CIMB Sekuritas Indonesia Financial Services Authority of Indonesia
Malaysia CGS-CIMB Securities Sdn. Bhd. (formerly known as Jupiter Securities Sdn. Bhd.)
Securities Commission Malaysia
Singapore CGS-CIMB Research Pte. Ltd. Monetary Authority of Singapore
South Korea CGS-CIMB Securities (Hong Kong) Limited, Korea Branch Financial Services Commission and Financial Supervisory Service
Thailand CGS-CIMB Securities (Thailand) Co. Ltd. Securities and Exchange Commission Thailand
Other Significant Financial Interests:
(i) As of March 31, 2021 CGS-CIMB has a proprietary position in the securities (which may include but not be limited to shares, warrants, call warrants and/or any other derivatives) in the following company or companies covered or recommended in this report:
(a) -
(ii) Analyst Disclosure: As of April 1, 2021, the analyst(s) who prepared this report, and the associate(s), has / have an interest in the securities (which may include but not be limited to shares, warrants, call warrants and/or any other derivatives) in the following company or companies covered or recommended in this report:
(a) -
This report does not purport to contain all the information that a prospective investor may require. Neither CGS-CIMB nor any of its affiliates (including CGIFHL, CIMBG and their related corporations) make any guarantee, representation or warranty, express or implied, as to the adequacy, accuracy, completeness, reliability or fairness of any such information and opinion contained in this report. Neither CGS-CIMB nor any of its affiliates nor their related persons (including CGIFHL, CIMBG and their related corporations) shall be liable in any manner whatsoever for any consequences (including but not limited to any direct, indirect or consequential losses, loss of profits and damages) of any reliance thereon or usage thereof.
This report is general in nature and has been prepared for information purposes only. It is intended for circulation amongst CGS-CIMB’s clients generally and does not have regard to the specific investment objectives, financial situation and the particular needs of any specific person who may receive this report. The information and opinions in this report are not and should not be construed or considered as an offer, recommendation or solicitation to buy or sell the subject securities, related investments or other financial instruments or any derivative instrument, or any rights pertaining thereto.
Investors are advised to make their own independent evaluation of the information contained in this research report, consider their own individual investment objectives, financial situation and particular needs and consult their own professional and financial advisers as to the legal, business, financial, tax and other aspects before participating in any transaction in respect of the securities of company(ies) covered in this research report.
The securities of such company(ies) may not be eligible for sale in all jurisdictions or to all categories of investors.
Restrictions on Distributions
Australia: Despite anything in this report to the contrary, this research is provided in Australia by CGS-CIMB Securities (Singapore) Pte. Ltd. and CGS-CIMB Securities (Hong Kong) Limited. This research is only available in Australia to persons who are “wholesale clients” (within the meaning of the Corporations Act 2001 (Cth) and is supplied solely for the use of such wholesale clients and shall not be distributed or passed on to any other person. You represent and warrant that if you are in Australia, you are a “wholesale client”. This research is of a general nature only and has been prepared without taking into account the objectives, financial situation or needs of the individual recipient. CGS-CIMB Securities (Singapore) Pte. Ltd. and CGS-CIMB Securities (Hong Kong) Limited do not hold, and are not required to hold an Australian financial services license. CGS-CIMB Securities (Singapore) Pte. Ltd. and CGS-CIMB Securities (Hong Kong) Limited rely on “passporting” exemptions for entities appropriately licensed by the Monetary Authority of Singapore (under ASIC Class Order 03/1102) and the Securities and Futures Commission in Hong Kong (under ASIC Class Order 03/1103).
Canada: This research report has not been prepared in accordance with the disclosure requirements of Dealer Member Rule 3400 – Research Restrictions and Disclosure Requirements of the Investment Industry Regulatory Organization of Canada. For any research report distributed by CIBC, further disclosures related to CIBC conflicts of interest can be found at https://researchcentral.cibcwm.com .
China: For the purpose of this report, the People’s Republic of China (“PRC”) does not include the Hong Kong Special Administrative Region, the Macau Special Administrative Region or Taiwan. The distributor of this report has not been approved or licensed by the China Securities Regulatory Commission or any other relevant regulatory authority or governmental agency in the PRC. This report contains only marketing information. The distribution of this report is not an offer to buy or sell to any person within or outside PRC or a solicitation to any person within or outside of PRC to buy or sell any instruments described herein. This report is being issued outside the PRC to a limited number of institutional investors and may not be provided to any person other than the original recipient and may not be reproduced or used for any other purpose.
France: Only qualified investors within the meaning of French law shall have access to this report. This report shall not be considered as an offer to subscribe to, or used in connection with, any offer for subscription or sale or marketing or direct or indirect distribution of financial instruments and it is not intended as a solicitation for the purchase of any financial instrument.
Germany: This report is only directed at persons who are professional investors as defined in sec 31a(2) of the German Securities Trading Act (WpHG). This publication constitutes research of a non-binding nature on the market situation and the investment instruments cited here at the time of the publication of the information.
The current prices/yields in this issue are based upon closing prices from Bloomberg as of the day preceding publication. Please note that neither the German Federal Financial Supervisory Agency (BaFin), nor any other supervisory authority exercises any control over the content of this report.
Hong Kong: This report is issued and distributed in Hong Kong by CGS-CIMB Securities (Hong Kong) Limited (“CHK”) which is licensed in Hong Kong by the Securities and Futures Commission for Type 1 (dealing in securities) and Type 4 (advising on securities) activities. Any investors wishing
Construction │ Malaysia
Sunway Bhd │ April 1, 2021
9
to purchase or otherwise deal in the securities covered in this report should contact the Head of Sales at CGS-CIMB Securities (Hong Kong) Limited. The views and opinions in this research report are our own as of the date hereof and are subject to change. If the Financial Services and Markets Act of the United Kingdom or the rules of the Financial Conduct Authority apply to a recipient, our obligations owed to such recipient therein are unaffected. CHK has no obligation to update its opinion or the information in this research report.
This publication is strictly confidential and is for private circulation only to clients of CHK.
CHK does not make a market on other securities mentioned in the report.
India: This report is issued and distributed in India by CGS-CIMB Securities (India) Private Limited (“CGS-CIMB India”). CGS-CIMB India is a subsidiary of CGS-CIMB Securities International Pte. Ltd. which is in turn is a 50:50 joint venture company of CGIFHL and CIMBG. The details of the members of the group of companies of CGS-CIMB can be found at www.cgs-cimb.com, CGIFHL at www.chinastock.com.hk/en/ACG/ContactUs/index.aspx and CIMBG at www.cimb.com/en/who-we-are.html. CGS-CIMB India is registered with the National Stock Exchange of India Limited and BSE Limited as a trading and clearing member (Merchant Banking Number: INM000012037) under the Securities and Exchange Board of India (Stock Brokers and Sub-Brokers) Regulations, 1992. In accordance with the provisions of Regulation 4(g) of the Securities and Exchange Board of India (Investment Advisers) Regulations, 2013, CGS-CIMB India is not required to seek registration with the Securities and Exchange Board of India (“SEBI”) as an Investment Adviser. CGS-CIMB India is registered with SEBI (SEBI Registration Number: INZ000209135) as a Research Analyst (INH000000669) pursuant to the SEBI (Research Analysts) Regulations, 2014 ("Regulations").
This report does not take into account the particular investment objectives, financial situations, or needs of the recipients. It is not intended for and does not deal with prohibitions on investment due to law/jurisdiction issues etc. which may exist for certain persons/entities. Recipients should rely on their own investigations and take their own professional advice before investment.
The report is not a “prospectus” as defined under Indian Law, including the Companies Act, 2013, and is not, and shall not be, approved by, or filed or registered with, any Indian regulator, including any Registrar of Companies in India, SEBI, any Indian stock exchange, or the Reserve Bank of India. No offer, or invitation to offer, or solicitation of subscription with respect to any such securities listed or proposed to be listed in India is being made, or intended to be made, to the public, or to any member or section of the public in India, through or pursuant to this report.
The research analysts, strategists or economists principally responsible for the preparation of this research report are segregated from the other activities of CGS-CIMB India and they have received compensation based upon various factors, including quality, accuracy and value of research, firm profitability or revenues, client feedback and competitive factors. Research analysts', strategists' or economists' compensation is not linked to investment banking or capital markets transactions performed or proposed to be performed by CGS-CIMB India or its affiliates.
CGS-CIMB India does not have actual / beneficial ownership of 1% or more securities of the subject company in this research report, at the end of the month immediately preceding the date of publication of this research report. However, since affiliates of CGS-CIMB India are engaged in the financial services business, they might have in their normal course of business financial interests or actual / beneficial ownership of one per cent or more in various companies including the subject company in this research report.
CGS-CIMB India or its associates, may: (a) from time to time, have long or short position in, and buy or sell the securities of the subject company in this research report; or (b) be engaged in any other transaction involving such securities and earn brokerage or other compensation or act as a market maker in the financial instruments of the subject company in this research report or act as an advisor or lender/borrower to such company or may have any other potential conflict of interests with respect to any recommendation and other related information and opinions.
CGS-CIMB India, its associates and the analyst engaged in preparation of this research report have not received any compensation for investment banking, merchant banking or brokerage services from the subject company mentioned in the research report in the past 12 months.
CGS-CIMB India, its associates and the analyst engaged in preparation of this research report have not managed or co-managed public offering of securities for the subject company mentioned in the research report in the past 12 months. The analyst from CGS-CIMB India engaged in preparation of this research report or his/her relative (a) do not have any financial interests in the subject company mentioned in this research report; (b) do not own 1% or more of the equity securities of the subject company mentioned in the research report as of the last day of the month preceding the publication of the research report; (c) do not have any material conflict of interest at the time of publication of the research report.
Indonesia: This report is issued and distributed by PT CGS-CIMB Sekuritas Indonesia (“CGS-CIMB Indonesia”). The views and opinions in this research report are our own as of the date hereof and are subject to change. CGS-CIMB Indonesia has no obligation to update its opinion or the information in this research report. This report is for private circulation only to clients of CGS-CIMB Indonesia. Neither this report nor any copy hereof may be distributed in Indonesia or to any Indonesian citizens wherever they are domiciled or to Indonesian residents except in compliance with applicable Indonesian capital market laws and regulations.
This research report is not an offer of securities in Indonesia. The securities referred to in this research report have not been registered with the Financial Services Authority (Otoritas Jasa Keuangan) pursuant to relevant capital market laws and regulations, and may not be offered or sold within the territory of the Republic of Indonesia or to Indonesian citizens through a public offering or in circumstances which constitute an offer within the meaning of the Indonesian capital market law and regulations.
Ireland: CGS-CIMB is not an investment firm authorised in the Republic of Ireland and no part of this document should be construed as CGS-CIMB acting as, or otherwise claiming or representing to be, an investment firm authorised in the Republic of Ireland.
Malaysia: This report is distributed in Malaysia by CGS-CIMB Securities Sdn. Bhd. (formerly known as Jupiter Securities Sdn. Bhd.) (“CGS-CIMB Malaysia”) solely for the benefit of and for the exclusive use of our clients. Recipients of this report are to contact CGS-CIMB Malaysia, at 29th Floor Menara CIMB No. 1 Jalan Stesen Sentral 2, Kuala Lumpur Sentral 50470 Kuala Lumpur, Malaysia, in respect of any matters arising from or in connection with this report. CGS-CIMB Malaysia has no obligation to update, revise or reaffirm its opinion or the information in this research reports after the date of this report.
New Zealand: In New Zealand, this report is for distribution only to persons who are wholesale clients pursuant to section 5C of the Financial Advisers Act 2008.
Singapore: This report is issued and distributed by CGS-CIMB Research Pte Ltd (“CGS-CIMBR”). CGS-CIMBR is a financial adviser licensed under the Financial Advisers Act, Cap 110 (“FAA”) for advising on investment products, by issuing or promulgating research analyses or research reports, whether in electronic, print or other form. Accordingly, CGS-CIMBR is a subject to the applicable rules under the FAA unless it is able to avail itself to
Construction │ Malaysia
Sunway Bhd │ April 1, 2021
10
any prescribed exemptions.
Recipients of this report are to contact CGS-CIMB Research Pte Ltd, 50 Raffles Place, #16-02 Singapore Land Tower, Singapore in respect of any matters arising from, or in connection with this report. CGS-CIMBR has no obligation to update its opinion or the information in this research report. This publication is strictly confidential and is for private circulation only. If you have not been sent this report by CGS-CIMBR directly, you may not rely, use or disclose to anyone else this report or its contents.
If the recipient of this research report is not an accredited investor, expert investor or institutional investor, CGS-CIMBR accepts legal responsibility for the contents of the report without any disclaimer limiting or otherwise curtailing such legal responsibility. If the recipient is an accredited investor, expert investor or institutional investor, the recipient is deemed to acknowledge that CGS-CIMBR is exempt from certain requirements under the FAA and its attendant regulations, and as such, is exempt from complying with the following:
(a) Section 25 of the FAA (obligation to disclose product information);
(b) Section 27 (duty not to make recommendation with respect to any investment product without having a reasonable basis where you may be reasonably expected to rely on the recommendation) of the FAA;
(c) MAS Notice on Information to Clients and Product Information Disclosure [Notice No. FAA-N03];
(d) MAS Notice on Recommendation on Investment Products [Notice No. FAA-N16];
(e) Section 36 (obligation on disclosure of interest in specified products), and
(f) any other laws, regulations, notices, directive, guidelines, circulars and practice notes which are relates to the above, to the extent permitted by applicable laws, as may be amended from time to time, and any other laws, regulations, notices, directive, guidelines, circulars, and practice notes as we may notify you from time to time. In addition, the recipient who is an accredited investor, expert investor or institutional investor acknowledges that as CGS-CIMBR is exempt from Section 27 of the FAA, the recipient will also not be able to file a civil claim against CGS-CIMBR for any loss or damage arising from the recipient’s reliance on any recommendation made by CGS-CIMBR which would otherwise be a right that is available to the recipient under Section 27 of the FAA, the recipient will also not be able to file a civil claim against CGS-CIMBR for any loss or damage arising from the recipient’s reliance on any recommendation made by CGS-CIMBR which would otherwise be a right that is available to the recipient under Section 27 of the FAA.
CGS-CIMBR, its affiliates and related corporations, their directors, associates, connected parties and/or employees may own or have positions in specified products of the company(ies) covered in this research report or any specified products related thereto and may from time to time add to or dispose of, or may be materially interested in, any such specified products. Further, CGS-CIMBR, its affiliates and its related corporations do and seek to do business with the company(ies) covered in this research report and may from time to time act as market maker or have assumed an underwriting commitment in specified products of such company(ies), may sell them to or buy them from customers on a principal basis and may also perform or seek to perform significant investment banking, advisory, underwriting or placement services for or relating to such company(ies) as well as solicit such investment, advisory or other services from any entity mentioned in this report.
As of March 31, 2021, CGS-CIMBR does not have a proprietary position in the recommended specified products in this report.
CGS-CIMBR does not make a market on the securities mentioned in the report.
South Korea: This report is issued and distributed in South Korea by CGS-CIMB Securities (Hong Kong) Limited, Korea Branch (“CGS-CIMB Korea”) which is licensed as a cash equity broker, and regulated by the Financial Services Commission and Financial Supervisory Service of Korea. In South Korea, this report is for distribution only to professional investors under Article 9(5) of the Financial Investment Services and Capital Market Act of Korea (“FSCMA”).
Spain: This document is a research report and it is addressed to institutional investors only. The research report is of a general nature and not personalised and does not constitute investment advice so, as the case may be, the recipient must seek proper advice before adopting any investment decision. This document does not constitute a public offering of securities.
CGS-CIMB is not registered with the Spanish Comision Nacional del Mercado de Valores to provide investment services.
Sweden: This report contains only marketing information and has not been approved by the Swedish Financial Supervisory Authority. The distribution of this report is not an offer to sell to any person in Sweden or a solicitation to any person in Sweden to buy any instruments described herein and may not be forwarded to the public in Sweden.
Switzerland: This report has not been prepared in accordance with the recognized self-regulatory minimal standards for research reports of banks issued by the Swiss Bankers’ Association (Directives on the Independence of Financial Research).
Thailand: This report is issued and distributed by CGS-CIMB Securities (Thailand) Co. Ltd. (“CGS-CIMB Thailand”) based upon sources believed to be reliable (but their accuracy, completeness or correctness is not guaranteed). The statements or expressions of opinion herein were arrived at after due and careful consideration for use as information for investment. Such opinions are subject to change without notice and CGS-CIMB Thailand has no obligation to update its opinion or the information in this research report.
CGS-CIMB Thailand may act or acts as Market Maker, and issuer and offerer of Derivative Warrants and Structured Note which may have the following securities as its underlying securities. Investors should carefully read and study the details of the derivative warrants in the prospectus before making investment decisions.
AAV, ADVANC, AEONTS, AMATA, AOT, AWC, BANPU, BBL, BCH, BCP, BCPG, BDMS, BEC, BEM, BGC, BGRIM, BH, BJC, BPP, BTS, CBG, CENTEL, CHG, CK, CKP, COM7, CPALL, CPF, CPN, DELTA, DTAC, EA, EGCO, EPG, ERW, ESSO, GFPT, GLOBAL, GPSC, GULF, GUNKUL, HANA, HMPRO, INTUCH, IRPC, IVL, JAS, JMT, KBANK, KCE, KKP, KTB, KTC, LH, MAJOR, MBK, MEGA, MINT, MTC, ORI, OSP, PLANB, PRM, PSH, PSL, PTG, PTT, PTTEP, PTTGC, QH, RATCH, RS, SAWAD, SCB, SCC, SGP, SPALI, SPRC, STA, STEC, STPI, SUPER, TASCO, TCAP, THAI, THANI, THG, TISCO, TKN, TMB, TOA, TOP, TPIPP, TQM, TRUE, TTW, TU, VGI, WHA, BEAUTY, JMART, LPN, SISB, WORK.
Corporate Governance Report:
The disclosure of the survey result of the Thai Institute of Directors Association (“IOD”) regarding corporate governance is made pursuant to the policy of the Office of the Securities and Exchange Commission. The survey of the IOD is based on the information of a company listed on the Stock Exchange of Thailand and the Market for Alternative Investment disclosed to the public and able to be accessed by a general public investor. The
Construction │ Malaysia
Sunway Bhd │ April 1, 2021
11
result, therefore, is from the perspective of a third party. It is not an evaluation of operation and is not based on inside information.
The survey result is as of the date appearing in the Corporate Governance Report of Thai Listed Companies. As a result, the survey result may be changed after that date. CGS-CIMB Thailand does not confirm nor certify the accuracy of such survey result.
Score Range: 90 - 100 80 – 89 70 - 79 Below 70 or No Survey Result
Description: Excellent Very Good Good N/A
United Arab Emirates: The distributor of this report has not been approved or licensed by the UAE Central Bank or any other relevant licensing authorities or governmental agencies in the United Arab Emirates. This report is strictly private and confidential and has not been reviewed by, deposited or registered with UAE Central Bank or any other licensing authority or governmental agencies in the United Arab Emirates. This report is being issued outside the United Arab Emirates to a limited number of institutional investors and must not be provided to any person other than the original recipient and may not be reproduced or used for any other purpose. Further, the information contained in this report is not intended to lead to the sale of investments under any subscription agreement or the conclusion of any other contract of whatsoever nature within the territory of the United Arab Emirates.
United Kingdom and European Economic Area (EEA): In the United Kingdom and European Economic Area, this material is also being distributed by CGS-CIMB Securities (UK) Limited (“CGS-CIMB UK”). CGS-CIMB UK is authorized and regulated by the Financial Conduct Authority and its registered office is at 53 New Broad Street, London EC2M 1JJ. The material distributed by CGS-CIMB UK has been prepared in accordance with CGS-CIMB’s policies for managing conflicts of interest arising as a result of publication and distribution of this material. This material is for distribution only to, and is solely directed at, selected persons on the basis that those persons: (a) are eligible counterparties and professional clients of CGS-CIMB UK; (b) have professional experience in matters relating to investments falling within Article 19(5) of the Financial Services and Markets Act 2000 (Financial Promotion) Order 2005 (as amended, the “Order”), (c) fall within Article 49(2)(a) to (d) (“high net worth companies, unincorporated associations etc”) of the Order; (d) are outside the United Kingdom subject to relevant regulation in each jurisdiction, material(all such persons together being referred to as “relevant persons”). This material is directed only at relevant persons and must not be acted on or relied on by persons who are not relevant persons. Any investment or investment activity to which this material relates is available only to relevant persons and will be engaged in only with relevant persons.
This material is categorised as non-independent for the purposes of CGS-CIMB UK and therefore does not provide an impartial or objective assessment of the subject matter and does not constitute independent research. Consequently, this material has not been prepared in accordance with legal requirements designed to promote the independence of research and will not be subject to any prohibition on dealing ahead of the dissemination of research. Therefore, this material is considered a marketing communication.
United States: This research report is distributed in the United States of America by CGS-CIMB Securities (USA) Inc, a U.S. registered broker-dealer and an affiliate of CGS-CIMB Securities Sdn. Bhd. (formerly known as Jupiter Securities Sdn. Bhd.), CGS-CIMB Research Pte Ltd, PT CGS-CIMB Sekuritas Indonesia, CGS-CIMB Securities (Thailand) Co. Ltd, CGS-CIMB Securities (Hong Kong) Limited and CGS-CIMB Securities (India) Private Limited, and is distributed solely to persons who qualify as “U.S. Institutional Investors” as defined in Rule 15a-6 under the Securities and Exchange Act of 1934. This communication is only for Institutional Investors whose ordinary business activities involve investing in shares, bonds, and associated securities and/or derivative securities and who have professional experience in such investments. Any person who is not a U.S. Institutional Investor or Major Institutional Investor must not rely on this communication. The delivery of this research report to any person in the United States of America is not a recommendation to effect any transactions in the securities discussed herein, or an endorsement of any opinion expressed herein. CGS-CIMB Securities (USA) Inc, is a FINRA/SIPC member and takes responsibility for the content of this report. For further information or to place an order in any of the above-mentioned securities please contact a registered representative of CGS-CIMB Securities (USA) Inc.
CGS-CIMB Securities (USA) Inc. does not make a market on other securities mentioned in the report.
CGS-CIMB Securities (USA) Inc. has not managed or co-managed a public offering of any of the securities mentioned in the past 12 months.
CGS-CIMB Securities (USA) Inc. has not received compensation for investment banking services from any of the company mentioned in the past 12 months.
CGS-CIMB Securities (USA) Inc. neither expects to receive nor intends to seek compensation for investment banking services from any of the company mentioned within the next 3 months.
United States Third-Party Disclaimer: If this report is distributed in the United States of America by Raymond James & Associates, Inc (“RJA”), this report is third-party research prepared for and distributed in the United States of America by RJA pursuant to an arrangement between RJA and CGS-CIMB Securities International Pte. Ltd. (“CGS-CIMB”). CGS-CIMB is not an affiliate of RJA. This report is distributed solely to persons who qualify as “U.S. Institutional Investors” or as “Major U.S. Institutional Investors” as defined in Rule 15a-6 under the Securities and Exchange Act of 1934, as amended. This communication is only for U.S. Institutional Investors or Major U.S. Institutional Investor whose ordinary business activities involve investing in shares, bonds, and associated securities and/or derivative securities and who have professional experience in such investments. Any person who is not a U.S. Institutional Investor or Major U.S. Institutional Investor must not rely on this communication. The delivery of this report to any person in the U.S. is not a recommendation to effect any transactions in the securities discussed herein, or an endorsement of any opinion expressed herein. If you are receiving this report in the U.S from RJA, a FINRA/SIPC member, it takes responsibility for the content of this report. For further information or to place an order in any of the above-mentioned securities please contact a registered representative of CGS-CIMB Securities (USA) Inc. or RJA. https://raymondjames.com/InternationalEquityDisclosures
Other jurisdictions: In any other jurisdictions, except if otherwise restricted by laws or regulations, this report is only for distribution to professional, institutional or sophisticated investors as defined in the laws and regulations of such jurisdictions.
Construction │ Malaysia
Sunway Bhd │ April 1, 2021
12
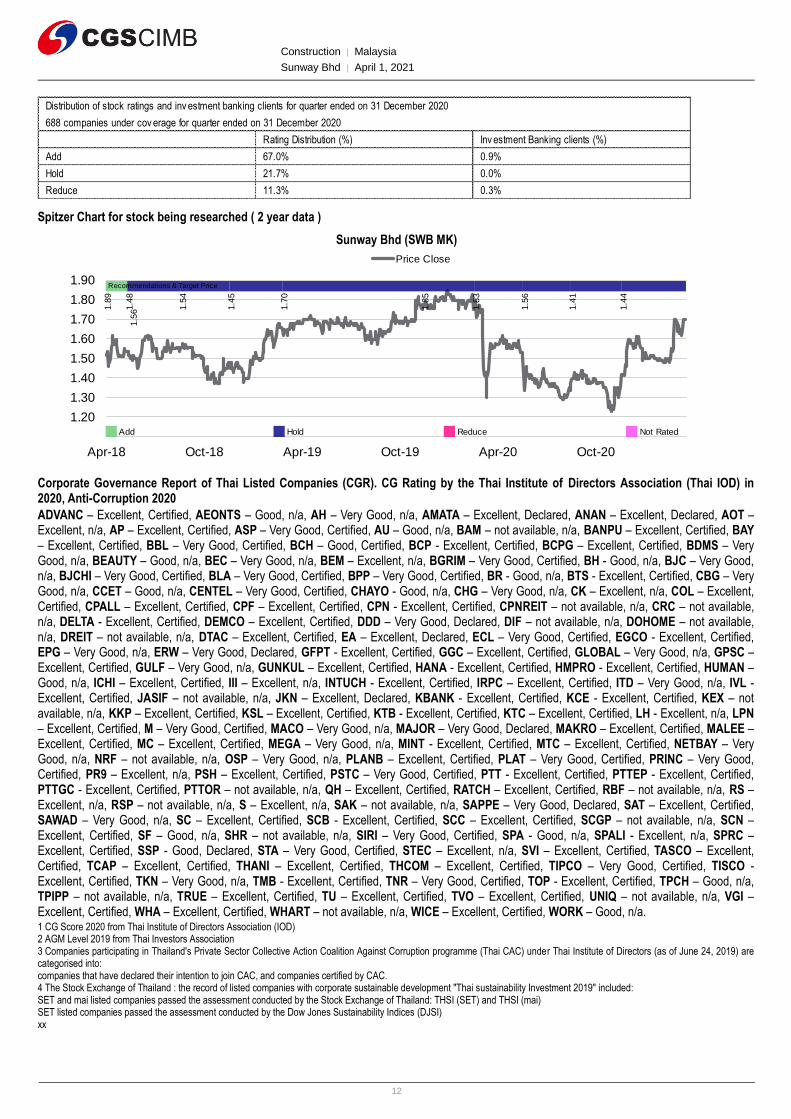
Spitzer Chart for stock being researched ( 2 year data )
Sunway Bhd (SWB MK)
Corporate Governance Report of Thai Listed Companies (CGR). CG Rating by the Thai Institute of Directors Association (Thai IOD) in 2020, Anti-Corruption 2020
ADVANC – Excellent, Certified, AEONTS – Good, n/a, AH – Very Good, n/a, AMATA – Excellent, Declared, ANAN – Excellent, Declared, AOT – Excellent, n/a, AP – Excellent, Certified, ASP – Very Good, Certified, AU – Good, n/a, BAM – not available, n/a, BANPU – Excellent, Certified, BAY – Excellent, Certified, BBL – Very Good, Certified, BCH – Good, Certified, BCP - Excellent, Certified, BCPG – Excellent, Certified, BDMS – Very Good, n/a, BEAUTY – Good, n/a, BEC – Very Good, n/a, BEM – Excellent, n/a, BGRIM – Very Good, Certified, BH - Good, n/a, BJC – Very Good, n/a, BJCHI – Very Good, Certified, BLA – Very Good, Certified, BPP – Very Good, Certified, BR - Good, n/a, BTS - Excellent, Certified, CBG – Very Good, n/a, CCET – Good, n/a, CENTEL – Very Good, Certified, CHAYO - Good, n/a, CHG – Very Good, n/a, CK – Excellent, n/a, COL – Excellent, Certified, CPALL – Excellent, Certified, CPF – Excellent, Certified, CPN - Excellent, Certified, CPNREIT – not available, n/a, CRC – not available, n/a, DELTA - Excellent, Certified, DEMCO – Excellent, Certified, DDD – Very Good, Declared, DIF – not available, n/a, DOHOME – not available, n/a, DREIT – not available, n/a, DTAC – Excellent, Certified, EA – Excellent, Declared, ECL – Very Good, Certified, EGCO - Excellent, Certified, EPG – Very Good, n/a, ERW – Very Good, Declared, GFPT - Excellent, Certified, GGC – Excellent, Certified, GLOBAL – Very Good, n/a, GPSC – Excellent, Certified, GULF – Very Good, n/a, GUNKUL – Excellent, Certified, HANA - Excellent, Certified, HMPRO - Excellent, Certified, HUMAN – Good, n/a, ICHI – Excellent, Certified, III – Excellent, n/a, INTUCH - Excellent, Certified, IRPC – Excellent, Certified, ITD – Very Good, n/a, IVL - Excellent, Certified, JASIF – not available, n/a, JKN – Excellent, Declared, KBANK - Excellent, Certified, KCE - Excellent, Certified, KEX – not available, n/a, KKP – Excellent, Certified, KSL – Excellent, Certified, KTB - Excellent, Certified, KTC – Excellent, Certified, LH - Excellent, n/a, LPN – Excellent, Certified, M – Very Good, Certified, MACO – Very Good, n/a, MAJOR – Very Good, Declared, MAKRO – Excellent, Certified, MALEE – Excellent, Certified, MC – Excellent, Certified, MEGA – Very Good, n/a, MINT - Excellent, Certified, MTC – Excellent, Certified, NETBAY – Very Good, n/a, NRF – not available, n/a, OSP – Very Good, n/a, PLANB – Excellent, Certified, PLAT – Very Good, Certified, PRINC – Very Good, Certified, PR9 – Excellent, n/a, PSH – Excellent, Certified, PSTC – Very Good, Certified, PTT - Excellent, Certified, PTTEP - Excellent, Certified, PTTGC - Excellent, Certified, PTTOR – not available, n/a, QH – Excellent, Certified, RATCH – Excellent, Certified, RBF – not available, n/a, RS – Excellent, n/a, RSP – not available, n/a, S – Excellent, n/a, SAK – not available, n/a, SAPPE – Very Good, Declared, SAT – Excellent, Certified, SAWAD – Very Good, n/a, SC – Excellent, Certified, SCB - Excellent, Certified, SCC – Excellent, Certified, SCGP – not available, n/a, SCN – Excellent, Certified, SF – Good, n/a, SHR – not available, n/a, SIRI – Very Good, Certified, SPA - Good, n/a, SPALI - Excellent, n/a, SPRC – Excellent, Certified, SSP - Good, Declared, STA – Very Good, Certified, STEC – Excellent, n/a, SVI – Excellent, Certified, TASCO – Excellent, Certified, TCAP – Excellent, Certified, THANI – Excellent, Certified, THCOM – Excellent, Certified, TIPCO – Very Good, Certified, TISCO - Excellent, Certified, TKN – Very Good, n/a, TMB - Excellent, Certified, TNR – Very Good, Certified, TOP - Excellent, Certified, TPCH – Good, n/a, TPIPP – not available, n/a, TRUE – Excellent, Certified, TU – Excellent, Certified, TVO – Excellent, Certified, UNIQ – not available, n/a, VGI – Excellent, Certified, WHA – Excellent, Certified, WHART – not available, n/a, WICE – Excellent, Certified, WORK – Good, n/a. 1 CG Score 2020 from Thai Institute of Directors Association (IOD) 2 AGM Level 2019 from Thai Investors Association 3 Companies participating in Thailand's Private Sector Collective Action Coalition Against Corruption programme (Thai CAC) under Thai Institute of Directors (as of June 24, 2019) are categorised into: companies that have declared their intention to join CAC, and companies certified by CAC. 4 The Stock Exchange of Thailand : the record of listed companies with corporate sustainable development "Thai sustainability Investment 2019" included: SET and mai listed companies passed the assessment conducted by the Stock Exchange of Thailand: THSI (SET) and THSI (mai) SET listed companies passed the assessment conducted by the Dow Jones Sustainability Indices (DJSI) xx
Rating Distribution (%) Inv estment Banking clients (%)
Add 67.0% 0.9%
Hold 21.7% 0.0%
Reduce 11.3% 0.3%
Distribution of stock ratings and inv estment banking clients for quarter ended on 31 December 2020
688 companies under cov erage for quarter ended on 31 December 2020
1.10
1.20
1.30
1.40
1.50
1.60
1.70
1.80
1.90
Apr-18 Oct-18 Apr-19 Oct-19 Apr-20 Oct-20
Price Close
1.8
9
1.4
8
1.5
6 1.5
4
1.4
5
1.7
0
1.8
5
1.8
3
1.5
6
1.4
1
1.4
4
Recommendations & Target Price
Add Hold Reduce Not Rated
Construction │ Malaysia
Sunway Bhd │ April 1, 2021
13
Recommendation Framework
Stock Ratings Definition:
Add The stock’s total return is expected to exceed 10% over the next 12 months.
Hold The stock’s total return is expected to be between 0% and positive 10% over the next 12 months.
Reduce The stock’s total return is expected to fall below 0% or more over the next 12 months.
The total expected return of a stock is defined as the sum of the: (i) percentage difference between the target price and the current price and (ii) the forward net dividend yields of the stock. Stock price targets have an investment horizon of 12 months.
Sector Ratings Definition:
Overweight An Overweight rating means stocks in the sector have, on a market cap-weighted basis, a positive absolute recommendation.
Neutral A Neutral rating means stocks in the sector have, on a market cap-weighted basis, a neutral absolute recommendation.
Underweight An Underweight rating means stocks in the sector have, on a market cap-weighted basis, a negative absolute recommendation.
Country Ratings Definition:
Overweight An Overweight rating means investors should be positioned with an above-market weight in this country relative to benchmark.
Neutral A Neutral rating means investors should be positioned with a neutral weight in this country relative to benchmark.
Underweight An Underweight rating means investors should be positioned with a below-market weight in this country relative to benchmark.
#01c
Insert Insert