holdsportpresentation 6may13 final final 2013 results_analyst... · page 2 analyst presentation -...
TRANSCRIPT
Analyst Presentationfor the year ended 28 February 2013

Analyst Presentation - 16 May 2013Page 2
Agenda
1. General commentary on the period – Kevin Hodgson
2. Financial review – Cobus Loubser
3. Questions

Analyst Presentation - 16 May 2013Page 3
General Commentary
Analyst Presentation - 16 May 2013Page 4
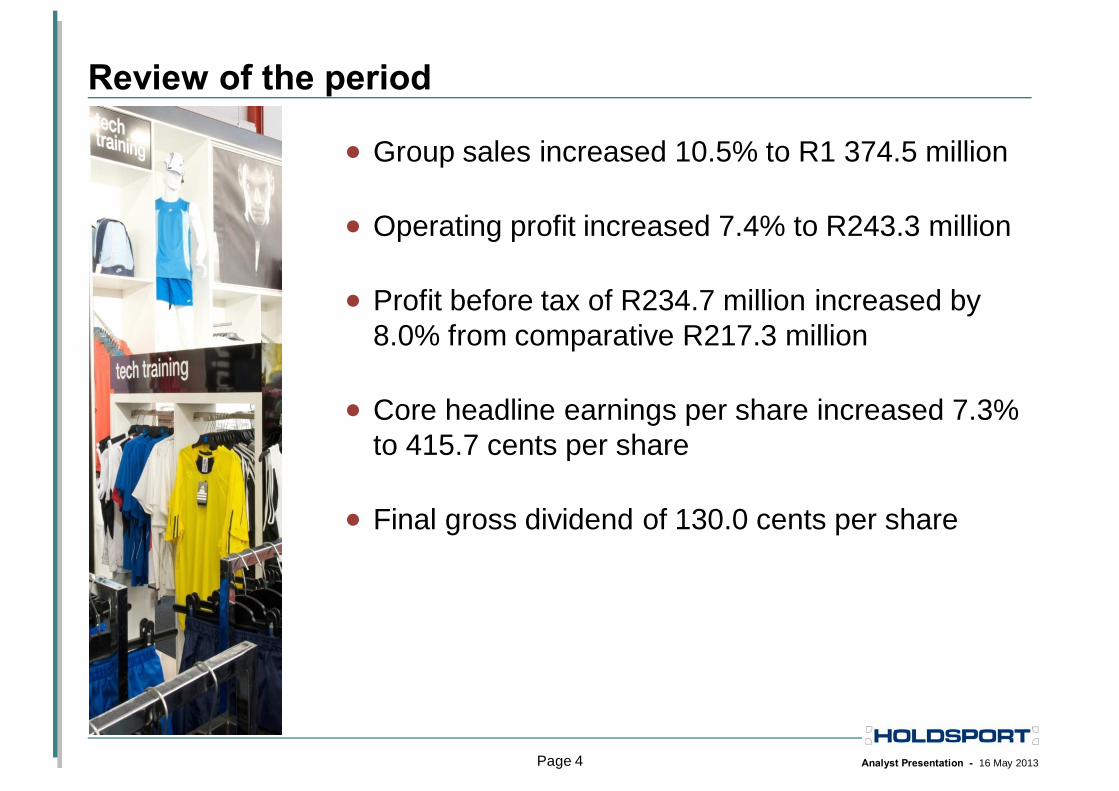
Review of the period
• Group sales increased 10.5% to R1 374.5 million
• Operating profit increased 7.4% to R243.3 million
• Profit before tax of R234.7 million increased by 8.0% from comparative R217.3 million
• Core headline earnings per share increased 7.3% to 415.7 cents per share
• Final gross dividend of 130.0 cents per share

Analyst Presentation - 16 May 2013Page 5
Review of the period• Sportsmans Warehouse
- sales increased by 11.4% (9.3% like-for-like) - increased operating profit by 7.0% from last year- launched online sales
• Outdoor Warehouse- 7.4% increase in sales (5.2% like-for-like)- operating profit 2.4% lower than last year
• Performance Brands- 11.9% growth in sales to external customers- Capestorm relaunched- increased operating profit by 12.7% from last year
• Expansion- Three new stores- One expansion and a relocation
Analyst Presentation - 16 May 2013Page 6
Financial Review

Analyst Presentation - 16 May 2013Page 7
Financial highlights• Satisfactory growth in sales
• Forex losses reduce gross margin and operating profit- The accounting treatment of foreign exchange denominated
transactions coupled with the volatile Rand/Dollar exchange rate results in a non-cash income or expense at the end of every reporting period which is partly included in cost of sales and partly recognised as foreign exchange gains or losses within trading expenses.
- During the current year the aggregate adjustment was an expense of R1.8 million compared to an aggregate profit of R6.1 million during the prior year. The majority of the adjustment is included in cost of sales.
- Core headline earnings excluding foreign exchange adjustments increased by 11.0%
• Capital expenditure
• Gross final dividend declared of 130.0 cents

Analyst Presentation - 16 May 2013Page 8
Income Statement review
• Achieved real sales growth, sales price inflation still low
• Gross profit margin reduced to 47.8% from 48.6% in the previous year mainly due to foreign exchange adjustments included in cost of sales.
• Trading expenses higher due to additional trading space and increased staff costs
• Net finance cost lower in line with repayments of term debt.
Year ended on 28 February
2013
Year ended on 29 February 2012
Audited Audited Change
R’000 R’000 %
Sales 1,374,531 1,243,539 10.5
Cost of sales (717,971) (638,807) 12.4
Gross profit 656,560 604,732 8.6
Other income 3,667 5,094 (28.0)
Trading expenses (416,937) (383,395) 8.7
Operating profit 243,290 226,431 7.4
Finance income 3,104 3,773 (17.7)
Finance cost (11,652) (12,945) (10.0)
Profit before taxation 234,742 217,259 8.0
Taxation (66,226) (63,564) 4.2
Profit for the period and total comprehensive income for the period attributable to equity holders of the company 168,516 153,695 9.6

Analyst Presentation - 16 May 2013Page 9
Sales
• The prior year was a challenging base for comparison
• Total sales increased by 10.5%- Total retail sales increased by 10.4% - Like for like retail sales increased by 8.3%- Performance Brands external sales increased by 11.9% and greater portion of total sales
• Sales mix broadly consistent with last year
• Performance Brands - expanding ranges helped to increase proportion of sales - relaunched Capestorm in the second half of this year
February
2013February
2012 Change
Like-for-like Store
Growth
Sales by segmentFeb '13
Sales by segmentFeb '12
R’m R’m % % % %
Sportsmans Warehouse 999.0 896.0 11.4% 9.3% 72.7% 72.1%
Outdoor Warehouse 322.3 299.9 7.4% 5.2% 23.4% 24.1%
Retail sales 1,321.3 1,195.9 10.4% 8.3% 96.1% 96.2%
Performance Brands 53.2 47.6 11.9% 3.9% 3.8%
Total sales 1,374.5 1,243.5 10.5% 100.0% 100.0%

Analyst Presentation - 16 May 2013Page 10
Sales
• Price inflation of 2.9% (2012: 0.6% inflation)
• Weighted space growth of 3.7%
2009 2010 2011 2012 2013
Increase in retail sales (%)Sportsmans Warehouse 6.0 9.7 10.5 9.2 11.4 Outdoor Warehouse 11.1 8.1 14.8 7.3 7.4 Total 7.2 9.3 11.6 8.7 10.4
Like-for-like sales increase (%)
Sportsmans Warehouse 0.5 6.5 10.8 7.5 9.3 Outdoor Warehouse 2.3 4.1 16.1 3.7 5.2 Total 0.9 5.9 12.1 6.6 8.3

Analyst Presentation - 16 May 2013Page 11
Growth in stores & trading density
• Expanded Sportsmans Warehouse in Fourways and relocated the Sportsmans Warehouse in Polokwane
• Added two new Sportsmans Warehouse stores and one Outdoor Warehouse store
• Strong performance from apparel
2009 2010 2011 2012 2013Change
%
Number of storesSportsmans Warehouse 32 32 32 33 35 Outdoor Warehouse 17 18 17 18 19 Total 49 50 49 51 54
Trading density (R'000s per m2)
Sportsmans Warehouse 13.6 14.3 15.8 16.9 18.0 6.5%Outdoor Warehouse 15.5 15.8 18.1 18.9 19.7 4.2%Total 14.0 14.7 16.4 17.4 18.4 5.7%

Analyst Presentation - 16 May 2013Page 12
Expenses
• Total expenses increased by 8.7% on prior year due to increased trading space and strategic increases in the number of professional staff.
• Occupancy costs benefited from various electrical savings initiatives.
• Depreciation calculated over 4 years.
• Advertising costs increased to support specific merchandise strategies and the launch of online sales
• The group recorded R0.5m of foreign exchange gains in the period compared to foreign exchange profits of R1.4m in the previous year.
• Other operating costs include banking costs (which are linked to sales), security, IT, telephones, insurance, cleaning and maintenance.
28 February 2013
29 February 2012
Audited Audited Change
R’000 % R’000 % % %
Staff costs 159,888 11.6 145,796 11.7 9.7 8.4
Occupancy cost 113,791 8.3 103,706 8.3 9.7 6.5
Straightlining of leases 2,480 0.2 2,812 0.2 (11.8) (11.7)
Depreciation 25,110 1.8 22,617 1.8 11.0 7.2
Amortisation of intangibles 12,963 0.9 12,554 1.0 3.3 3.3
Advertising costs 20,818 1.5 17,441 1.4 19.4 19.4
Foreign exchange gains (461) (0.0) (1,422) (0.1) (67.6) (67.5)
Exceptional expenses - - 3,130 0.3 (100.0) (100.0)
Other operating costs 82,348 6.0 76,761 6.2 7.3 5.4
416,937 30.3 383,395 30.8 8.7 6.9
Ratio to turnover
Ratio to turnover
Like-for-like
change

Analyst Presentation - 16 May 2013Page 13
Staff costs
• The ratio of staff costs to sales decreased to 11.6% from 11.7% as a result of lower incentives than last year
• The like-for-like increase in staff costs exclude stores opened since March 2012
• The forfeitable share plan expense is calculated in terms of IAS 2 – Share based payments over the full year compared to less than eight months in the prior period following the first award of shares in July 2011. Further shares were awarded in August 2012.
28 February 2013
29 February 2012
Audited Audited Change
R’000 % R’000 % % %
Salaries & Wages 143,455 10.4 127,393 10.2 12.6 11.5
Incentives 11,534 0.8 16,273 1.3 (29.1) (29.5)
Staff costs before share plan expense 154,990 11.3 143,666 11.6 7.9 6.2
Forfeitable share plan expense 4,898 0.4 2,130 0.2 130.0 130.0
Total staff costs 159,888 11.6 145,796 11.7 9.7 8.4
Ratio to turnover
Ratio to turnover
Like-for-like Store
Growth
Analyst Presentation - 16 May 2013Page 14
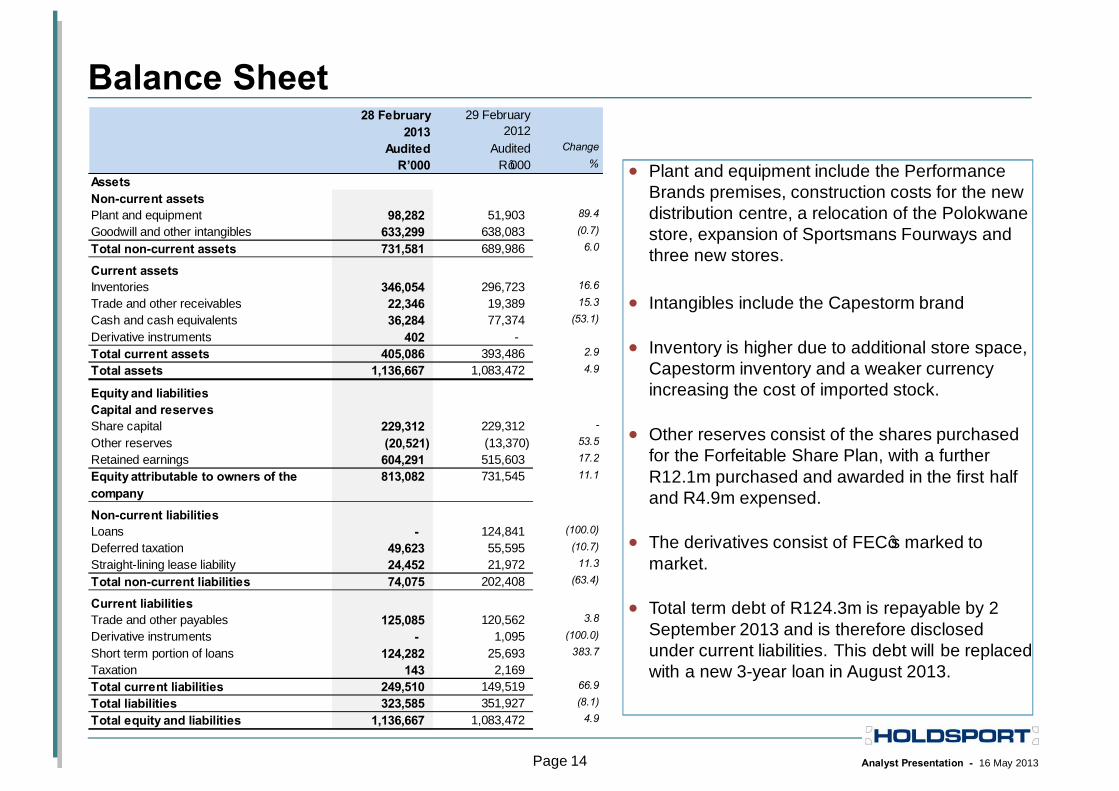
Balance Sheet
• Plant and equipment include the Performance Brands premises, construction costs for the new distribution centre, a relocation of the Polokwanestore, expansion of Sportsmans Fourways and three new stores.
• Intangibles include the Capestorm brand
• Inventory is higher due to additional store space, Capestorm inventory and a weaker currency increasing the cost of imported stock.
• Other reserves consist of the shares purchased for the Forfeitable Share Plan, with a further R12.1m purchased and awarded in the first half and R4.9m expensed.
• The derivatives consist of FEC’s marked to market.
• Total term debt of R124.3m is repayable by 2 September 2013 and is therefore disclosed under current liabilities. This debt will be replaced with a new 3-year loan in August 2013.
28 February 2013
29 February 2012
Audited Audited Change
R’000 R’000 %
AssetsNon-current assetsPlant and equipment 98,282 51,903 89.4
Goodwill and other intangibles 633,299 638,083 (0.7)
Total non-current assets 731,581 689,986 6.0
Current assetsInventories 346,054 296,723 16.6
Trade and other receivables 22,346 19,389 15.3
Cash and cash equivalents 36,284 77,374 (53.1)
Derivative instruments 402 - Total current assets 405,086 393,486 2.9
Total assets 1,136,667 1,083,472 4.9
Equity and liabilitiesCapital and reservesShare capital 229,312 229,312 -
Other reserves (20,521) (13,370) 53.5
Retained earnings 604,291 515,603 17.2
Equity attributable to owners of the company
813,082 731,545 11.1
Non-current liabilitiesLoans - 124,841 (100.0)
Deferred taxation 49,623 55,595 (10.7)
Straight-lining lease liability 24,452 21,972 11.3
Total non-current liabilities 74,075 202,408 (63.4)
Current liabilitiesTrade and other payables 125,085 120,562 3.8
Derivative instruments - 1,095 (100.0)
Short term portion of loans 124,282 25,693 383.7
Taxation 143 2,169 Total current liabilities 249,510 149,519 66.9
Total liabilities 323,585 351,927 (8.1)
Total equity and liabilities 1,136,667 1,083,472 4.9

Analyst Presentation - 16 May 2013Page 15
Working Capital
• Net investment in working capital increased due to higher stockholdings:- Gross store space increased by 7.3%- Performance Brands acquired Capestorm stock - Weaker currency lead to a 12.3% increase in the average USD exchange rate on imports for the year- Inventory increased in line with growth in sales
28 February 2013
29 February 2012
31 August 2012
Audited Audited Change Unaudited Change
R’000 R’000 % R’000 %
Working capitalInventories 346,054 296,723 17% 323,852 7%
Trade and other receivables 22,346 19,389 15% 17,248 30%
Trade and other payables (125,085) (120,562) 4% (91,762) 36%
243,315 195,550 24% 249,338 -2%
Analyst Presentation - 16 May 2013Page 16
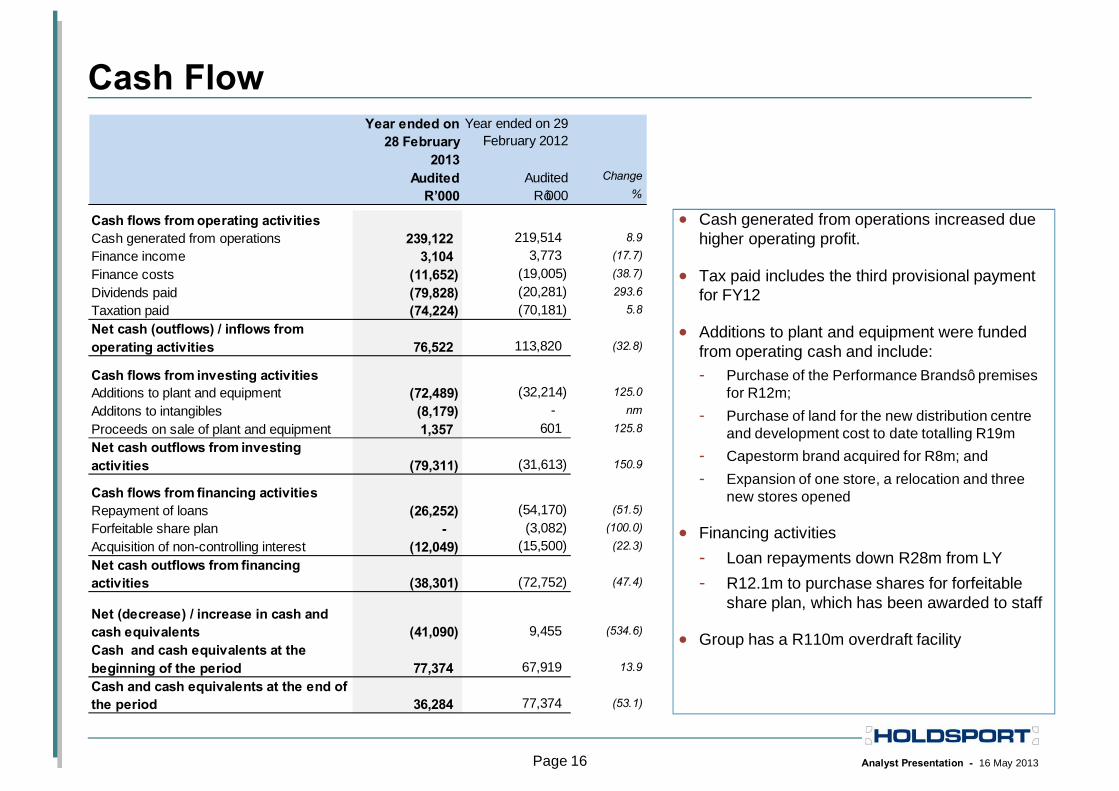
Cash Flow
• Cash generated from operations increased due higher operating profit.
• Tax paid includes the third provisional payment for FY12
• Additions to plant and equipment were funded from operating cash and include: - Purchase of the Performance Brands’ premises
for R12m; - Purchase of land for the new distribution centre
and development cost to date totalling R19m- Capestorm brand acquired for R8m; and- Expansion of one store, a relocation and three
new stores opened
• Financing activities- Loan repayments down R28m from LY- R12.1m to purchase shares for forfeitable
share plan, which has been awarded to staff
• Group has a R110m overdraft facility
Year ended on 28 February
2013
Year ended on 29 February 2012
Audited Audited Change
R’000 R’000 %
Cash flows from operating activitiesCash generated from operations 239,122 219,514 8.9
Finance income 3,104 3,773 (17.7)
Finance costs (11,652) (19,005) (38.7)
Dividends paid (79,828) (20,281) 293.6
Taxation paid (74,224) (70,181) 5.8
Net cash (outflows) / inflows from operating activities 76,522 113,820 (32.8)
Cash flows from investing activitiesAdditions to plant and equipment (72,489) (32,214) 125.0
Additons to intangibles (8,179) - nm
Proceeds on sale of plant and equipment 1,357 601 125.8
Net cash outflows from investing activities (79,311) (31,613) 150.9
Cash flows from financing activitiesRepayment of loans (26,252) (54,170) (51.5)
Forfeitable share plan - (3,082) (100.0)
Acquisition of non-controlling interest (12,049) (15,500) (22.3)
Net cash outflows from financing activities (38,301) (72,752) (47.4)
Net (decrease) / increase in cash and cash equivalents (41,090) 9,455 (534.6)
Cash and cash equivalents at the beginning of the period 77,374 67,919 13.9
Cash and cash equivalents at the end of the period 36,284 77,374 (53.1)

Analyst Presentation - 16 May 2013
Investing for the future
Page 17

Analyst Presentation - 16 May 2013Page 18
Investing for the future – Distribution
• Retail Distribution Centre- 50:50 joint venture with Redefine Properties - Purchase land in Philippi, Cape Town - Commenced with construction in November 2012- New 11 000m2 distribution facility on track to be completed in July 2013
• Performance Brands - Acquired current warehouse for R12m - Will construct additional warehouse space of 1 500m2 on adjacent plot- Plans approved and construction to be completed by 31 October 2013
• Incurred R31m in 2013 and further R43m in next financial year on the two warehouse projects.
• Capex funded from operational cash flows in 2013
• Investment in distribution reduced the return on net assets from 103.3% to 82.6%
Analyst Presentation - 16 May 2013Page 19
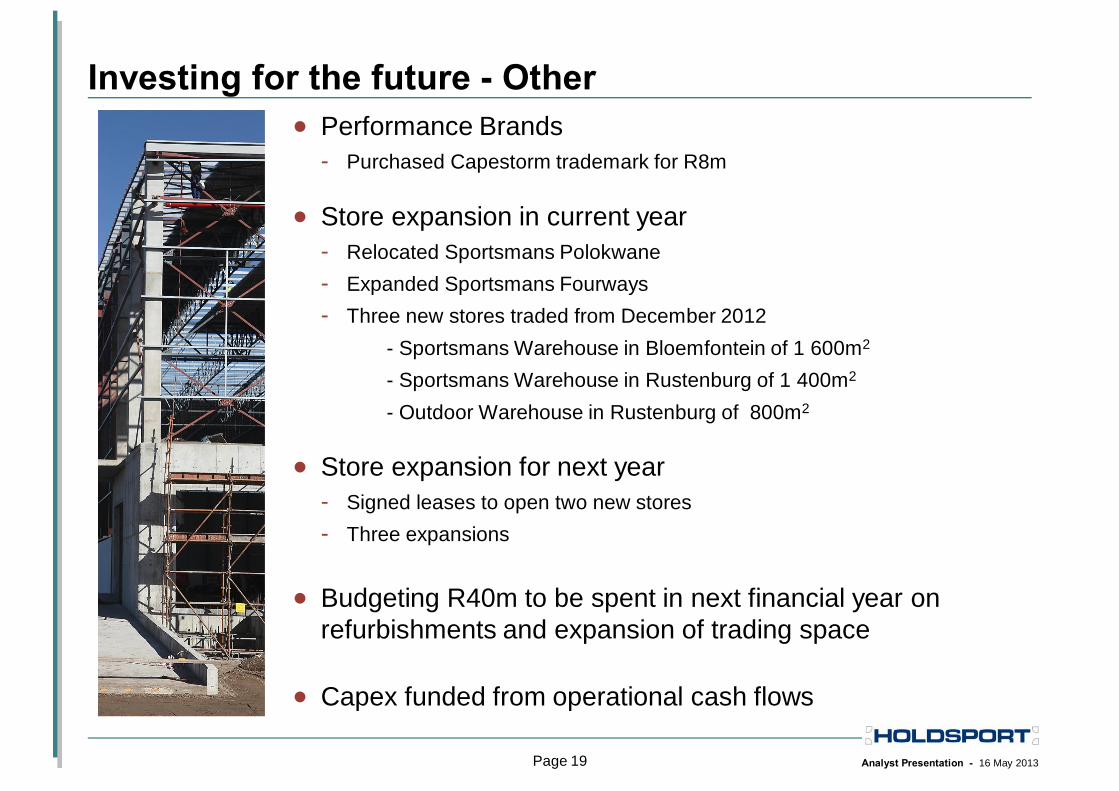
Investing for the future - Other• Performance Brands
- Purchased Capestorm trademark for R8m
• Store expansion in current year- Relocated Sportsmans Polokwane- Expanded Sportsmans Fourways- Three new stores traded from December 2012
- Sportsmans Warehouse in Bloemfontein of 1 600m2
- Sportsmans Warehouse in Rustenburg of 1 400m2
- Outdoor Warehouse in Rustenburg of 800m2
• Store expansion for next year- Signed leases to open two new stores - Three expansions
• Budgeting R40m to be spent in next financial year on refurbishments and expansion of trading space
• Capex funded from operational cash flows

Analyst Presentation - 16 May 2013Page 20
Dividend
• Final gross dividend of 130.0 cents per share to be paid on 10 June 2013
• The group’s dividend policy is to have dividends covered approximately twice by core headline earnings.
• The total gross dividend for the year of 200 cents is 2.1 times covered.
2013cents per
share
2012cents per
shareIncrease
%
Interim 70.0 47.0 48.9 Final 130.0 115.0 13.0 Total 200.0 162.0 23.4
Dividend cover 2.1 2.4

Analyst Presentation - 16 May 2013Page 21
In closing...
• Group sales increased 10.5% to R1 374.5 million
• Profit before tax of R234.7 million increased by 8.0% from comparative R217.3 million
• Core headline earnings per share increased 7.3% to 415.7 cents
• Cash flow from operating activities funded capital expenditure
• Final gross dividend of 130.0 cents per share
Analyst Presentation - 16 May 2013Page 22
Questions?

Thank you!
Investor Relationswww.holdsport.co.zaCobus Loubser (Chief Financial Officer)Tel: +27 21 464 5366E-mail: [email protected]
Analyst Presentation - 16 May 2013Page 24
DisclaimerThis presentation contains certain forward-looking statements withrespect to the financial condition and results of operations of HoldsportLimited and its subsidiaries, which by their nature involve risk anduncertainty because they relate to events and depend on circumstancesthat may occur in the future.