holiday destinations: understanding the travel choices of irish tourists
TRANSCRIPT
lable at ScienceDirect
Tourism Management 30 (2009) 683–692
Contents lists avai
Tourism Management
journal homepage: www.elsevier .com/locate/ tourman
Holiday destinations: Understanding the travel choices of Irish tourists
Sean Lyons a,*, Karen Mayor a, Richard S.J. Tol a,b,c,d
a Economic and Social Research Institute, Whitaker Square, Sir John Rogerson’s Quay, Dublin 2, Irelandb Institute for Environmental Studies, Vrije Universiteit, Amsterdam, The Netherlandsc Department of Spatial Economics, Vrije Universiteit, Amsterdam, The Netherlandsd Department of Engineering and Public Policy, Carnegie Mellon University, Pittsburgh, PA, USA
a r t i c l e i n f o
Article history:Received 25 September 2007Accepted 27 October 2008
JEL classification:D12L83
Keywords:International tourismIrelandDemand modelling
* Corresponding author. Tel.: þ353 1 8632019; fax:E-mail addresses: [email protected] (S. Lyons), kar
[email protected] (R.S.J. Tol).
0261-5177/$ – see front matter � 2008 Elsevier Ltd.doi:10.1016/j.tourman.2008.10.024
a b s t r a c t
This paper uses a McFadden choice model to measure the importance of destination, household andseasonal characteristics to the tourism destination choices of Irish households. The analysis is based onquarterly survey data of Irish households’ travel destinations between 2000 and 2006. In total, some55,000 holiday trips were observed. Destination characteristics such as temperature, GDP and coastlineare found to positively influence choice probabilities, while population density and distance havea negative effect on choice. Household-specific characteristics such as the number of children and peopleover 60 in a household are found to be important. We also identify differences in preferences acrossseasons and a change over time of the effect of destination country GDP on Irish holiday destinationchoices.
� 2008 Elsevier Ltd. All rights reserved.
1. Introduction
Economic prosperity and a substantial rise in disposableincomes in Ireland, alongside the advent of low-cost carriers suchas Ryanair, have meant that foreign holidays are no longerconsidered a luxury and many households go on more than one tripabroad in a year. Between January and March 2007, the number oftrips made by Irish people abroad outstripped the number of visitsby foreign tourists in Ireland for the first time. This represents a 17%growth in trips abroad compared to the corresponding period in2006 (Central Statistics Office, 2007). Irish consumers havechanged their travel patterns in recent years, but what attractsthem to international destinations? This paper examines the vari-ables that influence consumers’ choices when picking a holidaydestination.
The literature on tourism and destination choice is wide-ranging. Witt and Witt (1995) survey the earlier literature, whileSong and Li (2008) focus on recent studies. Crouch (1994) conductsa meta-analysis examining international tourism demand. Over 85empirical studies are included, and the effects of factors deemed to
þ353 1 [email protected] (K. Mayor),
All rights reserved.
influence tourism demand, namely income, prices, marketing andtrends and fashion, are compared. Lim (1999) follows the samemethodology and looks at the effects of income, transportationcosts and tourism prices. She finds that a high proportion of allstudies support the hypothesis that tourism demand is positivelyrelated to income and negatively related to prices.
Although prices and income are considered significant factorsaffecting the decision to travel, other non-monetary factors, such asthose detailed in this paper, can also be important. O’Hagan andHarrison (1984) found non-economic factors to be highly signifi-cant in their study of US travel to Europe. The effects of non-economic variables have also been highlighted in a number of otherstudies as detailed by Crouch (1994).
The empirical analysis in this paper differs from most of theliterature in three main ways. First, most studies rely on aggregatedata (e.g., Bigano et al., 2006) as it is easier to collect and to handleeconometrically, whereas we use micro-data of tourists from aparticular country of origin. Use of aggregate data assumes thatbroad regularities about tourists’ behaviour can be inferred andleads to results for a ‘representative tourist’. Although this ishelpful from a macroeconomic perspective, the use of micro-datacomplements this approach by differentiating results by type oftourist and tourist-specific characteristics. The results below showthat there is no single ‘representative tourist’, at least not fromIreland.
1 For example, shifting from domestic tourism to international trips would tendto involve a significant increase in emissions of greenhouse gases by Irish residents.Depending upon the treatment of international travel under multilateral climatechange treaties, these extra emissions could lead to higher mitigation costs for theIrish economy.
S. Lyons et al. / Tourism Management 30 (2009) 683–692684
The second difference between this study and most others isthat we examine a set of tourists from a particular country of origin.The more typical approach is to focus on tourists visiting a partic-ular destination or a limited number of destinations that are closecompetitors. This is understandable from a policy perspective; forexample, Irish policy-makers care about the number of visitors toIreland, not about where the Irish spend their holidays. The numberof Irish tourists abroad is too small to have much effect on mostdestinations. However, the holiday purchase decision involvesa choice among destinations, so we can only understand compe-tition between destinations by looking at the full range of choicesavailable to a tourist.
Finally, although previous studies have examined the relation-ship between country-specific characteristics and destinationchoice (see Lise and Tol (2002) and Maddison (2001) below), to ourknowledge no such study has been conducted on a country overa time period of very strong economic growth. Indeed, Irish growthover the period examined brought the country’s national income toapproximate parity with other western countries. We are inter-ested in examining whether choice characteristics have evolvedsignificantly during this macroeconomic transition.
We are not the first to look at origin-based tourist micro-data,but many such studies take a more qualitative approach than ours.Zhang et al. (2004) is a typical example. They focus on statedpreferences for certain destination characteristics. A few studies aremore similar to ours and focus on revealed preferences. Maddison(2001) looks at the impact of climate change on internationaltourism and welfare. He uses a pooled travel cost model (PTCM)and data from the 1994 UK International Passenger Survey as wellas climate variables to determine the reaction of British tourists tochanges in destination characteristics because of climate change.He finds that low-cost destinations favoured by British touristsbecome more attractive from a climate perspective, which resultsin welfare gains for the tourists. Lise and Tol (2002) use a similarPTCM on data on Dutch tourists and compare their results to thoseof Maddison (2001). They find that certain characteristics that wereimportant decision factors for British tourists, such as populationdensity and temperature at the destination, are not important forDutch tourists (who favour long-distance holidays). They also lookat the effect of non-monetary variables such as length of coast andthe country’s surface area. Lise and Tol (2002) also show that Dutchtourists are not homogenous. Hamilton et al. (2005) confirm this fortourists from Germany.
The studies mentioned above use OLS estimation, whereas weuse a multinomial logit model (MNL). This type of estimator isbetter suited to examination of discrete choice models than OLS,because such models tend to violate the OLS assumptions as to thedistribution of residuals. Examples of papers using an MNL modelin the travel/tourism literature include Correia et al. (2007) who usea mixed logit model to determine what affects the decision ofPortuguese tourists travelling to Latin America, taking into accounttourist awareness and destination characteristics, and Nicolau andMas (2006) who focus on the motivations of Spanish tourists. Usinga series of random coefficient multinomial logit models, theyattempt to capture what motivates individuals to go on holiday.Motivations such as the ‘‘search for relaxation and a good climate’’,‘‘broaden culture and discover new places’’ and ‘‘visiting family andfriends’’ are interacted with attributes of the destinations them-selves, such as distance and prices. They find that the effects of thelatter on choice could be moderated by a person’s motivation to goon a holiday. Nicolau and Mas (2006) focus on the type of holiday,whereas we look at the different characteristics of the holidaydestination.
The present study explores tourism from the perspective of theIrish tourist, studying the factors that influence destination choice.
We pay particular attention to variation between tourists andvariations over time. Thus, key questions include:
� What destination characteristics do Irish residents respond towhen choosing their holiday destinations?� What groups of people go on particular types of holidays, i.e.
are there individual- or group-specific characteristics thatdetermine destination choice for Irish tourists?� Do these relationships vary by the time of year a trip is taken?� How have these relationships evolved between 2000 and 2006,
a period characterised by rapid economic growth?
Considering the size and growth of the tourism industry, thetravel patterns of Irish tourists could affect Ireland’s climate changepolicies and have important implications for Ireland from aneconomic perspective.1 Accordingly we test a number of hypoth-eses set out in the papers cited above to see whether they hold forIrish tourists. These hypotheses are detailed in Table 1 below.
First, we check Irish tourists’ responses to climatic and scenicvariables such as temperature, rainfall, and length of coastlines,which cover hypotheses 1 and 2. Other characteristics of thedestination country such as population density, cultural heritage,political stability, poverty levels and distance from the origincountry will also be examined and related to hypotheses 3–7. Thesecond part of the paper focuses on the characteristics of thetourists themselves. Questions addressed in this section includewhether the ages of those in the travelling party affects destinationchoice (Hypothesis 8). In the final section of the analysis we look atthe effect of season and year-specific changes on preferences(Hypotheses 9 and 10).
The remainder of this paper is set out as follows. Section 2presents the methodology used in the analysis and the econometricissues underlying the model applied. Section 3 describes the dataused in the study. Section 4 presents the results of a conditionallogit model of the destination choices of Irish tourists. When pre-senting the results, we distinguish between destination charac-teristics and characteristics of the groups of persons travelling.Samples varying by quarter and year-specific coefficients areexamined to check the stability of preferences across seasons andtime. Finally, Section 5 provides a discussion and conclusions.
2. Methodology
The object of this paper is to quantify the factors affecting Irishtourists when they choose holiday destinations. The analysis isrestricted to holiday/tourism destination choices: business tripsand trips abroad for the purpose of visiting friends and family arenot included in the analysis. Indeed, the literature shows that travelfor purposes other than holidays is driven by different factors(Gossling and Hall, 2006) and, as a consequence, trips of these typesmade by Irish households were the subject of a separate study(Lyons et al., 2008).
We assume that when a household makes a decision abouta holiday, this decision takes into account a variety of variables andaims to maximise the utility of those that will be travelling.Consequently the analysis is run at trip level as the destinationcharacteristics will vary according to each destination and henceeach trip. Each household then aims to maximise its utility U for
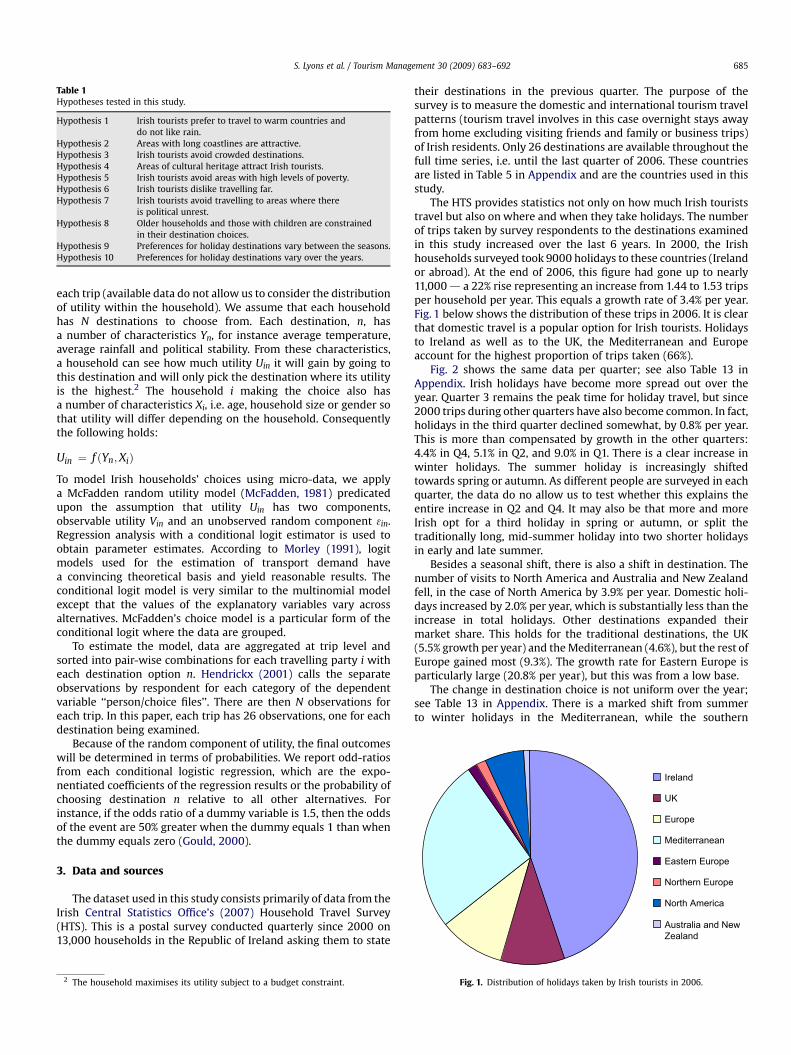
Table 1Hypotheses tested in this study.
Hypothesis 1 Irish tourists prefer to travel to warm countries anddo not like rain.
Hypothesis 2 Areas with long coastlines are attractive.Hypothesis 3 Irish tourists avoid crowded destinations.Hypothesis 4 Areas of cultural heritage attract Irish tourists.Hypothesis 5 Irish tourists avoid areas with high levels of poverty.Hypothesis 6 Irish tourists dislike travelling far.Hypothesis 7 Irish tourists avoid travelling to areas where there
is political unrest.Hypothesis 8 Older households and those with children are constrained
in their destination choices.Hypothesis 9 Preferences for holiday destinations vary between the seasons.Hypothesis 10 Preferences for holiday destinations vary over the years.
Ireland
UK
Europe
Mediterranean
Eastern Europe
Northern Europe
North America
Australia and NewZealand
S. Lyons et al. / Tourism Management 30 (2009) 683–692 685
each trip (available data do not allow us to consider the distributionof utility within the household). We assume that each householdhas N destinations to choose from. Each destination, n, hasa number of characteristics Yn, for instance average temperature,average rainfall and political stability. From these characteristics,a household can see how much utility Uin it will gain by going tothis destination and will only pick the destination where its utilityis the highest.2 The household i making the choice also hasa number of characteristics Xi, i.e. age, household size or gender sothat utility will differ depending on the household. Consequentlythe following holds:
Uin ¼ f ðYn;XiÞ
To model Irish households’ choices using micro-data, we applya McFadden random utility model (McFadden, 1981) predicatedupon the assumption that utility Uin has two components,observable utility Vin and an unobserved random component 3in.Regression analysis with a conditional logit estimator is used toobtain parameter estimates. According to Morley (1991), logitmodels used for the estimation of transport demand havea convincing theoretical basis and yield reasonable results. Theconditional logit model is very similar to the multinomial modelexcept that the values of the explanatory variables vary acrossalternatives. McFadden’s choice model is a particular form of theconditional logit where the data are grouped.
To estimate the model, data are aggregated at trip level andsorted into pair-wise combinations for each travelling party i witheach destination option n. Hendrickx (2001) calls the separateobservations by respondent for each category of the dependentvariable ‘‘person/choice files’’. There are then N observations foreach trip. In this paper, each trip has 26 observations, one for eachdestination being examined.
Because of the random component of utility, the final outcomeswill be determined in terms of probabilities. We report odd-ratiosfrom each conditional logistic regression, which are the expo-nentiated coefficients of the regression results or the probability ofchoosing destination n relative to all other alternatives. Forinstance, if the odds ratio of a dummy variable is 1.5, then the oddsof the event are 50% greater when the dummy equals 1 than whenthe dummy equals zero (Gould, 2000).
3. Data and sources
The dataset used in this study consists primarily of data from theIrish Central Statistics Office’s (2007) Household Travel Survey(HTS). This is a postal survey conducted quarterly since 2000 on13,000 households in the Republic of Ireland asking them to state
2 The household maximises its utility subject to a budget constraint.
their destinations in the previous quarter. The purpose of thesurvey is to measure the domestic and international tourism travelpatterns (tourism travel involves in this case overnight stays awayfrom home excluding visiting friends and family or business trips)of Irish residents. Only 26 destinations are available throughout thefull time series, i.e. until the last quarter of 2006. These countriesare listed in Table 5 in Appendix and are the countries used in thisstudy.
The HTS provides statistics not only on how much Irish touriststravel but also on where and when they take holidays. The numberof trips taken by survey respondents to the destinations examinedin this study increased over the last 6 years. In 2000, the Irishhouseholds surveyed took 9000 holidays to these countries (Irelandor abroad). At the end of 2006, this figure had gone up to nearly11,000 d a 22% rise representing an increase from 1.44 to 1.53 tripsper household per year. This equals a growth rate of 3.4% per year.Fig. 1 below shows the distribution of these trips in 2006. It is clearthat domestic travel is a popular option for Irish tourists. Holidaysto Ireland as well as to the UK, the Mediterranean and Europeaccount for the highest proportion of trips taken (66%).
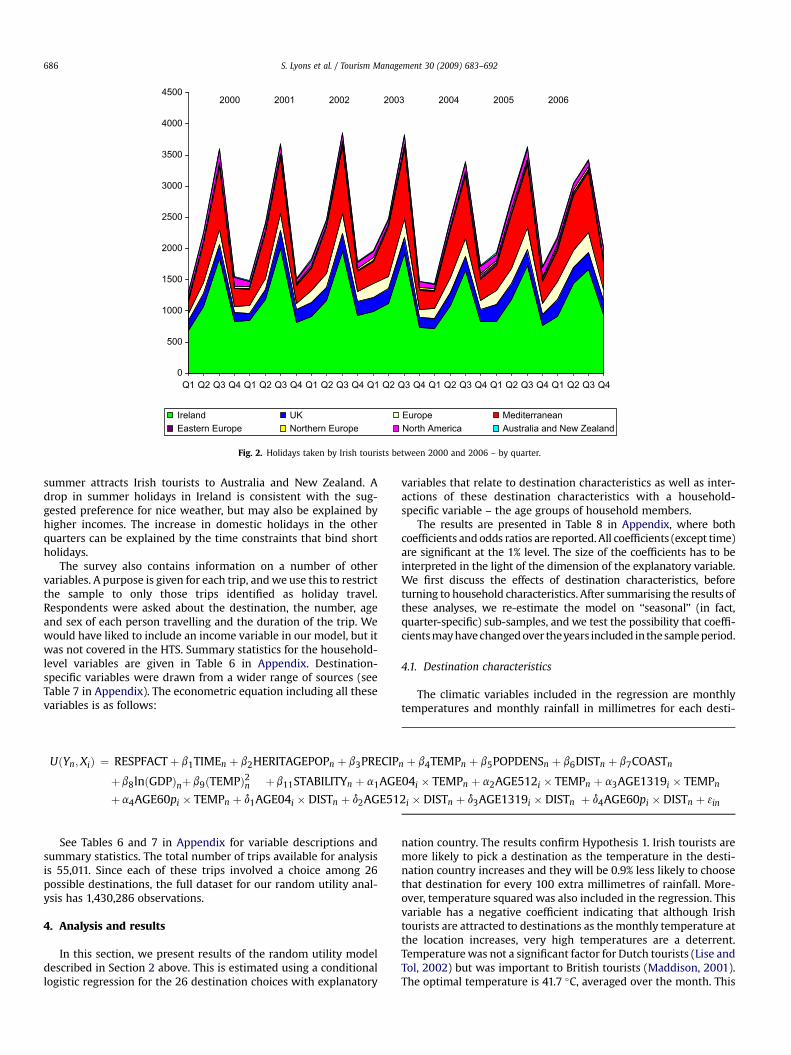
Fig. 2 shows the same data per quarter; see also Table 13 inAppendix. Irish holidays have become more spread out over theyear. Quarter 3 remains the peak time for holiday travel, but since2000 trips during other quarters have also become common. In fact,holidays in the third quarter declined somewhat, by 0.8% per year.This is more than compensated by growth in the other quarters:4.4% in Q4, 5.1% in Q2, and 9.0% in Q1. There is a clear increase inwinter holidays. The summer holiday is increasingly shiftedtowards spring or autumn. As different people are surveyed in eachquarter, the data do no allow us to test whether this explains theentire increase in Q2 and Q4. It may also be that more and moreIrish opt for a third holiday in spring or autumn, or split thetraditionally long, mid-summer holiday into two shorter holidaysin early and late summer.
Besides a seasonal shift, there is also a shift in destination. Thenumber of visits to North America and Australia and New Zealandfell, in the case of North America by 3.9% per year. Domestic holi-days increased by 2.0% per year, which is substantially less than theincrease in total holidays. Other destinations expanded theirmarket share. This holds for the traditional destinations, the UK(5.5% growth per year) and the Mediterranean (4.6%), but the rest ofEurope gained most (9.3%). The growth rate for Eastern Europe isparticularly large (20.8% per year), but this was from a low base.
The change in destination choice is not uniform over the year;see Table 13 in Appendix. There is a marked shift from summerto winter holidays in the Mediterranean, while the southern
Fig. 1. Distribution of holidays taken by Irish tourists in 2006.
0
500
1000
1500
2000
2500
3000
3500
4000
4500
Q1 Q2 Q3 Q4 Q1 Q2 Q3 Q4 Q1 Q2 Q3 Q4 Q1 Q2 Q3 Q4 Q1 Q2 Q3 Q4 Q1 Q2 Q3 Q4 Q1 Q2 Q3 Q4
Ireland UK Europe MediterraneanEastern Europe Northern Europe North America Australia and New Zealand
2000 2001 2002 2003 2004 2005 2006
Fig. 2. Holidays taken by Irish tourists between 2000 and 2006 – by quarter.
S. Lyons et al. / Tourism Management 30 (2009) 683–692686
summer attracts Irish tourists to Australia and New Zealand. Adrop in summer holidays in Ireland is consistent with the sug-gested preference for nice weather, but may also be explained byhigher incomes. The increase in domestic holidays in the otherquarters can be explained by the time constraints that bind shortholidays.
The survey also contains information on a number of othervariables. A purpose is given for each trip, and we use this to restrictthe sample to only those trips identified as holiday travel.Respondents were asked about the destination, the number, ageand sex of each person travelling and the duration of the trip. Wewould have liked to include an income variable in our model, but itwas not covered in the HTS. Summary statistics for the household-level variables are given in Table 6 in Appendix. Destination-specific variables were drawn from a wider range of sources (seeTable 7 in Appendix). The econometric equation including all thesevariables is as follows:
UðYn;XiÞ ¼ RESPFACTþ b1TIMEn þ b2HERITAGEPOPn þ b3PRECIPn þ b4TEMPn þ b5POPDENSn þ b6DISTn þ b7COASTn
þ b8lnðGDPÞnþ b9ðTEMPÞ2n þ b11STABILITYn þ a1AGE04i � TEMPn þ a2AGE512i � TEMPn þ a3AGE1319i � TEMPn
þa4AGE60pi � TEMPn þ d1AGE04i � DISTn þ d2AGE512i � DISTn þ d3AGE1319i � DISTn þ d4AGE60pi � DISTn þ 3in
See Tables 6 and 7 in Appendix for variable descriptions andsummary statistics. The total number of trips available for analysisis 55,011. Since each of these trips involved a choice among 26possible destinations, the full dataset for our random utility anal-ysis has 1,430,286 observations.
4. Analysis and results
In this section, we present results of the random utility modeldescribed in Section 2 above. This is estimated using a conditionallogistic regression for the 26 destination choices with explanatory
variables that relate to destination characteristics as well as inter-actions of these destination characteristics with a household-specific variable – the age groups of household members.
The results are presented in Table 8 in Appendix, where bothcoefficients and odds ratios are reported. All coefficients (except time)are significant at the 1% level. The size of the coefficients has to beinterpreted in the light of the dimension of the explanatory variable.We first discuss the effects of destination characteristics, beforeturning to household characteristics. After summarising the results ofthese analyses, we re-estimate the model on ‘‘seasonal’’ (in fact,quarter-specific) sub-samples, and we test the possibility that coeffi-cients may have changed over theyears included in the sample period.
4.1. Destination characteristics
The climatic variables included in the regression are monthlytemperatures and monthly rainfall in millimetres for each desti-
nation country. The results confirm Hypothesis 1. Irish tourists aremore likely to pick a destination as the temperature in the desti-nation country increases and they will be 0.9% less likely to choosethat destination for every 100 extra millimetres of rainfall. More-over, temperature squared was also included in the regression. Thisvariable has a negative coefficient indicating that although Irishtourists are attracted to destinations as the monthly temperature atthe location increases, very high temperatures are a deterrent.Temperature was not a significant factor for Dutch tourists (Lise andTol, 2002) but was important to British tourists (Maddison, 2001).The optimal temperature is 41.7 �C, averaged over the month. This

Table 2Conclusions of the analysis.
Hypothesis number Hypothesis Result
Hypothesis 1 Irish tourists prefer to travel to warm countriesand do not like rain.
Positive relationship between temperature and choice, negativebetween precipitation and choice.
Hypothesis 2 Areas with long coastlines are attractive. Positive relationship between coastline length and choice.Hypothesis 3 Irish tourists avoid crowded destinations. Negative relationship between crowds and choice.Hypothesis 4 Areas of cultural heritage attract Irish tourists. Negative relationship between cultural heritage areas and choice.Hypothesis 5 Irish tourists avoid areas with high levels of poverty. Negative relationship between high levels of poverty and choice.Hypothesis 6 Irish tourists dislike travelling far. Negative relationship between long distance and choice.Hypothesis 7 Irish tourists avoid travelling to areas where there
is political unrest.Relationship between political stability and choice is underdetermined.
Hypothesis 8 Older households and those with children areconstrained in their destination choices.
Older households avoid long distances and high temperatures; households withchildren avoid long distances but choose destinations with high temperatures.
Hypothesis 9 Preferences for holiday destinations vary between the seasons. True for climate variables only.Hypothesis 10 Preferences for holiday destinations vary over the years. True for poverty aversion and distance aversion only.
S. Lyons et al. / Tourism Management 30 (2009) 683–692 687
optimum is outside the sample of holiday destinations consideredhere, so that we can only conclude that the Irish like hot destina-tions, and that Turkey, the hottest destination, is not too hot.
Hypothesis 2 is also confirmed, as Irish tourists are 0.01% morelikely to pick a destination for every 1000 extra kilometres ofcoastline, and it also appears that Irish tourists prefer to avoiddestinations with high population densities, confirming Hypothesis3. Very crowded destinations are not seen as attractive holidaydestinations and countries with a higher level of GDP are muchmore attractive as tourist destinations than lower incomecountries.3
The two variables that produce counter-intuitive results arethose relating to Hypotheses 4 and 7, i.e. that areas of culturalheritage are attractive and political instability deters tourists. Theheritage coefficient is negative, suggesting that Irish tourists do notsee areas with a high number of World Heritage Sites per capita asattractive destinations – in fact, the contrary is true. This mayreflect a weakness in our proxy for a destination’s endowment ofheritage. Designation of World Heritage Sites is perhaps endoge-nous in a model of tourism, since areas with a relatively low level oftourism activity might see the designation of heritage sites as a wayof attracting more tourism. Hence countries with numerous heri-tage sites may actually be countries that have little tourism trafficfor other reasons.
An odds ratio of less than one on the political stability variablealso seems counter-intuitive. As political stability in a destinationcountry increases, the less likely it is that Irish tourists are goingto choose to go to that particular country. This may be explainedby the range of destinations included in our sample, whichexcludes most countries with serious problems with security orstability. The ‘‘stability’’ indicator therefore probably measuresa preference for safe but somewhat exotic destinations such asthe Czech Republic and Turkey over safe but staid Denmark andGermany.
Previous research into Hypothesis 6 (the effect that distance toa country has on destination choice) has yielded mixed results. Liseand Tol (2002) found that Dutch tourists prefer long-distanceholidays and Maddison (2001) showed that British holiday-makersprefer to stay closer to home. The present results again show thatIrish tourists react similarly to British tourists. Distance is nega-tively related to destination choice and Irish tourists will be 12% less
3 We also included the PPP conversion factor to official exchange ratio. This wasan attempt to take into account price differentials between countries as a deter-minant of choice. The GDP variable included in the results presented was convertedto US dollars using PPP exchange rates, so the two variables could not be includedtogether.
likely to choose a destination with every extra 100 kilometres oftravel.
4.2. Interactions and household-specific characteristics
Two variables that were deemed important factors in destina-tion choice (distance and temperature) were also interacted witha household-level characteristic, namely age. The proportion ofpeople in the household aged between 0 and 4 years of age, 5 and12 years of age, 13 and 19 years of age and over 60 years of age wereinteracted with the distance and temperature variables. Theomitted category is the proportion of people in the household whoare aged between 20 and 59.
We find that with regard to distance, increasing the share ofchildren and people over 60 in a travelling party reduces its toler-ance for distance relative to groups made up predominantly of 20–59 year olds. All the coefficients for these interactions are negativeand the odds ratios are smaller than one. When looking at therelation between age and temperature at the destination country,we find that groups with children are more likely to pick a desti-nation as its temperature increases, whereas groups with oldermembers are more averse to high temperatures.
When conducting this analysis, we considered the inclusion ofother variables such as the surface area of the destination country,the total reef area or the national density of world heritage sites.These did not add anything to the analysis (e.g. Australia and NewZealand are the only countries included in the study that wouldhave a significant area of reefs) and were consequently dropped.The mode of transport used was also dropped, as apart fromdomestic trips, most holidays were taken by air. The gendercomposition of the household was also not found to have a signif-icant effect.
4.3. Summary
The results presented above have allowed us to verify whetherthe hypotheses presented in Section 1 are correct. The summary ofthese conclusions is presented in Table 2 below.
4.4. Analysis of seasonal sub-samples
Ireland’s Household Travel Survey is conducted as a set ofquarterly cross-sections. As a result, it is difficult to segment it bytraditional travel seasons (summer, winter). Nevertheless, as a testof robustness and to obtain indicative evidence of any seasonalvariations, we split the sample according to the quarters in whichholidays were taken by households and re-analysed each quarter
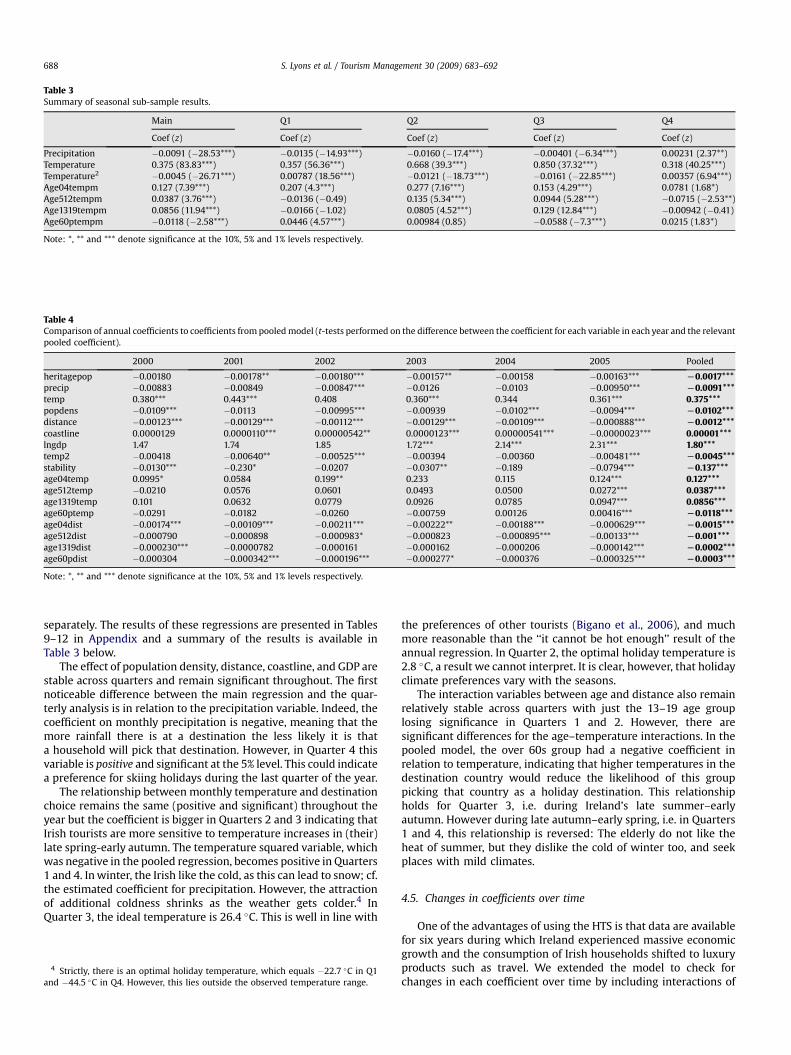
Table 4Comparison of annual coefficients to coefficients from pooled model (t-tests performed on the difference between the coefficient for each variable in each year and the relevantpooled coefficient).
2000 2001 2002 2003 2004 2005 Pooled
heritagepop �0.00180 �0.00178** �0.00180*** �0.00157** �0.00158 �0.00163*** L0.0017***precip �0.00883 �0.00849 �0.00847*** �0.0126 �0.0103 �0.00950*** L0.0091***temp 0.380*** 0.443*** 0.408 0.360*** 0.344 0.361*** 0.375***popdens �0.0109*** �0.0113 �0.00995*** �0.00939 �0.0102*** �0.0094*** L0.0102***distance �0.00123*** �0.00129*** �0.00112*** �0.00129*** �0.00109*** �0.000888*** L0.0012***coastline 0.0000129 0.0000110*** 0.00000542** 0.0000123*** 0.00000541*** �0.0000023*** 0.00001***lngdp 1.47 1.74 1.85 1.72*** 2.14*** 2.31*** 1.80***temp2 �0.00418 �0.00640** �0.00525*** �0.00394 �0.00360 �0.00481*** L0.0045***stability �0.0130*** �0.230* �0.0207 �0.0307** �0.189 �0.0794*** L0.137***age04temp 0.0995* 0.0584 0.199** 0.233 0.115 0.124*** 0.127***age512temp �0.0210 0.0576 0.0601 0.0493 0.0500 0.0272*** 0.0387***age1319temp 0.101 0.0632 0.0779 0.0926 0.0785 0.0947*** 0.0856***age60ptemp �0.0291 �0.0182 �0.0260 �0.00759 0.00126 0.00416*** L0.0118***age04dist �0.00174*** �0.00109*** �0.00211*** �0.00222** �0.00188*** �0.000629*** L0.0015***age512dist �0.000790 �0.000898 �0.000983* �0.000823 �0.000895*** �0.00133*** L0.001***age1319dist �0.000230*** �0.0000782 �0.000161 �0.000162 �0.000206 �0.000142*** L0.0002***age60pdist �0.000304 �0.000342*** �0.000196*** �0.000277* �0.000376 �0.000325*** L0.0003***
Note: *, ** and *** denote significance at the 10%, 5% and 1% levels respectively.
Table 3Summary of seasonal sub-sample results.
Main Q1 Q2 Q3 Q4
Coef (z) Coef (z) Coef (z) Coef (z) Coef (z)
Precipitation �0.0091 (�28.53***) �0.0135 (�14.93***) �0.0160 (�17.4***) �0.00401 (�6.34***) 0.00231 (2.37**)Temperature 0.375 (83.83***) 0.357 (56.36***) 0.668 (39.3***) 0.850 (37.32***) 0.318 (40.25***)Temperature2 �0.0045 (�26.71***) 0.00787 (18.56***) �0.0121 (�18.73***) �0.0161 (�22.85***) 0.00357 (6.94***)Age04tempm 0.127 (7.39***) 0.207 (4.3***) 0.277 (7.16***) 0.153 (4.29***) 0.0781 (1.68*)Age512tempm 0.0387 (3.76***) �0.0136 (�0.49) 0.135 (5.34***) 0.0944 (5.28***) �0.0715 (�2.53**)Age1319tempm 0.0856 (11.94***) �0.0166 (�1.02) 0.0805 (4.52***) 0.129 (12.84***) �0.00942 (�0.41)Age60ptempm �0.0118 (�2.58***) 0.0446 (4.57***) 0.00984 (0.85) �0.0588 (�7.3***) 0.0215 (1.83*)
Note: *, ** and *** denote significance at the 10%, 5% and 1% levels respectively.
S. Lyons et al. / Tourism Management 30 (2009) 683–692688
separately. The results of these regressions are presented in Tables9–12 in Appendix and a summary of the results is available inTable 3 below.
The effect of population density, distance, coastline, and GDP arestable across quarters and remain significant throughout. The firstnoticeable difference between the main regression and the quar-terly analysis is in relation to the precipitation variable. Indeed, thecoefficient on monthly precipitation is negative, meaning that themore rainfall there is at a destination the less likely it is thata household will pick that destination. However, in Quarter 4 thisvariable is positive and significant at the 5% level. This could indicatea preference for skiing holidays during the last quarter of the year.
The relationship between monthly temperature and destinationchoice remains the same (positive and significant) throughout theyear but the coefficient is bigger in Quarters 2 and 3 indicating thatIrish tourists are more sensitive to temperature increases in (their)late spring-early autumn. The temperature squared variable, whichwas negative in the pooled regression, becomes positive in Quarters1 and 4. In winter, the Irish like the cold, as this can lead to snow; cf.the estimated coefficient for precipitation. However, the attractionof additional coldness shrinks as the weather gets colder.4 InQuarter 3, the ideal temperature is 26.4 �C. This is well in line with
4 Strictly, there is an optimal holiday temperature, which equals �22.7 �C in Q1and �44.5 �C in Q4. However, this lies outside the observed temperature range.
the preferences of other tourists (Bigano et al., 2006), and muchmore reasonable than the ‘‘it cannot be hot enough’’ result of theannual regression. In Quarter 2, the optimal holiday temperature is2.8 �C, a result we cannot interpret. It is clear, however, that holidayclimate preferences vary with the seasons.
The interaction variables between age and distance also remainrelatively stable across quarters with just the 13–19 age grouplosing significance in Quarters 1 and 2. However, there aresignificant differences for the age–temperature interactions. In thepooled model, the over 60s group had a negative coefficient inrelation to temperature, indicating that higher temperatures in thedestination country would reduce the likelihood of this grouppicking that country as a holiday destination. This relationshipholds for Quarter 3, i.e. during Ireland’s late summer–earlyautumn. However during late autumn–early spring, i.e. in Quarters1 and 4, this relationship is reversed: The elderly do not like theheat of summer, but they dislike the cold of winter too, and seekplaces with mild climates.
4.5. Changes in coefficients over time
One of the advantages of using the HTS is that data are availablefor six years during which Ireland experienced massive economicgrowth and the consumption of Irish households shifted to luxuryproducts such as travel. We extended the model to check forchanges in each coefficient over time by including interactions of
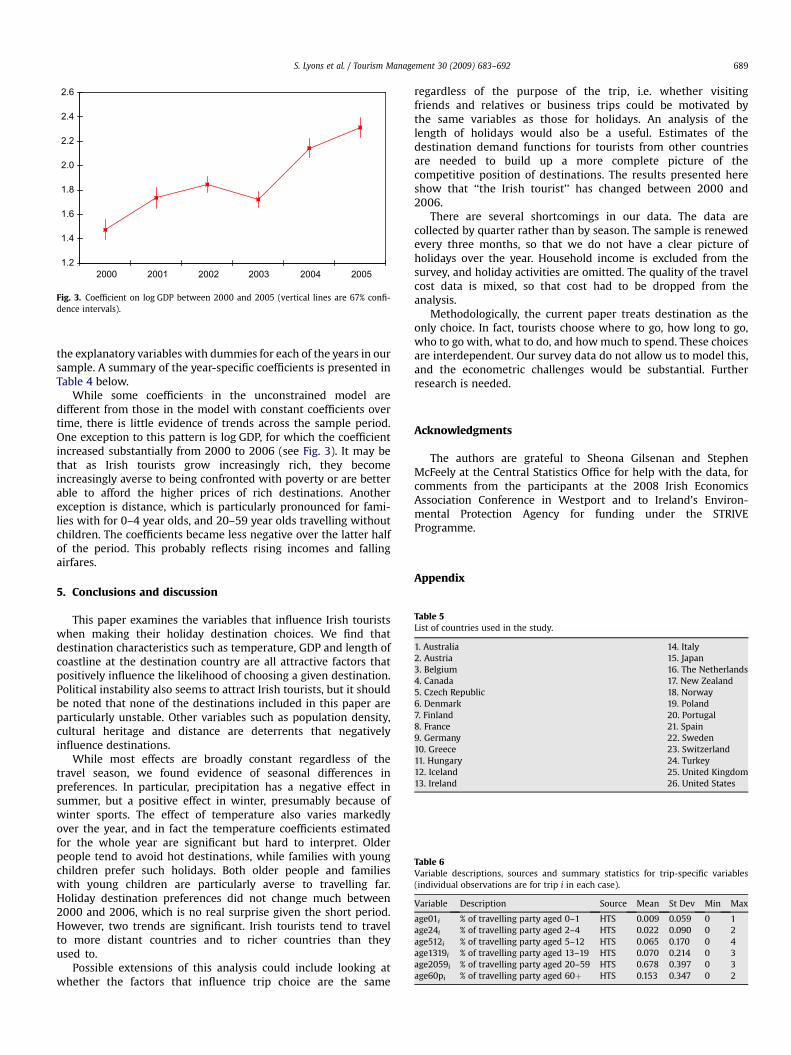
Table 5List of countries used in the study.
1. Australia 14. Italy2. Austria 15. Japan3. Belgium 16. The Netherlands4. Canada 17. New Zealand5. Czech Republic 18. Norway6. Denmark 19. Poland7. Finland 20. Portugal8. France 21. Spain9. Germany 22. Sweden10. Greece 23. Switzerland11. Hungary 24. Turkey12. Iceland 25. United Kingdom13. Ireland 26. United States
Table 6Variable descriptions, sources and summary statistics for trip-specific variables(individual observations are for trip i in each case).
Variable Description Source Mean St Dev Min Max
age01i % of travelling party aged 0–1 HTS 0.009 0.059 0 1age24i % of travelling party aged 2–4 HTS 0.022 0.090 0 2age512i % of travelling party aged 5–12 HTS 0.065 0.170 0 4age1319i % of travelling party aged 13–19 HTS 0.070 0.214 0 3age2059i % of travelling party aged 20–59 HTS 0.678 0.397 0 3age60pi % of travelling party aged 60þ HTS 0.153 0.347 0 2
1.2
1.4
1.6
1.8
2.0
2.2
2.4
2.6
2000 2001 2002 2003 2004 2005
Fig. 3. Coefficient on log GDP between 2000 and 2005 (vertical lines are 67% confi-dence intervals).
S. Lyons et al. / Tourism Management 30 (2009) 683–692 689
the explanatory variables with dummies for each of the years in oursample. A summary of the year-specific coefficients is presented inTable 4 below.
While some coefficients in the unconstrained model aredifferent from those in the model with constant coefficients overtime, there is little evidence of trends across the sample period.One exception to this pattern is log GDP, for which the coefficientincreased substantially from 2000 to 2006 (see Fig. 3). It may bethat as Irish tourists grow increasingly rich, they becomeincreasingly averse to being confronted with poverty or are betterable to afford the higher prices of rich destinations. Anotherexception is distance, which is particularly pronounced for fami-lies with for 0–4 year olds, and 20–59 year olds travelling withoutchildren. The coefficients became less negative over the latter halfof the period. This probably reflects rising incomes and fallingairfares.
5. Conclusions and discussion
This paper examines the variables that influence Irish touristswhen making their holiday destination choices. We find thatdestination characteristics such as temperature, GDP and length ofcoastline at the destination country are all attractive factors thatpositively influence the likelihood of choosing a given destination.Political instability also seems to attract Irish tourists, but it shouldbe noted that none of the destinations included in this paper areparticularly unstable. Other variables such as population density,cultural heritage and distance are deterrents that negativelyinfluence destinations.
While most effects are broadly constant regardless of thetravel season, we found evidence of seasonal differences inpreferences. In particular, precipitation has a negative effect insummer, but a positive effect in winter, presumably because ofwinter sports. The effect of temperature also varies markedlyover the year, and in fact the temperature coefficients estimatedfor the whole year are significant but hard to interpret. Olderpeople tend to avoid hot destinations, while families with youngchildren prefer such holidays. Both older people and familieswith young children are particularly averse to travelling far.Holiday destination preferences did not change much between2000 and 2006, which is no real surprise given the short period.However, two trends are significant. Irish tourists tend to travelto more distant countries and to richer countries than theyused to.
Possible extensions of this analysis could include looking atwhether the factors that influence trip choice are the same
regardless of the purpose of the trip, i.e. whether visitingfriends and relatives or business trips could be motivated bythe same variables as those for holidays. An analysis of thelength of holidays would also be a useful. Estimates of thedestination demand functions for tourists from other countriesare needed to build up a more complete picture of thecompetitive position of destinations. The results presented hereshow that ‘‘the Irish tourist’’ has changed between 2000 and2006.
There are several shortcomings in our data. The data arecollected by quarter rather than by season. The sample is renewedevery three months, so that we do not have a clear picture ofholidays over the year. Household income is excluded from thesurvey, and holiday activities are omitted. The quality of the travelcost data is mixed, so that cost had to be dropped from theanalysis.
Methodologically, the current paper treats destination as theonly choice. In fact, tourists choose where to go, how long to go,who to go with, what to do, and how much to spend. These choicesare interdependent. Our survey data do not allow us to model this,and the econometric challenges would be substantial. Furtherresearch is needed.
Acknowledgments
The authors are grateful to Sheona Gilsenan and StephenMcFeely at the Central Statistics Office for help with the data, forcomments from the participants at the 2008 Irish EconomicsAssociation Conference in Westport and to Ireland’s Environ-mental Protection Agency for funding under the STRIVEProgramme.
Appendix
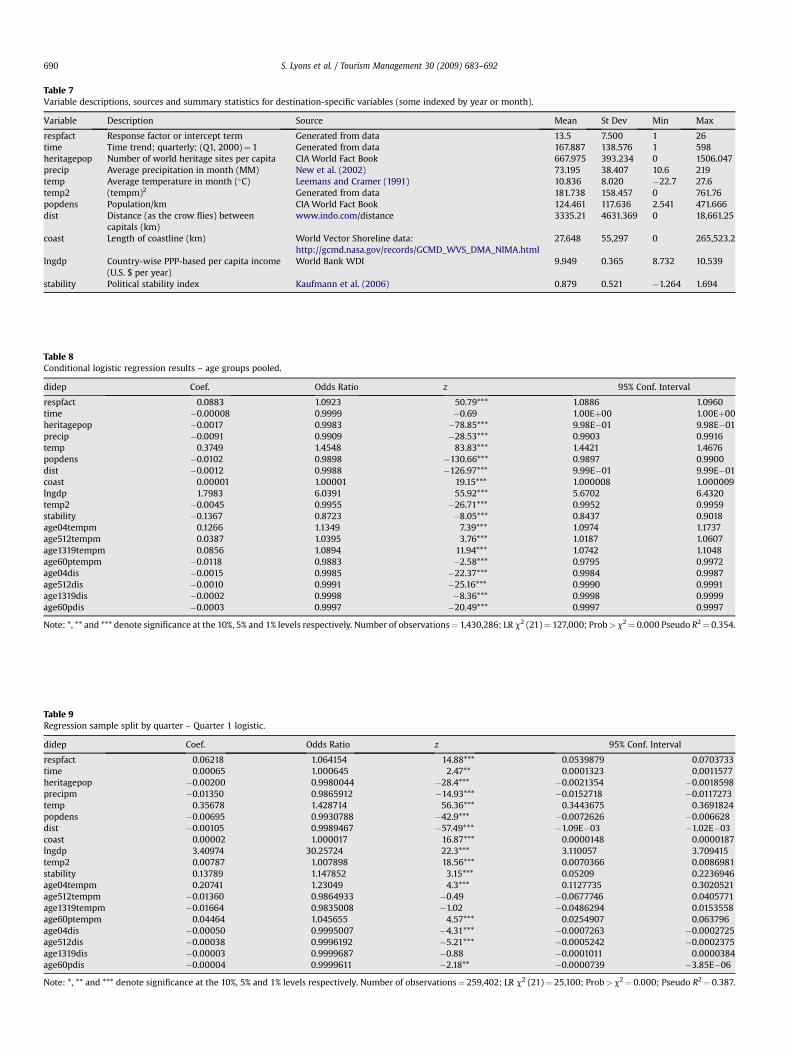
Table 7Variable descriptions, sources and summary statistics for destination-specific variables (some indexed by year or month).
Variable Description Source Mean St Dev Min Max
respfact Response factor or intercept term Generated from data 13.5 7.500 1 26time Time trend; quarterly; (Q1, 2000)¼ 1 Generated from data 167.887 138.576 1 598heritagepop Number of world heritage sites per capita CIA World Fact Book 667.975 393.234 0 1506.047precip Average precipitation in month (MM) New et al. (2002) 73.195 38.407 10.6 219temp Average temperature in month (�C) Leemans and Cramer (1991) 10.836 8.020 �22.7 27.6temp2 (tempm)2 Generated from data 181.738 158.457 0 761.76popdens Population/km CIA World Fact Book 124.461 117.636 2.541 471.666dist Distance (as the crow flies) between
capitals (km)www.indo.com/distance 3335.21 4631.369 0 18,661.25
coast Length of coastline (km) World Vector Shoreline data:http://gcmd.nasa.gov/records/GCMD_WVS_DMA_NIMA.html
27,648 55,297 0 265,523.2
lngdp Country-wise PPP-based per capita income(U.S. $ per year)
World Bank WDI 9.949 0.365 8.732 10.539
stability Political stability index Kaufmann et al. (2006) 0.879 0.521 �1.264 1.694
Table 8Conditional logistic regression results – age groups pooled.
didep Coef. Odds Ratio z 95% Conf. Interval
respfact 0.0883 1.0923 50.79*** 1.0886 1.0960time �0.00008 0.9999 �0.69 1.00Eþ00 1.00Eþ00heritagepop �0.0017 0.9983 �78.85*** 9.98E�01 9.98E�01precip �0.0091 0.9909 �28.53*** 0.9903 0.9916temp 0.3749 1.4548 83.83*** 1.4421 1.4676popdens �0.0102 0.9898 �130.66*** 0.9897 0.9900dist �0.0012 0.9988 �126.97*** 9.99E�01 9.99E�01coast 0.00001 1.00001 19.15*** 1.000008 1.000009lngdp 1.7983 6.0391 55.92*** 5.6702 6.4320temp2 �0.0045 0.9955 �26.71*** 0.9952 0.9959stability �0.1367 0.8723 �8.05*** 0.8437 0.9018age04tempm 0.1266 1.1349 7.39*** 1.0974 1.1737age512tempm 0.0387 1.0395 3.76*** 1.0187 1.0607age1319tempm 0.0856 1.0894 11.94*** 1.0742 1.1048age60ptempm �0.0118 0.9883 �2.58*** 0.9795 0.9972age04dis �0.0015 0.9985 �22.37*** 0.9984 0.9987age512dis �0.0010 0.9991 �25.16*** 0.9990 0.9991age1319dis �0.0002 0.9998 �8.36*** 0.9998 0.9999age60pdis �0.0003 0.9997 �20.49*** 0.9997 0.9997
Note: *, ** and *** denote significance at the 10%, 5% and 1% levels respectively. Number of observations¼ 1,430,286; LR c2 (21)¼ 127,000; Prob> c2¼ 0.000 Pseudo R2¼ 0.354.
Table 9Regression sample split by quarter – Quarter 1 logistic.
didep Coef. Odds Ratio z 95% Conf. Interval
respfact 0.06218 1.064154 14.88*** 0.0539879 0.0703733time 0.00065 1.000645 2.47** 0.0001323 0.0011577heritagepop �0.00200 0.9980044 �28.4*** �0.0021354 �0.0018598precipm �0.01350 0.9865912 �14.93*** �0.0152718 �0.0117273temp 0.35678 1.428714 56.36*** 0.3443675 0.3691824popdens �0.00695 0.9930788 �42.9*** �0.0072626 �0.006628dist �0.00105 0.9989467 �57.49*** �1.09E�03 �1.02E�03coast 0.00002 1.000017 16.87*** 0.0000148 0.0000187lngdp 3.40974 30.25724 22.3*** 3.110057 3.709415temp2 0.00787 1.007898 18.56*** 0.0070366 0.0086981stability 0.13789 1.147852 3.15*** 0.05209 0.2236946age04tempm 0.20741 1.23049 4.3*** 0.1127735 0.3020521age512tempm �0.01360 0.9864933 �0.49 �0.0677746 0.0405771age1319tempm �0.01664 0.9835008 �1.02 �0.0486294 0.0153558age60ptempm 0.04464 1.045655 4.57*** 0.0254907 0.063796age04dis �0.00050 0.9995007 �4.31*** �0.0007263 �0.0002725age512dis �0.00038 0.9996192 �5.21*** �0.0005242 �0.0002375age1319dis �0.00003 0.9999687 �0.88 �0.0001011 0.0000384age60pdis �0.00004 0.9999611 �2.18** �0.0000739 �3.85E�06
Note: *, ** and *** denote significance at the 10%, 5% and 1% levels respectively. Number of observations¼ 259,402; LR c2 (21)¼ 25,100; Prob> c2¼ 0.000; Pseudo R2¼ 0.387.
S. Lyons et al. / Tourism Management 30 (2009) 683–692690
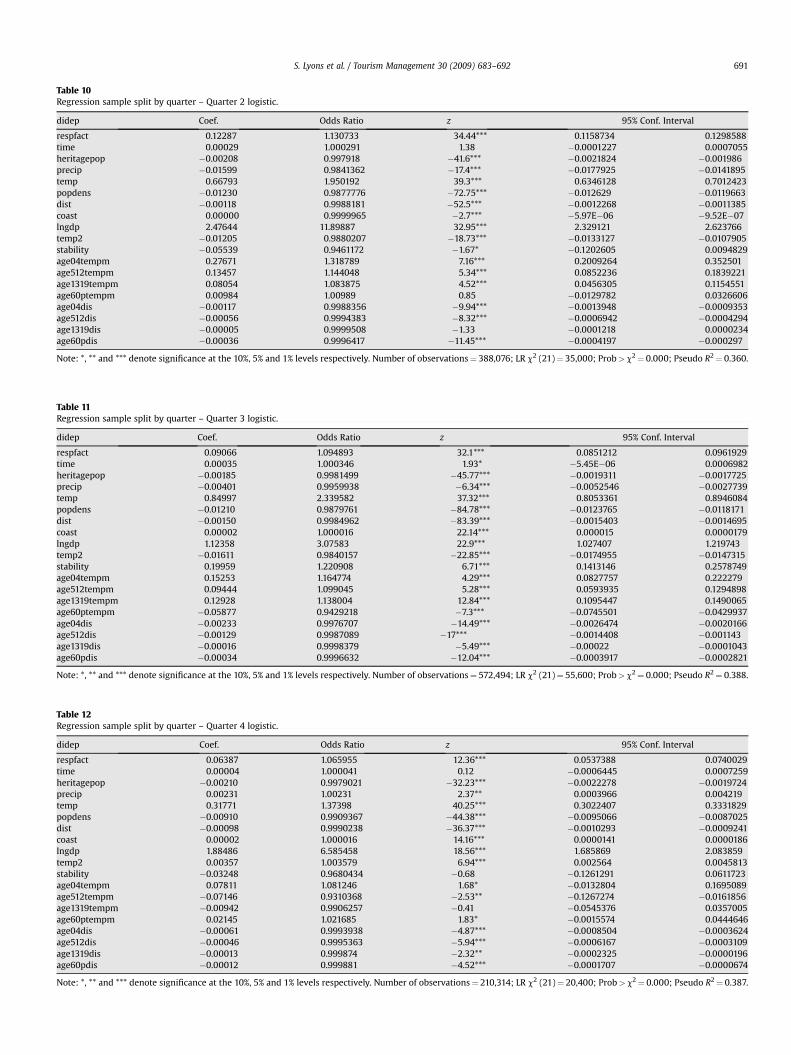
Table 10Regression sample split by quarter – Quarter 2 logistic.
didep Coef. Odds Ratio z 95% Conf. Interval
respfact 0.12287 1.130733 34.44*** 0.1158734 0.1298588time 0.00029 1.000291 1.38 �0.0001227 0.0007055heritagepop �0.00208 0.997918 �41.6*** �0.0021824 �0.001986precip �0.01599 0.9841362 �17.4*** �0.0177925 �0.0141895temp 0.66793 1.950192 39.3*** 0.6346128 0.7012423popdens �0.01230 0.9877776 �72.75*** �0.012629 �0.0119663dist �0.00118 0.9988181 �52.5*** �0.0012268 �0.0011385coast 0.00000 0.9999965 �2.7*** �5.97E�06 �9.52E�07lngdp 2.47644 11.89887 32.95*** 2.329121 2.623766temp2 �0.01205 0.9880207 �18.73*** �0.0133127 �0.0107905stability �0.05539 0.9461172 �1.67* �0.1202605 0.0094829age04tempm 0.27671 1.318789 7.16*** 0.2009264 0.352501age512tempm 0.13457 1.144048 5.34*** 0.0852236 0.1839221age1319tempm 0.08054 1.083875 4.52*** 0.0456305 0.1154551age60ptempm 0.00984 1.00989 0.85 �0.0129782 0.0326606age04dis �0.00117 0.9988356 �9.94*** �0.0013948 �0.0009353age512dis �0.00056 0.9994383 �8.32*** �0.0006942 �0.0004294age1319dis �0.00005 0.9999508 �1.33 �0.0001218 0.0000234age60pdis �0.00036 0.9996417 �11.45*** �0.0004197 �0.000297
Note: *, ** and *** denote significance at the 10%, 5% and 1% levels respectively. Number of observations¼ 388,076; LR c2 (21)¼ 35,000; Prob> c2¼ 0.000; Pseudo R2¼ 0.360.
Table 11Regression sample split by quarter – Quarter 3 logistic.
didep Coef. Odds Ratio z 95% Conf. Interval
respfact 0.09066 1.094893 32.1*** 0.0851212 0.0961929time 0.00035 1.000346 1.93* �5.45E�06 0.0006982heritagepop �0.00185 0.9981499 �45.77*** �0.0019311 �0.0017725precip �0.00401 0.9959938 �6.34*** �0.0052546 �0.0027739temp 0.84997 2.339582 37.32*** 0.8053361 0.8946084popdens �0.01210 0.9879761 �84.78*** �0.0123765 �0.0118171dist �0.00150 0.9984962 �83.39*** �0.0015403 �0.0014695coast 0.00002 1.000016 22.14*** 0.000015 0.0000179lngdp 1.12358 3.07583 22.9*** 1.027407 1.219743temp2 �0.01611 0.9840157 �22.85*** �0.0174955 �0.0147315stability 0.19959 1.220908 6.71*** 0.1413146 0.2578749age04tempm 0.15253 1.164774 4.29*** 0.0827757 0.222279age512tempm 0.09444 1.099045 5.28*** 0.0593935 0.1294898age1319tempm 0.12928 1.138004 12.84*** 0.1095447 0.1490065age60ptempm �0.05877 0.9429218 �7.3*** �0.0745501 �0.0429937age04dis �0.00233 0.9976707 �14.49*** �0.0026474 �0.0020166age512dis �0.00129 0.9987089 �17*** �0.0014408 �0.001143age1319dis �0.00016 0.9998379 �5.49*** �0.00022 �0.0001043age60pdis �0.00034 0.9996632 �12.04*** �0.0003917 �0.0002821
Note: *, ** and *** denote significance at the 10%, 5% and 1% levels respectively. Number of observations¼ 572,494; LR c2 (21)¼ 55,600; Prob> c2¼ 0.000; Pseudo R2¼ 0.388.
Table 12Regression sample split by quarter – Quarter 4 logistic.
didep Coef. Odds Ratio z 95% Conf. Interval
respfact 0.06387 1.065955 12.36*** 0.0537388 0.0740029time 0.00004 1.000041 0.12 �0.0006445 0.0007259heritagepop �0.00210 0.9979021 �32.23*** �0.0022278 �0.0019724precip 0.00231 1.00231 2.37** 0.0003966 0.004219temp 0.31771 1.37398 40.25*** 0.3022407 0.3331829popdens �0.00910 0.9909367 �44.38*** �0.0095066 �0.0087025dist �0.00098 0.9990238 �36.37*** �0.0010293 �0.0009241coast 0.00002 1.000016 14.16*** 0.0000141 0.0000186lngdp 1.88486 6.585458 18.56*** 1.685869 2.083859temp2 0.00357 1.003579 6.94*** 0.002564 0.0045813stability �0.03248 0.9680434 �0.68 �0.1261291 0.0611723age04tempm 0.07811 1.081246 1.68* �0.0132804 0.1695089age512tempm �0.07146 0.9310368 �2.53** �0.1267274 �0.0161856age1319tempm �0.00942 0.9906257 �0.41 �0.0545376 0.0357005age60ptempm 0.02145 1.021685 1.83* �0.0015574 0.0444646age04dis �0.00061 0.9993938 �4.87*** �0.0008504 �0.0003624age512dis �0.00046 0.9995363 �5.94*** �0.0006167 �0.0003109age1319dis �0.00013 0.999874 �2.32** �0.0002325 �0.0000196age60pdis �0.00012 0.999881 �4.52*** �0.0001707 �0.0000674
Note: *, ** and *** denote significance at the 10%, 5% and 1% levels respectively. Number of observations¼ 210,314; LR c2 (21)¼ 20,400; Prob> c2¼ 0.000; Pseudo R2¼ 0.387.
S. Lyons et al. / Tourism Management 30 (2009) 683–692 691

Table 13Annual growth rate of the number of holiday trips by quarter and destination.
All destinations Ireland UK Europe Mediterranean Eastern Europe Northern Europe North America Australia and New Zealand
Annual 3.4 2.0 5.5 9.3 4.6 20.8 5.2 �3.9 �1.0Q1 9.0 5.0 8.7 17.8 16.5 26.9 7.7 0.5 13.0Q2 5.1 5.1 3.3 7.6 5.8 26.0 15.6 �4.4 �9.3Q3 �0.8 �1.6 3.7 4.1 �0.6 13.2 �2.0 �10.7 �8.7Q4 4.4 2.3 7.2 12.6 6.7 20.1 2.9 0.7 �0.8
S. Lyons et al. / Tourism Management 30 (2009) 683–692692
References
Bigano, A., Hamilton, J. M., & Tol, R. S. J. (2006). The impact of climate on holidaydestination choice. Climatic Change, 76(3), 389–406.
Central Statistics Office. (2007). Household travel survey. Quarterly data from 2000 to2006. Cork: CSO.
Correia, A., Santos, C. M., & Pestana Barros, C. (2007). Tourism in latin America:a choice analysis. Annals of Tourism Research, 34(3), 610–629.
Crouch, G. I. (1994). A study of international tourism demand: a review of findings.Journal of Travel Research, 33(1), 12–23.
Gould, W. (2000). Interpreting logistic regression in all its forms. Stata TechnicalBulletin STB-53.
Gossling, S., & Hall, C. M. (2006). Uncertainties in predicting tourist flows underscenarios of climate change. Climatic Change, 79(3–4), 163–173.
Hamilton, J.M., Maddison, D.J., & Tol, R.S.J. (2005). Climate preference and destinationchoice: A segmentation approach. Working Paper, Research Unit Sustainabilityand Global Change, Hamburg University and Centre for Marine and Atmo-spheric Science: Hamburg. FNU-90.
Hendrickx, J. (2001). Special restrictions in multinomial logistic regression. At <http://www.xs4all.nl/wjhckx/>.
Kaufmann, D., Kraay, A., & Mastruzzi, M. (2006). Governance matters V: Governanceindicators for 1996–2005. At <http://go.worldbank.org/W0DI8LZMD0>.
Leemans, R., & Cramer, W. (1991). The IIASA database for mean monthly values oftemperature, precipitation and cloudiness on a global terrestrial grid. ResearchReport RR-91–18. Laxenburg: International Institute for Applied SystemsAnalysis.
Lim, C. (1999). A meta-analytic review of international tourism demand. Journal ofTravel Research, 37(2), 273–284.
Lise, W., & Tol, R. S. J. (2002). Impact of climate on tourist demand. Climatic Change,55(4), 429–449.
Lyons, S., Mayor, K., & Tol, R. S. J. (2008). The climate preferences of Irish tourists bypurpose of travel. ESRI Working Papers. No. 225. Dublin: ESRI.
McFadden, D. (1981). Conditional logit analysis of qualitative choice behavior. InP. Zarembka (Ed.), Frontiers in Econometrics (pp. 105–142). New York: AcademicPress.
Maddison, D. (2001). In search of warmer climates? The impact of climate changeon flows of British tourists. Climatic Change, 49(1), 193–208.
Morley, C. (1991). Modeling international tourism demand: model specification andstructure. Journal of Travel Research, 30(7), 40–44.
New, M., Lister, D., Hulme, M., & Makin, I. (2002). A high-resolution data set ofsurface climate over global land areas. Climate Research, 21, 1–25.
Nicolau, J. L., & Mas, F. J. (2006). The influence of distance and prices on the choice oftourist destinations: the moderating role of motivations. Tourism Management,27(5), 982–996.
O’Hagan, J. W., & Harrison, M. J. (1984). Market shares of U.S. tourist expenditures inEurope: an econometric analysis. Applied Economics, 16(6), 919–931.
Song, H., & Li, G. (2008). Tourism demand modelling and forecasting – a review ofrecent research. Tourism Management, 29, 203–220.
Witt, S. F., & Witt, C. A. (1995). Forecasting tourism demand: a review of empiricalresearch. International Journal of Forecasting, 11, 447–475.
Zhang, H. Q., Qu, H., & Tang, V. M. Y. (2004). A case study of Hong Kong residents’outbound leisure travel. Tourism Management, 25, 267–273.