holiday habits report 2016 - uk travel industry...abta holiday habits report 2016 5 6 abta holiday...
TRANSCRIPT

HOLIDAY HABITS REPORT2016
Overall, 86% of Britons said they took a holiday either at home or abroad in the 12 months to August 2016, which was a significant increase on the previous year (77%). This represents the largest proportion of Britons taking a holiday since 2011.
The average number of foreign holidays per person grew notably in the previous year (from 1.2 to 1.5) and so it is perhaps unsurprising that this year we have seen this stabilise at 1.4 per person, with 56% of people taking a holiday abroad (compared to 54% in 2015). 25-34 year olds and 55-64 year olds are the age groups that take the most foreign holidays – 13% of both groups said they took more than four holidays abroad during the year. The number of shorter breaks abroad increased slightly, however the number of longer holidays
abroad (7+ nights) decreased slightly, reinforcing the findings elsewhere in this report that city breaks have performed strongly this year while the beach holiday has proved relatively less popular.
The findings suggest that domestic holiday-taking is the main driver of growth in the number of Britons taking a holiday with almost three quarters of respondents (71%) taking a holiday in the UK, up from 64% last year. Domestic tourism has benefitted from a wide range of anniversaries, festivals and events across the country, including the 400th anniversary of Shakespeare’s death, which helped encourage more people to take holidays at home. Young families with at least one child under five took the most UK holidays, with 26% taking more than four domestic holidays.
TABLE 1 Britons taking a holiday 2012-16
TABLE 2 Average number of holidays taken per person 2012-16
(split by UK and abroad)
1. NUMBER OF HOLIDAYS TAKENINTRODUCTION
BRITONS TAKING A HOLIDAY 2012-2016
AVERAGE NUMBER OF HOLIDAYS
2 ABTAHolidayHabitsReport2016ABTAHolidayHabitsReport2016 1
NO HOLIDAYS UK ONLY ABROAD ONLY BOTH UK AND ABROAD
% of consumers
0
10
20
30
40
50
60
20122013201420152016
20122013201420152016
20122013201420152016
20122013201420152016
17 26 11 4517 31 13 3920 27 12 4123 14 23 30 13 15 41 41
UKHOLIDAYS
HOLIDAYSABROAD
TOTALHOLIDAYS
LIDAYAA S
LIDAYSROAD
TALOLIDAYS
2012
3.5
2013
3.1
2014
3.0
2015
3.2
2016
2.0
1.4
2.1
1.4
1.9
1.2
1.8
1.2
1.7
1.5
3.4
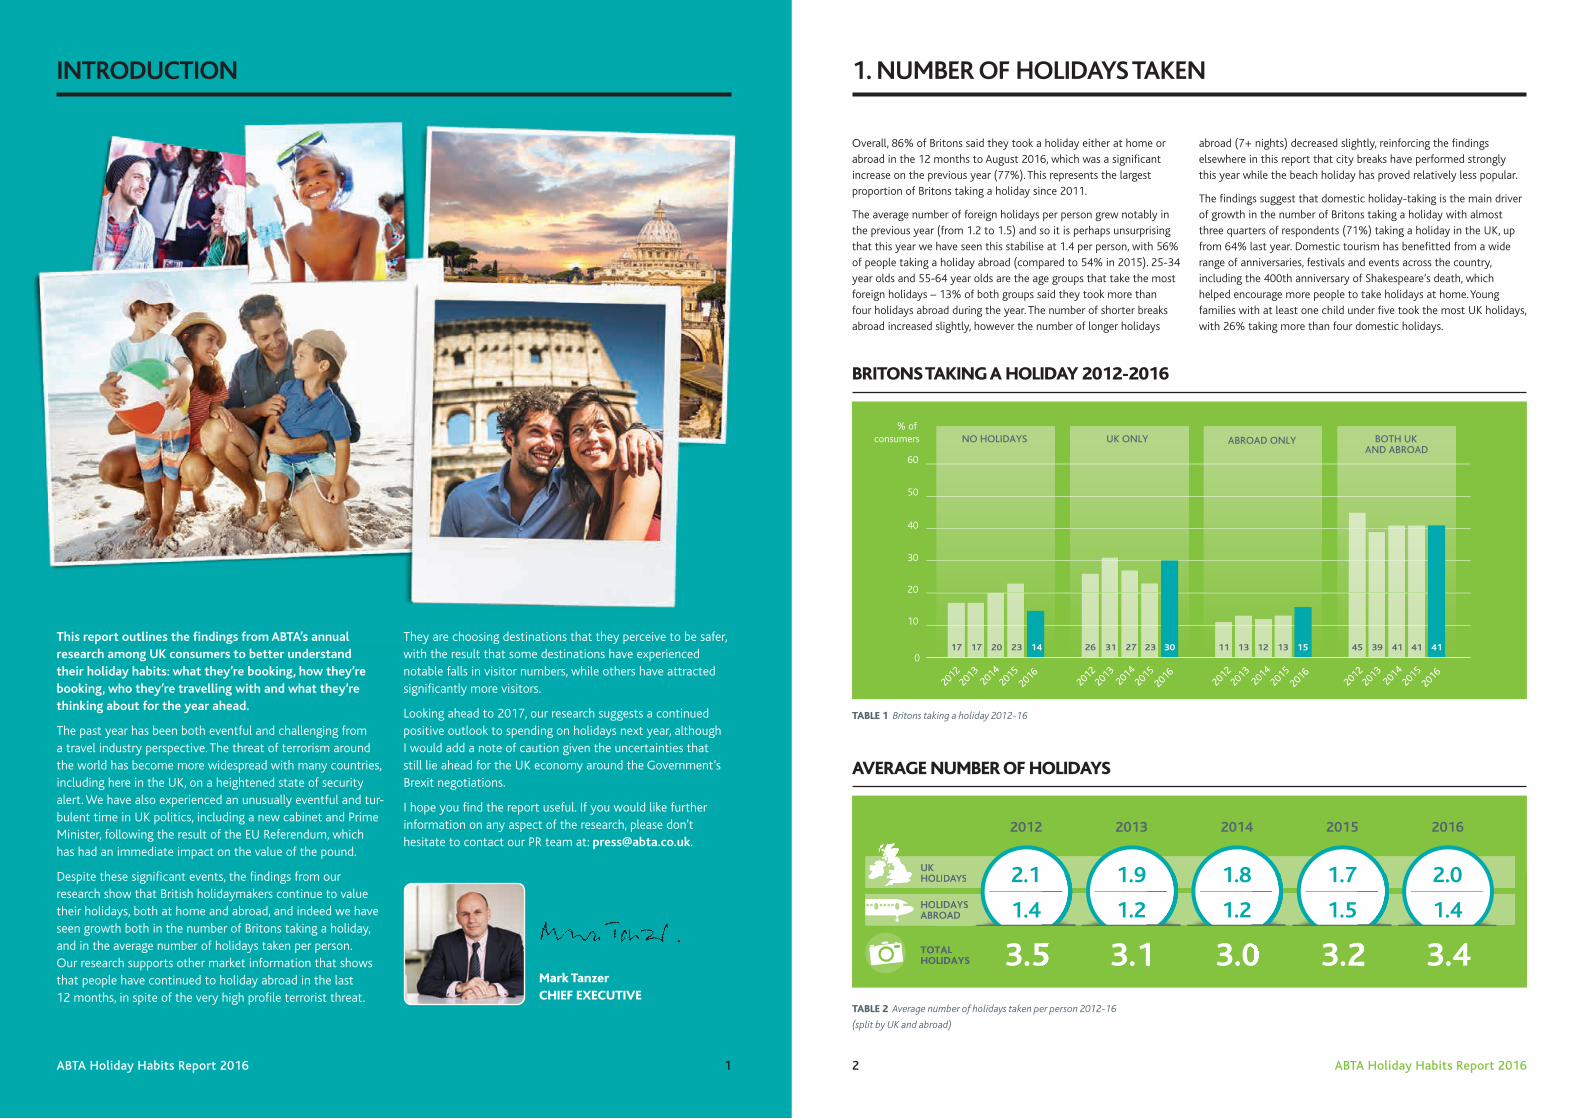
This report outlines the findings from ABTA’s annual research among UK consumers to better understand their holiday habits: what they’re booking, how they’re booking, who they’re travelling with and what they’re thinking about for the year ahead.
The past year has been both eventful and challenging from a travel industry perspective. The threat of terrorism around the world has become more widespread with many countries, including here in the UK, on a heightened state of security alert. We have also experienced an unusually eventful and tur-bulent time in UK politics, including a new cabinet and Prime Minister, following the result of the EU Referendum, which has had an immediate impact on the value of the pound.
Despite these significant events, the findings from our research show that British holidaymakers continue to value their holidays, both at home and abroad, and indeed we have seen growth both in the number of Britons taking a holiday, and in the average number of holidays taken per person. Our research supports other market information that shows that people have continued to holiday abroad in the last 12 months, in spite of the very high profile terrorist threat.
They are choosing destinations that they perceive to be safer, with the result that some destinations have experienced notable falls in visitor numbers, while others have attracted significantly more visitors.
Looking ahead to 2017, our research suggests a continued positive outlook to spending on holidays next year, although I would add a note of caution given the uncertainties that still lie ahead for the UK economy around the Government’s Brexit negotiations.
I hope you find the report useful. If you would like further information on any aspect of the research, please don’t hesitate to contact our PR team at: [email protected].
Mark Tanzer CHIEF EXECUTIVE

City breaks continue to maintain their leading position as the nation’s favourite holiday type, with over half of all respondents having taken one in the past 12 months and almost as many planning to take one in the next 12 months. There has been a fall
in the popularity of the beach holiday from 50% to 38%, although it remains the second most popular holiday type and 44% of respondents say they plan to take one next year. Countryside breaks are the third most popular holiday type.
It is most common for people to go on holiday with their partner (51%) or their immediate family (39%). Last year also saw one in five people (20%) holidaying with extended family (family members
from outside the household) and this figure remains static in 2016. More than eight in ten (82%) people who went on an extended family holiday said they did so to spend quality time together.
The “opportunity to be able to do what I want” is the number one reason for holidaying solo – 79% of those who went on holiday alone gave this as a reason. This is particularly true of 25-34 year olds, with nine out of ten (90%) citing this as a reason for travelling alone.
However, there are some notable demographic differences in other reasons why people choose to holiday alone.
Among families with older children (81%) and 45-54 year olds (82%) “taking some time out” is a key motivator, perhaps reflecting the pressures of a common life-stage of these groups caught between bringing up children as well as looking after elderly parents and working full-time.
Those over the age of 65 are most likely to holiday alone (18%) and for them, “travelling to a new destination” is a key driver with 45% stating this as a reason.
The survey suggests women (12%) are almost as likely as men (14%) to holiday alone, although their reasons for travelling may vary. Women find the idea of visiting a new destination particularly appealing (51% versus 35% of men) while among men, the chance to meet new people is more of a draw (45% versus 37% of women.)
Unsurprisingly, just over a quarter (27%) of 18-24 year olds who travelled solo were taking a career break or gap year before university.
3. WHAT TYPE OF HOLIDAYS HAVE BEEN BOOKED?
4 ABTAHolidayHabitsReport2016ABTAHolidayHabitsReport2016 3
2. HOLIDAY COMPANIONS: WHO DO PEOPLE HOLIDAY WITH?
HOLIDAYING ALONE: THE EMERGENCE OF THE SOLO TRAVELLER
WHO PEOPLE HOLIDAYED WITH IN 2016 TOP TEN TYPES OF HOLIDAY TAKEN IN THE PAST 12 MONTHS
TABLE 4 Top ten types of holiday taken in the past 12 months
*or sporting holiday (walking, cycling, sailing, trekking) **or a home swap, home stay, couch surfing
TABLE 3 Holiday companionsTABLE 3 Holiday companions
PARTNER ONLY
IMMEDIATE FAMILY
ADULT ONLY GROUP
EXTENDED FAMILY (with family members from outside the household)
ALONE
GROUP OF FRIENDS INCLUDING KIDS
51%
39%
23%
20%
13%
6%
A CITY BREAK
53%
A BEACH HOLIDAY
38%
A COUNTRYSIDE BREAK
24%
AN ALL-INCLUSIVE HOLIDAY
18%
LAKES & MOUNTAINS
10%
AN ACTIVITY HOLIDAY*
9%
A CRUISE
8%
A TRIP TO SEE A MUSIC EVENT
8%
A TRAIN HOLIDAY
8%
RENTING A PRIVATE HOME**
7%
79%say the “opportunity to do what I want” is the reason
for holidaying solo
51%of women travelling alone
find the idea of visiting new destinations particularly
appealing
A TABLET (e.g. iPad)
A MOBILEPHONE
A PC OR LAPTOP
Total 18-24 25-34 35-44 45-54 55-64 65+
92% 91% 84% 91% 95% 97% 95%
23% 22% 37% 28% 22% 16% 10%
13% 19% 27% 19% 6% 0% 1%
5. WHO DID PEOPLE BOOK THEIR HOLIDAYS WITH?
6 ABTAHolidayHabitsReport2016ABTAHolidayHabitsReport2016 5
DEVICES FOR BOOKING HOLIDAYS
The PC continues to be the most popular online booking device by a long way. Bookings on tablets have remained fairly steady since last year, with 23% of online bookers using them compared to 24% last year. An increase in 35-54 year olds using them has been offset by a fall in 18-24 year olds doing so.
Mobile phone bookings have seen a decline across all age groups apart from among 35-44 year olds, (where they have increased
by 3%), with particularly notable falls among 18-24 year olds and those aged over 55.
Our research suggests that this could be because people find the mobile booking experience more difficult. Only 44% of people said they found the experience of booking on a mobile easy, compared with 80% who booked on a PC.
4. HOW ARE PEOPLE BOOKING THEIR HOLIDAYS?
BOOKING METHODS OVER PAST 12 MONTHS
ONLINE BOOKING DEVICES
TABLE 6 Online booking devices for holidays by age
76% 11%19%21%
ONLINE OVER THEPHONE
IN PERSON(e.g. in store)
SOMEONE ELSE BOOKEDTHE HOLIDAY(S)
TABLE 5 How have you booked your holidays in the past 12 months?
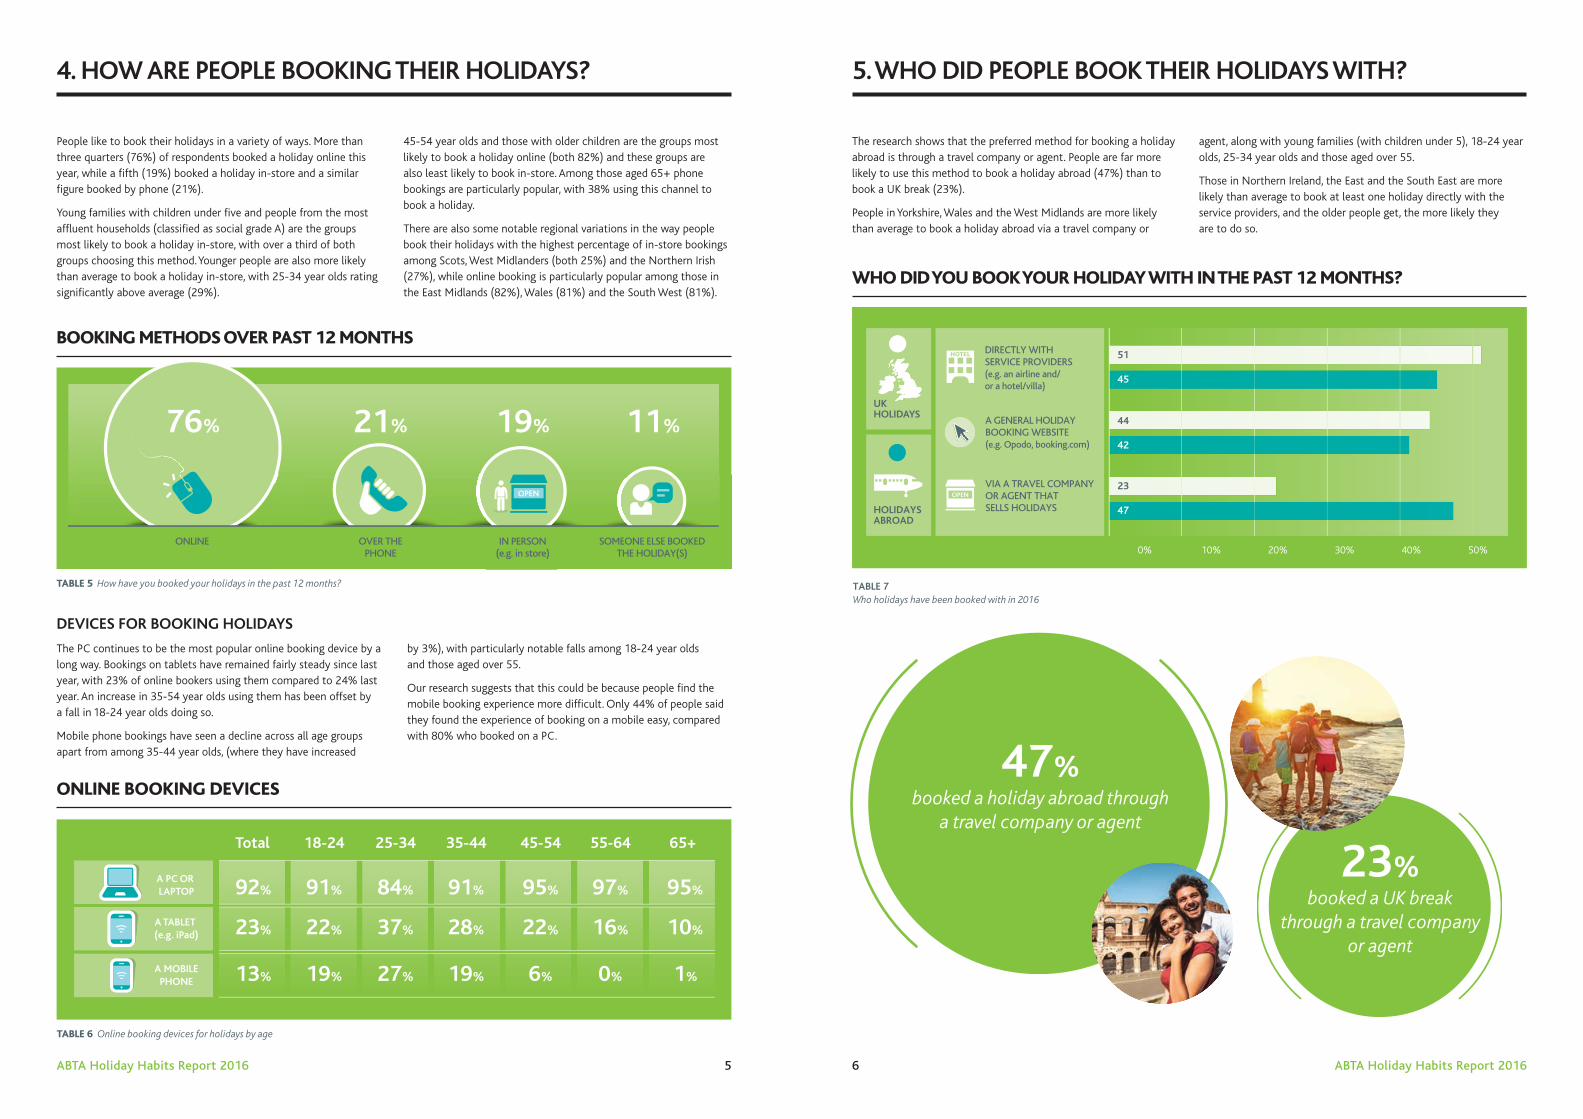
People like to book their holidays in a variety of ways. More than three quarters (76%) of respondents booked a holiday online this year, while a fifth (19%) booked a holiday in-store and a similar figure booked by phone (21%).
Young families with children under five and people from the most affluent households (classified as social grade A) are the groups most likely to book a holiday in-store, with over a third of both groups choosing this method. Younger people are also more likely than average to book a holiday in-store, with 25-34 year olds rating significantly above average (29%).
45-54 year olds and those with older children are the groups most likely to book a holiday online (both 82%) and these groups are also least likely to book in-store. Among those aged 65+ phone bookings are particularly popular, with 38% using this channel to book a holiday.
There are also some notable regional variations in the way people book their holidays with the highest percentage of in-store bookings among Scots, West Midlanders (both 25%) and the Northern Irish (27%), while online booking is particularly popular among those in the East Midlands (82%), Wales (81%) and the South West (81%).
The research shows that the preferred method for booking a holiday abroad is through a travel company or agent. People are far more likely to use this method to book a holiday abroad (47%) than to book a UK break (23%).
People in Yorkshire, Wales and the West Midlands are more likely than average to book a holiday abroad via a travel company or
agent, along with young families (with children under 5), 18-24 year olds, 25-34 year olds and those aged over 55.
Those in Northern Ireland, the East and the South East are more likely than average to book at least one holiday directly with the service providers, and the older people get, the more likely they are to do so.
UKHOLIDAYS
HOLIDAYSABROAD
TABLE 7Who holidays have been booked with in 2016
0% 10% 20% 30% 40% 50%
47
23
42
44
45
51
VIA A TRAVEL COMPANY OR AGENT THAT SELLS HOLIDAYS
A GENERAL HOLIDAY BOOKING WEBSITE (e.g. Opodo, booking.com)
DIRECTLY WITH SERVICE PROVIDERS (e.g. an airline and/or a hotel/villa)
WHO DID YOU BOOK YOUR HOLIDAY WITH IN THE PAST 12 MONTHS?
47%booked a holiday abroad through
a travel company or agent
23%booked a UK break
through a travel company or agent
62%of the most affluent
households took a package holiday last year
73%choose a package holiday
because everything is taken care of
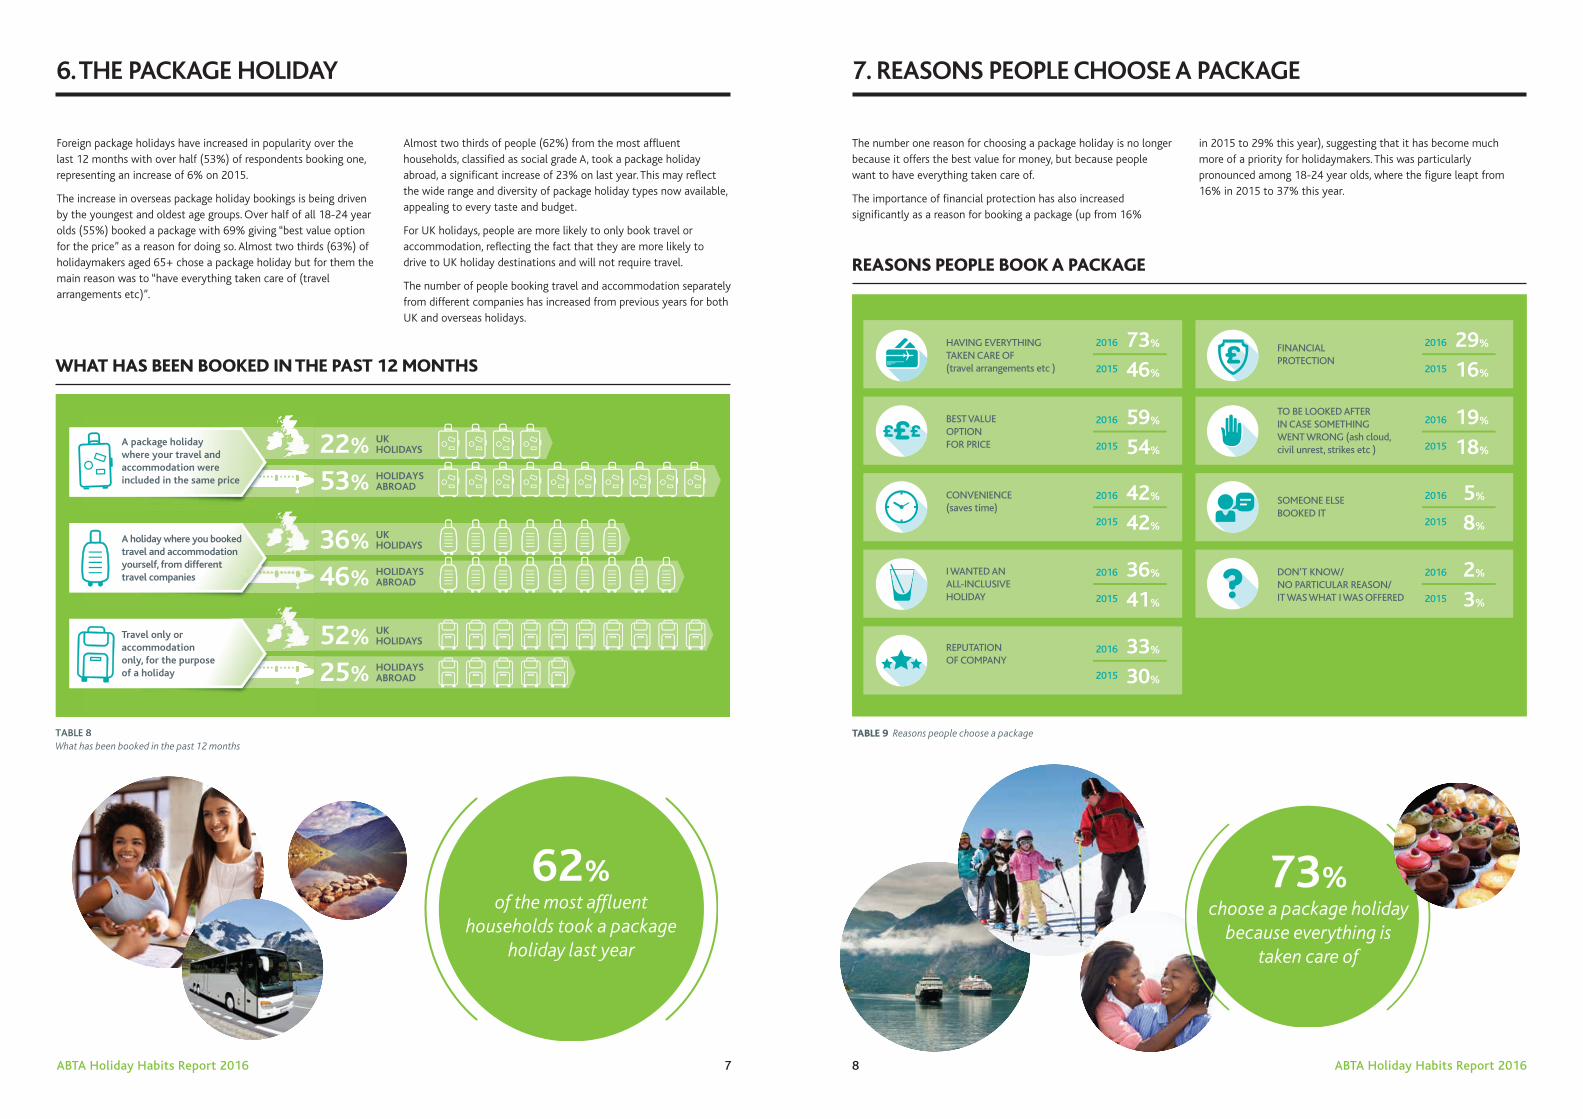
The number one reason for choosing a package holiday is no longer because it offers the best value for money, but because people want to have everything taken care of.
The importance of financial protection has also increased significantly as a reason for booking a package (up from 16%
in 2015 to 29% this year), suggesting that it has become much more of a priority for holidaymakers. This was particularly pronounced among 18-24 year olds, where the figure leapt from 16% in 2015 to 37% this year.
Foreign package holidays have increased in popularity over the last 12 months with over half (53%) of respondents booking one, representing an increase of 6% on 2015.
The increase in overseas package holiday bookings is being driven by the youngest and oldest age groups. Over half of all 18-24 year olds (55%) booked a package with 69% giving “best value option for the price” as a reason for doing so. Almost two thirds (63%) of holidaymakers aged 65+ chose a package holiday but for them the main reason was to “have everything taken care of (travel arrangements etc)”.
Almost two thirds of people (62%) from the most affluent households, classified as social grade A, took a package holiday abroad, a significant increase of 23% on last year. This may reflect the wide range and diversity of package holiday types now available, appealing to every taste and budget.
For UK holidays, people are more likely to only book travel or accommodation, reflecting the fact that they are more likely to drive to UK holiday destinations and will not require travel.
The number of people booking travel and accommodation separately from different companies has increased from previous years for both UK and overseas holidays.
8 ABTAHolidayHabitsReport2016ABTAHolidayHabitsReport2016 7
WHAT HAS BEEN BOOKED IN THE PAST 12 MONTHS
REASONS PEOPLE BOOK A PACKAGE
UKHOLIDAYS
ABROADHOLIDAYS
Table XWhat has been booked in the last 12 months
22%
47%
UKHOLIDAYS
ABROADHOLIDAYS
15%
26%
UKHOLIDAYS
ABROADHOLIDAYS
27%
34%
UKHOLIDAYS
ABROADHOLIDAYS
47%
24%
X
Holiday where you booked and paid for separate travel & accommodation, but from the same travel company
A holiday where you booked travel & accommodationyourself, from differenttravel companies
Travel only accommodationfor the purposeof a holiday
Package holiday where your travel &accommodation were included in the same price
UKHOLIDAYS
HOLIDAYSABROAD
TABLE 8What has been booked in the past 12 months
22%
53%
UKHOLIDAYS
HOLIDAYSABROAD
36%
46%
UKHOLIDAYS
HOLIDAYSABROAD
52%
25%
8
A holiday where you booked travel and accommodation yourself, from different travel companies
Travel only or accommodation only, for the purpose of a holiday
A package holiday where your travel and accommodation were included in the same price
HAVING EVERYTHING TAKEN CARE OF (travel arrangements etc )
BEST VALUE OPTION FOR PRICE
CONVENIENCE (saves time)
I WANTED AN ALL-INCLUSIVE HOLIDAY
REPUTATION OF COMPANY
FINANCIAL PROTECTION
TO BE LOOKED AFTER IN CASE SOMETHING WENT WRONG (ash cloud, civil unrest, strikes etc )
SOMEONE ELSE BOOKED IT
DON’T KNOW/ NO PARTICULAR REASON/ IT WAS WHAT I WAS OFFERED
73%
59%
42%
36%
33%
29%
19%
5%
2%
HAVING EVERYTHING TAKEN CARE OF (travel arrangements etc )
BEST VALUE OPTION FOR PRICE
CONVENIENCE (saves time)
I WANTED AN ALL-INCLUSIVE HOLIDAY
REPUTATION OF COMPANY
FINANCIAL PROTECTION
TO BE LOOKED AFTER IN CASE SOMETHING WENT WRONG (ash cloud, civil unrest, strikes etc )
SOMEONE ELSE BOOKED IT
DON’T KNOW/ NO PARTICULAR REASON/ IT WAS WHAT I WAS OFFERED
46%
73%
2015
2016
16%
29%
2015
2016
54%
59%
2015
2016
18%
19%
2015
2016
42%
42%
2015
2016
8%
5%
2015
2016
41%
36%
2015
2016
30%
33%
2015
2016
3%
2%
2015
2016
6. THE PACKAGE HOLIDAY 7. REASONS PEOPLE CHOOSE A PACKAGE
TABLE 9 Reasons people choose a package
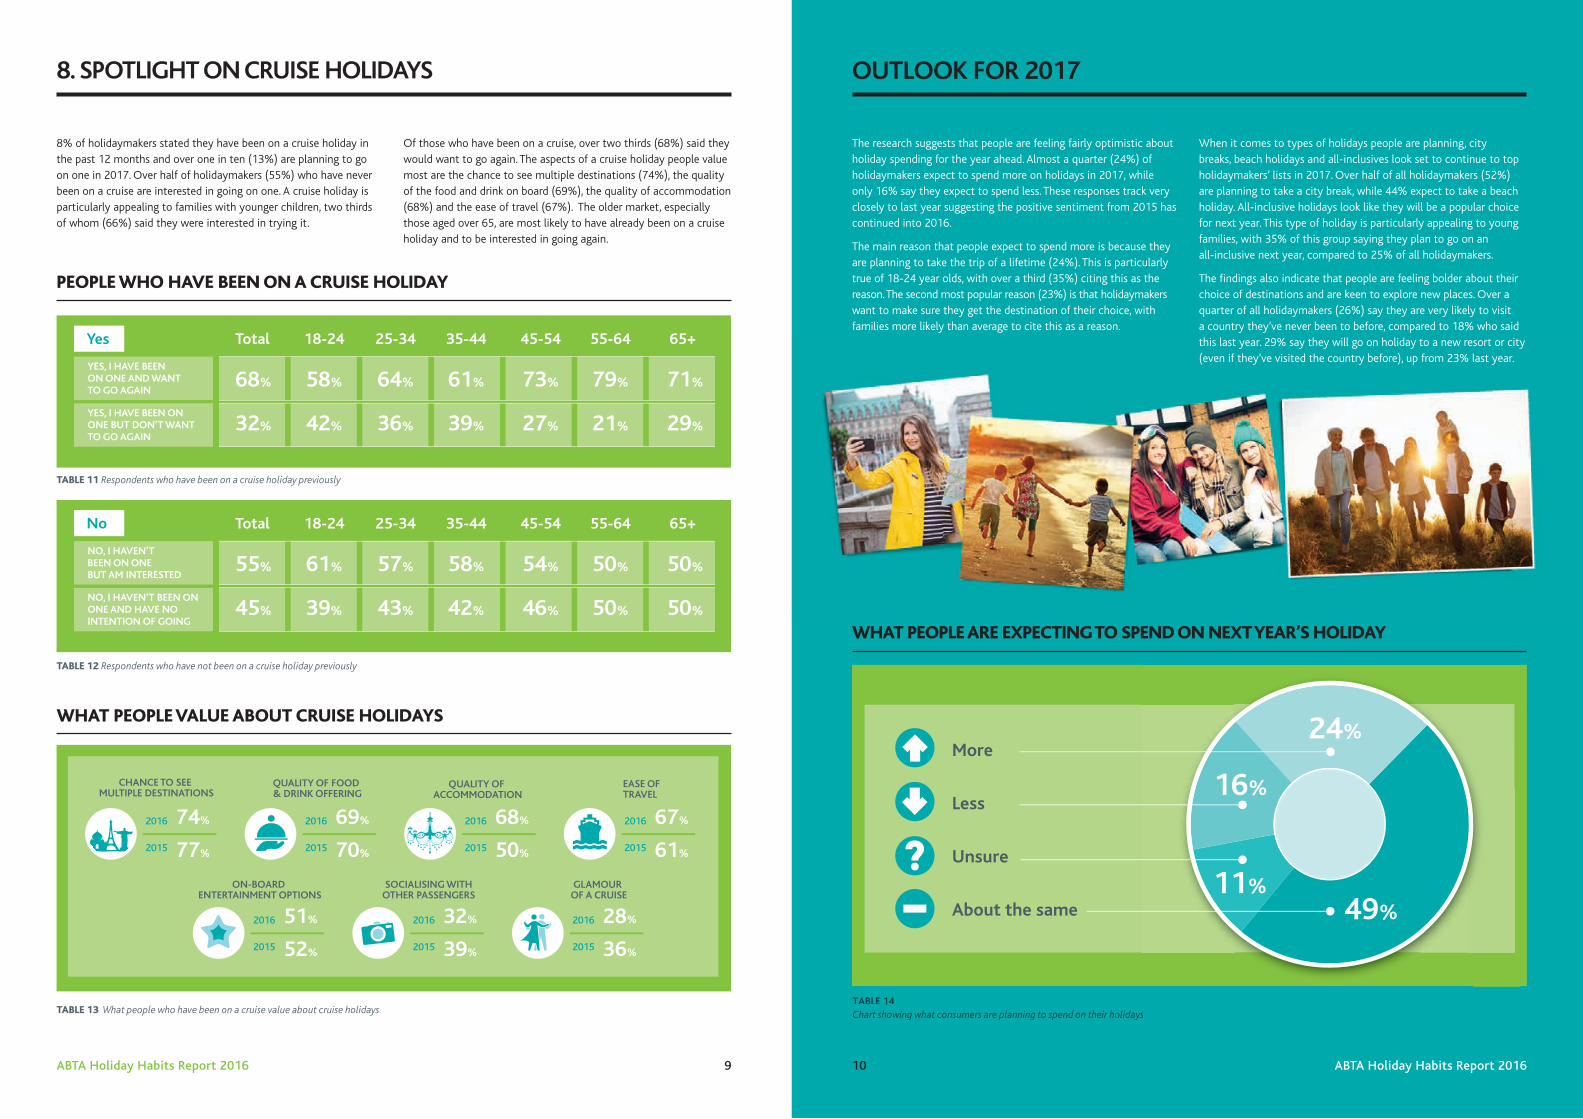
The research suggests that people are feeling fairly optimistic about holiday spending for the year ahead. Almost a quarter (24%) of holidaymakers expect to spend more on holidays in 2017, while only 16% say they expect to spend less. These responses track very closely to last year suggesting the positive sentiment from 2015 has continued into 2016.
The main reason that people expect to spend more is because they are planning to take the trip of a lifetime (24%). This is particularly true of 18-24 year olds, with over a third (35%) citing this as the reason. The second most popular reason (23%) is that holidaymakers want to make sure they get the destination of their choice, with families more likely than average to cite this as a reason.
When it comes to types of holidays people are planning, city breaks, beach holidays and all-inclusives look set to continue to top holidaymakers’ lists in 2017. Over half of all holidaymakers (52%) are planning to take a city break, while 44% expect to take a beach holiday. All-inclusive holidays look like they will be a popular choice for next year. This type of holiday is particularly appealing to young families, with 35% of this group saying they plan to go on an all-inclusive next year, compared to 25% of all holidaymakers.
The findings also indicate that people are feeling bolder about their choice of destinations and are keen to explore new places. Over a quarter of all holidaymakers (26%) say they are very likely to visit a country they’ve never been to before, compared to 18% who said this last year. 29% say they will go on holiday to a new resort or city (even if they’ve visited the country before), up from 23% last year.
8% of holidaymakers stated they have been on a cruise holiday in the past 12 months and over one in ten (13%) are planning to go on one in 2017. Over half of holidaymakers (55%) who have never been on a cruise are interested in going on one. A cruise holiday is particularly appealing to families with younger children, two thirds of whom (66%) said they were interested in trying it.
Of those who have been on a cruise, over two thirds (68%) said they would want to go again. The aspects of a cruise holiday people value most are the chance to see multiple destinations (74%), the quality of the food and drink on board (69%), the quality of accommodation (68%) and the ease of travel (67%). The older market, especially those aged over 65, are most likely to have already been on a cruise holiday and to be interested in going again.
OUTLOOK FOR 20178. SPOTLIGHT ON CRUISE HOLIDAYS
10 ABTAHolidayHabitsReport2016ABTAHolidayHabitsReport2016 9
WHAT PEOPLE ARE EXPECTING TO SPEND ON NEXT YEAR’S HOLIDAY
More
Less
Unsure
About the same
TABLE 14Chart showing what consumers are planning to spend on their holidayss
16%
24%
11%49%
PEOPLE WHO HAVE BEEN ON A CRUISE HOLIDAY
WHAT PEOPLE VALUE ABOUT CRUISE HOLIDAYS
52%
51%
2015
201639%
32%
2015
201636%
28%
2015
2016
Total 18-24 25- 34 35-44 45-54 55-64 65+
40% 45% 39% 47% 45% 38% 30%
33% 29% 29% 34% 38% 38% 30%
18% 15% 21% 12% 13% 19% 29%
9% 11% 12% 8% 5% 5% 12%
NO, I HAVEN’T BEEN ON ONE BUT AM INTERESTED
NO, I HAVEN’T BEEN ON ONE AND HAVE NO INTENTION OF GOING
YES, I HAVE BEEN ON ONE AND WANT TO GO AGAIN
YES, I HAVE BEEN ON ONE BUT DON’T WANT TO GO AGAIN
Total 18-24 25-34 35-44 45-54 55-64 65+
68% 58% 64% 61% 73% 79% 71%
32% 42% 36% 39% 27% 21% 29%
YES, I HAVE BEEN ON ONE AND WANT TO GO AGAIN
YES, I HAVE BEEN ON ONE BUT DON’T WANT TO GO AGAIN
Total 18-24 25-34 35-44 45-54 55-64 65+
55% 61% 57% 58% 54% 50% 50%
45% 39% 43% 42% 46% 50% 50%
NO, I HAVEN’T BEEN ON ONE BUT AM INTERESTED
NO, I HAVEN’T BEEN ON ONE AND HAVE NO INTENTION OF GOING
77%
73%
2015
201670%
69%
2015
201650%
68%
2015
201661%
67%
2015
2016
CHANCE TO SEE MULTIPLE DESTINATIONS
ON-BOARD ENTERTAINMENT OPTIONS
SOCIALISING WITH OTHER PASSENGERS
GLAMOUR OF A CRUISE
QUALITY OF FOOD & DRINK OFFERING
QUALITY OF ACCOMMODATION
EASE OF TRAVEL
CHANCE TO SEE MULTIPLE DESTINATIONS
ON-BOARD ENTERTAINMENT OPTIONS
SOCIALISING WITHOTHER PASSENGERS
GLAMOUR OF A CRUISE
QUALITY OF FOOD & DRINK OFFERING
QUALITY OF ACCOMMODATION
EASE OFTRAVEL
CHANCE TO SEE MULTIPLE DESTINATIONS
ON-BOARD ENTERTAINMENT OPTIONS
SOCIALISING WITHOTHER PASSENGERS
GLAMOUR OF A CRUISE
QUALITY OF FOOD & DRINK OFFERING
QUALITY OF ACCOMMODATION
EASE OFTRAVEL
CHANCE TO SEE MULTIPLE DESTINATIONS
QUALITY OF FOOD & DRINK OFFERING
QUALITY OF ACCOMMODATION
EASE OF TRAVEL
ON-BOARD ENTERTAINMENT OPTIONS
SOCIALISING WITH OTHER PASSENGERS
GLAMOUR OF A CRUISE
28%32%51%
74% 69% 68% 67%
52%
51%
2015
201639%
32%
2015
201636%
28%
2015
2016
77%
73%
2015
201670%
69%
2015
201650%
68%
2015
201661%
67%
2015
2016
CHANCE TO SEE MULTIPLE DESTINATIONS
ON-BOARD ENTERTAINMENT OPTIONS
SOCIALISING WITH OTHER PASSENGERS
GLAMOUR OF A CRUISE
QUALITY OF FOOD & DRINK OFFERING
QUALITY OF ACCOMMODATION
EASE OF TRAVEL
Yes
No
77%
74%
2015
2016
70%
69%
2015
2016
50%
68%
2015
2016
52%
51%
2015
2016
39%
32%
2015
2016
36%
28%
2015
2016
61%
67%
2015
2016
74%
77%
2015
2016
51%
52%
2015
2016
32%
39%
2015
201628%
36%
2015
2016
69%
70%
2015
201668%
50%
2015
201667%
61%
2015
2016
52%
51%
2015
201639%
32%
2015
201636%
28%
2015
2016
Total 18-24 25- 34 35-44 45-54 55-64 65+
40% 45% 39% 47% 45% 38% 30%
33% 29% 29% 34% 38% 38% 30%
18% 15% 21% 12% 13% 19% 29%
9% 11% 12% 8% 5% 5% 12%
NO, I HAVEN’T BEEN ON ONE BUT AM INTERESTED
NO, I HAVEN’T BEEN ON ONE AND HAVE NO INTENTION OF GOING
YES, I HAVE BEEN ON ONE AND WANT TO GO AGAIN
YES, I HAVE BEEN ON ONE BUT DON’T WANT TO GO AGAIN
Total 18-24 25-34 35-44 45-54 55-64 65+
68% 58% 64% 61% 73% 79% 71%
32% 42% 36% 39% 27% 21% 29%
YES, I HAVE BEEN ON ONE AND WANT TO GO AGAIN
YES, I HAVE BEEN ON ONE BUT DON’T WANT TO GO AGAIN
Total 18-24 25-34 35-44 45-54 55-64 65+
55% 61% 57% 58% 54% 50% 50%
45% 39% 43% 42% 46% 50% 50%
NO, I HAVEN’T BEEN ON ONE BUT AM INTERESTED
NO, I HAVEN’T BEEN ON ONE AND HAVE NO INTENTION OF GOING
77%
73%
2015
201670%
69%
2015
201650%
68%
2015
201661%
67%
2015
2016
CHANCE TO SEE MULTIPLE DESTINATIONS
ON-BOARD ENTERTAINMENT OPTIONS
SOCIALISING WITH OTHER PASSENGERS
GLAMOUR OF A CRUISE
QUALITY OF FOOD & DRINK OFFERING
QUALITY OF ACCOMMODATION
EASE OF TRAVEL
CHANCE TO SEE MULTIPLE DESTINATIONS
ON-BOARD ENTERTAINMENT OPTIONS
SOCIALISING WITHOTHER PASSENGERS
GLAMOUR OF A CRUISE
QUALITY OF FOOD & DRINK OFFERING
QUALITY OF ACCOMMODATION
EASE OFTRAVEL
CHANCE TO SEE MULTIPLE DESTINATIONS
ON-BOARD ENTERTAINMENT OPTIONS
SOCIALISING WITHOTHER PASSENGERS
GLAMOUR OF A CRUISE
QUALITY OF FOOD & DRINK OFFERING
QUALITY OF ACCOMMODATION
EASE OFTRAVEL
CHANCE TO SEE MULTIPLE DESTINATIONS
QUALITY OF FOOD & DRINK OFFERING
QUALITY OF ACCOMMODATION
EASE OF TRAVEL
ON-BOARD ENTERTAINMENT OPTIONS
SOCIALISING WITH OTHER PASSENGERS
GLAMOUR OF A CRUISE
28%32%51%
74% 69% 68% 67%
52%
51%
2015
201639%
32%
2015
201636%
28%
2015
2016
77%
73%
2015
201670%
69%
2015
201650%
68%
2015
201661%
67%
2015
2016
CHANCE TO SEE MULTIPLE DESTINATIONS
ON-BOARD ENTERTAINMENT OPTIONS
SOCIALISING WITH OTHER PASSENGERS
GLAMOUR OF A CRUISE
QUALITY OF FOOD & DRINK OFFERING
QUALITY OF ACCOMMODATION
EASE OF TRAVEL
Yes
No
77%
74%
2015
2016
70%
69%
2015
2016
50%
68%
2015
2016
52%
51%
2015
2016
39%
32%
2015
2016
36%
28%
2015
2016
61%
67%
2015
2016
74%
77%
2015
2016
51%
52%
2015
2016
32%
39%
2015
201628%
36%
2015
2016
69%
70%
2015
201668%
50%
2015
201667%
61%
2015
2016
TABLE 11 Respondents who have been on a cruise holiday previously
TABLE 12 Respondents who have not been on a cruise holiday previously
TABLE 13 What people who have been on a cruise value about cruise holidays

DID YOU KNOW…
ABOUT THE RESEARCH
ABOUT ABTA
Email: [email protected]
Web: abta.com
Twitter: @ABTAtravel
ABTA Ltd
Post: 30 Park Street, London, SE1 9EQ
Tel: +44 (0)20 3117 0500
Fax: +44 (0)20 3117 0581
ABTA has been a trusted travel brand for over 65 years. Our purpose is to help our Members to grow their businesses successfully and sustainably, and to help their customers travel with confidence.
The ABTA brand stands for support, protection and expertise. This means consumers have confidence in ABTA and a strong trust in ABTA Members. These qualities are core to us as they ensure that holidaymakers remain confident in the holiday products that they buy from our Members.
We help our Members and their customers navigate through today’s changing travel landscape by raising
standards in the industry; offering schemes of financial protection; providing an independent complaints resolution service should something go wrong; giving guidance on issues from sustainability to health and safety and by presenting a united voice to government to ensure the industry and the public get a fair deal.
ABTA currently has around 1,200 Members with a combined annual UK turnover of £32 billion. For more details about what we do, what being an ABTA Member means and how we help the British public travel with confidence, visit abta.com.
Consumer research was conducted by Arkenford Ltd (www.arkenford.co.uk) who specialise in leisure and tourism market research. The ABTA Consumer Trends survey generated responses from a nationally
representative sample of 1,962 consumers using an online research methodology and related to holiday booking habits in the 12 months to August 2016. Fieldwork was conducted in August 2016.
CONTACT US
65%
76% 75%
63%
of people expect their holiday company to be a Member of ABTA
of people feel more confident
booking a holiday with an ABTA Member
of people feel less positively
of companies that are not ABTA Members
of people feel that ABTA’s help and advice
in the event of a crisis is essential