home | food climate research network (fcrn) - ˘ ˇ ˆ˙1997–2020 55 4.3 total production of food...
TRANSCRIPT

����������
��� �������������
������������� ��� ��������

����������
��� ����������������
���������� ��� ��������
������������ �����
�����������
��������������
�������
���������������
International Food Policy Research InstituteWashington, D.C.
WorldFish CenterPenang, Malaysia

Copyright © 2003 International Food Policy Research Institute and WorldFish Center.All rights reserved. Sections of this book may be reproduced without the express permissionof, but with acknowledgment to, the International Food Policy Research Institute andWorldFish Center.
WorldFish Center Technical Report 62.
Library of Congress Cataloging-in-Publication Data
Fish to 2020 : supply and demand in changing global markets /Christopher L. Delgado ... [et al.].
p. cm.Includes bibliographical references and index.
ISBN 0-89629-725-X (alk. paper)1. Fish trade. 2. Fish trade—Developing countries. 3. Fisheries—Economicaspects 4. Fisheries—Environmental aspects I. Delgado, Christopher L.II. International Food Policy Research Institute. III. WorldFish Center.
HD9450.5.F56 2003333.95'611—dc22
2003019645
��������
Tables viFigures ixBoxes xForeword xiAcknowledgments xiii1. Introduction 12. Historical Trends and Current Patterns of Fisheries Production 113. Demand for Fish as Food and Feed Through the 1990s 294. Projections to 2020 Under Different Scenarios 455. Interactions Between Fisheries and the Natural Environment 656. Implications for Fisheries Technology Needs and Prospects 817. Rapidly Growing Fisheries Trade and its Impacts 1058. Conclusions 137Appendixes
A. Regional Classification of Countries 153B. Commodity Groups 157C. Commodity Aggregation and Balancing Procedures 159D. Handling Fisheries Trade Data in IMPACT 163E. Supplementary Tables 167F. Acronyms and Glossary 197
Bibliography 203Index 217Contributors 225
�

��� ��
2.1 Total production of food fish, 1973–97 122.2 Production of food fish from aquaculture, 1973–97 142.3 Production of food fish from capture, 1973–97 152.4 Global production of food fish by IMPACT category, 1973–97 192.5 Approximate unit values of IMPACT commodity groups, 1997 202.6 Production of fishmeal, 1977–97 213.1 Total consumption of food fish, 1973–97 313.2 Total per capita consumption of food fish, 1973–97 323.3 Changing relative importance of low-value food fish as a share of total food
fish consumption, 1973–97 363.4 Nominal and real export unit values of fisheries commodities 393.5 Nominal and real export unit values of IMPACT categories 403.6 Factors contributing to differential growth rates for food fish in developed
and developing countries, 1985–97 423.7 Use of fishmeal, 1973–97 434.1 Description of IMPACT projection scenarios 534.2 Projected total change in prices under different production scenarios,
1997–2020 554.3 Total production of food fish, 1997 and 2020 574.4 Regional shares of global food fish production, 1997 and 2020 584.5 Total projected production of food fish under various scenarios, 2020 594.6 Total per capita consumption of food fish, 1973–97 and 2020 614.7 Total per capita consumption of food fish under different production
scenarios, 2020 626.1 Estimated shares of fishmeal use by sector 836.2 Estimated shares of fish oil use by sector 846.3 Net exports of fishmeal and fish oil, 1997 856.4 Use of fishmeal and fish oil in aquafeeds for various categories of fish,
1999 89
��
������
6.5 Projected real price change of fisheries commodities under various scenarios,1997–2020 92
7.1 Net exports of tuna products, 1977–97 1117.2 Net exports of cod products, 1977–97 1127.3 Net exports of salmon products, 1977–97 1137.4 Net exports of frozen shrimp products, 1977–97 1147.5 Net exports of freshwater fish products, 1977–97 1157.6 Total net exports of food fish, 1973–97 and 2020 1167.7 Net exports of high-value finfish, 1973–97 and 2020 1177.8 Net exports of low-value food fish, 1973–97 and 2020 1187.9 Net exports of crustaceans, 1973–97 and 2020 1197.10 Net exports of mollusks, 1973–97 and 2020 1207.11 Net exports of fishmeal, 1977–97 and 2020 1217.12 Total projected net exports of food fish under various IMPACT scenarios,
2020 1227.13 Projected net exports of low-value food fish under various IMPACT
scenarios, 2020 1237.14 Projected net exports of fishmeal under various IMPACT scenarios,
2020 1247.15 Reductions in average tariffs for fisheries imports in selected Asian
countries 1307.16 Tariff escalation for some developed-country fisheries imports 130B.1 IMPACT fisheries commodity categories and component ISSCAAP
groups 158D.1 Change in net exports from different sources, 1985–97 165E.1 Total production of food fish, 1973–97 and 2020 167E.2 Production of food fish from capture, 1973–97 and 2020 168E.3 Production of food fish from aquaculture, 1973–97 and 2020 169E.4 Production of low-value food fish from capture, 1973–97 and 2020 170E.5 Production of high-value finfish from capture, 1973–97 and 2020 171E.6 Production of mollusks from capture, 1973–97 and 2020 172E.7 Production of crustaceans from capture, 1973–97 and 2020 173E.8 Production of low-value food fish from aquaculture, 1973–97 and
2020 174E.9 Production of high-value finfish from aquaculture, 1973–97 and 2020 175E.10 Production of mollusks from aquaculture, 1973–97 and 2020 176E.11 Production of crustaceans from aquaculture, 1973–97 and 2020 177E.12 Production of fishmeal, 1973–97 and 2020 178E.13 Production of fish oil, 1973–97 and 2020 179E.14 Total consumption of food fish, 1973–97 and 2020 180
������
E.15 Consumption of low-value food fish, 1973–97 and 2020 181E.16 Consumption of high-value finfish, 1973–97 and 2020 182E.17 Consumption of mollusks, 1973–97 and 2020 183E.18 Consumption of crustaceans, 1973–97 and 2020 184E.19 Use of fishmeal, 1973–97 and 2020 185E.20 Use of fish oil, 1973–97 and 2020 186E.21 Per capita food fish consumption, 1997 187E.22 Projected per capita food fish consumption, 2020 188E.23 Projected production of food fish from capture under various scenarios,
2020 189E.24 Projected production of food fish from aquaculture under various scenarios,
2020 190E.25 Projected total production of food fish under various scenarios, 2020 191E.26 Projected total consumption of food fish under various scenarios,
2020 192E.27 Per capita consumption of low-value food fish, 1973–97 and 2020 193E.28 Per capita consumption of high-value finfish, 1973–97 and 2020 194E.29 Per capita consumption of mollusks, 1973–97 and 2020 195E.30 Per capita consumption of crustaceans, 1973–97 and 2020 196
�������
2.1 Global capture fisheries and aquaculture production, 1970–98 132.2 Total aquaculture production, 1970–99 233.1 Re-aggregating consumption data 343.2 U.S. producer price indexes for fish and seafood products, 1947–2000 373.3 The relationship between per capita income and fish consumption 415.1 Projected capture fisheries production of food fish under IMPACT
scenarios, 2020 746.1 Ratio of fishmeal price to soymeal price, 1981–99 867.1 The rapid rise of fish in cross-border trade: Real export value of fisheries
products, 1976–98 1067.2 The rapid rise of fish in cross-border trade: Real import value of fisheries
products, 1976–98 1077.3 Gross fish-export shares in developing countries by quantity, 1977 and
1997 1087.4 Gross fish-export shares in developing countries by value, 1977 and
1997 110
��

�����
2.1 Re-aggregation of commodities according to market criteria 183.1 Apportioning aggregate food fish consumption data by market
categories 345.1 Price substitutability of aquaculture and capture products 76
�

��������
�hile fishing must surely be one of the oldest recorded sources of livelihood,it is only comparatively recently that fish have become important compo-nents of the diets of the majority of the world’s people—especially those liv-
ing in developing countries. Consumption of fish and seafood products reached 14kilograms per capita in developing countries in 2001, nearly twice the level recordedin the early 1970s, while population in those countries doubled over the same peri-od. Fish are an important component of the rapid growth of the consumption of ani-mal products in developing countries over the past two decades and into theforeseeable future.
Most of the net growth in fish production over the past 20 years has come fromthe development of fish farming, especially in the developing countries of Asia. At 11percent per year, aquaculture has in fact been the fastest growing source of food andagricultural income worldwide for the past 20 years. The composition and directionof fish trade between developed and developing countries have also shifted tremen-dously in recent years. Net fish exports of US$15 billion per year from developing todeveloped countries now surpass the monetary value of many other traditional devel-oping-country agricultural exports. Yet wild fisheries are in a state of crisis. Total catch-es of fish from the wild reached a plateau in the early 1990s. And even though theproduction of both low- and high-value aquaculture (grass carps for food and shrimpfor export, for example) has continued to grow, concerns have been raised about envi-ronmental risks associated with the ongoing intensification and spread of fish pro-duction, as well as competition between poor traditional fishers and large-scaleoperations. Choices for both technology and policy development are at a critical cross-roads. The stakes concern how small-scale fishers will retain their access rights to futurefisheries resources in the face of the demands from large-scale operators, how torebuild depleted fisheries resources and then maintain their exploitation at sustain-able levels, and how the benefits from fisheries will serve the interests of poor peopleand low-income countries in the face of increases in both fish consumption andtrade.
This is the first comprehensive quantitative study ever undertaken to inject glob-al food and agriculture debates with clear and concise fisheries policy issues,
��

including questions of food security, equity, trade, environment, and food safety. Theauthors provide a detailed assessment of policy research issues in world fisheries aris-ing from trends over the past 20 years. They then employ IFPRI’s IMPACT modelto forecast scenarios for the next 20. They explore the market linkages intrinsic to thefuture of aquaculture and capture fisheries, the changing consumer and producer rolesof different parts of the world under globalization, and the emerging tradeoffs betweenenvironmentally sound policies and equity-oriented goals. They show that viable solu-tions will require an understanding of what the separate incentives are for producersand consumers of fish, and how improved policies and new technologies interact toaffect wealth creation, poverty reduction, and environmental sustainability. Theyconclude with a list of 20 specific entry points for developed- and developing-country policies intended to influence poverty and environmental outcomes in developing countries.
The book grew out of broader collaboration between IFPRI and the WorldFishCenter that started with a consultative conference held in Hirtshals, Denmark, in thesummer of 1997. Attended by prominent fisheries policy analysts from developingcountries, the purpose of the conference was to define the key policy research issuesconfronting fisheries in developing countries, and to help recommend a commonagenda for policy research in fisheries between IFPRI, a food policy research institute,and the WorldFish Center, a specialist fisheries research agency. Participants identi-fied the need for a study such as this one to illustrate the complex tradeoffs withinthe fisheries sector, the interactions with events outside the sector, and the impact offisheries on food issues more broadly.
In approaching this difficult assignment, the team benefited greatly from thepartnership of IFPRI’s expertise in global modeling and food policy analysis andWorldFish’s specific knowledge of the fisheries sector and related policy and tech-nology issues. Several intermediate and spin-off products involving a number ofadditional authors have resulted from the partnership over the past five years. The planis to continue this fruitful collaboration, focusing on areas identified in the study aspriorities for future research.
Joachim von Braun Director General
International Food Policy Research Institute
Meryl WilliamsDirector General
WorldFish Center
��������

!���� ��������
�e would like to particularly acknowledge the support, patience, and foresightof four managers and colleagues at our institutes who recognized the valueand importance of a comprehensive, forward-looking approach to global fish
supply and demand. These individuals were also—importantly—willing to risk pro-moting a research venture without the certainty of a worthwhile product. Per Pinstrup-Andersen, Director General of IFPRI at the time this work began and currently H.E. Babcock Professor of Food, Nutrition, and Public Policy at Cornell University, wasinstrumental in this regard, as was Rajul Pandya-Lorch, head of IFPRI’s 2020 VisionInitiative. Their moral and financial support were fundamental to getting this workoff the ground. They also provided lengthy written comments on the first draft thatwere a valuable contribution. We would also like to acknowledge the ongoing signif-icant support for fisheries policy research at IFPRI from Joachim von Braun, IFPRI’scurrent Director General. Meryl Williams, Director General of the WorldFish Center(formerly known as ICLARM), consistently provided moral support to the team, facil-itated collaboration from her staff, and placed the moral authority of her centerbehind fundraising efforts for what—in the end—was a lengthy effort.
The origins of this study lie in a consultation of eminent fisheries experts fromdeveloping countries, universities in Europe and the United States, donor agencies,and the Food and Agriculture Organization of the United Nations (FAO) through ameeting on research priorities for fisheries policy in developing countries that was heldin Hirtshals, Denmark, in 1997. The meeting was made possible by the financial sup-port of Danish International Development Assistance (Danida) and the OverseasFishery Cooperation Foundation of Japan; it was co-sponsored by IFPRI, theWorldFish Center, and the Institute of Fisheries Management and CoastalCommunity Development, Denmark; and it was held in cooperation with the FAOand the Royal Veterinary and Agricultural University, Copenhagen. Undertaking astudy of this kind was identified as a top priority at that meeting.
We would also like to acknowledge help on specific issues provided by colleagueswithin and beyond our two institutes. The team particularly wishes to acknowledgethe invaluable research assistance of Claude Courbois, an IFPRI staff member in the
����

early stages of the project when data re-aggregation seemed so daunting. Cheng Fang,then of IFPRI and now of FAO, provided helpful comments for revisions, particu-larly on the presentation of modeling issues and on questions relating to China. Wealso thank Madan Dey of the WorldFish Center for his assistance on trade issues. Alsoproviding assistance from Worldfish were Bing Santos, Mohammed Rab, and RosalinaKamaruddin. Externally, Albert Tacon provided invaluable consulting advice on thenature of fishmeal markets and fish feeding technology issues, greatly broadening oureconomic perspective, and Ulf Wijkstrom and his colleagues at FAO were generouswith their time in providing comments on the study’s direction.
In addition to the contributors and colleagues acknowledged above, we partic-ularly wish to thank Serge Garcia of FAO and Cathy Roheim of the University ofRhode Island for highly detailed and insightful reviews of the draft manuscript thatsignificantly helped to improve the final product. We also wish to thank an anony-mous reviewer for further helpful comments on the first draft. Mary Jane Banks great-ly improved our prose through meticulous editing.
General financial support from IFPRI’s and the WorldFish Center’s core donorsis gratefully acknowledged, as is specific project and program support from IFPRI’s2020 Vision Initiative, the European Commission, the International DevelopmentResearch Center (Canada), the Australian Centre for International AgriculturalResearch, and the David and Lucille Packard Foundation (United States). Withoutsuch patience and support, this work would not have been possible. Having acknowl-edged the multiplicity of persons and organizations involved, the authors accept soleresponsibility for the views in the study and particularly for any remaining deficiencies.
���������������

� � � � � � �
"#�$%�&��"%#
�isheries are in the news. A flurry of media activity has centered around fish-eries issues in the past year prompted by the release of several studies andreports that point to growing crises and controversy in both wild fisheries
and aquaculture. A recent report from a panel of fishermen, scientists, businessleaders, and government officials pointed to overfished and depleted stocks in U.S.waters, along with severe habitat degradation (Pew Oceans Commission 2003).The report argued that the restoration of U.S. fisheries requires a major overhaulof policy, including the introduction of ecosystem-based management andstronger regulations. A much-publicized study in Nature reported that the popu-lation of large predatory marine fish has been reduced by 90 percent since pre-industrial times (Myers and Worm 2003). Another recent study argued that cor-recting reported Chinese fisheries statistics to levels that better fit estimates of bio-physical potential renders global catch trends far less favorable (Watson and Pauly2001). The Food and Agriculture Organization of the United Nations (FAO), par-ticularly in its State of World Fisheries and Aquaculture publications, has consis-tently sounded the alarm over threatened stocks of wild fish (FAO 1995, 1998,and 2000a).
The rapidly growing field of aquaculture, which now accounts for 30 percentof the world’s food fish, has also pushed its way into the media spotlight. For someyears now, aquaculture has been seen as a possible savior for the overburdened wildfisheries sector, and an important new source of food fish for the poor (FAO 1995;Williams 1996). However, there are some problems with the industry. A recentreport from the World Wildlife Fund argued that some forms of aquaculture placepressure on wild fisheries through demand for wild-caught fish as feed (Tuominenand Esmark 2003). Another Pew report warned of the lack of effective regulatorymechanisms for dealing with genetically modified fish, some varieties of which arealready in development (Pew Initiative on Food and Biotechnology 2003).Numerous studies have warned of potentially negative effects of escaped farmed
�

fish on wild populations. A 2000 study in Nature argued that while aquaculturehas the potential to contribute considerably to the world’s supply of fish, signifi-cant environmental tradeoffs have occurred with many forms of aquaculture(Naylor et al. 2000). In response, many industry advocates and policymakers havestrongly defended aquaculture as an environmentally sustainable means of con-tributing to the world’s fish supplies.
In this context, what does this study contribute to the growing dialogue onworld fisheries? Why would economists attempt to address issues of fisheries thattypically have been dealt with by biologists, ecologists, and policymakers? Theanswer: a key missing component to the puzzle thus far has been a broad econom-ic analysis of the rapid changes in fisheries over the past two decades. Economicfactors have been a crucial driver of these changes in fisheries, and economic fac-tors will drive further changes to the year 2020. It is imperative that audiencesbeyond the fisheries sector—especially policymakers—have a better understand-ing of fisheries issues, and how they interact with other critical policy issues inworld food and agriculture.
Most critical among the issues addressed in this study are those of povertyreduction and environmental sustainability in developing countries. The intentionis to address the issues in a consistent economic framework that focuses on thedynamic and interacting decisions of producers, consumers, and traders all overthe world, at the same time permitting sufficient data disaggregation by commod-ity and location to support useful conclusions on the likely future of fisheries.
A better understanding of these market interactions is not a substitute forother aspects of forecasting fisheries outcomes, such as stock assessment, fish pop-ulation dynamics, and biophysical modeling; however, better information onprice-mediated inter-relationships with supply and demand for other foods andfeeds is essential for reasoned policymaking. We trust that this study addresses thisneed to some degree.
%�'(��")(�%���*(��&�+
The overall purpose of the study is to analyze the changing—and now critical—place of fisheries in global food policy issues. The term “fisheries” is applied equal-ly to the capture of wild fish and to aquaculture. The focus is developing coun-tries, although the analysis includes the developed world.1 In a sector as globalizedas fisheries has become over the past two decades, events in one part of the worldimpinge quickly on outcomes in another. The study starts from a series of prem-ises that are documented and supported as the book unfolds. Attention is paid to
� ��������������
����� ������� � �� � ��������� ��� ��������������� ��� ��������������� ��� ���� �������
������ ���

critical changes in the fisheries sector and their impacts on a broader set of policyobjectives for growth, poverty reduction, and environmental sustainability indeveloping countries. Many past and future developments in the fisheries sectorcan best be understood by considering fish as a series of commodities within achanging world supply and demand system for different food and feed items. Thestudy concludes with a delineation of key domains for policy action within thefisheries sector that can improve outcomes for broader food and agricultural devel-opment policy objectives in developing countries. Thoughts on priorities for fur-ther food policy research in the fisheries area are also provided.
The study investigates the following key premises:
� Fish production has developed from a primarily local and relatively minor spe-cialized activity into an important part of a rapidly evolving global high-valuefood activity.
� Limits to wild capture fisheries mean that the time for fish farming hascome—but how and with what perils remains to be seen.
� Capture fisheries affect aquaculture both as a competitor and as a supplier offeed, leading to a complicated price-mediated relationship that is generallynot well understood.
� Poor rural people in developing countries are major stakeholders in the futureof fisheries—and this is true, furthermore, for an expanding inland rural pop-ulation.
� Tremendous uncertainties inherent in capture fisheries affect aquaculture inkey ways, particularly through markets for inputs and outputs.
� Policies and technology development in both developing and developed coun-tries will be crucial to improving global outcomes.
We investigate these premises first by focusing on what is changing and thenby devising a way to project how these trends might play out under different sce-narios. Historical consumption, production, price, and trade trends are assessedfor a wide variety of regions and for a number of fisheries products. The study thenattempts to illustrate the economic component that cuts across these importantmultidisciplinary issues and cannot be ignored. The analysis aims to link modeledoutcomes to issues for environmental sustainability, technology generation, tradepolicy, poverty alleviation, and human nutrition in poor countries.
A key objective is to put the consideration of fisheries issues into the broadercontext of evolving world markets for food. Looking at fish as a series of marketcommodities with different market profiles draws explicit attention to the role of
�������������������

prices in affecting both consumer and producer behavior toward different sub-categories of fish. It also permits examination of market tradeoffs within fisheriesand between fish and other foods. Fish is both a food market competitor and aninput to meat production, with nearly one-third of all wild-caught fish being usedas a feed input. Even within fisheries, competition exists among different kinds offish, and some kinds of fish provide critical inputs to the production of others.Events affecting prevailing prices for different kinds of fish and meat affect othercommodities in the animal protein group. Furthermore, fish feed prices alsopotentially interact with prices for vegetable protein sources, such as soy.
��* #�"#��,%$-���%$��"*($"(� #���"*($
Three main sets of fisheries issues attracted policy and research attention in the late1980s and 1990s: the decline of traditional marine capture fisheries, mainly indeveloped countries; the growing roles of developing countries and aquaculture,which have been inextricably linked; and the rising role of China. Salient factsfrom each of these sets of issues are briefly outlined below.
���������� �����������&�����������������.� ��������������
Fisheries in developed countries have traditionally been considered—at least inpopular culture—as the northern fishing grounds off the coasts of the UnitedStates, Canada, Norway, Russia, and Japan. The fisherman of lore is a doggedsailor setting off into stormy seas in oilskins, to bring home a hold of fish like codand halibut. Such fishermen were not thought of as farmers, much as range cow-boys of the American southwest would also reject that label. Fishermen were notthought of as rich, and their life was indisputably hard. Their product was tradi-tionally the “poor man’s meat” (Kurlansky 1997), a view that has some statisticalbasis across countries (Kent 1998).
Fishermen of the Northern countries were great travelers, sailing long dis-tances in search of rich schools of fish. They were also pioneers of the food pro-cessing industry, dealing with problems of conservation and disposal of a perish-able, seasonally harvested commodity hundreds of years ago. Dried cod (stockfish)became one of the early trade goods, transported great distances and to tropicalclimes along with European expansion in the 17th century (Kurlansky 1997).
In recent decades, capture fisheries in developed countries have entered a cri-sis. Global capture fisheries production for human consumption grew through thelate 1980s, largely driven by technological improvements that increased capacity;but it has stalled since then. In fact, food fish production from capture fisheries islower in developed countries than it was 30 years ago, and has declined steadilysince the late 1980s. Although some of this decline is attributable to the
� ��������������

establishment of 200-mile exclusive economic zones (EEZs) and the resultingreduced fishing access for some developed countries like Japan, overfished anddeclining stocks are also responsible.
Fisheries policy issues in developed countries have always been orientedtoward issues of access to fishing grounds claimed by others, and protecting thegrounds of one’s own country. As stocks began to dwindle, disputes over fishingrights became more exclusionary and even violent, as in the “Cod War” betweenIceland and Great Britain during the 1970s. The other main fisheries policy issuein developed countries revolves around saving the livelihoods of people (andregions), typically among the poorest in the nation, whose incomes are threatenedby declining catches. Fisheries subsidies have become even larger relative to out-put than other agricultural subsidies. Milazzo (World Bank 1998), drawing onwork from FAO (1993), reports that fisheries subsidies in developed countrieshave played a large role in excessive investment in boats and gear. Overcapacity,abetted by the lack of appropriate resource rent charges and the scaling up of fleetand vessel sizes and port infrastructure, has led to the over-exploitation of marinefisheries resources.
To make matters worse for the traditional fisherman in the North, average percapita consumption of fish actually declined in developed countries from 24.3kilograms (kg) per year in 1985 to 21.7 kg per year in 1997, as saturation levelshave been reached in the diets of rich consumers. Since human population growthin developed countries was also low, aggregate consumption stagnated in theNorth. Yet even here, per capita consumption of certain high-value items, such asshrimp and salmon, has substantially increased. These commodities shifted in the1990s from being primarily wild-caught to being primarily aquaculture-produced,and their shelf prices decreased. At the same time in developed countries, per capi-ta consumption of many low-value items, like canned sardines, fell.
It is an open question as to whether supply or demand factors best explainthese events. On the supply side, some fish have become scarcer with decreasedsupply, and salmon and shrimp have become much cheaper with increased aqua-culture production. Evolving distribution systems, including the expansion of coldchains, also changed the product mix available to consumers. On the demand side,most people in developed countries experienced real income growth over the1990s, which presumably led to substitution toward preferred (higher priced) fish-based calories and away from less preferred (cheaper) fish-based calories.
One trend that undoubtedly helped make once-expensive items like shrimpand salmon more abundant and much cheaper in developed countries is the glob-alization of the fish trade to include developing-country production. Institutionaldevelopments applicable to more than the fisheries sector alone have had tremendous implications for fish trade. Examples are tariff reduction under the
�������������������
World Trade Organization (WTO), inaugurated late in 1994; a more rules-basedtrading system for perishables under the Sanitary and Phyto-Sanitary Agreement(SPS) associated with WTO in early 1995; and improved airfreight facilities.Another factor was the move from costly and lengthy inspection-based systems forassuring food safety implemented by importing countries to process-based proce-dures implemented by exporting countries; the Hazard Analysis and CriticalControl Points (HACCP) system is the dominant example. Finally, globally inte-grated supermarket chains that procure in one country and retail in another haveproliferated in recent years. Many local fishermen no longer have naturally pro-tected markets for chilled and frozen products. The removal of protected marketshas also led in some cases to trade disputes that hinder aquaculture exports(Anderson and Fong 1997).
����������.����/�!���������� 0��!� ����������.� ���������������
Despite the stagnation of fish production and consumption in developed coun-tries, global fish consumption has doubled since the early 1970s. The developingworld is responsible for the vast majority of this increased aggregate consumption,much of which has come in the form of low-value freshwater fish in East Asia. Indeveloping countries, per capita consumption of all fisheries commodities hasgrown modestly since the 1960s, with consumption of the relatively expensivecrustaceans and mollusks rising fastest. Population growth, however, has beenrobust in developing countries, and its overall impact on aggregate fish consump-tion has been high. At the same time, aquaculture grew at an explosive rate indeveloping countries. Aquaculture production from developing countries rosefrom under 2 million metric tons (mmt) in 1973 to over 25 mmt in 1997, anddeveloping countries now represent nearly 90 percent of total aquaculture produc-tion. Globally, aquaculture production has been the only engine of growth in foodfish production, and hopes have risen that aquaculture may ease pressure onthreatened wild fish stocks.
Since both fish consumption and aquaculture production have soared indeveloping countries, the question arises as to which is the primary driver of trendsin the fisheries sector. Chapter 3 examines this question in the context of risingincomes, urbanization, and population in developing countries. At the same time,institutional development and improved infrastructure for trade in perishable fooditems was an element of great opportunity for the fish farmer in developing coun-tries. Global fish trade in the mid-1990s totaled well over US$50 billion (FAO2002a), and has grown far more rapidly than food and agricultural trade as awhole. Meanwhile, developing countries have increased their value share in worldfish exports to 50 percent.
� ��������������

Aquaculture represented only 6 percent of food fish production in 1970, andnow represents over 30 percent. As this share has grown, so has its demand for fish-meal and fish oil, both of which are derived from wild fisheries. Further, as farmedproduction of organisms such as shrimp and salmon—which have relatively strongrequirements for these feed ingredients—grows, aquaculture’s share will continueto grow. This possibility has caused some concern among those who fear that high-er fishmeal and fish oil demand will lead to greater fishing pressure on stocks offish used for feed—otherwise known as “reduction” fish (Naylor et al. 2000).
There are also other environmental issues associated with aquaculture.Aquaculture operations, especially in developed countries, have received attentionfor pollution in the form of effluent, chemicals, and escaped farmed fish(Goldburg and Triplett 1997). These issues are also of concern in developingcountries, where aquaculture operations are expanding rapidly. Already, hundredsof thousands of hectares of mangrove habitat have been converted to coastal aqua-culture. As both high-value and low-value aquaculture expand during the next twodecades, pressure on the environment will intensify in both developed and devel-oping countries.
The rapid expansion of operations and large amounts of money associatedwith the rise in export aquaculture in developing countries raises the issue of itsimpact on equity, and particularly on the welfare of the poor. Cutting down man-groves for shrimp farms, it has been claimed, displaces traditional fishers who relyon mangrove fishing habitat for their livelihoods (Naylor et al. 2000). If land suit-able for aquaculture expansion becomes scarcer in Asia, it can be anticipated thatissues associated with the governance of natural resource use will become moreacute. Another issue for the poor is the rising relative price of fish (Bouis 2000). Ithas been shown that the poor in developing countries get a higher share of theirmuch smaller animal protein consumption from fish than do better-off people inthe same countries (Kent 1998). The question arises as to the net effects of aqua-culture growth in developing countries on the access of the poor to better nutri-tion, and specifically to animal protein.
����$�����$�����������$� ���.��"�������!���/ �����
Surprisingly, China’s dominant role in world fisheries is often overlooked inoverviews of the industry. Chinese production totals for both aquaculture and cap-ture fisheries have soared during the past 20 years, turning China into the singlelargest producer in both categories. China is particularly important as an aquacul-ture producer, now accounting for more than two-thirds of total production offarmed fish. As a consequence of this rapid growth, per capita consumption totalsin China have more than tripled in the past 15 years, and total consumption hasconsistently grown at a rate of over 10 percent per year, according to official figures.
������������������
It has been suggested, however, that China significantly over-estimated itsproduction totals in the 1990s (Lu 1998a; Watson and Pauly 2001). Irrespectiveof their accuracy, it is worth putting such assertions into a conceptual frameworkfor examination because their significance is not straightforward, the magnitudesinvolved are sizable, and the claims have received widespread publicity.
1%-"�+�$(( $�*�2&(�"%#
Seven sets of key policy research questions can be inferred from the above trends.These are briefly developed below and are addressed in full as the study unfolds.
,� ��������1�����������������/����������������������
#�������������3
This is clearly a critical issue, especially given the suspected role of demandchanges in developing countries in shaping structural changes in the fisheries sec-tor. The question involves finding a consistent way to first assess what the trendsare. Achieving consistency in terminology and product flows (so that productionplus net trade matches consumption) is not a small matter when trying to attainbalance across a large number of commodities and countries. Next, the forces driv-ing these trends must be assessed, so as to understand both how existing trendscame about and how new trends may emerge in the future. Projections based onstraight-line extrapolation of past trends are rarely accurate. A number of structur-al driving forces are external to the fisheries sector, such as population growth,urbanization, and income growth. But events in other food sectors and withinfisheries (the impact of salmon consumption on fishmeal use, for example) alsoneed to be accounted for, typically through the mutual interaction of prices.
,�����,� ���� �����������3
This is a counterpart to the demand issue, and it has several aspects: What sorts ofproduction systems (both in aquaculture and capture fisheries) are likely to beneeded? What sorts of products will be in demand (high-value like shrimp or low-value like grass carp) and from what part of the world? What does this tell us abouttechnology needs? What are the implications for reduction fish? What does thisimply for livestock products and vice versa? Most of all, these questions haveimplications for trade and prices.
,����,� �*������������������������1��!��3
Will the developing-country export boom in high-value seafood items continue?What will be the impact on food fisheries in developing countries, and what willbe the impact on the price of the low-value food fish that the poor rely on? How
! ��������������

is the world trading system for fish likely to evolve? Will food safety or ecologicalconcerns in importing developed countries create insurmountable barriers fordeveloping-country exporters? Will barriers lead to economies of scale in developing-country fish production and marketing that effectively exclude small-scale producers and the poor?
,������������"�� �!�������/����������� ��&����/ ����
%!��������������� � ����3
Given all of the above, will pressure on capture fisheries continue to increase?Where will this happen? Will pressure increase faster on low- or high-value itemsand in the North or in the South? To what extent are answers to these questionsdependent on a pessimistic or optimistic view of either capture fisheries or aqua-culture? What are the implications of different assumptions on demand for reduc-tion fish? Will reduction fish emerge as a constraint to aquaculture production?
���� 0��!� ����� �.���������1����������������������������3
How important is aquaculture production in easing pressure (through substitutionrelationships) on capture fisheries? How sensitive is capture fisheries production toalternative assumptions about growth in aquaculture? Is it necessarily the case thatincreased demand for aquaculture products will raise the relative price of fishmealand fish oil, and thus provoke a number of important changes? Among these, pos-sibilities include a decline of reduction fish stocks resulting from overfishing,decreased profitability of carnivorous aquaculture, and de-linking of fishmealprices from soy prices as the value of fishmeal in fish feeding begins to substantial-ly exceed its value in other uses.
,������������"�� �!�������/�������1���3
Will the poor who currently fish get crowded out by larger-scale operators? Willlandless agricultural workers who currently work in rice paddies lose their jobs asland-holdings are converted to less labor-intensive pond aquaculture? What willhappen to the nutritional security of those poor rural people who previously reliedon cheap fish and now have only more expensive fish? What would happen to theincomes and livelihoods of the rural poor in the absence of aquaculture develop-ment?
,������������(�����1������/��������������4� ���$�.� �����5
�������.���� ���������1���3
The major events and changes portrayed above for fisheries closely resemble evenmore widespread changes taking place in the meat and milk sectors of developingcountries, which has been called the “Livestock Revolution” (Delgado et al.
������������������"
1999).2 If that is the case, it also seems likely that what some have termed the“Blue Revolution” in fisheries is also confronted by the dilemma that the changesin question are market-driven by millions if not billions of participants. They willbe very hard to stop but can perhaps be slightly steered at the margin to improveoutcomes for important policy goals such as poverty reduction and improved envi-ronmental sustainability in developing countries.
If so, a key for policy research is to find the effective entry points for harness-ing the power of the market to effect desired changes. Do trade restrictions onaquaculture-produced imports affect the price of low-value food fish? Can a smallincrease in feed efficiency have a much bigger impact? What factors are likely toexclude the poor from the export bonanza, and which are policy-changeable? Towhat factors are production and demand trends sensitive? Where are food fishprices likely to go, and should policymakers be worried? Where are consumer andproducer substitutions likely to occur if the price is right? Research on market-driven relationships cannot answer all these questions completely, nor can it pro-vide solutions to all important fisheries policy issues. It can, however, help sharp-en the focus on entry points for policy intervention that can better harness theenergies of market forces.
�# ��������������
����������������������������������������������������� ��� � ���� �!��������������������
���������� ��������������� ������������ ���������"��������������� ��"� � ��

� � � � � �
*"�%$"� -��$(#�� #���&$$(#�
1 ��($#�%���"*($"(�1$%�&��"%#
�lobal production of aquatic food products totaled approximately 93.2 mil-lion metric tons (mmt) in 1997,3 of which capture fisheries supplied 64.5mmt and aquaculture 28.6 mmt. Total global production has more than
doubled since 1970, with most of the increase since the mid-1980s coming fromaquaculture. From 1985 to 1997, aquaculture was responsible for 71 percent ofthe total growth in food fish production by weight. Table 2.1 and Figure 2.1 showtrends in total capture food fish and aquaculture production for 1973–97 and1970–98, respectively.
Aquaculture’s rapid growth has resulted in a steadily larger share in total foodfish production, rising from only 7 percent in 1973 to 12 percent in 1985, and tomore than 30 percent by 1997. Although capture fisheries production exhibitedconsiderable growth through the late 1980s, its growth has slowed considerably, ifnot stalled entirely, since then. Total global capture food fish production has hov-ered near 60 mmt since 1986, marking an end to decades of steady growth.4 TheFAO’s State of World Fisheries and Aquaculture (FAO 2000a) reports that themajority of world capture fisheries stocks are fully or over-exploited.
China has become an increasingly dominant figure in the production of fish-eries products. According to official statistics, nearly 75 percent of the growth inproduction during 1985–97 came from China, with both capture food fish andaquaculture production growing at rates near 10 percent per year. In 1985, China
��
#$ �������������� �������� �� ���������� � �� ��%&#���%'(�������%%&�� �� �� ������ ���� ����
����� ��������������������� ��
)* ���� �����*� ���+�%%,-�� �������������������������� �������!� ������� ����� ������� �
����%(./%)�
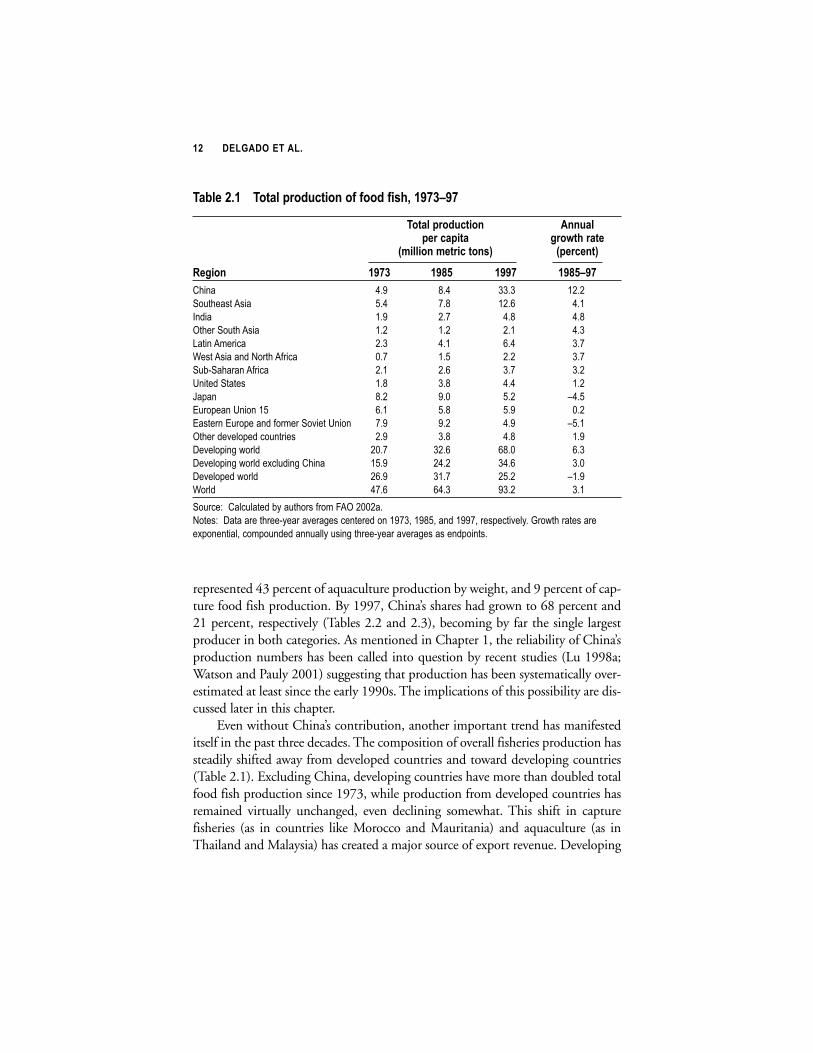
represented 43 percent of aquaculture production by weight, and 9 percent of cap-ture food fish production. By 1997, China’s shares had grown to 68 percent and21 percent, respectively (Tables 2.2 and 2.3), becoming by far the single largestproducer in both categories. As mentioned in Chapter 1, the reliability of China’sproduction numbers has been called into question by recent studies (Lu 1998a;Watson and Pauly 2001) suggesting that production has been systematically over-estimated at least since the early 1990s. The implications of this possibility are dis-cussed later in this chapter.
Even without China’s contribution, another important trend has manifesteditself in the past three decades. The composition of overall fisheries production hassteadily shifted away from developed countries and toward developing countries(Table 2.1). Excluding China, developing countries have more than doubled totalfood fish production since 1973, while production from developed countries hasremained virtually unchanged, even declining somewhat. This shift in capturefisheries (as in countries like Morocco and Mauritania) and aquaculture (as inThailand and Malaysia) has created a major source of export revenue. Developing
�� ��������������
�$%&'���� �()$&�*+(,-.)(/�(0�0((,�0123��" �4"
�()$&�*+(,-.)(/� �//-$&*'+�.$*)$ 5+(6)2�+$)'
78&&(/�8')+.�)(/19 7*'+.'/)9
�'5(/ �" � �"!� �"" �"!�4"
����� ��� �� � ����
������������� ��� �� ���� ���
����� ��� ��� �� ��
������ ��������� ��� ��� ��� ��
������������� �� ��� ��� ��
�������������� ������!���� "�� ��� ��� ��
�#$ ��������!���� ��� ��� �� ��
%������ ����� �� � ��� ���
&�'�� �� ��" ��� (���
)���'����%������� ��� �� ��� "��
)�������)���'������!������ �*����%���� ��� ��� ��� (���
��������*�+�'������������ ��� � �� ���
,�*�+�'��-�.��+� �"�� ��� ��" ��
,�*�+�'��-�.��+���/�+����-������ ���� ���� ��� �"
,�*�+�'���.��+� ���� ��� ���� (���
���+� ���� ��� ��� ��
�����0����+��+�����#1���������!����2����""���
����0��,�������������$1�����*���-������������������3����3���������3����'����*�+1��4��.�������������
�/'�������+3����'������������++1�����-������$1�����*���-���������'������

countries have gone from being net importers of fisheries products to large netexporters over the past 30 years. Fisheries products represent a major source ofexport revenue for developing countries, totaling over US$20 billion per year inthe late 1990s (FAO 2002a). The value of fisheries exports from developing coun-tries exceeded that from meat, dairy, cereals, vegetables, fruit, sugar, coffee, tobac-co, and oilseeds in 1997 (International Trade Centre 2002).
� 1�&$(��"*($"(�1$%�&��"%#��$(#�
Expansion of fleet capacity, technological innovation, and increases in investmentall led to explosive growth in the exploitation of capture fisheries through the1970s and 1980s. Global capture production of food fish soared from 44.5 mmtin 1973 to 64.5 mmt in 1997 (Table 2.3). The vast majority of this production(over 90 percent in 1997) has come from marine fisheries. During this period, thedeveloped world’s production as a whole actually declined by about 3.6 mmt,
:��������� �������������������;��������������:������;�����������������
Figure 2.1 Global capture fisheries and aquaculture production, 1970–98
Source: Calculated by authors from FAO 2002a.
0
10
20
30
40
50
60
70
1970 1973 1976 1979 1982 1985 1988 1991 1994 1997
Million metric tons
Capture
Aquaculture
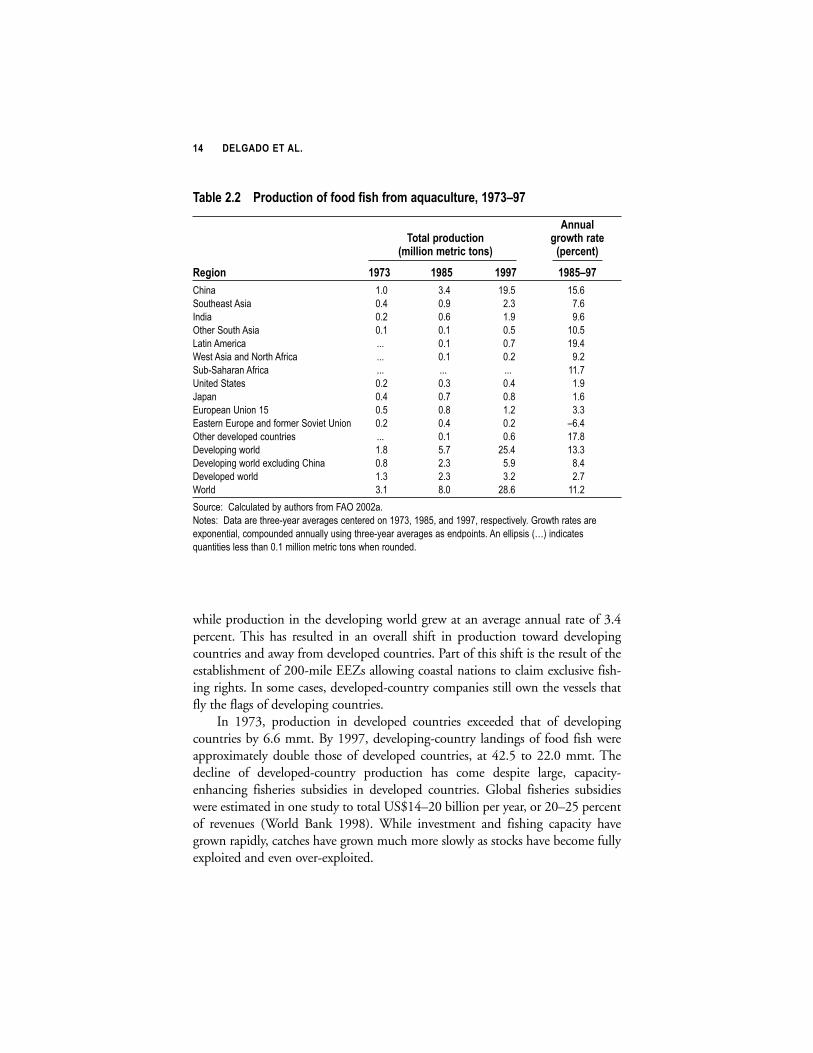
while production in the developing world grew at an average annual rate of 3.4percent. This has resulted in an overall shift in production toward developingcountries and away from developed countries. Part of this shift is the result of theestablishment of 200-mile EEZs allowing coastal nations to claim exclusive fish-ing rights. In some cases, developed-country companies still own the vessels thatfly the flags of developing countries.
In 1973, production in developed countries exceeded that of developingcountries by 6.6 mmt. By 1997, developing-country landings of food fish wereapproximately double those of developed countries, at 42.5 to 22.0 mmt. Thedecline of developed-country production has come despite large, capacity-enhancing fisheries subsidies in developed countries. Global fisheries subsidieswere estimated in one study to total US$14–20 billion per year, or 20–25 percentof revenues (World Bank 1998). While investment and fishing capacity havegrown rapidly, catches have grown much more slowly as stocks have become fullyexploited and even over-exploited.
�� ��������������
�$%&'���� ;+(,-.)(/�(0�0((,�012�0+(8�$<-$.-&)-+'3��" �4"
�//-$&�()$&�*+(,-.)(/� 5+(6)2�+$)'
78&&(/�8')+.�)(/19 7*'+.'/)9
�'5(/ �" � �"!� �"" �"!�4"
����� ��" �� ���� ����
������������� "�� "�� �� ���
����� "�� "�� ��� ���
������ ��������� "�� "�� "�� �"��
������������� ��� "�� "�� ����
�������������� ������!���� ��� "�� "�� ���
�#$ ��������!���� ��� ��� ��� ����
%������ ����� "�� "� "�� ���
&�'�� "�� "�� "� ���
)���'����%������� "�� "� ��� �
)�������)���'������!������ �*����%���� "�� "�� "�� (���
��������*�+�'������������ ��� "�� "�� ���
,�*�+�'��-�.��+� �� ��� ���� ��
,�*�+�'��-�.��+���/�+����-������ "� �� ��� ��
,�*�+�'���.��+� �� �� �� ���
���+� �� �" ��� ����
�����0����+��+�����#1���������!����2����""���
����0��,�������������$1�����*���-������������������3����3���������3����'����*�+1��4��.�������������
�/'�������+3����'������������++1�����-������$1�����*���-���������'�����������++�'����567�����������
8����������+���������"�����++����������������.������������

1����!��������$������������������ ���
One of the most striking trends in capture food fish production is China’s emer-gence as the largest producer, and the simultaneous decline of Japan’s production.In 1973, Japan was the largest capture food fish producer, accounting for 7.8 mmtor 18 percent of global production (Table 2.3). By 1997, Japan’s share had plum-meted to 7 percent, and its absolute level of production had dropped by nearlyhalf. Enforcement of the EEZ had significantly reduced the fisheries resourcesavailable to Japan, and dwindling stocks of fish such as pilchard further reducedJapanese catches. Heavy subsidies to the Japanese fishing sector likely slowed thissteady decline, which has been particularly acute among small- and medium-scaleproducers (World Bank 1998). Meanwhile, China increased its share from 9 to 21percent, boosting production from 3.8 mmt to 13.9 mmt.
Southeast Asia also dramatically increased its capture food fish production,more than doubling its output from 5.0 to 10.4 mmt during 1973–97. The regionis led in terms of production volume by Indonesia and Thailand. More than one-
:��������� �������������������;��������������:������;�����������������
�$%&'���� ;+(,-.)(/�(0�0((,�012�0+(8�.$*)-+'3��" �4"
�//-$&�()$&�*+(,-.)(/ 5+(6)2�+$)'
78&&(/�8')+.�)(/19 7*'+.'/)9
�'5(/ �" � �"!� �"" �"!�4"
����� � ��" ��� ��
������������� ��" ��� �"�� ��
����� ��� ��� ��� ��
������ ��������� ��� ��� ��� ��
������������� �� ��� ��� ���
�������������� ������!���� "�� ��� ��� �
�#$ ��������!���� ��� ��� �� ��
%������ ����� ��� �� ��" ���
&�'�� �� �� ��� (���
)���'����%������� ��� ��� ��� ("��
)�������)���'������!������ �*����%���� ��� � ��� (���
��������*�+�'������������ �� �� ��� ��"
,�*�+�'��-�.��+� ��� ���� ���� ��
,�*�+�'��-�.��+���/�+����-������ ���� ���" ��� ���
,�*�+�'���.��+� ���� ��� ���" (���
���+� ���� ��� ���� ���
�����0����+��+�����#1���������!����2����""���
����0��,�������������$1�����*���-������������������3����3���������3����'����*�+1��4��.�������������
�/'�������+3����'������������++1�����-������$1�����*���-���������'������
quarter of the overall increase in capture fisheries production since 1985 can be attributed to the Indian Ocean, which in 1997 still represented less than 10 percent of global landings. The Indian Ocean was the sole major marine fish-ing area to show sustained growth in the past three decades.
Peru and Chile led Latin America’s production, which also grew significantlyfrom 2.3 mmt in 1973 to 5.7 mmt in 1997. Production from Eastern Europe andthe former Soviet Union declined precipitously after the fall of the Soviet Union,as the heavily subsidized Soviet and Eastern European fleets aged quickly andinvestment declined. Total production in these regions was nearly cut in half from1985 to 1997. European production declined over the same period, while India,Sub-Saharan Africa, the United States, and West Asia and North Africa exhibitedoverall growth. However, production in all developed countries declined during1973–97 from 25.6 to 22.0 mmt.
Production from all Atlantic areas has stalled above 20 mmt since 1970, withthe composition of production moving toward species of lower trophic levels(Pauly et al. 1998). The high-profile collapse of the significant Atlantic cod fish-eries in the northwest Atlantic has become emblematic of the threats posed byheavy fishing. Production from Pacific areas grew steadily through the mid-1980s,especially landings of tuna, but has remained near 50 mmt since 1986. Despite theslowdown in growth, total Pacific production has more than doubled Atlantic pro-duction since the mid-1980s, at 52 mmt compared with 23 mmt in 1997. Overallproduction trends in the Pacific mask considerable variation across species, withdramatic fluctuations in the production of fish such as the Peruvian anchoveta, theJapanese pilchard, and the Alaskan pollock. Though dwarfed by marine fisheries,production from inland fisheries has grown modestly from 5 mmt in 1985 to 8mmt in 1997, the bulk of production coming from Asia and Africa.
������������������/ ���������� ��� �1����!��������� ��
China’s astonishing growth in the production of both wild- and aquaculture-derived fisheries commodities during the 1990s and the contrast between trendsin China and neighboring countries have raised suspicions about the accuracy ofreported totals. There is a significant and growing discrepancy between estimatesof fish consumption based on independent household surveys and estimates offish availability derived from production, trade, and other use data. Estimates ofconsumption based on household surveys result in totals far lower than those sug-gested by officially reported data. Moreover, in the case of wild fisheries, reportedcatches have risen rapidly despite the classification of major stocks as over-exploited; and vessel survey data are at odds with Chinese estimates of catch andcatch per unit effort. The FAO has been concerned about Chinese fisheries andagriculture statistics for some time, and has organized several collaborative work-
�� ��������������
shops on the problem (FAO 2001a). Lu (1998b) concluded that Chinese fisheriesproduction—including aquaculture—was over-estimated by 43 percent in 1995,after taking into account possible under-estimation of fish consumption. Lu sug-gests that institutional incentives that reward or punish local officials based onreported productivity may be largely responsible for the increasing distortion.
Watson and Pauly (2001) used a spatial model that predicted marine catchesbased on oceanographic and climatological data. They reported a significant devi-ation between expected and reported catches in Chinese coastal waters—a devia-tion that only arose in the 1990s—and conclude that institutional incentivesencouraged the exaggeration of capture fisheries production totals in China in thatdecade. The FAO has made it clear that its interpretation of Chinese statistics, andhence of global trends, had already taken into account the possibility of inaccura-cies (FAO 2000b, 2002b). The most recent FAO workshop on the issue in 2001did not result in any official adjustment of historical production statistics but didpropose further investigations (FAO 2001a).
If China has indeed over-reported its fisheries production for institutional orother reasons, trends in global fisheries production would appear much less favor-able than they otherwise do. In fact, Watson and Pauly argue that removing thealleged distortions in China’s production statistics and the catches of the Peruviananchoveta results in a negative trend in global capture fisheries production since1988.
The net impact of changes of this magnitude can only be considered in aframework that balances assumptions about supply, demand, and trade. If Chinaproduced less fish than reported, this must mean that Chinese consumers ate lessfish than reported, or Chinese fish imports were greater than reported, or somecombination of the two. Global production, consumption, and trade numbersmust be re-balanced according to a consistent set of assumptions. Chapter 4 pres-ents this issue in terms of economic modeling concerns; however, the officiallyreported statistics are used for the purposes of the historical discussion.
������������������1����!��������������6������
������������������
Low-Value Food Fish from Capture. In terms of production volume, the largestmarket-based fisheries commodity is low-value food fish from capture. (Table 2.4.See Appendix E for detailed historical production tables.) Global productiontotaled over 27 mmt in 1997, with the vast majority of production coming fromthe developing world (85 percent). Developed-country production of low-valuefood fish from capture has remained relatively static over the past several decades,while developing countries have expanded their production significantly. Chinahas expanded its share of production to nearly one-quarter of the global total,
:��������� �������������������;��������������:������;����������������

�! ��������������
�( ���� �'=$55+'5$)(/�(0�.(88(,)'1�$..(+,/5�)(�8$+>')�.+)'+$
The food policy issues considered in this report require that aggregatedcommodity data follow market lines rather than biological classifica-tions. For modeling purposes, commodities within a group shouldhave similar supply- and demand-response parameters. This usuallyimplies the need for fairly homogeneous product categories in terms ofvalue and function; modeling further dictates a small, manageablenumber of commodity categories. It is also important to create cate-gories that are meaningful and identifiable to audiences lacking special-ized fisheries knowledge.
Country-level data on production are available from FAO at a finerresolution than data for consumption. Consequently, production datamap more easily into the desired categories (see Appendix B fordetails). Four basic commodity aggregates for human fisheries con-sumption were chosen so as to keep data and parameter requirementsmanageable, with each category split by origin of production (aquacul-ture or capture). The term “food fish” in this report refers to the sumof these categories. Fishmeal and fish oil—derived products from cap-ture fisheries that are used as feed inputs—are considered as separatecommodities.
“Low-value food fish” are fish destined for human consumption thatare of relatively low value, including freshwater species like carp, andmarine species like herring and mackerel. Similarly, “high-value finfish”include higher-cost species like tuna, cod, salmon, and trout. The cate-gory “crustaceans” comprises mainly shrimp, prawns, crabs, and lob-sters. “Mollusks” include shellfish such as oysters, clams, and scallops;and also cephalopods, like squid.† Table 2.4 shows historical produc-tion totals for each market-based fisheries category.
†Production totals are live weight and include shell weight. This results in an overstate-ment of the amount of product available for human consumption, especially in the caseof mollusks.

while Southeast Asia nearly doubled its production from 3.6 mmt in 1973 to 6.3mmt in 1997.
Japanese production of low-value food fish has declined over the past twodecades, and Russia’s production also declined after the fall of the Soviet Union.Low-value food fish from capture constitutes Sub-Saharan Africa’s largest source offisheries production, and is the only commodity category in which Sub-SaharanAfrica represents a significant share of the global total (11 percent in 1997). Inlandfisheries have maintained a fairly constant share of low-value food fish production,at about 25 percent during 1973–97. Anchovies, herring, mackerel, and miscella-neous marine and freshwater fish are the largest species categories within this com-modity grouping.
High-Value Finfish from Capture. The second-largest capture fisheries commoditygroup is high-value finfish, with a global total in 1997 of 25 mmt. Production hasgrown only modestly in the past 30 years, although the composition of produc-tion has changed somewhat. China has emerged as a large producer, and the devel-oping world in general has taken up a larger share of production. Developed coun-tries accounted for 57 percent of production in 1997, down from 82 percent in1973. Russia has remained the top producer of high-value finfish since taking overthe lead from Japan in the mid-1970s; however, its production has declined almost
:��������� �������������������;��������������:������;����������������"
�$%&'���� �&(%$&�*+(,-.)(/�(0�0((,�012�%?���;����.$)'5(+?3��" �4"
�//-$&�&(%$&�*+(,-.)(/�(0�0((,�012 5+(6)2�+$)'
78&&(/�8')+.�)(/19 7*'+.'/)9
�(88(,)? �" � �"!� �"" �"!�4"
�8����+���� �� �" ��� ����
��.$*�+���!��!��� ��� ��� ���� �"��
9�-�$*�+���!��!��� "�� "� ��� ���
����������� ��� "� �� ��
:�++��;� �� ��� � ����
��'���� ���� ��� ���� ���
��.$*�+���!��!��� ��� ���� ���� "�
9�-�$*�+���!��!��� �"� �� ���� "��
����������� �� �� ��� ���
:�++��;� ��� ��� �� �
�����0����+��+�����#1���������!����2����""���
����0 ,�������������$1�����*���-������������������3����3���������3����'����*�+1��4��.�������������
�/'�������+3����'������������++1�����-������$1�����*���-���������'�����������++�'����567�����������
8����������+���������"�����++����������������.������������
50 percent from a peak of over 5 mmt in the late 1980s. Though the fall of theSoviet Union and the associated decline in fisheries subsidies is certainly responsible for some of this decline, overfishing of stocks such as pollock in theBering Sea is also to blame (FAO 1997a). Japan’s production has declined dramat-ically, while Latin America (notably Chile and Argentina) and Southeast Asia(especially Indonesia, the Philippines, and Thailand) have seen significant growth.Cod has declined from its peak as the largest source of high-value finfish, leavingpollock at the top, although catches have steadily declined since the 1980s.Production of skipjack and yellowfin tuna have increased significantly over thepast several decades.
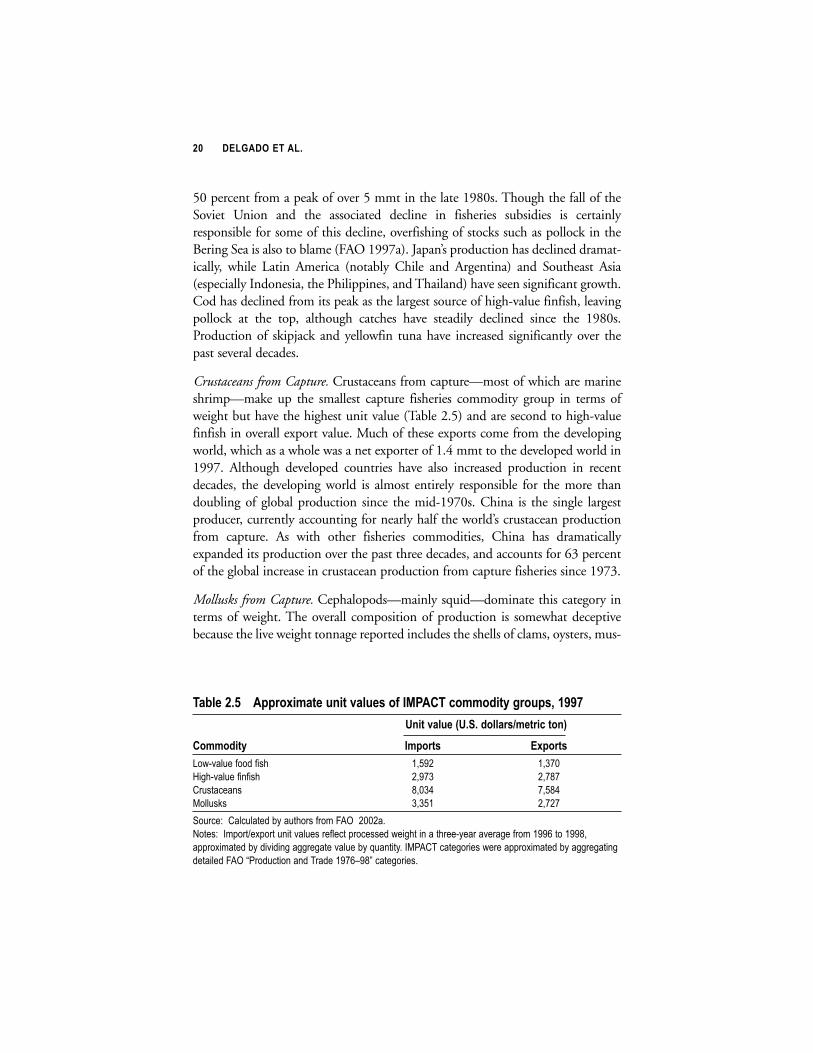
Crustaceans from Capture. Crustaceans from capture—most of which are marineshrimp—make up the smallest capture fisheries commodity group in terms ofweight but have the highest unit value (Table 2.5) and are second to high-valuefinfish in overall export value. Much of these exports come from the developingworld, which as a whole was a net exporter of 1.4 mmt to the developed world in1997. Although developed countries have also increased production in recentdecades, the developing world is almost entirely responsible for the more thandoubling of global production since the mid-1970s. China is the single largestproducer, currently accounting for nearly half the world’s crustacean productionfrom capture. As with other fisheries commodities, China has dramaticallyexpanded its production over the past three decades, and accounts for 63 percentof the global increase in crustacean production from capture fisheries since 1973.
Mollusks from Capture. Cephalopods—mainly squid—dominate this category interms of weight. The overall composition of production is somewhat deceptivebecause the live weight tonnage reported includes the shells of clams, oysters, mus-
�# ��������������
�$%&'���� �**+( 8$)'�-/)�$&-'1�(0���;����.(88(,)?�5+(-*13��""
�/)�$&-'�7�����,(&&$+1@8')+.�)(/9
�(88(,)? �8*(+)1 � *(+)1
��.$*�+���!����!��� �3��� �3�"
9�-�$*�+���!��!��� �3�� �3��
����������� 3"� �3��
:�++��;� 3�� �3���
�����0����+��+�����#1���������!����2�����""���
����0����'���<�/'���������*�+������!+����'���������.��-�������������$1�����*���-��!���������������3�
�''��/�������#1���*����-��--��-����*�+���#1�8������1���:=��> ����-������.�����''��/�������#1��--��-����-
�����+���2���?=��������������>���������(�@�����-������

sels, and so on. As global production has boomed, the developing world has takenan increasing share of mollusk production from capture, accounting for two-thirdsin 1997. Japan’s once-dominant role as the largest producer has been usurped byChina, which now produces nearly a third of the world total.
Fishmeal and Fish Oil. Fishmeal is created from the cooking, pressing, drying, andmilling of wild-caught, small pelagic fish such as anchovies and menhaden. Fishoil is usually a byproduct of the reduction process by which fishmeal is created(hence the term “reduction” fish as already mentioned). As a result, annual globalproduction of fishmeal and fish oil are highly correlated (r = 0.8, 1976–98).Approximately 30 percent of the total global catch of fish is reduced to fishmeal(and thus is not counted as “food fish” in the totals presented here), with a typicalreduction ratio of 5 kg of live fish for each kilogram of fishmeal. About two-thirdsof the world’s fishmeal is derived from “dedicated” fisheries devoted entirely to theproduction of fishmeal (New and Wijkstrom 2002).
:��������� �������������������;��������������:������;�����������������
�$%&'���� ;+(,-.)(/�(0�0128'$&3��" 4"
�//-$&�()$&�*+(,-.)(/� 5+(6)2�+$)'
7)2(-1$/,�8')+.�)(/19 7*'+.'/)9
�'5(/ �" � �"!� �"" �"!�4"
����� �� ��� ����
������������ � � ��� ��� ���
����� �� �� �� ����
������������� �� �� �� ���
����������� ����� ���� �� �� ��
!���������"����#���� �� � � ���
��$%�������#���� �� � �� ����
&����������� �� �� ��� ����
'�(�� � ����� �� ���
)���(���&������ �� ��� �� ���
)������)���(����#�������*���&���� ��� � �� �����
�������*�+�(����������� �� ��� ��� ���
,�*�+�(��-.��+� ����� �� �� ����� ���
,�*�+�(��-.��+��/�+����-0���� ���� ��� � ����� ���
,�*�+�(��.��+� ����� ����� ����� ���
!��+� ����� ��� � ����� ���
������10�+��+����$2�������#���3�������
"����1,�����������%2����*���-������������� ��� ������� ����(����*�+2�4��.����������
�/(�������+����(�����������++2����-�����%2����*���-�������(������
Peru and Chile dominate fishmeal production, making use of the world’smost heavily exploited fish in terms of weight—the Peruvian anchoveta (Engraulisringens). The combined global share of production from Peru and Chile averaged44 percent during the 1990s. Other major producers include China, Japan,Russia, Denmark, Norway, and the United States (Table 2.6). A similar pattern isobserved in the production of fish oil, though China and Russia are not majorproducers. Japan’s production of fishmeal and fish oil has dropped off significant-ly in the past decade.
Global production of fishmeal in 1997 totaled 6.1 mmt, while fish oil pro-duction totaled 1.1 mmt. Supply exhibits significant interannual variation, theresult of fluctuations in the catches of the Peruvian anchoveta induced by El Niñoevents in the eastern equatorial Pacific. The collapse of the Peruvian anchovetafisheries, which coincided with the El Niño event of 1973, brought down globalproduction to about 4.5 mmt during the mid-1970s. The Peruvian fisheries even-tually recovered (though production has been punctuated by sharp declines in ElNiño years), and fishmeal production has hovered near 6.5 mmt for well over adecade. Fish oil production has shown similar variation around a lower mean.
2& �&-�&$(�1$%�&��"%#��$(#�
Despite the stagnation in capture fisheries production, overall food fish produc-tion grew at an average annual rate of 3.1 percent between 1985 and 1997. Thisrapid growth is almost entirely the result of the global boom in aquaculture pro-duction, which grew at 11.2 percent per year over the same period. The boom waswidespread, across all four categories of fisheries commodities, though growth inthe low-value fish category was most prominent.
1����!��������$�����
Aquaculture is primarily a developing world activity. In 1973, developing coun-tries produced 58 percent of the world’s aquaculture products, but that share hadgrown to 89 percent by 1997. Developing-country production has grown at a rateof 13.3 percent per year since 1985, dwarfing the corresponding growth rate fordeveloped countries (2.7 percent). More precisely, however, aquaculture is pre-dominantly an activity of Asian developing countries. Asia accounts for 87 percentof global aquaculture production by weight, and China alone commands a stun-ning 68 percent share, up from 32 percent in 1973.
Rapid development in aquaculture production was part of China’s five-yearplan from 1986 to 1990, and state investment in extension and technology devel-opment contributed to the boom in Chinese production (Wang 2001; WorldBank 1998). The FAO reports that aquaculture development in China has result-
�� ��������������

ed in large part from government policies promoting aquaculture as a means ofimproving domestic food supply and increasing foreign exchange earnings, includ-ing policies targeted at seed and feed inputs (Hishamunda and Subasinghe 2003).The gradual removal of food grain self-sufficiency policies may have allowed aqua-culture production to rise especially rapidly by freeing farmland for use as pondarea. In 1999, 62 percent of Chinese aquaculture production came from inlandfreshwater ponds, many of which provide supplemental income to other farmingactivities.
The dominant role of Chinese aquaculture in global totals by weight can beseen in Figure 2.2. India and Southeast Asia are also large producers, accountingfor a combined 15 percent of production in 1997 (Table 2.2). Although SouthAsia, Southeast Asia, and Latin America have experienced rapid growth in totalproduction, China’s expansion has equaled the others in percentage terms, anddwarfed the others in absolute terms. Much of the boom in aquaculture is attrib-utable to expanded area; improved productivity in aquaculture, though importantfor a few high-value species, is in its relative infancy for most species under culti-vation (see Chapter 6).
:��������� �������������������;��������������:������;�����������������
Figure 2.2 Total aquaculture production, 1970–99
Source: Calculated by authors from FAO 2002a.
0
5
10
15
20
25
1970 1973 1976 1979 1982 1985 1988 1991 1994 1997
China
Million metric tons
Developing
world
excluding China
Developing world
Of the three major categories of production environment listed by the FAO,freshwater aquaculture accounts for the majority of global production at 58 per-cent in 1999, followed by mariculture (aquaculture practiced in a marine environ-ment) at 36 percent, and brackish water at 6 percent. These three categories maskconsiderable variation in production systems. Aquaculture ranges from simpleponds utilizing naturally occurring food sources to highly intensive systems withwater control, aeration, and supplemental feeding. Aquaculture is practicedinland, along the coast in brackish water systems, and in marine cages and netpens. Farm size can range from thousands of hectares down to the size of a backyard.
0��!� �����1����!��������������6������������������������
Low-Value Food Fish from Aquaculture. The most striking growth of all fisheriesoccurred in the production of low-value food fish from aquaculture. As can beseen in Table 2.4, the farmed production of low-value food fish has soared inrecent years, more than tripling during 1985–97. Nearly all of this growth hascome from China, whose production grew at an average annual rate of 14.1 per-cent over this time. Low-value food fish accounted for 60 percent of global aqua-culture production by weight in 1997, and China represented three-quarters ofthis total. The majority of fish in this category are freshwater carp. Carp account-ed for 75 percent of low-value food fish from aquaculture in 1997. India is thesecond-largest single producer, accounting for 1.8 mmt or 11 percent of globalproduction in 1997.5 Low-value food fish represent nearly all of India’s aquacul-ture production (96 percent). Most low-value food fish are domestically consumedand not traded because of transport and marketing costs.
High-Value Finfish from Aquaculture. Farmed production of high-value finfish isrelatively small by volume, representing only 5 percent of total aquaculture pro-duction. Nevertheless, high-value finfish supplied 39 percent of all export revenuegenerated from fisheries in 1997—the largest share of all market-based fisheriescommodity groups. Farmed production of these fish has garnered much attentionin recent years for its rapidly expanding production in coastal areas. As the nameimplies, the high-value finfish category includes relatively higher price-to-weightfish such as salmon, trout, and sea bream. Atlantic salmon (Salmo salar) dominatefarmed production in this category, representing 48 percent of high-value finfishproduction.
�� ��������������
(0��� �� ���� 1�� ���� "� "����� ���� ���� � ��� ���2� � ������ � �!� ���� 3��� �������� ������ �
�����!��� �4���������������5�������!��������$������+3��4��$-�+6�7��..��-�

Production of high-value finfish from aquaculture has exploded since themid-1980s. During 1985–97, global production grew at an average annual rate of13.4 percent. High-value finfish is the only fisheries category in which developedcountries have a larger production share than developing countries; this is especial-ly true for farmed production. Developed countries accounted for a 76 percentshare of production in 1997, the bulk of which was salmon and trout. Norway,Chile, the United Kingdom, Japan, and Canada are the largest producers (in thatorder), exploiting their large coastal areas.
Mollusks from Aquaculture. Capture production of each commodity group farexceeds aquaculture production, with the notable exception of mollusks. In thepast 10 years, aquaculture has passed wild fisheries as a source of mollusks.Mollusks produced from aquaculture are exclusively shellfish such as oysters, mus-sels, clams, and scallops. Mollusk production is generally a coastal activity, oftenundertaken in mudflats. Excluding China, global farmed production of molluskshas grown at the relatively slow rate of 1.7 percent since 1985, to a total of 2 mmtin 1997. Over the same time span, however, Chinese production has grown fromunder 1 mmt to nearly 7 mmt, at an average annual rate of 19.5 percent. Whileyields have risen, expanded cultivated area is responsible for the bulk of theincreases. Over half of China’s mollusk production from aquaculture is suppliedby 2 species: the Pacific cupped oyster (Crassostrea gigas) and the Japanese carpetshell clam (Ruditapes philippinarum). China was a net exporter of 0.34 mmt ofmollusks (in live weight) in 1997.
Crustaceans from Aquaculture. The farmed production of crustaceans has been oneof the more high-profile manifestations of aquaculture, in part because it hastransformed many coastlines in the developing world into mosaics of ponds ori-ented toward high-value exports. By weight, the global production of crustaceansfrom aquaculture is roughly equivalent to that of high-value finfish, totaling 1.3 mmt in 1997. Production growth has been dramatic and widespread, averag-ing 13.3 percent per year on a global basis from 1985 to 1997.
Developing countries accounted for nearly all (98 percent) of crustaceanaquaculture in 1997. In Southeast Asia (especially Indonesia, Thailand, and VietNam), farmed crustaceans have become a major source of export revenue, as ricepaddies and mangrove forests have made way for shrimp ponds along the coasts.Land-use conflicts have drawn attention from environmental organizations (seeChapter 5) in Southeast Asia and in Latin America, where Brazil, Ecuador, andMexico have also become large shrimp aquaculture producers.
:��������� �������������������;��������������:������;�����������������
%&�-%%7��%$�&11-+
������������� �����/ �����������������
With most wild fisheries near maximum sustainable exploitation levels, capturefisheries production will most likely grow slowly to 2020. Predicting long-termtrends for a single fish stock, however, is extremely difficult, and forecasting for theworld as a whole is an extraordinarily uncertain exercise at best. Conventional fish-eries are probably near the ceiling of their potential, though higher levels of pro-duction could probably be obtained by targeting small pelagic species, mesopelag-ic species, and krill. This strategy, however, would have severe consequences for theenvironment, as it would result in large species composition shifts and indirectharm to predator species.
While most would agree that large increases in production are unlikely, it isless easy to say with certainty that large fisheries collapses are impossible. Historyis replete with examples of anthropogenic marine extinctions and wholesalechanges in marine ecosystems (Jackson et al. 2001). Levels of fishing pressure,changes in management regimes, climatic shifts, alteration of fisheries habitat, andsynergistic combinations of these factors are difficult to forecast. Nonetheless, theymay have strong negative consequences on the population of marine and freshwa-ter resources.
%�����������������������������/���(����������/ 1����!�������
0��!� ����
The possibilities of expanding fisheries production are greatest for those com-modities that can be produced through aquaculture. Production of freshwater fishsuitable for aquaculture, such as carp and tilapia, will likely see large increases.Mollusk and crustacean production may also expand significantly, as they did inthe 1990s. As with terrestrial crops, increased aquaculture production can beachieved either through expanding the area under cultivation or by increasing theyield per unit area. Yield increases can come either from increased inputs or greaterefficiency of inputs. It is likely that in the next several decades, aquaculture pro-duction will benefit from both these sources of yield growth. Greater use of com-pounded aquafeeds in the diets of farm-raised fish, along with improvements inrearing technology and selective breeding (see Chapter 6), has the potential to sig-nificantly increase the productivity of many forms of aquaculture.
As a consequence of the probable slow growth in capture fisheries, the trajec-tory of aquaculture will play a large role in determining the relative prices of fish-eries commodities. Aquaculture’s course is far from certain, however. Several majorchallenges must be overcome if the rapid growth of the past 10 years is to be sus-tained. Aquaculture will face competition for land and marine resource use from
�� ��������������
other activities ranging from terrestrial agriculture to recreation. Fresh water willbecome an increasingly scarce resource over the next 20 years (Rosegrant, Cai, andCline 2002), making further expansion of freshwater aquaculture activities moredifficult. Increased pathways for transmission will allow disease to remain a majorconstraint to aquaculture production growth (Subasinghe, Bondad-Reantaso, andMcGladdery 2001). The availability of fishmeal and fish oil—wild-caught feedinputs that are currently indispensable for certain varieties of carnivorous aquaculture—may also become a limiting factor in production growth (seeChapter 6).
The emergence of land, water, and input constraints will place pressure ontechnology to find other ways to increase productivity. Some possible pathways forachieving this include selective breeding, better health management, water con-trol, and modification of feed inputs. It seems clear that the level of public and pri-vate investment in aquaculture technology and extension will play a large part inthe growth of aquaculture production over the next several decades.
:��������� �������������������;��������������:������;����������������

� � � � � � !
�(� #���%$��"*� ��%%�� #��
�((���*$%&�*��*(�899
�lobal consumption of fish as food has doubled since 1973, and the devel-oping world has been responsible for over 90 percent of this growth. TheFAO reports that growth of fish consumption as food in the relatively rich-
er countries has tapered off; food fish consumption in the poorer countries hasgrown rapidly (FAO 1999a). In particular, the consumption of freshwater fish hasgrown massively in recent decades, primarily in East Asia. Large increases have alsooccurred in the consumption of crustaceans and noncephalopod mollusks such asoysters and clams. In both cases, this growth in consumption has been matchedby an equally rapid growth in production from aquaculture, primarily but notexclusively within Asia.
These aggregate trends raise the perennial question: which came first, the sup-ply push or the demand pull? While both may be at work in different proportionsin different places, two elements suggest that demand is the primary motor ofthese changes. First, demand theory and the experience of developing countrieswith regard to other animal-source foods suggest that increases in income, popu-lation, and urbanization in developing countries leads to diversification of dietsinto higher priced calories. Increases in developing-country fish consumptionsince the 1970s are consistent with this phenomenon. Saturation of diets in devel-oped countries, coupled with low rates of population and urban growth, are a con-sistent explanation as to why total fish consumption in developed countries hasstagnated despite greater access to production technologies. Second, real prices forfish have generally increased over the past 20 years, and relative prices for fish havesoared compared with steeply declining meat and grain prices over the same peri-od. Higher relative fish prices may have stimulated further production but couldonly result from excess demand.
It is also likely that the rapid growth of freshwater aquaculture in Asia is part-ly driven by policy and the desire to diversify production out of rice monoculture;
�"

�# ��������������
this phenomenon has allowed fish to join the basket of animal-source foods thatare increasingly consumed in the developing world in response to demand shifts.Although per capita increases in fish consumption have been widespread through-out Asian developing countries, a dominant share of the aggregate global increasein food fish consumption during 1985–97 is accounted for by China, whose con-sumption increased by 24 mmt in live weight over this time.6 China pursued anaggressive aquaculture development strategy throughout the 1980s and 1990s,marked by significant investments in technology and extension (Wang 2001;World Bank 1998), and also realized significant gains in capture production.
�%%���"*��%#&�1�"%#� #���$ �(��$(#��
����������$�������������� %�����������������7
Total Food Fish. According to the FAO (1999a), the amount of food fish con-sumed on a global scale has increased from 45 mmt in 1973 to over 90 mmt in1997 (Table 3.1). Over this span, world per capita food fish consumption8 has alsorisen from 12 kg/year to 16 kg/year (Table 3.2). These increases have not been uni-form across geographic or economic categories, however. Growth in food fish con-sumption has primarily been a developing-country phenomenon. China dominat-ed aggregate consumption of fisheries products in 1997, with over 36 percent ofglobal consumption, rising from only 11 percent in 1973. India and SoutheastAsia together accounted for another 17 percent in 1997, with total consumptiondoubling since 1973.
The share of developing-country fish consumption has risen from 45 percentin 1973 to 70 percent in 1997, mainly because of the rapid growth in theseregions. Meanwhile, levels of per capita fish consumption have hardly increased inSub-Saharan Africa over the past 30 years; in fact, per capita fish consumption hasdeclined significantly in Sub-Saharan Africa since the mid-1980s. In the devel-oped world, aggregate consumption levels have also declined since 1985, mainlyas a consequence of dramatically lower per capita consumption in the formerEastern Bloc countries.
,���� ��� ������ ���� �� � ������ ���� �����!����� ����� �� ���� "���� � �� !���� ��� �� ���� ��
������������ �������� ������
&8����� ����������������"�������� ��� �!�6�7�+�%%%�-��6��� ������� ������������� ������
�� �"�� ����6�7�����39$�40:���������� ����������� ������� ���������������������� ����
������������ ����;�
'$� ���������������������"�������������� �������� ����� ��� ������������!�����

��������������:�������������������:����:��:���""#1 ��
Fish are an important source of protein, especially in the developing world.Fish account for 20 percent of animal-derived protein in low-income food deficitcountries, compared with 13 percent in the industrialized countries.9 While low-income food deficit countries have more than doubled per capita fish consump-tion from 6 kg/year to 14 kg/year, per capita consumption has leveled off in indus-trialized countries since the late 1980s. The absolute levels of fish consumption inpoor countries, however, are still much lower than those in richer countries. Percapita consumption in industrialized countries was double that of low-incomefood deficit countries in 1997 (28 kg/year compared with 14 kg/year). Of course,average consumption even within a similar income range varies considerablyacross countries based on geography and cultural preferences. For example, Japan’sper capita seafood consumption is well over 60 kg/year, while Switzerland’s isunder 15 kg/year.
�$%&'���� �()$&�.(/1-8*)(/�(0�0((,�0123��" ��"
�//-$&�()$&�.(/1-8*)(/ 5+(6)2�+$)'78&&(/�8')+.�)(/19 7*'+.'/)9
�'5(/ �" � �"!� �"" �"!�4"
0���� �� �� ���� ����
������������ ��� � ���� ���
����� ��� ��� ��� ���
������������� ��� ��� ��� ���
����������� ��� ��� ��� ���
!���������"����#���� ��� ��� ��� ���
��$%�������#���� ��� �� �� ���
&����������� �� ��� ��� ���
'�(�� �� �� � ���
)���(���&������ ��� �� ��� ���
)������)���(����#�������*���&���� �� �� ��� ����
�������*�+�(����������� �� ��� ��� ���
,�*�+�(��-.��+� ���� ���� ���� ��
,�*�+�(��-.��+��/�+����-0���� ���� ���� ���� ���
,�*�+�(��.��+� ���� � �� ���� ����
!��+� ���� ��� ��� ���
������10�+��+����$2�������#���3�������
"����1,�����������%2����*���-������������� ��� ������� ����(����*�+2�4��.����������
�/(�������+����(�����������++2����-�����%2����*���-�������(������
%1�� ����!������������������ ��2�����1����� ��<�������� ��2�� ��6�7������� ������
������ �!�1���������2�����1���������2������ ���
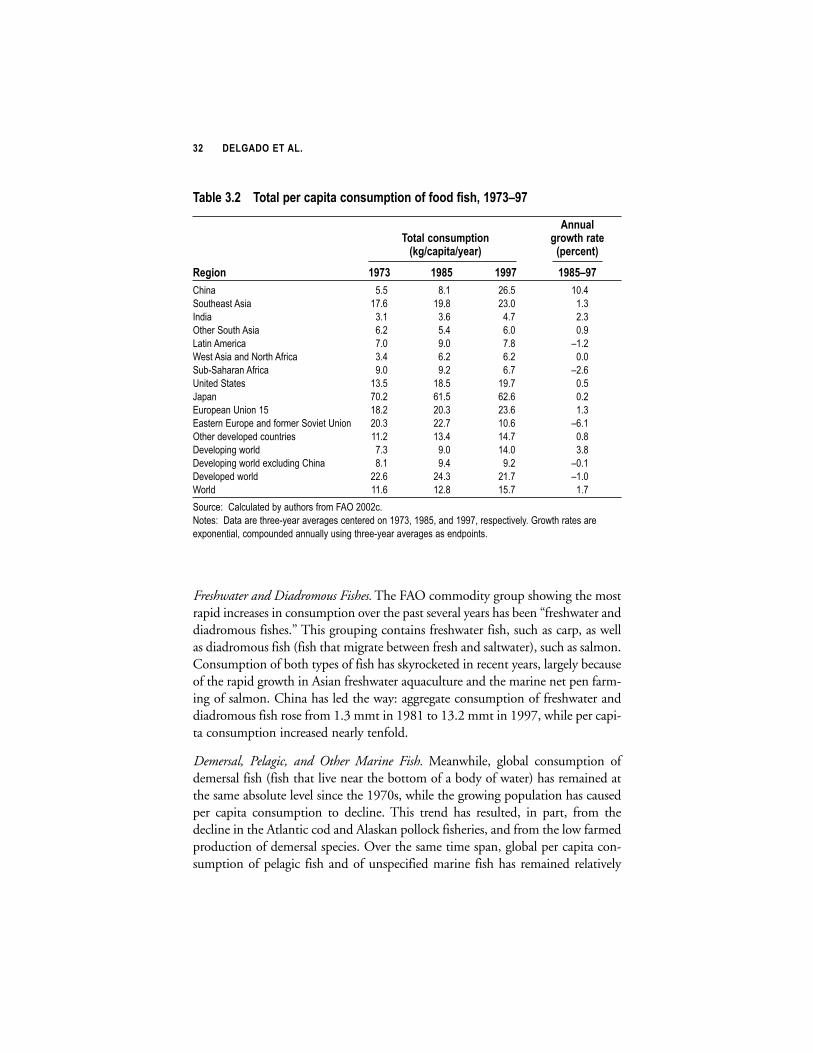
�� ��������������
Freshwater and Diadromous Fishes. The FAO commodity group showing the mostrapid increases in consumption over the past several years has been “freshwater anddiadromous fishes.” This grouping contains freshwater fish, such as carp, as wellas diadromous fish (fish that migrate between fresh and saltwater), such as salmon.Consumption of both types of fish has skyrocketed in recent years, largely becauseof the rapid growth in Asian freshwater aquaculture and the marine net pen farm-ing of salmon. China has led the way: aggregate consumption of freshwater anddiadromous fish rose from 1.3 mmt in 1981 to 13.2 mmt in 1997, while per capi-ta consumption increased nearly tenfold.
Demersal, Pelagic, and Other Marine Fish. Meanwhile, global consumption ofdemersal fish (fish that live near the bottom of a body of water) has remained atthe same absolute level since the 1970s, while the growing population has causedper capita consumption to decline. This trend has resulted, in part, from thedecline in the Atlantic cod and Alaskan pollock fisheries, and from the low farmedproduction of demersal species. Over the same time span, global per capita con-sumption of pelagic fish and of unspecified marine fish has remained relatively
�$%&'���� �()$&�*'+�.$*)$�.(/1-8*)(/�(0�0((,�0123��" �4"
�//-$&�()$&�.(/1-8*)(/ 5+(6)2�+$)'7>5@.$*)$@?'$+9 7*'+.'/)9
�'5(/ �" � �"!� �"" �"!�4"
0���� ��� ��� ���� ����
������������ � �� � �� ���� ���
����� ��� ��� �� ���
������������� ��� ��� ��� ��
����������� �� �� �� ����
!���������"����#���� ��� ��� ��� ���
��$%�������#���� �� �� �� ����
&����������� ���� ���� � � ���
'�(�� ��� ���� ���� ���
)���(���&������ ���� ���� ���� ���
)������)���(����#�������*���&���� ���� ��� ���� ����
�������*�+�(����������� ���� ���� ��� ���
,�*�+�(��-.��+� �� �� ���� ���
,�*�+�(��-.��+��/�+����-0���� ��� �� �� ����
,�*�+�(��.��+� ���� ���� ��� ����
!��+� ���� ���� ��� ��
������10�+��+����$2�������#���3�������
"����1,�����������%2����*���-������������� ��� ������� ����(����*�+2�4��.����������
�/(�������+����(�����������++2����-�����%2����*���-�������(������
��������������:�������������������:����:��:���""#1 ��
constant, while aggregate consumption has grown slowly. Consumption of marinefinfish species, broadly speaking, has been limited by the relative difficulty of aqua-culture production combined with the already high levels of exploitation in capture fisheries.
Cephalopods, Other Mollusks, and Crustaceans. Consumption of both crustaceansand noncephalopod mollusks has increased rapidly over the past several decades.In the case of crustaceans, the rising consumption of farmed shrimp and wild-caught marine shrimp has led the way; global per capita consumption of crus-taceans has nearly tripled since 1970. At the same time, per capita consumptionof noncephalopod mollusks—mostly shellfish such as oysters and clams—has alsotripled. The rise in consumption of shellfish has been centered in Asia, wheregrowing aquaculture production of mollusks, especially in China, led to an incred-ible 13-fold increase in per capita consumption from 1981 to 1997. Aggregatecephalopod consumption, mostly consisting of squid, has more than doubled in30 years, but per capita levels have remained fairly low—0.4 kg/year on a globalbasis in 1997.
����������������6��������������
This section outlines historical consumption trends based on fisheries commodi-ty aggregates devised according to market-based criteria (Box 3.1). Global percapita consumption of market-based fisheries commodities is led by low-valuefood fish at 7.5 kg/year in 1997, followed by high-value finfish consumption at4.4 kg/year, mollusks at 2.4 kg/year, and crustaceans at 1.2 kg/year. Consumptionlevels of total food fish are highest in China, Southeast Asia, and the developedworld (Table 3.2).
Low-Value Food Fish. Consumption of low-value fish has seen the largest absoluteincreases during the past several decades, as the poor in Asia have added diversityto their diets through increased consumption of farmed freshwater fish. Globalaggregate consumption of low-value food fish rose from 18 mmt in 1973 to 43mmt in 1997 (Appendix Table E.15). Chinese consumption drove most of thisincrease, rising from 4 mmt to 20 mmt as per capita consumption grew at an aver-age annual rate of 9.2 percent during 1985–97. The developing world as a wholeis a large net importer of low-value food fish, receiving approximately 2.3 mmt in1997 in imports from the developed world.
Interestingly, the overall share of low-value food fish in total food fish hasdecreased from the early 1970s to the late 1990s in both developing and devel-oped countries, yet it has increased in the world as a whole, from 41 to 47 percentover the same period (Table 3.3). This non-intuitive result stems from continued

�� ��������������
�( ���� �**(+)(//5�$55+'5$)'�0((,=012�.(/1-8*)(/�,$)$�%?�8$+>')�.$)'5(+'1
Aggregating fish consumption data into the market categories introducedin Chapter 2 is considerably more difficult than aggregating fish produc-tion data. Published FAO fish-utilization data, like production data, areaggregated by live weight into commodity groups according to biologicaland ecological criteria (see Figure 3.1). The data, however, are not avail-able at the disaggregated levels of the production data. These broad cate-gories have a drawback for consumption analysis: ecological categoriessuch as “pelagic” lump together commodities like tuna and herring, whichclearly belong in separate market-based categories because they have verydifferent demand responses to price and income changes. As prices andincomes change, analysis of tradeoffs in demand with nonfish food com-modities requires the reassignment of consumption data into the market-based aggregates described earlier.
Figure 3.1 Re-aggregating consumption data
FAO Categories IMPACT Categories
Unspecified marine fish
Low-value food fish
Freshwater/diadromous
Pelagic marine fish High-value finfish
Demersal fish
Crustaceans Crustaceans
Cephalopod Molluscs
Molluscs
Noncephalopod Molluscs
���������

��������������:�������������������:����:��:���""#1 ��
rapid growth in low-value food fish consumption in absolute terms in developingcountries (albeit more slowly than mollusk and crustacean consumption). Becausethe relative share of low-value food fish consumption is much higher in develop-ing than in developed countries, its relative global share has continued to increase.This has occurred even as consumers in both developing and developed countriesare more rapidly expanding their consumption of higher valued items.
High-Value Finfish. High-value finfish represents the only category of fish that hasdecreased in overall per capita consumption since 1973 (Appendix Table E.28).Declines in high-value finfish consumption in Japan and the former Soviet Unionhave offset increases in Asia, the United States, and elsewhere. Nonetheless, the
�( ���� �(/)/-',
Most of the FAO utilization categories map easily into these market-basedcategories, as was the case for production. The FAO category crustaceansis self-explanatory. Cephalopods (such as squid) are mollusks, and there-fore go into that market category, as do noncephalopod mollusks likeclams, oysters, mussels, and scallops (as described in Box 2.1). Demersalfish are primarily high-value marine fish like flounder, cod, sole, halibut,and seabass, which are considered as high-value finfish. Unspecifiedmarine fish are categorized as low-value food fish. The two remaining categories—pelagic fish and freshwater/diadromous fish—are more problematic. Pelagic fish include high-value species such as tuna and swordfish; howev-er, they also include lower-value species like herring and anchovies. Thedifferences in valuation of these commodities suggest that they have verydifferent consumption characteristics, and may in fact be consumed bydifferent sets of people. Freshwater/diadromous fish are similarly heteroge-neous in value, ranging from carp on the low end to salmon and trout onthe high end. Apportioning the demand for these categories between low-value and high-value fish requires clear decision rules using reasonableassumptions about country-level uses. Hence, fish from these categoriesthat are consumed in or imported by developed countries are categorizedas high-value finfish; fish that are consumed in or imported by developingcountries are categorized as low-value food fish.†
†This approach is imperfect, and will inevitably introduce some error; however, the generalvalidity of the approach was confirmed by aggregating processed-weight trade data into categories roughly corresponding to IMPACT and FAO categories. See Appendix C for further details on the assignment, error correction, and balancing of production, trade, and consumption data.

�� ��������������
levels of annual per capita consumption in Japan (33 kg), the European Union (15kg), and the United States (13 kg) still dwarf the levels in developing countries (2kg). Developed countries are by far the largest consumers of high-value fish; theyaccounted for 73 percent of global consumption in 1997. Nonetheless, this sharehas decreased from 86 percent in 1973—a phenomenon driven largely by growthin Chinese and Southeast Asian consumption.
Developing countries have rapidly entered export markets for high-value fin-fish since the 1980s. Latin America in particular has emerged as a major netexporter of high-value finfish, notably Chilean salmon produced from aquacul-ture. The Latin American region’s net exports grew by 1.5 mmt from 1985 to1997, while during the same period, developed countries expanded their netimports by 2.5 mmt.
Mollusks. As mentioned above, mollusk consumption has boomed in China. The14.5 percent growth rate in Chinese per capita consumption of mollusks from1985 to 1997 dwarfed the comparatively modest growth in the rest of the devel-oping world (2.1 percent, Appendix Table E.29). Europe and Japan are majorimporters of mollusks, with combined net imports of 1 mmt in 1997, while LatinAmerica and China are fairly large exporters.
Crustaceans. Crustacean consumption is also centered in Asia, where China, India,and Southeast Asia have all seen robust growth (Appendix Table E.30). Per capita
�$%&'���� �2$/5/5�+'&$)'�8*(+)$/.'�(0�&(6=$&-'�0((,�012�$1�$�12$+'�(0
)()$&�0((,�012�.(/1-8*)(/3��" �4"
�//-$&�5+(6)2�+$)'1�(0� �(6=$&-'�0((,�0120((,�012�.(/1-8*)(/ $1�$�12$+'�(0�)()$&
�"!�4" 0((,�012�.(/1-8*)(/7*'+.'/)9 7*'+.'/)9
:52= �(6= �()$&$&-' $&-' 0((,
�'5(/ 0/012 0((,�012 012 �" � �"!� �""
,�*�+�(��-.��+� ��� ��� �� � � ��
,�*�+�(��-.��+��/�+����-0���� �� ��� ��� � �
,�*�+�(��.��+� ���� ��� ���� �� ��
!��+� �� ��� ��� �� �� �
������10�+��+����$2�������#���3�������
"����1,�����������%2����*���-������������� ��� ������� ����(����*�+2�4��.����������
�/(�������+����(�����������++2����-�����%2����*���-�������(������

��������������:�������������������:����:��:���""#1 �
consumption of crustaceans in the developed world (2.0 kg/year) is still doublethat of the developing world. Latin America and Southeast Asia are large exportersof crustaceans; the farmed production of shrimp in Ecuador, Indonesia, Thailand,and Viet Nam has provided a major source of export revenue for these countries.
1��!��������
Unlike the behavior of red meat prices, which lost up to half their value on worldmarkets between the early 1980s and the late 1990s (Delgado et al. 1999), freshand frozen fish have shown a long-term increase in their real prices since the sec-ond world war, as shown in Figure 3.2 for the United States. An exception iscanned finfish products, which have become less favored in the consumption bas-kets of developed countries since the early 1970s. Other exceptions are the specif-ic cases of shrimp and salmon, where the rapid entry of aquaculture has loweredprices for these luxury goods, even as it has greatly broadened the market for thesegoods.
Figure 3.2 U.S. producer price indexes for fish and seafood products,1947–2000
Source: Calculated from U.S. Bureau of Labor Statistics 2002.Note: Data were deflated by the U.S. Producer Price Index for all commodities.
0.0
0.2
0.4
0.6
0.8
1.0
1.2
1.4
1.6
1.8
2.0
1947 1952 1957 1962 1967 1972 1977 1982 1987 1992 1997
Canned
Frozen
Fresh
Index (1982=1)
�! ��������������
Because fisheries commodities and markets are extraordinarily diverse, pricetrends in different regions for different commodities are also diverse. Survey datafrom China, for example, indicate that real fish prices increased very slightly dur-ing 1980–2000, with increases during the 1980s and smaller decreases during the1990s (Huang, Liu, and Li 2002). However, long-term price series for broad fish-eries commodity groups in developing countries are generally unavailable. Exportunit values provide a useful substitute. These should be treated with cautionbecause export unit values are not a perfect proxy for price, and the bundle of actu-al commodities within each group changes over time and across countries.Nonetheless, the weighted average prices represented by export unit values do givean indication of the direction of price changes.
Table 3.4 shows nominal and real export unit values over time of fisheriescommodities of particular interest, reported in processed weight. For the com-modities shown, real export unit values declined during 1977–85, though thisdecline generally reversed or slowed during 1985–97. It is noteworthy that exportunit values for salmon, shrimp, and freshwater fish have seen real declines from1985 to 1997, a phenomenon that can probably be attributed to the rapid growthof aquaculture production of these commodities. Meanwhile, real export unit val-ues for tuna and cod have risen.
The commodity unit values listed in Table 3.5 are for processed-weight com-modities and follow the broad, market-based categories defined above.Crustaceans have by far the largest export unit value, while low-value food fishhave the lowest. Real export unit values declined for all categories of food fishcommodities from 1977 to 1985 but increased from 1985 to 1997. High-valuefinfish unit values increased the most during this time span (42 percent), reflect-ing increased demand and stagnant production in this category. During 1985–97,combined production of high-value finfish grew only 9 percent, the slowestgrowth of all market-based fisheries commodities. The reported values are globalaverages; naturally, variation exists across regions and commodities.
�$")($�%���"*��%#&�1�"%#��$(#�
$����������/ ��������������������"�!��������������
����������!���/��
It has been shown that animal product consumption grows fastest in countrieswith rapid population growth, rapid income growth, and urbanization (Rae 1998;Delgado and Courbois 1998). This pattern is also observed with fisheries productsin particular. Across countries, per capita fish consumption is significantly corre-lated with average per capita national income (Figure 3.3). Consumer theory sug-

��������������:�������������������:����:��:���""#1 �"
gests that as individuals become wealthier, they tend to substitute higher-pricedcalories for lower-priced ones, once basic food needs are met.
The demand for fish products at the household level, as at the national level,is quite responsive to changes in income. A review of studies by Asche andBjorndal (1999) shows income elasticities of demand for fisheries products to begenerally high, often over 1.0. An income elasticity of 1.2, for example, impliesthat a 1 percent rise in income is associated with a 1.2 percent rise in fish con-sumption. Theory suggests that these income responses will be greater for lowerincome groups, and greater for luxury goods. Other evidence suggests that urban-
�$%&'���� �(8/$&�$/,�+'$&�' *(+)�-/)�$&-'1�(0�012'+'1�.(88(,)'1
� *(+)�-/)�$&-'1� �2$/5'�7�����,(&&$+1@>59 7*'+.'/)9
�(88(,)? �" �"!� �"" �" 4!� �"!�4"
"�����+(�����
3��5�������(� �� � ���� �� �� ��
��+���$ �� � �� � ���� � �
6���� ���� ��� ���� �� ��
0��� ���� ��� ��� � ��
3����.����#���� �� � ���� ���� �� ��
"����(��+�(����++��7�# ���� ��� ���� �� �
8��+(�����
3��5�������( ��� ���� ���� ��� �
��+��� ��� ���� ���� ��� ���
6��� �� � ���� �� � ��� ��
0�� ���� ���� ���� ��� �
3����.����#��� �� � ���� �� ��� ���
"����(��+�(����++��7� ��� ���� �� ��� ��
�������10�+��+����$2�������#������(�������������������������#3�������9+��:3������;�
"����1,�����������%2����*���-������������� �� ������� ����(����*�+2�&���*�+������
��(�������(��������.��-���6����#+��������#�����+*�+��������&���9�������9��������/#���++
������������.����$���2����#� ����,�#������������-�����3�:�����;�����������������+6����0+����#�������:��60;����-��2<�����(��
(��.���#��5���=$,�#������������-�������60����-�����<��+����#��5���/�����=<��+����#��������++���/�����=���
<��+����.��+���(������(��(�����(�����*���=�,�#������������-�������60����-�����<�����#��������++���/�����=<�����#��5���/�����=���<�����
.��+���(������(��(�����(�����*���=�,�#������������-�������60����-�����<����#��������++���/�����=<����#��5���/�����=<������+����=���
<�������������#�++����=�,�#�������++���(����#����#����.����#���������++������#����.����#����"�+�(�����(�����(�7�������+�(��
(�������#����������--��-������������(���������������3�:�����;�#,�#������������-��������������+0+����#�������#�����������:�0�;�����(��+�(����++��7����-�����
<��++�����������=<��++����������=<��++�����/�+����-��(��+�(����=���<��++����#��5���=

�# ��������������
ization also drives increased fish consumption through changing preferences(Huang and Bouis 1996).
Given the structural responsiveness of food fish demand to income andurbanization as argued above, it is not hard to see why the preponderance ofdemand growth has occurred in developing countries. Since the early 1980s,aggregate consumption of fisheries products has grown rapidly in the developingworld, at an average annual rate of 6 percent (Table 3.1). In China, where incomeand urbanization grew particularly rapidly from the early 1980s to the late 1990s,fish consumption grew at an astonishing 12 percent per year.
Moreover, population growth has played a significant role. As shown in Table3.6, population hardly grew in the developed world during 1985–97 (0.6 percentper annum), while growth in the developing world was robust (2.1 percent perannum excluding China). Even without per capita income growth, developingcountries will consume significantly more fish each year. Rates of urbanizationhave also been much higher in developing countries than in the developed world.Urbanization has been a major factor in China, even if population growth has not.
Table 3.6 also shows that China distinguishes itself from other large regionsof the world in the extraordinarily high income growth rate it has sustained sincethe mid-1980s. It is hard to understand the major changes that have occurred inChinese fisheries over the same period without taking this into account.Household surveys from China (Huang, Liu, and Li 2002) show that urbaniza-
�$%&'���� �(8/$&�$/,�+'$&�' *(+)�-/)�$&-'1�(0���;����.$)'5(+'1
� *(+)�-/)�$&-'1� �2$/5'�7�����,(&&$+1@>59 7*'+.'/)9
�$)'5(+? �" �"!� �"" �" 4!� �"!�4"
"�����+(�����
��.%*�+��#���#��� ��� �� ��� �� ��
>�-�%*�+��#��#��� ��� ���� �� � �� �
0���������� ���� ���� �� �� ��
?�++��7� ���� �� � �� � �� ��
6���+#���#��� ���� �� � ��� � ��
8��+(�����
��.%*�+��#���#��� ���� �� � ���� �� ��
>�-�%*�+��#��#��� ���� ���� ���� �� ��
0���������� ���� ���� ��� ��� ��
?�++��7� ���� ���� ���� ��� ��
6���+#���#��� ��� ��� ���� ��� ��
�������10�+��+����$2�������#������(�������������������������#3�������9+��:3������;�
"����1&���*�+��������(�������(��������.��-���)/(���*�+���.����--��-���������?906 ����-�����
��������-�������#����������((����/@�6����#+��������#�����+*�+��������&���9�������9��������/
#���++������������.����$���2����#� ���
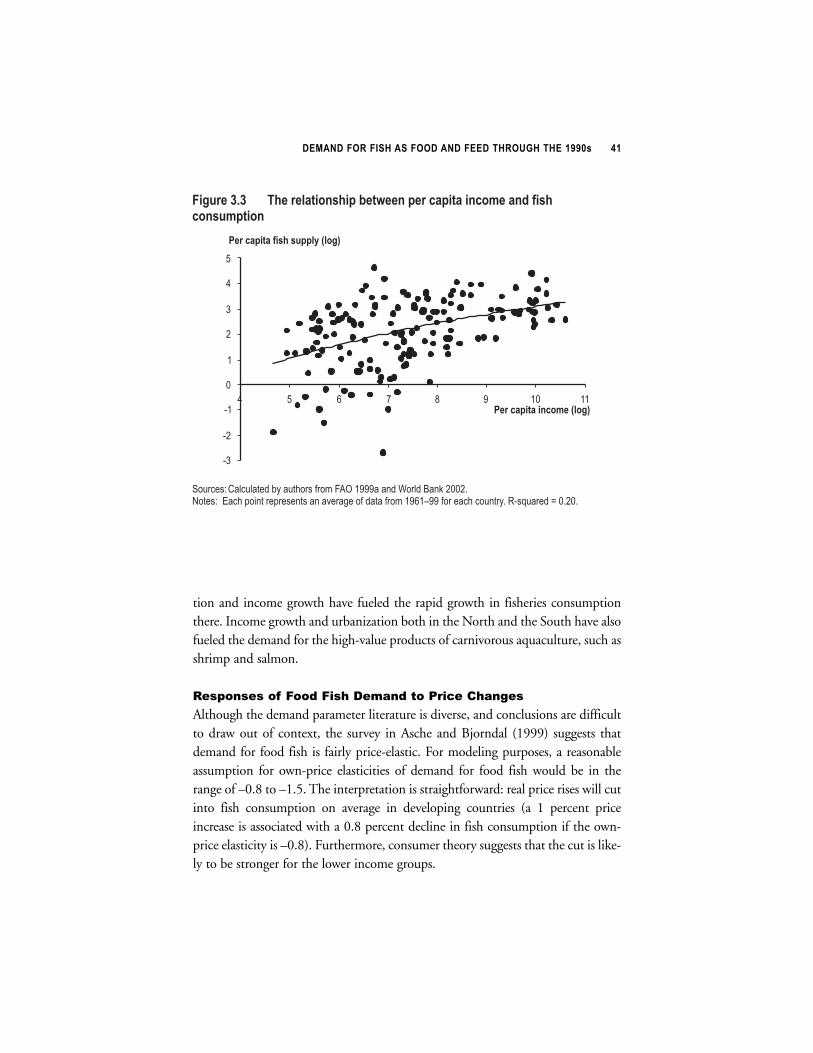
��������������:�������������������:����:��:���""#1 ��
tion and income growth have fueled the rapid growth in fisheries consumptionthere. Income growth and urbanization both in the North and the South have alsofueled the demand for the high-value products of carnivorous aquaculture, such asshrimp and salmon.
$����������/ ��������������������1��!���������
Although the demand parameter literature is diverse, and conclusions are difficultto draw out of context, the survey in Asche and Bjorndal (1999) suggests thatdemand for food fish is fairly price-elastic. For modeling purposes, a reasonableassumption for own-price elasticities of demand for food fish would be in therange of –0.8 to –1.5. The interpretation is straightforward: real price rises will cutinto fish consumption on average in developing countries (a 1 percent priceincrease is associated with a 0.8 percent decline in fish consumption if the own-price elasticity is –0.8). Furthermore, consumer theory suggests that the cut is like-ly to be stronger for the lower income groups.
-3
-2
-1
0
1
2
3
4
5
Figure 3.3 The relationship between per capita income and fishconsumption
Sources: Calculated by authors from FAO 1999a and World Bank 2002.Notes: Each point represents an average of data from 1961–99 for each country. R-squared = 0.20.
Per capita income (log)
Per capita fish supply (log)
5 6 7 8 9 10 114

�� ��������������
Poultry may be the best substitute for fish in developing regions, thoughcross-price elasticities with red meat products are fairly small (Delgado andCourbois 1998). A cross-price elasticity of 0.3, for example, implies that a 1 per-cent rise in poultry prices, ceteris paribus, induces a 0.3 percent rise in fish demand.
It is certainly true that aquaculture growth has been instrumental in makingfish widely available in developing countries, especially in China. The resultingincreased local availability (theoretically akin to a local price decline) is alsoundoubtedly a factor in many situations; the existence of rural markets for fish inChina is a significant factor in household fish consumption (Huang, Liu, and Li2002). Improvements in processing technology and cold chains that preventspoilage of fisheries products also contribute to increasing consumption by mak-ing fish available in markets at a distance from the source of production.
Nonetheless, aquaculture production meets an increased general demand foranimal products. In general, fish prices have risen relative to other food products,driven partly by rapid consumption growth. In developed countries, overall percapita consumption of fish has stagnated as saturation levels in the diets of con-sumers have been reached, though there has been growth in demand for crus-taceans on the higher end of fisheries commodities, consistent with consumer the-ory. In developing countries, per capita consumption of all fisheries commoditieshas grown, with consumption of the relatively expensive crustaceans and mollusksrising fastest. The developing countries still have great latitude for increasingdemand for low-value fish, but it is to be anticipated that the “upgrading”observed in the developed countries is also occurring among the better-off seg-ments of the developing world. This move toward higher value fish products fromaquaculture may also be leading to increased demand for fish used as feed, orreduction fish.
�$%&'���� �$.)(+1�.(/)+%-)/5�)(�,00'+'/)$&�5+(6)2�+$)'1�0(+�0((,�012�/,''&(*',�$/,�,''&(*/5�.(-/)+'13��"!�4"
�'+$5'�$//-$&�5+(6)2�+$)'13��"!��" �7*'+.'/)9
�'5(/ �()$&�*(*-&$)(/ �+%$/�*(*-&$)(/ ��; *'+�.$*)$
,�*�+�(��-����������/�+����-0���� ��� ��� ���
0���� ��� �� ��
,�*�+�(����������� ��� �� ��
!��+� ��� ��� ���
������10�+��+����$2�������#���!��+�@��7�����
"����14��.�����������/(�������+����(�����������++2����-�����%2����*���-�������(������

��������������:�������������������:����:��:���""#1 ��
��������������/ �������/���$���!���������
Fishmeal and fish oil are products derived from wild-caught fisheries that are usedfor feeding terrestrial livestock and farmed fish. The global supply of fishmeal andfish oil has changed little over the past several decades, as supply is limited byresource constraints (described in Chapter 2). Demand for fishmeal and fish oil isprimarily determined by the underlying demand for livestock and fish, but is alsodetermined by a wide range of other factors, including feed conversion efficiency,the relative prices of competing feeds, and the outlook for competing sectors thatalso consume fishmeal and fish oil. High-value aquaculture that produces carniv-orous fish and crustaceans has strong demand for these feed inputs. In fact, aqua-culture’s share of demand for fishmeal and oil has grown significantly over the pastseveral decades. Historical use patterns for fishmeal are shown in Table 3.7.Regions with rapidly growing poultry, pig, and aquaculture sectors, such as Chinaand Southeast Asia, have increased their shares of global use.
Aquaculture is likely to grow rapidly over the next 20 years, raising concernsthat rising demand for fishmeal and fish oil could place heavier fishing pressure onthreatened stocks of reduction fish. Addressing questions regarding the potential
�$%&'��� �1'�(0�0128'$&3��" ��"
�//-$&�()$&�-1'� 5+(6)2�+$)'
7)2(-1$/,�8')+.�)(/19 7*'+.'/)9
�'5(/ �" � �"!� �"" �"!�4"
0���� ��� ��� ��� � ��
������������ ��� ��� �� ��
����� � �� �� ����
������������� � �� � ���
����������� ��� � � ��� ����
!���������"����#���� �� ��� ���
��$%�������#���� �� �� �� ���
&����������� ��� ��� �� ����
'�(�� ��� ����� �� ����
)���(���&������ ����� ��� � ��� � ���
)������)���(����#�������*���&���� � ����� ��� � ��
�������*�+�(����������� � ��� �� ���
,�*�+�(��-.��+� � ����� ����� ��
,�*�+�(��-.��+��/�+����-0���� �� ����� ��� � ���
,�*�+�(��.��+� ���� ��� � �� �� ���
!��+� ����� ��� � ����� ���
������10�+��+����$2�������#���3�������
"����1,�����������%2����*���-������������� ��� ������� ����(����*�+2�4��.����������
�/(�������+����(�����������++2����-�����%2����*���-�������(������
�� ��������������
impacts of aquaculture growth on reduction fish stocks requires a framework thatallows for price-mediated interactions among terrestrial livestock, aquaculture,fishmeal and fish oil, and other feed substitutes. Chapter 6 addresses this questionin detail.
The picture that emerges for feed fish demand, as for food fish demand, is oneof rapid changes driven particularly by events in Asia. Substitutions are takingplace on both the consumption and production sides. Relative prices are chang-ing, which creates new incentives for substitution. Furthermore, all these changesare occurring in the context of technological progress. The next chapter discussesa methodological approach that simulates all these factors simultaneously.

� � � � � � "
1$%'(��"%#��%����
&#�($��"��($(#���(# $"%
Auantitative simulation into the future of the relation of fisheries to othercomponents of world food supply and prices has not been done at theglobal level to date, at least not with any degree of disaggregation. Many of
the methodological difficulties inherent in the task were discussed in Delgado etal. (2000). This chapter reports results of the projections to 2020 for 10 major eco-nomic categories of fisheries items, disaggregated into 12 geographic regions of theworld.10
A difficulty in undertaking formal inquiry of this type is the complexityinvolved with using data produced independently and then aggregated to theglobal level in broad commodity groups. All policy analysts wishing to examinethe price interactions among disaggregated food sectors at the global level are com-pelled to use national-level data from the FAO, the only source of such informa-tion. These data are based on submissions from national statistical agencies.
�%�(-"#���"*��%����,"�*"#� ��-%� -��%�(-�
%���%%��&11-+� #���(� #�
Besides providing a framework for assessing the consistency of assumptions aboutfish production, feed requirements, consumption, and trade, the main contribu-tion of economics as a discipline to forecasting fisheries outcomes is to explicitlyaccommodate the reality that producers, traders, input suppliers, and consumers
��
�.$� ��� ��� ���� ������ � � �� � �������� �� � ��������� ��� ���� "������ !������� ��� ���
3��� ��������3�����������6��� ��������!�������0 �������������.���..���=����������>�
?�������+8���������������..��-�

�� ��������������
all react to changes in relative prices, and choose among alternate inputs and out-puts—including nonfisheries alternatives—based on perceptions of changing rel-ative costs and benefits. Thus projections of long-term massive changes in relativeprices for specific fisheries items need to be treated with caution, because over timepeople in the real world are likely to find a better way of achieving their goals asconsumers or producers before those massive relative price changes actually occur.
The tool of choice for taking into account the impact of price changes on pro-duction, consumption, and trade trends is a supply and demand model that cal-culates demand and production outcomes for different commodities and loca-tions, and estimates an equilibrium set of prices and trade flows that allows all foodmarkets (including food items used as feeds) in all locations to match localdemand with local availability (production plus net trade). Furthermore, themodel needs to take into account the main nonprice drivers of change, such aschanging demographics and income levels. Finally, the model should allow itera-tive changes, in the sense that producers, consumers, and traders should have achance to refine their strategies periodically in light of changing conditions (sayonce a year in the case of a long-term model), as do participants in the real world.
IFPRI’s International Model for Policy Analysis of Agricultural Commoditiesand Trade (IMPACT), developed and maintained by a team led by MarkRosegrant, meets these conditions (Rosegrant et al. 2001). IMPACT is specifiedas a set of country or regional submodels, within each of which supply, demand,and prices for agricultural commodities are determined. The present version ofIMPACT (July 2002) covers 36 countries and regions (accounting for virtually allworld food production and consumption) and 22 nonfish commodities, includ-ing all cereals, soybeans, roots and tubers, four meats, milk, eggs, oils, oilcakes,meals, sweeteners, fruits, and vegetables.
IMPACT uses a system of supply and demand elasticities for each commod-ity, different for each of the 36 markets and incorporated into a series of linear andnonlinear equations, to approximate the underlying supply and demand func-tions. Cross-price elasticities and intermediate demands (such as feed grains forlivestock production) ensure the interlinkage of markets within each of the 36country groupings. Demand within each of the 36 country-group markets is afunction of prices, income, and population growth specific to that market.Growth in crop production in each country-group is determined by crop pricesand an exogenous rate of productivity growth specific to that group.
Prices are endogenous in the system. Domestic prices consist of world pricesmodified by country- and commodity-specific price differentials. The effects ofcountry-group specific price policies are expressed in terms of producer subsidyequivalents (PSE), consumer subsidy equivalents (CSE), and marketing margins.PSE and CSE measure the implicit level of taxation or subsidy borne by
;��B������������#�#���������������������������������
producers or consumers relative to world prices and account for the wedgebetween domestic and world prices.
Marketing margins reflect factors such as transport costs. All prices and quan-tities are in live-weight equivalents, so processing costs are not included. The pos-sible effects of major structural changes in world trade, such as China’s entry intothe WTO or the effects of a possible agreement during the Doha round of tradetalks beginning in 2001, are not explicitly incorporated in the model.11
The 36 country-group submodels for each commodity are interlinkedthrough trade with a separate, unique “world market” for each commodity, a spec-ification that highlights the interdependence of commodity prices across countriesand commodities in global agricultural markets. Commodity trade by country-group is the difference between domestic production and demand for that country-group. Countries with positive trade are net exporters, while those withnegative values are net importers. This specification does not permit a separateidentification of countries that are both importers and exporters of a particular commodity.
The world price of a commodity is the equilibrating mechanism such thatwhen an exogenous shock is introduced in the model, the world price will adjustand each adjustment is passed back to the effective producer and consumer pricesvia price transmission equations. Changes in domestic prices subsequently affectsupply and demand of the commodity concerned and of complements and sub-stitutes for that commodity, necessitating myriad iterative readjustments for allcommodities and regions until world supply and demand balance, and world nettrade is again equal to zero. World agricultural commodity prices are thus deter-mined annually at levels that clear world and regional markets.12
Forecasts of changes in relative prices from 1997 to 2020 are the principalinsight offered by global supply and demand models such as IMPACT. Thechanges that are forecast are devoid of inflation and can be shown as percentage
��3��������"��� �����������������������������"����� �� ������� ����������������!� �����!���
���!�� � � ��� ����!������� 3�� ������� ��� ���� ���� ����� ����� ������ ���������� ��
39$�40������ ������������
��0���!������� �����������*��� �������" ���9������������!�+*�9�-�� �� �!!�������
�������0�����������������������!�����5��������������������������*��������������� ��!�
0���� ����� ��!�!<���������!��������� ������� ������������ �������������������������� � ��
!� ����� ����� �����!!����������������������!� �������� ������������������������� ��� ���
��������������!������� ����������!!�������!����<� �������������������������������!���
������������ �������!!���������������� �����9�@� ������4����+�..�-��� ���������������� ��
�������39$�40 � � ����������� �� ������������

�! ��������������
changes over the entire period relative to an actual base level in 1997. They pro-vide insights into the net effect of thousands of simultaneous assumptions andparameters, adjusting over time to demographic changes, income growth, techno-logical changes, and to changes in relative prices themselves. The latter occurthrough substitution effects in both consumption and production. Consumptioneffects occur as consumers re-orient their consumption basket to handle pricechanges. Production effects occur as producers modify their behavior in responseto relative price changes, and as intermediate products such as animal feeds areaffected by changing demands for their use as inputs to livestock products andfish.
The fisheries components of IMPACT follow the same general approach asthe rest of the model. The number of fisheries commodity groups must be limit-ed to a manageable number. Yet demand response parameters to price and incomechanges must be fairly similar across subcomponents of each aggregate category;supply parameters must also be comparable. The new version of the modelincludes four categories of food fish, as discussed in Chapter 3. These are high-value finfish (such as salmon and tuna), low-value food fish (such as herring andcarp), crustaceans (such as shrimp and crabs), and mollusks (such as clams andsquid). It also includes two animal feed items made from fish: fishmeal and fishoil.
Commodities produced by aquaculture and capture need to be differentiated,given that they have different production parameters, even if treated as the samegood in consumption. Thus the four food fish categories are further subdivided onthe production side into separate categories for capture and aquaculture outputs.On the consumption side, the model collapses aquaculture- and capture-producedfood items into four categories plus fishmeal and fish oil. Supply (aquaculture andcapture) and demand (combined) for these six composite items interact to pro-duce six equilibrium fisheries prices in each geographic market, and these interactwith markets in other countries, and for other food and feed commodities.
Another difficult modeling problem is that supply, demand, and trade mustbe balanced for the 36 country groups. This is a problem in any global modelingexercise because independently collected global datasets rarely balance, and wouldbe slightly suspect if they did. Furthermore, simplifications adopted in aggregat-ing commodities into economic commodity and country groups, while eliminat-ing a few non-animal or minor commodities (see Appendixes A and B), are likelyto create inconsistencies in the end product. For the purposes of this study, bal-ance across production, consumption, and net trade (see Appendix D) for eachcountry group and consumption category has been imposed ex post for the baseyear of the projections (1997), as discussed in Appendix C; consistency in the pro-jections thereafter is achieved by model construction.

;��B������������#�#���������������������������������"
Finally, constructing a basic model of fisheries supply and demand withinIMPACT, according to the principles discussed above, requires adding thousandsof parameters for the fisheries section alone: 36 country groups multiplied by 10commodities in production and 6 in consumption, multiplied by the number ofrelationships and parameters in each fisheries relationship. Existing literature onsupply and demand for fish was used as much as possible, but it was clearly nec-essary to extrapolate many of the parameters given that no specific estimates existfor these items.
�*%%"#��1 $ �(�($
The determinants of fisheries demand in the IMPACT model can be separatedinto two broad categories: price-mediated drivers and nonprice-mediated drivers.On the demand side, IMPACT models responses to changes in own-prices, pricesof competing and substitute goods in consumption, income, and population. Onthe supply side, IMPACT models responses to changes in own-prices, prices ofcompeting and substitute goods in production, and input prices. The model alsoincludes a trend yield growth factor to capture nonprice influences on growth ofproduction. Parameters are modified every five years to allow for expectedchanges, such as declining income responsiveness (as income grows, demandbecomes less sensitive to further increases in income) over time, or the impact ofincreasing urbanization on demand for higher priced calories (Rosegrant, Meijer,and Cline 2002).
�������1���������
Population growth trends are a major determinant of demand growth in theIMPACT framework. Population growth estimates are based on medium-variantpredictions from the United Nations (1998); they are specified for each IMPACTcountry group, and different rates are specified for each five-year period to 2020.World population doubled from 3 billion in 1960 to 6 billion in 1999; the aver-age annual growth rate has declined to 1.4 percent in 1998. Population growthrates will likely decline further over the next 20 years. High population growth willoccur in Sub-Saharan Africa, where a population of nearly one billion people isprojected for 2020 (United Nations 1998). The huge population bases in Chinaand India will mean that, despite comparatively low population growth rates, thesetwo countries will account for nearly a third of the global population increase to2020, and thus for a large share of the growth of demand for food.13
�#��������� ������������..���� ��� ��� ����������������������
�# ��������������
Income changes in IMPACT affect demand through a set of country-groupand commodity-specific income elasticities of demand. These are typically higherin poorer countries and for higher value products such as fish. Income elasticitiesare typically specified to decline every five years over the projections period, addingcurvature to the relationship between consumption and income, as is the case withincreasing satiation of food demand over time. The decline in income elasticitiesover time is kept smaller for high-value items in countries still thought to be sub-ject to rapid urbanization, such as China, because of assumed shifting preferencesin favor of higher value fish.
Income change is measured by growth rates in future national income pro-jected by the World Bank (World Bank 2002). Generally cautious GDP projec-tions show highest growth in China, India, and Southeast Asia. Developed worldGDP growth projections are generally between 2 and 3 percent per year. Per capi-ta GDP growth translates into increased consumption for fisheries products whenpassed through income elasticities that reflect the demand response to changes inincome. These elasticities are specified for each region based on the best availableliterature and are comparable to those specified for livestock products. Incomeelasticities are generally lower for low-value food fish and also tend to be lower inhigh-income countries because consumption patterns tend to be less sensitive tochanges at higher levels of income.
Price-mediated drivers of consumption are those in which consumers altertheir behavior based on changes in the price of a commodity relative to those ofits substitutes and complements. Consumer responses to relative price changes aremodeled in IMPACT through a system of regionally specific own-price and cross-price elasticities. Own-price elasticities are generally lower for low-value food fish,reflecting their role as a protein staple in many diets in low-income countries. Priceelasticities for fisheries commodities are also in the same range as livestock prod-ucts because they occupy similar roles in the diets of consumers. Cross-price elas-ticities among fisheries products, and between fisheries and livestock products,allow consumers in the model to substitute toward or away from commoditiesdepending on relative prices.
When dealing with broad aggregates such as “low-value food fish,” consider-able variation will arise in the basket of commodities represented across the 36country groups of the model, adding to the need to have different production andresponse parameters across the 36 country groups.14 The demand elasticity with
�)���������39$�40 �����#,������ ��� ������ ������������������� ��� ���� ������ ������������
����� ��� ������� ������� ��������������� ��������������0�����"���������� ��� �����������
���� ������������������������!������� �������������!� ������� �������������

;��B������������#�#����������������������������������
respect to price for low-value food fish in China is related to commodities such asgrass carp, whereas in western Europe it is related more to herrings and sardines.Therefore, for each commodity category, hundreds of demand and supplyresponse parameters must be specified.
The model links demand for fishmeal and fish oil to the demand for livestockand aquaculture products through regionally specified feed demand elasticities andfeed conversion ratios. In the case of aquaculture, for example, a given level of pro-duction of high-value finfish from aquaculture in country X in year T will gener-ate a certain amount of initial demand for fishmeal and fish oil in country X inyear T. The actual amount consumed by this activity in country X, year T, is theniteratively affected by responses to changing relative input and output prices andquantities in country X, year T, which in turn iteratively interact with prices inother countries in year T. The feed conversion ratios that lead to initial resourcedemands by aquaculture products are assumed to become more efficient over timewith technological innovation.
��� ��1���������
Nonprice factors in supply, including technological change and changes in invest-ment, are modeled through trend growth factors that are allowed to differ acrosscommodities, country groups, and every five years through 2020. These “growthfactors” address the important effects—present and future—of myriad nonpricefactors in fisheries production, particularly in the capture fisheries sectors. Thesefactors might include technologies that affect productivity and subsidies that affectdesired investment levels.
Specified future growth rates in technical change for capture fisheries arerather modest in the IMPACT model, reflecting the past decade of stagnatingcatches. Precise estimates of changes in wild fish stocks are extraordinarily difficultto calculate, in contrast with the comparatively easier task of estimating pastchanges in global stocks of livestock such as pigs and poultry. Our approach is topiece together a reasonable but generally conservative scenario for capture fish-eries, using geographically disaggregated assumptions from the extrapolation ofrecent trends that show declining growth rates over time. These assumptions arepart of our “baseline scenario”; actual projections in the baseline depend not onlyon exogenous trend factors but also on responses to endogenous price changesacross all sectors.
Investment and technological change have also been important in aquacul-ture, which has provided most of the growth in global production over the past 15years. Much of these investment and productivity trends are independent of pricefactors and are specified as such, although favorable prices may tend to be associ-ated with lower subsidies and increased investment. Price responsiveness of supply
�� ��������������
is typically specified to be higher in aquaculture than in capture fisheries. Capturefisheries face resource and regulatory constraints that limit price responsiveness, atleast in the medium-term (less than five years); capital stock is a primary determi-nant of capture fisheries supply, and capital stock is heavily influenced by nation-al policies toward fisheries. Studies show generally price-inelastic supply in casestudies of capture fisheries (Pascoe and Mardle 1999). Aquaculturists in both themodel and the real world are more able to adjust production levels in response toyearly changes in prices.
������.������� ���������������!������� �� ����
It is clearly infeasible to fully test the sensitivity of results to the thousands of sep-arate assumptions built into the baseline model. The baseline is our best guessgiven available data, and it embodies sensible assumptions about nonprice trendfactors and responses to income and price changes. It is generally conservative, sothe error is likely to be in under- rather than overforecasting change to 2020. Thisis a deliberate strategy to add strength to predictions of major changes; hence thelikelihood is that—if anything—such changes will be more important in realitythan predicted.
That said, it is not absolutely necessary to agree with the assumptions of thebaseline scenario to derive value from the simulations. Whether or not one agreeswith the baseline assumptions, the model structure is useful for examining the sen-sitivity of fisheries outcomes to changes in assumptions. A number of scenarioswere developed with sweeping changes in different classes of the underlyingassumptions to see what happens. The choice of scenarios was dictated by theunderlying objective of assessing the prospects, constraints, and issues for policiestoward aquaculture, particularly in the face of major uncertainties in the outlookfor capture fisheries.
In this vein, the main point of adding capture fisheries to the model is toinclude its relationship with aquaculture through income and price substitutionrelationships. A more optimistic outlook for growth in capture fisheries would putdownward pressure on fish prices relative to other items, even though relativelylower prices by themselves encourage some increased fish consumption, whichmitigates any price fall. Thus a more positive outlook for capture fisheries impliessomewhat less incentive for growth of aquaculture, even though the price of feedinputs also declines if the capture of feed fish rises along with food fish. A morepessimistic outlook for capture fisheries is likely to be associated with higher pricesfor fish, on a net basis raising incentives for increased aquaculture output, eventhough the price of feed fish also rises.
A major concern is the possibility that the outlook for capture fisheries ismore pessimistic than is embodied in the baseline; hence an extremely pessimistic
;��B������������#�#����������������������������������
scenario is investigated for capture fisheries (“ecological collapse”). Table 4.1describes the project scenarios investigated. The baseline itself is hardly rosy. Forexample, the growth trend factor (the nonprice side of production growth) is neg-ative for most of the developed countries at the start of the simulation (–0.4 per-cent per annum for low value food finfish in Japan, for example). For most of thedeveloping countries, low positive trend growth of +1.0 to +1.5 percent perannum is built in, and declines every five years to 2020. In both cases, actualgrowth is also influenced by response to prices. The ecological collapse scenarioimposes a uniform –1 percent per annum trend decline in capture fisheries,including reduction fish, in all countries through 2020. If producer and consumerresponses were not allowed to occur to modify the final result, this would causethe projection of global production of fish from capture in 2020 to decline bymore than half relative to 1997, a more radical change than any serious fisheriesanalyst has yet proposed.
Another set of assumptions that could have major implications for resultsconcerns nonprice-mediated trends in aquaculture growth. These can be thoughtof as investment flows to aquaculture or productivity increases beyond those inresponse to price changes. As was discussed in Chapter 2, the explosion of pondfinfish aquaculture in China during the 1990s was significantly assisted by a pol-icy focus on this sector. Accordingly, in China for example, a 2.7 percent per
�$%&'���� �'1.+*)(/�(0���;����*+(C'.)(/�1.'/$+(1
�.'/$+( �'1.+*)(/
�� @���+��� '��-����$��������(+����$+�����#�����(������
�� 3������A����+���� 9���������-��.����������/�+����-��((+2���(������(��������-��#���++#���
�/(������ �A����+�������(���--��-��������������������������$2��(��������+���*���
���$���+������������
�� ��.��0���� 0��������(����#��������(������������������$2��������$���2���� �� �
(��������� #�++�.��-!��������9��+2:����;�0�����(�����������������������+������
����������$�+�����8�������������(����(��(���������+2����-#����������%
����� �������������+�����������(���������-��.������������#������*������
�����������B�������.�.��������������.������*��.���������+-��.����(��%
����������������(�����*��(����.��������.����#����+�.��������(������
�� 3������+�����+ 3������*�������##������2#��#������+���#�����+��(��*�����.����������
�##������2 �(���#��������$���+������������
�� �+�.���A����+���� 9���������-��.����������/�+����-��((+2���(������(��������-��#���++�A��%
�/(������ ��+��������������������������$2��(��������+���*������$���+������������
�� )��+�-���+��++�(�� ��(�����������+-��.����������(�����������/�+����-��((+2���(������(����
����-��#���++��(����#����������������������+����-#������+���#�����+�
������1,�*����$2��������
"����16���������-��.����������(����������((+2��(��������##�����#������+�-���+����-����
��������(�����##����C�������+������+���##�����$2(�������(������

�� ��������������
annum trend growth in high-value finfish aquaculture is built into the baselinescenario at the beginning of the simulation, declining to 2.0 percent per annumby 2020. These growth rates are in fact much smaller than actual growth in the1990s and are further modified in the projections by price effects. The “fasteraquaculture expansion” scenario arbitrarily increases the trend components foraquaculture growth in every country and for every aquaculture commodity by afurther 50 percent relative to baseline values. The “slower aquaculture expansion”scenario does the opposite. In both cases, “expansion” could occur throughchanges in resource use or productivity, or both. Again, price effects also influencefinal outcomes.
Another set of important assumptions concerns the rate of technologicalprogress in aquaculture. The “faster aquaculture expansion” scenario increasesassumed trend growth components but does not modify the relationship betweenreduction fish for feed and output fish for food. Consequently, the “fishmeal andoil efficiency” scenario increases the assumed growth in feed conversion efficiencyfor fishmeal and fish oil to twice the assumed rate in the baseline; this varies acrosscountries and commodities but is generally in the range of 1 percent per annumin the baseline.
As discussed in Chapter 2, controversy lingers over the official Chinese fish-eries statistics—specifically that production data may be too high. The baselineincorporates starting figures for 1997 from FAO datasets that have undergone thebalancing procedures discussed in Appendixes C and D to reconcile production,consumption, and trade. Furthermore, the baseline trend growth, price andincome responses, and feed conversion efficiency parameters for China are all con-sistent with reported trends in FAO data from the early 1980s to 1997.
The “lower China production” scenario attempts to modify the baseline sce-nario to fit the over-estimates of marine fisheries output in the late 1990s positedby Watson and Pauly (2001). This is done by reducing total capture fisheries pro-duction in China in 1997 by 4.6 mmt—an amount equivalent to Watson andPauly’s suggested over-estimate of marine capture. These reductions are spreadproportionately over the capture fisheries commodities modeled in IMPACT.However, maintaining consistency among production, consumption, and traderequired balancing to accommodate the lower estimate of production. Since tradeis small in China relative to consumption, and the trade figures are almost certain-ly more accurate than the consumption figures, the latter were reduced to matchthe new production estimate. Finally, given that the production figures for theearly 1980s are not disputed, the lower estimates of production and consumptionin 1997 necessarily imply that the baseline production and consumption parame-ters implied by the FAO data are inconsistent with the new estimates.Consequently, the baseline estimates of supply and demand parameters were

;��B������������#�#����������������������������������
adjusted in the lower China production scenario to be consistent with less rapidhistorical growth in fisheries. The results are not intended to better represent reality in China; rather, they serve to investigate the global implications of down-grading Chinese marine production estimates in the late 1990s.
"�1 ���1$%'(��"%#��%����
%�� ����/��������1��!�����������������"�������!���/
0��!� ����
Net forecast price changes to 2020, given as percentage changes relative to 1997levels, are shown in Table 4.2. The baseline version of the model projects that long-term real prices for high-value finfish and crustaceans increase by a total of 15 per-cent over 1997 levels (above any inflationary change). This result is particularlystriking compared with the projected price trends in other food commodities,which indicate nearly uniform real price declines. Fishmeal and fish oil pricesincrease more than food fish commodities under the baseline scenario, at 18 per-cent. Mollusks and low-value food fish show significantly lower—though still
�$%&'���� ;+(C'.)',�)()$&�.2$/5'�/�*+.'1�-/,'+�,00'+'/)�*+(,-.)(/�
1.'/$+(13��"" 4�#�#
;+(C'.)',�)()$&�.2$/5'�/�*+.'13��"" 4�#�#�7*'+.'/)9
�(1) �$1)'+ �(6'+ �128'$& �&(6'+&>'&? $<-$.-&)-+' �2/$ $/,�012�(& $<-$.-&)-+' �.(&(5.$&
�(88(,)? 7%$1'&/'9 ' *$/1(/ *+(,-.)(/ '00.'/.? ' *$/1(/ .(&&$*1'
��.%*�+��#���#��� � ��� � � �� ��
>�-�%*�+��#��#��� �� �� �� � �
0���������� �� � � �� �� �
?�++��7� � ��� � � �� ��
3������+ �� �� �� ��� � ���
3�����+ �� �� �� �� �� ���
@��# �� �� �� �� �� �
9�-���� �� �� �� �� �� �
����(���� �� �� �� �� �� �
9��+��2���� �� �� �� �� �
)--� �� �� �� �� �� �
?�+7 �� ��� �� � �� ��
D�-���$+����+� �� � � � �� ��
������19��B�������#���������#����398�E��?906 ����+:'�+2����;�
"���1 ���6�$+����#����������������(������

�� ��������������
positive—real price appreciation (4 and 6 percent respectively). Prices for meatand eggs, on the other hand, are forecast to decline by about 3 percent in realterms—still good news for producers in a sector where real prices are currently halfwhat they were 20 years ago.
On this basis, fish become about 20 percent more expensive relative to live-stock-derived substitutes by 2020, even taking into account price-motivated sub-stitutions by consumers. On the other hand, fishmeal and fish oil become slight-ly more expensive (3 percent) relative to high-value finfish, 12 percent moreexpensive relative to low-value food fish, 19 percent more expensive relative to veg-etable meals, and 20 percent more expensive relative to poultry.
Fishmeal and fish oil prices are likely to shoot up under a variety of possiblescenarios (Table 4.2). The worst case is under ecological collapse of capture fish-eries, wherein the direct effect on fishmeal output, coupled with the increaseddemand pressure from aquaculture, results in a more than doubling of currentprices in 2020.15 Even the faster aquaculture expansion scenario causes significantupward pressure on fishmeal prices, in addition to hastening its departure frompoultry rations. Interestingly, faster growth in aquaculture is associated with fur-ther price declines for livestock products, while ecological collapse in marine fish-eries is associated with a net increase in real livestock prices by 2020. Both of theseeffects in the model result from consumers substituting cheaper sources of animalprotein in their diets as relative prices change.
Rapid technological progress in aquaculture, represented by higher fishmealand oil conversion efficiency, is the one scenario that leads to slightly lower realfishmeal prices. This scenario suggests potentially high returns to the carnivorousaquaculture industry by investing in higher fishmeal and fish oil efficiency.Chapter 6 discusses this issue in greater detail.
Finally, the faster aquaculture expansion scenario is associated with a decreasein the projected real prices of low-value food fish, despite a significant rise in theprice of fishmeal. This is in part a result of the model construction, whereby fish-meal demand cannot be met by diverting supply of low-value food fish to reduc-tion; this reflects the separate nature of reduction fisheries and food fisheries (Newand Wijkstrom 2002). However, the model result also offers the insight that aqua-culture supplies a large share of the low-value food fish consumed by the poor, andthat investing in improving the productivity and sustainability of low-value foodfish aquaculture is a good way of making it more obtainable by the poor. Prices for
�(� �� ������������� !�� �����������������!������������ �!� ������������� ������������� �
���������������� ������� ��������� �!���� ����� �����������������������>A������������� ���
���������!�������@������� ��!��

;��B������������#�#���������������������������������
the other food fish commodities under the faster aquaculture growth scenarioeither decline, or increase less, than they do in the baseline. The slower aquacul-ture growth scenario results in real price increases for all food fish commodities—increases that are significantly higher than in the baseline.
1����!����
Baseline Scenario. Production levels and trends for food fish from the baseline pro-jections are shown in Tables 4.3 and 4.4. Global food fish production is projectedto total 130 mmt in 2020, equivalent to an annual rate of increase of 1.5 percentfrom 1997 onward (Table 4.3). Of the 37 mmt increase in global food fish pro-duction, over two-thirds comes from aquaculture, which is projected to represent41 percent of global food fish production in 2020 (up from 31 percent in 1997).
�$%&'���� �()$&�*+(,-.)(/�(0�0((,�0123��"" �$/,��#�#
�.)-$&� ;+(C'.)',� ;+(C'.)',�$//-$&�5+(6)2��"" �#�# +$)'1��"" 4�#�#�7*'+.'/)9
�&&(/ �2$+'�0+(8 �&&(/ �2$+'�0+(88')+.� $<-$.-&)-+' 8')+. $<-$.-&)-+' �<-$=)(/1 7*'+.'/)9 )(/1 7*'+.'/)9 �$*)-+' .-&)-+' �()$&
0���� ���� �� ���� �� ��� ��� ���
������������ ���� �� � �� � ��� ��� ���
����� ��� �� ��� �� ��� �� ���
������������� ��� �� ��� � ��� ��� ��
����������� ��� �� ��� �� ��� ��� ���
!���������
"����#���� ��� ��� �� ��� ��� ��
��$%�������#���� �� � ��� � ��� ��� ���
&����������� ��� �� �� �� ��� �� ���
'�(�� ��� �� ��� �� ���� ��� ���
)���(���&������ �� �� �� � ��� ��� ���
)������)���(����
#�������*���&���� �� � ��� � ��� ��� ���
�������*�+�(��
��������� ��� �� ��� �� ��� �� ���
,�*�+�(��-.��+� ���� � ����� � ��� ��� ���
,�*�+�(��-.��+�
�/�+����-0���� ���� � � �� � ��� ��� ���
,�*�+�(��.��+� ���� �� � �� � ��� ��� ���
!��+� ��� �� ����� �� �� ��� ���
�������1����+����.�����+��+����$2�������#���3������C(��B�������#���������#������$���+���
���������#�398�E��?906 ����+:'�+2����;�
"����1����+������������%2����*���-������������� �9��B�����-��.�����������/(�������+�
���(�����������++2����-�����%2����*���-�������(������

�! ��������������
This table shows that aquaculture growth trends projected to 2020 are almosttwice as high as those for capture food fish in most of the world.
The emerging picture of changes for food fish production to 2020 under thebaseline scenario can be summarized as three sets of points. First, the developing-country production share rises from 73 percent in 1997 to 79 percent in 2020,and China is responsible for about 5 of the 6 percentage point increase. This projection is consistent with trends observed in the past 30 years, includingChina’s expansion into distant-water fisheries previously occupied by fleets fromdeveloped countries. The absolute increase in annual aquaculture production out-side China in 2000 compared with 1970 was only 11 mmt (FAO 2003). Second,the share of aquaculture worldwide, including China, is projected to increase from31 to 41 percent in 2020. While China’s share of food fish production from aqua-culture increases from 58 to 66 percent, the production share from aquaculture forother developing countries increases from 17 to 27 percent, a larger relativechange. The share of aquaculture increases worldwide but especially in the devel-oping countries—and not just in China. Third, the share of low-value fish in totalfood fish is remarkably stable, at about 48 percent. Although the production shareof low-value food fish from wild fisheries declines, the production share of
�$%&'���� �'5(/$&�12$+'1�(0�5&(%$&�0((,�012�*+(,-.)(/3��"" �$/,��#�#
�2$+'�(0�6(+&,�)()$&�7*'+.'/)9
�.)-$& ;+(C'.)',
�'5(/ �" � �"!� �"" �#�#
0���� �� �� �� ��
������������ �� �� �� ��
����� � � � �
������������� � � � �
����������� � �
!���������"����#���� � � � �
��$%�������#���� � � � �
&����������� � � � �
'�(�� � �� � �
)���(���&������ �� � �
)������)���(����#�������*���&���� � �� � �
�������*�+�(����������� � � � �
,�*�+�(��-.��+� �� �� �
,�*�+�(��-.��+��/�+����-0���� �� �� � ��
,�*�+�(��.��+� �� � � ��
�������1����+����.�����+��+����$2�������#���3������C(��B�������#���������#������$���+���
���������#�398�E��?906 ����+:'�+2����;�
"����1����+������������%2����*���-������������� ��� ������� ����(����*�+2�

;��B������������#�#���������������������������������"
low-value food fish from aquaculture rises sufficiently by 2020 to compensate for this.
Alternative Scenarios. Modeling results for total food fish production under thevarious scenarios are shown in Table 4.5. Assumptions about technological changeor increased investment in aquaculture are shown to be crucial, with a differenceof 25 mmt between the faster and slower aquaculture expansion scenarios, neitherof which incorporates outlandish assumptions about the trend rate of growth. Thevast majority of this difference is in low-value food fish and mollusks, which rep-resented a combined 91 percent of aquaculture production by weight in 1997.
The scenario with a more rapid improvement in the feed conversion efficien-cy of fishmeal results in a 1 mmt (13 percent) decline in fishmeal production rel-ative to the baseline, because of price effects—a significant result in terms of
�$%&'���� �()$&�*+(C'.)',�*+(,-.)(/�(0�0((,�012�-/,'+�$+(-1�1.'/$+(13
�#�#
;+(C'.)',�*+(,-.)(/3��#�#�78&&(/�8')+.�)(/19
�$1)'+ �(6'+ �128'$& �&(6'+�(1) $<-$= �2/$ $/, $<-$= �.(&(=
�.)-$& &>'&? .-&)-+' *+(,-.= 012�(& .-&)-+' 5.$&�'5(/ �"" 7%$1'&/'9 ' *$/1(/ )(/ '00.'/.? ' *$/1(/ .(&&$*1'
0���� ���� ���� ��� ��� ���� ���� � �
������������ ���� � �� � �� � �� � �� ���� ����
����� ��� ��� �� ��� ��� �� ���
������������� ��� ��� ��� ��� ��� ��� ���
����������� ��� ��� �� ��� �� ��� ���
!���������
"����#���� ��� ��� �� ��� ��� �� ���
��$%�������#���� �� ��� ��� ��� ��� ��� ���
&����������� ��� �� ��� �� �� ��� ���
'�(�� ��� ��� ��� ��� ��� ��� ���
)���(���&������ �� �� �� �� ��� ��� ���
)������)���(����
#�������*���&���� �� ��� ��� ��� ��� ��� ���
�������*�+�(��
��������� ��� ��� ��� ��� ��� ��� ��
,�*�+�(��-.��+� ���� ����� ����� ��� ����� ��� ����
,�*�+�(��-.��+�
�/�+����-0���� ���� � �� ���� � �� � � ��� ����
,�*�+�(��.��+� ���� � �� ���� � �� � �� � �� ���
!��+� ��� ����� ����� ���� ����� �� �� �����
�������1����+����.�����+��+����$2�������#���3������C(��B�������#���������#����398�E�
�?906 ����+:'�+2����;�
"���1���6�$+����#����������������(������

�# ��������������
fishing pressure on reduction stocks. Greater efficiency of aquaculture productionhas a negligible effect on total food fish production but a larger relative effect onthe production of high-value finfish and crustaceans (in the order of 5 percent). Inthe extremely pessimistic ecological collapse scenario, total food fish productionsurprisingly declines by only 17 percent, with greater production declines mitigat-ed by production responses to major output price increases in both capture fish-eries and aquaculture.
�������������1��������������������������#��������
Baseline Scenario. Aggregate consumption trends largely mirror production trendsin terms of composition and region of production, except that annual rates ofgrowth of consumption in developing countries outstrip rates of growth of pro-duction by 0.2 percent per annum through 2020 (0.3 percent, excluding China),suggesting decreasing net exports of food fish from developing to developed coun-tries. Aggregate consumption of both high- and low-value food fish is projected tocontinue to increase in the developing world, at 2.3 and 1.6 percent, respectively,whereas it is static in the developed world. The rates hardly change if China isremoved from the calculation, suggesting that this is a widespread structural phe-nomenon driven by population growth, urbanization, and income growth.
Per capita consumption is projected to grow throughout the developing worldunder the baseline scenario, while developed-country consumption remains virtu-ally unchanged (Table 4.6). The most rapid growth in percentage terms continuesto be in China, where per capita consumption is projected to grow at an averageannual rate of 1.3 percent to 2020. Mollusk and crustacean consumption per capi-ta are projected to grow most rapidly on a global level (1.0 and 0.7 percent perannum, respectively), while per capita consumption of high-value finfish actuallydeclines by 0.2 percent per year. Although aggregate consumption is projected torise rapidly in Sub-Saharan Africa, this is a consequence of the region’s rapid pop-ulation growth rates; per capita consumption is projected to remain unchanged.
Developing countries became significant net exporters by the late 1990s (4mmt). China, India, and Latin America are projected to continue net exports inabsolute terms to 2020 under the baseline scenario (at 0.5, 0.4, and 3.0 mmt,respectively). But among developing regions, only Latin America’s net exports areprojected to represent a significant share of total production through 2020 (35percent). In other developing regions, demand continues to outstrip growing sup-ply. Whereas net exports of food fish were more than 11 percent of food fish pro-duction in developing countries, excluding China, in the late 1990s, they are pro-jected to be less than 5 percent in 2020. Chapter 7 discusses trade projections andsensitivity analysis with regard to trade in more detail.

;��B������������#�#����������������������������������
Alternative Scenarios. Table 4.7 illustrates the results of the different scenarios interms of projected per capita food fish consumption in 2020. As already men-tioned, the ecological collapse scenario would have the effect of cutting world cap-ture food fish production by more than half through 2020 if price factors did notplay a part. Yet projected global per capita consumption in 2020 under this scenario only declines to 14.2 kg/capita/year from the 17.1 kg/capita/year baselinelevel. The comparable figure from FAO (1999a) for 1997 is 15.7 kg/capita/year.Sharp price increases under this scenario are responsible for the absence of a larg-er per capita decline in food fish consumption because they slow the decline ofproduction growth in capture fisheries, induce increased aquaculture output, andalso reduce demand pressure.
�$%&'���� �()$&�*'+�.$*)$�.(/1-8*)(/�(0�0((,�0123��" �4" �$/,��#�#
�//-$&�()$&�.(/1-8*)(/ �+(6)2�+$)'7>5@.$*)$@?'$+9 7*'+.'/)9
�.)-$& ;+(C'.)', �.)-$& ;+(C'.)',
�'5(/ �" � �"!� �"" �#�# �"!�4" �"" 4�#�#
0���� ��� ��� ���� ��� ���� ���
������������ � �� � �� ���� ���� ��� ���
����� ��� ��� �� ��� ��� ��
������������� ��� ��� ��� ��� �� ���
����������� �� �� �� ��� ���� ���
!���������"����
#���� ��� ��� ��� ��� ��� ���
��$%�������#���� �� �� �� ��� ���� ���
&����������� ���� ���� � � � � ��� ���
'�(�� ��� ���� ���� ���� ��� ����
)���(���&������ ���� ���� ���� ��� ��� ���
)������)���(����
#�������*���&���� ���� ��� ���� ���� ���� ���
�������*�+�(��
��������� ���� ���� ��� ���� ��� ����
,�*�+�(��-.��+� �� �� ���� ���� ��� ���
,�*�+�(��-.��+�
�/�+����-0���� ��� �� �� � ���� ���
,�*�+�(��.��+� ���� ���� ��� ���� ���� ���
!��+� ���� ���� ��� � �� �� ���
�������1����+����.�����+��+����$2�������#���3������C(��B�������#���������#������$���+���
���������#�398�E��?906 ����+:'�+2����;�
"����1����+������������%2����*���-������������� ��� ������� ����(����*�+2�

�� ��������������
The lower China production scenario leads to a 1 kg/capita/year decrease inglobal projected food fish consumption in 2020, but this mostly results from itseffects on estimated Chinese consumption. Looking forward, as in the case of thehistorical trends discussed earlier, controversy over Chinese fish production levelsmatters in terms of Chinese consumption and global production trends, though ithas surprisingly little effect on consumption or production outside China or onworld prices for fish.
The plausible scenario with the strongest effects on outcomes is faster aqua-culture expansion, which modifies IMPACT’s conservative assumptions about therates of technological change and other exogenous factors affecting aquacultureproduction. A 50 percent increase in the exogenous rates of change in aquacultureproduction—modeled primarily to be sensitive to prices, as discussed earlier—
�$%&'��� �()$&�*'+�.$*)$�.(/1-8*)(/�(0�0((,�012�-/,'+�,00'+'/)�*+(,-.)(/
1.'/$+(13��#�#
�()$&�.(/1-8*)(/�7>5@.$*)$@?'$+9
�$1)'+ �(6'+ �128'$& �&(6'+�(1) $<-$= �2/$ $/, $<-$= �.(&(=
�.)-$& &>'&? .-&)-+' *+(,-.= 012�(& .-&)-+' 5.$&�'5(/ �"" 7%$1'&/'9 ' *$/1(/ )(/ '00.'/.? ' *$/1(/ .(&&$*1'
0���� ���� ��� ���� ��� ���� ���� ����
������������ ���� ���� ���� ���� ���� ��� ���
����� �� ��� ��� ��� �� ��� ���
������������� ��� ��� ��� ��� ��� ��� ���
����������� �� ��� �� ��� �� � ��
!���������
"����#���� ��� ��� �� ��� ��� ��� ���
��$%�������#���� �� ��� �� �� �� �� ���
&����������� � � � � ���� � �� � �� ���� ����
'�(�� ���� ���� ���� ���� ���� � �� ���
)���(���&������ ���� ��� ���� ���� ���� ��� ���
)������)���(����
#�������*���&�������� ���� ���� ���� ��� ���� ���
�������*�+�(��
��������� ��� ���� ���� ��� ���� ���� ���
,�*�+�(��-.��+� ���� ���� ���� ���� ���� ���� ����
,�*�+�(��-.��+�
�/�+����-0���� �� � ���� ���� ���� �� ���
,�*�+�(��.��+� ��� ���� ���� ���� ���� ���� � ��
!��+� ��� � �� � �� ���� � �� ��� ����
�������1����+����.�����+��+����$2�������#���3������C(��B�������#���������#����398�E�
�?906 ����+:'�+2����;�
"���1���6�$+����#����������������(������
leads to an increase in forecast per capita global consumption of food fish in 2020of 1.9 kg/capita/year, an increase comparable to the absolute magnitude of thedeclines forecast under the ecological collapse scenario. Table 4.7 shows that theeffect is twice as strong in developing as opposed to developed countries, althoughit is still significant in both. Not surprisingly, investing in technological change inaquaculture production will be critical to growing aggregate fisheries output in thefuture, particularly in the developing world.
�%#�-&"%#��$%���*(�"�1 ����%�(-�
�%#�($#"#���*(��* #�"#��-%�&� #���%�(�%�
,%$-���%%���"*�1$%�&��"%#
Based on the most likely set of assumptions—the baseline scenario—global foodfish production will increase slightly faster than global population through 2020.Per capita consumption is projected to rise, and real fish prices are also expectedto rise between 4 and 16 percent, depending on the commodity. Livestock prod-uct prices, on the other hand, are expected to decline in the order of 3 percent.Low-value food fish continues to account for a fairly constant share of total foodfish through 2020 (48 percent), while aquaculture’s share of aggregate finfish pro-duction increases from 31 to 41 percent.
Although developing countries will continue to dominate world fisheries pro-duction (79 percent of world food fish production in 2020, up from 73 percentin 1997), it should be noted that developing countries excluding China just man-age to preserve their 38 percent global share of production in 2020 under the base-line scenario. China’s gain in share mirrors the loss by industrialized countries,principally Eastern Europe and the former Soviet Union, the European Union,and Japan.
Global increases in consumption of food fish will predominantly take placein developing countries, where population is growing and higher incomes allowpurchase of high-value fisheries items for the first time by many people. Barringunforeseen technological progress in the manufacture or use of fishmeal and fishoil, these feedstuffs will become progressively more expensive relative to plant-derived substitutes in the feeding of livestock and noncarnivorous fish. It is to beanticipated that these commodities will eventually exit from the rations of animalsother than carnivorous fish, and that fishmeal prices will become progressively de-linked from vegetable feed alternatives, such as soymeal.
Sensitivity analysis suggests that the key outcome for the future of fish prices,including the price of low-value food fish to poor consumers, is the successfuldevelopment and extension of sustainable aquaculture. The latter will keep fishprices lower than would be the case under other production scenarios. A focus on
;��B������������#�#����������������������������������

�� ��������������
food security in poor countries would suggest concentrating on low-value foodfish aquaculture in developing countries. However, the uniform result across sce-narios of rising relative prices for high-value fisheries items such as crustaceans andmollusks also suggests the importance for poverty alleviation of finding ways tokeep poor fishers involved in these key sectors. Finally, several of our scenarios sug-gest significant increases in the relative prices of fishmeal. Aquaculture technologyinvestments targeted to low-value fish in developing countries will help ensure thatthe poor continue to benefit from fisheries development.
On the whole, the projections confirm the growing importance of fisheries forfood and natural resource policies in both developing and developed countries.They also show the extent to which considering the effect of relative price changesis likely to change the outlook for these issues when compared with straight-lineand other simple projections. The following chapters assess the implications of theprojection results for ongoing debates on environmental impacts, technologyneeds, fisheries trade, and food security issues in developing countries. Theyattempt to sharpen the focus on key relationships by highlighting existingresearch, rather than presenting results from field research of the type necessary toanswer many of the problems posed.

� � � � � � #
"#�($ ��"%#��(�,((#��"*($"(
#���*(�# �&$ -�(#)"$%#�(#�
�ecause of the stagnation in capture fisheries production described inChapter 2, aquaculture has been the sole source of supply growth in thefisheries sector during the 1990s, raising hopes that the growth of aquacul-
ture may ease pressure on threatened wild stocks. However, aquaculture is notwithout its own environmental problems. For example, frequent outbreaks of dis-ease and pollution of the underlying resource base call into question the overallimpact of some forms of intensive aquaculture. The most highly publicized ofaquaculture’s environmental impacts have occurred in the high-value sector(salmon and shrimp in particular), although low-value aquaculture makes up 70percent of production by weight and 54 percent by value. As both high- and low-value aquaculture expand during the next two decades, pressure on the environ-ment will inevitably intensify—often in ways that feed back into capture fisheries.
Aquaculture operations can generate considerable negative externalities—costs that affect the surrounding environment but not necessarily the aquacultureoperations themselves. Aquaculture development has resulted in the disturbanceof capture fisheries habitat through pollution and coastal habitat conversion.Escaped farmed fish, especially in high-value Northern aquaculture, may threatenthe genetic pools of wild stocks and disrupt habitat. Demand for wild seed andbroodstock to stock aquaculture ponds can place pressure on wild stocks. Mostcontroversially, the increasing use of fishmeal and fish oil in the feeds of farm-raised fish has also raised concerns that some forms of aquaculture may in fact beharming wild fish populations rather than easing pressure on them. These con-cerns will become increasingly prominent as demand for fish grows over the com-ing years. In terms of area or number of organisms affected, however, capture fish-eries still dwarf aquaculture as a source of negative environmental impacts.
��

�� ��������������
� 1�&$(��"*($"(�"#��$""
The capture fisheries sector is one of the last large-scale human activities that canbe classified under the rubric of “hunting and gathering.” As such, almost by def-inition, it is fundamentally dependent on the natural environment. Clearly, a limitexists to the capacity of the world’s oceans to supply wild stocks of fish, and theproduction plateau evidenced since the late 1980s indicates that fisheries may beapproaching this limit—at least the limit under current suboptimal managementregimes. With limited potential for supply growth, the health of the resource baseis essential to maintaining harvest levels in the face of increasing demand.Unfortunately, fishing activities around the world have significant, large-scale neg-ative impacts on the aquatic environment, creating both internal and externalcosts.
%.��6��� ��������
Of all the environmental impacts caused by the fisheries sector, overfishing posesby far the greatest environmental threat. Hardin’s (1968) tragedy of the commons,in which rational individuals act to the detriment of society as a whole, is as appli-cable to the open oceans as it is to common land. Although the current regulato-ry environment is far from “open access,” it is clear that management of the oceansis suboptimal. Wild stocks are notoriously difficult to manage for a variety of rea-sons, including complicated and uncertain access issues, and the fundamental dif-ficulty of accurately assessing the state of a complicated biological resource solelythrough extraction data. Excess capacity, asset and labor fixity, and technologicaladvances creating even more fishing capacity exacerbate the problem. A study bythe World Bank (1998), drawing on work from the FAO (1993), reports that sub-sidies to the fishing sector, especially in developed countries, have played a largerole in excessive investment, and therefore overcapacity and over-exploitation.During the 1970s and 1980s, fisheries harvests grew at only half the rate of fleetsize.
As a result of sustained, increasing fishing pressure, most stocks of wild fishtoday are classified as fully exploited, and an increasing number are over-exploit-ed, in decline, or in recovery (FAO 2000a). Few expect significant jumps in glob-al production from wild fisheries in the future. There have been many recentexamples of fishery collapses, including the decline in Northwest Atlantic ground-fish stocks through the 1980s and 1990s, and the California sardine fishery col-lapse of the 1940s. As supply remains stagnant and the profitability of capture fish-eries declines relative to other sectors, the slow pace of movement of resources outof the industry further endangers wild stocks through persisting overcapitalization.

������������������������:�����������:��������� ������������������
��!��!���������!����
Global fisheries capture, kill, and discard a massive quantity of undersized fish, fishwith other undesirable characteristics, and “nontarget species.” The catching ofnontarget species is known as “bycatch.” The majority of bycatch is kept and soldbecause the species caught are marketable (providing a significant contribution tothe revenues of some fishing operations). With some types of fishing, such astrawling, the amount of bycatch landed (and subsequently sold) can be severaltimes the amount of target species landed. However, much bycatch is simply dis-carded for economic or regulatory reasons. Global discarded bycatch of fish and ofother marine organisms is currently estimated at over 20 mmt per year (FAO2000a), wasting nearly one-quarter of the world fish catch. As nontarget speciestend to be neglected by conventional assessment and management, the risk is highthat they be overfished with serious consequences on their reproductive capacityas well as on the food sources of the target and other species.
Many of the fish inadvertently caught in this manner are undersized, whichharms the ability of stocks to replenish themselves. The most emblematic exam-ples of bycatch have been dolphins, seabirds, and sea turtles; however, the quanti-ty of bycatch represented by fish may be more problematic from a biodiversitystandpoint. Shrimp trawling produces the highest rate of nontarget species extrac-tion, and accounts for approximately half the world’s bycatch (Clucas 1997).Measures to increase the utilization of bycatch (as surimi or fishmeal, for example)might serve only to discourage the adoption of technologies designed to reducebycatch levels.
*�������������!����
Certain activities involved in the pursuit of fish have severely detrimental conse-quences for the habitats of marine organisms. Coral reef ecosytems (Smith 1978)have suffered significantly from reef fishing, for both ornamentals and food fish(Johannes and Riepen 1995). Techniques such as blast fishing and poison fishinghave had devastating effects on coral reefs in the Indo-Pacific and other regions.Grouper fishing, for example, often involves the use of cyanide. Even traditionalmethods of catching reef fish can damage coral; approximately one square meterof coral is destroyed for every grouper extracted, according to one study (Pet-Soede, Cesar, and Pet 2000). The damage to coral reef ecosystems is significantboth biologically—coral reefs are extremely productive and diverse habitats—andeconomically. Many coastal communities heavily depend on services provided bycoral reefs; such services include fish, tourism, and coastal protection (Cesar2000). The loss of these services represents a significant cost to the poor who relyupon them.

�! ��������������
Bottom trawling, the dragging of weighted nets across the seafloor, causes sig-nificant levels of bycatch and substantially disturbs seafloor ecosystems. Therepeated, large-scale disruption of the seafloor by trawling has been likened to theterrestrial activity of clear-cutting. Bottom trawling and related activities, such asdrag seining, kill organisms on and within the seafloor, remove important benth-ic structure-forming fauna, and thus fundamentally alter the population dynam-ics of the seafloor habitat. Fishing gear also damages structures on the seafloor,thus degrading habitat for a wide range of organisms. It is estimated that world-wide trawling disrupts an area as large as Congo, India, and Brazil combined(Watling and Norse 1998).
(!������������"���!��
The indirect effects of fisheries on ecosystems may also be significant. Removal ofmassive quantities of a species necessarily engenders wholesale changes in the foodweb dynamics of that ecosystem. Fisheries have caused documented ripple effectson multiple trophic levels, from seabird and marine mammal abundance on thehigher end, to sea urchin and algae abundance on the lower end (Williams 1996).It is suspected that overfishing created circumstances conducive to the invasionand proliferation of an introduced species into the Black Sea, the jellyfishMnemiopsis leidyi, which drastically altered that ecosystem (FAO 2000a).
Over the past few decades, the average trophic level of fish landings hasdeclined, indicating that capture fisheries are increasingly turning to small pelagicfish that are lower on the food chain (Garcia and Newton 1997; Pauly et al. 1998).This shift away from higher trophic levels suggests that the extraction patterns ofcapture fisheries may not be sustainable. Meanwhile, the use of fishmeal and fishoil in the feeds for farmed fish has prompted concern that the rise of aquaculturecould place even greater pressure on capture fisheries. The farmed production ofsome aquatic species, particularly carnivorous species such as salmon and shrimp,requires the wild harvesting of small pelagic fish as feed input (Naylor et al. 2000).This issue is becoming increasingly prominent as researchers and policymakers tryto assess the role of aquaculture in world fisheries.
2& �&-�&$(� #���*(�(#)"$%#�(#�
Over the past two decades, aquaculture has counterbalanced sluggish growth inproduction from capture fisheries. Side effects of the astonishing rise of aquacul-ture have spawned a number of significant environmental concerns among aca-demics, policymakers, fisheries and environmental advocates, and related stake-holders. Much of the growth in aquaculture production has come from expansionof low-value freshwater fish culture in Asia using low-input, low-output systems.But the simultaneous rapid emergence of large-scale aquaculture using high-input,

������������������������:�����������:��������� ������������������"
high-output production techniques has brought intensive aquaculture into thepolicy spotlight.
Chapter 6 looks at the issue of aquaculture intensification in detail. The rela-tionship between intensity of aquaculture production and environmental degrada-tion is not straightforward; intensification can have both positive and negativeenvironmental impacts (NACA/FAO 2001). The following section presents themajor environmental impacts associated with aquaculture, and raises issues thathave become important in determining the long-term sustainability of aquacul-ture development.
(�.��������� �1��� ���� ���!������,���� 0��!� ����
In theory, net social costs can arise when prices of inputs and outputs do not ade-quately reflect their impacts on the rest of society. These negative social conse-quences are known as “externalities” because their costs are not transmitted to pro-ducers through appropriate price signals. For example, absent any regulations, pro-ducers do not bear the financial costs of releasing pollution into a waterway.Although the financial cost of pollution is zero to the producer, others affected bythe pollution can incur significant costs. Negative externalities generated by aqua-culture include effluent pollution; escaped farmed species; land and habitat distur-bances; and possible ecosystem harm created by demand for wild seed, brood-stock, and feed inputs. However, some environmental issues, such as disease out-breaks, directly affect aquaculture producers.
Disease. Over the past several decades, the expansion and intensification of aqua-culture production has been accompanied by increased movements of live aquat-ic animals and aquatic animal products, including broodstock, seed, and feed.This process of expansion, along with globalization, has made the accidentalspread of disease into new aquatic populations and geographic regions more likely.
Disease is a major constraint to aquaculture development, often significantlydiminishing pond productivity. High stocking densities, poor water quality, andpoor seed quality can lead to disease outbreaks within ponds; these can subse-quently spread to other ponds through water exchange (Funge-Smith and Briggs1998). The shrimp industry has been hit particularly hard by disease, with vastareas of ponds going out of production because of viruses like whitespot and yel-lowhead. One of the primary constraints to the growth of shrimp aquaculture isthe threat of disease (Lotz 1997); the horizontal spread of disease from farm tofarm is a major concern for the industry (Naylor et al. 2000). The disease issue hasmajor implications for the environment because pond abandonment and landdegradation are direct consequences of the spread of disease.

# ��������������
The further expansion and intensification of aquaculture will continue toprovoke challenges arising from the emergence and recurrence of disease. Varyinglevels of development among countries, the transboundary nature of many diseaseproblems, and the need to harmonize approaches all complicate effective cooper-ation. Without effective coordination, however, epidemics will continue to threat-en the productivity of many aquaculture operations (Subasinghe, Bondad-Reantaso, and McGladdery 2001).
Impact on Other Resources. Coastal aquaculture development, especially shrimpfarming, has caused the destruction of hundreds of thousands of hectares of man-grove forest over the past few decades. Land conversion of this magnitude repre-sents a significant portion of overall mangrove loss, though aquaculture is by nomeans the only culprit (Menasveta 1997). Much attention has been drawn to theecosystem services provided by mangroves, including nutrient filtration andcleansing, flood and storm protection, provision of habitat for many organismsuseful to humans, and the protection of coral reefs through the trapping of sediment.
Mangroves provide nursery habitat for numerous species of fish and shellfishthat are economically important to wild fisheries and artisanal fishing communi-ties. Since mangroves also provide water filtration services, their removal hasimpacts on downstream fish habitats such as coral reefs. Naylor et al. (2000) esti-mate that over 100 kg of fish within mangrove ecosystems are lost for every hectareof mangroves converted; they further estimate that each kilogram of shrimp pro-duced from coastal aquaculture in former mangrove forests results in a loss of over400g of wild fish. Mangrove conversion has slowed in recent years, and somecountries have banned the clearing of mangroves in certain areas. However, theprofitability of aquaculture still places pressure on remaining coastal forest.Recognition of the benefits provided by ecosystem services is essential to an under-standing of the real costs incurred by conversion of coastal land.
Where aquaculture is expanding, traditional land uses such as rice agriculturemay come into conflict with the demand for new ponds. Conversion of agricul-tural land to aquaculture may not only directly reduce production of staple foodsbut may also impair the productivity of nearby agricultural systems through soilchanges and salinization (Be, Dung, and Brennan 1999). However, the removal ofrice self-sufficiency policies and the subsequent promotion of cash crops may belargely responsible for paddy conversion in many areas. Preventing disease is alsoimportant with regard to land use; if a farming operation becomes untenablethrough disease or other factors, the abandoned ponds are frequently unproduc-tive for years afterward, though substitution to other cultured species is sometimes
������������������������:�����������:��������� ����������������� �
possible. In particular, the long-term effects on the hydrology of coastal areas areoften severe.
Effluent and Water Demand. Effluent from aquaculture ponds and pens is oftenreleased directly into surrounding waterways, causing pollution problems stem-ming from fertilizer (to promote growth of phytoplankton), undigested feed, andbiological waste in the water. Effluent from ponds can contribute to eutrophica-tion of downstream waters, and waste from marine culture can harm benthic com-munities, though the latter effect is locally restricted. Nutrient-rich water cancause algal blooms, hypoxia, and direct toxicity to marine organisms. Chemicalsand antibiotics used to treat ponds may also have negative consequences for theimmediate aquatic environment (Tendencia and de la Pena 2001). Accumulationof organic material, salt, and chemicals can degrade soil quality.
Water is an increasingly scarce resource and a possible constraint to develop-ment around the world (Rosegrant, Cai, and Cline 2002). Aquaculture is findingitself in competition with other end-users and with ecosystem services for the highinputs of water that can be required for the activity. Shrimp farming in SoutheastAsia has been involved with a number of water conflicts, stemming from extrac-tion of freshwater and the resulting salinization of aquifers (Williams 1996). Pondaquaculture uses more water than most alternative agricultural production sys-tems, though the output per unit of water input is usually higher in value for aqua-culture (Boyd and Gross 2000). As aquaculture grows, the industry will need tofind ways of minimizing water use so as to avoid conflicts and remain cost-effec-tive, as is discussed in Chapter 6.
The issue of concentration and scale is also important with regard to waterpollution. A growing body of literature suggests that many environmental impactsare best modeled by a threshold effect, with acute or irreversible damages occur-ring beyond a certain level of strain (Costanza, Norton, and Haskell 1992). Thisconsideration implies that the location and density of farms is a significant deter-minant of environmental damage. With the development of large aggregations ofdensely situated farms, the chances increase that externalities might drive whole-sale ecosystem changes.
Aquaculture’s Demand for Fishmeal and Fish Oil. The use of fishmeal and fish oilin intensive aquaculture has generated much attention in recent years. Rapidlyincreasing demand by aquaculture for these feed inputs has led to concern that thefarming of carnivorous and omnivorous fish will place pressure on the wild pelag-ic stocks from which fishmeal and fish oil are derived. Some assert that the farm-ing of fish such as salmon and trout places heavy pressure on these wild species(Tuominen and Esmark 2003). Others, such as Asche and Tveteras (2000), argue
� ��������������
that substitution away from fishmeal in terrestrial livestock production has com-pensated for increased demand from aquaculture, with no net effect on the priceof fishmeal. However, as aquaculture grows, a greater share of demand for fishmealand fish oil will become relatively less elastic, threatening to cause greater pricevolatility and, in the long run, to drive up the prices of these inputs. This issue isdiscussed more fully in Chapter 6.
Escaped Farmed Species. Another interface between aquaculture and wild stocks offish comes from the escape of cultured species into the wild. For instance, escapedfarmed tilapia, which thrive in disturbed habitat where native species are alreadyat risk, have established themselves in waterways in Africa, Asia, Australia, and theUnited States. Aside from the risks of direct predation on native species or com-petition for food and habitat, escaped farmed fish may threaten the genetic poolsof wild organisms through interbreeding. Studies have shown instances of escapedfarmed Atlantic salmon—which number in the hundreds of thousands everyyear—successfully reproducing, establishing themselves in the wild, mingling withwild Atlantic salmon stocks, and even altering the genetic makeup of these stocks(Clifford, McGinnity, and Ferguson 1998). Traits bred into farmed fish are oftendifferent from those conferring reproductive fitness in the wild, and interbreedingbetween escaped farmed fish and wild fish may result in the loss of important localadaptations. Risk is greatest for small populations that are already threatened. Bycontrast, a report from the U.S. National Marine Fisheries Service (Nash 2001)argues that escapes of Atlantic salmon in the Pacific Northwest hold little or norisk to native Pacific salmon populations because they cannot interbreed and arepoor competitors for resources.
Though concerns exist over the possible spread of disease from farmed popu-lations to wild populations, the primary direction of pathogen flow is from wildstocks to farmed stocks (often through the use of wild broodstock and larvae). Themagnitude of disease risk for wild fish is unclear; little is known of harm to wildstocks caused by diseases originating on farms. Salmon hatcheries in the PacificNorthwest, for instance, have similar disease problems as those found in aquacul-ture, and release far more fish into the wild, but adverse disease effects on wildpopulations are low (Nash 2001).
Concerns over escaped species are likely to intensify in coming years as aqua-culture’s scope increases, but particular attention will be focused on the problemas genetically modified fish are developed for aquaculture operations around theworld. Although no transgenic fish have yet been approved for commercialization,both developed and developing countries have tested transgenic farmed speciesranging from shellfish to freshwater fish to marine fish (FAO 2000a). In additionto the potential for harm to wild stocks that exists with other escaped farmed

������������������������:�����������:��������� ����������������� �
species, the genetic modification of organisms introduces considerable uncertain-ty. Simulations have demonstrated the theoretical possibility of transgenic fishintroducing a “Trojan Horse” gene that entirely wipes out a native population(Muir and Howard 1999). Those involved in policy debates over introduction oftransgenic aquatic species will face the difficult task of weighing the benefits conferred by commercially beneficial traits against the risks of introducing specieswith these traits into an ecosystem.
(�"� �"#�� 2& �&-�&$(:�1$"�(6�(�" �(�
"�1 ���%#�,"-���"*($"(
Not all potential impacts of aquaculture on capture fisheries are negative, howev-er. Aquaculture will be the most important source of supply growth in fisheriesproducts in the future, and as such has been regarded as a possible savior for over-burdened and overexploited wild stocks of fish. The extent to which this is truedepends upon a large number of assumptions and uncertainties. It also is influ-enced by the effects of aquaculture on the prices of both food fish and reductionfish. These effects can work against each other, and the net effect is an empiricalissue. The next section presents the results of modeling under a set of assumptionsthat—while not perfectly representative of many aspects of fisheries—frame priceresponse issues in a reasonable manner and sets the stage for more refined globalmodeling.16
!������� �� ������/ ����"���!���/ 0��!� ���������������
���������
The additional supply of fisheries products from aquaculture could place down-ward pressure on food fish prices if farmed products and wild products behave assubstitutes. It is possible that in the short run, greater fishing effort may be appliedin response to declining fish prices because of the high fixed costs in the fishingfleet. Similarly, Copes (1970) pointed out that open access can lead to overharvest-ing, and hence lower catches despite higher prices. Nonetheless, it seems likely thatlong-run price elasticities of supply are positive (Pascoe and Mardle 1999). Lowerfood fish prices, other things remaining equal, are likely to reduce fishing effort inthe long run and generally be favorable to the health of stocks.
�,����� �� ��� ������������������ ���� ���������������"������!��������������3��� �������
3�����������6��� ��������!�������0 �������������.���..���=����������>� �?�������+=����
8��������������!����..�-�
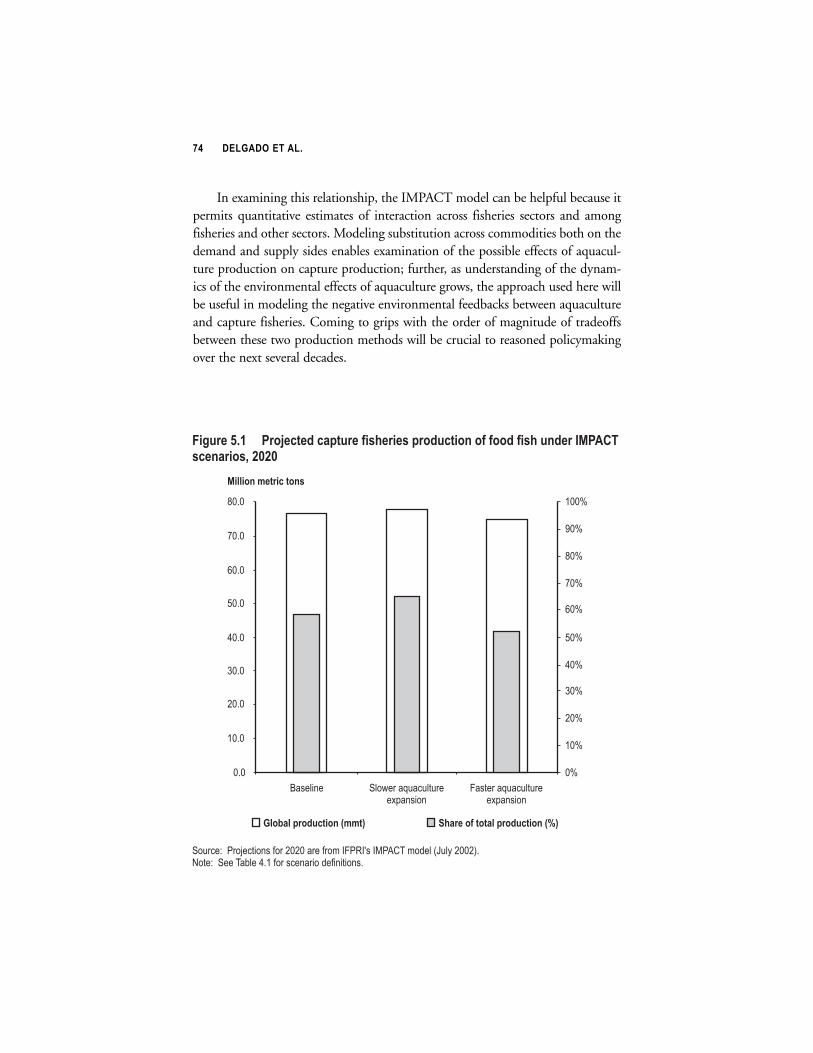
� ��������������
In examining this relationship, the IMPACT model can be helpful because itpermits quantitative estimates of interaction across fisheries sectors and amongfisheries and other sectors. Modeling substitution across commodities both on thedemand and supply sides enables examination of the possible effects of aquacul-ture production on capture production; further, as understanding of the dynam-ics of the environmental effects of aquaculture grows, the approach used here willbe useful in modeling the negative environmental feedbacks between aquacultureand capture fisheries. Coming to grips with the order of magnitude of tradeoffsbetween these two production methods will be crucial to reasoned policymakingover the next several decades.
Figure 5.1 Projected capture fisheries production of food fish under IMPACTscenarios, 2020
Source: Projections for 2020 are from IFPRI's IMPACT model (July 2002).Note: See Table 4.1 for scenario definitions.
0.0
10.0
20.0
30.0
40.0
50.0
60.0
70.0
80.0
Baseline Slower aquacultureexpansion
Faster aquacultureexpansion
0%
10%
20%
30%
40%
50%
60%
70%
80%
90%
100%
Global production (mmt) Share of total production (%)
Million metric tons

������������������������:�����������:��������� ����������������� �
Under the IMPACT baseline scenario, aquaculture production is forecast togrow at an average annual rate of 2.8 percent to 2020, nearly doubling from 1997.Capture production, by contrast, is forecast to grow much more slowly, at an aver-age annual rate of 0.7 percent. Prices for all capture fisheries commodities forhuman consumption rise 4–16 percent. The sensitivity of capture fisheries pro-duction to varying degrees of growth in the aquaculture sector is illustratedthrough the faster and slower aquaculture scenarios, which employ exogenousgrowth rates that are 50 percent higher and 50 percent lower than the baseline,respectively (see Table 4.1 for scenario descriptions). The supply response inducedby relatively lower prices under the faster aquaculture expansion scenario isapproximately 4 percent of total global production, with China accounting forabout 40 percent of this difference. Although the level of production is not anideal proxy for effort or fishing pressure, it does give an indication of the extent towhich resources flow in or out of capture fisheries in response to various factors.Figure 5.1 shows global capture food fish production under these two IMPACTscenarios as well as under the baseline scenario.
Price movements in large part determine incentives to apply fishing effort.Table 4.2 reported projected price changes for fisheries commodities under differ-ent aquaculture scenarios. Under the faster aquaculture expansion scenario, pricesfor fisheries commodities actually decline, as discussed in Chapter 4, while underthe slow growth scenario, prices rise 19–25 percent over the projection period. Byfar the largest price rises occur under the ecological collapse scenario where cap-ture fisheries production declines significantly, resulting in price increases rangingfrom 26–70 percent for the commodities modeled. Fishmeal and fish oil prices are18 percent higher in 2020 than in 1997 under the baseline scenario, and approx-imately 50 percent higher than in 1997 under the faster aquaculture expansionscenario. The scenario with rapid efficiency improvements in the utilization offishmeal and oil, however, results in real price declines for these commodities; feedefficiency improvement under this scenario occurs at twice the rate of the baselinescenario, diminishing aquaculture’s demand for fishmeal and fish oil and causingprice declines of 16 and 5 percent for these commodities, respectively.
"�� �!��������/ "�1 ���!��������/���(�.��������� �"�����
In the context of policy discussions of fisheries and aquaculture development, it isimportant to determine general orders of magnitude for environmental impacts.Although a significant price differential exists between the faster and slower aqua-culture growth scenarios, the difference between the two scenarios in the quantityof capture production is fairly small. Because of the relatively low supply elastici-ties assumed for the capture fisheries sector, rapid aquaculture production growthand the resulting lower food fish prices only result in a modest reduction in
� ��������������
�( ���� ;+.'�1-%1))-)$%&)?�(0�$<-$.-&)-+'�$/,�.$*)-+'�*+(,-.)1
A crucial assumption made in the IMPACT model on the demand side isthe equivalence of fisheries products from capture and fisheries productsfrom aquaculture. This assumption inevitably overstates the extent to whichaquaculture-derived and capture-derived products behave as substitutes.†
The assumption of substitutability provides a favorable case for the view thatincreased aquaculture production will drive down capture productionthrough price effects (Anderson 1985; Ye and Beddington 1996). Contraryfindings would be accordingly strengthened by the assumption of perfectsubstitutability.The assumption of equivalence between capture-derived and aquaculture-derived products in the IMPACT model is a simplification but no more sothan treating all rice varieties, corn varieties, fruits, pork products, and soon, as single commodities as is done within most food models, including thepresent version of IMPACT. Although there are certainly real and perceivedquality variations between capture- and aquaculture-derived products (andhence price differentials between the products may exist), the literatureshows that the two categories do behave as substitutes (Bene, Cadren, andLantz 2000; Clayton and Gordon 1999). Although the overall market rela-tionship between aquaculture- and capture-derived fisheries products ismore complicated than simple equivalence (Pascoe et al. 1999), it is difficultto believe, for example, that the rapid entry of farmed salmon into the mar-ket has not been the major factor in the crash of wild-caught salmon prices.It is the substitute relationship, and not the differential in prices, that ismost relevant to dynamic modeling.Price response in IMPACT is mediated through supply elasticities that arespecified to be higher in aquaculture than in capture fisheries. Few empiricalstudies of supply elasticities in capture fisheries exist because of inherent esti-mation difficulties; Pascoe and Mardle (1999) show generally price-inelasticsupply in North Sea fisheries. Resource and regulatory constraints limitpositive production responses to higher prices; subsidies and slow movementof resources out of the capture fisheries sector in many countries indicatethat price responsiveness in the other direction is likely to be fairly low aswell. Consequently, supply elasticities for capture fisheries are set to be fairlylow. In contrast, supply elasticities for aquaculture-derived commodities inthe IMPACT model are generally more than double those for capture-derived commodities, reflecting the greater capacity for expansion and inten-sification of production (and, conversely, the greater ability for the sector tocontract) in aquaculture. Other modeling efforts have made similar supplyelasticity assumptions (Chan, Garcia, and Leung 2002).
†If goods X and Y behave as substitutes, consumers will increase their consumption of good X if the price of good Y increases, and vice versa.

������������������������:�����������:��������� �����������������
capture fisheries production (and, most likely, fishing effort—at least in the medi-um term). This result is obtained even under the assumption of perfect inter-changeability of products from capture and aquaculture (see Box 5.1).
Rapid aquaculture growth will, however, likely put greater pressure on reduc-tion fisheries. A large environmental issue in aquaculture over the coming yearswill be the rate at which carnivorous aquaculture is able to substitute away fromfishmeal and fish oil, which is explored in the discussion of technology in Chapter6. Even in the absence of technical change, relatively elastic feed demand elastici-ties in the terrestrial livestock sector allow for substitution away from fishmeal tovegetable meals but not enough to keep fishmeal prices from rising (up to 50 per-cent higher than the baseline under the faster aquaculture growth scenario).
(#)"$%#�(#� -�1%-"�+�"&(�"#��"*($"(
�����������������
Environmental problems in capture fisheries often stem from the national or locallevel, where competition breeds overcapacity and overfishing (though competitionalso occurs among nations). This leads to the transfer of fishing effort elsewhere,either to other species or other areas, and eventually to a regional or global prob-lem. Global management is limited by the inherent difficulty of regulating thou-sands of participants from different nations and socioeconomic classes who com-pete for the same resources under imperfect information. A global patchwork ofregulatory bodies faces the daunting challenge of managing this resource baseunder conditions unique among food production systems in terms of the extentto which high information requirements, mobile resources (migratory fish),mobile gear, and high market uncertainty hinder effective management.
Although many of the underlying reasons for environmental problems in cap-ture fisheries have existed for a long time, the response has changed over recentdecades. Open access and its attendant resource management problems have grad-ually been addressed by a number of international agreements. The establishmentof EEZs in the 1970s allowed individual nations increased control over watersextending 200 miles from the coast. In 1982, the United Nations Convention onthe Law of the Sea further developed the notion of fisheries user rights and estab-lished frameworks for bilateral access agreements between nations. Subsequentagreements in the 1990s, including the 1995 signing of the U.N. agreement onthe Conservation and Management of Straddling Fish Stocks and HighlyMigratory Fish Stocks, strengthened property rights and dealt with issues involv-ing stocks that overlapped multiple international zones. In 1995, the development
! ��������������
of the nonbinding FAO Code of Conduct for Responsible Fisheries laid out prin-ciples for sustainable governance of fisheries by member nations.
The FAO’s State of World Fisheries and Aquaculture 2000 report points toaccess/user rights as the fundamental issue in fisheries management. It also high-lights the need for concerted international effort to curtail illegal, unreported, andunregulated (IUU) fishing—a pervasive problem in most of the world’s fisheriesthat threatens even the better management regimes. Since the 1990s, considerableeffort has been devoted to finding solutions to the IUU fishing problem, as wellas to developing indicators of fishery sustainability. This progress, however, has fol-lowed two decades during which the fleet size of the world’s fisheries increased attwice the rate of growth in catches (Williams 1996). Subsidies and overcapitaliza-tion remain a major problem, as does the recalcitrance of employment in the sec-tor. Long-term solutions to overfishing will have to involve programs enablingfisheries workers to successfully move into other sectors of the economy.
0��!� ����
In the sphere of agriculture, solutions to environmental problems almost alwaysrequire a combination of policy change and new technology. The relative weightof these elements depends greatly on the governmental infrastructure in the coun-tries involved. Similarly, in aquaculture, strict policy solutions to environmentalproblems may not be as feasible in less developed countries as they are in moredeveloped ones. Effective zoning regulations, bans on certain forms of develop-ment, and regulation of production standards can only be accomplished in tan-dem with requisite governmental capacity and political will—often difficult fordeveloping countries in the face of the large short-term benefits offered by rapidaquaculture development.
Indeed, improved technology may prove to be a necessary component inameliorating some of the environmental concerns associated with aquaculture indeveloping countries. Progress in breeding and hatchery technology holds thepotential to reduce disease problems in shrimp farms, for example. The develop-ment of replacements for fishmeal and fish oil in compound aquafeeds would sig-nificantly reduce the pressure placed on wild pelagic stocks. Genetic improvementof farmed freshwater species such as tilapia could, if undertaken with sensitivity toenvironmental and socioeconomic context, assist the development of sustainableaquaculture (Dey and Gupta 2000). Effective and coordinated extension of bestmanagement practices, including use of affordable existing technology from devel-oped countries, would go a long way toward enhancing the sustainability of aqua-culture in developing countries.

������������������������:�����������:��������� ����������������� "
The potential impact of technology does not, however, address some of thedeeper causes of environmental problems in aquaculture, which result from pro-ducer responses to incentives. High-value aquaculture offers the potential to rap-idly increase income to levels far greater than those allowed by previous uses of theland. Indeed, many problems arise when a relatively short-term perspective promising immediate profits overwhelms the long-term cost of unsustainabletechniques. This high implicit discount rate apparently employed by many aqua-culturists in developing countries is a natural consequence of poverty interactingwith a lucrative industry. The strong short-term incentives offered by aquaculture,combined with a lack of access to information and technology, can lead to man-agement decisions that place little emphasis on long-term sustainability.Governments may exacerbate the problem through lack of effective regulation.This situation has consequences for the willingness of lenders to supply capital towhat is perceived as a risky industry. The future growth of aquaculture will dependin part on whether the industry demonstrates an ability to manage long-term risk effectively.
Governments and lending agencies can promote environmental sustainabili-ty in aquaculture by creating an economic context in which long-term planning isrewarded. Loans with longer repayment schedules, for example, may reduce theincentives to pursue unsustainably high levels of farming intensity to repay largeshort-term loans. Lending agencies can require that funded aquaculture develop-ment projects meet certain environmental criteria, or follow best managementpractices. If subsidies to land or capital mask the full costs of aquaculture develop-ment in an effort to generate foreign exchange, the environment may suffer as aresult of this social cost-benefit miscalculation. Ultimately, little can substitute forcredibly enforced environmental regulations, but developing countries seldomhave the political or financial resources to follow this route effectively.
Domestic zoning regulations are the only appropriate and realistic means ofensuring that ponds are sited in appropriate locations. Such regulations may rangefrom input or system specifications to outright bans. Thailand, for example, haszoning laws regulating the construction of inland shrimp farms, while Ecuador hasplaced strong restrictions on mangrove conversion. Zoning may also serve to limitthe number and density of operations in sensitive areas. Ideally, integrated coastalzone management plans should serve as the framework for decisionmaking withrespect to coastal aquaculture development. In the absence of an established envi-ronmental regulatory framework in many developing countries, pressure fromnongovernmental organizations has proved to be an important factor in the con-troversy over land conversion and mangrove destruction.
Creating international standards for aquaculture and the environment ismade difficult by the wide diversity of countries and farming systems engaged in

aquaculture. Nonetheless, significant efforts have been made in the past decade tocreate an internationally applicable framework for decisionmaking in the aquacul-ture sector. The aforementioned 1995 Code of Conduct for Responsible Fisheries,in addition to dealing with capture fisheries, also provided a set of principlesintended to guide nations in the development of responsible aquaculture policies.The FAO and organizations such as the Network of Aquaculture Centers in Asia-Pacific (NACA) have developed technical recommendations and held regionalworkshops addressing environmental issues associated with aquaculture. In 2000,the FAO and NACA organized a major conference on aquaculture development,giving rise to the Bangkok Declaration and Strategy (NACA/FAO 2000). Thisdocument encourages states and the industry to adopt a number of measures forimproving the environmental impact of aquaculture, including environmentalsustainability indicators, integrated coastal management, institution-building,regional cooperation, and stakeholder participation.
Indeed, decisionmaking in the realm of aquaculture development shouldinvolve a wide range of issues and stakeholders so as to reduce the chances of pro-ducing detrimental outcomes and externalities for traditionally disenfranchisedgroups such as artisanal fishers. By refraining from treating aquaculture as a her-metically sealed activity, governments and lending agencies can encourage theadoption of best management practices that improve the overall fit of aquaculturewithin its environment. Ultimately, only this wider perspective can ensure the sus-tainable growth of aquaculture.
!# ��������������

� � � � � � $
"�1-"� �"%#��%$��"*($"(�
�(�*#%-%�+�#((�� #��1$%1(��
�s demand for fisheries products grows over the next several years, technol-ogy will play a crucial role in the ability of supply to keep pace. As a conse-quence of the heavy exploitation of capture fisheries discussed in previous
chapters, increased rates of extraction are undesirable from a global perspective.Rather, technologies are needed that confer the ability to better manage existingstocks in capture fisheries while minimizing waste and improving the value ofproducts through processing and handling. It may be difficult, however, to imple-ment technologies in the capture sector that have a positive impact on the envi-ronment without lowering the quantity of landings, at least in the short term.
By contrast, the aquaculture sector has the potential to help meet risingdemand. Aquaculture will require technology that allows for large sustainableincreases in production if this is to be the case (NACA/FAO 2001). Without anemphasis on minimizing environmental impacts, the potential for aquaculture tosignificantly boost its long-term contribution to world fish supplies will be dimin-ished. Technology will be especially important in this regard in developing coun-tries, where the regulatory approach is less effective than in developed countries.One of the most critical roles for technology will be in mediating the interactionbetween capture fisheries and aquaculture through its effects on the use of fishmealand fish oil in feeds for farmed fish.
$(�&�"#�� 2& �&-�&$(:�$(-" #�(�%#�� 1�&$(
�"*($"(��%$��((��"#1&�
Nearly one-third of the world’s wild-caught fish is not consumed directly byhumans, but rather is consumed indirectly as a feed ingredient for farm-raised ani-mals such as chickens, pigs, and other fish. The wild-caught fish that are reducedto fishmeal and fish oil each year amount to approximately 4–5 kg (live weight)
!�
!� ��������������
for every person on the planet. Although fish destined for reduction to meal andoil are generally undesirable for human consumption (New and Wijkstrom 2002),the practice of feeding fish to fish has raised questions about aquaculture’s nega-tive impact on wild fish stocks.17
In recent years, aquaculture has grown at an explosive rate, and aquaculturehas commanded an increasing share of fishmeal and fish oil use. With the contin-ued growth in production of aquatic organisms with relatively strong feed require-ments for fishmeal, this share will only continue to grow, increasing the likelihoodthat aquaculture will influence fishmeal and fish oil prices. This possibility hascaused some concern among those who fear that higher fishmeal and oil demandwill lead to greater fishing pressure on stocks of reduction fish (Naylor et al. 2000).
����������&����/ ������� ����������%�
Overall Importance of Fishmeal Use. Fishmeal is created from the cooking, pressing,drying, and milling of wild-caught pelagic fish; fish oil is largely a by-product ofthis process. A remarkably large share of global capture fisheries production is usedto produce these feed ingredients. About 80 percent of wild-caught pelagic fishare reduced to meal and oil (Durand 1998). The quantity of landed fish from cap-ture fisheries destined for reduction into meals and oils grew up to about 1990,but growth has stalled since then. This quantity has been variable, fluctuating froma low of 15.6 mmt in 1973 to a high of 30.5 mmt in 1994. In 1999, it was report-ed that 26.5 mmt or 28.5 percent of the total fish and shellfish catch was used forreduction (FAO 2001b). However, this figure only refers to whole fish destined forreduction and so excludes other fish scraps and processing wastes. Industry esti-mates for the quantity of fish reduced into meals and oils are therefore higher, ataround 30 mmt (Barlow 2000).
Roughly two-thirds of all fishmeal production comes from fisheries that arespecifically equipped and integrated with production chains to produce fishmeal(New and Wijkstrom 2002). Small pelagic fish species form the bulk of capturefisheries landings destined for reduction, with anchovies (Family Engraulidae)forming 46 percent; and herring, pilchards, sprats, sardines, and menhaden(Family Clupeidae) forming 40 percent of estimated landings for reduction in1999 (FAO 2000a).
Fishmeal species are typically not used as food; very low-value fish andbycatch have been used on an industrial scale for fishmeal. Yields of fishmeal and
�&����� �� ��� ������������������ ���� ���������������"������!��������������3��� �������
3�����������6��� ��������!�������0 �������������.���..���=����������>� �?�������+=����
8������������0������..�-�
��;�����������������:���������:�����D ����������;���;����������!�
fish oil from wild fish vary according to species, season (depending on the nutri-ent composition and moisture content of the reduction fish species), and the fishprocessing method employed. Typically, processing yields 20–22 percent fishmealand 4–5 percent fish oil by weight. Fishmeal production grew from the 1970s tothe 1980s, following the collapse of the Peruvian anchoveta stock in 1972–73, buthas remained near 6–7 mmt since the mid-1980s. Fish oil production hasremained slightly above 1 mmt during this period.
Approximately 90 percent of fishmeal is destined for indirect human con-sumption through farmed poultry, pigs, carnivorous aquatic species, and noncar-nivorous aquatic species. Available data and specialized studies suggest that aqua-culture’s share of fishmeal demand has been rising rapidly since the early 1980s(Table 6.1). In 1984, aquaculture represented 8 percent of world fishmeal con-sumption (New and Wijkstrom 2002). Barlow and Pike (2001) estimate that in1988, aquaculture used 10 percent of the world’s fishmeal as opposed to poultry’s60 percent. In 1994, aquaculture used an estimated 17 percent of the world’s fish-meal, with poultry feeds using 55 percent and pig feeds using 20 percent (Pike1997). By 2000, it is estimated that aquaculture consumed 35 percent of theworld’s fishmeal compared with 24 percent for poultry and 29 percent for pigs(Barlow and Pike 2001).
Fish oil has nonfood and direct human consumption uses. As in the case offishmeal, aquaculture has become an increasingly large end-user. As seen in Table6.2, aquaculture’s share was 16 percent in 1988, and this share grew to an estimat-ed 54 percent by 2000 (Barlow and Pike 2001). The increasing farmed produc-tion of high-value carnivorous species such as salmon has led to increased use offish oil within aquafeeds, as fish oil provides essential omega-3 fatty acids that arecurrently unavailable elsewhere.18
�$%&'���� �1)8$)',�12$+'1�(0�0128'$&�-1'�%?�1'.)(+
�2$+'�(0�)()$&�-1'�7*'+.'/)9
�'.)(+ �"!� �"!! �""� �###
���������� �� � ��
������� ���� �� �� ��
���� ���� �� �� ��
���� ���� �� ��
������� !��� "�� ��� �� "��# $% ��& '�()����# ����* &��� "�� �� ��& ���� �� "��# +����% ��& ��)
����* ��& &��� "�� ���� �� "��# ��) ��� �
$��� ���� ��&����� ���� &��� �� ��� �,����-��
�';��������������������������"����������������������� �������������"������ ����

!� ��������������
Geographic Concentrations of Fishmeal Production and Use, and Resultant TradeFlows. A large share of fishmeal production comes from the harvest by Peru andChile of just one species of fish, the Peruvian anchoveta (Engraulis ringens). Theharvest of this fish is extremely variable because of population fluctuations inducedby warm modes of the El Niño-Southern Oscillation (ENSO), commonly knownas El Niño (Pauly and Tsukayama 1987). El Niño warming events, which reduceupwelling along the Peruvian coast that provides nutrients for the anchoveta, arelinked to catastrophic declines in the fishery.
Since 1976, the combined share of Peru and Chile in world fishmeal produc-tion has averaged 34 percent, from a low of 13 percent in 1977 to a peak of 54percent in 1994 (FAO 2002a). China has become the next largest fishmeal pro-ducer in recent years, with an 11 percent share of global production in 1999.Denmark, Iceland, Japan, Norway, Thailand, and the United States togetheraccounted for 31 percent of global production in 1999. Japan’s production of fish-meal dropped significantly during the 1990s as a consequence of the rapid declineof the pilchard fishery, a decline that may be the result of natural environmentalvariability (FAO 1997a). The patterns of fish oil production are similar, with Peruand Chile usually commanding over 50 percent of production, though China ismuch less important in fish oil production than it is in fishmeal production.
China is by far the largest consumer of fishmeal, rising from relatively low lev-els in the 1980s to over 25 percent of total consumption in 1997, though it con-sumes only small amounts of fish oil. With the exceptions of Chile and Peru (andThailand in the case of fishmeal), the countries with high levels of both fishmealand oil consumption are in the developed world, reflecting the intensive produc-tion of livestock and carnivorous aquaculture in these countries. As a consequenceof these production and consumption patterns, net trade in both fishmeal and fishoil flows from the developing to the developed world (Table 6.3). Overall globalfishmeal exports have doubled since the mid-1970s and recently totaled about halfof production. In 1999, as in most years, the largest exporters of fishmeal werethose who led production. However, the amount of fishmeal and fish oil availablefor export has been steadily decreasing within exporting countries (including
�$%&'���� �1)8$)',�12$+'1�(0�012�(&�-1'�%?�1'.)(+
�2$+'�(0�)()$&�-1'�7*'+.'/)9
�'.)(+ �"!! �###
���������� �� ��
.�#�� �����#/���� � ��
0�&�������1/���#�������� ��
������ +����% ��& ��) �����

��;�����������������:���������:�����D ����������;���;����������!�
Chile, Japan, Norway, and Thailand) that also have rapidly growing domesticaquaculture sectors and consequently increasing domestic fishmeal and fish oildemands. China led fishmeal importers by a large margin, though Germany andJapan are also large importers. As with fishmeal, about half of fish oil productionis traded across international borders. Latin America (primarily Chile and Peru) isthe largest source of fish oil exports.
Trends in Global Fishmeal Prices and Price Volatility. Fishmeal is not traded on acentralized market or a futures market; transactions between buyers and sellers aregenerally private, sometimes on a forward contract basis (Durand 1998). Becauseof the general unsuitability of reduction fish for human consumption, it is likelythat markets for fishmeal and for low-value food fish are separate (New andWijkstrom 2002); there is no evidence in the literature of broad price linkagesbetween the two sectors.
Asche and Tveteras (2000) and others (Durand 1998) have shown that fish-meal and soymeal (another high-protein feed ingredient) behave as substitutes,with their relative prices historically stable. Soymeal is the primary substitute forfishmeal in animal feeds (Vukina and Anderson 1993); the price ratio of fishmealto soymeal has stayed near 2:1 for the past three decades, despite fluctuations inprices. The differential between fishmeal and soymeal prices is partly the result offishmeal’s higher protein content (Durand 1998).
�$%&'���� �')�' *(+)1�(0�0128'$&�$/,�012�(&3��""
�')�' *(+)1�7)2(-1$/,�8')+.�)(/19
�'5(/ �128'$& �12�(&
2���� 3�4��� 3��
�������� ���� 3� � 3
0�&�� 3� �
���� ����� ���� 3� �
5���� �#���� �4��� � �
'�� ���� ��& $���� �"���� 3�� �
��-6������� �"���� �� �
7���& ����� �� �
8�/�� 3� � 3��
9���/�� 7���� �� 3��� 3���
9����� 9���/ ��& "��#� ��,�� 7���� 3��� �
���� &,��/& �������� � 3��
!,��/��� %���& �� ���
!,��/��� %���& :���&��� 2���� �4�� ��
!,��/& %���& 3�� 3���
������ 2�������& -� ������� "��# ;�� ������
$���� !��� �� ���6��� �,���� ����& �� ��� � $����, ,���� ��&���� �� �#/�����
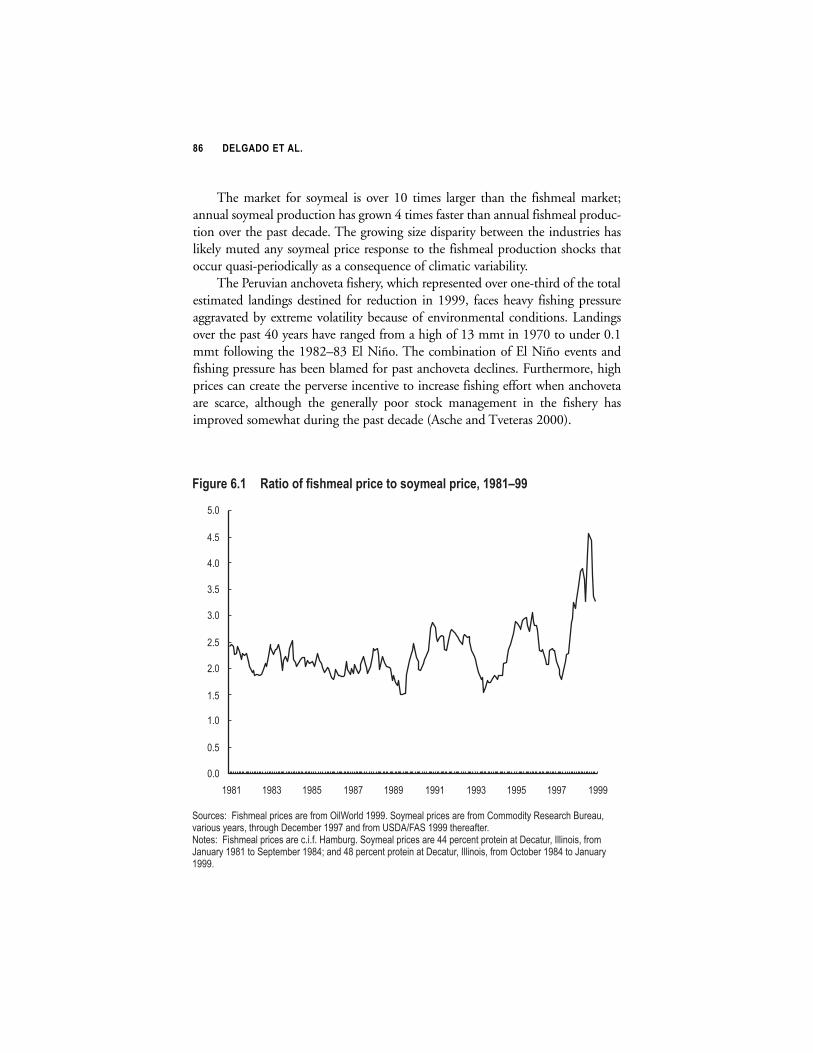
!� ��������������
The market for soymeal is over 10 times larger than the fishmeal market;annual soymeal production has grown 4 times faster than annual fishmeal produc-tion over the past decade. The growing size disparity between the industries haslikely muted any soymeal price response to the fishmeal production shocks thatoccur quasi-periodically as a consequence of climatic variability.
The Peruvian anchoveta fishery, which represented over one-third of the totalestimated landings destined for reduction in 1999, faces heavy fishing pressureaggravated by extreme volatility because of environmental conditions. Landingsover the past 40 years have ranged from a high of 13 mmt in 1970 to under 0.1mmt following the 1982–83 El Niño. The combination of El Niño events andfishing pressure has been blamed for past anchoveta declines. Furthermore, highprices can create the perverse incentive to increase fishing effort when anchovetaare scarce, although the generally poor stock management in the fishery hasimproved somewhat during the past decade (Asche and Tveteras 2000).
Figure 6.1 Ratio of fishmeal price to soymeal price, 1981–99
Sources: Fishmeal prices are from OilWorld 1999. Soymeal prices are from Commodity Research Bureau,various years, through December 1997 and from USDA/FAS 1999 thereafter.Notes: Fishmeal prices are c.i.f. Hamburg. Soymeal prices are 44 percent protein at Decatur, Illinois, fromJanuary 1981 to September 1984; and 48 percent protein at Decatur, Illinois, from October 1984 to January1999.
0.0
0.5
1.0
1.5
2.0
2.5
3.0
3.5
4.0
4.5
5.0
1981 1983 1985 1987 1989 1991 1993 1995 1997 1999

��;�����������������:���������:�����D ����������;���;����������!
Drastic declines in the catch of the Peruvian anchoveta have been associatedwith temporary fishmeal price increases. Substitution by poultry and pork produc-ers into soymeal and other vegetable meals has likely buffered these shocks, keep-ing the price ratio stable over time. The most recent El Niño event, however, coin-cided with a significant perturbation in the ratio of fishmeal prices to soymealprices. Figure 6.1 shows this price ratio from 1980 to 1999; the ratio had stayednear 2:1 but soared to 4:1 in September 1998.
��!�����&���� ����������������/���������� ����������%�
Nutritional Properties of Fishmeal and Fish Oil. Fishmeal has a number of favorablenutritional properties for the growth and survival of farmed pigs, poultry, fish, andcrustaceans. Fishmeal is a dense source of high-quality animal protein with a well-balanced essential amino acid profile. It is also a good source of digestible energy,minerals, trace elements, and vitamins. Importantly, fishmeal provides omega-3fatty acids that monogastric animals such as poultry and pigs cannot synthesize.Lysine, methionine, and cysteine levels are all higher in fishmeal than in vegetableprotein meals (Lim, Klesius, and Dominy 1998). Fishmeal competes with a broad-er range of other feedstuffs when used strictly as a supplier of vitamins, minerals,and energy.
Omega-3 fatty acids are particularly rich within fish oils, and therefore playan important role in immune function and health in fish. Fish oil is at present theonly commercially available and utilizable source of highly unsaturated fatty acidsrequired for carnivorous fish species.
In general, regular fishmeals (about 60 percent of total global fishmeal pro-duction) are used as dietary protein sources for poultry, pigs, and omnivorousfarmed aquatic species such as carp, tilapia, and catfish. By contrast, the higher-quality19 and higher-priced fishmeals are used primarily by carnivorous finfish andcrustacean farming systems. The amount of fishmeal included in diets of farmedspecies differs among farming systems, depending on the market value of thefarmed species and ingredient availability and cost. Typically, however, carnivorousfish (such as salmon) in intensive aquaculture systems consume aquafeeds contain-ing 30–70 percent fishmeal, while omnivorous fish (such as carp and tilapia) mayin some cases consume up to 25 percent fishmeal, though lower inclusion levelsare more common (Tacon 2001). Marine shrimp, such as black tiger prawns, con-sume aquafeeds of 20–50 percent fishmeal. These proportions dwarf the amounts
�%0��������!������ ��� �������� �!� ������� �������� �������������� �������� ���!�� ��
�� ���������������� ������!�������

!! ��������������
contained in the feeds of terrestrial animals. Poultry and pigs, the two other lead-ing consumers of fishmeal, consume 1–10 percent in their feeds.
Demand Characteristics for Fishmeal and Fish Oil in Aquaculture. As aquacultureexpands its production over the coming years, its use of inputs derived from cap-ture fisheries will become an increasingly important issue. The aquaculture sectoras a whole consumed the equivalent of approximately 11.5 mmt of wild-caughtpelagic fish in 1999. Intensive cultivation, especially of carnivorous species,requires the supply of supplementary and/or nutritionally complete, artificiallycompounded aquafeeds. The price and availability of fishmeal and fish oil inputsis a nontrivial issue to aquaculturists practicing intensive culture of carnivorousspecies; feed costs represent up to 60 percent of their total operating costs(Stickney 1994).
Richness in energy, amino acids, and fatty acids accounts for the inclusion offishmeal and fish oil in many aquafeeds, especially those destined for carnivorousspecies such as salmon and shrimp. Though these two categories represent only 13percent by weight of all aquaculture production, they use 41 percent of the fish-meal and 47 percent of the fish oil consumed by the industry. For such farmedspecies, it has been suggested that aquaculture can be regarded as a means of trans-forming low-value species into high-value species (Guttormsen 2002). Marinefish, in general, require higher levels of omega-3 fatty acids than do freshwater fish(Sargent et al. 1995). Herbivorous and omnivorous freshwater fish are better ableto process vegetable-based proteins and oils, and thus require less fishmeal and fishoil in their diets; however, even feeds for freshwater fish like carp and tilapia fre-quently contain fishmeal to boost growth.
Table 6.4 presents the estimated utilization of fishmeal and fish oil withincompound aquafeeds for each of the major species groups in 1999. Compoundaquafeeds consumed about 2.3 mmt of fishmeal and 0.6 mmt of fish oil in 1999,or the equivalent of 35 percent and 46 percent of the total global production offishmeal and fish oil, respectively. Carnivorous finfish species consume the bulk offishmeal and fish oil used within aquafeeds; the amount of fishmeal fed to salmonequals the amount fed to carp, tilapia, and catfish combined.
Aquaculture’s Competition for Fishmeal Use with Terrestrial Livestock. The propor-tion of fishmeal and fish oil in feed is typically governed by dozens of considera-tions for balancing growth versus cost (Vondruska 1981). Different zones in ahypothetical demand curve for fishmeal in animal feed each reflect a different rolein growth. Within the terrestrial livestock sector, substitution to and from fishmealoccurs in response to price changes. Estimates of the long-run price elasticity ofdemand for fishmeal in 1970 ranged from –0.48 to –3.0, but this was long before

��;�����������������:���������:�����D ����������;���;����������!"
aquaculture represented a significant fraction of fishmeal demand (Roemer 1970).Aquaculture’s increasing share may be changing the overall price responsiveness offishmeal demand, as is discussed in subsequent sections.
Substitution into nonfishmeal protein sources is significantly more con-strained in carnivorous aquaculture than in poultry or pig farming. In times ofhigh fishmeal and fish oil prices, many aquaculturists have little latitude in theirfeed composition choices. Studies have shown lower growth rates and higher mor-tality in several aquatic species when vegetable protein is substituted for fishmealin varying amounts (Lim, Klesius, and Dominy 1998). Fishmeal has higherdigestibility coefficients (the proportion of energy utilized by the animal) than itscompetitors for many carnivorous species (Allan 1998).
Although poultry is in most years still the largest end-user of fishmeal, aqua-culture’s share has grown considerably over recent years (Table 6.1). The growingshare of aquaculture in fishmeal demand cannot be explained by the industry’sgrowth alone. Global poultry production grew at over 5 percent per year during1985–97, a rate slower than aquaculture’s growth, but still considerable. However,the poultry sector has reduced its absolute level of consumption of fishmeal overthe past decade. Technological innovations, especially the use of processed plantprotein, have reduced the proportion of fishmeal in poultry feeds, though doublethe amount of poultry feed is now produced. Fishmeal has been reallocated to theaquaculture sector because as overall demand has grown, supply has remainedroughly the same, and terrestrial livestock producers have switched to vegetable-based meals.
�$%&'���� �1'�(0�0128'$&�$/,�012�(&�/�$<-$0'',1�0(+�$+(-1�.$)'5(+'1�(00123��"""
�1'�/�$<-$0'',1�$1�$�12$+'�(0�)()$&�7*'+.'/)9
�$)'5(+?�(0�012 �128'$& �12�(&
���#�� �� ��
<���� ����#/ �� �
<���� "��� �� ��
2��/ �� ��
=���� ��
9�� �
;���%��� ���������� � �
=���/�� � �
2��"��� � �
<��)"��� � �
=���� ���� �� ����"&� >�������& #���� ����? �4��� ���
=���� ���� �" ���������� >/����? �� ��
������� =���� �����
"# ��������������
Increasing demand for fishmeal by the booming aquaculture sector has notbeen associated with a proportionate increase in the overall fishmeal demand;instead, the high price elasticity for fishmeal in the livestock sector appears to haveallowed a distributional change in the end-uses of fishmeal. As aquaculture hasconsumed more fishmeal, the terrestrial livestock sector, which in general hasgreater latitude with regard to fishmeal substitutes, has consumed less. A similarsituation exists with fish oil, though in this case, usage has shifted from the ediblefood industry to the aquaculture sector. Some project that aquaculture willbecome the sole consumer of the world’s fish oil within the next two decades (Newand Wijkstrom 2002).
Likely Increased Overall Price Inelasticity of Demand for Fishmeal and Oil in theFuture. The traditional relationship between fishmeal and soymeal may be chang-ing as a result of the rapid growth in aquaculture’s share of fishmeal demand.Aquaculture’s relatively inelastic demand for fishmeal could lead to an overalldecreasing elasticity of demand for fishmeal, and especially for fish oil. Combinedwith the supply shocks from climate variability, this could be responsible for anincreasing frequency of price spikes during times of shortage, such as the severeprice spike that occurred during the 1997–98 El Niño event (Figure 6.1). As pricessoared because of fishmeal shortages, substitution to less expensive plant-basedmeals occurred extensively among poultry and pig feeds but only to a limitedextent in aquaculture feeds (IFOMA 1998). Consequently, aquaculture was thelargest end-user of fishmeal in 1998 (IFOMA 1999), most likely for the first timeever. This compares with aquaculture’s modest 8 percent share of fishmeal demandjust 12 years earlier in 1986 (New and Wijkstrom 2002). More volatility can beexpected, given that El Niño events occur at irregular intervals every 3 to 7 years.
Without technological change in aquaculture, its share of demand for fish-meal and fish oil is likely to continue increasing. A changing profile of fishmealand fish oil use over time is likely to be associated with changing price responsive-ness of demand. If this demand becomes less price-responsive, the price of fish-meal will become even more volatile during the large supply shocks that charac-terize the market. Demand from aquaculture could eventually drive prices higherand thus place pressure on wild fish populations, though effective management ofwild stocks would minimize the danger of overfishing (Asche and Tveteras 2000).This concern is not confined to environmental advocates; a report from theChilean fishing industry predicts that future growth in farmed salmon productionwill push fishmeal prices higher over the next few years (WorldCatch 2001). Thereis general concern that supply cannot keep pace with demand, and that the rela-tive prices of these finite commodities will increase in the long term.

��;�����������������:���������:�����D ����������;���;����������"�
The Outlook for Fishmeal. The IMPACT model permits examination of futuretrends in fishmeal and fish oil use through endogenous determination of countrygroup-specific use levels. The model allows for competition among sectors for feedinputs, and prices of these inputs are the consequence of numerous factors includ-ing output levels, feed efficiency, prices of substitutes, demand elasticities, andexogenous supply trends. Parameters for fishmeal and fish oil were specified usingavailable literature, with consideration given to the nutritional factors consideredabove and the magnitude of parameters specified for competing inputs in themodel. In general, own-price feed demand elasticities for fishmeal and fish oil usein carnivorous aquaculture were set at approximately half the corresponding val-ues for other end-uses. Also included in the model is a technological changeparameter, allowing for yearly improvements in feed conversion efficiency.
Because substitution away from fishmeal in the terrestrial livestock feed sec-tor has compensated for increased demand from aquaculture, there is little evi-dence that aquaculture’s growth has thus far been responsible for placing sus-tained, increased pressure on reduction fisheries. However, IMPACT projectionssuggest that real fishmeal and fish oil prices will increase by about 18 percent from1997 to 2020 under the baseline scenario. In this scenario, production of bothcrustaceans and of high-value finfish from aquaculture nearly doubles by 2020,contributing to higher demand for feed inputs. Strikingly, under the faster aqua-culture expansion scenario, real fishmeal and fish oil prices increase by about 50percent by 2020. Slower growth in aquaculture results in a real price decline forfish oil, and no change in real prices for fishmeal, by 2020. The scenario of rapidtechnological change (doubling the rate of improvement in feed conversion effi-ciency) results in real price declines for both fishmeal and fish oil, and even slight-ly lower prices for aquaculture commodities than in the baseline (Table 6.5).
These results demonstrate the crucial role that aquaculture will play in deter-mining demand for reduction fisheries commodities in coming decades. Most ofthe world’s fishmeal comes from specialized fisheries (New and Wijkstrom 2002),and it appears that there is little overlap between the markets for food fish andreduction fish at present. As such, it is unlikely that fishmeal price increases wouldimmediately result in large-scale conversion of low-value food fish to fishmeal,thus robbing food fish from the diets of the world’s poor.
However, it is probable that a long-term increase in the relative price of fish-meal to low-value food fish could, at some point, cause low-value food fish to beprocessed into feed. This has occurred at a local level in Lake Victoria with the pro-cessing into fishmeal of omena, traditionally a food fish for the poor, to supportthe burgeoning local poultry industry (Abila and Jansen 1997). The point atwhich this would occur on a broad scale depends on the costs involved in switch-ing to fishmeal production and processing systems. In any case, fishmeal price

"� ��������������
increases should be worrisome both to aquaculturists, for whom feed costs are asignificant proportion of operating expenses, and to those concerned with increas-ing pressure on the resource base.
Prospects for Replacement of Fishmeal and Fish Oil in Aquafeeds. Technology canreduce the risks of higher prices and overfishing by providing alternatives to theuse of capture fishery-derived inputs. Replacement of fishmeal and fish oil inaquafeeds with nutritionally comparable feedstuffs would remove the dependenceof many forms of aquaculture on wild stocks. Such replacement may also, in thelong run, diminish pressure on prices of feed inputs derived from capture fisheries,as is demonstrated by the IMPACT scenarios. Fishmeal inclusion rates inaquafeeds have declined in recent years; promising results have been obtained bysubstituting protein-rich oilseed and grain by-product meals for fishmeal in thediets of carnivorous finfish and marine shrimp. Such vegetable-based substitutesinclude soybean, rapeseed, corn gluten, wheat gluten, and to a lesser extent peaand lupin meals. Other prospects for replacement include terrestrial animal by-product meals such as meat-and-bone meal, although these bring with them realand perceived risks for the spread of disease.
In fact, bans on meat-and-bone meal as the result of Bovine SpongiformEncephalopathy (BSE) fears might create additional demand for fishmeal (Newand Wijkstrom 2002). On the other hand, they also create the need for crediblecertification of fishmeal purity in markets where importers are motivated by theprecautionary principle to ensure that fishmeal has not come into contact withmeat-and-bone-meal. The absence of this certification in Latin America led to aEuropean Union ban on Peruvian fishmeal from fear of adulteration. If the priceof fishmeal should rise, it is likely that such certification schemes will emerge.
�$%&'���� ;+(C'.)',�+'$&�*+.'�.2$/5'�(0�012'+'1�.(88(,)'1�-/,'+�$+(-1
1.'/$+(13��"" 4�#�#
;+(C'.)',�('+$&&�.2$/5'�7*'+.'/)9
�(1) �$1)'+ �&(6'+ �128'$&&>'&? $<-$.-&)-+' $<-$.-&)-+' $/,�(&
�(88(,)? 7%$1'&/'9 ' *$/1(/ ' *$/1(/ '00.'/.?
5�%6,��� "��& "��� @� 3�� @�� @�
.���6,��� "��"��� @�� @� @�� @��
2��������� @�� @� @�� @��
<�����)� @� 3�� @�� @�
;���#�� @� @�� 3� 3��
;��� ��� @� @�� 3� 3�
������� #�� 3� 3� @� 3�
������� ���(������ "�� ���� �� "��# 0;�A0B� 0<��2= #�&� >8��� ����?�
$��� � =�-� ��� "�� ������� &"���������
��;�����������������:���������:�����D ����������;���;����������"�
The main factor limiting the replacement of fishmeal is the presence of fac-tors within vegetable meals inhibiting nutrition for carnivorous fish species andthe consequent need to minimize these anti-nutritional effects either throughgenetic selection of the cultivated fish species or through the use of improved feedprocessing techniques (Francis, Makkar, and Becker 2001). However, in additionto the productivity of the cultivated species, factors such as flavor, appearance, andnutritional content must be considered by producers when attempting to substi-tute vegetable products for fishmeal and fish oil. Soybeans and other crops havelong been modified through breeding to produce feed ingredients with morefavorable commercial qualities, both by removing anti-nutritional factors andincreasing the content of desirable proteins. Increasingly, genetic modification willbe used to make further changes to existing vegetable crops. The replacement offishmeal and fish oil in feeds will certainly be targeted through a variety of means(Watanabe 2002), including transgenic improvement of nutritional factors in veg-etable feeds.
The total replacement of fish oil with commercially available plant and ani-mal oils is more problematic than the replacement of fishmeal. For many carniv-orous fish species, fish oils serve as the only readily available source of essentialfatty acids, and their total omission from rations would have a negative effect onthe final gastronomic and nutritional properties of the flesh (Sargent and Tacon1999). Some plant oils, including soybean, rapeseed, and linseed oils, haveachieved a degree of success as fish oil replacers (depending on the species farmed).At present, the most likely avenues for the commercial production of oils rich inhighly unsaturated fatty acids are micro-organisms such as the microalgaPhaeodactylum tricornulum produced through controlled fermentation processes(Reis et al. 1996), or extraction from largely untapped fisheries resources such askrill (Farstad 1999).
$ ""#��1$%�&��")"�+�"#� 2& �&-�&$(
Technological development and transfer will be essential to sustainable increases inaquaculture production, especially in the developing world, where systems domi-nated by extensive methods of production will likely intensify (NACA/FAO2001). Increases in production can occur through the provision of more inputs,such as compound aquafeeds. The growth of aquaculture to 2020 will undoubt-edly involve the commercialization and intensification of aquaculture systems.Production growth can also be achieved through improvements in the productiv-ity of cultivated organisms per unit of input, either through technological modifications to the inputs, or through modification of the cultivated organism

"� ��������������
itself. The latter means will be an important and controversial issue in aquacultureduring the next two decades.
� �!��.�������������� 0��!� ����
Compared with the advances achieved in the production of terrestrial animals,breeding technology in aquaculture is in its relative infancy. Selective breeding offish began only about 20 years ago, even though fish farming has been practicedin some regions for thousands of years (Fernando and Halwart 2000). Significantproductivity increases have been achieved for a few commercial species such assalmon, trout, and tilapia. Developed countries have particularly benefited fromselective breeding; at the industry level, breeding has increased the productivity ofthe Norwegian salmon industry by more than 60 percent and reduced the averagecost of production of Atlantic salmon by 65 percent during 1985–95 (Aerni2001). The successful cultivation and breeding of species such as bluefin tuna, alucrative and endangered fish that up until now has only been wild-caught orgrown without producing viable offspring, would be a tremendous boost to high-value aquaculture (Iioka, Kani, and Nhhala 1999).
Genetic improvement of tropical finfish is a recent phenomenon, whichbegan with the application of selective breeding technology to Nile tilapia (O. niloticus) at WorldFish in the 1990s (Dey et al. 2000). Similar technology iscurrently being applied to a range of Asian carps under collaborative agreementsbetween WorldFish and countries in the region. These efforts have resulted in atotal of 85 percent growth increases over six generations for O. niloticus, and anaverage value of around 10 percent growth per generation for three carp species inAsia (ICLARM 2001). Selectively bred Nile tilapia outperformed the most wide-ly farmed strains of tilapia in Asia both in terms of growth and survival rates,showing a yield improvement of 25–78 percent depending on local conditions(ICLARM 1998).
������!�����/�!���������������!��� ���
Methods such as gene transfer, chromosome set manipulation, and interspecieshybridization hold tremendous potential for improving the quality and quantityof fish reared in aquaculture, though not without significant controversy and risk.Biotechnology has the potential to enhance reproduction and the early develop-mental success of cultured organisms, as well as to expand periods of gamete andfry availability. Improved feed conversion efficiency in genetically altered fishwould reduce the amount of feed inputs and waste per unit of output, possiblyplacing less pressure on the environment. Genetic technology may also addressconsumer issues such as taste and aesthetics, and could conceivably be used to
��;�����������������:���������:�����D ����������;���;����������"�
improve the reproductive success and survival of endangered aquatic species.Improved growth and survival rates of cultured fish could reduce production costsper unit of output, possibly bringing down the price of fish to consumers (PewInitiative on Food and Biotechnology 2003).
Genes that regulate growth hormones, resistance to freezing, disease resist-ance, hatching, osmoregulation, behavior, and general metabolism have alreadybeen identified and transferred into aquatic species. Firms are already developingstrains of genetically modified salmon for potential use in cage aquaculture. Suchan approach is not confined to the developed world; China, Cuba, and India areamong the developing countries that have tested and in some cases developedtransgenic fish for use in aquaculture (FAO 2000a). To date, at least 10 species offish have been modified for enhanced growth, although none of these transgenicfish has yet been approved for commercialization. They include common carp,crucian carp, channel catfish, loach, tilapia, pike, rainbow trout, Atlantic salmon,chinook salmon, and sockeye salmon (Aerni 2001).
Biotechnology in aquaculture could improve productivity in an environmen-tally beneficial manner, depending on the progress of regulatory and infrastructuredevelopment (Hishamunda and Subasinghe 2003). However, some analysts warnof risk in the lack of effective monitoring and regulatory mechanisms (PewInitiative on Food and Biotechnology 2003). In the United States, regulatorypower over the approval of transgenic fish is held by the Food and DrugAdministration, which may not be adequately constituted to assess environmentalimpacts (Pew Initiative on Food and Biotechnology 2003). Concerns similar tothose regarding transgenic technologies in terrestrial crops also apply to aquacul-ture. The possible environmental impacts of genetically modified aquatic organ-isms are not well-understood (see Chapter 5), and concerns exist over possiblehuman health risks associated with transgenic fish. The documented escapes offarmed salmon and their threat to native wild populations through interbreedingand competition demonstrate that caution is necessary in considering the intro-duction of a new species into an ecosystem. Aquaculture cannot be perfectly con-tained with regard to the species under cultivation, and control of invasive speciesis extraordinarily difficult. The existence of a strong regulatory environment fordissemination, monitoring, and enforcement is a requirement for the responsibledevelopment of improved cultured species in both developed and developingcountries (Gardiner, Lim, and John 2002). This prerequisite is lacking in much ofthe world, particularly in developing countries.
Finally, the successful adoption of transgenic technology in aquaculture willalso depend on consumer acceptance of the new products. Consumer perceptionsof environmental and food safety risks associated with genetically modified organisms will partially determine the market viability of transgenic fish.

"� ��������������
Consumer risk perception also helps drive the adoption of regulations such aslabeling and traceability laws (both of which have been applied to genetically mod-ified food products in the European Union, for example), and may have eventualimpacts on the strictness of regulatory approval processes.
�%, $��&� "# �-(� 2& �&-�&$(�
"#�(#"�"� �"%#
As in the previous two decades, aquaculture will continue to comprise a broadspectrum of users, systems, practices, and species operating along a continuumfrom backyard operations to large-scale industrial systems. It is likely that econom-ic pressures will induce the progressive intensification of aquaculture around theworld to 2020. Yet optimal policies to align incentives with actions will be diverse,as will be the ways in which this intensification unfolds.
This section attempts to establish a working definition for intensification, aterm often used with many implicit meanings relating to aquaculture.“Intensification” is used in the literature to refer to a wide variety of ways toincrease input use, with or without technological change, and with or withoutgrowth in the quality of inputs used. Because aquaculture intensification mayinvolve such a broad array of changes, its relationship to environmental impacts ofthe kind discussed in Chapter 5 is not clear-cut. Some activities related to intensi-fication are detrimental to the environment, while others alleviate environmentaldamage.
"������/�!�����; ��������/�������������������
Generally speaking, intensification may be thought of as the process of producingmore outputs from the same level of the limiting factor of production, usually byincreasing the levels of other purchased inputs or factors of production, or by tech-nological change, or both. Boserup (1965) had cereal crops in mind in writing herseminal work on agricultural intensification, and used the definition of increasedoutput per unit of land area. More recently, the concept of “total factor productiv-ity” (TFP) has been linked to the issue of intensification (see Alston, Norton, andPardey 1995). In this framework, intensification is viewed as growth in TFP,equivalent to growth in the ratio of an index of outputs to an index of inputs. Thisis a useful approach in examining sources of productivity growth, such as changesin quantities of specific inputs used, changes in the composition of inputs, andtechnological change, but it is an abstract concept that unnecessarily obscures theissues related to intensification for present purposes.
Aquaculture intensification is taken here to mean increases in the quantityand quality of inputs or factors of production used with one unit of the limiting
factor of production, be it land, labor, or embedded capital, with or without tech-nological change of the type associated with increases in TFP. For most of theworld’s aquaculture, including pond finfish culture in Asia, pond area is probablythe factor most limiting output growth. Intensification in practice under these cir-cumstances may involve increasing labor input per hectare of pond surface, addingartificial feeds, improving dissolved oxygen content in water, increasing stockingdensity, controlling temperature, adding antibiotics or fertilizer, improving rearingor hatchery techniques, water re-circulation techniques, selective breeding of theorganism under cultivation, or a number of other methods and technologies.
Although the two are sometimes used synonymously, intensity should be dis-tinguished from stocking density, a measure of concentration of organisms perunit of surface area (or volume). Although intensive systems may in fact utilizehigh stocking densities, intensification encompasses a range of technologies andmethods of which the degree of concentration is only one component. Mostimportantly for this discussion, the degree of concentration and the level of inten-sification may affect environmental objectives in opposing ways.
Aquaculture operations can be roughly divided into three categories, thoughthe boundaries among them are not rigidly fixed: extensive, semi-intensive, andintensive (Hatch and Tai 1997). Extensive aquaculture includes traditional sys-tems that use few capital inputs, often relying on natural stocking and feeding ofthe species under cultivation over a wide area. Semi-intensive aquaculture opera-tions use more capital inputs, such as compound aquafeeds and water controltechnology. Yields from semi-intensive farms are generally higher than those fromextensive farms. Finally, intensive farms employ a high level of inputs and producea high level of outputs. Intensive farms almost always use compound feeds, useseed from hatcheries, and stock at relatively high densities. They may use suchinputs as pesticides, antibiotics, aerators, and sophisticated water control technol-ogy. The output per unit area from intensive farms is high relative to extensive andsemi-intensive systems.
Aquaculture has been practiced in traditional, extensive form for thousands ofyears in some areas. Freshwater fish culture dates back over 3,100 years in China(Guo 2000), and centuries-old techniques for raising marine organisms are stillcommon in many regions of Asia. Traditional methods, however, have beenincreasingly replaced with higher-yielding systems. Over the past few decades, asaquaculture has boomed, the increased production has come not only fromexpanded area but also from a progressive intensification of production in manyregions. For example, in Southeast Asia, shrimp has been cultivated for centuriesby allowing natural stocking of low-lying impoundments, with low yields and fewor no inputs. In countries such as Bangladesh, India, Indonesia, Taiwan, Thailand,and Viet Nam, semi-intensive and intensive production of shrimp now dominate
��;�����������������:���������:�����D ����������;���;����������"

"! ��������������
production. These systems often use compound aquafeeds, hatchery-raised seed,and other capital inputs.
The degree of aquaculture intensification is typically a response to relative fac-tor and input prices, which reflect the economic and regulatory environments fac-ing producers. For example, extensive, low-yield systems tend to be more commonwhen skilled labor is scarce and land is ample (Kusumastanto, Jolly, and Bailey1998). As demand for aquaculture products grows and investment levels rise, thevalue of cultivated area rises relative to labor and purchased inputs, provoking sub-stitution of the latter for the former. As a consequence, aquaculture—particularlyhigh-value aquaculture—has intensified over time.
����$� ������������������"������/�!����������(�.���������
"���!��
Because large-scale and intensive systems use higher levels of inputs, and oftengenerate higher levels of outputs, they can potentially generate high levels of envi-ronmental externalities. Intensive aquaculture has drawn most of the negativeattention from environmental damage caused by the sector. However, intensifica-tion of aquaculture can also have positive effects on the environment (Barg andPhillips 1997). Capital-intensive production systems often allow for more controlover negative impacts such as effluent pollution and the spread of disease. Theremay, in fact, be economies of scale in the control of environmental problemsthrough the use of technology. Intensive systems also demand less land and waterper unit of output than do extensive systems, though the profitability of intensivefarming has encouraged the spread of such systems over wide areas. The demandfor wild-caught seed stock can increase with higher stocking densities, but devel-opment of hatcheries and internalization of the rearing process serve to take pres-sure off wild stocks.
Disease. The overall risk of disease is determined by numerous factors, and, corre-spondingly, numerous possibilities exist for reducing this risk. Stocking at highdensities tends to degrade water quality and increase stress on the organisms, thuscontributing to disease risk. Controlling disease may be partially addressed bymanagement techniques such as rotation of culture species and stocking organismsat lower densities. However, water control technology (for example, aerators andwater re-circulation systems) and antibiotics, both of which are associated withintensive production, can mitigate the stress caused by high concentrations oforganisms.
A major cause of disease in shrimp culture (and other forms of aquaculture)is poor seed quality. Technological advances that internalize the life cycle of farmedorganisms would be of great value in minimizing disease risk and reducing reliance

��;�����������������:���������:�����D ����������;���;����������""
on wild broodstock. Although complete domestication may be several years away,much can be done to minimize disease risks in the existing production chain.Except in large vertically integrated systems, it is difficult at present for farmingoperations in developing countries to obtain a traceable, reliable source of disease-free postlarvae. Advances in hatchery technology and the development of infra-structure to improve control over seed stock would significantly lower the risks ofintensive culture. Domestication and improved rearing techniques would not onlyreduce disease risk but also ease pressure on wild stocks. As aquaculture continuesto expand, these developments may help to minimize impacts on the environmentwhile simultaneously sustaining the possibility for future growth.
Effluent, Water Quality, and Water Demand. Poor water quality can result from feedwastage, lack of oxygen circulation, and exchange of polluted water with neigh-boring ponds. Minimizing water exchange through recirculation has the dual ben-efit of reducing water demand and minimizing the effluent problem for both theenvironment and surrounding farms (Boyd and Gross 2000). Other steps toimprove water quality include calibration of the amount of applied feed so as tominimize waste, integrated systems that raise complementary organisms to reduceunwanted outputs, and capital improvements such as aerators and pumps.
Capital-intensive approaches to the effluent problem such as containmentand treatment are not scale-neutral, and are probably not economically viable forthe majority of the world’s producers. Similarly, pond lining is a relatively expen-sive but effective technique to prevent water loss; less expensive water conservationmeasures include water re-use (as opposed to water exchange) and weed control tolimit transpiration (Boyd and Gross 2000).
Potential also exists for aquaculture development in under-exploited water-bodies, such as rice paddies, irrigation canals, reservoirs, and seasonal or perenni-al ponds in developing countries (Fernando and Halwart 2000). Technology forsuch expansion need not be based on intensive commercial operations; rather,basic principles of aquaculture can be applied and adapted to local knowledge sys-tems and different political and cultural contexts. The gathering of information onexisting forms of aquaculture practiced under different conditions can aid in thesuccessful transfer of practices from one region to another. The relatively inexpen-sive exploitation of existing water resources could augment incomes, help increasefish availability in domestic markets, and increase the affordability of low-valuefood fish in developing countries (Li 1999).
Management/Technological Strategies to Minimize Risks and Externalities. Areas ofconcern in achieving sustainable aquaculture development include water manage-ment, effluent control, disease control, and minimization of land use

�## ��������������
(NACA/FAO 2001). Some technologies long employed in traditional aquaculturesystems can be useful in addressing these concerns. Polyculture, in which severalspecies of organisms are grown together (or an aquatic species is farmed in tandemwith a land-based, often agricultural, system), can help to reduce both the inputsand negative outputs of a system. Integrated agro-aquaculture, often with freshwa-ter fish such as carp and tilapia, has been shown to be a viable means of providingboth cash and dietary protein to low-income farmers in Asia, Latin America, andSub-Saharan Africa (Prein and Ahmed 2000; Hatch and Tai 1997). Freshwaterfish aquaculture in China is dominated by systems that are closely integrated withfarming systems, utilizing agricultural wastes as feed inputs. These farms have lowresource demands and waste outputs but similarly have low yields (Gomiero et al.1999).
Successful introduction of technological change in aquaculture depends oneffective communication and extension. These constraints are particularly acute indeveloping countries (Jagger and Pender 2001), where institutions and infrastruc-ture to promote dissemination of information are lacking. Nonetheless, the devel-opment and dissemination of inexpensive sustainable technologies to assist aqua-culturists is crucial in light of the weak environmental regulatory environment inmany developing countries. Investment in aquaculture technologies for intensivesystems in developed countries may have positive spillover effects.
The Bangkok Declaration and Strategy (NACA/FAO 2000) outlined a frame-work for aquaculture development strategies that emphasize sustainable incomegrowth and environmental responsibility. Among its recommendations are invest-ments in research, training, and extension, especially as they pertain to the devel-opment of aquaculture systems that are managed according to best available prac-tices and integrated with surrounding ecosystems. The Joint Group of Experts onthe Scientific Aspects of Marine Environmental Protection (GESAMP 2001) alsoprovides a comprehensive list of guidelines and tools to be used by planners andresearchers concerned with sustainable aquaculture development.
#((�� #��1$%1(���"#��*(�� 1�&$(�
�"*($"(�(��%$
Higher relative fish prices will provide a strong incentive to improve productionand processing efficiency, but can have negative consequences for resource use byencouraging greater fishing effort. Technology can play a major positive role byreducing discarded bycatch and postharvest losses, especially because significantproductivity increases are unlikely through increased catches of conventionalspecies. Technology will also be essential in improving the quality and safety of

��;�����������������:���������:�����D ����������;���;�����������#�
fisheries products in the market. Ensuring sustainability in capture fisheries pro-duction will require technologies that enable a better understanding of fish stocksand their movements, and make management and monitoring tools more user-friendly. Technologies will also be needed to minimize the sources of pollution anddamage to coastal fisheries from land-based activities.
"�/�����������!��� ���
Production from capture fisheries grew rapidly from the 1950s through the 1970s,aided in large part by the use of technologies like nylon fishing nets, hydraulicpower, electronic fish-finding equipment, larger vessels, freezing, and better stor-age capacity. However, the world’s oceans have likely neared their production ceil-ing under current management regimes. Technological advances that improvemanagement methods and information are even more necessary than those thatfurther increase capacity.
Technology can play an important role in providing better information tothose charged with managing fisheries. Information about the location, size, struc-ture, and growth potential of stocks is essential to the effective management offisheries. Unfortunately, gathering information about fisheries resources isextremely challenging because the extent of the resources in question is generallyunknown and can only be inferred with complex calculations based on years oflandings or survey data. Moreover, many countries with a large fisheries sector lackthe capacity to devote significant resources to scientific stock assessment. Reliabledata can be difficult to obtain even in developed countries, and even about land-ings. Although information technologies can also improve catching efficiency,their benefits to management may well outweigh their risks in terms of overfishing.
Currently, acoustic techniques provide the best means of remotely assessingfish stocks and remotely identifying species, though long time series are needed forreliable assessment. Improvements in these techniques, along with improvementsin the analysis and display of data provided by these techniques, promise to great-ly add to the knowledge base within fisheries management. Developed-countryinvestment in a new generation of fisheries research vessels and remote sensingprojects would also considerably enhance the information available to stakehold-ers and policymakers in fisheries. Satellite-based systems have already improvedthe ability of vessels to track down fish (thus increasing capacity) but also have thepotential to address a management need—the monitoring of fishing activity andfishing vessels themselves. Satellite technology could also aid in communication(often limited by the range of radio and telephone) and facilitate the rapid report-ing of fish landings.

�#� ��������������
Finally, the traceability of seafood products will be increasingly important forconsumers, who will in all likelihood wish to know more about the origins of theirseafood than can currently be gleaned in most markets. Consumers may wish tohave more information concerning the health of the stock (in the case of wild-caught fish), the biotechnology employed in breeding or raising the fish (in thecase of aquaculture), the risks of chemical or heavy metal contamination, or themanner of postharvest handling. Greater traceability would also be useful for man-agement purposes because it could help exclude seafood products from marketswhen their production fails to conform with established guidelines. Certificationschemes such as that of the Marine Stewardship Council (an independent non-profit organization) provide a means for companies to recoup the extra costs ofemploying technology to conform to guidelines, as long as consumers are willingto pay a premium for certified products.
����������������������������
Even if information were perfect, the problem of effective management of fisheriesresources would remain. Although a growing number of international agreementsinvolving fisheries management are in place, the industry is not managed by aninternational body; it is usually managed nationally. As such, access rights to fish-eries are subject to considerable regional and national variation, often leading tosuboptimal outcomes that place excess pressure on stocks—analogous to the“tragedy of the commons” (Hardin 1968). The reluctance of industrialized nationsto deal with the difficult issue of allocation (thereby allowing wasteful competitionand overcapacity) has led to progressive expansion of fleets and overfishing inexpanding areas. Developing countries have the same reluctance but must alsoapproach the problem with limited fiscal resources and management capacity.These factors have contributed to a poor management outcome in capture fish-eries worldwide.
The creation of exclusive user rights, changing the nature of resource owner-ship by converting publicly owned and used resources into publicly owned butprivately used ones, may lead to increased cooperation among user groups andtheir acceptance of some of the responsibilities of management (FAO 1997b).However, the notion of exclusive user rights means that some participants must beexcluded from some fisheries to reduce fishing capacity. Developing countries facea special dilemma in managing their fisheries, dominated as they are by subsistenceand small-scale participants (Ahmed et al. 1999). Rights-based management sys-tems such as individual transferable quotas (ITQs) are often perceived as unfair atthe state level given unequal distribution of wealth and negotiating power (Aerni2001). Such systems may exclude part-time fisheries users, and the initial alloca-tion of quotas may be biased toward more politically powerful stakeholders.

��;�����������������:���������:�����D ����������;���;�����������#�
Transaction costs may also be considerable. Instead, decentralized forms of man-agement drawing on stakeholder participation and collective action, such as co-management and community-based management, may be better suited insome cases to the governance of capture fisheries (Pinkerton 1989).
Successful management of the world’s diverse and widely distributed capturefisheries resources will depend on coordination of technology and policy.Technology can facilitate information gathering and exchange. The application ofgeographic information systems (GIS) technology to fisheries management, forexample, will facilitate a better and more systematic exchange of informationacross local, national, regional, and global levels (Caddy and Garcia 1986). A goodexample of the possibilities offered by technology working in tandem with regula-tion is vessel monitoring system (VMS) technology, which employs satellite track-ing to allow onshore tracking of vessel movements, thereby enhancing the enforce-ment and deterrence of regulations. With limited resources available for patrollingvast areas of ocean, remote monitoring will be an extremely valuable and cost-effective management tool. VMS is already used as a regulatory tool in severalcountries including the United States.
������<����(������ ����������,����
Technology is crucial to the avoidance of externalities created by commercial fish-ing, such as the damage wreaked on the seafloor by trawling; though in terms ofseafloor disturbances, bans on certain kinds of gear may ultimately prove to bemore effective than anything else. Modifications to existing gear have, however,produced favorable results by minimizing seafloor contact (National ResearchCouncil Ocean Studies Board 2002).
Some types of gear, such as bottom trawls or certain nets, generate morebycatch than others, especially when used with excessively small-sized mesh or innursery areas. Efforts to limit discards or bycatch of sensitive species may take theform of outright bans on technology deemed to result in excessive waste of marineresources. Often, however, modifications to existing gear may produce highlyfavorable outcomes. Bycatch reduction devices, or BRDs, are increasinglyemployed in fishing operations to lower the amount of unintended catch. BRDsmay be designed to specifically exclude marine mammals, turtles, undersized fish,or other organisms.
Although they can potentially diminish the catch of target species, manyBRDs (along with selective fishing methods) have proved successful in reducingbycatch while maintaining high levels of target catches. BRDs employed inAustralian prawn trawls, for instance, have resulted in bycatch reductions of over60 percent while increasing the average size of prawns caught (Broadhurst et al.1999). Nevertheless, some target and nontarget species that pass through

�#� ��������������
excluder devices do not survive (Samonte-Tan and Griffin 2001). In an industry suffering from economic hardship, new technology that minimizes unwantedbycatch while not significantly affecting target landings is essential.
Appropriate policies must complement the implementation of bycatch reduc-tion technology. BRDs will remain unused or ineffectively used without properpolicy incentives, along with training and extension. Catch quota systems oftenworsen discarded bycatch problems, though ITQ management systems allow forthe trading of some bycatch. Surveillance and observation are also key componentsof any selective fishing regime, though again, developing countries usually do nothave the resources to implement effective observation programs on national fleets.The U.S. National Observer Program, which is operated in partnership with theNational Marine Fisheries Service and involves the placement of observers aboardfishing vessels, is the primary source of discard and bycatch data in the UnitedStates. Both fishers and conservationists can benefit from accurate data presentedobjectively in this manner.
�*(��$&�" -�$%-(�%���(�*#%-%�+�"#��*(�
%&�-%%7��%$��"*($"(
With global fish supply struggling to keep pace with demand over the next 20years, technology will play a crucial role in determining the prices of food fish bothto the poor and to developed-country consumers. In capture fisheries, informationtechnology and waste reduction will be useful in stabilizing production; moreintense exploitation is unlikely to yield significant growth on a global scale.Aquaculture has much greater potential for growth, and requires a broader arrayof technologies not only to increase productivity but also to deal with the atten-dant problems of intensification. In high-value aquaculture, the possible limitingconstraints of fishmeal and fish oil can only be surmounted through feed replace-ments, and this need will become more important both for aquaculture and thehealth of reduction fish stocks as aquaculture’s demand for fishmeal and fish oilincreases.
Production growth in aquaculture will come from expansion of area; fromincreased intensity of input use, especially feed; and from technological improve-ments in both inputs and organisms. Breeding and biotechnology have tremendous potential to boost production, especially for species that are widelycultivated in resource-poor systems (such as carp and tilapia). The introduction ofnew species and new traits into ecosystems, however, must be regulated and mon-itored with great caution. As global aquaculture intensifies, technology’s role incontrolling externalities and minimizing net resource demands will become evenmore important.

� � � � � � %
$ 1"�-+��$%,"#���"*($"(�
�$ �(� #��"��"�1 ��
�oughly 40 percent of global fish output by value (about 33 percent byweight) was traded across international borders in 1998 (FAO 2001b),compared with less than 10 percent for meat (Delgado et al. 1999). The
high trade share of fish is astounding for such a highly perishable commoditygroup, and mirrors major changes in human diets around the world, changingsupply conditions in both the North and South, and the ongoing globalization ofhigh-value food chains. If fishmeal is included, more than 90 percent of fish tradeis comprised of commodities that have been processed in some form. Food fish areprimarily traded as fillets, cleaned and packaged frozen fish, and canned fish (FAO2001b). By the late 1990s, almost 80 percent of all fish imports by value (includ-ing fishmeal) were accounted for by the OECD countries, whereas over 50 per-cent of exports originated in developing countries. About 40 percent of develop-ing-country fisheries exports originated in low-income food deficit countries(FAO 2001b).
Global fish trade in the mid-1990s (including fishmeal) totaled well overUS$50 billion (FAO 2002a), over three times the corresponding value in nominalterms in the early 1980s. By comparison, food and agricultural trade as a whole(including fish) only doubled in nominal value terms over the same period (FAO1999b). Developing countries increased their value share in world fish exportsfrom 40 percent in 1980–82 to 50 percent in 1995 (FAO 1999b).
During the period 1980–98, the average annual growth of fish exports indeveloping countries was almost 10 percent, and in 1998 the fisheries sectoraccounted for more than 2 percent of the total export earnings of developingcountries (United Nations 2002). Net exports of fish and fish products fromdeveloping to developed countries surpassed US$16.5 billion in the year 1999(FAO 2001b). Figures 7.1 and 7.2 show the rapid expansion of fish trade since the1970s, in both export and import values.
�#�
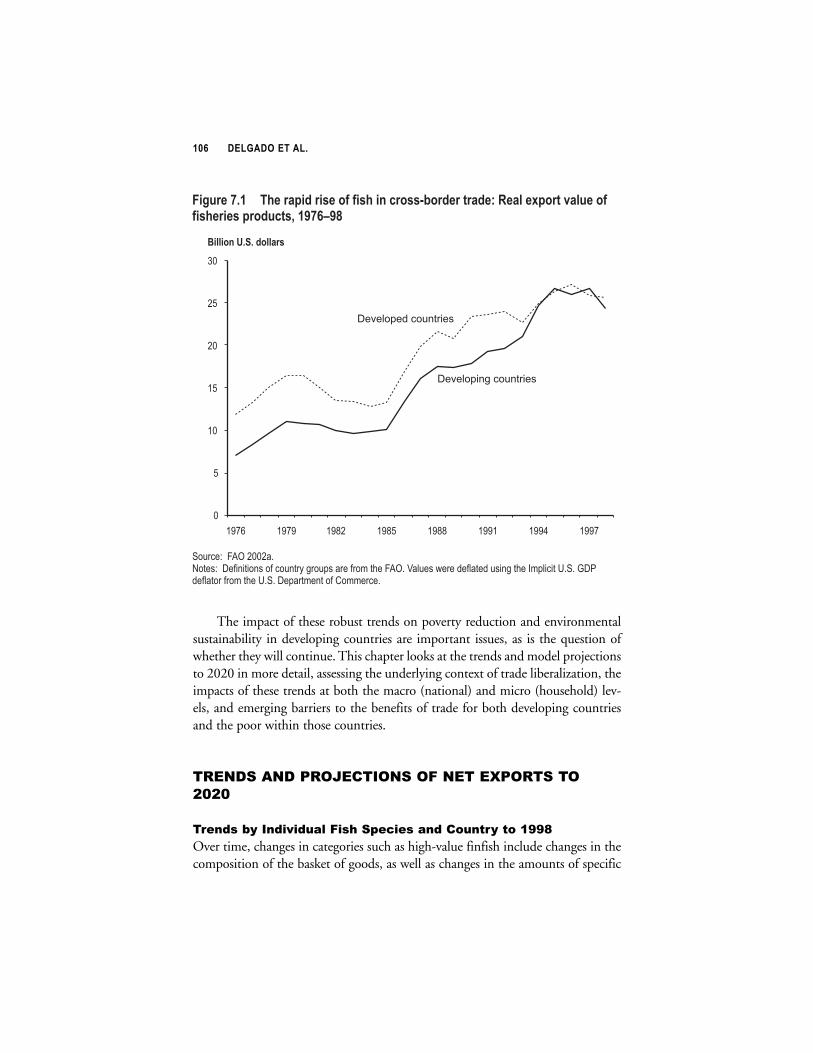
�#� ��������������
The impact of these robust trends on poverty reduction and environmentalsustainability in developing countries are important issues, as is the question ofwhether they will continue. This chapter looks at the trends and model projectionsto 2020 in more detail, assessing the underlying context of trade liberalization, theimpacts of these trends at both the macro (national) and micro (household) lev-els, and emerging barriers to the benefits of trade for both developing countriesand the poor within those countries.
�$(#�� #��1$%'(��"%#�%��#(��(=1%$���%
��
����������"���.���� ��������!�������������������899>
Over time, changes in categories such as high-value finfish include changes in thecomposition of the basket of goods, as well as changes in the amounts of specific
Figure 7.1 The rapid rise of fish in cross-border trade: Real export value offisheries products, 1976–98
Source: FAO 2002a.Notes: Definitions of country groups are from the FAO. Values were deflated using the Implicit U.S. GDPdeflator from the U.S. Department of Commerce.
0
5
10
15
20
25
30
1976 1979 1982 1985 1988 1991 1994 1997
Billion U.S. dollars
Developed countries
Developing countries

��;���D �����������:����������������������;�����������#
commodities consumed. Consequently, it is useful to look at past trends in thetrade of specific fish species in addition to looking at changes over time in broad-er categories. The trends since 1977 show significant growth in trade and majorincreases in developing-country net exports (FAO 2002a).
The share by weight of gross major fish exports from developing countries20
is illustrated in Figure 7.3 for 1977 and 1997. The share by weight of high-valueitems such as scallops, squid, and other mollusks has doubled (from 6 to 12 per-cent), whereas the share of fishmeal and fish oil has fallen by 8 percent of the totalweight (from 35 to 27 percent). The impact of these changes is better shown invalue terms (Figure 7.4). By 1997, high-value items such as mollusks, crustaceans,tuna, demersal fish (such as basses), freshwater fish (mostly white fish fillets), and
Figure 7.2 The rapid rise of fish in cross-border trade: Real import value offisheries products, 1976–98
Source: FAO 2002a.Notes: Definitions of country groups are from the FAO. Values were deflated using the Implicit U.S. GDPdeflator from the U.S. Department of Commerce.
0
10
20
30
40
50
60
1976 1979 1982 1985 1988 1991 1994 1997
Billion U.S. dollars
Developed countries
Developing countries
�.0�����������!!������������������� ������������������������� �����������������/�����
� �������� ����� ������!��

�#! ��������������
Figure 7.3 Gross fish-export shares in developing countries by quantity,1977 and 1997
Source: Calculated by authors from FAO 2002a.Notes: Data are three-year averages centered on 1977 and 1997, respectively. Values are the sum of allnational data within the IMPACT developing countries.
Tuna and other pelagics17 percent
Marine unspecified22 pecent
Freshwater fish
Total = 2.8 million metric tons
Total = 10.4 million metric tons
1 percent
1977
Fishmeal and fish oil35 percent
Shrimp and othercrustaceans13 percent
Demersal(such as hake and bass)
6 percent
Cephalopodsand mollusks
6 percent
1997
Demersal(such as hake and bass)
5 percent
Shrimp and othercrustaceans10 percent
Cephalopods and Mollusks12 percent
Tuna and other pelagics18 percent
Marine unspecified22 percent
Fishmeal and fish oil27 percent
Salmon2 percent
Other2 percent
Freshwater fish2 percent
��;���D �����������:����������������������;�����������#"
salmon accounted for nearly three-quarters of gross fisheries exports identified byspecies. A further 19 percent were only labeled as “marine, not elsewhere speci-fied.” Thus 90 percent of the gross fisheries exports of developing countries in1997 specifically identified by species were high-value items.
Tuna is clearly one of the most important finfish in international trade, andhas long been so. Trade is dominated by exports from China and Latin America,and imports to the European Union, Japan, and the United States, as shown inTable 7.1.21 Thailand is a major developing-country producer of canned tuna, andthe major markets for canned tuna are the European Union and the United States(FAO 2002a). China is the dynamic player on world markets; from the early1970s to the mid-1980s its net tuna exports grew by half, and thereafter they grewmore than threefold.
Cod is a venerable product in world food trade going back hundreds of years;it was one of the first perishables successfully exported around the world on a reg-ular basis (Kurlansky 1997). Cod trade continues to be overwhelmingly from theNorth to the South, as would be expected for this species, which until recently hadbeen a staple in parts of the North. It has become a luxury item in both the Northand South over the past couple of decades (Table 7.2). This may in part explainthe rise of Russia as a major cod exporter after the fall of the Soviet Union, andthe new role for China as a major cod importer over the same period. The UnitedStates went from being a small net importer to being a small net exporter of codproducts over this time, despite the collapse of the shared Canadian–U.S.Northeast cod fishery in the 1990s.
Salmon has become a much more important commodity in fisheries trade inrecent years as a result of aquaculture. As suggested by the regional totals in Table7.3, the big changes have been the emergence of Chile, Denmark, and Norway asmajor exporters, and the diminished role of the United States as a net exporter.Denmark’s prominence in this regard results from its role as an internal E.U.processor of non-E.U. Norwegian salmon; the processed product is subject tomuch higher tariffs than the raw product in the European Union. Wild salmoncatches in the United States have not declined much over the past 20 years, butthe U.S. market has been inundated with farmed salmon from other parts of theworld, including Chile. The European Union and Japan have emerged as majorand still-growing import markets, while China was a net importer of 33,000 mtper year of salmon (processed weight) in the late 1990s.
��>������ ����� �������� ��� ����� ����������� ���� �!���������� ���������� ����!���������
!�� ������������ ���������� ������ ����������� ����� �������� ��� ������ ��� ������ � ���
����!�������� ������ ����������"����>�������������� ���� ������!�� ���
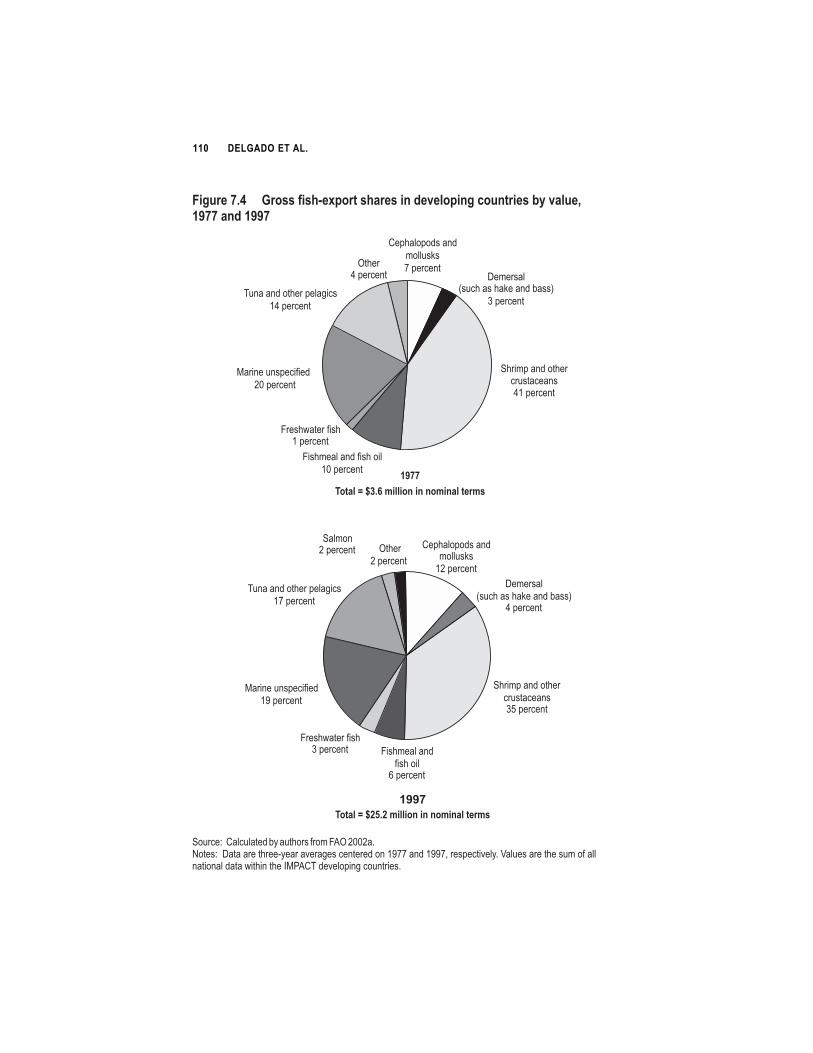
��# ��������������
Figure 7.4 Gross fish-export shares in developing countries by value,1977 and 1997
Source: Calculated by authors from FAO 2002a.Notes: Data are three-year averages centered on 1977 and 1997, respectively. Values are the sum of allnational data within the IMPACT developing countries.
1977
Total = $3.6 million in nominal terms
Total = $25.2 million in nominal terms
Tuna and other pelagics
14 percent
Other4 percent
Cephalopods and
mollusks
7 percentDemersal
(such as hake and bass)
3 percent
Shrimp and othercrustaceans41 percent
Fishmeal and fish oil
10 percent
Freshwater fish1 percent
Marine unspecified
20 percent
Marine unspecified19 percent
Freshwater fish3 percent Fishmeal and
fish oil6 percent
Shrimp and othercrustaceans35 percent
Demersal(such as hake and bass)
4 percent
Cephalopods andmollusks
12 percent
Other2 percent
Salmon2 percent
Tuna and other pelagics17 percent
1997

��;���D �����������:����������������������;�������������
Shrimp is the principal traded fisheries commodity in value terms; it account-ed for about 20 percent of world fisheries trade by value in the late 1990s (FAO2001b). As shown by Table 7.4, it remains important in volume terms as well. Theflow of trade is primarily from the developing to the developed world. The majorexporters are in Southeast Asia (Thailand being the foremost world exporter),Central America, and India. The major importers are in the OECD countries; netimports of the developed world tripled by volume from the late 1970s to the late1990s. U.S. shrimp imports currently exceed US$3 billion annually (FAO 2002a).
Freshwater fish such as Nile perch, tilapia, and catfish (including Asian vari-eties such as basa) have become significant export items from developing countriesover the past 15 years, as suggested by Table 7.5, with the biggest changes occur-ring in Sub-Saharan Africa, where net exports have grown by 53,000 mt. Kenya,Tanzania, and Uganda have been important exporters of Nile perch fillets fromLake Victoria, and Viet Nam has rapidly expanded its basa exports to the U.S.markets in the past 3 years (not shown in the table).
�$%&'� �� �')�' *(+)1�(0�)-/$�*+(,-.)13��" 4"
�')�' *(+)1�7)2(-1$/,�8')+.�)(/1�/�*+(.'11',�6'52)9 �')�.2$/5'
�'5(/ �" �"!� �"" �"!�4"
2���� � ��� ��� � �
�������� ���� �� �� 3�� 3��
0�&�� � � � �
���� ����� ���� �� � �� �
5���� �#���� �� � �� ��
'�� ���� ��& $���� �"���� � 3� 3�� 3��
��-6������� �"���� �� �� �� �
7���& ����� 3� 3�� 3��� ��
8�/�� 3� 3�� 3�� 3���
9���/�� 7���� �� 3 � 3�� 3��� 3���
9����� 9���/ ��&
"��#� ��,�� 7���� � � 3� 3�
���� &,��/& �������� 3 3�� 3�� 3��
!,��/��� %���& �� ��� ��� ���
!,��/��� %���&
:���&��� 2���� ��� �� �� 3��
!,��/& %���& 3�� 3��� 3�� 3��
������ 2�������& -� ������� "��# ;�� ������
$���� !��� �� ���6��� �,���� ����& �� �� 4 ���4 ��& ��� 4 ��/���,��� $����, ,����
��&���� �� �#/����� =��� /��&���� �� &"��& �����&��� �� �� ;�� >�����? ����&��& 0�&������� =��&
2�����"������� >�0=2? �������� C����4 "���4 �����& :� ��4D C����4 "��E� :� ��4D ��& C����4 %��� ��
/���4 /�/��&4 /���,&�D $� :/���� �� &"��& �� �� ���&��� -�%� :/���� ��& �#/���� �� �
������ F��-�� �� :/���� &� ��� ��# �� E���

��� ��������������
"�1 �������������������; *������!� ������������1��?�!������
�����
The direction of net trade by quantity of total food fish changed dramatically fromthe mid-1980s to the late 1990s, as shown in Table 7.6. Developing countries asa whole went from being net importers from developed countries (over 1.2 mmtof food fish in 1985) to net exporters to developed countries (over 4 mmt in1997). This surely must be one of the largest changes in direction of trade betweendeveloped and developing countries for any natural resource commodity.22 Theestablishment of EEZs (Chapter 2) was partly responsible for this shift.
�$%&'� �� �')�' *(+)1�(0�.(,�*+(,-.)13��" 4"
�')�' *(+)1�7)2(-1$/,�8')+.�)(/1�/�*+(.'11',�6'52)9 �')�.2$/5'
�'5(/ �" �"!� �"" �"!�4"
2���� � � 3��� 3���
�������� ���� � � 3� 3�
0�&�� � � � �
���� ����� ���� � � � �
5���� �#���� 3�� 3 3�� 3��
'�� ���� ��& $���� �"���� � � � �
��-6������� �"���� 3�� 3� � �
7���& ����� 3� 3� �� ��
8�/�� � 3� 3�� ��
9���/�� 7���� �� 3��� 3�� 3��� 3
9����� 9���/ ��&
"��#� ��,�� 7���� � � � �
���� &,��/& �������� ��� ��� �� 3�
!,��/��� %���& 3�� 3�� 3�� 3���
!,��/��� %���&
:���&��� 2���� 3�� 3�� 3�� 3��
!,��/& %���& 3�� 3��� 3�� ���
������ 2�������& -� ������� "��# ;�� ������
$���� !��� �� ���6��� �,���� ����& �� �� 4 ���4 ��& ��� 4 ��/���,��� $����, ,����
��&���� �� �#/����� 2�& /��&���� �� &"��& �����&��� �� �� ;�� >�����? ����&��& 0�&������� =��&
2�����"������� >�0=2? �������� C��&4 "���4 �����& :� ��4D C��&4 "��E� :� ��4D C��&4 ����&4D ��& C��&4
&��&4 ��� "������D $� :/���� �� &"��& �� �� ���&��� -�%� :/���� ��& �#/���� �� � ������ F��-�� ��
:/���� &� ��� ��# �� E���
��� ����"�������� � �����������"����� ������ ������ ����� ��������������� ����"���������
��������������� ��������� ����������!��������������!��������������������� �����������
� �������������� ����� ��������������!����������� ������ �������������#,������ ��� ����!� �
�����+�����������4-��0������ ����� ���!���������� ������������������� �������������
���!������������� ��������!����� ������������ �������������+�����������8-��6�7�������
�����������"����������������� ��������������� ����� ���������� ����� �� �������������� ���
���������� � �������� ��������!��

��;���D �����������:����������������������;�������������
In absolute terms, Japan exhibited the biggest change in food fish trade overthe 1985–97 period, from being one of the world’s largest net exporters to beingthe world’s largest net importer, which reflects the steep declines in Japanese catches in the 1990s. Both the European Union and the United States increasedtheir net imports over the same period. The correspondingly large increase in netexports came from Latin America and Southeast Asia, while Sub-Saharan Africashifted from being a major net importer to near self-sufficiency, although it is like-ly that a good part of this change stemmed from demand reduction.
The two rightmost columns of Table 7.6 compare the absolute aggregatechange in volume of net exports from 1985 to 1997 with the change projected to2020 under the baseline scenario described in Chapter 4. The comparison suggestsa slowing and even a reversal of net export growth by developing countries.Developing countries as a whole are projected to continue as net food fishexporters in 2020 but with lower volumes than in 1997. This is driven by eventsin developing countries other than China, as demand for food fish is expected to
�$%&'� �� �')�' *(+)1�(0�1$&8(/�*+(,-.)13��" 4"
�')�' *(+)1�7)2(-1$/,�8')+.�)(/1�/�*+(.'11',�6'52)9 �')�.2$/5'
�'5(/ �" �"!� �"" �"!�4"
2���� � 3� 3�� 3��
�������� ���� � � 3 3
0�&�� � � � �
���� ����� ���� � � 3� 3�
5���� �#���� � � �� ��
'�� ���� ��& $���� �"���� � � 3� 3�
��-6������� �"���� � � 3� 3�
7���& ����� � �� � 3 �
8�/�� 3�� 3�� 3��� 3
9���/�� 7���� �� 3�� 3�� 3��� 3���
9����� 9���/ ��&
"��#� ��,�� 7���� � � �� ��
���� &,��/& �������� � �� ��� ��
!,��/��� %���& � 3� �� ��
!,��/��� %���&
:���&��� 2���� � �
!,��/& %���& 3� 3� 3�� 3��
������ 2�������& -� ������� "��# ;�� ������
$���� !��� �� ���6��� �,���� ����& �� �� 4 ���4 ��& ��� � $����, ,���� ��&���� ��
�#/����� ���#�� /��&���� �� &"��& �����&��� �� �� ;�� >�����? ����&��& 0�&������� =��& 2�����"�������
>�0=2? �������� C���#��4 "��E� :� ��4D C���#��4 "���4 �����& :� ��4D ��& C���#��4 %��� �� /���4
/�/��&4 /���,&�D $� :/���� �� &"��& �� �� ���&��� -�%� :/���� ��& �#/���� �� � ������ F��-��
�� :/���� &� ��� ��# �� E���

��� ��������������
grow more rapidly than supply. Baseline projections indicate that world fish priceswill rise; demand in developing countries will remain strong, however, because ofincome growth, population growth and urbanization. Similarly, the developedcountry groups will continue to be net importers but less so than during the1990s.
Similar tables are presented for high- and low-value finfish used for food(Tables 7.7 and 7.8, respectively). A comparison of the two tables shows that thecontribution of high- and low-value finfish to the trends discussed in the previousparagraph are quite different. Developing countries as a whole have been and areprojected to remain large net importers of low-value food fish and exporters ofhigh-value finfish. Considering developing countries without China does not sig-nificantly change this pattern. Projections indicate that China and India willbecome significant net exporters of low-value food fish by 2020, and India is like-ly to be a net importer of high-value finfish in 2020.
Crustaceans and mollusks (including squid) are other forms of high-valuefood fish; comparable data for their net exports are presented in Tables 7.9 and
�$%&'� �� �')�' *(+)1�(0�0+(E'/�12+8*�*+(,-.)13��" 4"
�')�' *(+)1�7)2(-1$/,�8')+.�)(/1�/�*+(.'11',�6'52)9 �')�.2$/5'
�'5(/ �" �"!� �"" �"!�4"
2���� � �� 3�� 3��
�������� ���� �� � ��� ���
0�&�� �� �� ��� ��
���� ����� ���� � �� �� ��
5���� �#���� �� ��� ��� ���
'�� ���� ��& $���� �"���� � � �� ��
��-6������� �"���� �� �� �� ��
7���& ����� 3� 3��� 3��� 3���
8�/�� 3��� 3�� 3��� 3 �
9���/�� 7���� �� 3�� 3 � 3��� 3���
9����� 9���/ ��&
"��#� ��,�� 7���� � � 3� 3�
���� &,��/& �������� � � 3�� 3��
!,��/��� %���& ��� �� �� ���
!,��/��� %���&
:���&��� 2���� ��� �� �� ��
!,��/& %���& 3��� 3��� 3 �� 3���
������ 2�������& -� ������� "��# ;�� ������
$���� !��� �� ���6��� �,���� ����& �� �� 4 ���4 ��& ��� 4 ��/���,��� $����, ,���� ��&�6
��� �� �#/����� ;��E� ����#/ /��&���� �� &"��& �����&��� �� �� ;�� >�����? ����&��& 0�&������� =��&
2�����"������� >�0=2? ������� C����#/�4 /��%��4 "��E��D $� :/���� �� &"��& �� �� ���&��� -�%�
:/���� ��& �#/���� �� � ������ F��-�� �� :/���� &� ��� ��# �� E���

��;���D �����������:����������������������;�������������
7.10. The use of weight units in the table belies the high value of these items intrade compared with other fish. The net direction of trade for these categories isalso from developing countries to developed countries. However, changes in nettrade flows are expected through 2020. These will result primarily from rapiddemand growth in some of the developing countries. China is expected to becomea significant net importer of crustaceans by 2020, and Latin America andSoutheast Asia are expected to increase their net exports of crustaceans. Althoughthe conceptual framework does not specifically predict the direction of trade flowsbetween country groups, it seems likely from these results that South–South tradewill account for the majority of the trade in crustaceans in 2020.
Net exports of mollusks (including squid) from the developing to the devel-oped world expanded rapidly in the 1980s and 1990s. Developing countries areprojected to continue to be net exporters of mollusks in 2020 but at a lower annu-
�$%&'� �� �')�' *(+)1�(0�0+'126$)'+�012�*+(,-.)13��" 4"
�')�' *(+)1�7)2(-1$/,�8')+.�)(/1�/�*+(.'11',�6'52)9 �')�.2$/5'�
�'5(/ �" �"!� �"" �"!�4"
2���� 3�� 3�� � �
�������� ���� � 3� �� ��
0�&�� � � � �
���� ����� ���� � � � �
5���� �#���� � � 3� 3��
'�� ���� ��& $���� �"���� � � � �
��-6������� �"���� � � �� ��
7���& ����� 3�� 3�� 3�� 3�
8�/�� � � � �
9���/�� 7���� �� 3 3�� 3�� 3��
9����� 9���/ ��&
"��#� ��,�� 7���� � �� �
���� &,��/& �������� � 3�
!,��/��� %���& 3�� 3� � ���
!,��/��� %���&
:���&��� 2���� � � �
!,��/& %���& 3�� 3 3 � 3��
������ 2�������& -� ������� "��# ;�� ������
$���� !��� �� ���6��� �,���� ����& �� �� 4 ���4 ��& ��� 4 ��/���,��� $����, ,����
��&���� �� �#/����� ;���%��� "��� /��&���� �� &"��& �����&��� �� �� ;�� >�����? &���������& ���&
��& /��&������ &��� �� ��� ���/4 ���"���4 "���%��� "���4 #���������� "���%��� "���4 $�� /���4 /���4 /�)4
��& ����/�� /��&����� $� :/���� �� &"��& �� �� ���&��� -�%� :/���� ��& �#/���� �� � ������ F��-��
�� :/���� &� ��� ��# �� E���

��� ��������������
al amount than at present because of increased domestic consumption within thedeveloping countries themselves. The United States is expected to increase its netimports and Latin America its net exports, while Japan and the European Unionwill likely reduce their net imports significantly.
On balance, fishmeal is a net export of the developing world to the developedworld (Table 7.11). China is a major net importer, and gets most of its supplyfrom Peru—the dominant world exporter. Changes from 1997 to 2020 areexpected to be of similar magnitude and direction to those from 1985 to 1997,with the exception of Japan, which went from being a net exporter of fishmeal in1985 to being a significant net importer in 1997; the picture is likely to remainsimilar in 2020.
�$%&'� �� �()$&�/')�' *(+)1�(0�0((,�0123��" �4" �$/,��#�#
�()$&�/')�' *(+)1 �')�.2$/5'7)2(-1$/,�8')+.�)(/19 7)2(-1$/,�8')+.�)(/19
�.)-$& ;+(C'.)', �.)-$& ;+(C'.)',
�'5(/ �" � �"!� �"" �#�# �"!�4" �"" 4�#�#
2���� 3�� 3�� �� ��� ��� ���
�������� ���� 3��� 3��� �4��� �� �4� � 3���
0�&�� 3�� 3��� ��� ��� ��� ���
���� ����� ���� �� 3� � 3�� �� 3���
5���� �#���� �� �� �4��� �4�� �4��� ���
'�� ���� ��&
$���� �"���� �� 3��� �� 3�� ��� 3�
��-6������� �"���� 3��� 3�4��� 3�� 3��� �4��� 3��
7���& ����� 3�4��� 3 �� 3�4��� 3�4�� 3�� 3���
8�/�� ��� �4��� 3�4��� 3�4��� 3�4�� ���
9���/�� 7���� �� 3�� 3�4��� 3�4��� 3�4��� 3�4��� �
9����� 9���/ ��&
"��#� ��,�� 7���� ��� ��� �� �� �� 3��
���� &,��/&
�������� �4 �4��� �4��� �4��� � � ��
!,��/��� %���& 3� 3�4� � �4��� �4�� �4��� 3�4���
!,��/��� %���&
:���&��� 2���� 3 �� 3��� �4�� �4� � �4�� 3�4���
!,��/& %���& � �4� � 3�4��� 3�4�� 3�4��� �4���
������� ������ &��� �� ��������& -� ������� "��# ;�� �����* /��(������ "�� ���� �� "��# �� -�����
������� �" 0;�A0B� 0<��2= #�&� >8��� ����?�
$���� ������ &��� �� ���6��� �,���� ����& �� �� �4 ���4 ��& ��� 4 ��/���,��� $����, ,����
��&���� �� �#/�����

��;���D �����������:����������������������;������������
������.�����/ 1��?�!���������&���� �����!�������
As discussed in the methodology section of Chapter 4, the baseline model embod-ies a series of possibly controversial assumptions about nonprice-mediated factorslikely to have a strong impact on fisheries to 2020. These are specified in advanceas nonprice assumptions; the model itself focuses on price-mediated responsesover time. The most uncertain of the nonprice assumptions involves the outlookfor marine capture fisheries, but other major uncertainties concern the rate oftechnological progress in fish farming and other factors besides price that couldslow down or speed up the rate of investment in both capture and aquaculturefisheries. Changes in assumptions also affect trade projections through the relativeprice changes they produce. The sensitivity of the net export projections to otherpossible scenarios (defined in Chapter 4) is presented below.
More rapid aquaculture growth increases the net food fish imports of devel-oped countries from developing countries by 32 percent in 2020 compared with
�$%&'� � �')�' *(+)1�(0�252=$&-'�0/0123��" �4" �$/,��#�#
�()$&�/')�' *(+)1 �')�.2$/5'7)2(-1$/,�8')+.�)(/19 7)2(-1$/,�8')+.�)(/19
�.)-$& ;+(C'.)', �.)-$& ;+(C'.)',
�'5(/ �" � �"!� �"" �#�# �"!�4" �"" 4�#�#
2���� �� ��� ��� �� ��� 3���
�������� ���� �� ��� ��� ��� �� 3���
0�&�� �� �� �� 3�� � 3��
���� ����� ���� ��� � �� � � 3���
5���� �#���� ��� �� �4��� �4��� �4� � ��
'�� ���� ��& $���� �"���� � � �� �� ��� 3�
��-6������� �"���� 3��� 3��� �� � ��� 3���
7���& ����� 3�4��� 3��� 3��� 3�4��� 3��� 3���
8�/�� 3��� 3�4�� 3�4� � 3�4��� 3�4��� � �
9���/�� 7���� �� 3�4��� 3�4��� 3�4��� 3�4�� 3�4��� ���
9����� 9���/ ��&
"��#� ��,�� 7���� 3��� 3 �� 3��� 3��� �� 3���
���� &,��/&
�������� �4� �4��� �4��� �4�� � ���
!,��/��� %���& ��� �4� �4 �4��� �4��� 3���
!,��/��� %���&
:���&��� 2���� � �4�� �4��� �4��� �4�� 3��
!,��/& %���& 3��� 3�4� 3�4 3�4��� 3�4��� ���
������� ������ &��� �� ��������& -� ������� "��# ;�� �����* /��(������ "�� ���� �� "��# �� -�����
������� �" 0;�A0B� 0<��2= #�&� >8��� ����?�
$���� ������ &��� �� ���6��� �,���� ����& �� �� �4 ���4 ��& ��� 4 ��/���,��� $����, ,����
��&���� �� �#/�����

��! ��������������
baseline projections; the net effects on trade in terms of total food fish (includingcrustaceans and mollusks) are shown in Table 7.12, while the same informationfor low-value food fish is contained in Table 7.13. As discussed in Chapter 4, theprice impact of this scenario change is to lower world prices for low-value food fishin 2020 by 12 percent below current real levels, whereas they rise in the baselineby 6 percent over current levels (Table 4.2). Prices for high-value fish items (exceptmollusks) increase, but less so than under the baseline. Prices for fishmeal and fishoil shoot up three times faster than in the baseline. Food fish production (seeChapter 4) increases globally by 11 percent over the baseline result, broadly led bydeveloping countries in percentage terms.
Net food fish imports into Sub-Saharan Africa triple under this faster aqua-culture growth scenario because of the fall in the real and relative world prices oflow-value fish. The matching expansion in food fish exports comes from Chinaand India (both up by a factor of three), and lesser increases from Southeast Asia
�$%&'� �! �')�' *(+)1�(0�&(6=$&-'�0((,�0123��" �4" �$/,��#�#
�()$&�/')�' *(+)1 �')�.2$/5'7)2(-1$/,�8')+.�)(/19 7)2(-1$/,�8')+.�)(/19
�.)-$& ;+(C'.)', �.)-$& ;+(C'.)',
�'5(/ �" � �"!� �"" �#�# �"!�4" �"" 4�#�#
2���� 3��� 3 �� 3�� �� �� �4���
�������� ���� 3��� 3�� 3�� 3� �� 3���
0�&�� 3�� 3�� 3�� ��� ��� ���
���� ����� ���� 3�� 3� � 3�� 3��� � 3���
5���� �#���� 3��� 3� � 3�� 3�� 3� 3��
'�� ���� ��& $���� �"���� 3�� 3��� 3��� 3 �� ��� 3���
��-6������� �"���� 3��� 3�4�� 3��� 3�� � 3���
7���& ����� ��� �� ��� ��� �� ��
8�/�� ��� �4��� ��� �� 3�4�� �
9���/�� 7���� �� ��� 3� ��� ��� ��� ��
9����� 9���/ ��&
"��#� ��,�� 7���� ��� � �4�� �4�� �� �
���� &,��/&
�������� �� � � � � ��� ��� 3��
!,��/��� %���& 3�4��� 3�4��� 3�4��� 3�4��� �4 � 3���
!,��/��� %���&
:���&��� 2���� 3�4�� 3�4�� 3�4�� 3�4��� �4 �� 3�4���
!,��/& %���& �4��� �4��� �4��� �4��� 3�4 � ���
������� ������ &��� �� ��������& -� ������� "��# ;�� �����* /��(������ "�� ���� �� "��# �� -�����
������� �" 0;�A0B� 0<��2= #�&� >8��� ����?�
$���� ������ &��� �� ���6��� �,���� ����& �� �� �4 ���4 ��& ��� 4 ��/���,��� $����, ,����
��&���� �� �#/�����

��;���D �����������:����������������������;������������"
and West Asia and North Africa. The main trade-related result of this scenario isto promote production and export of low-value food fish from aquaculture inSouth and East Asia, and to increase fish consumption in Africa.
The net impact on world trade projections of introducing the assumptionsabout lower Chinese marine fish catches (the lower China production scenario) isminimal. The effects are mostly within China, and this is primarily because of thedownward adjustments in Chinese consumption figures in the model scenario dis-cussed in Chapter 4. However, relative world prices in this scenario are somewhathigher than under the baseline, mostly for crustaceans and high-value finfish, andthis leads to a 6 percent overall decline in net food fish imports into developedcountries from developing countries, as compared with baseline scenario projections.
More pessimistic assumptions about the rate of nonprice-induced investmentin aquaculture, as in the slower aquaculture expansion scenario, have more signif-
�$%&'� �" �')�' *(+)1�(0�.+-1)$.'$/13��" �4" �$/,��#�#
�()$&�/')�' *(+)1 �')�.2$/5'7)2(-1$/,�8')+.�)(/19 7)2(-1$/,�8')+.�)(/19
�.)-$& ;+(C'.)', �.)-$& ;+(C'.)',
�'5(/ �" � �"!� �"" �#�# �"!�4" �"" 4�#�#
2���� ��� �� 3� � 3�� 3���
�������� ���� ��� ��� ��� � �� ���
0�&�� � �� ��� ��� � 3��
���� ����� ���� �� �� �� ��
5���� �#���� ��� ��� ��� ��� �� ���
'�� ���� ��& $���� �"���� � � � 3�� 3� 3��
��-6������� �"���� � �� � � �� ��
7���& ����� 3� 3� � 3��� 3��� 3��� 3��
8�/�� 3��� 3� � 3 �� 3��� 3��� �
9���/�� 7���� �� 3��� 3��� 3�� 3��� 3��� �
9����� 9���/ ��&
"��#� ��,�� 7���� � �� �� � �� ��
���� &,��/& �������� �� ��� ��� ��� ���
!,��/��� %���& � � � �4� � �4� ��� 3��
!,��/��� %���&
:���&��� 2���� ��� �� �4��� �4 � ��� ���
!,��/& %���& 3� � 3 � 3�4� � 3�4� 3��� ��
������� ������ &��� �� ��������& -� ������� "��# ;�� �����* /��(������ "�� ���� �� "��# �� -�����
������� �" 0;�A0B� 0<��2= #�&� >8��� ����?�
$���� ������ &��� �� ���6��� �,���� ����& �� �� �4 ���4 ��& ��� 4 ��/���,��� $����, ,����
��&���� �� �#/�����

��# ��������������
icant impacts on world production and trade in food fish. (As described inChapter 4, this scenario leads to across-the-board real price increases in the rangeof 20–25 percent for food fish items.) The main difference under this scenario isin low-value food fish, for which the real price increase is projected to be 25 per-cent rather than the 6 percent under the baseline. World food fish consumptiondeclines 9 percent in 2020 compared with baseline projections, and well over halfof the total decrease is concentrated in developing-country consumption of low-value food fish. Net imports of total food fish into developed countries from devel-oping countries fall 5 percent relative to the baseline results, and low-value foodfish exports from developed to developing countries increase somewhat.
The extreme pessimism underlying the ecological collapse scenario has realprices of high-value finfish and crustaceans rising approximately 70 percent rela-tive to current world prices, low-value food fish prices rising 35 percent, and fish-meal and oil prices rising about 128 and 134 percent, respectively, to 2020. Theeffect on world food fish trade is similarly drastic, with net exports from develop-
�$%&'� ��# �')�' *(+)1�(0�8(&&-1>13��" �4" �$/,��#�#
�()$&�/')�' *(+)1 �')�.2$/5'7)2(-1$/,�8')+.�)(/19 7)2(-1$/,�8')+.�)(/19
�.)-$& ;+(C'.)', �.)-$& ;+(C'.)',
�'5(/ �" � �"!� �"" �#�# �"!�4" �"" 4�#�#
2���� 3�� �� ��� �� ��� ��
�������� ���� �� ��� �� 3 � �� 3���
0�&�� � �� � �� �
���� ����� ���� � � � 3�
5���� �#���� � ��� �� ��� ��� ��
'�� ���� ��& $���� �"���� �� �� �� � �� 3�
��-6������� �"���� � �� �� 3 3�� 3��
7���& ����� 3� 3��� 3��� 3��� �� 3���
8�/�� 3�� 3��� 3�� 3� 3��� ���
9���/�� 7���� �� 3�� 3��� 3��� 3 � 3��� ��
9����� 9���/ ��&
"��#� ��,�� 7���� 3� �� 3� 3�� 3�� 3��
���� &,��/& �������� �� � �� ��� 3�� ��
!,��/��� %���& ��� �� �4�� �� ��� 3���
!,��/��� %���&
:���&��� 2���� ��� �� ��� ��� 3���
!,��/& %���& 3��� 3�� 3�4�� 3�� 3��� ���
������� ������ &��� �� ��������& -� ������� "��# ;�� �����* /��(������ "�� ���� �� "��# �� -�����
������� �" 0;�A0B� 0<��2= #�&� >8��� ����?�
$���� ������ &��� �� ���6��� �,���� ����& �� �� �4 ���4 ��& ��� 4 ��/���,��� $����, ,����
��&���� �� �#/�����

��;���D �����������:����������������������;�������������
ing to developed countries projected at only one-tenth the level forecast under thebaseline scenario. The negative impact on food fish production is concentrated indeveloping countries and primarily in the high-value finfish and crustacean sec-tors. The ecological collapse scenario has a much higher relative impact on aggregate world food fish trade than on world food fish consumption. This isbecause higher prices induce increased aquaculture production, and effects are feltdisproportionately at the higher-value end of the fisheries sector.
Reduction fish amount to about a quarter of all fish produced and a third ofcapture fisheries production. The sensitivity of fishmeal trade to different scenar-ios is shown in Table 7.14. Net fishmeal exports primarily originate in Chile andPeru, and Asian countries (China, Japan, and Taiwan) are dominant importers.Chinese net imports under the baseline scenario are equivalent to 17 percent offorecast world production in 2020. On the whole, developed countries are pro-jected to be net importers of fishmeal, equivalent on a net basis to 9 percent offorecast world production. Fishmeal prices are very sensitive to the faster aquacul-
�$%&'� ��� �')�' *(+)1�(0�0128'$&3��" 4" �$/,��#�#
�()$&�/')�' *(+)1 �')�.2$/5'7)2(-1$/,�8')+.�)(/19 7)2(-1$/,�8')+.�)(/19
�.)-$& ;+(C'.)', �.)-$& ;+(C'.)',
�'5(/ �" � �"!� �"" �#�# �"!�4" �"" 4�#�#
2���� 3��� 3��� 3�4��� 3�4�� 3��� 3�
�������� ���� � �� 3� � 3� 3�� 3��
0�&�� � � 3� 3�� 3� 3��
���� ����� ���� �� 3� 3� 3�� 3� 3��
5���� �#���� �� �4� �4��� �4��� �� ���
'�� ���� ��& $���� �"���� 3 � 3��� 3�� 3��� � 3�
��-6������� �"���� 3� 3� �� � �� �
7���& ����� 3�� 3��� �� �� �� �
8�/�� 3�� �� 3� � 3��� 3��� ��
9���/�� 7���� �� 3� 3��� 3��� 3��� �� ��
9����� 9���/ ��&
"��#� ��,�� 7���� 3��� 3� � 3��� 3�� ���
���� &,��/& �������� �� �� � 3��� 3��
!,��/��� %���& � � ��� �� �� 3 � 3���
!,��/��� %���&
:���&��� 2���� �� �4��� �4�� �4��� ��� ���
!,��/& %���& 3� � 3��� 3�� 3 �� � ���
������� ������ &��� �� ��������& -� ������� "��# ;�� �����* /��(������ "�� ���� �� "��# �� -�����
������� �" 0;�A0B� 0<��2= #�&� >8��� ����?�
$���� ������ &��� �� ���3��� �,���� ����& �� �� 4 ���4 ��& ��� 4 ��/���,��� $����, ,����
��&���� �� �#/�����

��� ��������������
ture expansion scenario (rising 42 percent) and the increased fishmeal efficiencyscenario (falling 16 percent). The impact of scenario change on developing-coun-try net fishmeal exports is in the range of a 10 percent increase if investment inaquaculture is higher than under the baseline, and a decrease of 13–14 percentunder increased efficiency or ecological collapse.
"�1 ���%���"*($"(��$ �(�%#��()(-%1"#�
�%&#�$"(
The analysis of past and projected trade trends for fisheries products suggests thatthe fisheries sector has become of critical importance to developing countries. Thiswill remain the case over time, raising the issue of the net impacts of fisheriesgrowth on developing countries, both at the macro level and directly on the poor.This issue is not fully resolved at the present time because comprehensive studies
�$%&'� ��� �()$&�*+(C'.)',�/')�' *(+)1�(0�0((,�012�-/,'+�$+(-1���;����
1.'/$+(13��#�#
�()$&�*+(C'.)',�/')�' *(+)1�7)2(-1$/,�8')+.�)(/19
�(1) �$1)'+ �(6'+ �128'$& �&(6'+&>'&? $<-$.-&)-+' �2/$ $/,�012�(& $<-$.-&)-+' �.(&(5.$&
�'5(/ 7%$1'&/'9 ' *$/1(/ *+(,-.)(/ '00.'/.? ' *$/1(/ .(&&$*1'
2���� ��� �4 � �� � � 3 �� �4���
�������� ���� �� ��� ��� ��� ��� 3
0�&�� ��� �4� � �� ��� 3��� ���
���� ����� ���� 3�� �� 3��� 3��� 3�� 3���
5���� �#���� �4�� �4��� �4��� �4� � �4�� �4���
'�� ���� ��&
$���� �"���� 3�� 3 � 3��� 3��� 3�� 3 ��
��-6������� �"���� 3��� 3�4��� 3��� 3��� ��� 3�4� �
7���& ����� 3�4�� 3�4 �� 3�4� � 3�4�� 3�4� 3 �
8�/�� 3�4��� 3�4��� 3�4��� 3�4�� 3�4��� 3�4��
9���/�� 7���� �� 3�4��� 3�4��� 3�4�� 3�4��� 3�4��� 3�4���
9����� 9���/ ��&
"��#� ��,�� 7���� �� 3�� ��� �� ��� ���
���� &,��/&
�������� �4��� �4�� �4�� �4� � �4�� �4��
!,��/��� %���& �4�� �4 �� �4��� �4 �� �4�� ���
!,��/��� %���&
:���&��� 2���� �4� � �4�� �4�� �4��� �4� 3�4���
!,��/& %���& 3�4�� 3�4 �� 3�4��� 3�4 �� 3�4�� 3���
������ ���(������ "�� ���� �� "��# 0;�A0B� 0<��2= #�&� >8��� ����?�
$��� � =�-� ��� "�� ������� &����/������

��;���D �����������:����������������������;�������������
of the impact of rising fisheries exports on welfare in developing countries largelyremain to be done. This section pinpoints some relevant issues and examines theprimarily anecdotal evidence available.
"���!������������ ��!���/ 1�������
Over the years, developing countries (particularly in Asia) have imported starchyfood staples from developed countries and exported fish in return. As mentionedabove, the contribution of low-income food deficit countries to world fish exportswas about 20 percent in the year 2000, and the equivalent of 50 percent of theirimport bill for food was paid by receipts for fish exports. Similarly, the contribu-tion of Asian countries to world fish exports is around 32 percent, and these coun-tries as a group earned enough foreign exchange from fish to finance 34 percentof their food imports in the year 2000 (FAO 2001b). This experience is not lim-ited to China and India; in 1966, 12 developing countries had more than the
�$%&'� ��� ;+(C'.)',�/')�' *(+)1�(0�&(6=$&-'�0((,�012�-/,'+�$+(-1
��;����1.'/$+(13��#�#
;+(C'.)',�/')�' *(+)1�7)2(-1$/,�8')+.�)(/19
�(1) �$1)'+ �(6'+ �128'$& �&(6'+&>'&? $<-$.-&)-+' �2/$ $/,�012�(& $<-$.-&)-+' �.(&(5.$&
�'5(/ 7%$1'&/'9 ' *$/1(/ *+(,-.)(/ '00.'/.? ' *$/1(/ .(&&$*1'
2���� �� �4�� �4�� ��� � �4��
�������� ���� 3� 3 � 3��� 3�� 3 �� 3�4��
0�&�� ��� �4��� ��� ��� 3��
���� ����� ���� 3��� 3��� 3� 3��� 3��� 3���
5���� �#���� 3�� 3�4�� 3��� 3��� 3 �� 3�4���
'�� ���� ��&
$���� �"���� 3 �� 3�4��� 3�� 3�� 3��� 3���
��-6������� �"���� 3�� 3�4��� 3� � 3��� � 3�4��
7���& ����� ��� �� �� ��� ��� ���
8�/�� �� ��� ��� ��� ��� ���
9���/�� 7���� �� ��� �� �� ��� ��� 3��
9����� 9���/ ��&
"��#� ��,�� 7���� �4�� �4��� �4�� �4��� �4��� ��
���� &,��/&
�������� ��� ��� ��� ��� �� ���
!,��/��� %���& 3�4��� 3�4��� 3�4��� 3�4�� 3�4 �� 3�4���
!,��/��� %���&
:���&��� 2���� 3�4��� 3�4�� 3�4�� 3�4� � 3�4 �� 3�4���
!,��/& %���& �4��� �4��� �4��� �4�� �4 �� �4���
������ ���(������ "�� ���� �� "��# 0;�A0B� 0<��2= #�&� >8��� ����?�
$��� � =�-� ��� "�� ������� &����/������

��� ��������������
equivalent of $30 million (1995 constant dollars) in fish exports per year. By 1997,47 developing countries were surpassing that benchmark (FAO 2001b).
"���!������"�!���������(�� ������
The adoption of both pond aquaculture and intensive commercial aquaculture hasbeen widespread in Asia. Assessing the net impact of these developments onhousehold incomes is complex. First, direct incremental income accrues to thehouseholds of farmers who operate a fish pond, and additional subsistence incomeresults from consuming one’s own fish, rather than having to buy it. Then, bothlandless laborers working in small-scale fish farming and employees of commercialestablishments receive income from fisheries employment. Further, associatedindustries stimulated by the rise of fish farming and capture fisheries also provideincomes. Aquaculture has backward linkages to hatcheries, nurseries, seed gather-ing, reduction fish harvest, feed milling, and input distribution systems (Lewis,
�$%&'� ��� ;+(C'.)',�/')�' *(+)1�(0�0128'$&�-/,'+�$+(-1���;����
1.'/$+(13��#�#
;+(C'.)',�/')�' *(+)1�7)2(-1$/,�8')+.�)(/19
�(1) �$1)'+ �(6'+ �128'$& �&(6'+&>'&? $<-$.-&)-+' �2/$ $/,�012�(& $<-$.-&)-+' �.(&(5.$&
�'5(/ 7%$1'&/'9 ' *$/1(/ *+(,-.)(/ '00.'/.? ' *$/1(/ .(&&$*1'
2���� 3�4�� 3�4��� 3�4�� 3��� 3�4��� 3�4���
�������� ���� 3� 3 �� 3�� 3� � 3��� 3���
0�&�� 3�� 3�� 3�� 3�� 3�� 3��
���� ����� ���� 3�� 3�� 3� 3�� 3�� 3��
5���� �#���� �4��� �4� �4��� �4�� �4 �� �4���
'�� ���� ��&
$���� �"���� 3��� 3��� 3�� 3��� 3��� 3��
��-6������� �"���� � �� �� �� �� ��
7���& ����� �� � � �� ��
8�/�� 3��� 3��� 3��� 3��� 3�� 3��
9���/�� 7���� �� 3��� 3��� 3��� 3�� 3�� 3���
9����� 9���/ ��&
"��#� ��,�� 7���� 3�� 3��� 3��� 3��� 3�� 3
���� &,��/&
�������� 3�� �� �� � �
!,��/��� %���& �� � �� � � � ���
!,��/��� %���&
:���&��� 2���� �4��� �4�� �4��� �4��� �4� � �4���
!,��/& %���& 3 �� 3 � 3�� 3� � 3 � 3���
������ ���(������ "�� ���� �� "��# 0;�A0B� 0<��2= #�&� >8��� ����?�
$��� � =�-� ��� "�� ������� &����/������
��;���D �����������:����������������������;�������������
Wood, and Gregory 1996), while capture fisheries have backward linkages to boat-building, gear supply, and so on. Both fisheries sectors have forward linkages topostharvest handling, processing, and marketing, all of which absorb significantamounts of labor.
Finally, and probably most importantly in low-income countries in the earlystages of development, aquaculture and capture fisheries give rise to consumptiongrowth linkages that occur when incomes from production of a tradable good(such as fish) create additional income in rural areas with underemployedresources (typically labor). The net additions to income from fish sales are thenlargely spent as net increments to local consumer demand in rural areas with loweffective demand for services and local goods that under-employed local resourcescan supply. In rural Africa, this increased spending by poor consumers has beenshown to provide an additional increment to local income through re-spending ofthe initial income injection that is at least as large as the initial sales of tradableitems that started the process (Delgado, Hopkins, and Kelly 1998). In otherwords, if fish can be produced and sold outside an isolated local area, the netincome benefit to the area may be more than twice the value of the fish sales.
Evidence on the impact of fisheries on household income is anecdotal at best,relying either on estimates of the numbers of persons involved, or a few relativelysmall case studies. In terms of the former, the FAO has estimated that the num-ber of fishers worldwide doubled between 1970 and 1990, compared with a 35percent increase in the economically active farm population over the same period(FAO 1997c). Most of the growth occurred in Asia, where around 80 percent ofthe world’s fishers and fish farmers live, according to the study. The total numberof fish farmers and fishers for whom fishing was the primary income source wasestimated at 28.5 million workers in 1990. If similar growth in fishing occurredin the 1990s, the comparable number for 2003 would be approximately 40 mil-lion. If allowance is made for the people employed in associated industries, or whoderive significant income from the local expenditure of fishers, it does not seemfarfetched to estimate that somewhere between 60 and 100 million workers derivetheir incomes from the fisheries sector at the present time. With dependents, it isconjectured that well over 200 million persons are thus dependent on fisheries fortheir livelihoods at the present time, overwhelmingly in Asia and overwhelminglyamong the poor.
Even by the standards of developing countries, landless fish workers and arti-sanal fishermen are among the poorest of people in many cases (Kent 1998;Ahmed and Lorica 2002). Employment in capture fisheries on boats belonging toothers is traditionally a refuge from unemployment in other sectors, in both devel-oping and developed countries. Exclusion from the capture sector is therefore aparticularly disturbing prospect for the poor in developing countries, who are

��� ��������������
often landless, without much formal schooling, without other potential sources oflivelihood, and without the social safety nets more prevalent in richer countries.This raises the question of whether a rising aquaculture sector in developing coun-tries can play a significant role in creating new livelihoods.
In this context, how has the rise of fish demand and trade affected householdincomes in developing countries? A particularly careful case study of the issue—controlling for the various factors affecting overall household income and nutri-tion—was conducted in Bangladesh by Bouis (2000), investigating the impact ofseveral schemes for promoting more intensified pond aquaculture. He found onlymodest overall net increases in household incomes from aquaculture activities butconsiderable potential for further increases with intensification. In a five-countrysurvey of Asia in the 1990s, an external team reporting to the FAO found thatrates of return over variable costs in pond aquaculture were 150 to 200 percent inthe study countries (FAO 2001c). Overall additions to farm income thus dependon the opportunity costs of land and other fixed factors. Since even semi-intensivepond aquaculture is typically less labor-intensive than rice production in Asia,shifts of resources from rice cultivation into fish farming could lead to a reductionin demand for labor from landless people.
The overall picture that emerges in Asia is of a modestly profitable fish farm-ing activity for small land-owners at low levels of intensification, uncertainty forlandless laborers (whose position is shaky in any event as the relative profitabilityof rice farming declines), and a potentially highly profitable commercial activityfor capital-intensive larger-scale operations with access to natural resources. Theissue of the economic viability of sustainable intensification of small-scale, morecapital-intensive, aquaculture under developing-country conditions has yet to bedemonstrated or even fully examined (see Chapter 6).
Another way that the rise of fisheries trade might affect household incomes indeveloping countries is through increases in subsistence consumption of own-produced fish, both as a side effect of increased production and through its effecton the prices of food fish to poor consumers. Finally, trade may displace poor peo-ple from traditional fishing livelihoods if competition for natural resources drivesthem out of business. These possibilities are considered later in this chapter.
"���!������*�����#���������
Fish trade influences nutrition in developing countries by affecting income (asseen above), increasing the intake of micronutrient-rich foods and dense calories,and influencing relative fish prices, which potentially changes the diet and henceoverall nutrient intake of the poor.
Fish provides high-quality, easily absorbable protein and a wide variety of vita-mins and minerals, including phosphorus, magnesium, selenium, and iodine

��;���D �����������:����������������������;������������
(from marine fish) (Thilsted, Roos, and Hassan 1997). Even a small amount offish is an important dietary supplement for poor people who cannot easily affordanimal protein, and who mainly rely on starch diets. According to the FAO(1997c), fish provides over 7 percent of animal protein in North and CentralAmerica, more than 9 percent in Europe, over 17 percent in Africa, 26 percent inAsia, and 22 percent in low-income food deficit countries, including China.
Humans extract higher amounts of minerals by weight from small fish com-pared with meat and large fish because the bones of small fish are easily consum-able (Thilsted, Roos, and Hassan 1997). Thus, the traditional practice in much ofAsia of the consumption of whole small fish is especially important to people withnutrient deficiencies. Surveys conducted in Bangladesh suggest that small fish con-tinue to contribute larger portions of vitamin A, calcium, iron, and zinc to thediets of the rural poor than big fish (Thilsted, Roos, and Hassan 1997).
Bouis (2000), in evaluating the impact of small pond fish farming on nutri-ent intakes in Bangladesh, found that households adopting improved technologiesfor fish farming consumed the same weight of fish as previously—but in largerfish, leading to possible nutrient loss. More strikingly, Bouis found that for givenincome levels, fish farming households did not consume more fish than their non-fish farming counterparts but rather purchased half to two-thirds of the fish theyconsumed. The Bangladesh case suggests that the impact of fish trade on the pricesof small fish is likely to be the key to its impact on the nutrition of the poor. Low-value fish has traditionally accounted for a disproportionately high share of the lowamount of animal protein consumption by the poor in developing countries (Kent1998).
"���!����������1��!���/ ��������1�������������
In his study zone in the late 1990s, Bouis (2000) reported that real fish prices hadat least doubled over the previous 25 years, and the relative price to meat and veg-etables had increased 50 to 75 percent. The export unit values and price series discussed in Chapter 3 suggest that on world markets, fish has become more expen-sive relative to other food items over the past 30 years, if only because real fish priceshave not fallen, while the price of meat is half what is was in the early 1970s.
Firm prices for most fish items cannot be “blamed” on trade alone; both fishprices and trade are responding to fish demand outstripping fish supply. Thisdemand is growing primarily in the developing countries themselves, as shownhistorically in Chapter 3 and in future projections to 2020. Nonetheless, it seemsat least possible that the increasing globalization of fisheries and the rise of high-end fish exports (like shrimp) from poor countries is raising the price of low-valuefood fish beyond what it would otherwise be, through resource substitutions inproduction. Under increasingly interlinked world markets, this will tend to hap-

��! ��������������
pen regardless of whether a given country or region is heavily involved in exportproduction, because domestic prices will increasingly reflect regional and globalprices. Furthermore, within developing countries, it seems reasonable to believethat rising urban demand by wealthier people will divert some local food fish pro-duction away from consumption by the poor, through rising relative fish prices.
As argued in Chapter 6, the rise of high-value aquaculture will probably notreduce the supply of food fish for the poor by 2020, both because of substitutionout of fishmeal in terrestrial livestock and because of the separate fisheries involvedin low-value food fish and reduction fish. Nonetheless, the huge real price increas-es for fishmeal and fish oil projected to 2020 under the faster aquaculture expan-sion scenario make it conceivable that fishmeal and fish oil prices could rise suffi-ciently for entrepreneurs to begin processing the food fish of the poor into fish-meal. In fact, anecdotal evidence suggests this has already occurred in some arti-sanal fisheries such as the omena fishery in Lake Victoria (Abila and Jansen 1997).The rising cost of low-value food fish to the poor in the present, and the potentialfor further relative rises in the future, are real policy concerns.
"���!������$�����!��&���������������� ���
It is likely that the combination of high incentives for production, a weak regula-tory environment, and the meteoric rise of aquaculture in developing countrieshave created conditions ripe for environmental degradation of the type discussedin Chapter 5. Lucrative trade markets for high-value commodities such as shrimphave induced large-scale aquaculture development along coastlines in LatinAmerica and Southeast Asia, often with severe environmental impacts. In addi-tion, public health issues have arisen from the use of polluting chemicals and theconcentration of toxic agents in fish from intensive aquaculture operations (FAO2002d). Public health issues surrounding fish consumption have direct impacts ontrade, in that exporting countries will increasingly have to meet consumerdemands for food safety in importing countries.
Ultimately, these conditions will have to be dealt with through legislative andadministrative processes in the developing countries themselves. This has begun tohappen in India and Thailand, as constituencies that benefit from fisheries tradehave joined with other interest groups to help ensure the sustainability of aquacul-ture development. In the shorter term, rising market premiums for seafood prod-ucts in Europe and Japan that are certifiable as having been sustainably producedmay create incentives for changing behavior in the commercial fisheries sector. Acase in point is the demonstrated desire of many fish processors and retailers indeveloped countries to have Marine Stewardship Council certification for theirseafood products shipped from all over the world (Roheim 2002). Although sup-port for eco-labeling has been strong in the maritime industries, it has neither been

��;���D �����������:����������������������;������������"
universal nor unconditional. Furthermore, some producers from developing coun-tries have taken the position that eco-labeling in the OECD countries will dis-criminate against producers from developing countries, where the costs of certifi-cation are seen as too steep for any one association to bear. Other concerns in thecommercial sector have arisen from rising retentions at the borders of rich import-ing countries on health grounds—because of chloraphenicol residues in shrimp,for example (WorldCatch 2002)—causing losses in developing countries.Together, these concerns are providing incentives for developing countries toenforce health and environmental regulations, and possibly also to rein in small-scale producers, as is discussed below.
$""#��� $$"($��%�(=1%$���$%���()(-%1"#�
�%&#�$"(
The relevance of this issue in the context of this book is to consider whether therapid rise in fish trade from the South to the North is likely to continue. The pri-mary reason for projecting decreasing net exports of fish from developing to devel-oped countries is that the swelling ranks of the middle class in developing coun-tries will increasingly wish to consume local high-value fisheries items themselves.Nonetheless, other rapidly occurring factors are also affecting fish imports intodeveloped-country markets and could be an increasing issue for developing-coun-try exporters. Even as trade liberalization in the sense of tariff reduction hasoccurred, nontariff barriers of various sorts have arisen. The net effect of the latter—as is discussed later in this chapter—may be more to displace traditionalsmall-scale fishers in developing countries than to block developing-countryexports.
����//�������.� �����������.� ������������������������//
(�!� �����
The General Agreement on Tariffs and Trade (GATT) era under the Uruguayround of trade negotiations culminated in the launch of the World TradeOrganization in late 1994 and the signing of the associated Sanitary and Phyto-Sanitary Agreements (SPS) early in 1995, just as world trade in fish was reachingits highest point to date. Two significant events with respect to fisheries were thecommitment to reduce fish tariffs and the attempt to subject health-justifiedrestrictions on trade to a predictable set of rules. In fact, tariffs on primary fishcommodities have declined significantly in developed countries and havedecreased even in the developing countries of Asia, where they were previouslymuch higher than in developed countries (Tables 7.15 and 7.16).
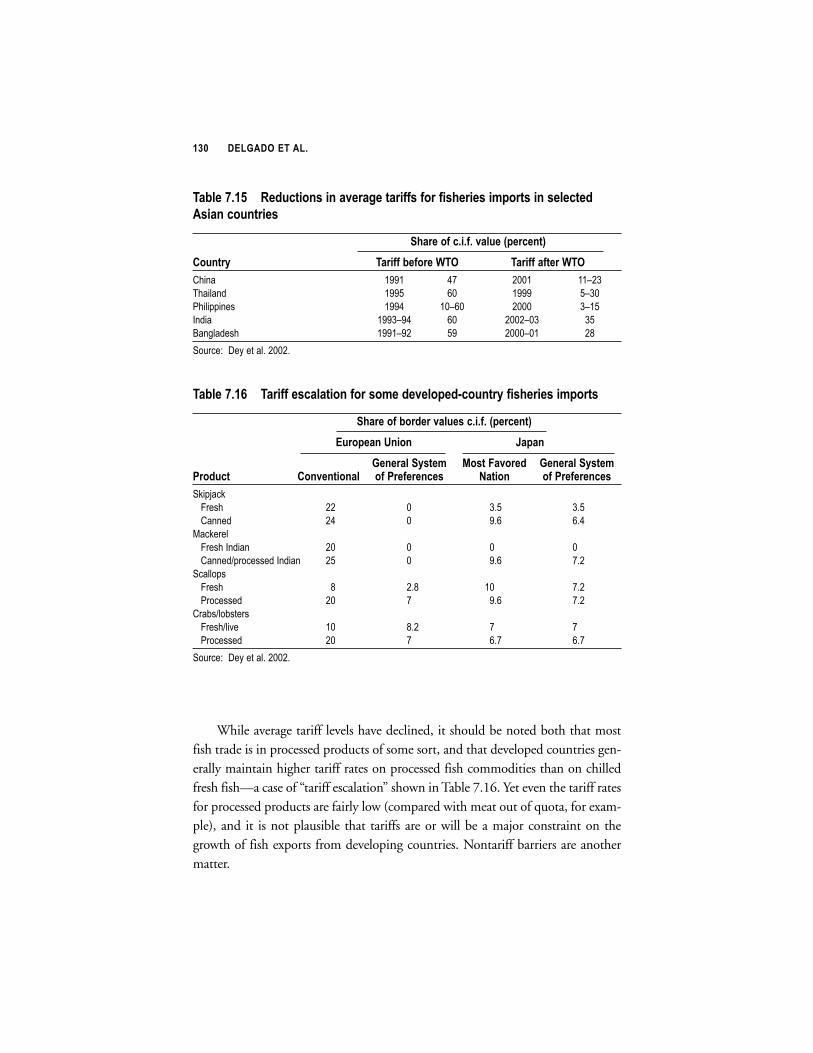
��# ��������������
While average tariff levels have declined, it should be noted both that mostfish trade is in processed products of some sort, and that developed countries gen-erally maintain higher tariff rates on processed fish commodities than on chilledfresh fish—a case of “tariff escalation” shown in Table 7.16. Yet even the tariff ratesfor processed products are fairly low (compared with meat out of quota, for exam-ple), and it is not plausible that tariffs are or will be a major constraint on thegrowth of fish exports from developing countries. Nontariff barriers are anothermatter.
�$%&'� ��� �',-.)(/1�/�$'+$5'�)$+001�0(+�012'+'1�8*(+)1�/�1'&'.)',
�1$/�.(-/)+'1
�2$+'�(0�.��0��$&-'�7*'+.'/)9�
�(-/)+? �$+00�%'0(+'���� �$+00�$0)'+����
2���� ���� � ���� ��3��
=������& ���� �� ���� �3��
�����//��� ���� ��3�� ���� �3��
0�&�� ����3�� �� ����3�� ��
+�����&�� ����3�� �� ����3�� �
������ !� � ��� �����
�$%&'� ��� �$+00�'1.$&$)(/�0(+�1(8'�,''&(*',=.(-/)+?�012'+'1�8*(+)1
�2$+'�(0�%(+,'+�$&-'1�.��0��7*'+.'/)9
�-+(*'$/��/(/ B$*$/
�'/'+$&��?1)'8 �(1)��$(+', �'/'+$&��?1)'8;+(,-.) �(/'/)(/$& (0�;+'0'+'/.'1 �$)(/ (0�;+'0'+'/.'1
�)�/(��)
;��� �� � ��� ���
2���& �� � ��� ���
<��)��
;��� 0�&��� �� � � �
2���&1/�����& 0�&��� �� � ��� ��
������/�
;��� �� �� ��
������& �� ��� ��
2��-�1��-����
;���1��, �� ��
������& �� �� ��
������ !� � ��� �����
��!���!� @ �������@ ����%�����#������// �����������������
Concerns in electorates about food safety and environmental sustainability haveprovoked major fish importing countries to introduce institutional innovations forcontrolling trade in fisheries items, including SPS measures; better process-basedprocedures for ensuring food safety, such as Hazard Analysis and Critical ControlPoints (HACCP) plans; and labeling requirements. On one hand, these measuresare legitimate responses to the concerns of electorates, but on the other, manybelieve them to be protective. In any event, they are expected to become morestringent in the future.
Concerns about heavy metals and other contaminants in ocean-caught fishhave been rising. California recently required supermarkets to post warnings thatsmall children and women of child-bearing age should not eat swordfish, shark,king mackerel, and tilefish (Fiorillo 2003). The primary concern is mercury, butcadmium, arsenic, thallium, zinc, and polychlorinated biphenyls (PCBs) fromindustrial waste are also worrisome, as is rainfall bearing pollutants from industri-al smoke emissions. Heavy metals and chemical residues tend to collect over timein the oily tissues of large predators. Worried consumers are found in developingcountries as well as in the North. A research team from the Chinese University ofHong Kong linked high blood levels of mercury from high seafood consumptionto infertility in 150 Hong Kong couples (BBC News 2002). A recent study inThailand found that 6 out of 10 samples of shark’s fin examined had concentra-tions of mercury above the limit for safe human consumption (BBC News 2002).
As in the case of wild fish, heavy metals and PCBs can also affect farmedsalmon through fishmeal derived from waters subject to heavy metal pollution,such as off the Arctic coast of Russia (The Globe and Mail 2002). Other humanhealth concerns associated with aquaculture include residues from use of pro-scribed antibiotics, such as chloramphenicol. This has been a concern in the Northfor shrimp imports from developing countries, particularly China. The EuropeanUnion’s Standing Veterinary Committee banned imports of seafood from Chinaduring part of 2002 following discovery of the banned substance in samples andin Chinese processing plants. The United States and Canada subsequently loweredtheir tolerance levels to the E.U. standard following similar concerns (IntraFishMedia 2003).
The issue of chloramphenicol illustrates the tension between legitimate healthconcerns in regulating fisheries imports, and the desire of some parties to invokehealth regulations to limit imports for commercial reasons. In the United States in2002, the primary impetus for tougher chloramphenicol regulation of shrimpimports came from the Southern Association of State Departments of Agriculture,primarily composed of states with important shrimp production interests.Meanwhile, a Dutch scientific study conducted by Dr. J. C. Hanekamp conclud-
��;���D �����������:����������������������;�������������
��� ��������������
ed that most people would have to consume 40 kg of shrimp daily for a lifetimeto run a risk of contracting cancer from the chloramphenicol residues typicallyfound in Asian shrimp (McGovern 2002).
Enforcement of SPS measures—whether clearly warranted or controversial—is naturally a problem for developing-country exporters. The European Unionimposed a ban on imports of fish from Tanzania and Uganda in 1999, and onshrimp from Bangladesh in 1997. These bans (which typically range from severalmonths to over one year in duration) can have massive effects in terms of foreignexchange revenues, disruption of investment, and losses of employment. InTanzania and Uganda, for example, the importance of Nile perch exports hadgrown considerably from the 1980s to the 1990s; the value of freshwater fishexports from Tanzania alone had grown from under US$1 million in 1987 to overUS$51 million in 1997 (World Bank 2000). Fish exports dropped by almost 50percent during the ban. Uganda’s loss was US$37 million during the ban, whileTanzania lost about US$63 million. About 30 percent of export fish workers losttheir jobs in both countries as a result of this ban (Calzadilla-Sarmiento 2002).Cato and dos Santos (2000) estimated the cost to Bangladesh as a US$65 millionloss of revenue, although US$50 million could be offset from increased sales inother markets. The study also estimated that about one million people were affect-ed either directly or indirectly through backward and forward linkages associatedwith the shrimp export sector.
Responding to the concerns of consumers and governments in importingcountries with regard to microbial and chemical contamination of traded fishfood, the Codex Alimentarius Commission (CAC) recommended adoption ofHACCP as a tool for food safety management in 1993. Although the CAC has noformal enforcement mechanism for its recommendations through internationallaw, it has been endorsed by the 1995 agreements of the WTO on SPS andTechnical Barriers to Trade (TBT) (Thomas and Meyer 1997). National govern-ments have also adopted CAC recommendations in their national policies, as inthe case of the United States. In practice, therefore, exporting countries are forcedto comply with HACCP norms and other CAC recommendations. As discussedbelow, there are cost implications to compliance that are justified by the value ofthe trade it permits, but that create economies of scale in exporting countries thatcould work to exclude the small-scale sectors in those countries.
Three significant sets of international codes of practice, agreements, and tech-nical guidelines have been promoted to provide a degree of standardization for theprotocols used to minimize the risks of diseases associated with movements ofaquatic animals. These include: (a) the Office International des Epizooties (OIE)International Aquatic Animal Health Code and Diagnostic Manual for AquaticAnimal Diseases (OIE 2000a, 2000b), (b) the International Council for the
Exploration of the Sea (ICES) Code of Practice on the Introduction and Transferof Marine Organisms (ICES 1995), and (c) the European Inland FisheriesAdvisory Commission (EIFAC) (Turner 1988). While compliance by developing-country exporters to these standards has been mixed in the past, fisheries trade toEurope and the United States is becoming more difficult in cases where compli-ance cannot be demonstrated. Both compliance and improved mechanisms for thecertification of compliance are soon likely to emerge as a consequence.
Besides health issues, there are other nontechnical barriers to fish trade, suchas countervailing duties, anti-dumping legislation, and property rights over mar-ket names. Some of these respond to concerns of political constituencies in theimporting countries, such as eco-labeling or the certification of non-use of childlabor. Some are more clearly motivated by commercial concerns, such as actionsby U.S. producers of farmed catfish to prevent Vietnamese basa from being soldas catfish in the United States. Others may arise from the administrative complex-ity of certifying country of origin when traceability is an issue. One recent estimatein the U.S. Federal Register estimates the net cost of implementation—due in2003—of the new U.S. country-of-origin label law to be $2 billion (USDA2002). It seems unlikely that all of this amount will be borne by U.S. consumers;some of it will undoubtedly be borne by developing-country exporters in the formof reduced demand for their products.
����"���!���/ %(���������������1����!������������
�������������
As in the rest of agriculture, fish trade is also affected by the very large productionsubsidies paid by developed countries. The difference with the rest of agricultureis that China is a member of the developed-country club in this respect. A com-prehensive report on the topic by Milazzo (World Bank 1998) shows that theOECD countries plus China account for three-quarters of production subsidies tofisheries, primarily in the marine capture sector. Total production support levelsfor fish in these countries amount to 30 to 35 percent of final price, comparedwith 14 percent for poultry. The size and power of the Chinese marine fleetquadrupled from 1978 to 1994, with late 1990s subsidy estimates in the range of$500 to $750 million per year—a level comparable to that of Japan and twice thatof the European Union.
Although these subsidies are in the marine sector, they affect all fish pricesthrough overcapitalization of the capture fishing effort and depressing fish prices(at least in the short term). Should the subsidies be removed, it is likely that fishprices would rise even further and that the incentives to exports from aquaculturewould be even more favorable. However, the rapid rise of health and documenta-tion requirements for high-value fish trade suggest that potent barriers are being
��;���D �����������:����������������������;�������������

raised to the continued participation of the small-scale sectors in fish trade, in theabsence of some viable form of vertical coordination that keeps them in the loop.
$""#��� $$"($��%��*(�1 $�"�"1 �"%#�
%���*(�1%%$
The intensification of aquaculture has been ongoing, as discussed in Chapter 6,and is likely to be accelerated by the current direction of technological change.Even environmental requirements are likely to contribute to capital-intensive pro-duction, as controlling negative externalities from aquaculture often requiresexpensive capital investments. If policy subsidies in developing countries followthe example of the OECD and China, capital-intensive, large-scale operations arelikely to emerge in developing countries at the expense of traditional and small-scale commercial fishers. Such subsidies could include cheaper land and credit,and lower taxes and tariffs on imported inputs for larger-scale operations (Ahmed1997). Furthermore, in many developing countries, the legal and institutionalframeworks to promote or protect access rights for traditional fishers are eitherweak or not implemented. These issues are becoming more prominent in Asia asnew land and water for fish farming is becoming scarcer.
The rapid rise in information and documentation requirements is anotheremerging barrier to the continued participation of small-scale and poor producers.It requires considerable experience, skill, and investment to ensure adequate doc-umentation of safe handling, processing, and origin of fish products. The mini-mum installation cost in Bangladesh for a HACCP-certified plant ranges fromUS$270,000 to US$380,000, and annual maintenance of an average small plantcosts US$35,000 to US$71,000 per year (Dey et al. 2002). Bangladesh thereforeneeds 9.4 percent of its one-year export sales of fish to install a HACCP plant and1.3 percent to maintain it (Cato and dos Santos 2000).
Thailand has the most efficient HACCP processes in Asia, and the cost ofprocessing 1 kg of fish is only US$0.10 to US$0.14 per year (Dey et al. 2002).Thus the costs of HACCP compliance are not likely to exclude countries from fishtrade. They are, however, likely to make it difficult for small-scale operations tocompete unless they are vertically coordinated with larger processing operationsthat can adequately certify the compliance of their suppliers with safe processes.
Where there are constraints, there are also opportunities. The world is mov-ing toward skilled-labor-intensive hygiene and food safety requirements, fair laborpractices, and increased consumer consciousness of environmental issues. Fishexporting countries that comply in certifiable ways should be able to capture thelucrative export market more successfully by pursuing better quality managementat lower cost. There is a role for policy in favoring these outcomes. In Thailand,
��� ��������������

producers, transporters, and processors formed an all-industry organization andcreated a code of conduct to certify their products (Rahman 2002). Thailand nowhas four well-equipped inspection centers for detection of bacteria, virus, antibi-otics, and heavy metals, and has developed three open auction markets. The trickfor poverty reduction and inclusive development will be to find institutionalmeans to include smaller-scale producers in these arrangements.
��;���D �����������:����������������������;�������������

� � � � � � &
�%#�-&"%#
�ombined analysis of observed trends through the 1990s, salient issues fromexisting literature, baseline “best guess” projections to 2020, and other pos-sible scenarios suggests specific answers to the research questions outlined
in the beginning of this book. Quantitative projections for consumption, produc-tion, trade, and prices are the result of the simultaneous interaction of supply anddemand relationships around the world. For convenience, the projections are sum-marized separately under the former classifications rather than the latter. However,the framework for considering broader policy conclusions for fisheries distinguish-es whether the entry points for effecting change lie on the demand- or the supply-side, and whether these entry points differ between developed and developingcountries. The book concludes with a list of key issues for further policy researchand a synthesized perspective for a “brave new world” in fisheries in the next twodecades.
�*(�$(( $�*�2&(�"%#
,� ��������1������������������������������#�����
�����������������3
On average, people in 2020 will be eating more fish, but the increases will accruemore slowly than in the past two decades. The baseline scenario forecasts globalper capita food fish consumption to increase at an annual compound rate of 0.4percent from 199723 to 2020, with aggregate consumption increasing at 1.5 per-cent per annum (Chapter 4). China and India lead with per capita growth
��
�#B� ��������� �� ���������������� ������������� � �����%%%� ��� ������������� ������ ���� �
���������� ������������� ���� ��+�%%&���� ���!��������������������� ������ ��%%,/%'-�

forecast at 1.3 and 0.9 percent per annum to 2020, respectively. Latin Americaand Southeast Asia hold the middle ground with 0.4 and 0.5 percent growth,respectively, while the rest of the world exhibits little or negative growth in percapita fish consumption under baseline assumptions. On average, each person inSub-Saharan Africa is unlikely eat more fish in 2020 than is eaten today, butbecause of high population growth, the region’s aggregate fish consumption is pre-dicted to rise at an average rate of 2.4 percent per year under the baseline(Appendix E).
China’s fish consumption has grown rapidly of late, and will continue to growrapidly relative to other countries. Projected annual growth in aggregate Chinesefood fish consumption of 2.0 percent per annum may seem high but is actuallymuch lower than the recorded growth of 11.8 percent per annum in the FAO fig-ures for 1985 to 1997. Baseline projections indicate that aggregate consumptiongrowth in the developed countries will continue to stagnate; results range from adecline in Japan (–0.3 percent per annum) to small increases in the United States(0.7 percent per annum), while the European Union remains fairly constant.Except for Eastern Europe and the former Soviet Union, which had already beenthrough a period of very rapid decline in fish consumption in the 1990s, allregions of the world are likely to exhibit lower growth rates in food fish consump-tion to 2020 than observed during 1985–97.
Consumers in China will continue to diversify their diets. Low-value foodfish consumption is projected to grow at a lesser annual rate (1.5 percent) thantotal food fish consumption (2.0 percent) to 2020 under baseline assumptions,and aggregate Chinese consumption of crustaceans, mollusks, and high-value fin-fish is projected to grow much more rapidly, from 2.6 to 2.8 percent per annumto 2020 (Appendix E). Over time, the Chinese are projected to consume anincreasing share of higher-value fisheries items, affecting both their current exportsto the developed world and their imports from neighboring countries in theSouth.
Southeast Asia will also follow this path; it is projected to increase its totalfood fish consumption faster than its low-value fish consumption (1.7 versus 1.4percent per annum). However, in South Asia, with and without India, the con-sumption of low-value fish is projected to increase at 2.1 percent per annum to2020, faster than total food fish (1.9 percent per annum). In the rest of the devel-oping world, the aggregate consumption of total food fish increases at about 0.1percent per annum faster than low-value food fish consumption, and the overallconsumption of higher value fisheries items increases faster than low-value items,a trend already observed in developed countries.
Under the various fish production scenarios investigated in Chapter 4, glob-al per capita fish consumption in 2020 is projected to range from a low of 14.2
��! ��������������
kg/capita under the willfully extreme ecological collapse in capture fisheries sce-nario, to a high of 19.0 kg/capita under the faster investment in aquaculture sce-nario, while the baseline scenario projects 17.1 kg/capita. For comparison, actualestimates are 15.7 kg/capita for 1997 and 11.6 kg/capita for 1973 (Chapter 3).The comparable range across all scenarios for the developing countries, excludingChina, is 8.3–11.1 kg/capita in 2020, with a baseline result of 9.9 kg/capita, com-pared with an actual estimate of 9.2 kg/capita in 1997. In developed countries, thescenario results for fish consumption in 2020 range from 17.0 to 22.6 kg/capita,with a baseline projection of 21.5 kg/capita, compared with an actual 1997 esti-mate of 21.7 kg/capita.
In sum, growth in fish consumption will very likely continue, but it will bedriven primarily by the developing countries. Moreover, growth will occur slight-ly more in high-value than in low-value items, except in India and the rest ofSouth Asia. Most of the world’s per capita consumption growth will occur in Eastand Southeast Asia. Overall consumption growth of food fish will overwhelming-ly occur in developing countries, where the effects of population growth will com-bine with consumer desire for a larger, diversified food basket. These factors are nolonger important in developed countries for high-value items as a whole, althoughthey may still be important for individual high-end fisheries items like scallops andsmoked salmon. Both the existing literature on past trends and the model con-struction for this study identify urbanization as a significant contributing factor tothe growth in developing-country fish consumption.
The 1.5 percent per annum global growth rate forecast for total food fish con-sumption through 2020 under the baseline scenario can be compared with esti-mated rates for meat and milk from the same baseline projections. Meat consump-tion (beef, pork, poultry, and small ruminant meat combined) is projected to growat 2.1 percent per annum worldwide, 3.0 percent per annum in developing coun-tries, and 0.8 percent in developed countries. Comparable figures for milk are 1.7percent per annum growth to 2020 overall, with 2.9 percent growth in develop-ing countries and 0.6 percent in the developed world (Rosegrant et al. 2001;Delgado et al. 2002b). On the whole, fish consumption growth rates are similaracross regions to meat growth rates, although they are about one-third smaller.Furthermore, proportionately, China is slightly more important in the overallgrowth of fisheries than it is in the growth of the meat sector.
,�����,� ���� �����������3
Observed past consumption trends and future projections can be explained in partby trends in production. Most capture fisheries growth during 1985–97 camefrom China, though figures for the 1990s have been challenged by some (seeChapter 2). Nevertheless, China expanded its high-seas fishing capacity by a fac-
�������������������"

tor of four between the late 1970s and mid-1990s (Chapter 7). Furthermore,other parts of Asia and Latin America had uncontested annual production growthrates of 3 percent or more during that period. At the same time, capture food fishproduction in the developed world fell at a rate of 2.4 percent per annum.
Looking forward to 2020, almost all of the 1.5 percent per annum growth intotal food fish production projected under the baseline scenario will come fromaquaculture, and much of this from developing countries. Capture fisheries indeveloped countries are only expected to grow at 0.1 percent per annum through2020; they are likely to do a little better in the developing countries, at 1.0 per-cent per annum both with and without China (Chapter 4 and Appendix E).
The global share of food fish production from aquaculture is projected to riseto 41 percent in 2020, up from 31 percent in 1997 (Chapter 4). Asia will contin-ue to be the leading region in aquaculture development in absolute terms, butaquaculture development will be widespread. 13 percent of developed-countryfood fish production came from aquaculture in 1997, and this share is projectedto rise to 19 percent in 2020. For the developing countries, excluding China, theshare of food fish production from aquaculture is projected to rise from 17 per-cent in 1997 to 27 percent in 2020, and for China the comparable share is pro-jected to rise from 58 percent in 1997 to 66 percent in 2020.
Growth rates for food fish production across regions illustrate a changinglocus of world fish production. China’s share in global food fish production wasonly 10 percent in 1973, but rose to 36 percent by 1997 (based on officiallyrecorded data), and is expected to reach 41 percent by 2020 using the same data.Using the downward-adjusted data of the lower China production scenario, whichis consistent with claims of some critics of the official data, the Chinese share ofworld food fish production in 2020 is still 37 percent. Developed countriesaccounted for 56 percent of global food fish production in 1973 and 27 percentin 1997; under the baseline scenario, this share is expected to fall to 21 percent by2020. Thus, overall, world food fish production is shifting rapidly away frombeing primarily an activity of the North, carried out by trawlers on the high seas,toward being an activity of the South, primarily carried out by rural people infreshwater ponds in Asia.
Despite the relatively high rates of growth in capture fisheries observed indeveloping countries from 1985 to 1997, projection of any further growth in cap-ture fisheries production (even at one-third the 1985–97 rate) may seem surpris-ing, given widely held pessimism as to the sustainability of capture fisheries. Yetwhile sustainability concerns remain valid in many developing-country fisheries,media views in the developed countries are heavily influenced by the experience oftheir own countries, where the sustainability issues of ocean fisheries are especial-ly acute. Roughly one-quarter of the world’s capture fisheries are classified by the
��# ��������������

FAO as either under-exploited or only moderately exploited, and these growthareas are entirely in the tropics (FAO 2000a). The baseline scenario assumptionsconcerning capture fisheries are a conservative view, deemed reasonable at thepresent time by the study team; nevertheless—given the notorious uncertainty ofcapture fisheries—both more pessimistic and more optimistic future scenarioswere also modeled.
Global food fish production from capture was 56.2 mmt in 1985 and 64.5mmt in 1997 (Chapter 3), and is projected to reach 76.5 mmt in 2020 underbaseline assumptions. If the lower China production hypothesis is correct, the2020 projection falls to 69.2 mmt; in the event of a disastrous and global ecolog-ical collapse in marine fisheries, the low-end figure is 53.4 mmt. Slower aquacul-ture expansion puts substantially more pressure on capture fisheries with onlysmall production gains, for a projected total of 77.9 mmt (Chapter 4).
The implication for technology development of the production projections isthat aquaculture-related technologies will become even more important in thefuture. Aquaculture is likely to continue to intensify, especially in those areas of thetropics where it has been relatively extensive to date. Intensifying aquaculturebrings risks of increased disease and more difficult disease control within ponds orcages, unless new technologies are also introduced to deal with these risks.Pollution control will become more of a policy issue as aquaculture increasinglyimpinges on other activities. Competition for water will become much moreacute, especially in those parts of Asia where aquaculture development is alreadyadvanced. Technologies for better dealing with these problems will be much indemand, and their divisibility in terms of economies of scale will be important tothe social outcomes of aquaculture development in developing countries becausepresent technologies may be economically infeasible for small-scale operations.Fish nutrition will become an increasingly important issue, both for pollution con-trol and for reducing the costs associated with rapidly rising demand for fishmeal(discussed in a subsequent section).
It seems likely that even more attention will be devoted to the selective breed-ing of species for aquaculture production than in the past, much as the rise ofintensive poultry production coincided with the development of more productivepoultry grandparent stock. As noted in Chapter 6, this is a relatively new yet cru-cial venture for tropical finfish in view of its expanding role in world food supply,particularly for the animal protein supply of the poor. Far more public attentionis likely to be devoted to the safety and quality of aquaculture products in thefuture, as well as the interaction between production characteristics and productquality.
The environmental sustainability of aquaculture will become more con-tentious over time, not less. Biotechnology will become increasingly important in
��������������������

aquaculture, and claims of possible dangers to the wild genetic stock from escapedfish will become more frequent. Judging from experience in the meat sector, foodsafety debates and trade issues will surface relating to the use of genetically modi-fied organisms in aquafeeds and, certainly, to the cultivation of genetically modi-fied fish.
Although capture fisheries production will not grow much overall, technolo-gy to prevent it from shrinking further in specific regions will be in considerabledemand, particularly in the traditional fisheries of the North. Technologies thatpermit better fisheries management are foremost among these, including informa-tion technologies that permit easier, more sustainable, and more easily document-ed fishing. Pressure for improved bycatch-reduction strategies (through better gearand practices) will grow. As is the case for most environmental issues, solutions willbe found in a combination of technologies and policies directed at the same prob-lem. Arguably, accurate information for fisheries management and choice of fish-ing gear have been more extensive for the North Sea than for most developing-country fisheries, yet stocks are still depleted. Improved information serves theinterests of those who have the best access to it. Since this often means large-scaleprivate fishing operations, there is little reason to think that it will necessarily pro-mote better management. Appropriate institutional arrangements will be neces-sary both to level the playing field and to facilitate use of new technologies for thepurposes of the common good.
Domestic needs and pressures will help to shape institutions, policies, andtechnologies for resource management, especially in developed countries and insome of the large developing countries such as China and India. However, unlikethe red meat sector, the main pressure for environmental sustainability and foodsafety in developing countries will probably not come from domestic sources.Rather, it is likely to come from trade opportunities and barriers that will createincentives for change.
,����,� �*������������������������1��!��3
The data analysis in this study, which assessed trade as the residual of productionminus consumption, identified the developing-country shift away from netimportation of food fish toward net exportation as occurring a few years later thanthe separate data on fish imports and exports would indicate—that is, the mid-1980s instead of the mid-1970s (see Chapter 7). Part of the reason for confusionsurrounding the shift in export flows (other than statistical anomalies) is thatdeveloping countries first extended their EEZs to the 200 nautical mile limit inthe 1970s, though these areas continued to be fished under license by foreignfleets. The catch was booked to the flag country of the foreign vessel; thus actual“exports” were under-recorded. In the 1980s, developing countries began to phase
��� ��������������

out licenses, favoring their own fleets, at which time exports began to be creditedto developing countries in the records.
Either way, the shift has occurred, and the rapid rise in developing-countryfish exports is one of the major developing-country trade stories of the late 1980sand early 1990s. Two-thirds of developing-country net exports are high-end itemslike tuna, salmon, shrimp, crabs, and bivalves. The remainder is low-value finfishfor food, such as canned sardines and other processed low-value products.
A key question is whether the export boom in high-value seafood items indeveloping countries will continue. Overall, the 2020 projections indicate that netexports will continue but at lower levels in the future than now. Net exports ofhigh-value finfish from developing countries, which increased by 2.5 mmtbetween 1985 and 1997, shrink under the baseline scenario by over 0.5 mmt to2020, and a similar pattern results for crustaceans. Net food fish exports fromdeveloping to developed countries decrease overall by more than 1.2 mmt between1997 and 2020 under baseline assumptions, having shifted from –1.3 mmt in1985 (that is, net imports of 1.3 mmt) to 4.0 mmt in 1997. Since production indeveloping countries is not forecast to decline, the primary explanation for thedecrease in net exports is that demand growth is outstripping supply growth indeveloping countries, particularly at the high-end, and particularly in China andSouth and Southeast Asia.
The developing-country export boom in fisheries of the 1980s and 1990sundoubtedly kept the relative prices of high-end items down in developed coun-tries, while increasing them in developing countries. In any event, real world pricesfor food fish items generally rose—or at minimum did not fall—in the past 15years, while red meat prices have fallen by about half (Chapter 7; Delgado et al.1999). Anecdotal evidence suggests that, if anything, real prices of low-value foodfish in developing countries rose at least as fast and probably faster than those ofmany high-end items such as salmon and shrimp, for which rapid growth in aqua-culture production depressed prices (Chapter 7).
At one extreme, fish prices abruptly tripled in real terms in many locations inWest Africa from the late 1980s to the early 1990s. Highly subsidized long-distance fleets of Eastern Europe dumped low-value blocks of frozen food fish incountries along the central part of the West African coast in the 1970s and 1980s;when these fleets disappeared with the fall of the Soviet bloc, local prices in thesecountries may have caught up with secular increases elsewhere in the region.China is at the other end of the spectrum; the high rate of growth of freshwateraquaculture in the late 1980s and early 1990s appears to have helped keep realdomestic prices for low-value food fish stable or even slightly depressed. In thiscase, prices were partially controlled through various government interventions.
��������������������

The rise in net fish exports from developing countries is associated with thedevelopment of institutions to facilitate trade in highly perishable commodities,such as improved airfreight facilities, a more rules-based trading system under SPS,and the extension of process-based food safety assurance approaches, such asHACCP (Chapter 7). Which came first—the institutions or the increased trade—is an open issue, but the two surely interacted.
Looking forward, it seems very likely that real fish prices will increase to 2020.Short-term price changes up or down are to be anticipated and can be quite largeon a transitory basis, but production or consumption changes typically ensure areversion to a long-term trend. The methodology used in the study is appropriatefor assessing long-term structural changes in supply and demand that lead to last-ing realignment of relative prices. The most likely outcome in the model is forhigh-value finfish and crustacean prices to be about 15 percent higher in 2020,whereas the real price of low-value food fish is expected to increase a total of 6 per-cent. In contrast, real fishmeal and fish oil prices are expected to increase by a totalof 18 percent by 2020, whereas meats and milk are expected to decline 3 and 8percent, respectively.
Thus fish is expected to become more expensive relative to meat and otherfood products. Significantly, the relative prices of both fishmeal and fish oil willincrease by about 20 percent compared with poultry, pig meat, and soymeal butonly 3 percent compared with high-value finfish (Chapter 4). Hence fishmealprices will probably become de-linked from soymeal prices by 2020, and theseinputs will largely exit from most uses in the poultry and hog sectors, barring tech-nical change.
Scenario analysis suggests that the real price of high-value finfish is especiallysensitive to assumptions about the health of capture fisheries. In the very pes-simistic ecological collapse scenario for capture fisheries, the real price of high-value finfish rises by 69 percent, an incredible amount for a long-term real pricein a price-mediated model of supply and demand. This suggests that if the situa-tion in capture fisheries becomes sufficiently dire, even hearty growth in aquacul-ture cannot dampen the relative price rise for high-value fish. One reason for thisis that ecological collapse in capture fisheries also leads to an even more extraordi-nary rise in prices for fishmeal (134 percent), also a product of capture fisheries,leading to severe pressure on profit margins for carnivorous aquaculture.
Four other insights on prices come from the scenario analysis. First, the onlyscenario that leads to a decrease in the real price of low-value food fish is fasteraquaculture expansion (that is, a higher exogenous rate of investment or produc-tivity increase in aquaculture). Second, slower aquaculture expansion and ecolog-ical collapse lead to 25 percent and 35 percent increases, respectively, in the realprice of low-value food fish. Third, the only scenarios that lead to a stable or
��� ��������������
declining real price of fishmeal are slower aquaculture expansion (0 percent realchange) and higher fishmeal efficiency growth (a 16 percent real decline). Fourth,red meat prices are hardly affected by big changes in the fish sector, but poultryprices are supported marginally by higher fish prices under pessimistic scenarios.The real price of vegetable meals, however, is projected to increase 16 percent inthe event of the ecological collapse of capture fisheries.
The price forecasts imply that major re-alignments of incentives within theanimal protein sector are possible, depending on the outlook for capture fisheries,investment in aquaculture, and the rate of technical efficiency in fish feeding. Allcan be influenced by policy, but the latter two are more likely to benefit theinvestors concerned; thus, they are more achievable.
,������������"�� �!�������/����������� ��&����/ ����%!����
���������� � ����3
The dire forecasts to 2020 under the pessimistic scenarios, along with the analysisof the literature and issues in Chapter 5, indicate that evolving global food mar-kets will continue to apply heavy pressures on capture fisheries, both at the highand low ends of the sector in terms of market demand. Demand shifts in favor offish consumption play a key role here, but the supply side is also a factor. Highlevels of subsidies to boat construction and operation in OECD countries andChina have contributed to severe overcapitalization of their fleets. This in turn hasencouraged resistance by fishers to sustainable management of stocks and has ledto overfishing in the grounds frequented by these fleets.
Within capture fisheries, it will be vital for governments to invest in improv-ing the information upon which fisheries management decisions are based and topromote better governance of natural resource use. These issues have proven diffi-cult in both developing and developed countries for similar reasons, includinginherent technical difficulties, justifiable concern about the livelihoods of tradi-tional fishers, and strong vested interests in the fishing industry. Nevertheless,adopting systems of tradable user rights or other forms of restricting access andlimiting catches is ultimately unavoidable. This study supports this need, but isnot well-placed to identify specific solutions.
One insight of this study is a price-mediated tradeoff between aquacultureand capture fisheries; aquaculture can relieve pressure on fishing for food fish bydampening the rise of fish prices, but at the same time it stimulates growth in theprices of reduction fish. Under current technology, the growth of aquacultureshifts fishing pressure from output fish (such as salmon) to input fish (such ascapelin).
��������������������

���� 0��!� ����� �.���������1����������������������������3
As shown under the scenarios of faster and slower aquaculture growth, the pace ofaquaculture development makes an important difference in the projected realprices of fisheries commodities to 2020. Increased aquaculture production thusprovides a price-mediated tradeoff with capture fisheries, in that lower food fishprices mean lower incentives to apply capture effort in food fisheries. On the otherhand, growth in carnivorous aquaculture does put pressure on reduction fisheriesby 2020. Government policy has aggressively promoted this expansion in the past,as in the Gulf of Thailand during the shrimp boom of the 1990s.
Analysis of the projections shows a modest difference in capture fisheries pro-duction between the faster and slower aquaculture scenarios. However, the previ-ous point illustrates the importance of investing in reducing the amount of fish-meal needed for aquaculture output. In the short run, returns to such an invest-ment may not be obvious because continuing use of fishmeal in livestock feedingwould initially buffer increases in the price of fishmeal. The substitution of veg-etable meals for fishmeals in livestock enterprises results in a smaller relative priceincrease for fishmeal than would otherwise occur.
On the other hand, analysis in Chapter 5 showed that farmers of carnivorousfish (including shrimp) have generally more inelastic demand for fishmeal and fishoil than do farmers of terrestrial animals, for reasons of fish biology. This moreinelastic demand over time coupled with growing aquaculture production willshift the use of fishmeal and fish oil out of livestock and poultry production.Furthermore—and this is key—this combination will tend to make the price offishmeal even more volatile than in the past. Fishmeal prices are already notorious-ly volatile across years because of variable climatic factors that affect harvests ofreduction fish. If fish are eating a larger share of total fishmeal output over time,then the increasingly inelastic fishmeal demand and its unpredictable supply willmake the price of fishmeal extremely unstable, potentially harming the profitabil-ity of carnivorous aquaculture operations at short notice. This also implies theperiodic potential to “make a killing” in fishmeal at the very time that it is mostharmful to be literally killing remaining stocks.
The key to allowing aquaculture to achieve its potential of alleviating pressureon ocean fisheries is to concentrate resources on noncarnivorous forms of aquacul-ture, and to promote improvements in fishmeal efficiency for the carnivorousspecies that are farmed. Some of this scientific research will be on feed, as discussedin Chapter 6, while some will be on the output fish themselves. The main envi-ronmental message of this study is that much more needs to be done to reduce theaverage global amount of fishmeal used per unit of fish output, and that this is along-term issue of critical importance where the immediate market return may not
��� ��������������

be great. This effort is a reasonable candidate for classification as a global publicgood.
,������������"�� �!�������/�������1���3
Review of the few studies available that link fish to the food security of the poorsuggest that the outlook is not especially good. Capture fisheries are not likely toprovide increasing sources of employment on any significant scale, and competi-tion for crowded resources is likely to intensify. Aquaculture in developing coun-tries will provide expanding employment to many; however, the net effect onemployment is still not clear in land- and water-constrained areas, such as most ofAsia. Fish ponds typically require less labor input per hectare than the rice paddiesthey supplant. Land owners are likely to experience higher incomes, especially iffish prices rise relative to other items, and this argues for targeting public-sectoraquaculture development funds to small-scale fish pond development with non-carnivorous species.
On the consumption side, it seems likely that over time the poor who used toget small amounts of animal protein from small fish are likely to substitute milkand meat, as meat and milk calories become cheaper relative to fish. The nutri-tional impact of this is not known, but at minimum it will be necessary for thepoor in question to increase their total consumption of animal protein despite ris-ing prices for fish.
The net effect on poverty of the global fish trends outlined above could goeither way. On the positive side, regional income effects of fisheries developmentwill stimulate a great deal of local economic activity in services, local handicrafts,food sales, and so on. This will be especially true in remoter areas where under-employed local resources are available to create these products but insufficientlocal demand for them exists. An activity such as fish production that can bringincome into the local area from outside will lead to substantial extra net incomein remote areas (Chapter 7). Conversely, it seems likely that intensification ofaquaculture will end up displacing many poor and landless families in developingcountries from their former low-wage employment as agricultural laborers. Onbalance, the more remote and sparsely populated the area, the more favorable thepoverty-reduction impact of aquaculture is likely to be.
Another area for policy concern is that aquaculture operations in developingcountries will likely scale upward in individual size, particularly in export opera-tions. Significant economies of scale are present in environmentally friendly tech-nologies that have been developed primarily to fit the needs of capital-intensiveaquaculture. HACCP-enabled supply chains typically also involve larger-scale pro-ducers in the absence of institutional development cutting the costs and risks ofdealing with a large number of small suppliers. It is plausible, however, to assume
�������������������

that institutions of collective action within a market-oriented framework couldcapture some of these economies of scale for small-scale fishers—akin to contractfarming in livestock operations—but methods of accomplishing this on a wide-spread basis in fisheries have yet to be documented.
(#�$+�1%"#���%$�1%-"�+� ��"%#
The premises outlined in Chapter 1, which have on the whole proven to be cor-rect, and the specific conclusions outlined above, suggest a range of entry-pointsfor policy action to improve poverty-reduction and sustainability outcomes indeveloping-country fisheries. Most of the dynamic policy issues apply to aquacul-ture situations, although coastal and marine resource management issues will con-tinue to loom large in coastal areas.
��� �6����(�����1������
On the supply side, issues for developing counties are not very different from thosein developed countries. The partial list below applies to both.
� Facilitating institutions that can improve the governance of marine and costalresources.
� Facilitating institutions that can improve the governance of freshwater fish-eries resource management, including conversion of inland water and land toaquaculture production, integrated crop-fish development, and sequential useof water.
� Developing transparent and process-based food safety systems for consumers.
� Focusing environmental and food-safety attention on the sources of pollutionin fisheries that most endanger human health and sustainability (and thatoriginate outside the fisheries sector but accumulate in fish over time).
� Developing technologies to reduce the production costs of small-scale noncar-nivorous pond aquaculture outputs.
� Adopting science-based policies on genetically modified organisms and theiruse in aquaculture production.
� Developing enforcement mechanisms for sustainable aquaculture codes ofconduct, and creating certification systems for compliance (such as eco-labeling) that allow private-sector agents to reap the benefits of sustainablebehavior in the market.
��! ��������������

� Promoting market information, certification, and extension systems for small-scale aquaculture.
� Developing an adapted legal code for participatory institutions of collectiveaction for small-scale fisheries, such as marketing and input supply coopera-tives.
� Redirecting subsidies currently going to increase marine fishing operations toimproving resource management and information systems.
� Creating a fisheries policy monitoring and planning function within min-istries of finance or prime ministerial offices (not just in ministries of fish-eries), to ensure that the sector gets the policy attention it will deserve.
������6����(�����1�����
From the standpoint of improving policy outcomes in developing countries, dis-tinct differences arise between the developed countries and the developing coun-tries on the demand side. For developed countries, the priorities are as follows.
� Rationalizing food safety systems for seafood imports such that safety is pro-moted and purely protective nontariff barriers are removed.
� Harmonizing and modernizing tariff classifications across countries to fit themodern realities of fish trade in processed tropical products.
� Eliminating tariff escalation on fisheries imports.
� Providing technical assistance to associations of small-scale developing-country fish exporters in achieving and maintaining fair trade and eco-labeling certification.
� Providing technical assistance to associations of small-scale developing- country fish exporters in setting up and maintaining credible process-basedfood safety plans such as HACCP along their export chains.
The focus of demand-side policies in developing countries should be to facil-itate South–South trade, which will grow rapidly in the next 20 years; to providepublic goods in assuring domestic food safety; and to help ensure that fish prod-ucts reach those in developing countries who need them the most from a nutri-tional standpoint. The developing-country priorities are as follows.
� Adhering to a rationalized, rule-based system of fisheries trade that protectsfood safety but does not create artificial barriers to imports from other devel-oping countries.
�������������������"

� Using aquaculture as a development vehicle for the poor in regional develop-ment projects.
� Monitoring and evaluating the impact of such projects and how they can beimproved.
� Monitoring the nutritional status of poor people in fish-producing areas andexploring cost-effective ways of improving outcomes using locally producedfish.
1$"%$"�"(��%$��&$�*($�1%-"�+�$(( $�*
Developing a sustainable fish sector that benefits poor people will requireresearchers to address a number of questions that arise from the preceding analysis:
� What is happening to the industrial organization of fish production and pro-cessing in developing countries (with particular emphasis on factors promot-ing scaling-up of the average size of individual operations) and why?
� How does the changing structure of international fish markets affect theopportunities and constraints for developing-country exporters, specificallysmall-scale and poor producers? In particular, what has been the impact ofeco-labeling, fair trade, organic, and food safety regulations?
� How has the fish export boom of the late 1980s and 1990s affected incomesand nutrition of the poor in developing countries, and what can be done toimprove outcomes?
� How should participatory institutions of collective action be designed andfacilitated to allow small-scale fishers and farmers to participate in growingfish markets subject to increasing economies of scale arising from growingenvironmental and health restrictions?
� How should participatory and market-oriented institutions be designed andfacilitated to improve the governance of resources critical to the maintenanceand expansion of fish production?
� How can research on reducing use of fishmeal in world fisheries be promot-ed, and how can cost recovery for that research be improved?
� What are the constraints and opportunities in terms of the expansion ofSouth–South trade in fisheries, and what are the options for improving out-comes for poverty reduction and improving environmental sustainability?
��# ��������������

� At what point will world fishmeal prices become de-linked from soymealprices, and what are the implications of this for the industry and for consumers?
��$ )(�#(,�,%$-��"#��"*($"(
In concluding this assessment of the outlook for fisheries to 2020, five major struc-tural shifts can be predicted for global fisheries in relation to developing countries,aquaculture development, poverty alleviation, and environmental sustainability.These “sea changes” (in the full sense) are already underway, although they aremore visible in some cases than in others; by 2020, they will be pervasive.Forward-looking policy discourse, research, and technology development address-ing the above issues should focus on these changes.
First, developing countries, particularly in Asia, will dominate production sys-tems; aquaculture development is central to this shift, but it will become moreapparent in capture fisheries as well. The remaining quarter of world marine cap-ture fisheries that are not fully exploited (and which are all in the tropics, largelywithin the EEZs of developing countries) will become more heavily fished.
Second, the source of net fisheries exports on a global scale has already shift-ed from the North to the South, and South–South trade will become increasing-ly important with the further emergence of urban middle classes. Developedcountries will continue to be large net importers, and their domestic producerswill continue to gradually exit the sector. Over time, it is likely that public policyin the North will increasingly favor import-friendly regimes for fish. On the otherhand, it is quite possible that trade wars—perhaps based on both real and spuri-ous food safety claims—will become more prominent in the South. Fish willbecome an increasingly high-value food commodity in relative terms, and trade islikely to continue to shift from low-grade and frozen whole fish to fresh fillets andthe like.
Third, environmental controversy will continue in the fisheries sector but willchange focus. Overfishing in marine areas will remain a huge concern.Sustainability-motivated environmental regulations and institutions will rapidlybecome more prominent, starting in the developed countries and then spreadingto developing countries. Relatively more attention will be devoted to the exploita-tion of reduction fisheries and of the stocks preyed on by traditional marine foodfish. It seems likely that the relationship between pollution and food safety in fish-eries will be given much more attention in both the North and the South. If prob-lems become worse, and as the consumer base for fish becomes larger and morewealthy, more attention will be given to sources of pollution such as dioxins,PCBs, and heavy metal residues that accumulate in food fish, directly affecting
��������������������

capture fisheries and both directly and indirectly affecting aquaculture (throughreduction fish). These pollution sources are outside the fisheries sector (via run-offs from agricultural chemicals, industrial dumping of heavy metals, chemical-laden rain, and so on), and the interests behind the activities causing the pollutionhave typically been stronger than the constituency worried about the pollution’seffects on fisheries—but this will change.
Fourth, the importance and focus of fisheries technology development willalso shift to meet new challenges. Technology to profitably reduce the fishmealand fish oil requirements for carnivorous aquaculture are key, and efforts will beexpanded by private-sector interests. Some efforts will be focused on fish, otherson synthetic feeds, and still others on modification of crops used in aquafeeds.Private-sector technology development will also continue to find ways to lessen thenegative environmental impacts of intensifying large-scale aquaculture, throughthe design of relatively capital-intensive innovations. In the public arena, interestwill increase in finding technological solutions to mitigate the negative environ-mental externalities associated with progressive intensification of small-scale pondaquaculture under tropical conditions, where, to date, technological solutions toenvironmental problems have not been forthcoming. Environmental and food-safety regulations that require capital-intensive approaches to compliance willreceive increased scrutiny. In capture fisheries, information technologies forimproved management will become increasingly important both in the North andthe South but will pay off for public purposes only where the right form of insti-tutional development accompanies use of the technology.
Fifth and finally, the issue of institutional development in fisheries will be anecessary condition for poverty reduction through fisheries development, as it isfor improving environmental sustainability and food safety. The outlook for tradi-tional fishers in developing countries in the absence of such institutional innova-tion is not bright. Both capture and culture fisheries are scaling-up and becomingmore capital-intensive, and increased focus on food safety and environmentalexternalities under current technologies is likely to further this tendency. Foodsafety certification will become important to the survival of all fishers in the nexttwo decades, and eco-labeling will become important to most. The world has notyet found a way to deliver such certifications cost-effectively and credibly to largenumbers of small-scale fish producers, but the stakes are increasingly clear.
��� ��������������

� � � � � � ' �
$(�"%# -��- "�"� �"%#�
%���%&#�$"(
�he 36 IMPACT country groups include 184 countries, representing over 99percent of the world’s human population and 99 percent of the world’s pro-duction of IMPACT fisheries commodities from 1996–98. Countries
excluded from the model produced approximately 1 mmt, or less than 1 percent,of the global production total for IMPACT commodity groups for the base yearof 1997. In this book, “global” refers to the 36 IMPACT commodity groups.Regional groupings were chosen based on Delgado et al. (1999). Data from somesmall countries were not available in all series in all years. Missing values for verysmall countries are ignored without note. The following list shows the countriesaggregated into the groupings reported in the tables.
China Mainland China, Taiwan, and Hong Kong
Eastern Europe and Albania, Armenia, Azerbaijan, Belarus, Bosnia–former Soviet Union Herzegovina, Bulgaria, Croatia, Czech Republic,
Czechoslovakia, Estonia, Georgia, Hungary,Kazakhstan, Kyrgyzstan, Latvia, Lithuania,Macedonia, Moldova, Poland, Romania, RussianFederation, Slovakia, Slovenia, Tajikistan,Turkmenistan, Ukraine, former Soviet Union,Uzbekistan, Yugoslavia, and former Yugoslavia
European Union 15 Austria, Belgium/Luxembourg, Denmark,Finland, France, Germany, Greece, Ireland, Italy,the Netherlands, Portugal, Spain, Sweden, andthe United Kingdom
India India
���

Japan Japan
Latin America Antigua and Barbuda, Argentina, Bahamas,Barbados, Belize, Bolivia, Brazil, Chile,Colombia, Costa Rica, Cuba, DominicanRepublic, Dominica, Ecuador, El Salvador,French Guiana, Grenada, Guadeloupe,Guatemala, Guyana, Haiti, Honduras, Jamaica,Martinique, Mexico, Netherlands Antilles,Nicaragua, Panama, Paraguay, Peru, St. Lucia, St. Kitts and Nevis, St. Vincent and Grenadines,Suriname, Trinidad and Tobago, Uruguay, andVenezuela
Other developed Australia, Canada, Iceland, Israel, Malta, New countries Zealand, Norway, South Africa, Switzerland
Other South Asia Afghanistan, Bangladesh, Maldives, Nepal,Pakistan, and Sri Lanka
Southeast Asia Brunei, Cambodia, Indonesia, Laos, Malaysia,Myanmar, Philippines, Thailand, and Vietnam
Sub-Saharan Africa Angola, Botswana, Burkina Faso, Benin,Burundi, Cameroon, Central African Republic,Chad, Comoros Islands, Democratic Republicof the Congo, Cote d’Ivoire, Djibouti, Eritrea,Ethiopia, Gabon, Gambia, Ghana, Guinea,Guinea-Bissau, Kenya, Lesotho, Liberia,Madagascar, Malawi, Mali, Mauritania,Mauritius, Mozambique, Namibia, Niger,Nigeria, Republic of the Congo, Reunion,Rwanda, Sao-Tome and Principe, Senegal, SierraLeone, Somalia, Sudan, Swaziland, Tanzania,Togo, Uganda, Zambia, and Zimbabwe
United States United States of America
Western Asia and Algeria, Cyprus, Egypt, Iran, Iraq, Jordan, North Africa Kuwait, Lebanon, Libya, Morocco, Saudi
Arabia, Syria, Tunisia, Turkey, United ArabEmirates, and Yemen
��� ��������������

Developed world European Union 15, Japan, Other developedcountries, and the United States
Developing world China, India, Latin America, Other South Asia,Southeast Asia, Sub-Saharan Africa, West Asiaand North Africa, Cape Verde, Fiji, FrenchPolynesia, Kiribati, Macao, Mongolia, NewCaledonia, North Korea, Papua New Guinea,Seychelles, South Korea, and Vanuatu
World Developed world and Developing world
�;;�������F��������� ������������������������������������

� � � � � � ' (
�%��%�"�+��$%&1
�MPACT commodity groups were aggregated using the FAO coding systemcalled the International Standard Statistical Classification of Aquatic Animalsand Plants (ISSCAAP). Effort was made to include only fish, crustaceans (with
the exception of krill), and mollusks. Excluded fisheries products include reptiles,marine mammals, aquatic plants, and other miscellaneous aquatic organisms.Production of the excluded ISSCAAP categories in the 36 IMPACT countrygroups totaled 9.5 mmt in the base year of 1997, or 7 percent of overall aquaticproduction, over 90 percent of which consisted of seaweeds and other aquaticplants (FAO 2002a).24 Table B.1 shows the IMPACT categories with their com-ponent ISSCAAP groups, along with a list of excluded ISSCAAP groups.
The category “low-value food fish” includes freshwater fish such as carp, andsmall marine fish such as anchovies, sardines, and jacks. Fish specified as miscella-neous in ISSCAAP groupings are assigned to low-value food fish. The category“high-value finfish” includes marine fish such as salmon, snappers, cod, tuna, andflatfishes, as well as high-value freshwater fish such as trout. “Crustaceans” repre-sents all crustaceans with the exception of krill (plankton) and includes productsranging from prawns to lobsters. “Mollusks” includes shelled bivalves such asclams and oysters and also includes cephalopods like squid and octopuses. In thisreport, the terms “fisheries products,” “food fish,” and “seafood” refer to theIMPACT commodity groups.
��
�);���� ������������� �����:�� ������������������� �:��� ������������ ������������ �� ����:
������� !� ��������������� ������� ����������� �!�����������"�������������������!���� �
�� ������������� ���� ��������!�� �"���
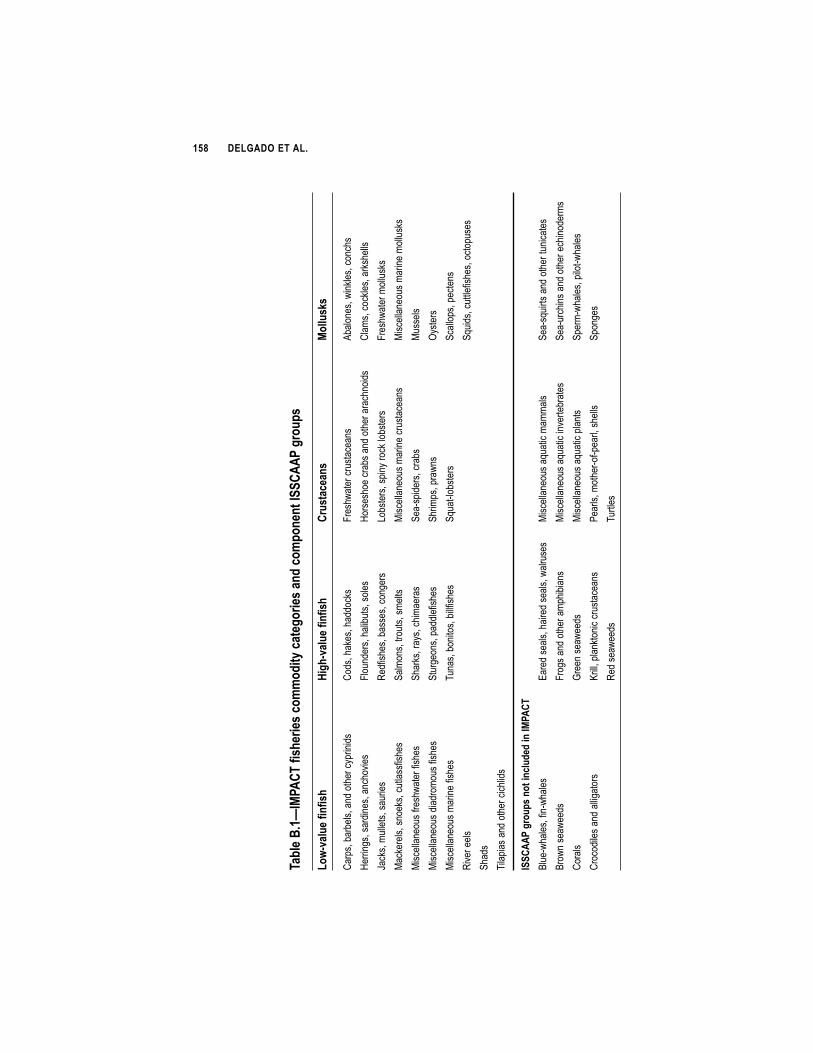
��! ��������������
�$%&'����G��;����012'+'1�.(
88(,)?�.$)'5(+'1�$/,�.(8*(/'/
)�������;5+(-*1
�(6=$&-'�0/012
:52=$&-'�0/012
�+-1)$.
'$/1
�(&&-
1>1
������������������ �������������
� �������������� ���
�������������������
��� ������������ ����
���������������������� ���
� ����������������� �
� ���� ����������� ���������� ���
������� �����������
�������������������
����������������� ����
� �������������� ��� �����
���������� ����
��������� ���������������
!�� ������ ���������
����� �������������������
����� ���������� ����
����� �����������������
!���������������������
!�"�������������
����
����� �������� � ��������
!���� �������������
!��������������
#�����
����� ��������������
$������� ��� ����������
!%���" �����
!�� ���������
������
!%����������������� �� ����
!����
$����������� �����������
������;5+(-*1�/()�/.&-,',
�/���;���
&�"���������"����
'��������������������������
����� ����%������������
!�"�%���������� ������������
&� ��������
�� ������� ��������������
����� ����%����������������
!�"������������ �������� ����
� ���
(��������
����� ����%�����������
!���"�������� �"����
�� � ������������� ��
)��������� ��������������
*������ ���" �"��������
!� ���
��������
$����
� � � � � � ' �
�%��%�"�+� ��$(� �"%#� #�
� - #�"#��1$%�(�&$(
�his section describes the steps involved in creating the IMPACT fisheriescommodity groups described in Appendix B, and the subsequent balancingof production, consumption, and trade among the 36 IMPACT country
groups. It should be noted that production data were held constant because theymapped directly into IMPACT categories, while consumption and trade data wereadjusted so that their IMPACT aggregations would be consistent with the produc-tion aggregations.
The first step was to create the four IMPACT fisheries commodity categoriesfrom the International Standard Statistical Classification of Aquatic Animals andPlants (ISSCAAP) groupings found in Fishstat Plus (FAO 2002a). Because con-sumption and trade data are not available in ISSCAAP categories, we took thesefrom noncomparable categories in FAO’s “Balance Sheet Data: Non-PrimaryLivestock and Products” and “Food Supply: Non-Primary Livestock andProducts” (FAO 2002c).
The FAO aggregates consumption and trade data into eight commoditygroups, six of which map almost directly into IMPACT categories. “Demersalfish” were assigned to high-value finfish; “marine fish unspecified” were assignedto low-value food fish; “crustaceans” mapped directly to crustaceans; and“cephalopods” and “molluscs other” were each assigned to mollusks. “Freshwaterfish” and “pelagic fish,” however, each contain species from more than oneIMPACT category. Data from these two categories were initially assigned toIMPACT categories using rules based on geography and trade patterns (Delgadoet al. 2000). Fish consumed in or imported to developed countries was classifiedas high-value finfish, while fish consumed in or imported to developing countrieswas classified as low-value food fish. This procedure created inevitable errors thatwere addressed in later steps. Fish used for feed were classified temporarily as low-value food fish, to be subsequently removed.
��"

��# ��������������
Three-year averages centered on 1973, 1985, and 1997, respectively, were cre-ated for all data. “Error” in a region was defined as production minus human con-sumption, net exports, and other uses for a given year. At this stage, considerableerror arose in each region, much of which, it is assumed, came from a misalloca-tion of shares of freshwater and pelagic fish into IMPACT categories.Consequently, in cases where a low-value food fish error was of the opposite signto a high-value finfish error, net exports and human consumption were appropri-ately adjusted so that the error in each category was reduced by an amount thateliminated the smaller of the two errors.
With this stage complete, leftover error still remained in instances where bothhigh-value finfish and low-value food fish errors were of the same sign, and in thepreviously unaddressed errors in the crustaceans and mollusks categories. A cate-gory’s “share” in a given region for a given commodity was defined as that catego-ry divided by the sum of imports, exports, human consumption, and other uses.Remaining error in the four IMPACT categories was eliminated by adjustingimports, exports, human consumption, and other uses, each by its proportionateshare.
For each commodity, global net exports were then brought to zero by sub-tracting the global quantity of net exports multiplied by each region’s share in theabsolute value of net exports. The resulting error in each region was eliminated byapportioning it among human consumption and other uses according to theshares of each in total availability. As a result, no further error remained, thoughsome categories had been overcorrected (indicated by negative quantities).Overcorrected values were reverted to their original values, and error was broughtto zero by adjusting imports, exports, or consumption as appropriate. Thesechanges threw global trade out of balance, so the deficit in global net exports wasspread proportionately among all other regions to maintain global net exports atzero, and error in these regions was kept at zero by subtracting the same amountfrom human consumption.
This process provided consistent 1997 base-year values for production, con-sumption, trade, and other uses for all the IMPACT categories, with the exceptionof low-value food fish, which still included reduction fish. Reduction fish produc-tion data (“fishmeal inputs”) were taken from FAO’s “fishery: derived” datasets(FAO 2002b). These data were assigned to 36 IMPACT country groups.Reduction fish data were only available through 1997, so 1998 reduction fish datawere estimated by applying the percentage change in fishmeal production from1997 to 1998 in each region to 1997 fishmeal input data. Three-year averages cen-tered on 1997 were then created for all country groups.
In each region, reduction fish was removed from “low-value food fish fromcapture” totals by subtracting fishmeal inputs. The difference between the global

total for fishmeal inputs and the global low-value food fish total for feed use wasadded to or subtracted from human consumption, as appropriate, proportionate-ly by region. The above procedures were repeated to eliminate the resulting errorand bring global net exports to zero. Final production, consumption, and tradedata for low-value food fish, high-value finfish, crustaceans, and mollusks werepassed into the IMPACT model.
Fishmeal was defined according to the Standard Industrial TradeClassification (SITC) group “flour etc. fish, animal feed” from Fishstat Plus (FAO2002a). Fish oil was defined by the SITC group “fat, oil, of fish, other” fromFishstat Plus. Production, import, and export data for fishmeal and fish oil werecollected for 1976-98 for 36 IMPACT country groups from Fishstat Plus. Three-year averages centered on 1973, 1985, and 1997 were created for all data.
Total fishmeal and fish oil consumption data were calculated for each regionby subtracting net exports from production. For each commodity, global netexports were then brought to zero by subtracting the global quantity of net exportsmultiplied by each region’s share in the absolute value of net exports. The result-ing error in each region was eliminated by adjusting consumption. Resulting neg-ative consumption values were set to zero, and net exports were adjusted by thesame amount. The deficit in global net exports was spread proportionately amongall other regions to keep global net exports at zero, and error in these regions waskept at zero by subtracting the same amount from human consumption.
Consumption of fish oil was assigned to aquafeed, human consumption, andother uses by employing the estimates of Tacon (2001) regarding distribution offish oil end-uses. Fish oil feed consumption was distributed according to fixedratios that take into account aquaculture production in each region. In cases wherethis procedure resulted in feed use exceeding overall use, feed use was equated withoverall use. The amount by which feed use was diminished in these cases was pro-portionately added to feed use in the other regions. Food and other uses of fish oilwere proportionately distributed among the regions with remaining unaccounted-for fish oil consumption. Final fishmeal and fish oil production, consumption,and trade data were passed into the IMPACT model.
�;;�������F���������D ��������������������������;������������������
� � � � � � '
* #�-"#���"*($"(��$ �(�
� � �"#�"�1 ��
�he IMPACT model, like most international datasets, does not analyze tradeflows between specific countries. Instead, it estimates net trade with a disem-bodied “world market,” which is the difference between domestic produc-
tion and consumption at domestic prices within each country group. Net tradethat is positive is called “net exports” and negative net trade is “net imports.”Resulting trade flows occur in the model until domestic supply (production plusnet imports) equals domestic demand at prevailing domestic prices. The latter aresimultaneously influenced by trade flows, and the iteration stops when a set ofgroup-specific prices for 36 countries for each commodity are in balance across allmarkets for a given year, and net trade sums to zero globally for each commodity.Prices for the same commodity can differ in a given year across country groups andwith world prices because of country group-specific price wedges specified as pro-duction subsidy equivalents in percentage terms.
Imposing this framework on the model requires that the baseline data for1996–98, on which subsequent forecasts are based, have consistent series for pro-duction, consumption, and trade figures for each country and commodity group,as is discussed in Appendix C. This means that considerable effort was devoted togetting consistent estimates of production, consumption, and net trade in themodel after reaggregation into IMPACT categories. Production data after reaggre-gation are held as the starting point, and consumption and trade estimates arejointly and proportionately adjusted to achieve balance, following the proceduresdescribed in Appendix C.
Comparison of projected trends for net trade with past trends also necessitatesadjusting live weight data from FAO 2002b (including trade data) for earlier yearsinto comparable IMPACT market-defined categories, such as low-value food fish,for IMPACT country aggregates, again using the approach and datasets detailedin Appendix C.
���
��� ��������������
The question then arises as to how these historical estimates of trade forIMPACT categories actually compare with direct data on historical trade flows forfish. The best independent trade data for comparative purposes come from the“trade and production” database within FishStat Plus (FAO 2002a), which reportshighly disaggregated processed-weight trade data as exports and imports by coun-try. It was therefore possible to individually assign each trade commodity to anappropriate IMPACT category. However, to make the series more comparablewith the IMPACT category series arising from the procedures in Appendix C, anunknown adjustment would have to be made to convert processed weight to live-weight equivalents. Furthermore, there is no reason why this conversion would beconstant across years or countries, as the true conversion will differ by processedproduct and fish species, and the mix of these in broad aggregates changes acrossyears and countries. Therefore the independent estimates of historical trade flowswould need to remain in processed weight, and could be expected to be substan-tially smaller (but not in a systematic way) than our live-weight estimates. Finally,the commodities in the fisheries trade and production dataset may not be compre-hensive with regard to the live-weight fisheries production totals.
There are two other reasons why the independent processed-weight trade datamight differ from re-aggregation using the procedures in Appendix C of historicalfisheries trade data. First, imperfections in the assignment of FAO live-weightcommodities to IMPACT categories using Appendix C procedures will inevitablyintroduce some error, for which there is no solution. This is judged to be anunavoidable outcome of the worthwhile process of aggregating fisheries commodi-ties into market-based categories. Second, and perhaps more importantly, theFAO processed-weight trade data are collected and reported separately for eachnation. Global net exports do not sum to zero, as global consistency is notimposed.26
A comparison of the trends shown by our re-aggregations in live weight tothose derived from processed-weight totals from FishStat Plus is given forIMPACT categories in Table D.1. This table reports the net change in annual foodfish trade between 1985 and 1997, where these years are three-year averages cen-tered on the year indicated. Results are largely as expected, and are largely consis-tent, with only one major discrepancy. The discrepancy concerns low-value foodfish in the developed world. The processed-weight dataset shows net exportsincreasing between the two periods, whereas our procedure shows net exports of
�,>� ����������"���� ���������������������� ������ ������������������������!��������� ��"�
����� ��

low-value food fish declining substantially from developed countries. The mainreason for this discrepancy is probably that global net exports for the processedweight dataset sum to over 1 million metric tons (not shown in table), while byconstruction they sum to zero in the IMPACT dataset, as in the real world theymust. The imbalance in global net exports of processed-weight totals can be seenin the table, for example, in the simultaneous increase in net exports of low-valuefood fish by both the developing and developed countries from 1985 to 1997.
�;;�������F��:�����������:���������������� �����;������������
�$%&'���� �2$/5'�/�/')�' *(+)1�0+(8�,00'+'/)�1(-+.'13��"!�4"
�')�' *(+)1�7)2(-1$/,�8')+.�)(/19
;+(.'11',�6'52) �'�6'52)�(88(,)? �'5(/ 7���9 7��;���9
� �"����� ������ +� ���� �� ,-. /0�110
+� ������ �� -23 0�110
+� ������ ���4�5������ 61. 0�103
����"����������� +� ���� �� /0�,67 /8�633
+� ������ �� 711 8�633
+� ������ ���4�5������ 8-- 8�7,2
���������� +� ���� �� /768 /63,
+� ������ �� 73, 63,
+� ������ ���4�5������ 7-7 6-6
���� +� ���� �� /73. /6,,
+� ������ �� -37 6,,
+� ������ ���4�5������ ,-7 873
$ ���� ������ +� ���� �� /0�-,6 /6�70.
+� ������ �� 0�.-, 6�70.
+� ������ ���4�5������ 0�-10 ,�26,
! ����9����#��� �������������������������� ����#�:8338�;<�= *��$ ���������������������������
���� ����� ����#�:8338�;5
> ��9��+����������������� �����"����������������� ��0.26�����0..15�* ��������������������
�������������4� ������ ��0.26�� �0..1<������������������������������5��� �� ������������ ��
������� �������� ��= *��$5�� ������� ������������������������������ �� �������� ��������������
�� ����� ���������������#�:8338�;���������������� ����� ������= *��$ ���� ������� ������� ����
������� ������������4�&5��� ���� �������������������� ������4� ����� �� ������� �?� 5�= *��$ ������
��������������������� ������4� ��������� �?� ����� �������� �5�>��4� �������������������������
�����4� ����������� ������������ �5
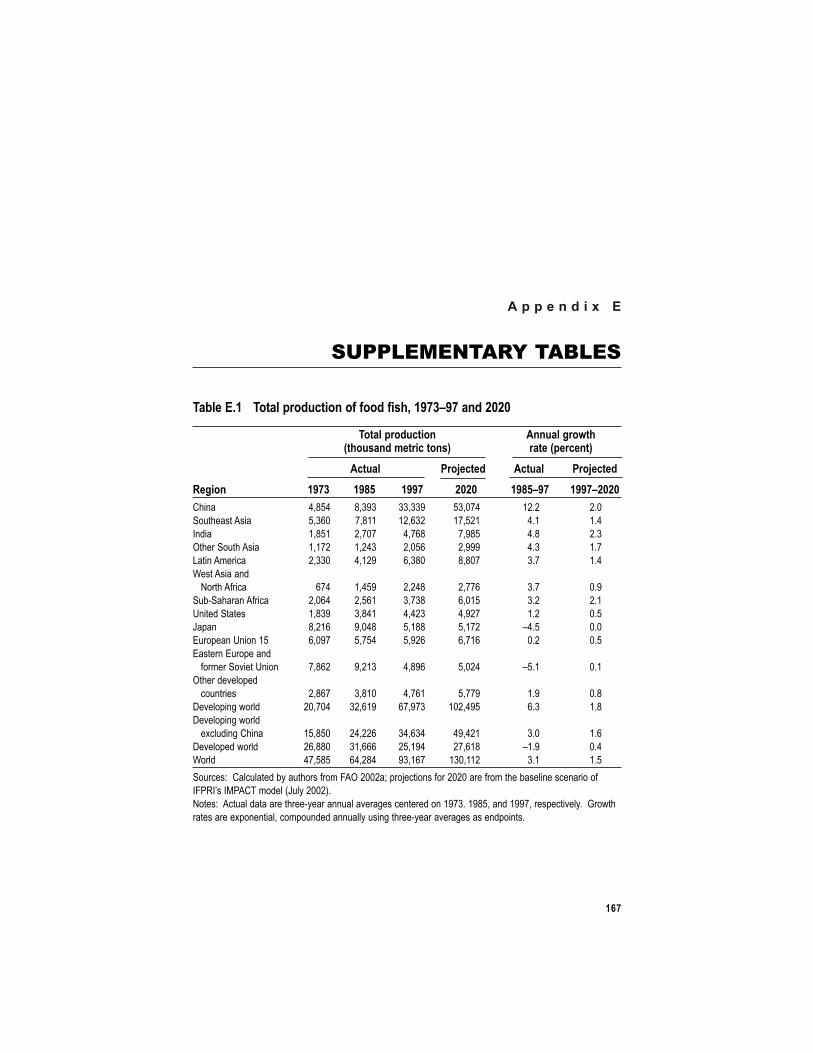
� � � � � � ' )
&11-(�(#� $+�� �-(
��
�$%&'���� �()$&�*+(,-.)(/�(0�0((,�0123��" �4" �$/,��#�#
�()$&�*+(,-.)(/ �//-$&�5+(6)27)2(-1$/,�8')+.�)(/19 +$)'�7*'+.'/)9
�.)-$& ;+(C'.)', �.)-$& ;+(C'.)',
�'5(/ �" � �"!� �"" �#�# �"!�4" �"" 4�#�#
����� ,�26, 2�7.7 77�77. 67�31, 0858 853
! ����������� 6�7-3 1�200 08�-78 01�680 ,50 05,
=���� 0�260 8�131 ,�1-2 1�.26 ,52 857
#����! �������� 0�018 0�8,7 8�36- 8�... ,57 051
������������ 8�773 ,�08. -�723 2�231 751 05,
@������������
> ���������� -1, 0�,6. 8�8,2 8�11- 751 35.
!��"!������������� 8�3-, 8�6-0 7�172 -�306 758 850
A�����!���� 0�27. 7�2,0 ,�,87 ,�.81 058 356
����� 2�80- .�3,2 6�022 6�018 /,56 353
'�� ����A�� ��06 -�3.1 6�16, 6�.8- -�10- 358 356
'������'�� ������
� ����! ����A�� � 1�2-8 .�807 ,�2.- 6�38, /650 350
#������ ���
� ������ 8�2-1 7�203 ,�1-0 6�11. 05. 352
+� ������ �� 83�13, 78�-0. -1�.17 038�,.6 -57 052
+� ������ ���
4������������ 06�263 8,�88- 7,�-7, ,.�,80 753 05-
+� ���� �� 8-�223 70�--- 86�0., 81�-02 /05. 35,
@ �� ,1�626 -,�82, .7�0-1 073�008 750 056
! ����9����������������� ����� ����#�8338�<��� B��� ���� ��8383������ ����������������� � �
=�*�=C��= *��$ � ��:����8338;5
> ��9�������������������"����������������������� ��0.175�0.26������0..1����������5��(� ���
��������4� �������� �� ���������������������"����������������� ����5

��! ��������������
�$%&'���� ;+(,-.)(/�(0�0((,�012�0+(8�.$*)-+'3��" �4" �$/,��#�#
�()$&�*+(,-.)(/ �//-$&�5+(6)27)2(-1$/,�8')+.�)(/19 +$)'�7*'+.'/)9
�.)-$& ;+(C'.)', �.)-$& ;+(C'.)',
�'5(/ �" � �"!� �"" �#�# �"!�4" �"" 4�#�#
����� 7�2,. ,�.6- 07�268 01�.68 25. 050
! ����������� ,�.62 -�2-1 03�767 08�7.. 756 352
=���� 0�-12 8�311 8�211 7�-02 852 053
#����! �������� 0�3.2 0�033 0�61. 0�20- 750 35-
������������ 8�781 ,�360 6�18, 1�766 85. 050
@������������
> ���������� --7 0�7.0 8�36, 8�7,8 757 35-
!��"!������������� 8�36. 8�668 7�138 6�227 750 853
A�����!���� 0�--2 7�633 7�..- ,�070 050 350
����� 1�236 2�7.6 ,�7.1 ,�082 /658 /357
'�� ����A�� ��06 6�-38 ,�.0. ,�133 ,�1,, /35, 353
'������'�� ������
� ����! ����A�� � 1�-62 2�1.7 ,�131 ,�202 /650 350
#������ ���
� ������ 8�276 7�182 ,�011 ,�-60 053 356
+� ������ �� 02�.88 8-�.86 ,8�6,8 6,�3,3 75. 053
+� ������ ���
4������������ 06�317 80�.-. 82�-.3 7-�322 858 053
+� ���� �� 86�6-. 8.�77- 80�.11 88�,16 /85, 350
@ �� ,,�,.0 6-�8-0 -,�683 1-�606 050 351
! ����9����������������� ����� ����#�8338�<��� B��� ���� ��8383������ ����������������� � �
=�*�=C��= *��$ � ��:����8338;5
> ��9�������������������"����������������������� ��0.175�0.26������0..1����������5��(� ���
��������4� �������� �� ���������������������"����������������� ����5
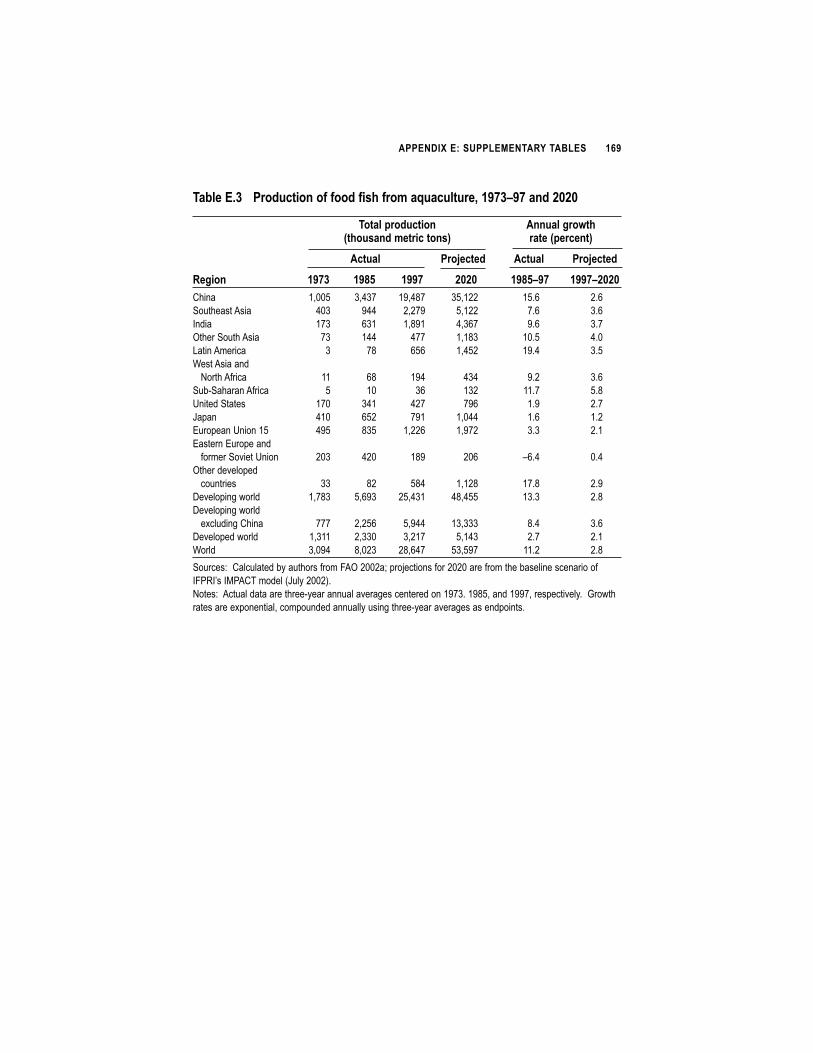
�;;�������F���;;��������D ��������������"
�$%&'���� ;+(,-.)(/�(0�0((,�012�0+(8�$<-$.-&)-+'3��" �4" �$/,��#�#
�()$&�*+(,-.)(/ �//-$&�5+(6)27)2(-1$/,�8')+.�)(/19 +$)'�7*'+.'/)9
�.)-$& ;+(C'.)', �.)-$& ;+(C'.)',
�'5(/ �" � �"!� �"" �#�# �"!�4" �"" 4�#�#
����� 0�336 7�,71 0.�,21 76�088 065- 85-
! ����������� ,37 .,, 8�81. 6�088 15- 75-
=���� 017 -70 0�2.0 ,�7-1 .5- 751
#����! �������� 17 0,, ,11 0�027 0356 ,53
������������ 7 12 -6- 0�,68 0.5, 756
@������������
> ���������� 00 -2 0., ,7, .58 75-
!��"!������������� 6 03 7- 078 0051 652
A�����!���� 013 7,0 ,81 1.- 05. 851
����� ,03 -68 1.0 0�3,, 05- 058
'�� ����A�� ��06 ,.6 276 0�88- 0�.18 757 850
'������'�� ������
� ����! ����A�� � 837 ,83 02. 83- /-5, 35,
#������ ���
� ������ 77 28 62, 0�082 0152 85.
+� ������ �� 0�127 6�-.7 86�,70 ,2�,66 0757 852
+� ������ ���
4������������ 111 8�86- 6�.,, 07�777 25, 75-
+� ���� �� 0�700 8�773 7�801 6�0,7 851 850
@ �� 7�3., 2�387 82�-,1 67�6.1 0058 852
! ����9����������������� ����� ����#�8338�<��� B��� ���� ��8383������ ����������������� � �
=�*�=C��= *��$ � ��:����8338;5
> ��9�������������������"����������������������� ��0.175�0.26������0..1����������5��(� ���
��������4� �������� �� ���������������������"����������������� ����5
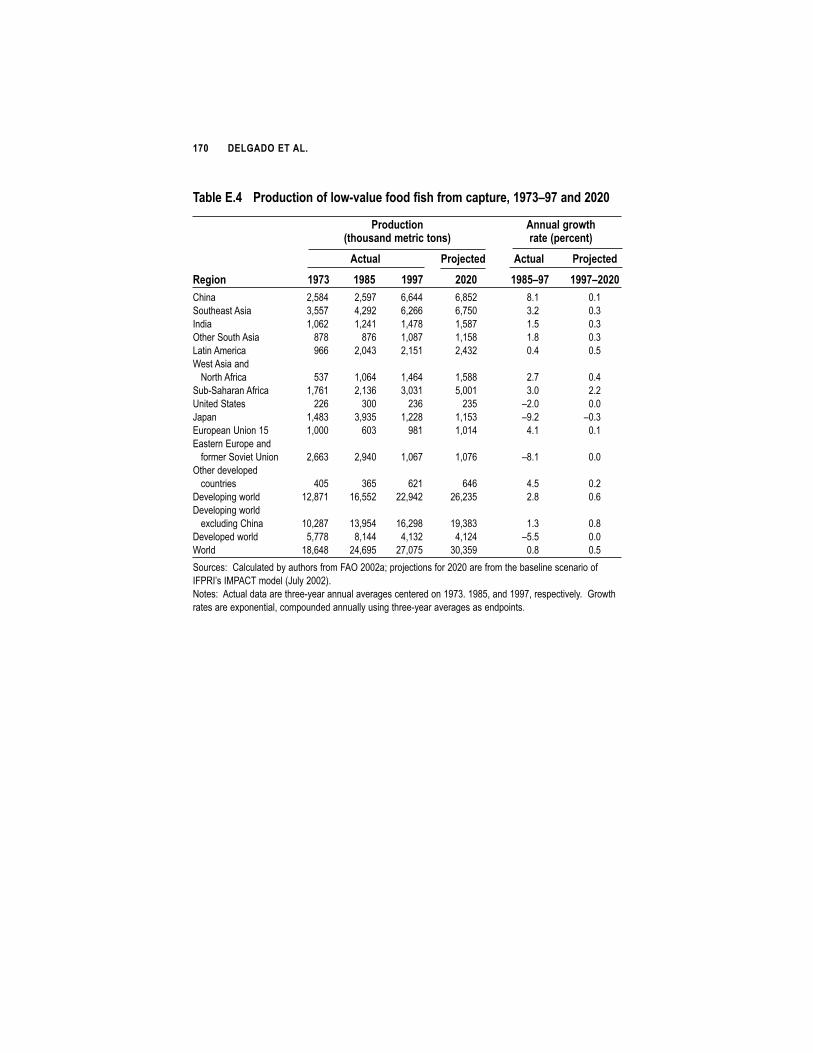
� # ��������������
�$%&'���� ;+(,-.)(/�(0�&(6=$&-'�0((,�012�0+(8�.$*)-+'3��" �4" �$/,��#�#
;+(,-.)(/� �//-$&�5+(6)27)2(-1$/,�8')+.�)(/19 +$)'�7*'+.'/)9
�.)-$& ;+(C'.)', �.)-$& ;+(C'.)',
�'5(/ �" � �"!� �"" �#�# �"!�4" �"" 4�#�#
����� 8�62, 8�6.1 -�-,, -�268 250 350
! ����������� 7�661 ,�8.8 -�8-- -�163 758 357
=���� 0�3-8 0�8,0 0�,12 0�621 056 357
#����! �������� 212 21- 0�321 0�062 052 357
������������ .-- 8�3,7 8�060 8�,78 35, 356
@������������
> ���������� 671 0�3-, 0�,-, 0�622 851 35,
!��"!������������� 0�1-0 8�07- 7�370 6�330 753 858
A�����!���� 88- 733 87- 876 /853 353
����� 0�,27 7�.76 0�882 0�067 /.58 /357
'�� ����A�� ��06 0�333 -37 .20 0�30, ,50 350
'������'�� ������
� ����! ����A�� � 8�--7 8�.,3 0�3-1 0�31- /250 353
#������ ���
� ������ ,36 7-6 -80 -,- ,56 358
+� ������ �� 08�210 0-�668 88�.,8 8-�876 852 35-
+� ������ ���
4������������ 03�821 07�.6, 0-�8.2 0.�727 057 352
+� ���� �� 6�112 2�0,, ,�078 ,�08, /656 353
@ �� 02�-,2 8,�-.6 81�316 73�76. 352 356
! ����9����������������� ����� ����#�8338�<��� B��� ���� ��8383������ ����������������� � �
=�*�=C��= *��$ � ��:����8338;5
> ��9�������������������"����������������������� ��0.175�0.26������0..1����������5��(� ���
��������4� �������� �� ���������������������"����������������� ����5
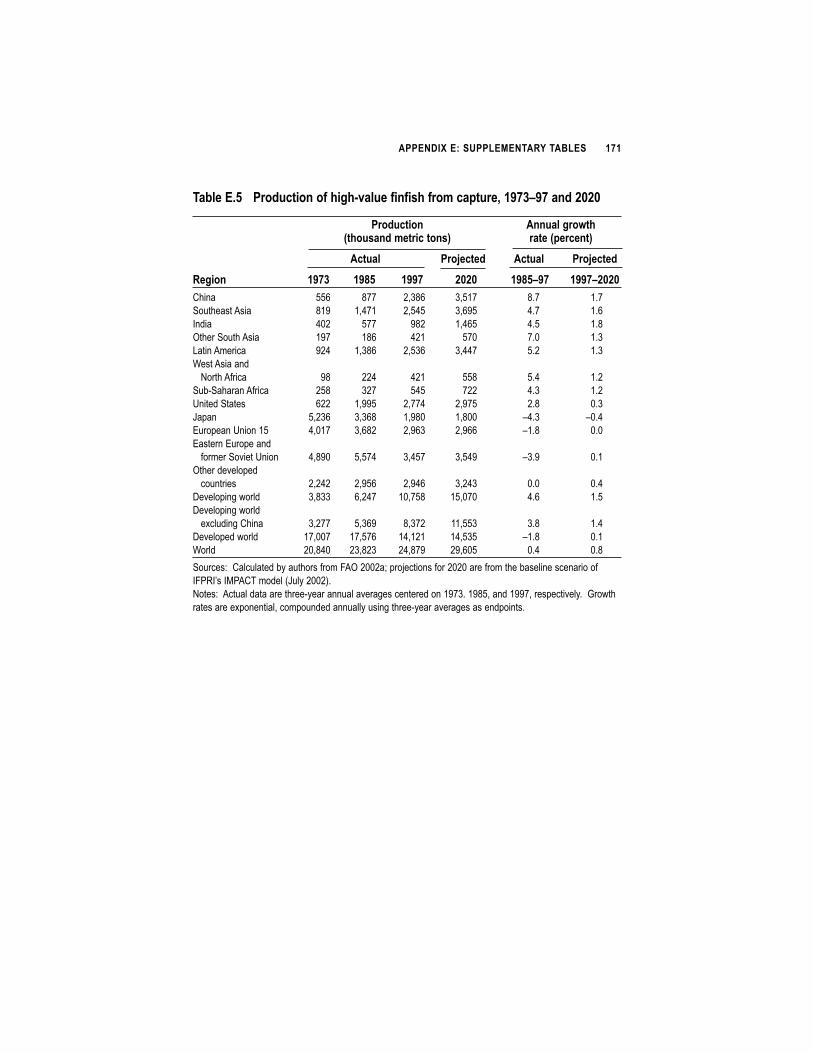
�;;�������F���;;��������D ������������� �
�$%&'���� ;+(,-.)(/�(0�252=$&-'�0/012�0+(8�.$*)-+'3��" �4" �$/,��#�#
;+(,-.)(/� �//-$&�5+(6)27)2(-1$/,�8')+.�)(/19 +$)'�7*'+.'/)9
�.)-$& ;+(C'.)', �.)-$& ;+(C'.)',
�'5(/ �" � �"!� �"" �#�# �"!�4" �"" 4�#�#
����� 66- 211 8�72- 7�601 251 051
! ����������� 20. 0�,10 8�6,6 7�-.6 ,51 05-
=���� ,38 611 .28 0�,-6 ,56 052
#����! �������� 0.1 02- ,80 613 153 057
������������ .8, 0�72- 8�67- 7�,,1 658 057
@������������
> ���������� .2 88, ,80 662 65, 058
!��"!������������� 862 781 6,6 188 ,57 058
A�����!���� -88 0�..6 8�11, 8�.16 852 357
����� 6�87- 7�7-2 0�.23 0�233 /,57 /35,
'�� ����A�� ��06 ,�301 7�-28 8�.-7 8�.-- /052 353
'������'�� ������
� ����! ����A�� � ,�2.3 6�61, 7�,61 7�6,. /75. 350
#������ ���
� ������ 8�8,8 8�.6- 8�.,- 7�8,7 353 35,
+� ������ �� 7�277 -�8,1 03�162 06�313 ,5- 056
+� ������ ���
4������������ 7�811 6�7-. 2�718 00�667 752 05,
+� ���� �� 01�331 01�61- 0,�080 0,�676 /052 350
@ �� 83�2,3 87�287 8,�21. 8.�-36 35, 352
! ����9����������������� ����� ����#�8338�<��� B��� ���� ��8383������ ����������������� � �
=�*�=C��= *��$ � ��:����8338;5
> ��9�������������������"����������������������� ��0.175�0.26������0..1����������5��(� ���
��������4� �������� �� ���������������������"����������������� ����5

� � ��������������
�$%&'���� ;+(,-.)(/�(0�8(&&-1>1�0+(8�.$*)-+'3��" �4" �$/,��#�#
;+(,-.)(/� �//-$&�5+(6)27)2(-1$/,�8')+.�)(/19 +$)'�7*'+.'/)9
�.)-$& ;+(C'.)', �.)-$& ;+(C'.)',
�'5(/ �" � �"!� �"" �#�# �"!�4" �"" 4�#�#
����� 8,7 -1, 8�0-1 7�-81 0358 857
! ����������� 0.1 616 --3 1.3 058 352
=���� 0 80 031 060 0,5- 056
#����! �������� 0 3 2 . 7-5- 356
������������ 0,6 8.8 131 0�362 151 052
@������������
> ���������� 08 -2 080 078 653 35,
!��"!������������� 03 ,- ,, ,2 /35, 35,
A�����!���� ,20 2-6 6., 603 /750 /351
����� .78 .7- 0�3,2 0�307 35. /350
'�� ����A�� ��06 ,06 ,,. 67, ,10 05, /356
'������'�� ������
� ����! ����A�� � 18 80, .1 .0 /-5, /357
#������ ���
� ������ 21 068 803 873 851 35,
+� ������ �� 166 8�303 ,�77- -�726 -5- 051
+� ������ ���
4������������ 607 0�776 8�0-. 8�162 ,50 053
+� ���� �� 0�.21 8�-01 8�,27 8�706 /35, /357
@ �� 8�1,8 ,�-81 -�20. 2�133 757 050
! ����9����������������� ����� ����#�8338�<��� B��� ���� ��8383������ ����������������� � �
=�*�=C��= *��$ � ��:����8338;5
> ��9�������������������"����������������������� ��0.175�0.26������0..1����������5��(� ���
��������4� �������� �� ���������������������"����������������� ����5

�;;�������F���;;��������D ������������� �
�$%&'��� ;+(,-.)(/�(0�.+-1)$.'$/1�0+(8�.$*)-+'3��" �4" �$/,��#�#
;+(,-.)(/� �//-$&�5+(6)27)2(-1$/,�8')+.�)(/19 +$)'�7*'+.'/)9
�.)-$& ;+(C'.)', �.)-$& ;+(C'.)',
�'5(/ �" � �"!� �"" �#�# �"!�4" �"" 4�#�#
����� ,-1 231 8�-66 7�.6- 035, 051
! ����������� 726 68. 228 0�0-, ,5, 058
=���� 80, 872 703 ,06 858 057
#����! �������� 87 71 -7 1. ,5- 053
������������ 8.8 773 773 ,02 353 053
@������������
> ���������� 0- 7, ,2 -, 852 057
!��"!������������� 73 ,8 28 008 651 05,
A�����!���� 77. 7,3 7.8 ,00 058 358
����� 066 06- 0,0 0-8 /352 35-
'�� ����A�� ��06 013 02, 888 8.7 05- 058
'������'�� ������
� ����! ����A�� � 77 -, 2- 038 856 351
#������ ���
� ������ 030 86, ,33 678 752 058
+� ������ �� 0�,-7 8�001 ,�63- -�763 -56 056
+� ������ ���
4������������ ..- 0�703 0�260 8�7., 85. 050
+� ���� �� 1.2 ... 0�8,0 0�630 052 352
@ �� 8�8-0 7�00- 6�1,1 1�260 658 05,
! ����9����������������� ����� ����#�8338�<��� B��� ���� ��8383������ ����������������� � �
=�*�=C��= *��$ � ��:����8338;5
> ��9�������������������"����������������������� ��0.175�0.26������0..1����������5��(� ���
��������4� �������� �� ���������������������"����������������� ����5

� � ��������������
�$%&'���! ;+(,-.)(/�(0�&(6=$&-'�0((,�012�0+(8�$<-$.-&)-+'3��" �4" �$/,��#�#
;+(,-.)(/� �//-$&�5+(6)27)2(-1$/,�8')+.�)(/19 +$)'�7*'+.'/)9
�.)-$& ;+(C'.)', �.)-$& ;+(C'.)',
�'5(/ �" � �"!� �"" �#�# �"!�4" �"" 4�#�#
����� 172 8�6-0 08�,06 80�,1- 0,50 85,
! ����������� 780 132 0�,., 7�672 -5, 752
=���� 017 -02 0�203 ,�877 .5, 752
#����! �������� 10 078 ,06 0�3,8 0353 ,50
������������ 0 81 01- 6-3 0-5. 658
@������������
> ���������� 00 -6 071 77, -57 ,53
!��"!������������� 6 . 77 082 0058 -50
A�����!���� 73 0,- 862 6,3 ,5. 757
����� 08- 80. 0.6 806 /053 35,
'�� ����A�� ��06 06 7- ,0 ,1 058 35-
'������'�� ������
� ����! ����A�� � 0.1 ,36 013 016 /153 350
#������ ���
� ������ 07 08 02 82 757 05.
+� ������ �� 0�780 ,�08. 0-�600 70�7-1 0858 852
+� ������ ���
4������������ 62, 0�6-2 ,�3.- .�2.0 257 75.
+� ���� �� 723 201 -28 0�337 /056 051
@ �� 0�138 ,�.,- 01�0.7 78�713 035. 852
! ����9����������������� ����� ����#�8338�<��� B��� ���� ��8383������ ����������������� � �
=�*�=C��= *��$ � ��:����8338;5
> ��9�������������������"����������������������� ��0.175�0.26������0..1����������5��(� ���
��������4� �������� �� ���������������������"����������������� ����5

�;;�������F���;;��������D ������������� �
�$%&'���" ;+(,-.)(/�(0�252=$&-'�0/012�0+(8�$<-$.-&)-+'3��" �4" �
$/,��#�#
;+(,-.)(/� �//-$&�5+(6)27)2(-1$/,�8')+.�)(/19 +$)'�7*'+.'/)9
�.)-$& ;+(C'.)', �.)-$& ;+(C'.)',
�'5(/ �" � �"!� �"" �#�# �"!�4" �"" 4�#�#
����� 3 8 07 87 015. 856
! ����������� 3 3 , 1 8258 856
=���� 3 3 3 3 /03353 D
#����! �������� 3 3 3 3 D D
������������ 3 7 8,2 ,32 ,,57 858
@������������
> ���������� 3 8 67 .7 7057 856
!��"!������������� 3 3 3 3 /03353 D
A�����!���� 0, 8, ,0 20 ,5, 753
����� 87 13 073 0.. 657 05.
'�� ����A�� ��06 -3 068 ,3. 1,0 25- 85-
'������'�� ������
� ����! ����A�� � - 07 01 82 856 858
#������ ���� ������ 8 ,8 ,6, 2.1 8853 753
+� ������ �� 0 2 7,8 617 7153 857
+� ������ ���
4������������ 0 - 78. 663 7.56 857
+� ���� �� 03, 733 0�360 0�.,- 0053 851
@ �� 036 732 0�7.8 8�60. 075, 85-
! ����9����������������� ����� ����#�8338�<��� B��� ���� ��8383������ ����������������� � �
=�*�=C��= *��$ � ��:����8338;5
> ��9�������������������"����������������������� ��0.175�0.26������0..1����������5��(� ���
��������4� �������� �� ���������������������"����������������� ����5
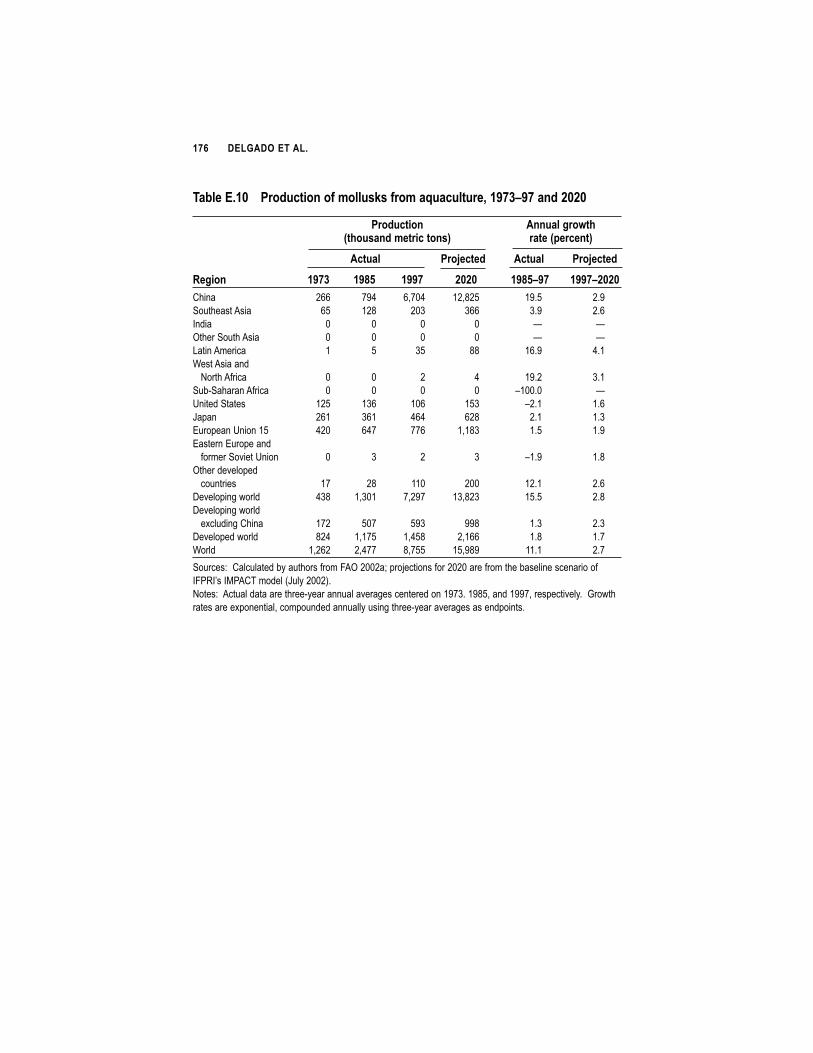
� � ��������������
�$%&'����# ;+(,-.)(/�(0�8(&&-1>1�0+(8�$<-$.-&)-+'3��" �4" �$/,��#�#
;+(,-.)(/� �//-$&�5+(6)27)2(-1$/,�8')+.�)(/19 +$)'�7*'+.'/)9
�.)-$& ;+(C'.)', �.)-$& ;+(C'.)',
�'5(/ �" � �"!� �"" �#�# �"!�4" �"" 4�#�#
����� 8-- 1., -�13, 08�286 0.56 85.
! ����������� -6 082 837 7-- 75. 85-
=���� 3 3 3 3 D D
#����! �������� 3 3 3 3 D D
������������ 0 6 76 22 0-5. ,50
@������������
> ���������� 3 3 8 , 0.58 750
!��"!������������� 3 3 3 3 /03353 D
A�����!���� 086 07- 03- 067 /850 05-
����� 8-0 7-0 ,-, -82 850 057
'�� ����A�� ��06 ,83 -,1 11- 0�027 056 05.
'������'�� ������
� ����! ����A�� � 3 7 8 7 /05. 052
#������ ���
� ������ 01 82 003 833 0850 85-
+� ������ �� ,72 0�730 1�8.1 07�287 0656 852
+� ������ ���
4������������ 018 631 6.7 ..2 057 857
+� ���� �� 28, 0�016 0�,62 8�0-- 052 051
@ �� 0�8-8 8�,11 2�166 06�.2. 0050 851
! ����9����������������� ����� ����#�8338�<��� B��� ���� ��8383������ ����������������� � �
=�*�=C��= *��$ � ��:����8338;5
> ��9�������������������"����������������������� ��0.175�0.26������0..1����������5��(� ���
��������4� �������� �� ���������������������"����������������� ����5

�;;�������F���;;��������D �������������
�$%&'����� ;+(,-.)(/�(0�.+-1)$.'$/1�0+(8�$<-$.-&)-+'3��" �4" �$/,��#�#
;+(,-.)(/� �//-$&�5+(6)27)2(-1$/,�8')+.�)(/19 +$)'�7*'+.'/)9
�.)-$& ;+(C'.)', �.)-$& ;+(C'.)',
�'5(/ �" � �"!� �"" �#�# �"!�4" �"" 4�#�#
����� 0 1. 766 1.2 0757 75-
! ����������� 01 03. 612 0�800 0,5. 757
=���� 3 08 20 07, 0153 858
#����! �������� 7 08 -8 0,0 0653 75-
������������ 0 ,7 0.1 7.- 0756 750
@������������
> ���������� 3 3 8 7 2150 052
!��"!������������� 3 3 7 , ,351 057
A�����!���� 8 7, 88 88 /75- 353
����� 0 8 8 8 /053 353
'�� ����A�� ��06 3 3 3 0 /03353 D
'������'�� ������
� ����! ����A�� � 3 3 3 3 D D
#������ ���
� ������ 3 3 8 7 715, 052
+� ������ �� 88 866 0�820 8�-.8 0,5, 757
+� ������ ���
4������������ 80 01- .8- 0�2., 0,5. 758
+� ���� �� 7 7- 8- 82 /852 357
@ �� 86 8.8 0�731 8�10. 0757 758
! ����9����������������� ����� ����#�8338�<��� B��� ���� ��8383������ ����������������� � �
=�*�=C��= *��$ � ��:����8338;5
> ��9�������������������"����������������������� ��0.175�0.26������0..1����������5��(� ���
��������4� �������� �� ���������������������"����������������� ����5

� ! ��������������
�$%&'����� ;+(,-.)(/�(0�0128'$&3��" �4" �$/,��#�#
;+(,-.)(/� �//-$&�5+(6)27)2(-1$/,�8')+.�)(/19 +$)'�7*'+.'/)9
�.)-$& ;+(C'.)', �.)-$& ;+(C'.)',
�'5(/ �" � �"!� �"" �#�# �"!�4" �"" 4�#�#
����� 7 6, 6,8 111 8050 05-
! ����������� 017 863 ,62 13, 658 05.
=���� 83 78 06 83 /-53 057
#����! �������� 0- 77 ,8 63 853 352
������������ 0�022 8�86. 8�1-7 7�616 051 050
@������������
> ���������� 86 61 .6 082 ,5, 057
!��"!������������� 03 2 ,- 1, 0-57 850
A�����!���� 82. 78. 733 7,1 /352 35-
����� 1-. 0�037 76. 766 /25. 353
'�� ����A�� ��06 601 6,3 -81 273 057 058
'������'�� ������
� ����! ����A�� � -60 1-. 801 882 /0353 358
#������ ���
� ������ 271 -38 -8, 110 357 35.
+� ������ �� 0�,60 8�168 ,�332 6�721 758 057
+� ������ ���
4������������ 0�,,. 8�-.2 7�,-- ,�-03 850 058
+� ���� �� 7�3-8 7�7,8 8�08- 8�670 /751 352
@ �� ,�60, -�3., -�077 1�.02 350 050
! ����9����������������� ����� ����#�8338�<��� B��� ���� ��8383������ ����������������� � �
=�*�=C��= *��$ � ��:����8338;5
> ��9�������������������"����������������������� ��0.175�0.26������0..1����������5��(� ���
��������4� �������� �� ���������������������"����������������� ����5

�;;�������F���;;��������D ������������� "
�$%&'����� ;+(,-.)(/�(0�012�(&3��" �4" �$/,��#�#
;+(,-.)(/� �//-$&�5+(6)27)2(-1$/,�8')+.�)(/19 +$)'�7*'+.'/)9
�.)-$& ;+(C'.)', �.)-$& ;+(C'.)',
�'5(/ �" � �"!� �"" �#�# �"!�4" �"" 4�#�#
����� 3 3 3 3 /03353 D
! ����������� 0 0 3 3 /03353 D
=���� 3 3 3 3 D D
#����! �������� 3 3 3 3 D D
������������ 0.- ,82 68, -23 051 050
@������������
> ���������� - 1 80 82 .50 057
!��"!������������� 0 0 , - 0353 052
A�����!���� .- 063 00, 078 /857 35-
����� 010 ,86 ,- ,- /0-5. 353
'�� ����A�� ��06 071 08. 0.3 868 758 058
'������'�� ������
� ����! ����A�� � - 6 7 7 /,51 353
#������ ���
� ������ 78, 823 887 811 /05. 35.
+� ������ �� 836 ,72 6,. 10, 05. 050
+� ������ ���
4������������ 836 ,72 6,. 10, 05. 050
+� ���� �� 177 ..0 61- 103 /,5, 35.
@ �� .72 0�,8. 0�08, 0�,86 /853 053
! ����9����������������� ����� ����#�8338�<��� B��� ���� ��8383������ ����������������� � �
=�*�=C��= *��$ � ��:����8338;5
> ��9�������������������"����������������������� ��0.175�0.26������0..1����������5��(� ���
��������4� �������� �� ���������������������"����������������� ����5
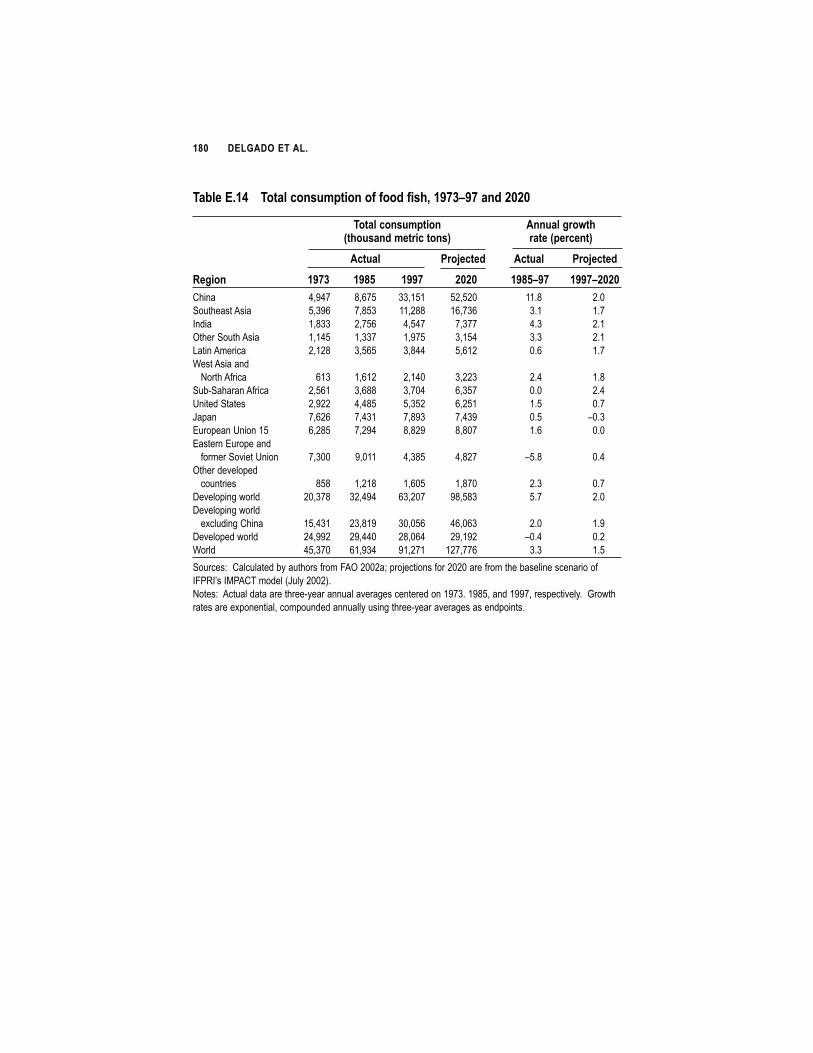
�!# ��������������
�$%&'����� �()$&�.(/1-8*)(/�(0�0((,�0123��" �4" �$/,��#�#
�()$&�.(/1-8*)(/� �//-$&�5+(6)27)2(-1$/,�8')+.�)(/19 +$)'�7*'+.'/)9
�.)-$& ;+(C'.)', �.)-$& ;+(C'.)',
�'5(/ �" � �"!� �"" �#�# �"!�4" �"" 4�#�#
����� ,�.,1 2�-16 77�060 68�683 0052 853
! ����������� 6�7.- 1�267 00�822 0-�17- 750 051
=���� 0�277 8�16- ,�6,1 1�711 ,57 850
#����! �������� 0�0,6 0�771 0�.16 7�06, 757 850
������������ 8�082 7�6-6 7�2,, 6�-08 35- 051
@������������
> ���������� -07 0�-08 8�0,3 7�887 85, 052
!��"!������������� 8�6-0 7�-22 7�13, -�761 353 85,
A�����!���� 8�.88 ,�,26 6�768 -�860 056 351
����� 1�-8- 1�,70 1�2.7 1�,7. 356 /357
'�� ����A�� ��06 -�826 1�8., 2�28. 2�231 05- 353
'������'�� ������
� ����! ����A�� � 1�733 .�300 ,�726 ,�281 /652 35,
#������ ���
� ������ 262 0�802 0�-36 0�213 857 351
+� ������ �� 83�712 78�,., -7�831 .2�627 651 853
+� ������ ���
4������������ 06�,70 87�20. 73�36- ,-�3-7 853 05.
+� ���� �� 8,�..8 8.�,,3 82�3-, 8.�0.8 /35, 358
@ �� ,6�713 -0�.7, .0�810 081�11- 757 056
! ����9����������������� ����� ����#�8338�<��� B��� ���� ��8383������ ����������������� � �
=�*�=C��= *��$ � ��:����8338;5
> ��9�������������������"����������������������� ��0.175�0.26������0..1����������5��(� ���
��������4� �������� �� ���������������������"����������������� ����5

�;;�������F���;;��������D �������������!�
�$%&'����� �(/1-8*)(/�(0�&(6=$&-'�0((,�0123��" �4" �$/,��#�#
�(/1-8*)(/� �//-$&�5+(6)27)2(-1$/,�8')+.�)(/19 +$)'�7*'+.'/)9
�.)-$& ;+(C'.)', �.)-$& ;+(C'.)',
�'5(/ �" � �"!� �"" �#�# �"!�4" �"" 4�#�#
����� 7�-6. 6�.38 0.�171 81�-31 035- 056
! ����������� ,�07- 6�1,2 1�206 03�1.- 85- 05,
=���� 0�720 8�031 7�,76 6�736 ,58 05.
#����! �������� 0�3-- 0�026 0�6.- 8�,6- 856 05.
������������ 0�768 8�76. 8�-00 7�1-3 352 05-
@������������
> ���������� 668 0�,76 0�117 8�-8- 052 051
!��"!������������� 8�01, 7�0.7 7�8.3 6�-3- 357 857
A�����!���� 2- -7 76 ,0 /,52 351
����� -0. .31 0�3,. .10 058 /357
'�� ����A�� ��06 7,2 67, 180 1,0 856 350
'������'�� ������
� ����! ����A�� � 8�833 8�6-6 063 0-0 /8050 357
#������ ���
� ������ -. 0,3 076 0-0 /357 352
+� ������ �� 06�,20 87�-03 ,0�870 6.�,88 ,52 05-
+� ������ ���
4������������ 00�280 01�132 80�,., 70�206 05- 051
+� ���� �� 7�780 ,�803 8�3.3 8�317 /651 353
@ �� 02�238 81�283 ,7�780 -0�,.- 752 056
! ����9����������������� ����� ����#�8338�<��� B��� ���� ��8383������ ����������������� � �
=�*�=C��= *��$ � ��:����8338;5
> ��9�������������������"����������������������� ��0.175�0.26������0..1����������5��(� ���
��������4� �������� �� ���������������������"����������������� ����5

�!� ��������������
�$%&'����� �(/1-8*)(/�(0�252=$&-'�0/0123��" �4" �$/,��#�#
�(/1-8*)(/� �//-$&�5+(6)27)2(-1$/,�8')+.�)(/19 +$)'�7*'+.'/)9
�.)-$& ;+(C'.)', �.)-$& ;+(C'.)',
�'5(/ �" � �"!� �"" �#�# �"!�4" �"" 4�#�#
����� 71, 6-2 0�.71 7�602 0352 85-
! ����������� 182 0�06- 0�268 7�031 ,53 857
=���� 73, ,26 2,8 0�6-2 ,51 851
#����! �������� 17 0,. 73, 6-, -50 851
������������ 633 .33 280 0�803 /352 051
@������������
> ���������� ,- 0,7 8.3 ,-2 -50 850
!��"!������������� 7-7 ,17 76. -,1 /857 85-
A�����!���� 0�-,2 8�6,7 7�-36 ,�0-, 753 35-
����� 6�,.8 ,�,17 ,�01- 7�2.6 /35- /357
'�� ����A�� ��06 ,�227 ,�.11 6�160 6�-,. 058 /350
'������'�� ������
� ����! ����A�� � 6�308 -�81. ,�32, ,�,.7 /756 35,
#������ ���
� ������ -06 126 0�323 0�8,0 851 35-
+� ������ �� 8�1.1 ,�163 1�3-1 08�376 75, 857
+� ������ ���
4������������ 8�,87 ,�028 6�073 2�601 051 858
+� ���� �� 01�-63 0.�361 02�-.1 0.�,,8 /358 358
@ �� 83�,,1 87�231 86�1-, 70�,11 351 35.
! ����9����������������� ����� ����#�8338�<��� B��� ���� ��8383������ ����������������� � �
=�*�=C��= *��$ � ��:����8338;5
> ��9�������������������"����������������������� ��0.175�0.26������0..1����������5��(� ���
��������4� �������� �� ���������������������"����������������� ����5

�;;�������F���;;��������D �������������!�
�$%&'���� �(/1-8*)(/�(0�8(&&-1>13��" �4" �$/,��#�#
�(/1-8*)(/� �//-$&�5+(6)27)2(-1$/,�8')+.�)(/19 +$)'�7*'+.'/)9
�.)-$& ;+(C'.)', �.)-$& ;+(C'.)',
�'5(/ �" � �"!� �"" �#�# �"!�4" �"" 4�#�#
����� 688 0�,,, 2�678 0-�310 0-53 852
! ����������� 8,1 661 -.6 0�88. 05. 856
=���� 0 1 72 1, 0652 85.
#����! �������� 0 3 8 8 8-5- 353
������������ 0,7 028 773 687 650 853
@������������
> ���������� 7 7 8. 60 8853 856
!��"!������������� 00 6 82 6- 0,5. 750
A�����!���� --7 0�87, 2-1 0�31, /85. 35.
����� 0�830 0�688 0�207 0�123 056 /350
'�� ����A�� ��06 17, 0�736 0�-01 0�-.0 052 358
'������'�� ������
� ����! ����A�� � 17 08- 030 002 /05. 351
#������ ���
� ������ 23 23 87. 8.1 .5- 35.
+� ������ �� 0�321 8�-78 03�,.- 0.�817 0858 851
+� ������ ���
4������������ 6-6 0�022 0�.-, 7�838 ,57 850
+� ���� �� 8�160 ,�8-1 ,�-7- ,�.-3 351 357
@ �� 7�272 -�2.. 06�078 8,�877 -52 850
! ����9����������������� ����� ����#�8338�<��� B��� ���� ��8383������ ����������������� � �
=�*�=C��= *��$ � ��:����8338;5
> ��9�������������������"����������������������� ��0.175�0.26������0..1����������5��(� ���
��������4� �������� �� ���������������������"����������������� ����5

�!� ��������������
�$%&'����! �(/1-8*)(/�(0�.+-1)$.'$/13��" �4" �$/,��#�#
�(/1-8*)(/� �//-$&�5+(6)27)2(-1$/,�8')+.�)(/19 +$)'�7*'+.'/)9
�.)-$& ;+(C'.)', �.)-$& ;+(C'.)',
�'5(/ �" � �"!� �"" �#�# �"!�4" �"" 4�#�#
����� 7.0 1-0 8�.,6 6�78, 005. 85-
! ����������� 82- 7.8 .8- 0�-3, 15, 85,
=���� 0,1 062 878 ,73 757 851
#����! �������� 6 7 17 078 735. 85-
������������ 07, 08, 28 00. /75, 05-
@������������
> ���������� 08 70 ,2 12 75- 850
!��"!������������� 07 0- 81 ,2 ,58 856
A�����!���� 68- -,6 2,6 .18 857 35-
����� 70, 68. 266 1.7 ,50 /357
'�� ����A�� ��06 780 ,11 1,3 18- 751 /350
'������'�� ������
� ����! ����A�� � 06 ,3 63 66 052 35,
#������ ���
� ������ ., 807 060 010 /852 356
+� ������ �� 0�307 0�637 ,�,07 1�267 .5, 856
+� ������ ���
4������������ -88 1,0 0�,-2 8�68. 65. 85,
+� ���� �� 0�810 0�.36 8�-,0 8�101 852 350
@ �� 8�82, 7�,32 1�36, 03�613 -57 052
! ����9����������������� ����� ����#�8338�<��� B��� ���� ��8383������ ����������������� � �
=�*�=C��= *��$ � ��:����8338;5
> ��9�������������������"����������������������� ��0.175�0.26������0..1����������5��(� ���
��������4� �������� �� ���������������������"����������������� ����5

�;;�������F���;;��������D �������������!�
�$%&'����" �1'�(0�0128'$&3��" �4" ��$/,��#�#
�1' �//-$&�5+(6)27)2(-1$/,�8')+.�)(/19 +$)'�7*'+.'/)9
�.)-$& ;+(C'.)', �.)-$& ;+(C'.)',
�'5(/ �" � �"!� �"" �#�# �"!�4" �"" 4�#�#
����� 008 66, 0�617 8�326 .50 058
! ����������� 076 872 182 0�820 .52 856
=���� 01 78 86 ,6 /853 85-
#����! �������� 0 76 ,1 2. 85- 852
������������ ,27 -18 ,60 --3 /757 051
@������������
> ���������� .. 801 868 713 057 051
!��"!������������� 06 08 0, 8- 05- 851
A�����!���� 77, ,-7 8-1 8.- /,56 35,
����� 282 0�368 170 136 /753 /358
'�� ����A�� ��06 0�03, 0�0.0 0�313 0�0,- /35. 357
'������'�� ������
� ����! ����A�� � ..8 0�0,2 7-0 7-7 /.58 353
#������ ���
� ������ 71. ,80 661 1-6 85, 05,
+� ������ �� 211 0�280 7�0,2 ,�-,0 ,51 051
+� ������ ���
4������������ 1-6 0�8-- 0�616 8�66- 052 850
+� ���� �� 7�-71 ,�817 8�.26 7�811 /85. 35,
@ �� ,�60, -�3., -�077 1�.02 350 050
! ����9����������������� ����� ����#�8338�<��� B��� ���� ��8383������ ����������������� � �
=�*�=C��= *��$ � ��:����8338;5
> ��9�������������������"����������������������� ��0.175�0.26������0..1����������5��(� ���
��������4� �������� �� ���������������������"����������������� ����5

�!� ��������������
�$%&'����# �1'�(0�012�(&3��" �4" ��$/,��#�#
�1' �//-$&�5+(6)27)2(-1$/,�8')+.�)(/19 +$)'�7*'+.'/)9
�.)-$& ;+(C'.)', �.)-$& ;+(C'.)',
�'5(/ �" � �"!� �"" �#�# �"!�4" �"" 4�#�#
����� 3 0 07 0, 8351 357
! ����������� 0 8 1 00 035- 853
=���� 3 3 3 3 D D
#����! �������� 3 3 3 3 /03353 D
������������ 83, 707 7,2 632 35. 051
@������������
> ���������� 8 6 02 81 0850 052
!��"!������������� 8 0 0 8 /850 750
A�����!���� ,7 7. 7, ,- /058 057
����� 1. 838 036 00, /657 35,
'�� ����A�� ��06 7.0 -,3 776 7-, /658 35,
'������'�� ������
� ����! ����A�� � . 77 7 7 /0250 353
#������ ���
� ������ 838 026 868 78, 85- 050
+� ������ �� 806 78. 7., 61, 056 05-
+� ������ ���
4������������ 80, 782 720 6-3 057 051
+� ���� �� 18, 0�3.. 173 263 /75, 351
@ �� .72 0�,8. 0�08, 0�,86 /853 053
! ����9����������������� ����� ����#�8338�<��� B��� ���� ��8383������ ����������������� � �
=�*�=C��= *��$ � ��:����8338;5
> ��9�������������������"����������������������� ��0.175�0.26������0..1����������5��(� ���
��������4� �������� �� ���������������������"����������������� ����5

�;;�������F���;;��������D �������������!
�$%&'����� ;'+�.$*)$�0((,�012�.(/1-8*)(/3��""
�(/1-8*)(/�7>5@*'+1(/@?'$+9
�(6=$&-' :52=$&-' �()$&�'5(/ 0((,�012 0/012 �(&&-1>1 �+-1)$.'$/1 0((,�012
����� 0652 056 -52 85, 8-56
! ����������� 065. 752 05, 05. 8753
=���� 75- 35. 353 358 ,51
#����! �������� ,5. 35. 353 358 -53
������������ 657 051 351 358 152
@������������> ���������� 650 352 350 350 -58
!��"!������������� 65. 35- 350 353 -51
A�����!���� 350 0757 758 750 0.51
����� 257 7750 0,5, -52 -85-
'�� ����A�� ��06 05. 065, ,57 853 875-
'������'�� ������
� ����! ����A�� � 35, .5. 358 350 035-
#������ ���� ������ 058 .5. 858 05, 0,51
+� ������ �� .50 05- 857 053 0,53
+� ������ ���
4������������ -5- 05- 35- 356 .58
+� ���� �� 05- 0,56 75- 853 8051
@ �� 156 ,5, 85- 058 0651
! ���9����������������� ����� ����#�8338�5
> �9��+����������"����������������������� ��0..15

�!! ��������������
�$%&'����� ;+(C'.)',�*'+�.$*)$�0((,�012�.(/1-8*)(/3��#�#
;+(C'.)',�.(/1-8*)(/�7>5@*'+1(/@?'$+9
�(6=$&-' :52=$&-' �()$&�'5(/ 0((,�012 0/012 �(&&-1>1 �+-1)$.'$/1 0((,�012
����� 025. 85, 0053 75- 765.
! ����������� 0-5- ,52 05. 856 8652
=���� ,58 058 350 357 652
#����! �������� ,52 050 353 357 -50
������������ 652 05. 352 358 25-
@������������> ���������� 658 35. 350 358 -5,
!��"!������������� 652 351 350 350 -5-
A�����!���� 350 0750 75, 750 0.51
����� 15. 7056 0,5, -5, -358
'�� ����A�� ��06 853 0658 ,5- 853 8751
'������'�� ������
� ����! ����A�� � 35, 0352 357 350 005-
#������ ���� ������ 058 .57 858 057 0,53
+� ������ �� .51 853 758 057 0-58
+� ������ ���
4������������ -5. 052 351 356 .5.
+� ���� �� 056 0,57 75- 853 8056
@ �� 258 ,58 758 05, 0150
! ���9��*� B��� ���� ��8383������ ����������������� � ��=�*�=C��= *��$ � ��:����8338;5
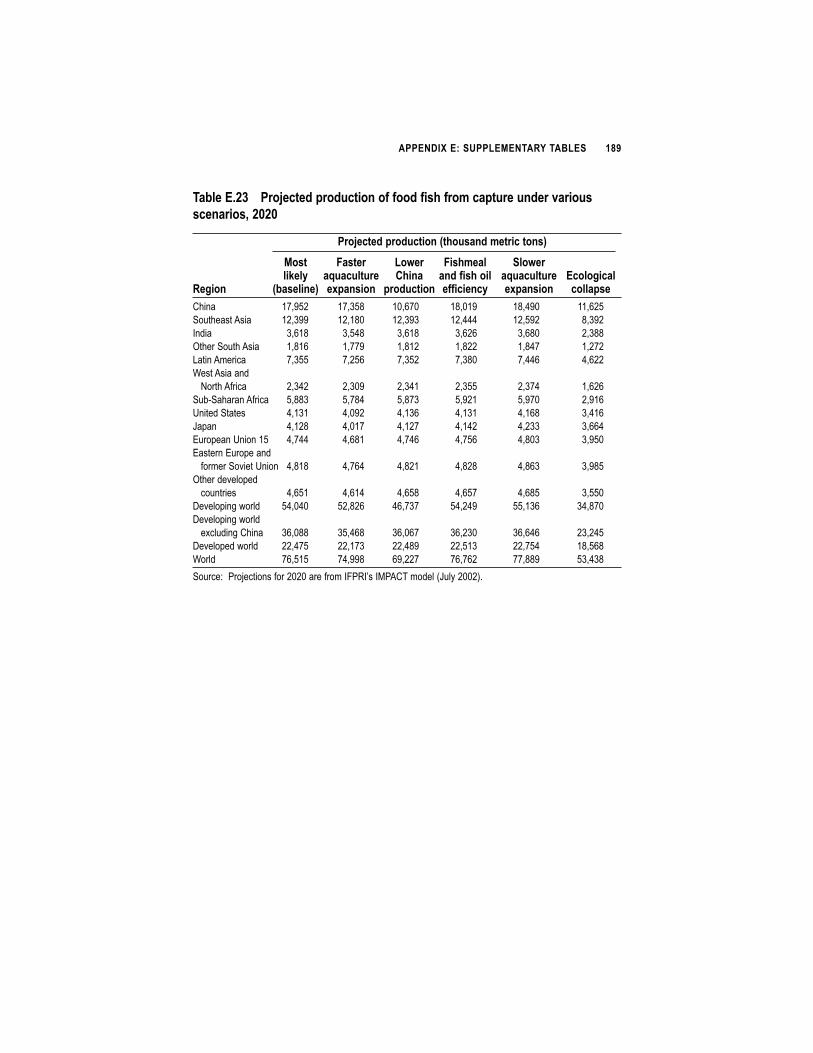
�;;�������F���;;��������D �������������!"
�$%&'����� ;+(C'.)',�*+(,-.)(/�(0�0((,�012�0+(8�.$*)-+'�-/,'+�$+(-1�
1.'/$+(13��#�#
;+(C'.)',�*+(,-.)(/�7)2(-1$/,�8')+.�)(/19
�(1) �$1)'+ �(6'+ �128'$& �&(6'+&>'&? $<-$.-&)-+' �2/$ $/,�012�(& $<-$.-&)-+' �.(&(5.$&
�'5(/ 7%$1'&/'9 ' *$/1(/ *+(,-.)(/ '00.'/.? ' *$/1(/ .(&&$*1'
����� 01�.68 01�762 03�-13 02�30. 02�,.3 00�-86
! ����������� 08�7.. 08�023 08�7.7 08�,,, 08�6.8 2�7.8
=���� 7�-02 7�6,2 7�-02 7�-8- 7�-23 8�722
#����! �������� 0�20- 0�11. 0�208 0�288 0�2,1 0�818
������������ 1�766 1�86- 1�768 1�723 1�,,- ,�-88
@������������
> ���������� 8�7,8 8�73. 8�7,0 8�766 8�71, 0�-8-
!��"!������������� 6�227 6�12, 6�217 6�.80 6�.13 8�.0-
A�����!���� ,�070 ,�3.8 ,�07- ,�070 ,�0-2 7�,0-
����� ,�082 ,�301 ,�081 ,�0,8 ,�877 7�--,
'�� ����A�� ��06 ,�1,, ,�-20 ,�1,- ,�16- ,�237 7�.63
'������'�� ������
� ����! ����A�� � ,�202 ,�1-, ,�280 ,�282 ,�2-7 7�.26
#������ ���
� ������ ,�-60 ,�-0, ,�-62 ,�-61 ,�-26 7�663
+� ������ �� 6,�3,3 68�28- ,-�171 6,�8,. 66�07- 7,�213
+� ������ ���
4������������ 7-�322 76�,-2 7-�3-1 7-�873 7-�-,- 87�8,6
+� ���� �� 88�,16 88�017 88�,2. 88�607 88�16, 02�6-2
@ �� 1-�606 1,�..2 -.�881 1-�1-8 11�22. 67�,72
! ���9��*� B��� ���� ��8383������ ��=�*�=C��= *��$ � ��:����8338;5

�"# ��������������
�$%&'����� ;+(C'.)',�*+(,-.)(/�(0�0((,�012�0+(8�$<-$.-&)-+'�-/,'+�$+(-1
1.'/$+(13��#�#
;+(C'.)',�*+(,-.)(/�7)2(-1$/,�8')+.�)(/19
�(1) �$1)'+ �(6'+ �128'$& �&(6'+&>'&? $<-$.-&)-+' �2/$ $/,�012�(& $<-$.-&)-+' �.(&(5.$&
�'5(/ 7%$1'&/'9 ' *$/1(/ *+(,-.)(/ '00.'/.? ' *$/1(/ .(&&$*1'
����� 76�088 ,,�707 76�30. 76�820 81�627 7-�376
! ����������� 6�088 1�828 6�002 6�0.0 7�6-1 6�07-
=���� ,�7-1 -�8,, ,�768 ,�,3, 7�307 ,�7.1
#����! �������� 0�027 0�1,. 0�023 0�0.6 121 0�02.
������������ 0�,68 8�03, 0�,68 0�,21 0�33. 0�,,6
@������������
> ���������� ,7, -80 ,77 ,,3 733 ,73
!��"!������������� 078 8,, 078 077 10 070
A�����!���� 1.- 0�306 1.7 23, -88 281
����� 0�3,, 0�006 0�3,0 0�367 .10 0�3.7
'�� ����A�� ��06 0�.18 8�77. 0�.13 8�331 0�-67 8�372
'������'�� ������
� ����! ����A�� � 83- 83. 836 832 830 837
#������ ���
� ������ 0�082 0�,1, 0�08. 0�018 268 0�0,,
+� ������ �� ,2�,66 -7�78. ,2�786 ,2�11- 7-�2-7 ,.�,0-
+� ������ ���
4������������ 07�777 0.�30- 07�73- 07�,.6 .�823 07�720
+� ���� �� 6�0,7 -�063 6�076 6�8,8 ,�8.. 6�73,
@ �� 67�6.1 -.�,23 67�,-3 6,�30. ,0�0-0 6,�183
! ���9��*� B��� ���� ��8383������ ��=�*�=C��= *��$ � ��:����8338;5

�;;�������F���;;��������D �������������"�
�$%&'����� ;+(C'.)',�)()$&�*+(,-.)(/�(0�0((,�012�-/,'+�$+(-1�1.'/$+(13
�#�#
;+(C'.)',�)()$&�*+(,-.)(/�7)2(-1$/,�8')+.�)(/19
�(1) �$1)'+ �(6'+ �128'$& �&(6'+&>'&? $<-$.-&)-+' �2/$ $/,�012�(& $<-$.-&)-+' �.(&(5.$&
�'5(/ 7%$1'&/'9 ' *$/1(/ *+(,-.)(/ '00.'/.? ' *$/1(/ .(&&$*1'
����� 67�31, -0�-10 ,6�-2. 67�733 ,-�317 ,1�--3
! ����������� 01�680 0.�,-8 01�600 01�-76 0-�06. 07�682
=���� 1�.26 .�1.8 1�.13 2�373 -�-.7 -�126
#����! �������� 8�... 7�682 8�..8 7�301 8�-7, 8�,-0
������������ 2�231 .�7-3 2�23, 2�2-1 2�,66 -�3-1
@������������
> ���������� 8�11- 8�.73 8�11, 8�1.6 8�-1, 8�36-
!��"!������������� -�306 -�382 -�336 -�36, -�3,0 7�3,1
A�����!���� ,�.81 6�031 ,�.8. ,�.76 ,�1.3 ,�8,7
����� 6�018 6�078 6�0-2 6�0.6 6�83, ,�161
'�� ����A�� ��06 -�10- 1�383 -�10- -�1-7 -�,6- 6�.22
'������'�� ������
� ����! ����A�� � 6�38, ,�.17 6�38- 6�37- 6�3-, ,�022
#������ ���
� ������ 6�11. -�322 6�121 6�28. 6�671 ,�-.,
+� ������ �� 038�,.6 00-�066 .6�3-8 037�386 .0�... 2,�82-
+� ������ ���
4������������ ,.�,80 6,�,2, ,.�717 ,.�186 ,6�.8- 7-�-8-
+� ���� �� 81�-02 82�787 81�-8, 81�166 81�367 87�218
@ �� 073�008 0,,�,12 088�-21 073�120 00.�363 032�062
! ���9��*� B��� ���� ��8383������ ��=�*�=C��= *��$ � ��:����8338;5

�"� ��������������
�$%&'����� ;+(C'.)',�)()$&�.(/1-8*)(/�(0�0((,�012�-/,'+�$+(-1�1.'/$+(13
�#�#
;+(C'.)',�)()$&�.(/1-8*)(/�7)2(-1$/,�8')+.�)(/19
�(1) �$1)'+ �(6'+ �128'$& �&(6'+&>'&? $<-$.-&)-+' �2/$ $/,�012�(& $<-$.-&)-+' �.(&(5.$&
�'5(/ 7%$1'&/'9 ' *$/1(/ *+(,-.)(/ '00.'/.? ' *$/1(/ .(&&$*1'
����� 68�683 6.�.78 ,6�013 68�200 ,-�26, ,,�,78
! ����������� 0-�17- 02�601 0-�1,6 0-�27. 06�762 0,�3,6
=���� 1�711 2�873 1�7.0 1�,70 -�187 -�033
#����! �������� 7�06, 7�636 7�0-8 7�01- 8�227 8�-,.
������������ 6�-08 -�0-0 6�-88 6�-,, 6�020 ,�122
@������������
> ���������� 7�887 7�6.. 7�876 7�8,- 8�.77 8�18.
!��"!������������� -�761 1�8-- -�72. -�,0, 6�-13 6�8.0
A�����!���� -�860 -�-3. -�836 -�8-1 6�.10 ,�23,
����� 1�,7. 1�20, 1�,08 1�,,1 1�07. -�828
'�� ����A�� ��06 2�231 .�731 2�1-7 2�286 2�,07 1�33,
'������'�� ������
� ����! ����A�� � ,�281 ,�.., ,�1.8 ,�2,, ,�-., 7�667
#������ ���
� ������ 0�213 0�.11 0�26. 0�21, 0�121 0�,,.
+� ������ �� .2�627 000�888 .0�706 ..�01- 22�22, 27�31,
+� ������ ���
4������������ ,-�3-7 60�8.3 ,-�0,6 ,-�7-6 ,8�373 72�-,8
+� ���� �� 8.�0.8 73�133 8.�370 8.�86. 82�330 87�32.
@ �� 081�11- 0,0�.87 083�7,1 082�,76 00-�226 03-�0-8
! ����9��*� B��� ���� ��8383������ ��=�*�=C��= *��$ � ��:����8338;5

�;;�������F���;;��������D �������������"�
�$%&'���� ;'+�.$*)$�.(/1-8*)(/�(0�&(6=$&-'�0((,�0123��" �4" �$/,��#�#
�(/1-8*)(/� �//-$&�5+(6)27>5@.$*)$@?'$+9 +$)'�7*'+.'/)9
�.)-$& ;+(C'.)', �.)-$& ;+(C'.)',
�'5(/ �" � �"!� �"" �#�# �"!�4" �"" 4�#�#
����� ,50 656 0652 025. .58 352
! ����������� 0756 0,56 065. 0-5- 352 358
=���� 857 851 75- ,58 858 351
#����! �������� 652 ,52 ,5. ,52 350 /350
������������ ,56 -53 657 652 /053 35,
@������������> ���������� 753 656 650 658 /35- 350
!��"!������������� 15- 15. 65. 652 /85, /350
A�����!���� 35, 357 350 350 /651 353
����� 651 156 257 15. 35. /358
'�� ����A�� ��06 053 056 05. 853 858 358
'������'�� ������
� ����! ����A�� � -50 -56 35, 35, /8057 357
#������ ���
� ������ 35. 056 058 058 /052 /350
+� ������ �� 656 -56 .50 .51 852 357
+� ������ ���
4������������ -58 153 -5- -5. /356 358
+� ���� �� 753 756 05- 056 /-58 /357
@ �� ,52 652 156 258 858 35,
! ����9����������������� ����� ����#�8338�<��� B��� ���� ��8383������ ����������������� � �
=�*�=C��= *��$ � ��:����8338;5
> ��9�������������������"����������������������� ��0.175�0.26������0..1����������5��(� ���
��������4� �������� �� ���������������������"����������������� ����5

�"� ��������������
�$%&'����! ;'+�.$*)$�.(/1-8*)(/�(0�252=$&-'�0/0123��" �4" �$/,��#�#
�(/1-8*)(/� �//-$&�5+(6)27>5@.$*)$@?'$+9 +$)'�7*'+.'/)9
�.)-$& ;+(C'.)', �.)-$& ;+(C'.)',
�'5(/ �" � �"!� �"" �#�# �"!�4" �"" 4�#�#
����� 35, 356 056 85, .5, 05.
! ����������� 85, 85. 752 ,52 858 053
=���� 356 35- 35. 058 851 056
#����! �������� 35, 35- 35. 050 75- 351
������������ 051 857 051 05. /856 356
@������������
> ���������� 357 356 352 35. 756 356
!��"!������������� 057 058 35- 351 /,5. 358
A�����!���� 15- 0356 0757 0750 853 353
����� 6356 7153 7750 7056 /35. /358
'�� ����A�� ��06 0,50 075. 065, 0658 35. 353
'������'�� ������
� ����! ����A�� � 075. 0652 .5. 0352 /752 35,
#������ ���
� ������ 253 25- .5. .57 050 /357
+� ������ �� 053 057 05- 853 056 053
+� ������ ���
4������������ 057 05- 05- 052 /35, 351
+� ���� �� 065. 0651 0,56 0,57 /351 353
@ �� 658 ,5. ,5, ,58 /35. /358
! ����9����������������� ����� ����#�8338�<��� B��� ���� ��8383������ ����������������� � �
=�*�=C��= *��$ � ��:����8338;5
> ��9�������������������"����������������������� ��0.175�0.26������0..1����������5��(� ���
��������4� �������� �� ���������������������"����������������� ����5

�;;�������F���;;��������D �������������"�
�$%&'����" ;'+�.$*)$�.(/1-8*)(/�(0�8(&&-1>13��" �4" �$/,��#�#
�(/1-8*)(/� �//-$&�5+(6)27>5@.$*)$@?'$+9 +$)'�7*'+.'/)9
�.)-$& ;+(C'.)', �.)-$& ;+(C'.)',
�'5(/ �" � �"!� �"" �#�# �"!�4" �"" 4�#�#
����� 35- 057 -52 0053 0,56 850
! ����������� 352 05, 05, 05. 350 057
=���� 353 353 353 350 075- 051
#����! �������� 353 353 353 353 8751 /05.
������������ 356 356 351 352 758 352
@������������
> ���������� 353 353 350 350 0.58 352
!��"!������������� 353 353 350 350 005. 35-
A�����!���� 750 650 758 75, /752 357
����� 0050 085- 0,5, 0,5, 050 353
'�� ����A�� ��06 850 75- ,57 ,5- 056 358
'������'�� ������
� ����! ����A�� � 358 357 358 357 /858 351
#������ ���
� ������ 053 35. 858 858 15. 350
+� ������ �� 35, 351 857 758 0358 057
+� ������ ���
4������������ 357 356 35- 351 850 35-
+� ���� �� 856 756 75- 75- 350 350
@ �� 053 05, 85- 758 650 053
! ����9����������������� ����� ����#�8338�<��� B��� ���� ��8383������ ����������������� � �
=�*�=C��= *��$ � ��:����8338;5
> ��9�������������������"����������������������� ��0.175�0.26������0..1����������5��(� ���
��������4� �������� �� ���������������������"����������������� ����5
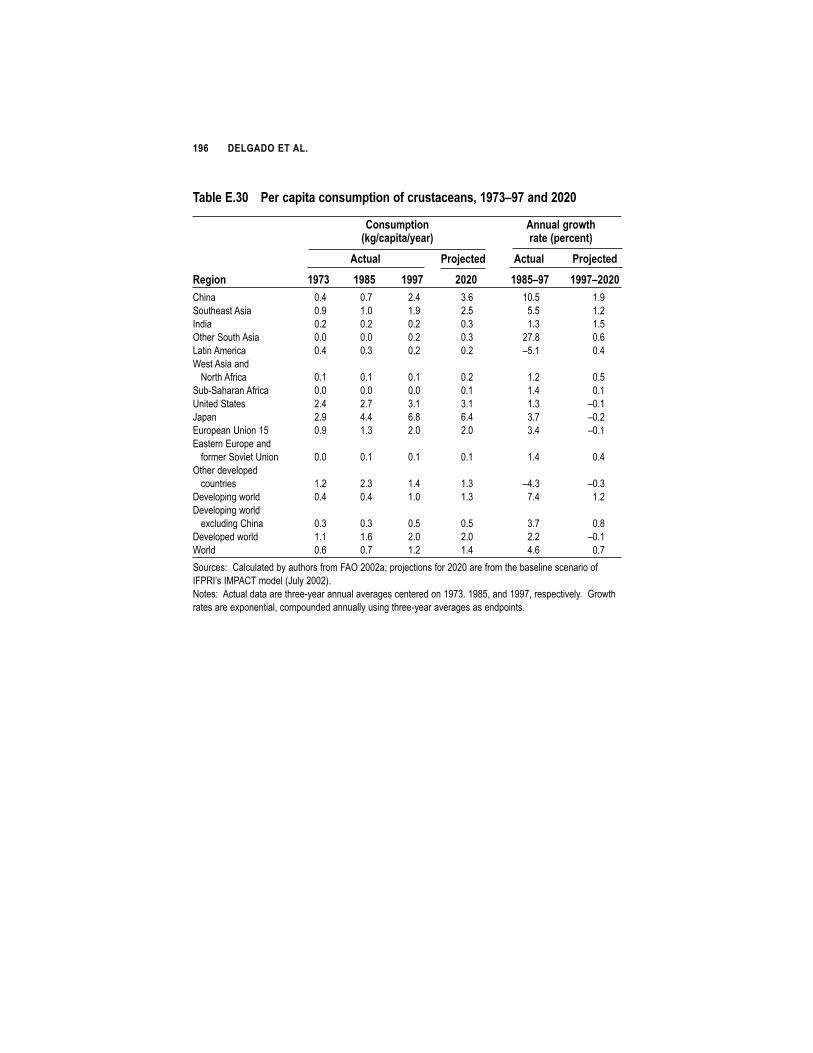
�"� ��������������
�$%&'����# ;'+�.$*)$�.(/1-8*)(/�(0�.+-1)$.'$/13��" �4" �$/,��#�#
�(/1-8*)(/� �//-$&�5+(6)27>5@.$*)$@?'$+9 +$)'�7*'+.'/)9
�.)-$& ;+(C'.)', �.)-$& ;+(C'.)',
�'5(/ �" � �"!� �"" �#�# �"!�4" �"" 4�#�#
����� 35, 351 85, 75- 0356 05.
! ����������� 35. 053 05. 856 656 058
=���� 358 358 358 357 057 056
#����! �������� 353 353 358 357 8152 35-
������������ 35, 357 358 358 /650 35,
@������������
> ���������� 350 350 350 358 058 356
!��"!������������� 353 353 353 350 05, 350
A�����!���� 85, 851 750 750 057 /350
����� 85. ,5, -52 -5, 751 /358
'�� ����A�� ��06 35. 057 853 853 75, /350
'������'�� ������
� ����! ����A�� � 353 350 350 350 05, 35,
#������ ���
� ������ 058 857 05, 057 /,57 /357
+� ������ �� 35, 35, 053 057 15, 058
+� ������ ���
4������������ 357 357 356 356 751 352
+� ���� �� 050 05- 853 853 858 /350
@ �� 35- 351 058 05, ,5- 351
! ����9����������������� ����� ����#�8338�<��� B��� ���� ��8383������ ����������������� � �
=�*�=C��= *��$ � ��:����8338;5
> ��9�������������������"����������������������� ��0.175�0.26������0..1����������5��(� ���
��������4� �������� �� ���������������������"����������������� ����5

� � � � � � ' *
�$%#+�� #���-% $+
Aquaculture The cultivation of food fish or shellfish under con-trolled conditions, including marine net pens, fresh-water ponds, brackish-water ponds, and cages
Aquafeeds Formulated feed provided to organisms raised inaquaculture
Baseline data The starting dataset for economic projections, inthis case a consistent set of production, consump-tion, and trade figures for 32 food and feed com-modities in 36 country groups averaged over annualFAO observations for 1996–98
Baseline scenario The “most likely” scenario in economic modeling,incorporating the authors’ best estimate of modelparameters combined with the baseline data
Benthic Living in or on the bottom of a body of water (suchas clams)
Bivalves Mollusks with two-valved shells, such as clams ormussels
BRD Bycatch Reduction Device
Broodstock Captured wild organisms (such as shrimp orsalmon) that are used for breeding
BSE Bovine Spongiform Encephalopathy, commonlyknown as “mad cow disease,” a degenerative disor-der affecting the central nervous system of cattle,linked to the fatal Variant Creutzfeldt-Jacob diseasein humans
�"

�"! ��������������
Bycatch The inadvertent catch of organisms that were notspecifically targeted by a fishing operation (forexample, nontarget fish species, marine mammals,seabirds) that are either discarded (see “discards”) orlanded for commercial sale
CAC Codex Alimentarius Commission
Capture fisheries Fishing operations that catch wild fish, either infreshwater or saltwater
Carnivorous aquaculture The cultivation of aquatic organisms that requireanimal matter as part of their feed, such as salmonor shrimp
Cephalopods Marine mollusks in the class Cephalopoda, such assquid and octopus
C.i.f. Cost, insurance, and freight; the price of a tradedgood including transport and associated costs
Cross-price elasticity A ratio measuring the percentage change in the of demand demand for a good, X, in response to a percentage
change in the price for another good, Y
Cross-price elasticity A ratio measuring the percentage change in the sup-of supply ply for a good, X, in response to a percentage
change in the price for another good, Y
CSE Consumer Subsidy Equivalent
Demersal Living near the bottom of a body of water
Diadromous Migrating between freshwater and saltwater
Discards Fish that are thrown away after being caught, usual-ly because of undesirable characteristics (the wrongspecies, unmarketable, undersized, and so on); asubset of bycatch
Eco-labeling The practice of certifying a product as having beenproduced under environmentally sustainable conditions
EEZ Exclusive Economic Zone
Effluent An outflow, especially of liquid waste, in this con-text from an aquaculture operation

�;;�������F������D��������������D �""
El Niño/Southern A linked ocean–atmosphere phenomenon that Oscillation or ENSO occurs quasi-periodically and results in the warming
of the eastern equatorial Pacific Ocean along withvarious climatic anomalies
Eutrophication The process of enrichment of a body of water byorganic nutrients, causing algal growth and thusreduced dissolved oxygen content, often resulting inthe deaths of other organisms
Exclusive Economic Zone An area of the sea, typically within 200 nauticalmiles from the shore of a sovereign nation, in whichthe nation may claim the rights to exploit naturalresources; defined by the United NationsConvention on the Law of the Sea
Externalities Costs/benefits of an activity that are not borne/cap-tured by the originating agent
FAO Food and Agriculture Organization of the UnitedNations
Feed conversion efficiency A measure of the ability to convert animal feed intoanimal meat, expressed as the ratio of live weightgain to feed ingested
Fish oil Usually a byproduct of the fishmeal manufacturingprocess, used for pharmaceuticals, fish feeds, and fordirect human consumption
Fishmeal Cooked, pressed, dried, and milled fish, usuallysmall pelagic fish, used for animal feeds
Fry Juvenile fish able to obtain their own food
Gamete Sperm (in the case of a male), or egg (in the case ofa female), in this context referring to fish
GATT General Agreement on Tariffs and Trade
GESAMP Group of Experts on the Scientific Aspects ofMarine Pollution
GIS Geographic Information Systems
GMO Genetically Modified Organism
Groundfish A common name for several species of demersal fin-fish, particularly commercial species such as cod

�## ��������������
HACCP Hazard Analysis and Critical Control Points
ICES International Council for the Exploration of theSeas
IMPACT IFPRI’s International Model for Policy Analysis ofAgricultural Commodities and Trade
Income elasticity A ratio measuring the percentage change in demand of demand for a good in response to a percentage change in
income
Intensification The process of producing more outputs from thesame level of the limiting factor of production, usu-ally by increasing the levels of other purchasedinputs or factors of production, or by technologicalchange, or both
ISSCAAP International Standard Statistical Classification ofAquatic Animals and Plants
ITQs Individual Transferable Quotas
IUU Illegal, Unreported, and Unregulated fishing
Krill Very small planktonic marine crustaceans
Mariculture Aquaculture practiced in a marine environment
Mesopelagic Living in the region of the ocean between depths ofabout 200 and 1,000 meters
Micronutrient Nutrients, such as specific vitamins or minerals,required in very small quantities for healthy func-tioning
NACA Network of Aquaculture Centers in Asia/Pacific
Nes Not elsewhere specified (an FAO statistical term)
OECD Organisation for Economic Co-operation andDevelopment
Pelagic Living in the open ocean, as opposed to near shoreor on the sea bottom
Polyculture The cultivation of several species of organism withinthe same system
Postlarvae Animals (like shrimp) that have changed from thelarval form to the juvenile or adult form

Price elasticity of demand A ratio measuring the percentage change in thedemand for a good, X, in response to a percentagechange in the price for that good
Price elasticity of supply A ratio measuring the percentage change in the sup-ply of a good, X, in response to a percentage changein the price for that good
PSE Producer Subsidy Equivalent
Reduction fish Fish destined for processing into fishmeal and fishoil, especially small pelagic fish
Seine nets Large nets that float vertically in the water withweighted bottoms
SPS Sanitary and Phyto-Sanitary Agreements
SSA Sub-Saharan Africa
Stocking density A measure of the number of organisms in an aqua-culture operation per surface area of water, or perunit volume of water
Surimi Processed fish used for imitation seafood, often forartificial crabmeat
Tariff escalation The maintenance of higher tariff rates on productswith a higher degree of processing than on productsin less processed form
TBT Technical Barriers to Trade
TFP Total Factor Productivity
Transgenic Relating to the transfer of genes from one speciesinto another
Trawling The fishing method of dragging a net behind aboat, sometimes on the sea bottom
Trophic level Position in the food chain
VMS Vessel Monitoring System
WTO World Trade Organization
�;;�������F������D��������������D �#�

�"�-"%�$ 1*+
Abila, R. O., and E. G. Jansen. 1997. From local to global markets: The fish export-ing and fishmeal industries of Lake Victoria: Structure, strategies and socio-economic impacts in Kenya. Socioeconomics of the Lake Victoria Fisheries No. 2. Nairobi: International Union for Conservation of Nature and NaturalResources (IUCN), Eastern Africa Programme.
Aerni, P. 2001. Aquatic resources and technology: Evolutionary, environmental, legal,and developmental aspects. Science, Technology and Innovation DiscussionPaper No. 13. Cambridge, Mass., U.S.A.: Center for InternationalDevelopment.
Ahmed, M. 1997. Fish for the poor under a rising global demand and changingfishery regime. Naga—The ICLARM Quarterly (supplement).July–December: 4–7.
Ahmed, M., and M. H. Lorica. 2002. Improving developing country food securi-ty through aquaculture development—lessons from Asia. Food Policy 27:125–141.
Ahmed, M., C. L. Delgado, S. Sverdrup-Jensen, and R. A. V. Santos, ed. 1999.Fisheries policy research in developing countries: Issues, priorities and needs.Manila: International Center for Living Aquatic Resources Management andInternational Food Policy Research Institute.
Allan, G. 1998. Potential for pulses. International Aquafeeds 2: 17–20.
Alston, J. M., G. W. Norton, and P. G. Pardey. 1995. Science Under Scarcity:Principles and practice for agricultural research evaluation and priority setting.Ithaca, N.Y., U.S.A.: Cornell University Press.
Anderson, J. L. 1985. Private aquaculture and commercial fisheries: Bioeconomicsof salmon ranching. Journal of Environmental Economics and Management 12(4): 353–370.
�#�

Anderson, J. L., and Q. S. W. Fong. 1997. Aquaculture and international trade.Aquaculture Economics & Management 1: 29–44.
Asche, F., and S. Tveteras. 2000. On the relationship between aquaculture andreduction fisheries. Paper presented at the biennial meetings of theInternational Institute of Fisheries Economics and Trade held in Corvallis,Oregon, 10–14 July, 2000.
Asche, F., and T. Bjorndal. 1999. Demand elasticities for fish: A review. GlobefishSpecial Series No. 9. Rome: Food and Agrictulture Organization of theUnited Nations.
Barg, U., and M. J. Phillips. 1997. Environment and sustainability. In Review ofthe State of World Aquaculture 1997. FAO Fisheries Circular 886. Rome: Foodand Agriculture Organization of the United Nations.
Barlow, S. M. 2000. Fishmeal and fish oil: Sustainable feed ingredients for aqua-culture. The Global Aquaculture Advocate 3 (2): 85–86.
Barlow, S. M., and Pike, I. H. 2001. Sustainability of fish meal and oil supply.Paper presented at the Scottish Norwegian Marine Fish Farming conference,“Sustainable Future for Marine Fish Farming,” held at the University ofStirling, Scotland, June 14–15, 2001.
BBC News. 2002. Infertility linked to mercury in seafood. Cited in WorldCatch News. <http://www.thewaveonline.com/article/?id=11321&ss=Heavy%20Metals>. September 24, 2002; accessed February 20, 2003.
Be, T. T., L. C. Dung, and D. Brennan. 1999. Environmental costs of shrimp cul-ture in the rice-growing regions of the Mekong Delta. Aquaculture Economics& Management 3 (1): 31–42.
Bene, C., M. Cadren, and F. Lantz. 2000. Impact of cultured shrimp industry onwild shrimp fisheries: Analysis of price determination mechanisms and mar-ket dynamics. Agricultural Economics 23 (1): 55–68.
Boserup, E. 1965. The conditions of agricultural growth: The economics of agrarianchange under population pressure. Chicago: Aldine Press.
Bouis, H. E. 2000. Commercial vegetable and polyculture fish production inBangladesh: Their impacts on household income and dietary quality. Foodand Nutrition Bulletin 21 (4): 482–487.
Boyd, C. E., and A. Gross. 2000. Water use and conservation for inland aquacul-ture ponds. Fisheries Managment & Ecology 7: 55–63.
Broadhurst, M. K., R. B. Larsen, S. J. Kennelly, and P. E. McShane. 1999. Useand success of composite square-mesh codends in reducing bycatch and in
�#� ��������������

improving size-selectivity of prawns in Gulf St. Vincent, South Australia.Fishery Bulletin 97: 434–448.
Caddy, J. F., and S. M. Garcia. 1986. Fisheries thematic mapping: A prerequisitefor intelligent development and management of fisheries. OceanographieTropicale 21 (1): 31–52.
Calzadilla-Sarmiento, B. 2002. UNIDO’s activities related to standards and mar-ket access facilitation: The case of Victorian lake project. Paper presented atthe United Nations Conference on Trade and Development held in Geneva,May 16–17, 2002.
Cato, J. C., and C. A. L. dos Santos. 2000. Costs to upgrade the Bangladeshfrozen shrimp processing sector to adequate technical and sanitary standardsand to maintain a HACCP program. In The economics of HACCP: Costs andbenefits, ed. L. J. Unnevehr. St. Paul, Minn., U.S.A.: Eagan Press.
Cesar, H. S. J. 2000. Coral reefs: Their functions, threats and economic value. InThe economics of coral reefs, ed. H. S. J. Cesar. Kalmar, Sweden: Coral ReefDegradation in the Indian Ocean (CORDIO).
Chan, H. L., M. C. Garcia, and P. Leung. 2002. Long-term world projections offish production and consumption. Report to the Food and AgricultureOrganization of the United Nations. Photocopy.
Clayton, P. L., and D. V. Gordon. 1999. From Atlantic to Pacific: Price links inthe U.S. wild and farmed salmon market. Aquaculture Economics &Management 3 (2): 93–104.
Clifford, S. L., P. McGinnity, and A. Ferguson. 1998. Genetic changes in anAtlantic salmon population resulting from escaped juvenile farm salmon.Journal of Fish Biology 52 (1): 118–127.
Clucas, I. 1997. A study of the options for utilizing bycatch and discards from marinecapture fisheries. FAO Fisheries Circular No. 928 FIIU/C928. Rome: Foodand Agriculture Organization of the United Nations.
Commodity Research Bureau. 1985, 1986, 1990, 1996, 1998. CRB CommodityYearbook. New York: John Wiley & Associates.
Copes, P. 1970. The backward-bending supply curve of the fishing industry.Scottish Journal of Political Economy 17: 69–77.
Costanza, R., B. G. Norton, and B. D. Haskell. 1992. Ecosystem health: New goalsfor environmental management. Washington, D.C.: Island Press.
Delgado, C. L., and C. Courbois. 1998. Trade-offs among fish, meat, and milkdemands in developing countries from the 1970’s to the 1990’s. In Proceedings
���������;:D �#�

of the biennial meetings of the International Institute of Fisheries Economics andTrade, ed. A. Eide and T. Vassdal. Tromso, Norway: The Norwegian Collegeof Fishery Science.
Delgado, C. L., C. Courbois, M. Rosegrant, M. Ahmed. 2000. Issues in model-ing fish to 2020 within a global food model. Paper presented at the biennialmeetings of the International Institute of Fisheries Economics and Trade, heldin Corvallis, Oregon, July 10–14, 2002.
Delgado, C. L., M. Rosegrant, S. Meijer, N. Wada, and M. Ahmed. 2002a. Fishas food: Projections to 2020. Paper presented at the biennial meetings of theInternational Institute of Fisheries Economics and Trade, held in Wellington,New Zealand, August 19–23, 2002.
Delgado, C. L., M. Rosegrant, N. Wada, and S. Meijer. 2002b. Livestock and fish-eries to 2020: The food revolution in developing countries continues.Unpublished draft of Markets, Trade, and Institutions Division DiscussionPaper. International Food Policy Research Institute, Washington, D.C.
Delgado, C. L., M. Rosegrant, H. Steinfeld, S. Ehui, and C. Courbois. 1999.Livestock to 2020: The next food revolution. Food, Agriculture, and theEnvironment Discussion Paper No. 28. Washington, D.C.: InternationalFood Policy Research Institute.
Delgado, C. L., J. Hopkins, and V. Kelly. 1998. Agricultural growth linkages in sub-Saharan Africa. IFPRI Research Report No. 107. Washington, D.C.:International Food Policy Research Institute.
Dey, M. M., and M. V. Gupta. 2000. Socioeconomics of disseminating genetical-ly improved Nile tilapia in Asia: An introduction. Aquaculture Economics &Management 4 (1–2): 5–12.
Dey, M. M., A. E. Eknath, L. Sifa, M. G. Hussain, T. M. Thien, N. Van Hao, S.Aypa, and N. Pongthana. 2000. Performance and nature of geneticallyimproved farmed tilapia: A socioeconomic analysis. Aquaculture Economics &Management 4 (1–2): 83–106.
Dey, M. M., M. Ahmed, K. M. Jahan, and M. A. Rab. 2002. Analysis of fish tradepolicies in developing Asian countries: Liberalization vs. barriers. Paper pre-sented at the biennial meetings of the International Institute of FisheriesEconomics and Trade, held in Wellington, New Zealand, August 19–23,2002.
Durand, M. H. 1998. Fishmeal price behavior: Global dynamics and short-termchanges. In Global versus local changes in upwelling ecosystems, ed. M. H.Durand, P. Cury, R. Mendelssohn, C. Roy, A. Bakun, and D. Pauly. Paris:
�#� ��������������

Institut Français de Recherche Scientifique pour le Développement enCoopération (ORSTROM).
FAO (Food and Agriculture Organization of the United Nations). 1993. Marinefisheries and the law of the sea: A decade of change. Special (revised) chapterin The State of Food and Agriculture 1992. Rome.
———. 1995. The state of world fisheries and aquaculture. Rome.
———. 1997a. Review of the state of world fishery resources: Marine fisheries. FAOFisheries Circular No. 920. Rome.
———. 1997b. Review of the state of world aquaculture. FAO Fisheries CircularNo. 886. Rome.
———. 1997c. Number of fishers. FAO Fisheries Circular No. 929. Rome.
———. 1998. The state of world fisheries and aquaculture. Rome.
———. 1999a. Fish and fishery products: World apparent consumption statisticsbased on food balance sheets, ed. E. Laurenti. FAO Fisheries Circular No. 821Revision 5. Rome.
———. 1999b. World fisheries trade and some emerging issues. Trade Issues: FAOFact Sheets. Rome.
———. 2000a. The state of world fisheries and aquaculture. Rome.
———. 2000b. Chinese fishery statistics and their accuracy. Rome.
———. 2001a. Report of the workshop on Chinese Capture Fishery and AquacultureStatistics. Beijing: FAO.
———. 2001b. Fisheries statistics: Commodities 1999. Rome: FAO FisheriesDepartment, Fishery Information, Data and Statistics Unit.
———. 2001c. Production, accessibility, marketing and consumption patterns offreshwater aquaculture products in Asia: A cross-country comparison. FAOFisheries Circular No. 973. Rome.
———. 2002a. Fishstat Plus: Universal software for fishery statistical time series.Rome: FAO Fisheries Department, Fishery Information, Data and StatisticsUnit.
———. 2002b. Fishery Statistics: Reliability and policy implications.<http://www.fao.org/fi/statist/nature_china/30jan02.asp>. Accessed May 19,2003.
———. 2002c. FAO Statistical databases. <http://apps.fao.org/subscriber>.Accessed January 2002.
���������;:D �#

———. 2002d. Committee on fisheries: Report on the eighth session of the sub-committee on fish trade, Bremen, Germany, February 12–16, 2002. FAOFisheries Report No. 673. Rome.
———. 2003. Review of state of world aquaculture. FAO Fisheries Circular No.886, Rev. 2. Rome.
Farstad, A. 1999. Zooplankton key to oil shortfall? Fish Farming International 26(7): 9–9.
Fernando, C. H., and M. Halwart. 2000. Possibilities for the integration of fishfarming into irrigation systems. Fisheries Managment & Ecology 7 (1–2):45–54.
Fiorillo, J. 2003. Mercury issue attracts national media attention. In WorldCatchNews. <http://www.thewaveonline.com/column/?columntype=1&cat=2>.Accessed March 10, 2003.
Francis, G., H. P. S. Makkar, and K. Becker. 2001. Antinutritional factors presentin plant-derived alternative fish feed ingredients and their effects in fish.Aquaculture 199 (3–4): 197–228.
Funge-Smith, J. S., and M. R. P. Briggs. 1998. Nutrient budgets in intensiveshrimp ponds: Implications for sustainability. Aquaculture 164 (1–4):117–133.
Garcia, S. M., and C. Newton. 1997. Current Situation, Trends and Prospects inWorld Capture Fisheries. In Global Trends: Fisheries Management, ed. E. L.Pikitch, D. D. Huppert, and M. P. Sissenwine. Bethesda, Md., U.S.A.:American Fisheries Society Symposium 20.
Gardiner, P., L. S. Lim, and G. John. 2002. New biotechnology application infish. Paper presented at a conference convened by the Government of Egypt,FAO, UNESCO, World Bank, OECD, CGIAR, ICARDA, AGERI,AASTMT, NAS, and TWAS on “Biotechnology and SustainableDevelopment: Voices of the North and South,” held in Alexandria, Egypt, onMarch 20, 2002.
GESAMP (Joint Group of Experts on the Scientific Aspects of MarineEnvironmental Protection). 2001. Planning and management for sustainablecoastal aquaculture development. GESAMP Reports and Studies No. 68.Rome: Food and Agriculture Organization of the United Nations.
Globe and Mail. 2002. Study: Farmed salmon high in PCBs. Cited inWorldCatch News. <http://wave.worldcatch.com/article/?id=10097>.Accessed May 20, 2002.
�#! ��������������
Goldburg, R., and T. Triplett. 1997. Murky Waters: Environmental Effects ofAquaculture in the U.S. New York: Environmental Defense Fund.
Gomiero, T., M. Giampietro, S. G. F. Bukkens, and M. G. Paoletti. 1999.Environmental and socioeconomic constraints to the development of fresh-water fish aquaculture in China. Critical Reviews in Plant Sciences 18 (3):359–371.
Grainger, R. J. R., and S. M. Garcia. 1996. Chronicles of Marine Fishery Landings(1950–1994): Trend analysis and fisheries potential. FAO Fisheries TechnicalPaper No. 359. Rome: Food and Agriculture Organization of the UnitedNations.
Guo, X. 2000. Aquaculture in China: Two decades of rapid growth. Aquaculturemagazine 26 (3).
Guttormsen, A. 2002. Input factor substitutability in salmon aquaculture. MarineResource Economics 17 (2): 91–102.
Hardin, G. 1968. The tragedy of the commons. Science 162: 1243–1248.
Hatch, U., and C. F. Tai. 1997. A survey of aquaculture production economicsand management. Aquaculture Economics & Management 1 (1): 13–27.
Hishamunda, N., and R. P. Subasinghe. 2003. Aquaculture development in China:The role of public sector policies. FAO Fisheries Technical Paper No. 427.Rome: Food and Agriculture Organization of the United Nations.
Huang, J., and H. E. Bouis. 1996. Structural changes in the demand for food in Asia.Food, Agriculture, and the Environment Discussion Paper No. 11.Washington, D.C.: International Food Policy Research Institute.
Huang, J., H. Liu, and L. Li. 2002. Urbanization, income growth, food marketdevelopment, and demand for fish in China. Paper presented at the biennialmeetings of the International Institute of Fisheries Economics and Trade, heldin Wellington, New Zealand, August 19–23, 2002.
ICES (International Council for the Exploration of the Sea). 1995. ICES Code ofPractice on the Introductions and Transfers of Marine Organisms. ICESCooperative Research Report No. 204. Copenhagen.
ICLARM (International Center for Living Aquatic Resources Management).1998. Dissemination and evaluation of genetically improved tilapia species inAsia: Final report. Asian Development Bank Regional Technical AssistancePaper No. 5558. Makati City, Philippines: ICLARM.
———. 2001. Genetic improvement of carp species in Asia. Report to AsianDevelopment Bank. Penang, Malaysia: ICLARM.
���������;:D �#"

IFOMA (International Fishmeal and Fish Oil Manufacturers Association). 1998.IFOMA News Release, November 25, 1998. <http://www.ifoma.com/servlet/Releases/view/ifoma?name=9952>. Accessed October 1999.
———. 1999. Recovery of fish meal and oil production continues to be slow.IFOMA News Release, May 19, 1999. <http://www.ifoma.com/servlet/Releases/view/ifoma?name=9941>. Accessed October 1999.
Iioka, C., K. Kani, and H. Nhhala. 1999. Present status and prospects of techni-cal development of tuna sea-farming. Paper presented at the MediterraneanAgronomic Institute of Zaragoza–FAO seminar, “Mediterranean MarineAquaculture Finfish Species Diversification,” held in Zaragoza, Spain, 24–28May, 1999.
International Trade Centre. 2002. ITC Databases: Aggregated Trade Statistics.International Trade Centre. <http://www.intracen.org/tradstat/welcome.htm>. Accessed November 2002.
IntraFish Media. 2003, April 22. New chloramphenicol testing kit available. InWorldCatch News. <http://www.thewaveonline.com/article/?id=13781>.Accessed April 23, 2003.
Jackson, J. B. C., M. X. Kirby, W. H. Berger, K. A. Bjorndal, L. W. Botsford, B.J. Bourque, R. H. Bradbury, R. Cooke, J. Erlandson, J. A. Estes, T. P. Hughes,S. Kidwell, C. B. Lange, H. S. Lenihan, J. M. Pandolfi, C. H. Peterson, R. S.Steneck, M. J. Tegner, and R. R. Warner. 2001. Historical overfishing and therecent collapse of coastal ecosystems. Science 293: 629–638.
Jagger, P., and J. Pender. 2001. Issues for aquaculture in East Africa: The case ofUganda. Naga–The ICLARM Quarterly 24 (1–2): 42–51.
Johannes, R. E., and M. Riepen. 1995. Environmental, economic and social impli-cations of the live reef fish trade in Asia and the western Pacific. Report to TheNature conservancy and the South Pacific Forum Fisheries Agency.Wellington, New Zealand: Fisheries Development Associates.
Kent, G. 1998. Fisheries, food security, and the poor. Food Policy 22 (5): 393–404.
Kurlansky, M. 1997. Cod: A biography of the fish that changed the world. New York:Walker and Company.
Kusumastanto, T., C. M. Jolly, and C. Bailey. 1998. A multiperiod programmingevaluation of brackishwater shrimp aquaculture development in Indonesia1989/1990–1998/1999. Aquaculture 159 (3–4): 317–331.
��# ��������������
Lewis, D. J., G. D. Wood, and R. Gregory. 1996. Trading the silver seed: Localknowledge and market moralities in aquacultural development. IntermediateTechnology Publications. Dhaka and London: University Press Limited.
Li, S. 1999. Availability of areas for further aquaculture production. In SustainableAquaculture: Food For The Future, ed. N. Svennevig, H. Reinertsen, and M.B. New. Rotterdam: A. A. Balkema.
Lim, C., P. H. Klesius, and W. Dominy. 1998. Soyabean products. InternationalAquafeeds 3: 17–23.
Lotz, J. M. 1997. Viruses, biosecurity and specific pathogen-free stocks in shrimpaquaculture. World Journal of Microbiology and Biotechnology 13 (4):405–413.
Lu, F. 1998a. Output data on animal products in China: How much they are over-stated. Beijing: China Center for Economic Research.
———. 1998b. Aspects of the differences between fishery production and con-sumption. Management World 1998 5: 165–171.
McGovern, D. 2002, June 14. New study downplays danger of chloramphenicol.In WorldCatch News. <http://wave.worldcatch.com/article/?cat=1>.Accessed June 14, 2002.
Menasveta, P. 1997. Mangrove destruction and shrimp culture systems. WorldAquaculture 28: 36–42.
Muir, W. M., and R. D. Howard. 1999. Possible ecological risks of transgenicorganism release when transgenes affect mating success: Sexual selection andthe Trojan gene hypothesis. Proceedings of the National Academy of Sciences ofthe United States of America 24: 13853–13856.
Myers, R. A., and B. Worm. 2003. Rapid worldwide depletion of predatory fishcommunities. Nature 423: 280–283.
NACA/FAO (Network of Aquaculture Centers in Asia/Pacific/Food andAgriculture Organization of the United Nations). 2000. Aquaculture develop-ment beyond 2000: The Bangkok declaration and strategy. Rome.
———. 2001. Aquaculture in the Third Millenium: Technical proceedings of theconference on Aquaculture in the Third Millenium, Bangkok, Thailand,February 20–25, 2000, ed. Subasinghe, R. P., P. Bueno, M. J. Phillips, C.Hough, and S. E. McGladdery. Bangkok: Network of Aquaculture Centers inAsia/Pacific–Food and Agriculture Organization of the United Nations.
Nash, C. E., ed. 2001. The net-pen salmon farming industry in the PacificNorthwest. U.S. Department of Commerce, NOAA Technical Memo No.
���������;:D ���
NMFS-NWFSC–49. <http://www.nwfsc.noaa.gov/publications/techmemos/tm49/TM49.htm>. September 2001; accessed July 2003.
National Research Council Ocean Studies Board. 2002. Effects of trawling anddredging on seafloor habitat. Washington, D.C.: National Academy Press.
Naylor, R. L., R. J. Goldburg, J. H. Primavera, N. Kautsky, M. C. M. Beveridge,J. Clay, C. Folke, J. Lubchenco, H. Mooney, and M. Troell. 2000. Effect ofaquaculture on world fish supplies. Nature 405: 1017–1024.
New, M. B. and U. N. Wijkstrom. 2002. Use of fishmeal and fish oil in aquafeeds:Further thoughts on the fishmeal trap. FAO Fisheries Circular No. 975. Rome:Food and Agriculture Organization of the United Nations.
OIE (Office Internationale de Epizooties). 2000a. International Aquatic AnimalHealth Code. 3d Ed. Paris: OIE.
———. 2000b. Diagnostic Manual for Aquatic Animal Diseases. 3d Ed. Paris:OIE.
OilWorld. 1999. OilWorld database. <http://www.oilworld.biz>.
Pascoe, S., and S. Mardle. 1999. Supply response in fisheries: The North Sea. Centrefor the Economics and Management of Aquatic Resources (CEMARE)Research Paper No. 143. Portsmouth, U.K.: University of Portsmouth.
Pascoe, S., S. Mardle, F. Steen, and F. Asche. 1999. Interactions between farmedsalmon and the North Sea demersal fisheries: A bioeconomic analysis. Centre forthe Economics and Management of Aquatic Resources (CEMARE) ResearchPaper No. 144. Portsmouth, U.K.: University of Portsmouth.
Pauly, D., and I. Tsukayama, ed. 1987. The Peruvian Anchoveta and its upwellingecosystem: Three decades of change. Manila: Instituto del Mar del Perú(IMARPE).
Pauly, D., V. Christensen, J. Dalsgaard, R. Froese, and F. Torres, Jr. 1998. Fishingdown marine food webs. Science 279: 860–863.
Pet-Soede, L., H. S. J. Cesar, and J. S. Pet. 2000. Blasting away: The economicsof blast fishing on Indonesian coral reefs. In The Economics of Coral Reefs,H. S. J. Cesar ed. Kalmar, Sweden: Coral Reef Degradation in the IndianOcean (CORDIO).
Pew Initiative on Food and Biotechnology. 2003. Future Fish: Issues in science andregulation of transgenic fish. Pew Initiative on Food and Biotechnology.<http://pewagbiotech.org/research/fish/>. Accessed June 2003.
��� ��������������
Pew Oceans Commission. 2003. America’s Living Oceans: Charting a course for seachange. Pew Oceans Commission. <http://www.pewtrusts.com/pdf/env_pew_oceans_final_report.pdf>. Accessed June 2003.
Pike, I. H. 1997. Future supplies of fish meal and oil: quality requirements foraquaculture with particular reference to shrimp. In Feed ingredients Asia ’97.Uxbridge, U.K.: Turret RAI.
Pinkerton, E. 1989. Co-operative management of local fisheries. Vancouver:University of British Columbia Press.
Prein, M., and M. Ahmed. 2000. Integration of aquaculture into smallholderfarming systems for improved food security and household nutrition. Foodand Nutrition Bulletin 21: 466–471.
Rae, A. N. 1998. The effects of expenditure growth and urbanization on food con-sumption in East Asia: A note on animal products. Agricultural Economics 18:291–299.
Rahman, M. 2002. Problems of shrimp production and processing in Bangladesh,Centre for Policy Dialogue, Dhaka, Bangladesh. Photocopy.
Reis, A., L. Gouveia, V. Veloso, H. L. Fernandes, J. A. Empis, and J. M. Novais.1996. Eicosapentaenoic acid-rich biomass production by the microalgaPhaeodactylum tricornutum in a continuous flow reactor. BioresourceTechnology 55: 83–88.
Roemer, M. 1970. Fishing for Growth: Export-Led Development in Peru,1950–1967. Cambridge, Mass., U.S.A.: Harvard University Press.
Roheim, C. A. 2002. Early indications of market impacts from the MarineStewardship Council’s ecolabeling of seafood. London, Seattle, and Sydney:Marine Stewardship Council.
Rosegrant, M., S. Meijer, and S. Cline. 2002. International Model for PolicyAnalysis of Agricultural Commodities and Trade (IMPACT): Model descrip-tion. <http://www.ifpri.org/themes/impact/impactmodel.pdf>. Accessed June2003.
Rosegrant, M, X. Cai, and S. Cline. 2002. World Water and Food to 2025: DealingWith Scarcity. Washington, D.C.: International Food Policy ResearchInstitute.
Rosegrant, M., M. S. Paisner, S. Meijer, and J. Witcover. 2001. Global food projec-tions to 2020. 2020 Vision Initiative Book Series. Washington, D.C.:International Food Policy Research Institute.
���������;:D ���

Samonte-Tan, G. and W. L. Griffin. 2001. Bycatch reduction impacts on theshrimp harvesting and consumer sectors in the Gulf of Mexico. Society andNatural Resources 14: 223–237.
Sargent, J. R. and A. G. J. Tacon. 1999. Development of farmed fish. A nutrition-ally necessary alternative to meat. Proceedings of the British Nutrition Society58: 377–383.
Sargent, J. R., J. G. Bell, M. V. Bell, R. J. Henderson, and D. R. Tocher. 1995.Requirement criteria for essential fatty acids. Journal of Applied Icthyology 11:183–198.
Smith, S. V. 1978. Coral reef arca and contribution of reefs to processes andresources of the world’s oceans. Nature 273: 225–225.
Stickney, R. 1994. Principles of aquaculture. New York: John Wiley & Sons.
Subasinghe, R. P., M. G. Bondad-Reantaso, and S. E. McGladdery. 2001.Aquaculture development, health, and wealth. In Aquaculture in the ThirdMillenium: Technical proceedings of the conference on Aquaculture in the ThirdMillenium, Bangkok, Thailand, February 20–25, 2000, ed. R. P. Subasinghe,P. Bueno, M. J. Phillips, C. Hough, and S. E. McGladdery. Bangkok:Network of Aquaculture Centers in Asia/Pacific–Food and AgricultureOrganization of the United Nations.
Tacon, A. G. J. 2001. Fish meal and fish oil: Global supply, demand and outlook.Report to the International Food Policy Research Institute, Washington,D.C. Photocopy.
Tendencia, E. A. and L. D. de la Pena. 2001. Antibiotic resistance of bacteria fromshrimp ponds. Aquaculture 195 (3–4): 193–204.
Thilsted, S. H., N. Roos, and N. Hassan. 1997. The role of small indigenous fishspecies in food and nutrition security in Bangladesh. Naga—The ICLARMQuarterly (supplement). July-December: 13–15.
Thomas, J. S., and M. A. Meyer. 1997. The new rules of global trade: A guide to theWorld Trade Organization. Scarborough, Ontario: Carswell.
Tuominen, T.-R., and M. Esmark. 2003. Food for thought: The use of marineresources in fish feed. WWF Report 02/03. Norway: World Wildlife Fund.
Turner, G.E., ed. 1988. Codes of practice and manual of procedures for considerationof introduction and transfers of marine and freshwater organisms. EuropeanInland Fisheries Advisory Commission (EIFAC) Occasional Paper No. 23.Rome: Food and Agriculture Organization of the United Nations.
United Nations. 1998. World urbanization prospects: The 1999 revision. New York.
��� ��������������
———. 2002. Trade and development report, United Nations Conference on Tradeand Development. New York and Geneva.
United States Bureau of Labor Statistics. 2002. Producer price index commoditydata. <http://www.data.bls.gov>. Accessed January 2002.
USDA (United States Department of Agriculture). 2002. Federal Register 67/225(November 21): 70205–70206.
USDA/FAS (United States Department of Agriculture, Foreign AgriculturalService). 1999. Oilseeds: World Markets and Trade. April 1999 circular.<http://www.fas.usda.gov/oilseeds/circular/1999/99–04/toc.htm>. AccessedJune 1999.
Vondruska, J. 1981. Postwar production, consumption, and prices of fish meal. InResource Management and Environmental Uncertainty, ed. M. H. Glantz andJ. D. Thompson. New York: John Wiley & Sons.
Vukina, T., and J. L. Anderson. 1993. A state-space forecasting approach to opti-mal intertemporal cross-hedging. American Journal of Agricultural Economics75: 416–424.
Wada, N., C. L. Delgado, and A. G. J. Tacon. 2002. Outlook for fishmeal and fishoil demand: The role of aquaculture. Paper presented at the biennial meetingsof the International Institute of Fisheries Economics and Trade, held inWellington, New Zealand, August 19–23, 2002.
Wada, N., C. L. Delgado, and M. Ahmed. 2002. Environmental tradeoffsbetween aquaculture and capture fisheries. Paper presented at the biennialmeetings of the International Institute of Fisheries Economics and Trade, heldin Wellington, New Zealand, August 19–23, 2002.
Wang, Y. 2001. China P.R. 1: A review of national aquaculture development. InAquaculture in the Third Millenium: Technical proceedings of the conference onAquaculture in the Third Millenium, Bangkok, Thailand, February 20–25,2000, ed. R. P. Subasinghe, P. Bueno, M. J. Phillips, C. Hough, and S. E.McGladdery. Bangkok: Network of Aquaculture Centers in Asia/Pacific–Food and Agriculture Organization of the United Nations.
Watanabe, T. 2002. Strategies for further development of aquatic feeds. FisheriesScience 68 (2): 242–252.
Watling, L., and E. A. Norse. 1998. Disturbance of the seabed by mobile fishinggear: A comparison with forest clear-cutting. Conservation Biology 12:1180–1197.
���������;:D ���
Watson, R., and D. Pauly. 2001. Systematic distortions in world fisheries catchtrends. Nature 414: 534–536.
Williams, M. J. 1996. Transition in the contribution of living aquatic resources tosustainable food security. In Perspectives in Asian fisheries, ed. Sena S. De Silva.Makati City, the Philippines: Asian Fisheries Society.
World Bank. 1998. Subsidies in world fisheries: A reexamination. World BankTechnical Paper Number 406. Washington, D.C.
———. 2000. Agriculture in Tanzania Since 1986: Follower or leader of growth?World Bank Country Study. Washington, D.C.: World Bank–InternationalFood Policy Research Institute.
———. 2002. World Development Indicators 2000. Washington, D.C. CD-ROM.
WorldCatch News Network. 2001. Salmon farms to drive fishmeal markets higher. WorldCatch News. <http://www.worldcatch.com/WC_Article_View.wc?priority=9&Featured=False&wave=25372&id=458>.Accessed June 13, 2001.
———. 2002. EU suspends Chinese shrimp imports over food safety concerns. WorldCatch News. <http://www.worldcatch.com/page/WC_Article_View.wc?ID=6735>. Accessed January 28, 2002.
Ye, Y. and J. R. Beddington. 1996. Bioeconomic interactions between the capturefishery and aquaculture. Marine Resource Economics 11 (2): 105–123.
��� ��������������
��
Agricultural land, 70Aquaculture
carnivorous, defined, 198creating international standards for, 79–80defined, 197environmental issues and, 68–73, 78–80escaped species and, 72–73fisheries and, 9, 65, 73–75, 81–82, 146–147, 151fishmeal demand in, 71–72, 88impact on capture fisheries of, 73–77intensification, 96–100, 141nonprice-mediated trends and, 53ponds, 71, 124price substitutability of, 76raising productivity in, 93–96selective breeding in, 94technological changes in, 54, 56, 90
Aquaculture production. See also IMPACTmodelin China, 22–24expansion of, 26–27, 56–57export revenue from, 12–13fish demand and, 42global, 13by market-based commodity category, 24–25projection scenarios, 58by region, 22–24total, 23
Aquafeedsdefined, 197fishmeal replacement in, 92–93use of fishmeal in, 88–89
�Bangkok Declaration and Strategy, 80, 100Baseline data, defined, 197Baseline scenario, defined, 197Benthic, defined, 197Biotechnology, 94–96, 141–142Bivalves, defined, 197Blast fishing, 67“Blue revolution,” 9–10Bottom trawling. See TrawlingBovine Spongiform Encephalopathy (BSE),
92, 197Breeding technology, 94Broodstock, defined, 197Bycatch and discards
capture fisheries and, 67defined, 67, 198devices for reducing, 103
�Capture fisheries. See also Fisheries
aquaculture and, 65, 73–75, 81–82, 146–147bycatch and discards and, 67–68defined, 198employment in, 125–126, 147environmental issues and, 77–78habitat destruction by, 67–68
"����
��! ��������������
management of, 102–103, 142price substitutability with aquaculture of, 76technology’s role in improving, 100–102
Carnivorous aquaculture, defined, 198Cephalopods. See MollusksChild labor, 133China
aquaculture production in, 22–24classification of, 153fish consumption in, 42, 60, 138fisheries production in, 11–12, 16–17,54–55, 58, 139–140fishmeal production in, 84–85fish trade in, 109, 114–115, 119GDP projections in, 50production subsidies in, 133–134projection scenarios, 62rise in importance of, 7–8
Chloramphenicol, 131Code of Practice on the Introduction and
Transfer of Marine Organisms, 133Codex Alimentarius Commission (CAC),
132, 198Cod trade, 109, 112“Cod War,” 5Commodities, re-aggregation of, 18Commodity trade, 47, 48Consumer subsidy equivalents (CSE),
46, 198Coral reef ecosystems, 67, 70Cost, insurance, and freight, 198Cross-price elasticity of demand, defined,
198Cross-price elasticity of supply, defined, 198Crustaceans
from aquaculture, 25, 177from capture, 20, 173categories of, 157–158consumption of, 33, 36–37, 184, 196export of, 119trade of, 114–115unit values of, 38
�Demersal fish
consumption of, 32–33, 35defined, 198
Developed countries. See also Technologybreeding technology in, 94classification of, 155high-value finfish in, 19–20production subsidies and, 133tariffs in, 129–130Developing countriesclassification of, 155fish export from, 107–111, 129–134,143–144fish trade in, 112–115, 122–129,134–135policy action in, 148–149priorities, 149–150tariffs in, 129–130
Diadromous fish. See also Salmonconsumption of, 32defined, 198
Dietary diversification, 6–7Discards. See Bycatch and discardsDisease(s)
aquaculture expansion and, 69–70fish trade and, 132risk, minimizing, 98–99
(Eastern Europe
classification of, 154fisheries production in, 16
Eco-labeling, 128, 129, 133, 198Ecological collapse scenario, 120–121, 144Effluent problem, 71, 99, 198El Niño warming events, 84, 86, 87, 90,
199Employment, 125–126, 147Environmental issues
aquaculture and, 2, 7, 68–73, 78–80,98–100bycatch and discards, 67capture fisheries and, 77–78fisheries outlook and, 151fish trade barriers and, 131habitat destruction, 67–68IMPACT scenarios for, 75, 77over-exploitation, 66
�������������"
European Inland Fisheries AdvisoryCommission (EIFAC), 133
European Unionclassification of, 153, 154fish trade in, 109
Eutrophication, 71, 199Exclusive economic zones (EEZs), 5, 77,
198, 199Export revenue, 12–13Export value of fisheries products, 106Extensive aquaculture, 97Externalities, defined, 199
�Farmed species
escaped, 72fishmeal in diets of, 87
Feed conversion efficiency, defined, 199Fish(ing)
blast, 67bycatch of, 67illegal, 78poison, 67transgenic, 72, 73, 95, 201
Fish consumptionalternative scenarios, 61–63baseline scenario, 60–61in China, 138by commodity groups, 30–33high-value finfish, 35–36increase in, 29–30, 63low-value food fish, 33, 35by market-based category, 33–37per capita, 32, 33, 61, 62, 138–139,187–188projection scenarios, 120by region, 30–33total, 31, 180trends in, 38–41
Fish demand. See Supply and demand issuesFisheries. See also IMPACT model
aquaculture and, 9, 73–75arguments against, 3–4China’s role in, 7–8in developed countries, 4–8fish prices and, 52introduction to, 1–2
outlook for, 52–53structural shifts in, 151–152subsidies, 5, 14sustainability of, 26Fisheries commoditiesprice issues, 75, 91–92unit values of, 38–39Fisheries productionby market-based commodity category,17, 19–22by region and fishing area, 15–16
Fisheries productsexport value of, 106import value of, 107
Fish exportschanges in, 165fisheries outlook and, 151by fish species, 106–111growth of, 105–106projections of, 143by quantity, 107–108by value, 110
Fishmeal/fish oilaquaculture and, 71–72defined, 160, 199demand for, 43, 43–44, 51, 87–90estimated shares of, 83–84export of, 84–85, 116, 121, 124geographic concentrations of, 84nutritional properties of, 87–88outlook for, 91–92policy research in, 150–151price issues, 55–56, 75, 82, 85–87, 144, 146production of, 21–22, 82–84, 178–179replacement of, 92–93use of, 43, 82, 83, 160, 185–186
Fish pricesaquaculture and, 90fish demand and, 41–42fish trade and, 142–145future of, 8–9, 55–57IMPACT model and, 52increase in, 29poor people and, 7, 127–128trends in, 37–38
��# ��������������
FishStat Plus, 164Fish trade
barriers to, 129–134codes of practice for, 132–133commodity groups and, 112–116expansion of, 105–106fish exports and, 106–112fish prices and, 142–145impact of, 122–129policy research in, 150–151production subsidies’ role in, 133–134projections, 117–122
Food and Agriculture Organization of theUnited Nations (FAO), 1, 78, 199
Food fish productionalternative scenarios, 59–60from aquaculture, 169baseline scenario, 57–59, 75from capture, 168global, 19growth of, 140policy research in, 150–151projection scenarios, 59, 74, 189–191regional, 58supply sources for, 139–140total, 12, 57, 167
Freshwater fishin China, 100consumption of, 32export of, 111, 115unit values of, 38, 39
Fry (fish), defined, 199
�Gamete, defined, 199General Agreement on Tariffs and Trade
(GATT), 129, 199Genetically modified organism (GMO),
defined, 199Genetic modifications, 94–95Geographic information systems (GIS) tech-
nology, 103, 199Globalization, 5–6, 127Global modeling. See IMPACT modelGovernment agencies, environmental issues
and, 79
Groundfish, defined, 199Group of Experts on the Scientific Aspects
of Marine Environmental Protection(GESAMP), 100, 199
*Hazard Analysis and Critical Control Points
(HACCP) system, 6, 131, 132, 134, 200Health concerns, fish trade and, 131–133High-value finfish
from aquaculture, 24–25, 175from capture, 19–20, 171categories of, 157–158consumption of, 35–36, 182, 194export and import of, 114, 117price trends, 37, 144
"Illegal, unreported, and unregulated (IUU)
fishing, 78, 200IMPACT commodity groups
fish production by, 19fish trade and, 112–116listing of, 157–158steps involved in creating, 159–161unit values of, 20, 40
IMPACT modelaquaculture’s impact and, 74–77assumptions under, 52–55classification of countries under, 153–155conclusions from, 63–64demand parameters and, 49–51development of, 46fishmeal outlook under, 91–92fishmeal replacement under, 92–93fish prices and, 55–57fish production and, 57–60handling trade data in, 163–165per capita consumption and, 60–63price issues in, 46–48, 76projection scenarios, 53, 117–122supply parameters and, 51–52
Import value of fisheries products, 107Income
elasticity of demand, defined, 200fish demand and, 38–41, 50from fish trade, 124–126, 147

��������������
Indiaaquaculture production in, 24fish consumption in, 60fish trade in, 114GDP projections in, 50
Individual transferable quotas (ITQs), 102,104, 200
Information technology. See TechnologyIntensification
aquaculture, 96–97defined, 200demand for, 96environmental impacts and, 98–100
International Aquatic Animal Health Codeand Diagnostic Manual for AquaticAnimal Diseases, 132
International Council for the Exploration ofthe Sea (ICES), 132, 133, 200
International Model for Policy Analysis ofAgricultural Commodities and Trade(IMPACT), defined, 200
International Standard StatisticalClassification of Aquatic Animals andPlants (ISSCAAP), 157, 159, 200
Investment, changes in, 51–52
'Japan
fish consumption in, 31fish production in, 15, 19fish trade in, 109, 113high-value finfish in, 20
7Krill, defined, 200
-Latin America
aquaculture production in, 23classification of, 154fish consumption in, 60fisheries production in, 16fish export from, 109fish trade in, 115
Lending agencies, 79“Livestock Revolution,” 9Low-value food fish
from aquaculture, 174from capture, 170categories of, 157–158consumption of, 33, 35–36, 138, 181,193export of, 118, 123price issues, 128
�Mangroves, damage to, 70Mariculture, defined, 200Marine fish, 32–33Marine Stewardship Council, 102, 128Meat-and-bone meal, 92Mercury, 131Mesopelagic, defined, 200Micronutrient, defined, 200Mollusks
from aquaculture, 25, 176from capture, 20–21, 172categories of, 157–158consumption of, 33, 35, 36, 183, 195defined, 198export of, 120trade of, 114–116
#National Marine Fisheries Service, 104Network of Aquaculture Centers in Asia-
Pacific (NACA), 80, 200Nile tilapia, 94Nonprice-mediated drivers, 49Nontarget species, 67North Africa, classification of, 154Not elsewhere specified (NES), 200Nutrition, fish trade impact on, 126–127
%Oceans, sustainable use of, 145Office International des Epizooties (OIE), 132Omega-3 fatty acids, 83, 87, 88Organisation for Economic Co-operation
and Development (OECD), 200
1Pelagic fish
consumption of, 32–33, 35defined, 200
��� ��������������
Per capita consumptionbaseline scenario, 60food fish, 32, 33, 61, 62, 138–139, 187–188
Per capita income, 41Peruvian anchoveta fishery, 86Pew report, 1Phaeodactylum tricornulum, 93Poison fishing, 67Pollution, 69, 71Polychlorinated biphenyls (PCBs), 131Polyculture, 100, 200Poor people
fisheries outlook and, 152fish prices and, 7, 127–128fish trade and, 9implications for, 147–148
Population growth, 40, 49Postlarvae, defined, 200Poultry, 42, 89Price elasticity of demand, defined, 201Price elasticity of supply, defined, 201Price-mediated drivers, 49, 50, 145Producer subsidy equivalents (PSE), 46, 201
$Reduction fish
defined, 7, 201determinants of demand for, 43–44
Rights-based management systems,102–103
Salmon
escaped species, 72export of, 109, 113supply and demand, 5
Sanitary and Phyto-Sanitary Agreements(SPS), 6, 129, 131, 132, 201
Satellite technology, 101Seafloor ecosystems, 68Seafood products
certification for, 128contaminants in, 131price indexes for, 37–38traceability of, 102
Seine nets, defined, 201
Semi-intensive aquaculture, 97Shrimp
contaminants in, 131export of, 111, 114supply and demand, 5trawling, 67
Shrimp farming/industryaquaculture expansion and, 69, 128water demand and, 71
Southeast Asiaclassification of, 154fish consumption in, 138–139fisheries production in, 15–16GDP projections in, 50high-value finfish in, 20
Soybeans, 93Soymeal, 85, 86, 90Squid. See MollusksState of World Fisheries and Aquaculture
2000 report, 78Stocking density, 98, 201Sub-Saharan Africa, 154, 201Supply and demand issues. See also
IMPACT modelentry points for policy action and,148–150fish consumption and, 29fish demand and, 5, 8, 137–139fish prices and, 41–42, 46–47, 127–128
Surimi, 67, 201
�Tariffs
in developed and developing countries,129–130escalation, 129–130, 201
Technical Barriers to Trade (TBT), 132, 201Technology
aquaculture and, 54, 56, 90, 93, 99–100breeding, 94environmental issues and, 78–79fisheries and, 104, 152fishmeal use and, 89fish production and, 141fish trade and, 134–135hatchery, 99IMPACT model and, 51–52
��������������
minimizing disease risk with, 98–99minimizing waste by using, 103–104transgenic, 95water control, 97
Terrestrial livestock, 88–90Thailand
fish trade in, 109HACCP process in, 134Total factor productivity (TFP), 96, 97, 201Transgenic fish, 72, 73, 95, 201Trawling
bycatch reduction devices and, 103damage caused by, 68defined, 201shrimp, 67
“Trojan Horse” gene, 73Trophic level, 201Tuna, export of, 109, 111
&
U.S. National Observer Program, 104
United Nations Convention on the Law ofthe Sea, 77
United States of America. See Developedcountries
Urbanization, food fish demand and, 40–41
)
Vessel monitoring system (VMS) technolo-gy, 103, 201
,
Water demandaquaculture expansion and, 71environmental impacts and, 99
Western Asia, classification of, 154Wild fisheries. See FisheriesWorld Trade Organization (WTO), 6, 129,
201World Wildlife Fund, 1
A
Zoning regulations, 78, 79

���
������������
Christopher Delgado is an agricultural and policy economist with expertise inglobal livestock and fisheries product markets, agricultural and food trade issues,and interactions between poverty and environmental sustainability. After 24years as a researcher at IFPRI, he was recently appointed the first director of anew program for livestock market opportunities, undertaken jointly by theInternational Livestock Research Institute (ILRI) and IFPRI, which merges thetwo institutes’ research activities concerning livestock product marketing, trade,and food safety policies and institutions for marketing animal food products andinputs. In addition to this study, Christopher’s most recent research involvedfieldwork in the Philippines, Bangladesh, India, Thailand, Kenya, and Brazil.
Nikolas Wada is a senior research assistant in the Markets, Trade, andInstitutions Division of IFPRI. His research has focused primarily on fisheries,aquaculture, and smallholder livestock production since joining IFPRI in 2001.Prior to joining IFPRI, Nikolas worked as a research fellow at the Center forEnvironmental Science and Policy within the Institute for International Studiesat Stanford University, focusing on aquaculture and climatic interactions withagriculture. He received his B.S. in environmental science from StanfordUniversity in 1999.
Mark W. Rosegrant is the director of the Environment and ProductionTechnology Division at IFPRI. He also holds a joint appointment as a principalresearcher with the International Water Management Institute. Mark has 24years of experience in research and policy analysis related to agriculture andeconomic development, emphasizing critical water issues as they affect worldfood security, rural livelihoods, and environmental sustainability. Markdeveloped IFPRI’s International Model for Policy Analysis of AgriculturalCommodities and Trade (IMPACT) and to continues to coordinate a joint

��� ��������������
IFPRI–IWMI team developing state-of-the-art integrated global water and foodmodels.
Siet Meijer is currently an economist with the World Resources Institute. At thetime of contributing to this study she was a research analyst in the Environmentand Production Technology Division of IFPRI. She worked as a member of theIMPACT team, conducting research related to global food supply, demand,trade, and water resources management. Siet, a Dutch national, received an MScdegree in rural development economics from Wageningen AgriculturalUniversity, the Netherlands.
Mahfuzuddin Ahmed is a principal scientist and leader of the Policy Researchand Impact Assessment Program at the WorldFish Center, where he is part ofthe senior management team responsible for providing strategic leadership inprioritizing, planning, and implementing the center’s research activities.Mahfuzuddin, who was born in a coastal village of Bangladesh, holds bachelorsand masters degrees in economics, specializing in rural economics. He also holdsa Ph.D. in resource economics from Agricultural University of Malaysia.