home ownership & renting:...
TRANSCRIPT
www.parliament.uk/commons-library | intranet.parliament.uk/commons-library | [email protected] | @commonslibrary
BRIEFING PAPER
Number CBP 7706, 9 June 2017
Home ownership & renting: demographics
By Cassie Barton
Contents: 1. Measuring housing tenure
and demographics 2. Region 3. Age group 4. Ethnicity 5. Country of birth Statistical tables
2 Home ownership & renting: demographics
Contents Summary 3
1. Measuring housing tenure and demographics 4 1.1 Tenure groups 4 1.2 Counting households: what is a household reference person? 4 1.3 Measuring changes over time 4 1.4 Why use the Labour Force Survey? 5
2. Region 6 2.1 Household tenure by region, 2016 6 2.2 Local data on housing tenure 6 2.3 Trends in focus 7
Decline in social renting 7 Rise and fall of home ownership 8 Steady rise in private renting 9
2.4 Further reading 9
3. Age group 11 3.1 Tenure by age of household leader, 2016 11 3.2 Trends in focus 12
Decline in home ownership amongst young people 12 Narrowing age gap in the social rented sector 12
3.3 Further reading 13
4. Ethnicity 14 4.1 Trends in focus 15
Growing disparity in home ownership 15 4.2 Further reading 15
5. Country of birth 17 5.1 Tenure by country of birth of household leader, 2016 17 5.2 Trends in focus 17
Growth in private renting amongst migrants 17 5.3 Further reading 18
Statistical tables 20
Cover page image copyright Patrick Down (Bay Windows)
3 Commons Library Briefing, 9 June 2017
Summary This briefing paper looks at the demographics of households in owner-occupied, privately rented and social rented housing and considers trends over the last twenty years. The data comes from analysis of the Labour Force Survey (LFS), a UK-wide survey.
At the end of 2016, around 65% of UK households were owner-occupiers, 17% were renting from a private landlord and 18% were renting from a social landlord. Social renting has declined since 1996, while private renting has increased. The rate of owner-occupation is also slightly lower than it was ten years ago.
Some of the key regional and demographic variations in this pattern are described below.
Region
• Owner-occupation is least common in London and more common in the South of England and in Wales.
• London and the North of England also saw less growth in the number of households owner-occupying between 1996 and 2016.
• Social renting is more common in Scotland, the North of England and London. The number of social renters has fallen – particularly in the North – over the last twenty years.
• Private renting has grown across the UK, and is currently most common in London.
Age
• Households with a younger household reference person (HRP) are less likely to be owner-occupiers and more likely to rent privately.
• The age gap in home ownership rates has grown over the last twenty years: 16-34 year olds have become less likely to own their home, and over-65s more likely.
Ethnicity
• Home ownership is more common amongst households led by someone who is White, Indian or Pakistani than other ethnic groups.
• The rate of home ownership fell amongst all ethnic groups between 2001 and 2016, but the fall was greater amongst non-White ethnic groups.
Country of birth
• Households led by someone born outside the UK are less likely to own their home and more likely to rent privately. Rates of social renting are similar for UK-born and non-UK-born household reference persons.
• The number of households led by someone born outside of the UK has grown substantially in the last twenty years. Most of this growth has been in the private rented sector.
The Library has published other briefings on related topics, which are listed in more detail at the end of each section. More generally, Tackling the under-supply of housing looks at trends in the supply of housing in each tenure group and Allocating social housing looks at how social housing is allocated presents a demographic breakdown of recent housing allocations.
4 Home ownership & renting: demographics
1. Measuring housing tenure and demographics
This briefing paper uses the Labour Force Survey (LFS), a quarterly survey of UK households, to look at trends in home ownership and renting across different demographic groups. This section explains some of the terms and methods used.
1.1 Tenure groups This analysis looks at three kinds of housing tenure:
• Owner-occupation, where the home is owned outright or being bought with a mortgage or loan.
• Social renting, where the household pays rent to a local authority or housing association.
• Private renting, where the household rents from any other kind of landlord.
Households living rent-free, squatting or in ‘shared ownership’ schemes (where the property is part owned and part rented) are not included here because the groups are too small to allow for meaningful analysis.
1.2 Counting households: what is a household reference person?
Analysis of housing tenure usually looks at the number of households in a particular group, rather than the number of individual people.
According to the definition used in the LFS, a household is ‘a single person, or a group of people, living at the same address who have the address as their only or main home. They also share one main meal a day or share the living accommodation’.1 A household is not always the same thing as a family unit: for example, a group of friends living together would count as separate family units but one household.
In order to count households, this analysis looks at the demographics of the household reference person (HRP). In the LFS, the HRP is the person who owns the accommodation or is responsible for the rent. In joint tenures, the person with the highest income is the HRP and if income is the same, the eldest person is the HRP.
Many households will contain people with a mixture of demographics. But looking at the characteristics of the HRP gives an idea of how demographics vary with housing tenure while controlling for the size and makeup of households.
1.3 Measuring changes over time This paper looks at survey data at five-year intervals: LFS samples from the final months of 1996, 2001, 2006, 2011 and 2016. For 1996 and 2001, data was collected between September and November; afterwards, it was collected from October to December.
The LFS uses a representative sample, which means its estimates can be generalised to the whole population. However, no sample perfectly reflects the real population. This means that estimates are subject to variation. This report gives values rounded to the nearest
1 Office for National Statistics. Labour Force Survey User Guide Volume 8: Household and family data 2008,
p.4.
5 Commons Library Briefing, 9 June 2017
thousand, and these should be treated as indicative only. Differences between estimates are commented on if they are statistically significant, i.e. that there is a less than five percent chance that the difference occurred randomly.
1.4 Why use the Labour Force Survey? The LFS is not the only source of data on housing tenure. The English Housing Survey (EHS) also collects data on housing tenure and demographic characteristics, released in an annual publication.
The EHS is the best source to use for detailed, England-only housing statistics. As well as tenure, it covers topics including overcrowding, energy efficiency, housing quality and housing costs. The most recent publication is the headline report for 2015-16,2 and a series of more detailed reports from 2014-15 are also available from DCLG.
The LFS has some differences from the EHS which make it a useful additional source of statistics. It covers the whole of the UK and is also produced more frequently than the EHS – quarterly, rather than annually.
The LFS also has a larger sample size: around 40,000 households are interviewed for each release, compared to around 13,000 for the EHS. This means the LFS is better suited to producing statistics for small groups (e.g. figures broken down by tenure group and region).
2 DCLG, English Housing Survey 2015 to 2016: Headline report, 3 March 2017
6 Home ownership & renting: demographics
2. Region
2.1 Household tenure by region, 2016
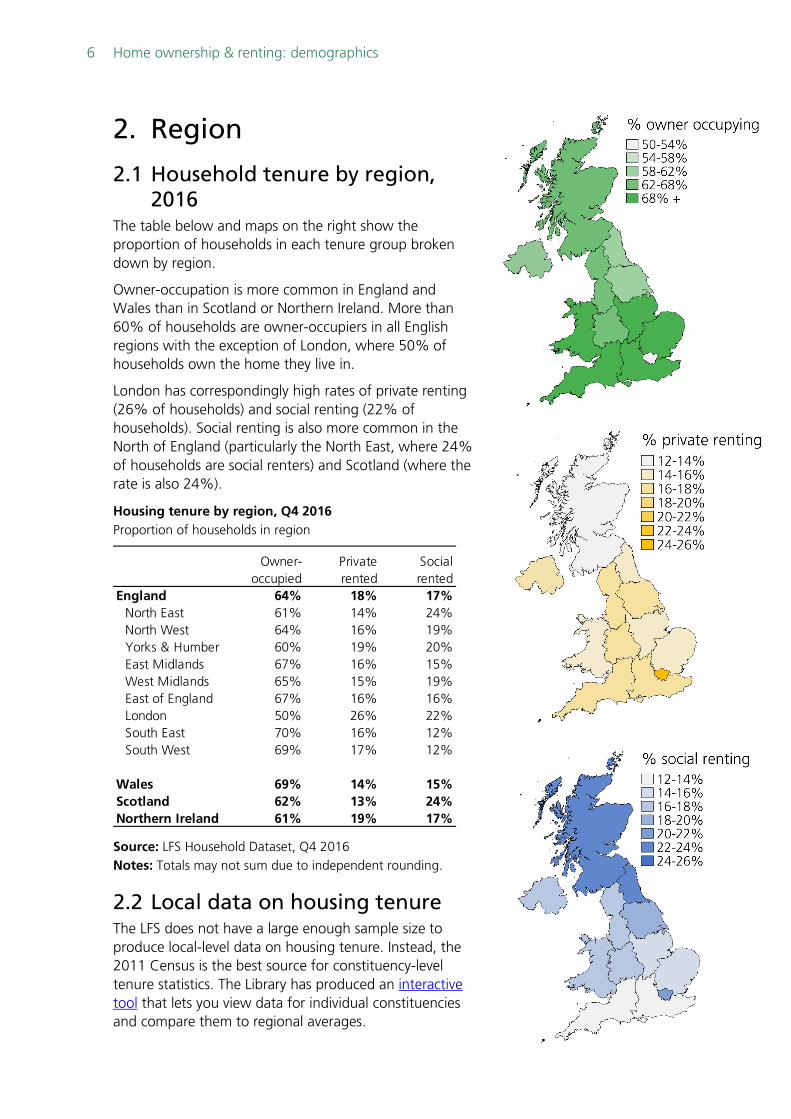
The table below and maps on the right show the proportion of households in each tenure group broken down by region.
Owner-occupation is more common in England and Wales than in Scotland or Northern Ireland. More than 60% of households are owner-occupiers in all English regions with the exception of London, where 50% of households own the home they live in.
London has correspondingly high rates of private renting (26% of households) and social renting (22% of households). Social renting is also more common in the North of England (particularly the North East, where 24% of households are social renters) and Scotland (where the rate is also 24%).
Housing tenure by region, Q4 2016 Proportion of households in region
Source: LFS Household Dataset, Q4 2016 Notes: Totals may not sum due to independent rounding.
2.2 Local data on housing tenure The LFS does not have a large enough sample size to produce local-level data on housing tenure. Instead, the 2011 Census is the best source for constituency-level tenure statistics. The Library has produced an interactive tool that lets you view data for individual constituencies and compare them to regional averages.
Owner-occupied
Private rented
Social rented
England 64% 18% 17%North East 61% 14% 24%North West 64% 16% 19%Yorks & Humber 60% 19% 20%East Midlands 67% 16% 15%West Midlands 65% 15% 19%East of England 67% 16% 16%London 50% 26% 22%South East 70% 16% 12%South West 69% 17% 12%
Wales 69% 14% 15%Scotland 62% 13% 24%Northern Ireland 61% 19% 17%
7 Commons Library Briefing, 9 June 2017
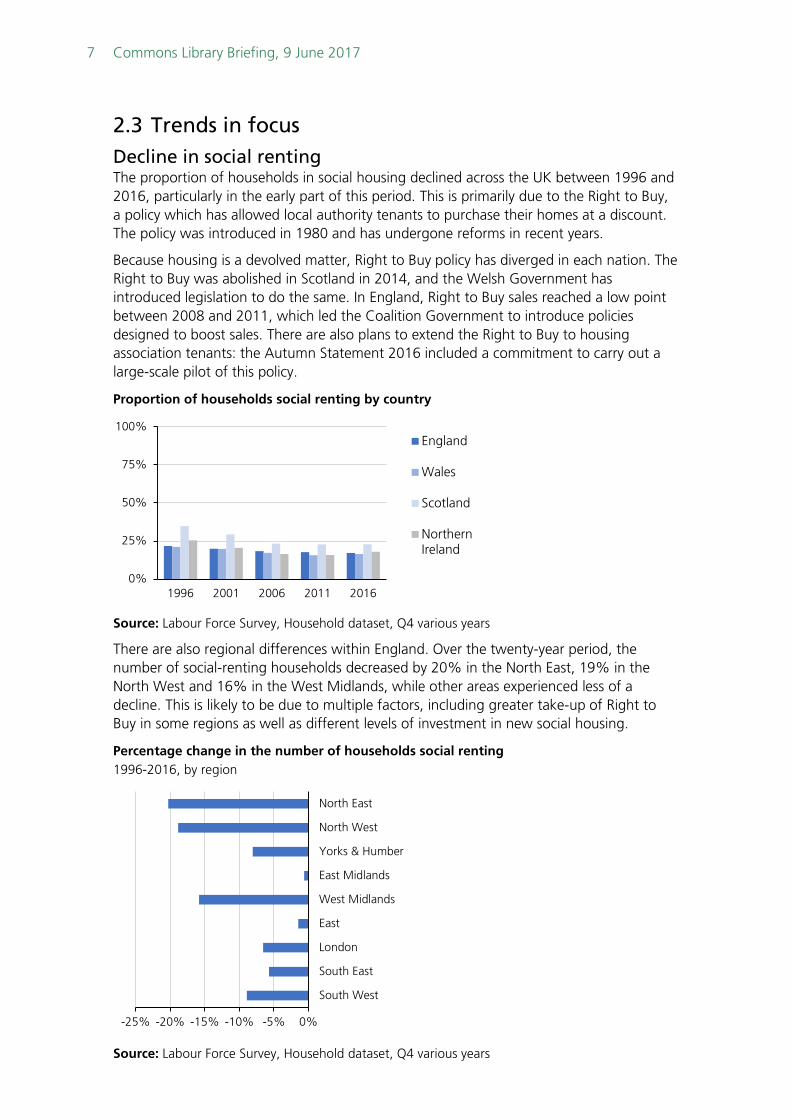
2.3 Trends in focus Decline in social renting The proportion of households in social housing declined across the UK between 1996 and 2016, particularly in the early part of this period. This is primarily due to the Right to Buy, a policy which has allowed local authority tenants to purchase their homes at a discount. The policy was introduced in 1980 and has undergone reforms in recent years.
Because housing is a devolved matter, Right to Buy policy has diverged in each nation. The Right to Buy was abolished in Scotland in 2014, and the Welsh Government has introduced legislation to do the same. In England, Right to Buy sales reached a low point between 2008 and 2011, which led the Coalition Government to introduce policies designed to boost sales. There are also plans to extend the Right to Buy to housing association tenants: the Autumn Statement 2016 included a commitment to carry out a large-scale pilot of this policy.
Proportion of households social renting by country
Source: Labour Force Survey, Household dataset, Q4 various years
There are also regional differences within England. Over the twenty-year period, the number of social-renting households decreased by 20% in the North East, 19% in the North West and 16% in the West Midlands, while other areas experienced less of a decline. This is likely to be due to multiple factors, including greater take-up of Right to Buy in some regions as well as different levels of investment in new social housing.
Percentage change in the number of households social renting 1996-2016, by region
Source: Labour Force Survey, Household dataset, Q4 various years
0%
25%
50%
75%
100%
1996 2001 2006 2011 2016
England
Wales
Scotland
NorthernIreland
-25% -20% -15% -10% -5% 0%
North East
North West
Yorks & Humber
East Midlands
West Midlands
East
London
South East
South West
8 Home ownership & renting: demographics
Right to Buy has not led to a straightforward increase in home ownership. As discussed in the sections below, the regions that have experienced greater decline in social renting have tended to see more of an increase in private renting than home ownership.
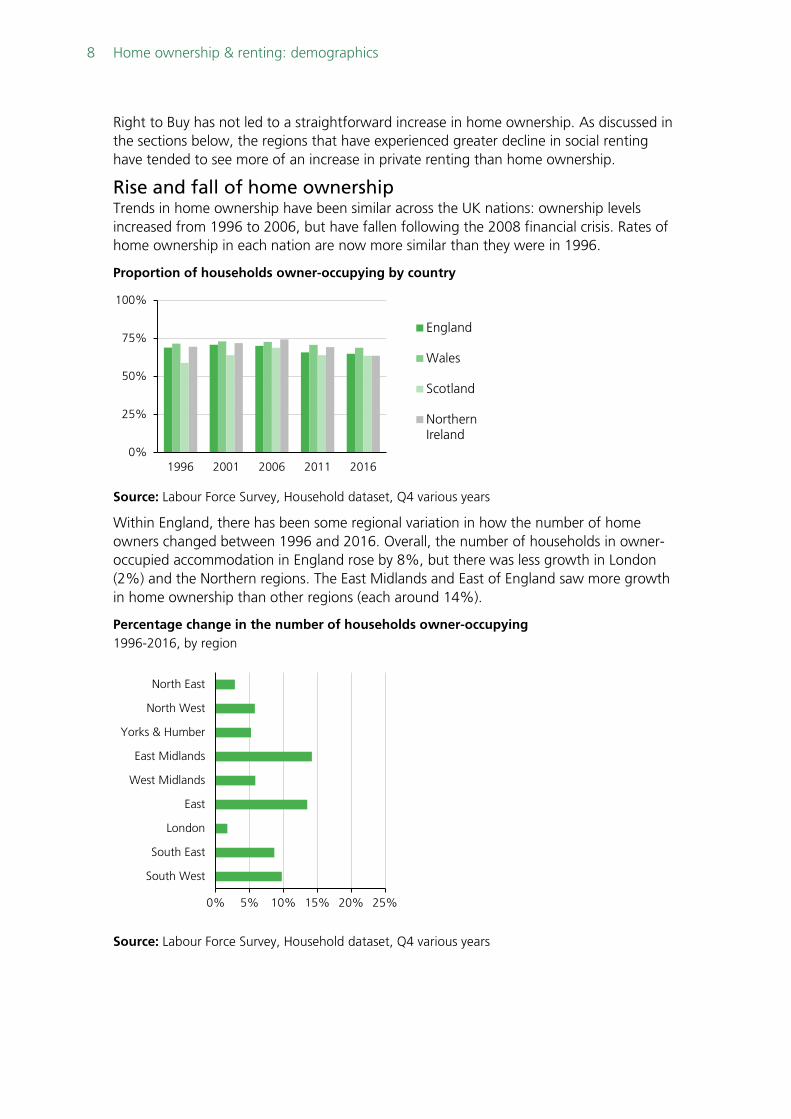
Rise and fall of home ownership Trends in home ownership have been similar across the UK nations: ownership levels increased from 1996 to 2006, but have fallen following the 2008 financial crisis. Rates of home ownership in each nation are now more similar than they were in 1996.
Proportion of households owner-occupying by country
Source: Labour Force Survey, Household dataset, Q4 various years
Within England, there has been some regional variation in how the number of home owners changed between 1996 and 2016. Overall, the number of households in owner-occupied accommodation in England rose by 8%, but there was less growth in London (2%) and the Northern regions. The East Midlands and East of England saw more growth in home ownership than other regions (each around 14%).
Percentage change in the number of households owner-occupying 1996-2016, by region
Source: Labour Force Survey, Household dataset, Q4 various years
0%
25%
50%
75%
100%
1996 2001 2006 2011 2016
England
Wales
Scotland
NorthernIreland
0% 5% 10% 15% 20% 25%
North East
North West
Yorks & Humber
East Midlands
West Midlands
East
London
South East
South West

9 Commons Library Briefing, 9 June 2017
Steady rise in private renting As the chart below shows, he proportion of households privately renting increased steadily in all UK nations over the last twenty years.
Proportion of households privately renting by country
Source: Labour Force Survey, Household dataset, Q4 various years
In England, the number of households privately renting increased by 121%. There was a particular increase in the North and Midlands (there was an increase of 212% in the North East). There was less of a proportional increase in the South, where rates of private renting have historically been higher.
Percentage change in the number of households privately renting 1996-2016, by region
Source: Labour Force Survey, Household dataset, Q4 various years
2.4 Further reading The House of Commons Library has produced a number of briefing papers looking at housing tenure trends and the factors influencing them. Tackling the under-supply of housing looks at long term trends in the supply of housing in the private and social sectors and discusses factors which have affected the net supply of social housing. The online version of the briefing includes tables with historic data on the housing stock in each tenure group.
There are two Library briefings covering the Right to Buy: Comparing the Right to Buy in England, Scotland, Wales and Northern Ireland looks at differences in devolved policy,
0%
25%
50%
75%
100%
1996 2001 2006 2011 2016
England
Wales
Scotland
NorthernIreland
0% 100% 200%
North East
North West
Yorks & Humber
East Midlands
West Midlands
East
London
South East
South West

10 Home ownership & renting: demographics
while Introducing a voluntary Right to Buy for housing association tenants in England covers past trends and future English policy plans in more detail.
What is affordable housing? looks at the regional and local variations in housing affordability that have limited households’ ability to get on the housing ladder, particularly in London. It also looks at regional trends in the provision of affordable housing under the National Planning Policy Framework (NPPF) definition of the term – including different rent levels in the social sector as well as affordable home ownership.
11 Commons Library Briefing, 9 June 2017
3. Age group
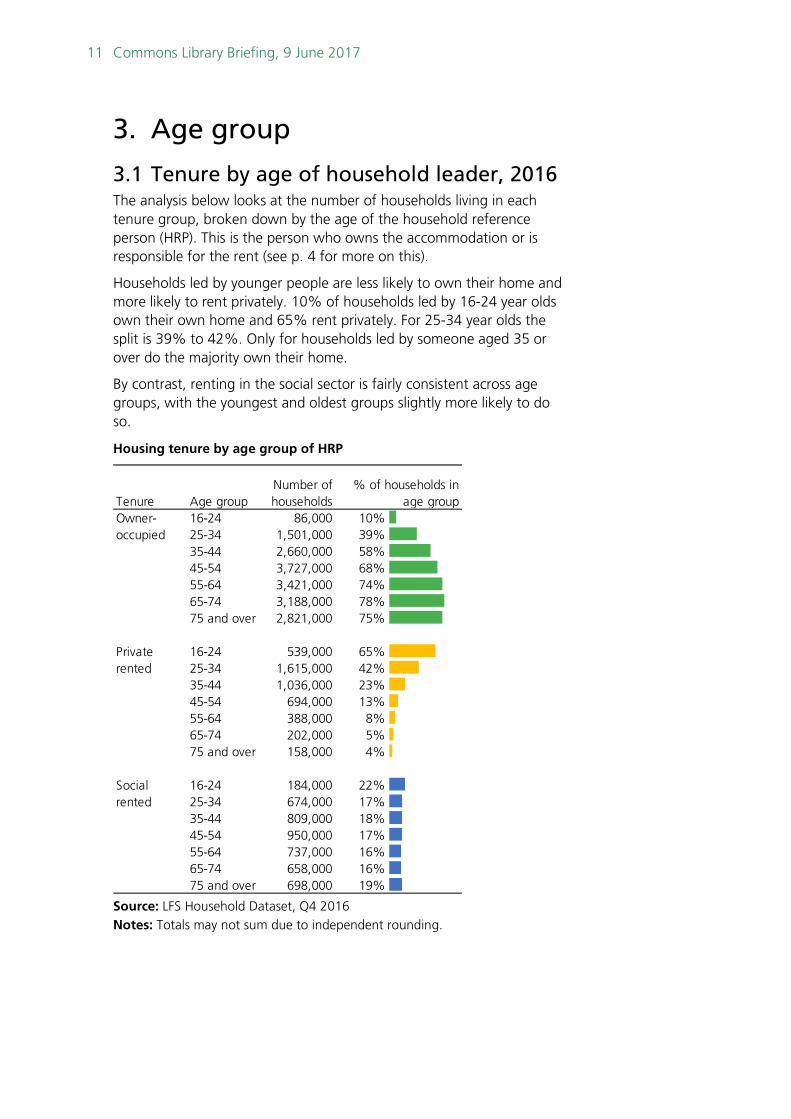
3.1 Tenure by age of household leader, 2016 The analysis below looks at the number of households living in each tenure group, broken down by the age of the household reference person (HRP). This is the person who owns the accommodation or is responsible for the rent (see p. 4 for more on this).
Households led by younger people are less likely to own their home and more likely to rent privately. 10% of households led by 16-24 year olds own their own home and 65% rent privately. For 25-34 year olds the split is 39% to 42%. Only for households led by someone aged 35 or over do the majority own their home.
By contrast, renting in the social sector is fairly consistent across age groups, with the youngest and oldest groups slightly more likely to do so.
Housing tenure by age group of HRP
Source: LFS Household Dataset, Q4 2016 Notes: Totals may not sum due to independent rounding.
Tenure Age groupNumber of households
16-24 86,000 10%25-34 1,501,000 39%35-44 2,660,000 58%45-54 3,727,000 68%55-64 3,421,000 74%65-74 3,188,000 78%75 and over 2,821,000 75%
16-24 539,000 65%25-34 1,615,000 42%35-44 1,036,000 23%45-54 694,000 13%55-64 388,000 8%65-74 202,000 5%75 and over 158,000 4%
16-24 184,000 22%25-34 674,000 17%35-44 809,000 18%45-54 950,000 17%55-64 737,000 16%65-74 658,000 16%75 and over 698,000 19%
Owner-occupied
Private rented
Social rented
% of households in age group
12 Home ownership & renting: demographics
3.2 Trends in focus
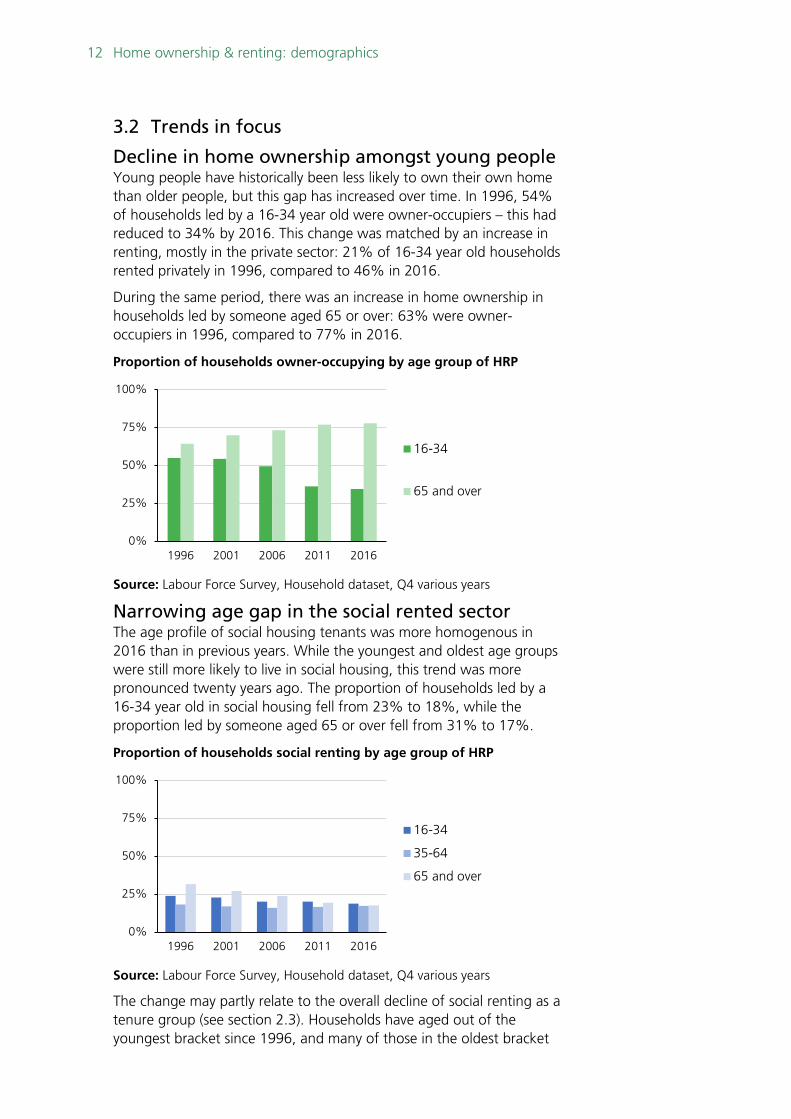
Decline in home ownership amongst young people Young people have historically been less likely to own their own home than older people, but this gap has increased over time. In 1996, 54% of households led by a 16-34 year old were owner-occupiers – this had reduced to 34% by 2016. This change was matched by an increase in renting, mostly in the private sector: 21% of 16-34 year old households rented privately in 1996, compared to 46% in 2016.
During the same period, there was an increase in home ownership in households led by someone aged 65 or over: 63% were owner-occupiers in 1996, compared to 77% in 2016.
Proportion of households owner-occupying by age group of HRP
Source: Labour Force Survey, Household dataset, Q4 various years
Narrowing age gap in the social rented sector The age profile of social housing tenants was more homogenous in 2016 than in previous years. While the youngest and oldest age groups were still more likely to live in social housing, this trend was more pronounced twenty years ago. The proportion of households led by a 16-34 year old in social housing fell from 23% to 18%, while the proportion led by someone aged 65 or over fell from 31% to 17%.
Proportion of households social renting by age group of HRP
Source: Labour Force Survey, Household dataset, Q4 various years
The change may partly relate to the overall decline of social renting as a tenure group (see section 2.3). Households have aged out of the youngest bracket since 1996, and many of those in the oldest bracket
0%
25%
50%
75%
100%
1996 2001 2006 2011 2016
16-34
65 and over
0%
25%
50%
75%
100%
1996 2001 2006 2011 2016
16-34
35-64
65 and over
13 Commons Library Briefing, 9 June 2017
are likely to have died. Because the sector has not grown over the last twenty years, households leaving those age cohorts have not been replaced to the same extent.
3.3 Further reading The perceived generation gap in access to home ownership in the UK has triggered a range of comment and analysis.
The Library has published a briefing paper on ‘millennials’ which looks at the socio-economic situation of people aged 25-34 in the UK, including more in-depth discussion of access to the housing market in this age group and trends over time.3
The Office for National Statistics (ONS) have published a short briefing, Why are more young people living with their parents?, which analyses data from the LFS and other sources to examine trends in the living arrangements of under-35s.4 They discuss affordability issues affecting young people’s ability to buy their own home, and also point to other factors which have an impact on housing arrangements.
A 2016 report by the Resolution Foundation, Stagnation generation, compared home ownership amongst different generations using the Family Resources Survey (FRS). According to their report:
The second half of the 20th century was characterised by the arrival of mass home ownership, with clearly divergent experiences across different generations. […] members of the silent generation [born 1926-45] were far more likely to own their own homes than their forbears, and this progress continued with the baby boomers [born 1946-55]: at age 40, roughly 70 per cent of this generation owned their home, compared with less than 40 per cent of the greatest generation [born 1911-25] at the same age.
However, this forward march has since reversed, with both generation X [born 1966-80] and the millennials [born 1981-2000] less likely than previous generations to own their own homes. At age 30, baby boomers were 50 per cent more likely to own their own home than millennials were at the same age. Put another way, 30 year old millennials have lower home ownership rates than the baby boomers did at age 24. Indeed, they even have lower levels of ownership than silent generation which came some 55 years earlier. 5
3 House of Commons Library, Millennials, April 2017 4 ONS Digital, Why are more young people living with their parents?, February 2016. 5 Resolution Foundation, Stagnation generation: the case for renewing the
intergenerational contract, July 2016, p.34. Age groups in square brackets are definitions used elsewhere in the report.
14 Home ownership & renting: demographics
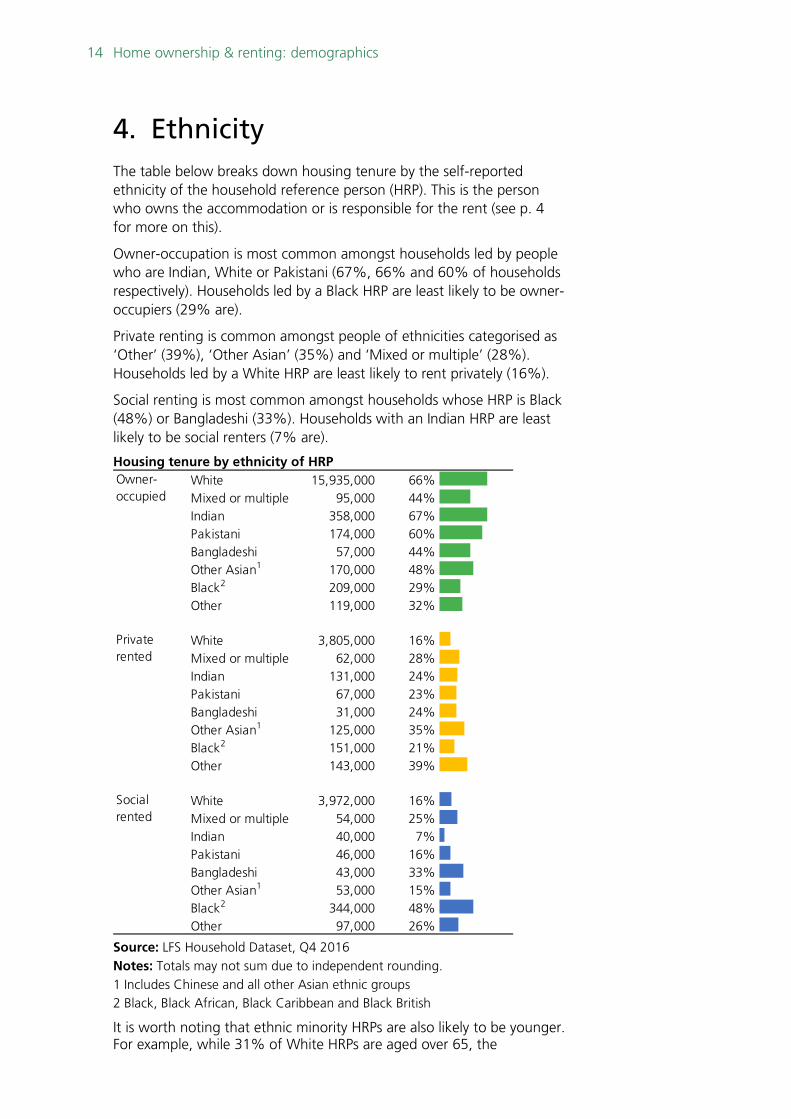
4. Ethnicity The table below breaks down housing tenure by the self-reported ethnicity of the household reference person (HRP). This is the person who owns the accommodation or is responsible for the rent (see p. 4 for more on this).
Owner-occupation is most common amongst households led by people who are Indian, White or Pakistani (67%, 66% and 60% of households respectively). Households led by a Black HRP are least likely to be owner-occupiers (29% are).
Private renting is common amongst people of ethnicities categorised as ‘Other’ (39%), ‘Other Asian’ (35%) and ‘Mixed or multiple’ (28%). Households led by a White HRP are least likely to rent privately (16%).
Social renting is most common amongst households whose HRP is Black (48%) or Bangladeshi (33%). Households with an Indian HRP are least likely to be social renters (7% are).
Housing tenure by ethnicity of HRP
Source: LFS Household Dataset, Q4 2016 Notes: Totals may not sum due to independent rounding. 1 Includes Chinese and all other Asian ethnic groups 2 Black, Black African, Black Caribbean and Black British
It is worth noting that ethnic minority HRPs are also likely to be younger. For example, while 31% of White HRPs are aged over 65, the
White 15,935,000 66%Mixed or multiple 95,000 44%Indian 358,000 67%Pakistani 174,000 60%Bangladeshi 57,000 44%Other Asian1 170,000 48%Black2 209,000 29%Other 119,000 32%
White 3,805,000 16%Mixed or multiple 62,000 28%Indian 131,000 24%Pakistani 67,000 23%Bangladeshi 31,000 24%Other Asian1 125,000 35%Black2 151,000 21%Other 143,000 39%
White 3,972,000 16%Mixed or multiple 54,000 25%Indian 40,000 7%Pakistani 46,000 16%Bangladeshi 43,000 33%Other Asian1 53,000 15%Black2 344,000 48%Other 97,000 26%
Owner-occupied
Private rented
Social rented
15 Commons Library Briefing, 9 June 2017
proportion amongst minority ethnic groups ranges from 4% of ‘Mixed/Multiple’ HRPs to 16% of Indian HRPs. Older HRPs are more likely to be homeowners (see section 2 above), so this trend may account for some of the differences in home ownership rates shown in this chapter.
4.1 Trends in focus Comparisons between ethnic groups can be made between 2001 and 2016. Before 2001, respondents were asked a different, non-comparable set of questions about their ethnicity. The ethnic groups specified also vary slightly after 2001, so this analysis uses a simplified set of categories to make comparisons.
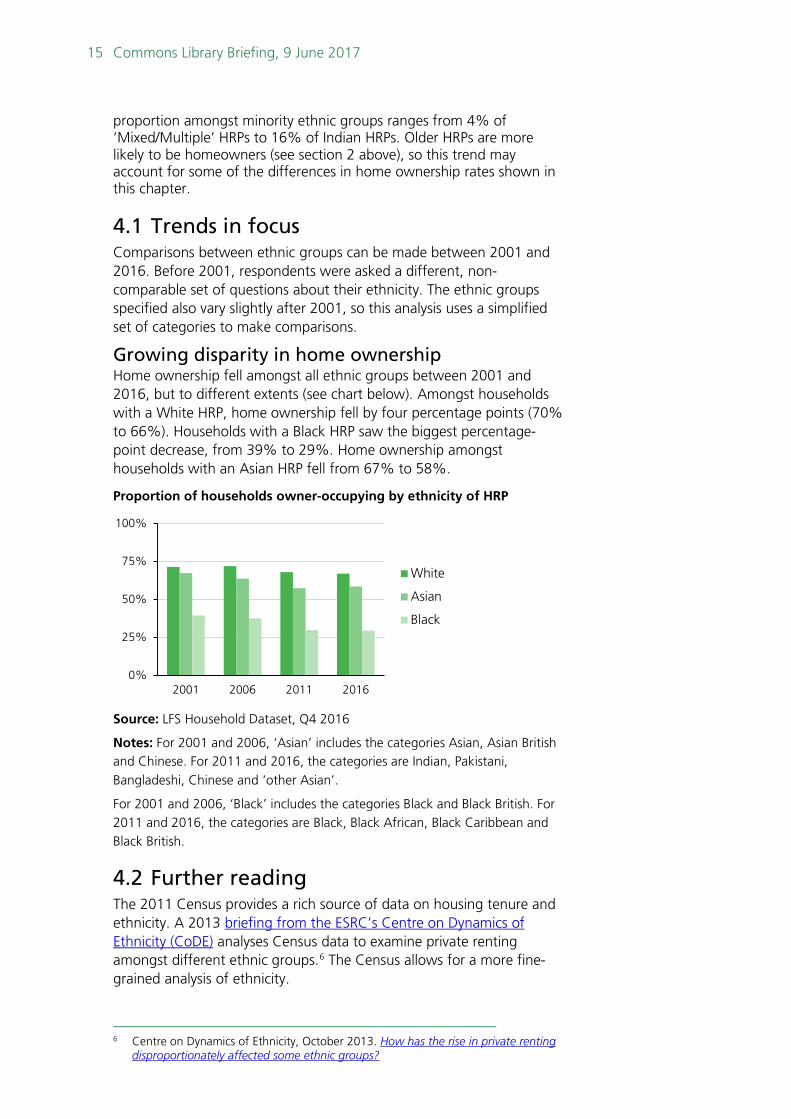
Growing disparity in home ownership Home ownership fell amongst all ethnic groups between 2001 and 2016, but to different extents (see chart below). Amongst households with a White HRP, home ownership fell by four percentage points (70% to 66%). Households with a Black HRP saw the biggest percentage-point decrease, from 39% to 29%. Home ownership amongst households with an Asian HRP fell from 67% to 58%.
Proportion of households owner-occupying by ethnicity of HRP
Source: LFS Household Dataset, Q4 2016
Notes: For 2001 and 2006, ‘Asian’ includes the categories Asian, Asian British and Chinese. For 2011 and 2016, the categories are Indian, Pakistani, Bangladeshi, Chinese and ‘other Asian’.
For 2001 and 2006, ‘Black’ includes the categories Black and Black British. For 2011 and 2016, the categories are Black, Black African, Black Caribbean and Black British.
4.2 Further reading The 2011 Census provides a rich source of data on housing tenure and ethnicity. A 2013 briefing from the ESRC’s Centre on Dynamics of Ethnicity (CoDE) analyses Census data to examine private renting amongst different ethnic groups.6 The Census allows for a more fine-grained analysis of ethnicity.
6 Centre on Dynamics of Ethnicity, October 2013. How has the rise in private renting
disproportionately affected some ethnic groups?
0%
25%
50%
75%
100%
2001 2006 2011 2016
White
Asian
Black

16 Home ownership & renting: demographics
CoDE’s analysis found that in 2011 private renting was highest amongst Other White and Arab ethnic groups, both of which have a high proportion of recent immigrants. Private renting increased between 1991 and 2011 for many ethnic groups, particularly Indian, Pakistani and Black Caribbean populations. The authors also note that ethnic differences in housing tenure are more pronounced amongst young adults.
17 Commons Library Briefing, 9 June 2017
5. Country of birth
5.1 Tenure by country of birth of household leader, 2016
This section looks at housing tenure by the country of birth of the household reference person (HRP, see p.4 for definition). ‘Country of birth’ is sometimes used as a proxy for migration status, but it does not identify whether or not a person has UK citizenship.7
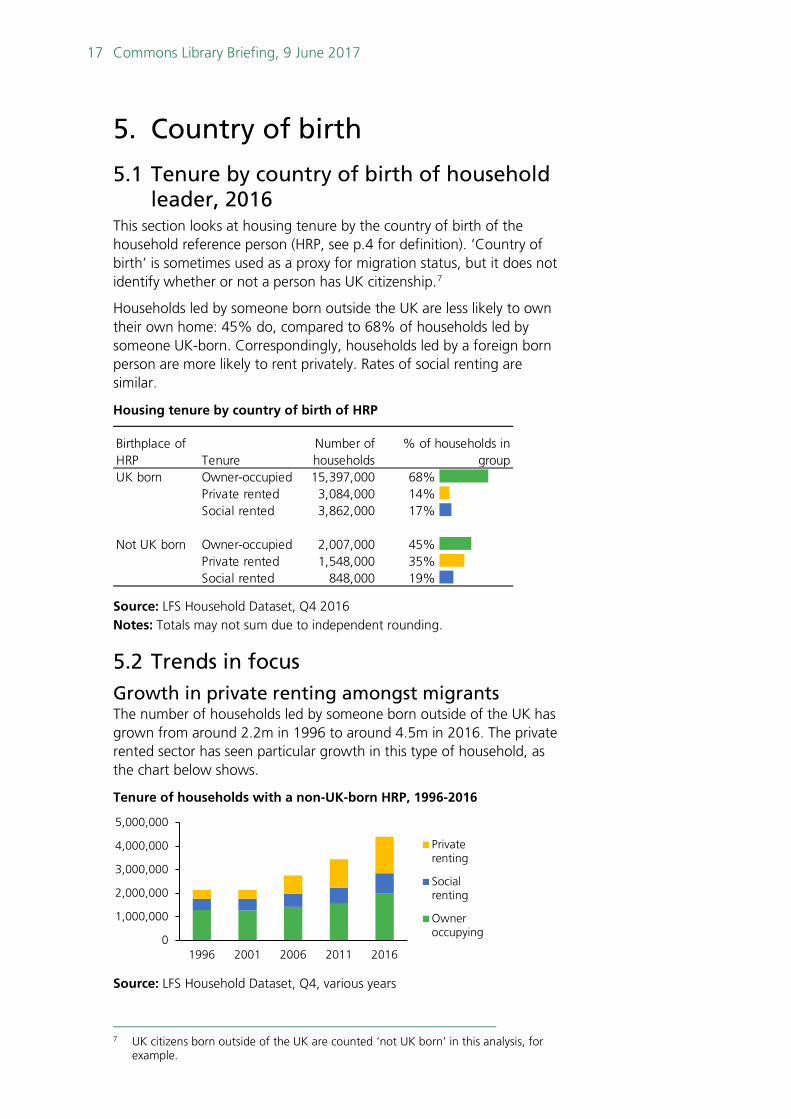
Households led by someone born outside the UK are less likely to own their own home: 45% do, compared to 68% of households led by someone UK-born. Correspondingly, households led by a foreign born person are more likely to rent privately. Rates of social renting are similar.
Housing tenure by country of birth of HRP
Source: LFS Household Dataset, Q4 2016 Notes: Totals may not sum due to independent rounding.
5.2 Trends in focus Growth in private renting amongst migrants The number of households led by someone born outside of the UK has grown from around 2.2m in 1996 to around 4.5m in 2016. The private rented sector has seen particular growth in this type of household, as the chart below shows.
Tenure of households with a non-UK-born HRP, 1996-2016
Source: LFS Household Dataset, Q4, various years
7 UK citizens born outside of the UK are counted ‘not UK born’ in this analysis, for
example.
Birthplace of HRP Tenure
Number of households
UK born Owner-occupied 15,397,000 68%Private rented 3,084,000 14%Social rented 3,862,000 17%
Not UK born Owner-occupied 2,007,000 45%Private rented 1,548,000 35%Social rented 848,000 19%
% of households in group
0
1,000,000
2,000,000
3,000,000
4,000,000
5,000,000
1996 2001 2006 2011 2016
Privaterenting
Socialrenting
Owneroccupying
18 Home ownership & renting: demographics
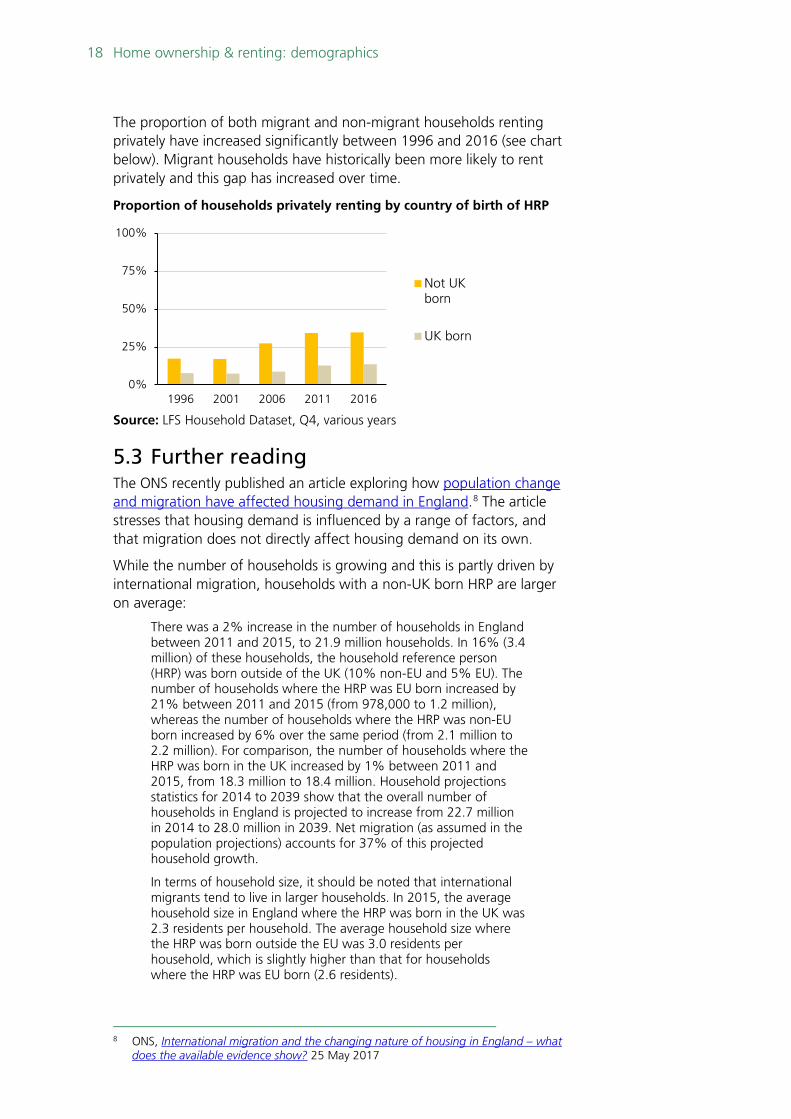
The proportion of both migrant and non-migrant households renting privately have increased significantly between 1996 and 2016 (see chart below). Migrant households have historically been more likely to rent privately and this gap has increased over time.
Proportion of households privately renting by country of birth of HRP
Source: LFS Household Dataset, Q4, various years
5.3 Further reading The ONS recently published an article exploring how population change and migration have affected housing demand in England.8 The article stresses that housing demand is influenced by a range of factors, and that migration does not directly affect housing demand on its own.
While the number of households is growing and this is partly driven by international migration, households with a non-UK born HRP are larger on average:
There was a 2% increase in the number of households in England between 2011 and 2015, to 21.9 million households. In 16% (3.4 million) of these households, the household reference person (HRP) was born outside of the UK (10% non-EU and 5% EU). The number of households where the HRP was EU born increased by 21% between 2011 and 2015 (from 978,000 to 1.2 million), whereas the number of households where the HRP was non-EU born increased by 6% over the same period (from 2.1 million to 2.2 million). For comparison, the number of households where the HRP was born in the UK increased by 1% between 2011 and 2015, from 18.3 million to 18.4 million. Household projections statistics for 2014 to 2039 show that the overall number of households in England is projected to increase from 22.7 million in 2014 to 28.0 million in 2039. Net migration (as assumed in the population projections) accounts for 37% of this projected household growth.
In terms of household size, it should be noted that international migrants tend to live in larger households. In 2015, the average household size in England where the HRP was born in the UK was 2.3 residents per household. The average household size where the HRP was born outside the EU was 3.0 residents per household, which is slightly higher than that for households where the HRP was EU born (2.6 residents).
8 ONS, International migration and the changing nature of housing in England – what
does the available evidence show? 25 May 2017
0%
25%
50%
75%
100%
1996 2001 2006 2011 2016
Not UKborn
UK born
19 Commons Library Briefing, 9 June 2017
The analysis found that recent migrants are more likely to rent privately, while migrants who have been in the UK long-term show a similar tenure pattern to UK-born residents:
88% of EU born residents and 80% of non-EU born residents arriving between 2014 and 2016 privately rented. EU born residents who had immigrated to the UK before 2001 were more likely to own or have bought their house with a mortgage; 59% of those arriving between 1991 and 2000 and 73% of those arriving before 1990 lived in homes that they own, similar to the proportion of UK born residents in the owner-occupied sector in 2016 (69%).
The analysis also found that privately-renting households with a non-UK-born HRP were more likely to live in London than any other region. There were 1.4 million such households in London in 2016, and 1.6 million in the rest of the UK regions combined.
The Migration Observatory at the University of Oxford has published a briefing on migrants and housing in the UK.9 The analysis looks at the accommodation of migrants who have recently arrived in the UK compared to those who have lived in the country for longer, and covers individuals rather than households. It found that the longer someone has lived in the country the more likely they are to live in owned accommodation:
[…] migrants who entered the UK recently (i.e. fewer than 5 years ago) differ significantly from other foreign born arrival groups in regards to type of accommodation. These recent migrants are much more likely to be renters (80%) compared to the average among all foreign born (41%). Yet, those who have been in the UK longer tend to have housing accommodation that is closer to that of the UK-born. In fact, the housing accommodation of those who have been in the UK for 20 years or more is very similar to that of the UK-born.
The briefing also includes a discussion of the allocation of social housing to migrants and non-migrants. They note that not all migrants are entitled to social housing, and add:
While there are no major differences in the use of social housing between the foreign-born and the UK-born populations, there have been claims in the popular press that migrants often receive priority status in the allocation of social housing. Several studies have failed to find evidence supporting this claim (e.g. Battiston et al. 2014, Rutter and Latorre 2009, Robinson 2010). However, some migrant groups are more likely to have the characteristics required to gain priority for social housing and this is one of the reasons for the claim that migrants often receive priority status. Social housing allocation policies vary by location, making it difficult to generalise these findings.
9 Migration Observatory, Migrants and housing in the UK: Experiences and impacts,
October 2016
20 Home ownership & renting: demographics
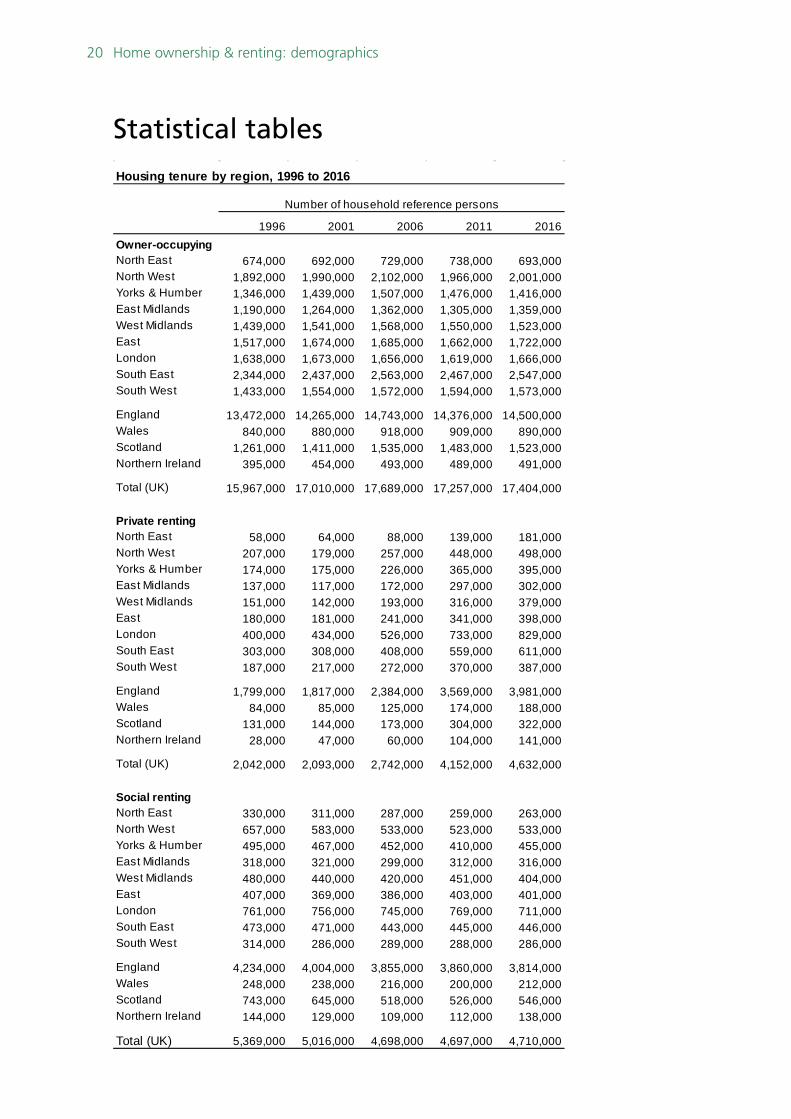
Statistical tables
Housing tenure by region, 1996 to 2016
1996 2001 2006 2011 2016Owner-occupyingNorth East 674,000 692,000 729,000 738,000 693,000North West 1,892,000 1,990,000 2,102,000 1,966,000 2,001,000Yorks & Humber 1,346,000 1,439,000 1,507,000 1,476,000 1,416,000East Midlands 1,190,000 1,264,000 1,362,000 1,305,000 1,359,000West Midlands 1,439,000 1,541,000 1,568,000 1,550,000 1,523,000East 1,517,000 1,674,000 1,685,000 1,662,000 1,722,000London 1,638,000 1,673,000 1,656,000 1,619,000 1,666,000South East 2,344,000 2,437,000 2,563,000 2,467,000 2,547,000South West 1,433,000 1,554,000 1,572,000 1,594,000 1,573,000
England 13,472,000 14,265,000 14,743,000 14,376,000 14,500,000Wales 840,000 880,000 918,000 909,000 890,000Scotland 1,261,000 1,411,000 1,535,000 1,483,000 1,523,000Northern Ireland 395,000 454,000 493,000 489,000 491,000
Total (UK) 15,967,000 17,010,000 17,689,000 17,257,000 17,404,000
Private rentingNorth East 58,000 64,000 88,000 139,000 181,000North West 207,000 179,000 257,000 448,000 498,000Yorks & Humber 174,000 175,000 226,000 365,000 395,000East Midlands 137,000 117,000 172,000 297,000 302,000West Midlands 151,000 142,000 193,000 316,000 379,000East 180,000 181,000 241,000 341,000 398,000London 400,000 434,000 526,000 733,000 829,000South East 303,000 308,000 408,000 559,000 611,000South West 187,000 217,000 272,000 370,000 387,000
England 1,799,000 1,817,000 2,384,000 3,569,000 3,981,000Wales 84,000 85,000 125,000 174,000 188,000Scotland 131,000 144,000 173,000 304,000 322,000Northern Ireland 28,000 47,000 60,000 104,000 141,000
Total (UK) 2,042,000 2,093,000 2,742,000 4,152,000 4,632,000
Social rentingNorth East 330,000 311,000 287,000 259,000 263,000North West 657,000 583,000 533,000 523,000 533,000Yorks & Humber 495,000 467,000 452,000 410,000 455,000East Midlands 318,000 321,000 299,000 312,000 316,000West Midlands 480,000 440,000 420,000 451,000 404,000East 407,000 369,000 386,000 403,000 401,000London 761,000 756,000 745,000 769,000 711,000South East 473,000 471,000 443,000 445,000 446,000South West 314,000 286,000 289,000 288,000 286,000
England 4,234,000 4,004,000 3,855,000 3,860,000 3,814,000Wales 248,000 238,000 216,000 200,000 212,000Scotland 743,000 645,000 518,000 526,000 546,000Northern Ireland 144,000 129,000 109,000 112,000 138,000
Total (UK) 5,369,000 5,016,000 4,698,000 4,697,000 4,710,000
Number of household reference persons
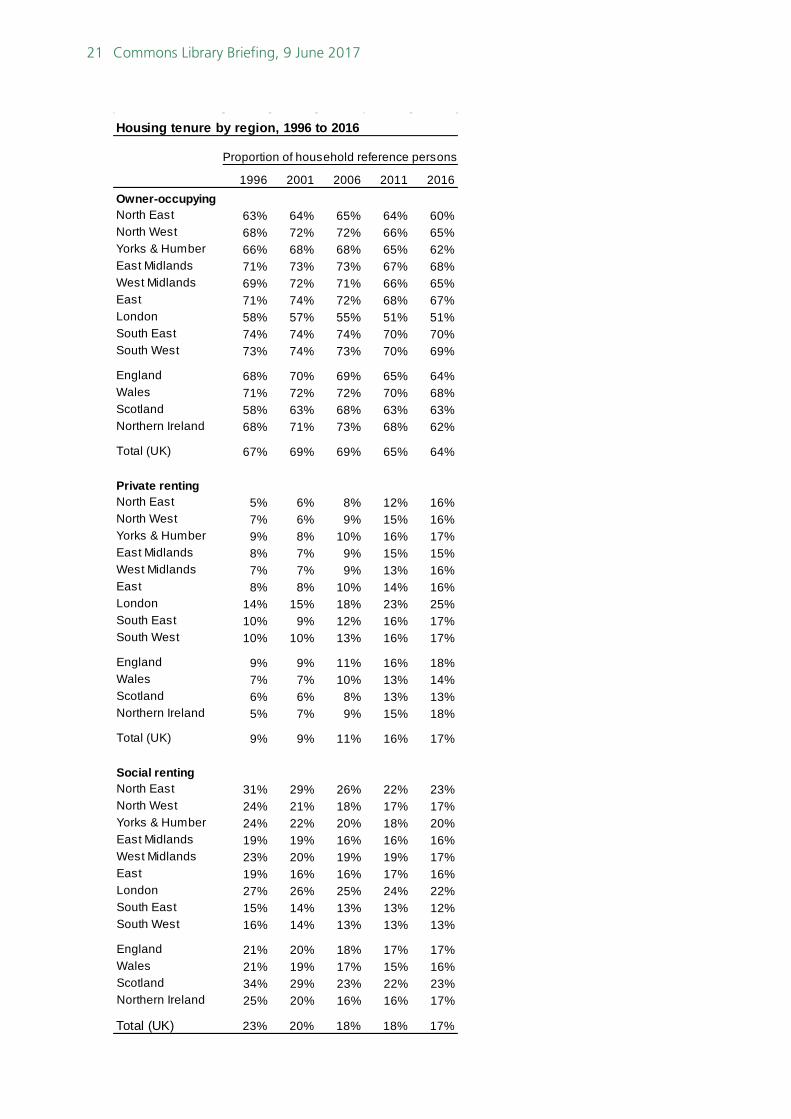
21 Commons Library Briefing, 9 June 2017
Housing tenure by region, 1996 to 2016
1996 2001 2006 2011 2016Owner-occupyingNorth East 63% 64% 65% 64% 60%North West 68% 72% 72% 66% 65%Yorks & Humber 66% 68% 68% 65% 62%East Midlands 71% 73% 73% 67% 68%West Midlands 69% 72% 71% 66% 65%East 71% 74% 72% 68% 67%London 58% 57% 55% 51% 51%South East 74% 74% 74% 70% 70%South West 73% 74% 73% 70% 69%
England 68% 70% 69% 65% 64%Wales 71% 72% 72% 70% 68%Scotland 58% 63% 68% 63% 63%Northern Ireland 68% 71% 73% 68% 62%
Total (UK) 67% 69% 69% 65% 64%
Private rentingNorth East 5% 6% 8% 12% 16%North West 7% 6% 9% 15% 16%Yorks & Humber 9% 8% 10% 16% 17%East Midlands 8% 7% 9% 15% 15%West Midlands 7% 7% 9% 13% 16%East 8% 8% 10% 14% 16%London 14% 15% 18% 23% 25%South East 10% 9% 12% 16% 17%South West 10% 10% 13% 16% 17%
England 9% 9% 11% 16% 18%Wales 7% 7% 10% 13% 14%Scotland 6% 6% 8% 13% 13%Northern Ireland 5% 7% 9% 15% 18%
Total (UK) 9% 9% 11% 16% 17%
Social rentingNorth East 31% 29% 26% 22% 23%North West 24% 21% 18% 17% 17%Yorks & Humber 24% 22% 20% 18% 20%East Midlands 19% 19% 16% 16% 16%West Midlands 23% 20% 19% 19% 17%East 19% 16% 16% 17% 16%London 27% 26% 25% 24% 22%South East 15% 14% 13% 13% 12%South West 16% 14% 13% 13% 13%
England 21% 20% 18% 17% 17%Wales 21% 19% 17% 15% 16%Scotland 34% 29% 23% 22% 23%Northern Ireland 25% 20% 16% 16% 17%
Total (UK) 23% 20% 18% 18% 17%
Proportion of household reference persons
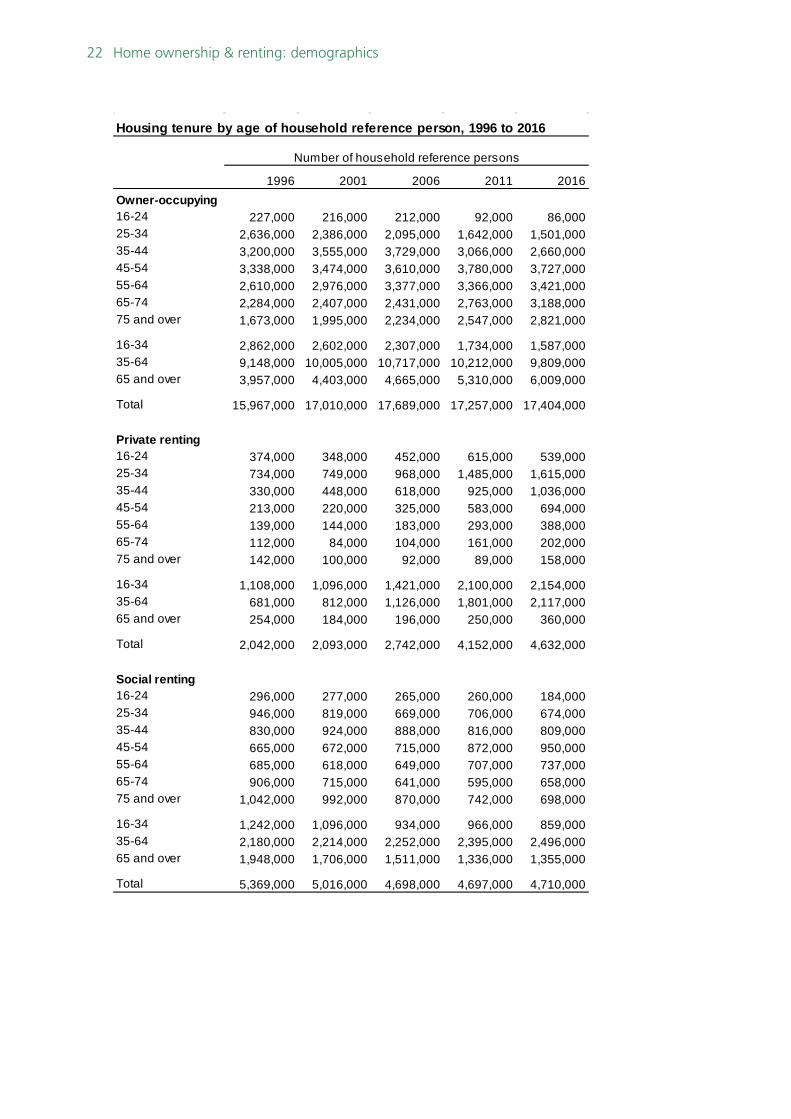
22 Home ownership & renting: demographics
Housing tenure by age of household reference person, 1996 to 2016
1996 2001 2006 2011 2016Owner-occupying16-24 227,000 216,000 212,000 92,000 86,00025-34 2,636,000 2,386,000 2,095,000 1,642,000 1,501,00035-44 3,200,000 3,555,000 3,729,000 3,066,000 2,660,00045-54 3,338,000 3,474,000 3,610,000 3,780,000 3,727,00055-64 2,610,000 2,976,000 3,377,000 3,366,000 3,421,00065-74 2,284,000 2,407,000 2,431,000 2,763,000 3,188,00075 and over 1,673,000 1,995,000 2,234,000 2,547,000 2,821,000
16-34 2,862,000 2,602,000 2,307,000 1,734,000 1,587,00035-64 9,148,000 10,005,000 10,717,000 10,212,000 9,809,00065 and over 3,957,000 4,403,000 4,665,000 5,310,000 6,009,000
Total 15,967,000 17,010,000 17,689,000 17,257,000 17,404,000
Private renting16-24 374,000 348,000 452,000 615,000 539,00025-34 734,000 749,000 968,000 1,485,000 1,615,00035-44 330,000 448,000 618,000 925,000 1,036,00045-54 213,000 220,000 325,000 583,000 694,00055-64 139,000 144,000 183,000 293,000 388,00065-74 112,000 84,000 104,000 161,000 202,00075 and over 142,000 100,000 92,000 89,000 158,000
16-34 1,108,000 1,096,000 1,421,000 2,100,000 2,154,00035-64 681,000 812,000 1,126,000 1,801,000 2,117,00065 and over 254,000 184,000 196,000 250,000 360,000
Total 2,042,000 2,093,000 2,742,000 4,152,000 4,632,000
Social renting16-24 296,000 277,000 265,000 260,000 184,00025-34 946,000 819,000 669,000 706,000 674,00035-44 830,000 924,000 888,000 816,000 809,00045-54 665,000 672,000 715,000 872,000 950,00055-64 685,000 618,000 649,000 707,000 737,00065-74 906,000 715,000 641,000 595,000 658,00075 and over 1,042,000 992,000 870,000 742,000 698,000
16-34 1,242,000 1,096,000 934,000 966,000 859,00035-64 2,180,000 2,214,000 2,252,000 2,395,000 2,496,00065 and over 1,948,000 1,706,000 1,511,000 1,336,000 1,355,000
Total 5,369,000 5,016,000 4,698,000 4,697,000 4,710,000
Number of household reference persons
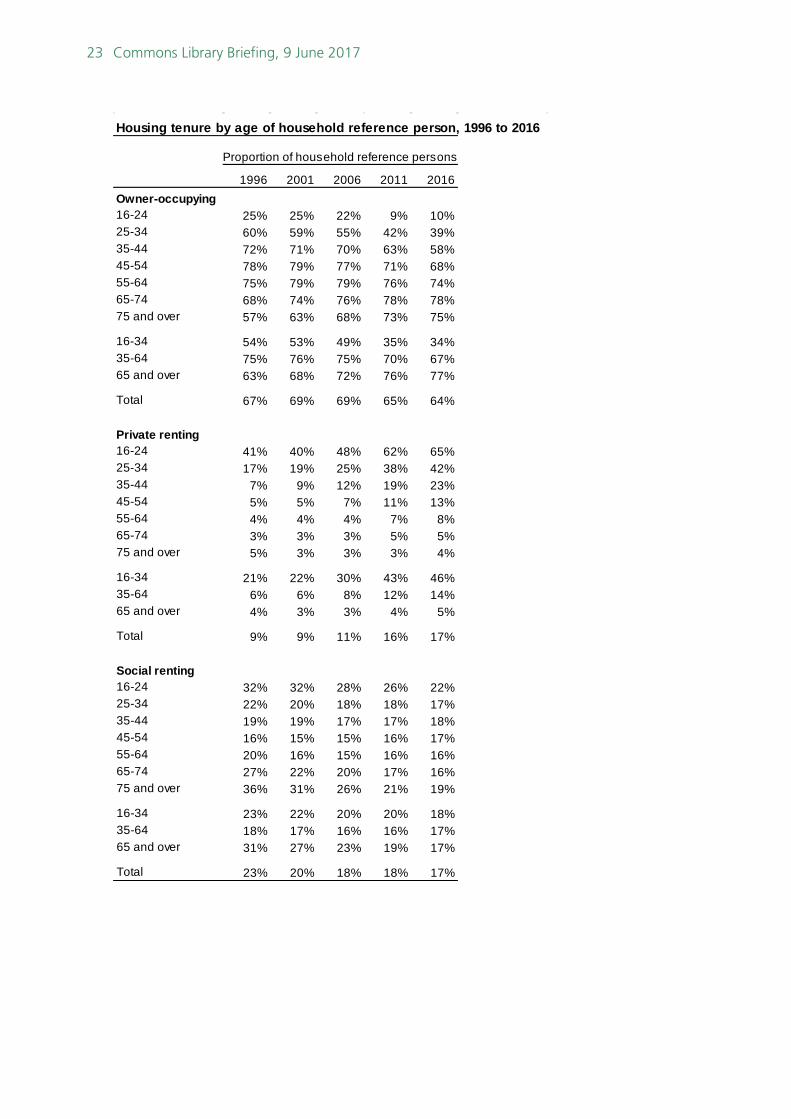
23 Commons Library Briefing, 9 June 2017
Housing tenure by age of household reference person, 1996 to 2016
1996 2001 2006 2011 2016Owner-occupying16-24 25% 25% 22% 9% 10%25-34 60% 59% 55% 42% 39%35-44 72% 71% 70% 63% 58%45-54 78% 79% 77% 71% 68%55-64 75% 79% 79% 76% 74%65-74 68% 74% 76% 78% 78%75 and over 57% 63% 68% 73% 75%
16-34 54% 53% 49% 35% 34%35-64 75% 76% 75% 70% 67%65 and over 63% 68% 72% 76% 77%
Total 67% 69% 69% 65% 64%
Private renting16-24 41% 40% 48% 62% 65%25-34 17% 19% 25% 38% 42%35-44 7% 9% 12% 19% 23%45-54 5% 5% 7% 11% 13%55-64 4% 4% 4% 7% 8%65-74 3% 3% 3% 5% 5%75 and over 5% 3% 3% 3% 4%
16-34 21% 22% 30% 43% 46%35-64 6% 6% 8% 12% 14%65 and over 4% 3% 3% 4% 5%
Total 9% 9% 11% 16% 17%
Social renting16-24 32% 32% 28% 26% 22%25-34 22% 20% 18% 18% 17%35-44 19% 19% 17% 17% 18%45-54 16% 15% 15% 16% 17%55-64 20% 16% 15% 16% 16%65-74 27% 22% 20% 17% 16%75 and over 36% 31% 26% 21% 19%
16-34 23% 22% 20% 20% 18%35-64 18% 17% 16% 16% 17%65 and over 31% 27% 23% 19% 17%
Total 23% 20% 18% 18% 17%
Proportion of household reference persons
24 Home ownership & renting: demographics
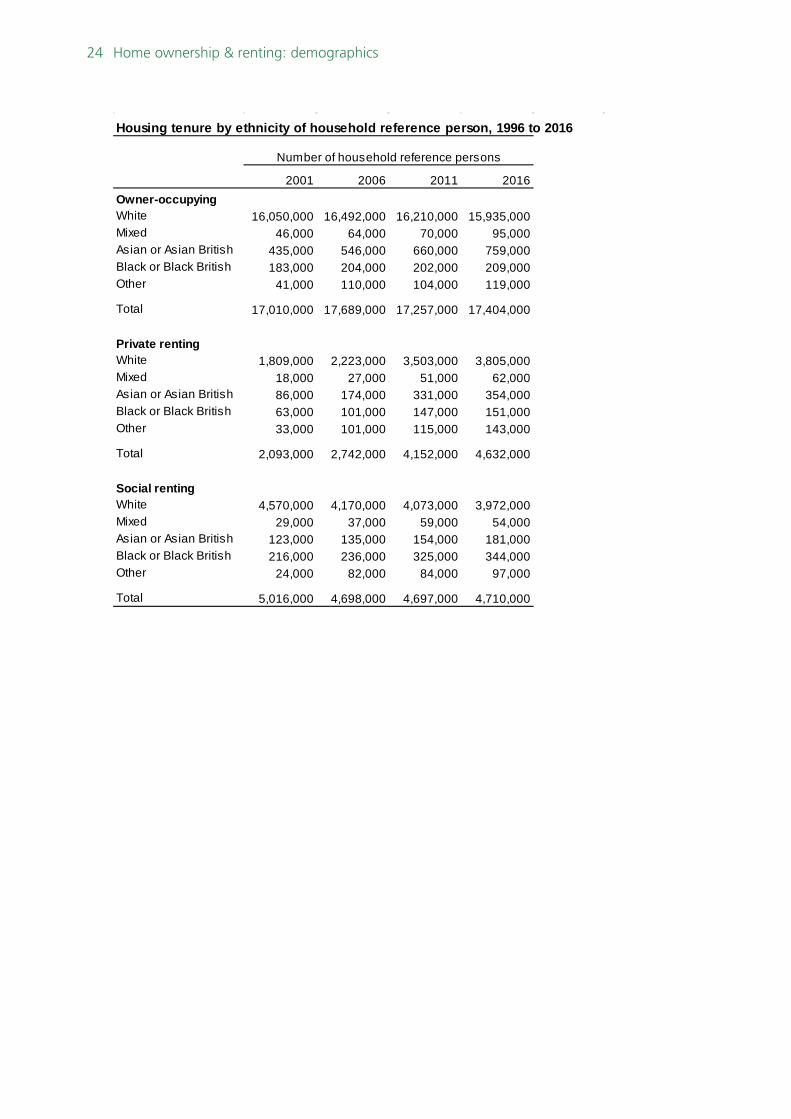
Housing tenure by ethnicity of household reference person, 1996 to 2016
2001 2006 2011 2016Owner-occupyingWhite 16,050,000 16,492,000 16,210,000 15,935,000Mixed 46,000 64,000 70,000 95,000Asian or Asian British 435,000 546,000 660,000 759,000Black or Black British 183,000 204,000 202,000 209,000Other 41,000 110,000 104,000 119,000
Total 17,010,000 17,689,000 17,257,000 17,404,000
Private rentingWhite 1,809,000 2,223,000 3,503,000 3,805,000Mixed 18,000 27,000 51,000 62,000Asian or Asian British 86,000 174,000 331,000 354,000Black or Black British 63,000 101,000 147,000 151,000Other 33,000 101,000 115,000 143,000
Total 2,093,000 2,742,000 4,152,000 4,632,000
Social rentingWhite 4,570,000 4,170,000 4,073,000 3,972,000Mixed 29,000 37,000 59,000 54,000Asian or Asian British 123,000 135,000 154,000 181,000Black or Black British 216,000 236,000 325,000 344,000Other 24,000 82,000 84,000 97,000
Total 5,016,000 4,698,000 4,697,000 4,710,000
Number of household reference persons

25 Commons Library Briefing, 9 June 2017
Housing tenure by ethnicity of household reference person, 1996 to 2016
2001 2006 2011 2016Owner-occupyingWhite 70% 71% 67% 66%Mixed 48% 49% 38% 44%Asian or Asian British 67% 63% 56% 58%Black or Black British 39% 37% 30% 29%Other 41% 36% 34% 32%
Total 71% 71% 65% 65%
Private rentingWhite 8% 10% 14% 16%Mixed 19% 21% 28% 28%Asian or Asian British 13% 20% 28% 27%Black or Black British 13% 18% 21% 21%Other 33% 33% 37% 39%
Total 9% 11% 16% 17%
Social rentingWhite 20% 18% 17% 16%Mixed 30% 28% 32% 25%Asian or Asian British 19% 16% 13% 14%Black or Black British 46% 43% 48% 48%Other 24% 27% 27% 26%
Total 21% 19% 18% 18%
Proportion of household reference persons
26 Home ownership & renting: demographics
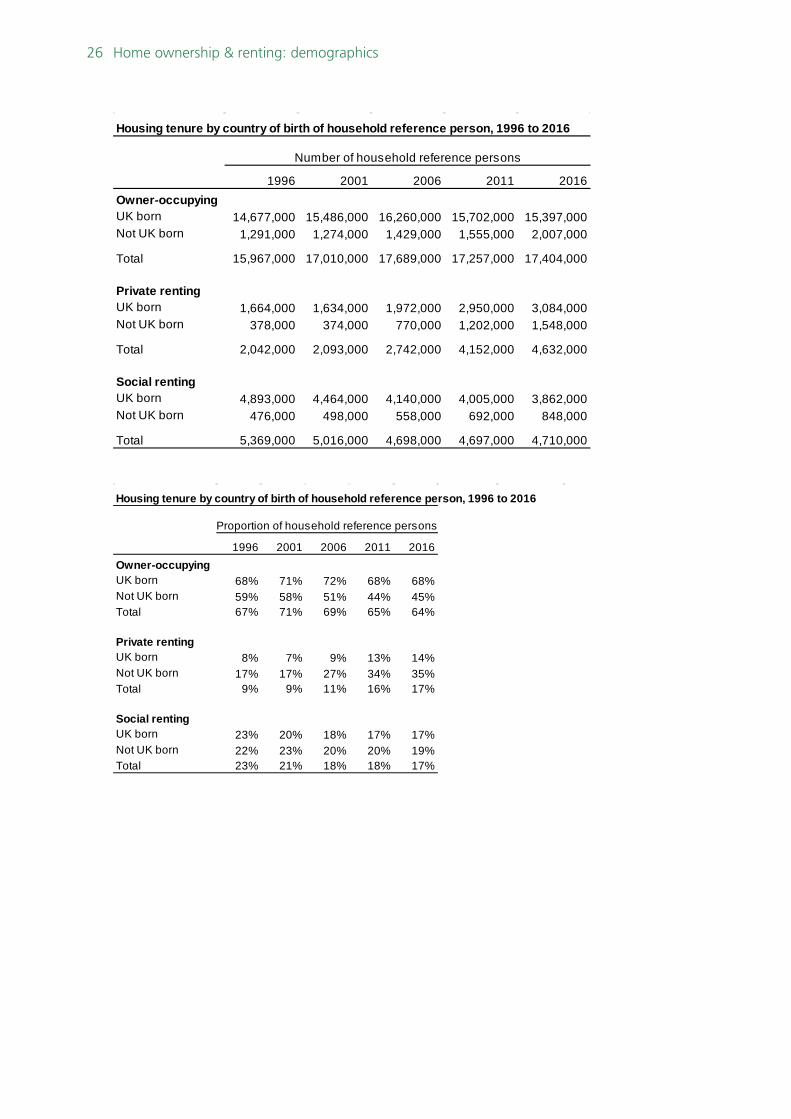
Housing tenure by country of birth of household reference person, 1996 to 2016
1996 2001 2006 2011 2016Owner-occupyingUK born 14,677,000 15,486,000 16,260,000 15,702,000 15,397,000Not UK born 1,291,000 1,274,000 1,429,000 1,555,000 2,007,000
Total 15,967,000 17,010,000 17,689,000 17,257,000 17,404,000
Private rentingUK born 1,664,000 1,634,000 1,972,000 2,950,000 3,084,000Not UK born 378,000 374,000 770,000 1,202,000 1,548,000
Total 2,042,000 2,093,000 2,742,000 4,152,000 4,632,000
Social rentingUK born 4,893,000 4,464,000 4,140,000 4,005,000 3,862,000Not UK born 476,000 498,000 558,000 692,000 848,000
Total 5,369,000 5,016,000 4,698,000 4,697,000 4,710,000
Number of household reference persons
Housing tenure by country of birth of household reference person, 1996 to 2016
1996 2001 2006 2011 2016Owner-occupyingUK born 68% 71% 72% 68% 68%Not UK born 59% 58% 51% 44% 45%Total 67% 71% 69% 65% 64%
Private rentingUK born 8% 7% 9% 13% 14%Not UK born 17% 17% 27% 34% 35%Total 9% 9% 11% 16% 17%
Social rentingUK born 23% 20% 18% 17% 17%Not UK born 22% 23% 20% 20% 19%Total 23% 21% 18% 18% 17%
Proportion of household reference persons
BRIEFING PAPER Number CBP 7706 9 June 2017
About the Library The House of Commons Library research service provides MPs and their staff with the impartial briefing and evidence base they need to do their work in scrutinising Government, proposing legislation, and supporting constituents.
As well as providing MPs with a confidential service we publish open briefing papers, which are available on the Parliament website.
Every effort is made to ensure that the information contained in these publicly available research briefings is correct at the time of publication. Readers should be aware however that briefings are not necessarily updated or otherwise amended to reflect subsequent changes.
If you have any comments on our briefings please email [email protected]. Authors are available to discuss the content of this briefing only with Members and their staff.
If you have any general questions about the work of the House of Commons you can email [email protected].
Disclaimer This information is provided to Members of Parliament in support of their parliamentary duties. It is a general briefing only and should not be relied on as a substitute for specific advice. The House of Commons or the author(s) shall not be liable for any errors or omissions, or for any loss or damage of any kind arising from its use, and may remove, vary or amend any information at any time without prior notice.
The House of Commons accepts no responsibility for any references or links to, or the content of, information maintained by third parties. This information is provided subject to the conditions of the Open Parliament Licence.