home range and spatial overlap of two high andean …. tellaeche... · capture (2011- 2013) 148...
TRANSCRIPT

Home Range and Spatial Overlap of Two High Andean Felids

Studied species
Pampas Cat
Total length : 77-91cm
Abundance: 0.74 - 0.78
ind/Km2
Andean Cat
Total length : 110 -140 cm
Abundance: 0.07 - 0.12
ind/Km2
68 cm 58 cm 45 cm 28 cm

Pampas Cat Andean Cat
Distribution
(Pereira y Aprile 2012)

Conservation status

Vulnerable
Near Threatened
The Read Book of the Endangered Mammal of Argentina
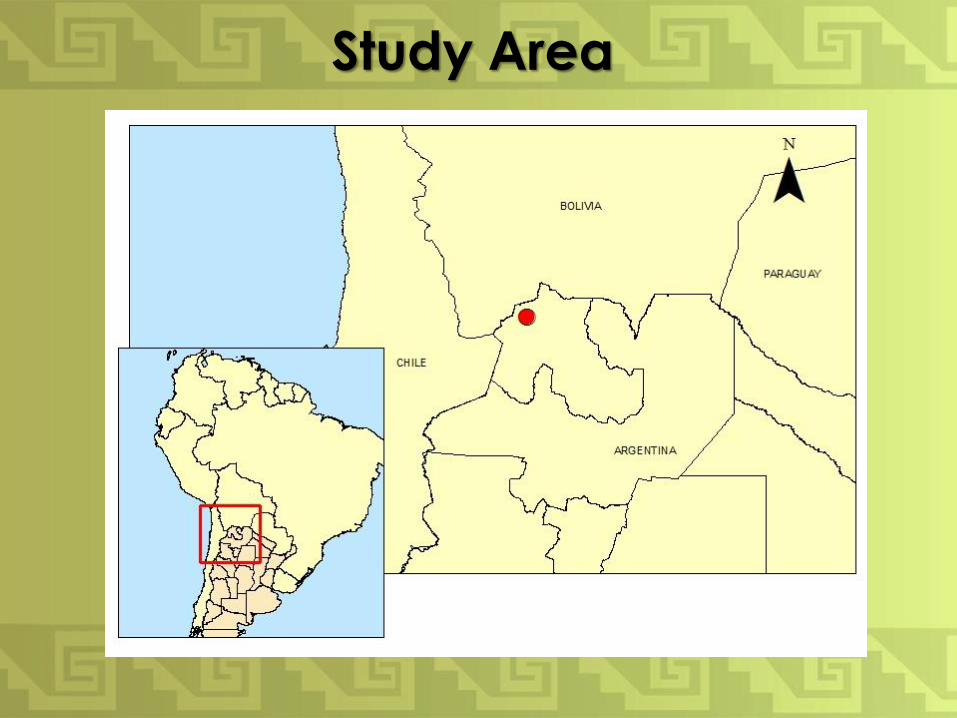
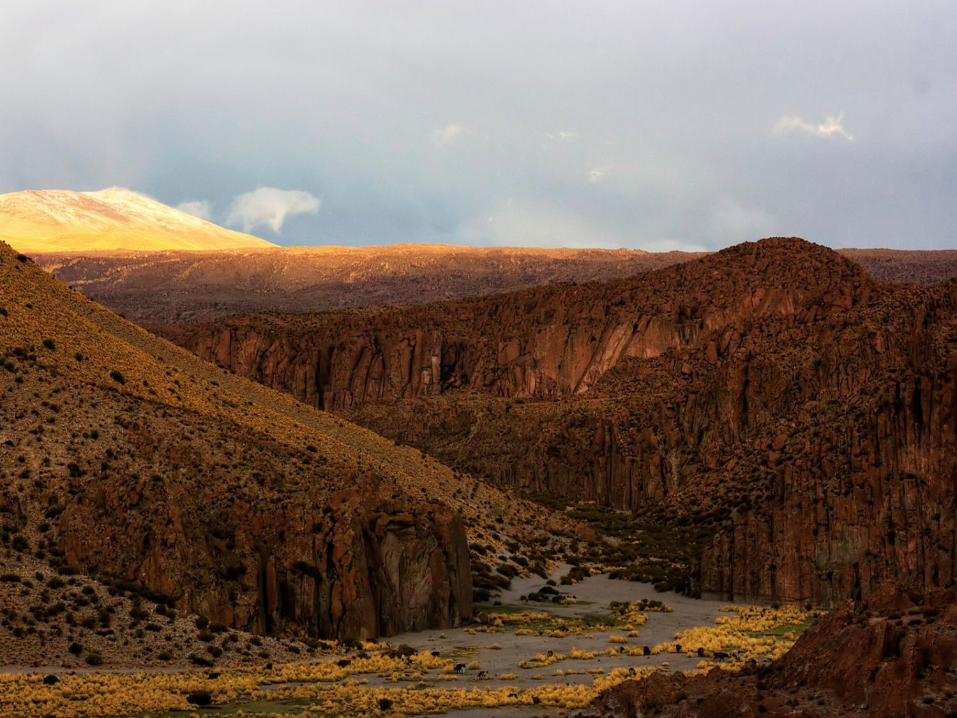
Study Area


This work is part of a bigger project
Food Habits
Habitat Use
Activity Patterns
Density Estimations
Morphology
Provide information about not well studied aspects of the
ecology of both felids, to help us to understand their
interactions.

Estimate home range (HR) and core
area (CA)
Evaluate the spacial overlap (SO) betwen both species
Goals

Radio-collars GPS-VHF
Capture campaigns (2011- 2014)
148 days (1244 trap nights)
5 Andean Cat
4 Pampas Cat
13 captures
Methodology

Radio collars GPS-VHF
• 1 data point every 7 hs. and every 5
days 1 data point every 2 hs.
• 1 data point every 5 hs. and every 7
days 1 data point every1 hour.
Date Time Latitude Longitude Satellites HDOP
30/09/2012 12:00:21 22.495366 S 066.489841 W 4 5.1
02/10/2012 20:01:34 22.486625 S 066.483875 W 3 3.0
03/10/2012 03:00:28 22.486775 S 066.484183 W 4 3.3
03/10/2012 17:01:05 22.486883 S 066.483866 W 3 6.3
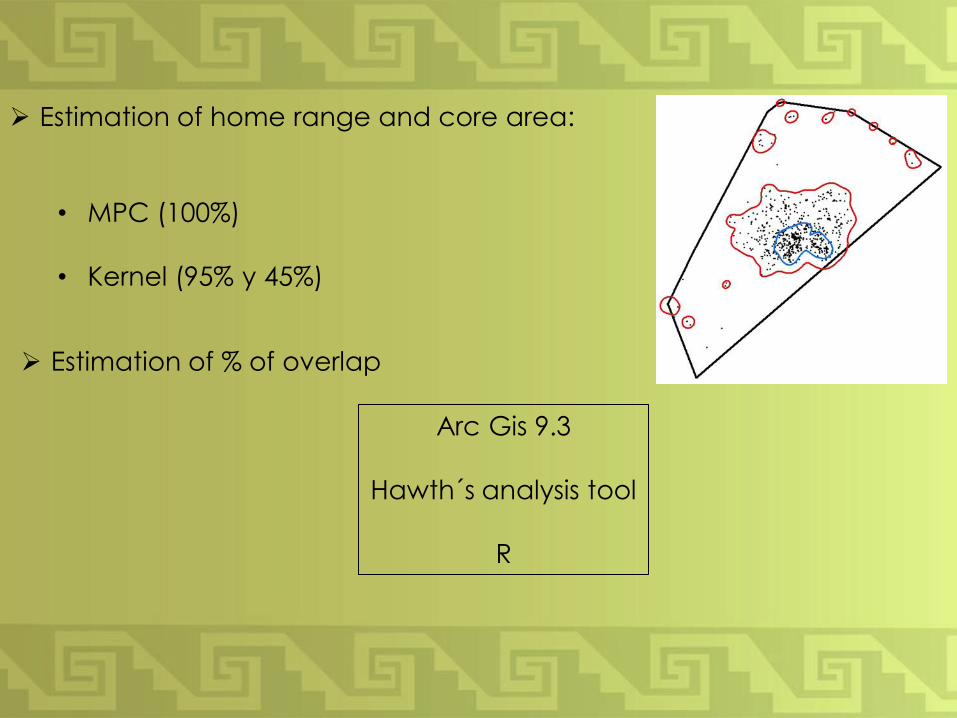
Estimation of home range and core area:
• MPC (100%)
• Kernel (95% y 45%)
Arc Gis 9.3
Hawth´s analysis tool
R
Estimation of % of overlap

Radio-collars GPS-VHF
Capture (2011- 2013) 148 days (1244 trap nights)
5 AC
4 PC
13 captures
We use data of 3 individuals of each species.
Individual Collar model Collar duration N° of positions Fix success
GP H1† Sirtack 34 41 23,3
GP H2 Sirtack 180 193 22,1
GP M1 Sirtack 211 213 19,8
GP M1 Sirtack 9 15 31,3
GA H1 Sirtack 184 109 11,6
GA H1 Sirtack ..... 0 0
GA H3 ATS 38 194 69,8
GA H2† Sirtrack 10 13 25,5
GA M2† Sirtrack 15 22 28,6
GA M2† Sirtrack 61 122 39,4
GA M1 Sirtrack ..... 0 0

Home range and core area (Km2)
HR
MPC
(100%)
HR
Kernel
(95%)
CA
Kernel
(45%)
Andean Cat
M2 63,3 59,08 21,92
H1 18,73 18,94 5,16
H3 157,63 61,19 12,40
Pampas Cat
M1 43,38 31,06 12,02
H1 8,61 7,33 1,94
H2 9,56 6,18 1,28
0 50 100 150 200
M2
F1
F3
M1
F1
F2
An
dea
n C
atP
amp
as C
at Kernel (45%)
Kernel (95%)
MPC (100%)
Results

Interspecífic overlap
Average home range overlaps:
53.9%
Average core area overlaps:
45.7%
Kernel 45%
Kernel 95%

Andean Cat intraspecific overlap
Kernel 95%
Results
Average home range overlaps:
58.1%
Average core area overlaps:
45%
Kernel 45%

Kernel 95%
Pampas Cat intraspecific overlap
Average home range overlaps:
59.6%
Average core area overlaps:
48.9%
Kernel 45%

Home range and core areas size
Interspecific
AC >PC
Previous estimations in the
same study area (camera
traps)
Similar results
AC More specialist
AC Bigger body mass
Discussion

Home range and core areas size
Interspecific
AC >PC
Previous estimations in the
same study area ( camera
traps)
Similar results
AC ♀ > size HR Juvenile Intraspecific
PC As expected, ♂ > ♀
AC More specialist
AC Bigger

Overlap
• Females have a great
superposition with
males
As expected for felids
• Between females >
reported for other species
• Great overlap in HR
between both species.
Habitat structure
and availability of
resources in the
area

• Previous
studies
(same
species)
GA: similar results
Bolivia HR bigger size
Brasil Similar results
Habitat
structure GP

• Studies about
similar species
• L. geoffroyi, Felis nigripes and
feral cats
AC y PC > size Productivity in the area.
• Felis manul
Similar results Similar habitat

Conclusions
• Andean cats have bigger HR and CA than Pampas cats
• There is a big % of overlap between both species, especially in good habitat areas.
Home Range (Kernel 95%)
Conclusions
• Andean cats have bigger HR and CA than Pampas cats
• There is a big % of overlap between both species, especially in good habitat areas.
• The structure of the habitat could influence the HR size.
• The male Pampas cat have bigger HR and CA size than females.

Sponsors

¡Thank you!


Core Area (Kernel 45%)