homeostasis and well being - mercury.smu.edu.sg · homeostasis and well being malcolm dowling and...
TRANSCRIPT

ANY OPINIONS EXPRESSED ARE THOSE OF THE AUTHOR(S) AND NOT NECESSARILY THOSE OF THE SCHOOL OF ECONOMICS & SOCIAL SCIENCES, SMU
Homeostasis and Well Being
John Malcolm Dowling, Yap Chin Fang February 2006
Paper No. 09-2006
SSSMMMUUU EEECCCOOONNNOOOMMMIIICCCSSS &&& SSSTTTAAATTTIIISSSTTTIIICCCSSS WWWOOORRRKKKIIINNNGGG PPPAAAPPPEEERRR SSSEEERRRIIIEEESSS

Homeostasis and well being
Malcolm Dowling and Yap Chin-Fang∗
JEL Classification Number – I3.
Summary: The paper suggests that maintenance of a homeostatic equilibrium provides a rationale for many actions of economic agents. Homeostatic equilibrium has physical, economic, emotional, psychological and environmental dimensions. The characteristics of this equilibrium include feelings of safety, trust, connectedness with friends, family and community, and a predictable and welcoming social and work environment. Individuals generally make decisions that help them move toward and achieve this state of equilibrium. Departure from homeostasis reduces well being and stimulates agents to take actions that will return them to a state of homeostasis. This hypothesis is tested with probit analysis using sample responses from the four waves of the World Values Surveys conducted between 1980 and 2002. Results generally support the homeostasis hypothesis. Variables that reflect departure from homeostasis such as divorce and poor health are highly significant, pointing to a reduction in well being. Variables that reflect the importance of friends, family, a trusting social and work environment have significant impacts to raise well being.
I. INTRODUCTION A growing number of economists, psychologists and other social scientists have become
interested in research on the determinants of happiness (See Ferrer-i-Carbonell and
Frijters 2004, Easterlin 2001a, Easterlin 2001b, Frank 1988, Lane 2000, Layard 2005,
Di Tella et al 2003 and Veenhoven 1994 among others). The basic approach in these
studies has been to compare self reported levels of happiness or well being from
questionnaire surveys with several explanatory variables. The initial results from this
research took many economists by surprise. It showed, for example, that well being and
income were not closely related over time. While income and happiness are positively
correlated across countries up to a middle level of per capita income, the relationship
flattens out quickly. Happiness in most industrialized countries is about the same no
∗ Dowling (corresponding author) is visiting professor of economics at Singapore Management University, 90 Stamford Road, Singapore 178903. Email:[email protected]. Yap teaching economics at Tampines Junior College, Singapore. Email: [email protected]. We would like to thank Colin Ash and Markus Karner for helpful comments.
1

matter what the level of per capita income. Furthermore, aggregate levels of happiness
and well being are not appreciably higher now than they were at the end of World War II,
even though per capita income has increased by several hundred percent. Relationships
between well being and gender, race, education, age, life style, employment status and
health have also been investigated.
While psychologists have developed some models of behavior modification and mental
reinforcement to help people achieve an elevated state of well being (Seligman 2002)
and economists have used theories of consumer behavior to give insights into the
importance of relative income in explaining variations in well being (for example
Duesenberry (1949), Friedman (1957), Veblen (1994) and Scitovsky (1976), there have
been fewer attempts to develop a more general theory of well being that incorporates
both economic and psychological factors.
In this paper we propose a behavioral theory of well being and happiness based on the
biological concepts of homeostasis and allostasis. The theory has several components.
First, individuals achieve a higher state of well being and happiness when they are in a
homeostatic equilibrium. This equilibrium state has physical, emotional, psychological
and environmental dimensions. The characteristics of this equilibrium include feelings of
safety, trust, connectedness with friends, family and community, and a predictable and
welcoming social and work environment. Individuals make decisions that help them
move toward and achieve this state of equilibrium.
Second, when individuals are displaced from this equilibrium as a result of abrupt and
strong changes (shocks) in the overall environment, well being and happiness are
affected. If the shock is positive (marriage, birth of a child, promotion, windfall
inheritance), the individual experiences an increase in well being. If the shock is negative
(death of a child, parent or spouse, falling seriously ill, demotion or getting fired), well
being is adversely affected.
2
Third, behavior adjusts to restore the individual to homeostatic equilibrium through a
combination of physical, emotional, behavioral and psychological adjustments. This
behavioral readjustment is known as allostasis.
Fourth, this process of adjustment to external shocks creates physical, emotional and
psychological stress.
To develop this theory, the concept of homeostasis as it relates to human, ecological and
physical systems is developed. We pay particular attention to the impact of external
shocks (such as unemployment, deteriorating health, divorce, emotional challenges) on
agents and how agents react to these shocks. These behavioral adjustments by agents are
then related to the concept of homeostasis and allostasis, and to research findings on the
determinants of happiness and well being.
The structure of the paper is as follows: The second section discusses the proposed
unifying framework of homeostasis and allostasis, and its usefulness in explaining the
behavior of organisms, sociological and ecological systems. The results of this review
suggest that departures from a position of homeostasis result in displacements in states of
well being and happiness. As individuals readjust to these displacements through
adjustments in emotional and cognitive states through an allostatic process, they find a
new equilibrium and balance in well being. Empirical support for the theory is developed
in section 3. In this section we initially discuss the determinants of well being and
happiness that have been reported in the literature. Within the context of this literature,
variables that impact on individuals happiness and their homeostatic equilibrium are
reorganized and classified in general terms as to whether they are a demographic control
variables (gender, age, educational level), work related variables (employment status,
work environment) or life circumstances (health, leisure, friends and family.) The results
of existing empirical studies are reviewed from this perspective and the impact on
happiness is discussed. Next we undertake a new analysis of happiness using
questionnaire results from different waves of World Value Surveys. These results are
then summarized and compared with the literature surveyed and conclusions drawn.
3
II. HOMEOSTASIS AND HAPPINESS
The objectives of this section are threefold. The first is to explain the concepts of
homeostasis and allostasis as they relate to physiological systems in animals, humans
and the general environment. The second is to derive a model of behavior that postulates
that happiness is attained when a homeostatic equilibrium is reached. In particular, a
model of dynamic behavioral and emotional adjustment is developed to explain what
happens when these states are disturbed and how agents attempt to return to a state of
homeostatic equilibrium. Finally, the section goes on to explore how the results from
happiness research summarized in the previous section fits into to a model of behavior
based on such homeostatic and allostatic responses of biological, ecological and other
systems.
To begin, we can define a few key concepts. The first is homeostasis. Homeostasis is a
term coined by Walter Cannon in 1932 (see http://en.wikipedia.org/wiki/homeostasis)
which refers to the use of term homeostasis in biology and other fields) to describe a
process observed in biological systems. It has subsequently been used to describe
ecological systems, the balance of forces in nature and other natural and human systems.
Homeostatic mechanisms are present in all levels of living systems down to the cellular
and molecular levels, including the organisms themselves and their populations. In
complex organisms, such as humans, it involves a constant monitoring and regulation of
oxygen and carbon dioxide levels, nutrients, hormones, organic and inorganic
substances. The concentrations of these substances in the body fluids remain unchanged,
within limits, despite changes in the external environment.
Homeostasis in organisms is exemplified by the operations of the endocrine system. The
hormone-synthesizing activities of the endocrine glands are regulated by events occurring
in the systems that the hormones regulate. For example, a rise in blood-glucose levels
stimulates the pancreas to secrete insulin, which acts to accelerate the removal of glucose
from the blood by conversion into storage products like glycogen and fat. The sensations
4
of hunger and thirst are also homeostatic mechanisms - they help the organism maintain
optimum levels of energy, nutrients, and water.
Homeostatic mechanisms also operate to regulate the size of populations. An example is
the relationship between the populations of predatory animals and their prey. If prey
becomes abundant, so do their predators, until predation diminishes the supply of prey
and causes a decline in the predator population. This allows the prey population to build
up again, and the cycle is repeated. In this manner, the populations of both prey and
predator oscillate around a mean.1
One important aspect of homeostasis that is particularly relevant for human behavior is
that the regulatory system is sensitive to changes in stimuli and environments rather than
to the maintained level of activity or equilibrium. When the level of activity is as
expected, the system is in homeostatic equilibrium. When there are shocks or stress on
the system, homeostatic mechanisms act to return the system to equilibrium. This process
of adjustment is referred to as allostasis. As the system responds, it is subjected to an
allostatic load. A common example in animals is the fight or flight response to danger.
In the case of everyday life, there are stressful situations experienced by people which we
can call the wear and tear of existence. We call this wear and tear allostatic load (See B.S.
Mc Ewen and T. Seeman 1999). In cases where the shocks are severe and /or prolonged,
the system experiences evolutionary changes that result in a movement to a new
equilibrium. In cases of extreme shock, the system may experience permanent or lasting
damage. Extreme shocks in the natural ecological balance can lead to the extinction of
species. In the case of people, it can result in psychological and emotional problems such
as post traumatic stress syndrome and intense anxiety. Generally, the greater the allostatic
load and the higher the level of stress, the greater is the potential for increasing mortality
and morbidity. “Social ordering in human society is …associated with gradients of
disease, with an increasing frequency of mortality and morbidity as one descends the
1 Anthropologists studying the evolution of mankind through the ages believe that for the period of more than 100,000 years prior to the development of agriculture about 10,000 years ago when hunting and gathering were the primary economic activities that mankind was in a homeostatic equilibrium with the rest of the natural environment. Population densities were quite low and human settlements were widely dispersed. (See for example the work of Paul Shepard (1996)).
5
scale of socioeconomic status that reflects both income and education.” Mc Ewen (1999,
p. 30). For example in the UK, life expectancy of boys born into professional class homes
had a life expectancy of nearly 80 years in 2000, while those born into homes of
unskilled laborers could expect to live almost a decade less. (See Office of National
Statistics Longitudinal Survey Development Team, 2004 and http://www.gad.gov.uk/life
tables)
The concepts of homeostasis and allostasis present an opportunity for economists to
integrate these ideas into a theory that explains the motivation of decision makers.
Whether they are maximizing utility or satisfaction or happiness, emotional and social
forces are interacting with genetic imperatives in the decision making process. As we
begin to understand how this process works, we may be able to build more realistic and
broader models of behavior and understand more clearly the mechanisms that drive the
search for happiness and well being.
We can look at the determinants discussed in the previous section from the point of view
of these biological mechanisms. The determinants of well being accumulated from these
surveys reported above suggest that individuals get more satisfaction from predictable
and friendly environments and are negatively impacted by unexpected and negative
changes in their environment. To explain these changes in life circumstance as
determinants of well being, we need to assume that the physical and emotional state in
equilibrium before the displacement was associated with a more satisfactory state of well
being and happiness than after the displacement. This assumption requires that we
believe that homeostasis is generally associated with well being. If we equate well being
with general genetic fitness, this seems like a reasonable assumption.
When people are in a nurturing and free environment where there is trust, stability, good
health, a satisfactory work environment, companionship with friends and family, people
are generally happy and have a strong sense of well being. This represents the attainment
of a homeostatic equilibrium at the environmental social, emotional and psychological
level.
6
As time passes people experience shocks to this equilibrium. Some of these shocks may
be positive – a better job, promotion, birth of a child, marriage, movement to a better and
more desirable living environment, greater security and trust, development of a more well
integrated social life, exercise and more robust health, enjoyment of hobbies, friends and
family, and so on. This would lead to a higher level of well being as the individual moves
to a new homeostatic equilibrium.
On the other hand, a downward displacement from a homeostatic equilibrium would lead
to a lower level of well being. Well being is adversely impacted by events that change the
status quo in a negative direction. The factors causing this displacement could include
abrupt lowering of income perhaps associated with job loss, break up of important
relationships such as divorce, death of spouse or close relative (parent/child), separation
from loved ones, illness or illness of relatives or close friends, frequent shifts in residence,
being subject to discrimination, a reduction in the safety of the living environment (civil
disorder, increase in crime, or war), increased vulnerability to disaster, a feeling of
isolation brought on by disagreements with work associates, friends or family.
How does this description of the dynamics of homeostasis applied to well being and
happiness relate to the research results surveyed above in the previous section? These
results are consistent with much of the research which are reviewed in Section 3 below.
Divorce and separation have a negative relationship on happiness (compared with
marriage) as do unemployment and poor health. Other variables, such as trust and
spiritual values are also important. In one sense, the importance of friends and family is
indirect and arises mainly from higher labor productivity and better general work
performance. However, the results from the Day Reconstruction Survey (Kahneman,
Krueger, Schkade, Schwartz and Stone (2004) provide more direct evidence for the
strong importance of these factors. Other factors such as racial discrimination, sex, age
and educational differences are not strong determinants of well being.
Therefore, the data on the determinants of happiness is generally supportive of the
homeostasis hypothesis. In addition, the idea that systems return to equilibrium by
making adjustments in their response to shocks is consistent with the results that people
7
seem to recover their level of well being after some time, even when the severe
disruptions involve disabling injuries and loss of loved ones.
There are other results of happiness research such as the results of time allocation and the
various emotional reactions that do not seem to fit nicely into the homeostatic framework
of decision making. The question of why people continue to spend on a wide variety of
consumer goods when this spending has such a limited impact on the overall well being
of society remains unanswered. One possible explanation for such behavior is that
survival mechanisms that are still in place as part of our genetic inheritance prompt us to
show off to our peer group of friends, family and work associates. Positional goods are a
good way to do this. As others catch up, the desire to acquire new positional goods is
aroused and a new spending spree begins. In terms of homeostasis and allostasis, the
accumulation of wealth would satisfy the need for individuals to feel part of, and
acceptance into a peer group community of friends and work associates.2
At a more fundamental level however, the underlying model and motivations that drive
behavior in a model of homeostatic and allostatic adjustment are different from the
maximizing calculus of microeconomic theory. Rather than decision being motivated by
purely cognitive factors, the adjustment mechanism that drives behavior in the case of
homeostasis involves a combination of cognitive and emotional imperatives. As a result,
the decision making process is richer and broader than the underlying economists’ model
and involves changes in external factors and tastes as motivation to return to equilibrium.
While tastes may change, the economist assumes they are exogenous. Once they become
endogenous, as they are in models involving homeostasis, the decision making process
becomes more complex. Tastes enter the decision making apparatus in the form of
2 Some individuals are also motivated to excel, explore and seek new and sometimes risky challenges in both work and leisure environments. They become easily bored being forced into a repetitive and humdrum low risk life. It is easy to incorporate this kind of behavior into the homeostatic model by recognizing that the behavior of risk taking people is regulated by a somewhat different adjustment mechanism. Risk lovers will also make adjustments to behavior to bring themselves to a higher equilibrium level of risk and excitement. Nevertheless the adjustment process need not be qualitatively different from the behavior of the risk averse who avoids danger and risky situations. The risk taker will also return to his homeostatic equilibrium through an allostatic adjustment process. While the allostatic load may be different the process itself remains the same.
8

adjustments to behavior which are required to achieve an enhanced state of well being
and involve physical, emotional and cognitive factors which could also be responses to
external shocks and different environmental and physical stresses.
Within the context of behavioral adjustments and pursuit of well being, there are a
number of examples of how people adjust behavior to maintain homeostasis. Research in
neuroeconomics3 suggests that the very presence of ambiguity alone tends to activate the
limbic system which is associated with emotional decision making (rather than logical
reasoning). This implies that the emotions become more actively involved in decision
making when individuals are in a new situation, in unfamiliar surroundings or with
unfamiliar people. Because of this, individuals are often reluctant to face new challenges,
or experience stress when doing so and are anxious to return to their own comfort zone or
familiar equilibrium niche. Furthermore, neuroscience also suggests that agents are
comfortable in groups where there is trust and stability (See Camerer et al 2005).
Neuroscience has also shown that the tendency to discriminate, for example racial
discrimination against minorities, which is often subliminal, dissipates when knowledge
and familiarity are increased. This suggests that there is less tension and discord in
familiar surroundings (See Healy 2004, Mc Evily et al 2003, and Camerer et al 2005).
Another reflection of the desire to return to equilibrium is evident from behavior of
bettors at horse races who generally play long shots as the day progresses. Kahneman and
Tversky (1979) argue that this kind of behavior supports the hypothesis that a failure to
adapt to losses or to attain an expected gain induces risk seeking. We can also interpret
this kind of risk seeking behavior as a desire to return to an equilibrium level of wealth.
This motivation is particularly strong when losses are involved. After a gain, gamblers
may also take greater risks. This behavior, sometimes called the house money effect,
suggests that agents are more willing to gamble away gains just so long as they maintain
their equilibrium initial endowment. This initial endowment is the homeostatic
equilibrium or set point.
3 See Camerer, Loewenstein and Prelec (2005) for a review of this new field.
9
The desire to get back to an equilibrium level or set point is also reflected in experiments
by Kahneman, Knetsch and Thaler (1991) who argue that losses and gains are calculated
in terms of departure from a reference point. In a series of experiments dealing with
different initial positions they observed that in departures from a reference point
experimental subjects were more sensitive to losing than winning, i.e. the emotional
impact of a loss is significantly greater than that of a gain.
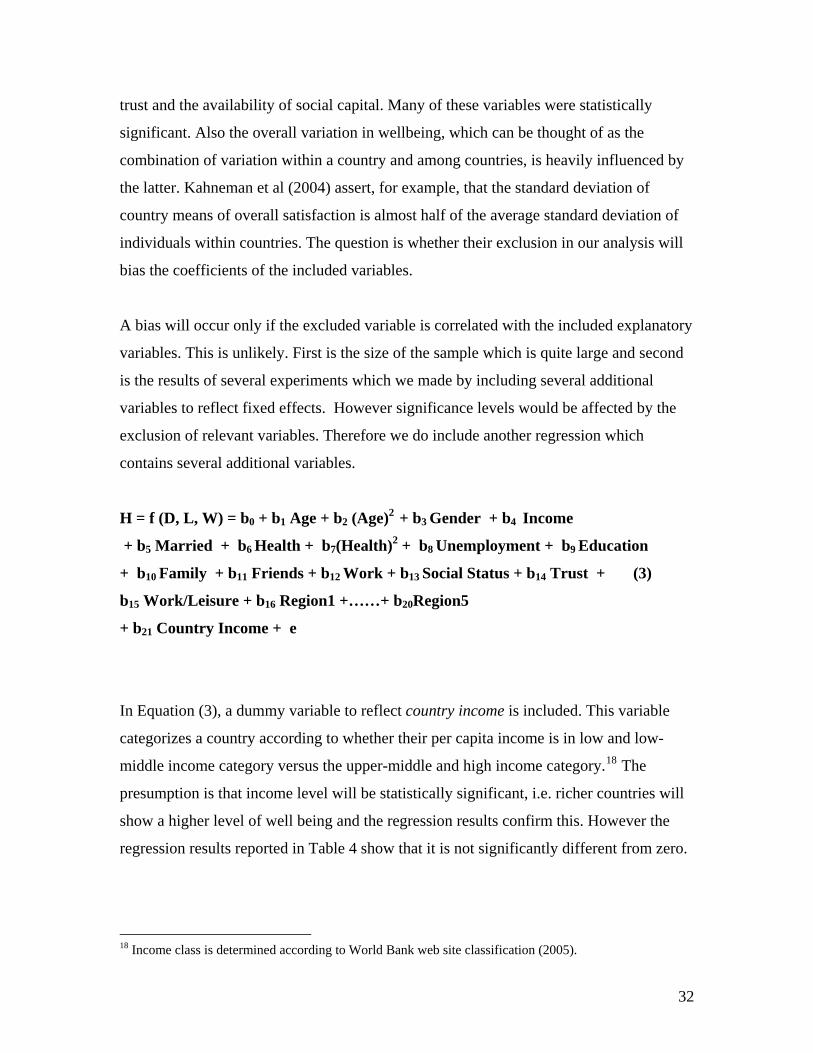
Business firms also operate to bring about a return to an equilibrium set point. Firms take
more risks when they stray from the set point. This analysis results in a U shaped risk –
return relationship with an inflection point (minimum) occurring around the target rate of
return (see Figure 2). Fiegenbaum and Thomas’ 1988 study of US firms confirms this
relationship between risk and return. To the far left of the inflection point, firms will
engage in more risky behavior in order to get back to a target rate of return and they will
also take on more risk once they have gone substantially above the target rate to the right
of the inflection point.
[Insert Figure 1 here]
Another aspect of the relationship between risks and the homeostatic equilibrium relates
to behavior that has been dubbed risk homeostasis. This behavior implies that there is an
optimum or equilibrium level of risk that people are generally comfortable with. If this is
true, then efforts to decrease risk may be met by riskier behavior. Consider the case of
farm tractors and road design. When tractors were designed for greater stability, farmers
used them on steeper slopes and the accident rate remained constant. When highways
were designed to be safer, drivers increased their speed and took more risks and the
accident rate remained at previous levels (See Slovic 1984 for details). Ample evidence
also illustrates that when individuals are placed in dangerous situations where there is
risk of injury or death, they experience a higher level of stress (Spitzer et al 1995) which
10
implies that they have the urge and motivation to take action to return to their equilibrium
level of stress which is consistent with their desired comfort zone. .
The nature of individual’s disposition also affects the rate of return to the equilibrium set
point. For example, research suggests that optimistic patients live longer than pessimistic
patients (Palmore 1969a, 1969b). Happy people recover faster and some diseases can be
cured or treated more effectively when the patient has a happy and upbeat attitude
(Diener and Seligman 2004). As a corollary to this, a pleasant mood seems to lower
blood pressure and that a high level of stress reduces the ability of the immune system to
fight of disease. Furthermore, depression and anxiety, two major forms of mental illness,
lead to significant declines in well-being (Spitzer et al 1995, and Packer et al 1997). On
the other hand, there is evidence that happy people show low signs of mental illness
(Diener and Seligman 2002). In addition, duration of unemployment and well being are
negatively related, and absenteeism and turnover rates are lower when workers are
happier (Clegg 1983, Clark 2001 and Akerlof et al 1988).
There is also ample evidence that agents who experience negative shocks that reduces
well being make persistent attempts to return to the homeostatic equilibrium and to
increase their levels of well being and happiness. Those who are unemployed look for
work.4 Those who are sick go to the doctor. 5 Those who are divorced begin to date and
often remarry6. Those who move to a new city or neighborhood make efforts to make
new friends.
While the desire to return to a set point or homeostatic equilibrium may not always be
synonymous with an increase in happiness and well being, the various behaviors just
described do suggest that the motivation to return to such an equilibrium set point is
4 In the United States while some people may become discouraged and drop out of the labor force, there is great persistence in trying to find work. The numbers of unemployed looking for work after 26 weeks in the US is still about 60 percent of the number of workers unemployed for five weeks or less looking for work. 5 Over 15% of GDP is spent on health care in the United States (see Heffler et al (2005) 6 In the United States over 95% of all adults are married or have been married. 75% of all divorced people remarry, half within three years.(see http:www.census.gov/prod/2002pubs)
11
strong and highly desirable in a wide variety of circumstances. As such, this behavioral
pattern generally reflects a desire to return to or move toward the familiar, predictable
and comfortable, and away from undue stress and aggravation. To the extent that these
states of equipoise and relaxation are preferred, we can infer that they are also positively
associated with higher levels of well being and happiness. When life circumstances such
as stress, death of relatives/close friends and other negative social developments disrupt
this equilibrium, well being is also compromised.
Other researchers have pinpointed the importance of such a homeostatic set point in
determining the level of well being. For example, Cummins and Nistico (2000) suggest
that life satisfaction responses from questionnaires, on average, are not free to vary over
the full range of possible outcome (say from being very unhappy to very happy). Instead,
the distribution of responses is confined to a narrow range in the happy to very happy
neighborhood. Cummins and Nistico (2000) argue that this is because of the operation of
such a homeostatic mechanism. They suggest that high self esteem control, optimism
about life’s circumstances and the understanding that we are in control of our own
destiny help to constrain responses to a narrow range. This optimistic approach to life in
general serves as a psychological buffer against misfortune, if and when it arises.
Furthermore, this narrow range of variation in average subjective well being is
reinforced by observations that people’s feeling of well being respond quickly following
misfortune. Even those who have suffered serious accidents involving paralysis return to
a fairly optimistic view of life after some time. Such a view of behavior stresses the
powerful psychological forces that lead to a return to a set point or homeostatic
equilibrium.
Psychologists refer to this belief pattern as positive cognition bias. This bias leads to a
variety of observed behaviors that buffer the psyche. These include people’s need to
preserve their self esteem by downplaying the ability of others; to control essentially
random outcomes (like roll of dice) by mental concentration or to predict many more
positive than negative outcomes when asked to think about the future.
12
We should, however, not interpret the strong desire to return to a set point as a reason to
forsake explanations for variations in observed well being. Despite the relatively small
variation in responses (vis a vis the full range of possibilities), models which try to
describe the causes of well being are only successful in accounting for a small proportion
of the variation. In large cross-sections such the world value surveys or US General
Social Surveys, less than 10 percent of the variation in individual response is explained.
Furthermore, where panel data are available, analysis suggests that happiness over time
varies directly and significantly with several dimensions of people lives including family
life, health, work and social environment (Easterlin 2001a).
None of this work contradicts the results of happiness analysis which is reviewed in
conducted in the next section or the interpretation of these results within a framework of
homeostasis. Rather it reinforces the findings from a slightly different perspective by
introducing dynamics of behavior more explicitly through the use of panel data. Easterlin
argues, for example, that satisfaction with work and family results in a slight increase in
happiness until middle age and that beyond midlife happiness decreases slowly as health
deteriorates.7. These changes are quite small relative to the size of the happiness
coefficient for different age cohorts. His analysis also reinforces the conclusion that
family life, financial situation, work and health are all important determinants of well
being. With the exception of health, the order of importance also corresponds closely to
the conclusions drawn in this paper which is more concerned with displacement from
equilibrium and not the general pattern of well being over time. There are also
interaction effects that must be taken into account. Unemployment, divorce and health
effects in combination have a negative impact on all four of Easterlin’s explanatory
variables.
7 The impact of age on well being is not very strong in any of the probit results presented in section 3.
13
III. DETERMINANTS OF HAPPINESS AND WELL BEING – RESULTS
FROM THE LITERATURE
Much of what goes on in our lives reflects two opposing, yet complementary sets of
motivating factors. On one hand, we are drawn to security, safety, predictability and the
comfort of a loving home and work environment. On the other hand, we are drawn by
our curiosity to adventure and risky behavior as an antidote to the boredom which results
when life becomes routine and humdrum. We could still be swinging from the branches
of trees in Africa if we hadn't developed curiosity and overcome our fear of moving
outside our comfort zone. Yet cooperation and a sense of community are key ingredients
in the evolution of modern society, beginning with settled agriculture and the formation
of stable farming settlements and moving eventually to more complex industrialized
societies.
Most of the literature on happiness and well being focuses on the variables that impact
subjective or hedonic well being8. We confine our analysis to variables that have been
identified in self reporting questionnaire responses. Generally, evidence from surveys
suggests that well being is dependent upon three sets of variables. The first are those
variables dealing with work and the workplace, such as job and employment status, and
whether the work environment is friendly or hostile, challenging or humdrum. We define
this vector of variables as W. Variables dealing with leisure and life circumstances, such
as relationships with family and friends, marital and health status as well as the political
and social environment also has an impact on well being. We define this vector of
variables as L. Finally, there is a set of demographic variables which includes gender, 8 Psychologists have developed some ways to define and measure happiness or well being (see Seligman 2002). They suggest that there are two kinds of well being. The first is subjective well being, sometimes called hedonic well being. Hedonic or subjective well-being focuses on positive affects such as satisfaction with work and life in general, and the frequency of pleasant or unpleasant emotions in the context of self-reporting. Another way to gauge happiness and well being is by measuring an individual's ability to take control of situations, assume a leadership role or achieve some status in the world. Called psychological or eudemonic well being, it is related to personal growth, purpose in life, positive relations, dealing with challenges, working with others and self-acceptance.
14

race, education and age that also has a potential impact on happiness which is not likely
to change (with exception of education). We define this vector of variables as D.
Therefore, happiness or well being, defined as H, is determined by these three sets of
independent variables.
Combining we have the fundamental happiness equation, we have
H = f (D, L, W) (1)
Self reporting measures of happiness are a concrete way of reflecting an individual’s
feeling of well being and of determining how these three factors rank as determinants of
happiness. Much of the literature on happiness focuses on subjective well being as
reflected by these self-reported responses to survey questions.9,10
The results of these researches can be summarized briefly. For each variable or set of
variables we designate whether they fit into the D, L or W categories.
1. Demographics variables such as age, marital status, education and gender and
considered in (D)
Demographic variables capture the fixed effects of variations in individual
characteristics but not individual traits. If we could relate changes in happiness to
9 There are fewer studies concerned with measuring psychological well being and/or devoted to carefully distinguishing between psychological and subjective well being. Triandis (2000) suggests an interesting dichotomy between individual attributes and circumstances (personality characteristics, stress, health, education, employment and marital status) and cultural forces (income per capita, political freedom, civil conflict, physical vulnerabilities, trust, and corruption) and their impact on well-being. 10 There are a number of surveys that have been conducted throughout the world over the past few decades and, more intensively, in industrial countries. These include the Euro-Barometer Surveys conducted in several European countries by the European Commission and the World Value Surveys conducted in many countries around the world (view at http:// www.europeanvalues.nl/ and http://www.worldvaluessurvey.org/). A more recent wave of World Value Surveys is available on CDRom. In addition there are individual country surveys that have been used by researchers. Some examples are Di Tella et al (2003) for the US, John Helliwell (2005) for Canada, Clark and Oswald (1994) for the UK, and Frey and Stutzer (2002b) for Switzerland.
15
changes in the explanatory variables through the use of time series or panel data we
could hope to eliminate individual traits. However most of the studies have not done so
(See Ferrer-i-Carbonell and Frijters 2004).
These individual traits are captured by differences in genetic make up. Much of our
emotional and cognitive makeup is determined by the hardwiring of our brains and
bodies as a result of our genetic inheritance. Studies of identical twins show that their
happiness levels are very similar even if they were raised in separate environments
(Layard 2005 and Lykken 2000). Twins, for example, might have the same reported well
being if one was raised in a country with a higher per capita income and the other in a
country with a low per capita income. Psychologists estimate that about half of our
happiness is determined by genetic factors that are determined by our genetic makeup
and our predisposition to be happy or sad in a particular social setting. The remainder is
determined by the environment we are raised in.
The impact of Age on happiness is interesting in its own right, either as a proxy for
variations in age cohort effects on happiness or of deterioration in health or other
unobserved social factors. The World Values Study Group (1994) found a small positive
effect reflecting either that the happy live longer (Argyle 1999) or that they feel more in
control of their environment (Ryff 1995) or have come to grips with life and have fewer
expectations (Campbell et al 1976). Other results show a U shaped pattern of well-being
is observed over the life cycle, with a low point in the mid forties to early fifties age
groups for both men and women (Helliwell 2005, Frey and Stutzer 2002a, 2002b, and
Blanchflower and Oswald 2004a), perhaps reflecting what is commonly referred to as
mid life crisis. However, Alesina et al (2001) and Easterlin (2001a) found happiness
increases with age up until between 40 and 45, after which happiness begins to decrease.
The explanation given by Easterlin for differences between his result and the U shaped
pattern reported by Helliwell, Blanchflower and Oswald and others is that these other
studies included life cycle variables such as work marital and economic status. In any
event, the impact of age on well being, while statistically significant, is never large.
16
Like age, gender plays a very small role in determining levels of well being.
Other things equal, men are marginally less happy than women, (Helliwell 2005, Di
Tella et al 2003, and Blanchflower and Oswald 2004a) although, as Helliwell (2005)
points out, the attempted suicide rate for women is higher.
Marriage has a significant positive impact on well being. People who are married or
living with partners are happier than those who are single, divorced, separated or
widowed. Further, the impact of marital status seems to be independent of the argument
that happy people are able to stay married longer (Helliwell 2005, Di Tella et al 2003,
Argyle 1999, Veenhoven et al 1994, and Gerlach and Stephan 1996).
Minorities are generally less happy probably because of discrimination both at work and
by society in general (Blanchflower and Oswald 2004a, Easterlin 2001a and Helliwell
2005).
2. Variables dealing with work and the workplace, such as income, jobs and
employment status are considered in W.
Relative income has a small positive impact on well being, particularly in high per capita
income countries. Studies by Blanchflower and Oswald (2004a) Frank (1989), Lane
(2000), Helliwell (2005), Easterlin (2001a), Di Tella et al (2003) and Layard (2005) reach
this conclusion. For individuals living in a high per capita income country, being above
the median relative income has a small impact on well being. Di Tella (2003) found
small but significant impact on well being for the three highest quartiles of the income
distribution. Also, Blanchflower and Oswald (2004a) conclude that people look upward
rather than downward when making relative income comparisons. However, since
movements within the income distribution tend to cancel each other, the impact of
changes in relative income doesn’t affect the aggregate level of happiness.
This accounts for the fact that the level of income or the absolute levels of income per
capita has virtually no impact on well being above a minimum level of per capita income.
17

This result holds for a wide spectrum of countries (see Table 1, Lane and Honohan
(2000), Frey and Stutzer (2002a and 2002b), Diener and Seligman (2004) and
Blanchflower and Oswald (2004a).11 Even when people unexpectedly acquire large sums
of money from winning the lottery or inheritance, there are minimal long term effects on
happiness (Argyle, 1999). This is probably because people quickly adapt to their new
levels of wealth.
[Insert Figure 2 here]
Unemployment has a strong negative impact on well being (Layard 2005, Oswald 1997,
and Clark and Oswald 1994, Di Tella et al 2003). Clark and Oswald suggest that job loss
had a greater depressing effect on well-being than any other single characteristic,
including other important negative impacts such as divorce and separation. Similar
results are observed in Germany, Australia and the United States, and reviewed in more
detail by Frey and Stutzer (2000). One of the reasons why the impact of unemployment
is so strong is that in addition to the economic effect of losing a job, there are additional
psychological and social impacts. The psychological costs are loss of self-esteem and
self worth, which can lead to depression and hopelessness, particularly if the duration of
unemployment is prolonged. The social costs relate to the fact that work often defines
social position and status -- loss of work has a strong negative impact on social status.
Furthermore, an increase in unemployment can cause distress and anxiety among those
employed who starts to fear for their jobs. It also has a negative impact on the family
members of those who have become unemployed. Unemployment is a heavier burden in
societies where being employed is an important social norm. In addition, there is some
evidence that an increase in the general level of unemployment makes the rest of society
feel worse! (Di Tella, MacCulloch and Oswald 2003, and Helliwell 2003) Helliwell
11 However, Di Tella et al (2003) found that the level of GDP and the rate of change of GDP do have a significant effect on well being at the aggregate level across a dozen European nations from 1975 to 1992. This could be because the level of income is related to other variables that indirectly affect well being.
18

finds that unemployment has a greater negative impact on well being in high per capita
nations than in low per capita countries. This could be because the psychological impact
of loss of self-esteem is greater where there is greater emphasis on material success. This
reaction is also consistent with findings that unemployment has a larger deleterious
effect on men than women. Men identify more with their jobs as a status symbol than
women who have children and the family as additional sources of emotional support
which are not always available to men.
Satisfying and stable work environments are key ingredients to a high level of self
esteem, self worth, well being and happiness. Furthermore, happy workers are more
productive workers. There is a considerable amount of research that suggest job
satisfaction and positive attitudes both contributed to raising worker productivity.
Experiencing more positive emotions at work is also associated with higher levels of
organizational citizenship, as well, as better performance. There is also lower turnover,
less absenteeism, more punctual attendance and cooperation when employees are happier
(Spector 1997, Miner 2001, and Diener and Seligman 2004). This evidence suggests that
not only are happy workers more productive, happy workers also contribute to raising
productivity for other workers. Having happy employees also result in higher levels of
consumer satisfaction since customers like being served by happy employees. Because
of these favorable consumer attitudes, firms got repeat business which resulted in greater
sales turnover and higher profits. It is well known that paying workers a higher salary
than the norms in the industry – the so-called efficiency wage argument – can be a
contributing factor in raising productivity (Campbell 1993). It is also possible that
efficiency wages may also increase workers’ feelings of well being by making them feel
more appreciated and thus more valuable to the firm.
3. Personal interactions, health, economic and social stability and the social
environment are important textural influences on happiness. These variables are
considered in L.
19
Social organization and freedom of expression impact on well being. Helliwell (2003 and
2005) concluded that people with the highest feeling of well being are those who live in
societies where social and political institutions are effective, have a high degree of mutual
trust and a low level of corruption. Other studies (Inglehart and Klingemann 2000,
Veenhoven 1994 and 2001, and Layard 2005) found that economic freedom was
positively related to happiness, particularly in poorer countries. Diener, Diener and
Diener (1995) suggested that human rights and individual freedom are also correlated
with well being. Frey and Stutzer (2002b) explored the relationship between democracy
and indices of subjective well being in Switzerland. They found a highly significant
relationship between life satisfaction and democracy using data from Swiss cantons.
Furthermore, they found that a stronger democratic environment raised the well being
coefficients across the board for a wide range of individuals in the entire society, not just
a select few. Repressive regimes reduced the sense of well being (Frey and Stutzer 2000,
and Veenhoven 2001). On the other hand, stability in a society is also an important
component in establishing a feeling of well being. Low happiness scores were reported in
the Soviet Union in the unstable years following liberation from Soviet oppression
(Inglehard and Klingemann 2000, Veenhoven 2001 and Layard 2005). These low levels
are evident from a quick look at Figure 2. The lowest happiness scores were recorded in
countries that used to be part of the Soviet Union.
It is possible that widespread well being is necessary for democracy to prosper as
suggested by Inglehart (1990), although high levels of well being could legitimize
democracy and promote its survival as suggested by Doyle (2002). But democracy is not
a necessary condition for happiness. For example, as reflected in Figure 2, well being in
China (a communist state) is higher than in India (a parliamentary state). This implies a
reverse causality between happiness and the establishment of democratic institutions
which tend to bias estimates in models where happiness is posited as a function of the
institutional setting.
Another factor to consider in judging the importance of the institutional setting is how the
organizational norms of society and the degree of tolerance to departures from these
20
norms impacts on well being. For example, Arrindell et al (1997) and Triandis (1994 and
1995) argue that in tight societies with rigid enforcement of rules, e.g. Japan (Iwao 1993),
people are more prone to experiencing high levels of anxiety. They fear that they will be
sanctioned or even ostracized if they fail to adhere to proper behavioral norms.
Recent work comparing the Americans with Europeans suggests that the social context
and government policy have important impacts on well being, particularly to those in the
lower levels of the income distribution. For example, Alesina et al (2001) found that
when income in Europe is more unequally distributed, the level of happiness is reduced.
This suggests that just observing greater income inequality makes Europeans unhappy.
However in the United States the distribution of income doesn’t generally have a
significant effect on happiness. They suggest two possible explanations – Europeans
prefer more equal societies, and that social mobility is higher in the United States.
Alesina et al (2001) found evidence in the US that only the rich liberals were unhappy
about the level of income inequality, whereas in Europe, both the poor and rich liberals
alike were unhappy about the level of inequality. The results suggest that there is greater
popular demand for governments to fight inequality in Europe than in the United States.
This could explain why the “dole” is generally less popular as a method for redistributing
income in the United States than it is in Europe.
Life disruptions have a strong negative and very strong impact on happiness and well
being. As noted previously, divorce reduces well being. Social mobility as reflected by
the number of moves also has a significant negative impact on well being. Making more
moves tend to reduce trust, while fewer moves tend to increase trust and social cohesion
in neighborhoods. Magdol (2002) conclude that frequent moves have a detrimental
impact on families, particularly in wives. Long distance mobility discourages individuals
in forming long-lasting community ties and has a negative impact on well being. Illness,
mental anguish and death in families also have a very strong negative impact on well
being (Di Tella et al 2003, Layard 2005, and Diener and Seligman 2004). Disruption in
the form of vulnerabilities to floods, hurricanes, earthquakes, tornadoes and other natural
disasters, also results in lower levels of well being (Veenhoven 1994).
21

Poor health and illness diminishes well being quite dramatically as shown in several
studies (World Values Study Group 1994, Packer, Husted, Cohen and Tomlinson 1997,
Diener and Seligman 2004, and Gerlach and Stephan 1996). Depression and other
psychiatric illness together make up about 30 percent of the various causes of disability.
This is a much higher rate than disability from alcohol and drug addiction (together
10%), respiratory illness, cancer and heart trouble (together 15%) (Layard 2005, Chapter
11). There is also evidence that happy people show fewer signs of mental illness (Diener
and Seligman 2004).
Rewarding social interactions are key components of well being (Baumeister and Leary
1995). This entails frequent and pleasant interactions with a few people within the
context of a stable, trusting and mutual caring environment (Zak and Knack 2001).
Ongoing relationships, within a framework of mutual concern, provide a stronger and
more substantive bond and feeling of belonging than one based on self interest alone
(Clark 1984, and Clark and Mills 1979). Furthermore, superficial social contacts can not
substitute for deeper and more intimate relationships (Weiss 1973, 1979 and Baumeister
and Leary 1995). Positive social bonds are associated with positive emotions and higher
levels of well being (see Sternberg 1986 and McAdams 1985). Conversely, the loss of
friends leads to loneliness and depression (Leary 1990) as well as anxiety (Baumeister
and Tice 1990). Other research shows that intimate relationships and close social and
family ties are highly valued by respondents and, in the case of sexual intimacy, results in
a significantly high increase in well being. (Kahneman et al 2004, Diener and Seligman
2002, and Blanchflower and Oswald 2004b)
Two specific events that have a strong impact on a person’s need to belong are divorce
and death. Even though marriages that end up in divorce court may not have been joyful,
divorce nevertheless results in negative feelings and reduced well being (Weiss 1979,
Price and Mc Kenry 1988). The death of a spouse, child or close friend rank high on the
list of stressful and difficult events and can result in a period of depression (Holmes and
Rahe 1967 and Weiss 1979).
22
4. Summary
The results of happiness research suggest that people are happier in environments that
are fair, trusting and predictable and where social and work relationships are satisfying
and rewarding. People are adversely affected by negative disruptions such as illness,
unemployment and divorce yet they recover more rapidly than they expect from these
disruptions. People value their freedom and are adversely affected by rigid constraints
and governmental controls. People value friends, family and social relationships more
than work and yet they spend more time involved in activities they don’t like including
work and commuting. Extra income increases happiness less and less as people get
richer. Motivation for maintaining the status quo (being comfortable) is consistent with
homeostasis and is reinforced by our social nature and search for trust.
To look at the relative importance of these various factors, consider the Layard (2005)
summary of the results from Helliwell’s study (2003) of over 90,000 people from the
World Value Survey.12 These results are reported in Table 1.
12 Di Tella et al (2003) find a similar set of factors and degrees of importance in determining the level of well being.
23
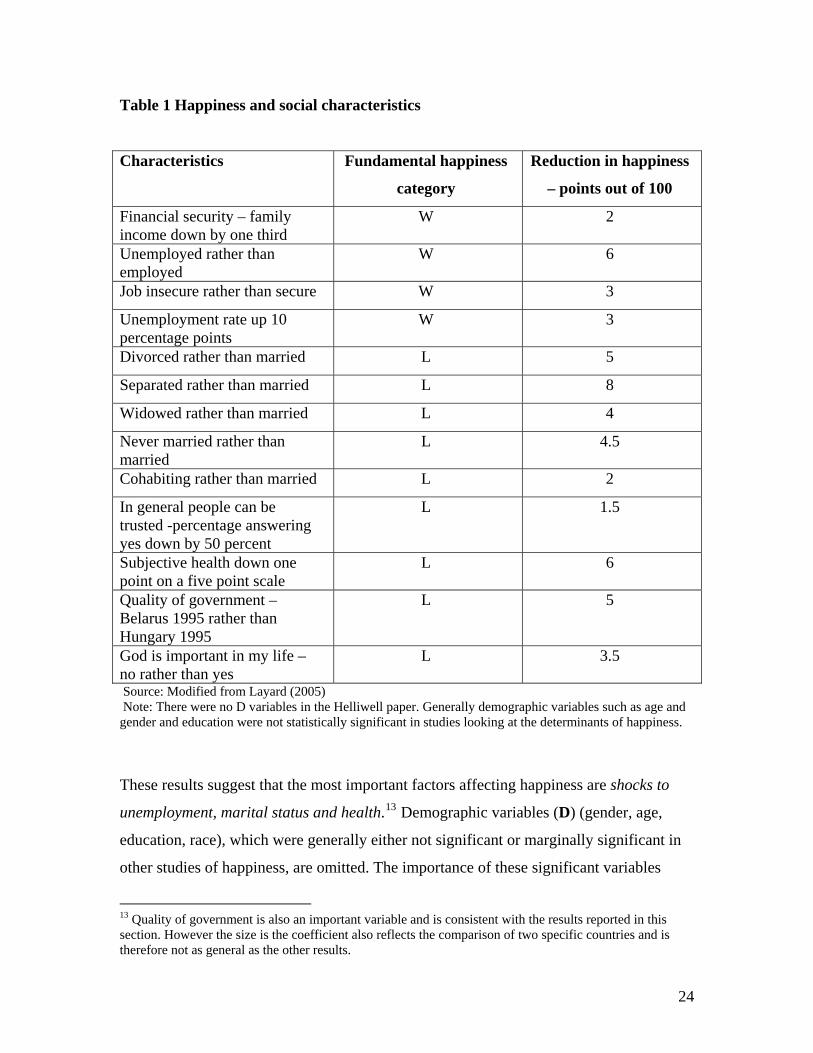
Table 1 Happiness and social characteristics
Characteristics Fundamental happiness
category
Reduction in happiness
– points out of 100
Financial security – family income down by one third
W 2
Unemployed rather than employed
W 6
Job insecure rather than secure W 3
Unemployment rate up 10 percentage points
W 3
Divorced rather than married L 5
Separated rather than married L 8
Widowed rather than married L 4
Never married rather than married
L 4.5
Cohabiting rather than married L 2
In general people can be trusted -percentage answering yes down by 50 percent
L 1.5
Subjective health down one point on a five point scale
L 6
Quality of government – Belarus 1995 rather than Hungary 1995
L 5
God is important in my life – no rather than yes
L 3.5
Source: Modified from Layard (2005) Note: There were no D variables in the Helliwell paper. Generally demographic variables such as age and gender and education were not statistically significant in studies looking at the determinants of happiness.
These results suggest that the most important factors affecting happiness are shocks to
unemployment, marital status and health.13 Demographic variables (D) (gender, age,
education, race), which were generally either not significant or marginally significant in
other studies of happiness, are omitted. The importance of these significant variables
13 Quality of government is also an important variable and is consistent with the results reported in this section. However the size is the coefficient also reflects the comparison of two specific countries and is therefore not as general as the other results.
24
reflects the extent of life disruptions as general explanatory influences and, in the case of
divorce and unemployment, the feeling of rejection and isolation. With regard to
economic factors, it took a large shock in income to have an impact on well being and
other studies have generally found the level of income to be a minor factor in
determining happiness. Relative income is more significant.
IV. PROBIT ANALYSIS OF WELL BEING
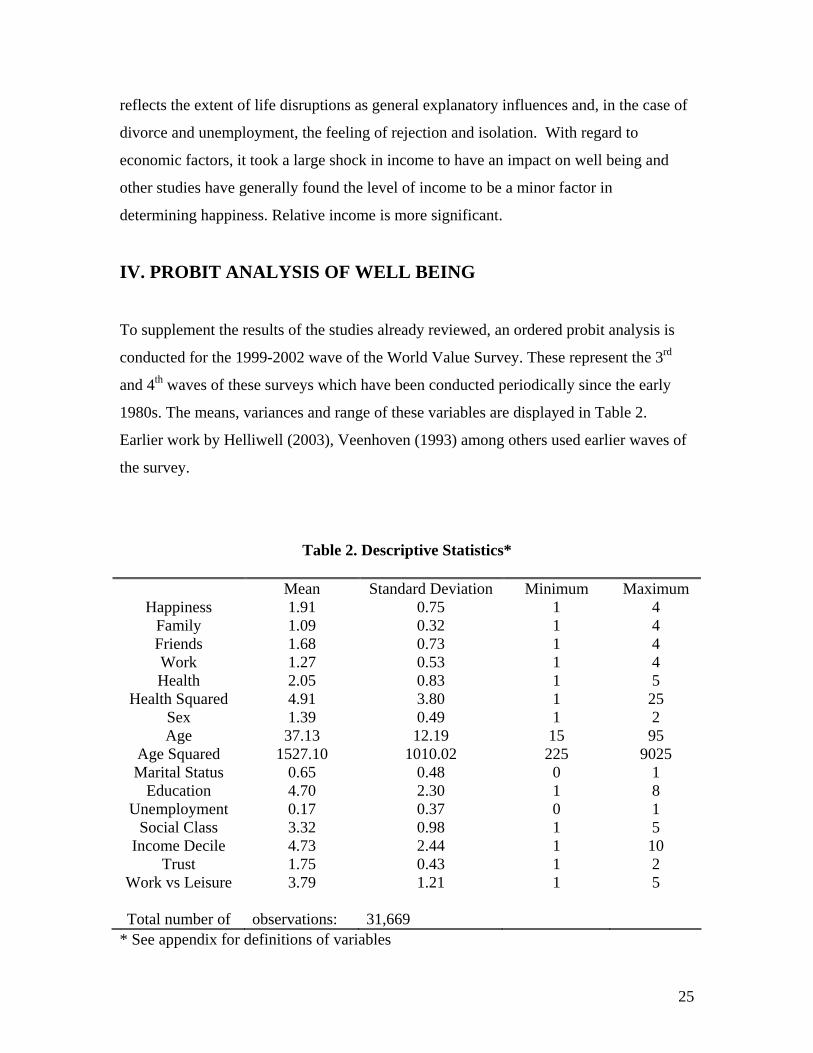
To supplement the results of the studies already reviewed, an ordered probit analysis is
conducted for the 1999-2002 wave of the World Value Survey. These represent the 3rd
and 4th waves of these surveys which have been conducted periodically since the early
1980s. The means, variances and range of these variables are displayed in Table 2.
Earlier work by Helliwell (2003), Veenhoven (1993) among others used earlier waves of
the survey.
Table 2. Descriptive Statistics* Mean Standard Deviation Minimum Maximum
Happiness 1.91 0.75 1 4 Family 1.09 0.32 1 4 Friends 1.68 0.73 1 4 Work 1.27 0.53 1 4 Health 2.05 0.83 1 5
Health Squared 4.91 3.80 1 25 Sex 1.39 0.49 1 2 Age 37.13 12.19 15 95
Age Squared 1527.10 1010.02 225 9025 Marital Status 0.65 0.48 0 1
Education 4.70 2.30 1 8 Unemployment 0.17 0.37 0 1
Social Class 3.32 0.98 1 5 Income Decile 4.73 2.44 1 10
Trust 1.75 0.43 1 2 Work vs Leisure 3.79 1.21 1 5
Total number of observations: 31,669
* See appendix for definitions of variables
25

General model assumptions for well being equations where responses are ordinal in a
bounded range14 have been discussed by Carbonell and Frijters (2004). The ordered
probit model requires that satisfaction is ordinal rather than cardinal and that
interpersonal comparison can be made on that basis. If general satisfaction is reflected by
the ordinal response to the question of, say, “How happy are you with your life as a
whole at the present time?”, then this general satisfaction (gs) for individual i at time t
(gsit) is a monotonic transformation of an underlying metaphysical concept called
welfare (wit). If gsit > gs iu for all times t,u = 1 ….n, then wit > w iu
To estimate the ordered probit as a model of causation, the error terms in the ordered
probit – whether they are time varying eit or time invariant vi, - are either unrelated to
observed factors or their relationship is known. Ordinarily we assume the former. This
structural framework has been used by Blanchflower and Oswald (2004b), Frey and
Stutzer (2000) among others.
How do time invariant fixed effects, including personal characteristics, impact on
happiness? To examine this question, Ferrer-i-Carbonell and Frijters (2004) compare the
results from ordered probit models of this type with other models used primarily by
psychologists. These models assume cardinality and as a result psychologists were able
to introduce controls for fixed effects. Economists are not willing to assume cardinality
and as a result they have generally relied on probit or logit models of the type just
described.
14 Respondents were asked to answer questions such as “Taking all things together would you say you are very happy, quite happy, not very happy, not at all happy?”; “On the whole are you very satisfied, fairly satisfied, not very satisfied or not at all satisfied with the life you lead?”; “Taken all together, how would you say things are these days – would you say you are very happy, pretty happy or not too happy?” 15In this type of model it is not advisable to introduce fixed effects in the model, since this would make the estimators inconsistent (Madalla 1983).14
26
After reviewing the results using different estimating techniques, Ferrer-i-Carbonell and
Frijters (2004) conclude that the differences in model structures, i.e. cardinality or
ordinality, don’t make much difference to the significance of the estimates. They do,
however, note that introducing time invariant fixed effects, which is possible when panel
data are available, did reduce the impact of income on well being. Although they didn’t
perform any tests, they speculate that the impact of these time invariant fixed effects may
also change the significance of other explanatory variables. In another study, Graham et
al (2004) report probit results from panel data created from Russian Longitudinal
Monitoring Survey which covered almost 13,000 Russians per year from 1992 to 2001.
Using panel data constructed from these surveys for 1995 and 2001, changes in
happiness between 1995 and 2001 were related to changes in variables such as income,
getting divorced (change in marital status) and leaving school, becoming unemployed
and retiring. These results were not much different from level results also reported in the
paper although unemployment and retirement lost significance in the panel findings.
For future research, Ferrer-i-Carbonell and Frijters (2004) suggest including as
regressors time-invariant personality traits that may have a large influence on general
satisfaction. These would be in addition to the usual demographic characteristics such as
age, gender and level of education attained.15
As a possible response to this suggestion and also to address the importance of
individual social relationships and bonding, the model includes additional explanatory
variables that reflect the importance of family and friends as well as the usual
demographic variables and marital status.
Taking these factors into account as well as the identification of important variables from
the review in the previous section the model then becomes
15 Another approach suggested by Ferrer-i-Carbonell and Frijters (2004) is to work with a model which combines the ordinality assumption with individual fixed effect estimators employed by Winkelmann and Winkelmann (1988) and Hamermesh (2001).
27

H = f (D, L, W) = b0 + b1 Age + b2 (Age)2 + b3 Gender + b4 Income
+ b5 Married + b6 Health + b7(Health)2 + b8 Unemployment + b9 Education +
b10 Family + b11 Friends + b12 Work + e (2)
The error term, e is independent of all explanatory variables. Income is calibrated by
quartile of respondent’s income in his own country; Married is whether respondent is
married or cohabiting. Health is respondents answer to the question how is the state of
your health. Unemployment is in response to the question are you now unemployed.
Education is response to question what is highest education level attained. Family,
Friends and Work variables are responses to the questions how important are family,
friends and work to you. Definitions of the variables are shown in the Appendix.
The results from the estimation of equation 2 and variations are displayed in Tables 3 and
4.
Table 3 Ordered Probit Regression Statistics on Happiness
Coefficient Std. Error z-Statistic
Family 0.167 0.020 8.526Friends 0.1013 0.009 11.58Work 0.037 0.012 3.047Health 0.680 0.035 19.61
Health Squared -0.053 0.008 -6.990Sex -0.115 0.013 -8.735Age 0.026 0.003 8.347
Age Squared -0.0003 3.63E-02 -8.192Marital Status -0.232 0.015 -15.36
Education 0.009 0.003 2.883Unemployment 0.189 0.018 10.73
Social Class 0.102 0.007 13.92Income Decile -0.035 0.003 -12.09
Trust 0.043 0.015 2.852
28

Work vs Leisure -0.030 0.005 -5.576
Log Likelihood -32101.35Psuedo R2 0.0755
Number of observations 31,668
29
In Table 3 all the independent variables are statistically significant16 .. These overall
results are basically consistent with evidence on the determinants of well being discussed
above in the previous section.
Looking at the control variables first we see that age follows a remarkable similar
parabolic pattern as reported by Easterlin (2004) and Alesina et al (2001). Well being is
an inverse U shape which peaks at age 44 and then declines slowly thereafter Alesina et
al (2001) and Easterlin (2004) also found happiness increases with age up until between
40 and 45, after which happiness begins to decrease. Results by others show a different
pattern (U shaped rather than inverse U shaped ) of well-being is observed over the life
cycle, with a low point in the mid forties to early fifties age groups for both men and
women (Helliwell 2005, Frey and Stutzer 2001, 2002a, 2002b, and Blanchflower and
Oswald 2004a). This could reflect what is commonly referred to as the mid life crisis.
The explanation given by Easterlin for differences between his result and the U shaped
pattern reported by Helliwell, Blanchflower and Oswald and others is that these other
studies included life cycle variables such as work, marital and economic status. Easterlin
suggests that the inverse U is a result of not including control for these changing life
circumstances.
However, the explanation offered by Easterlin (2001a) does not apply to the analysis
presented here since we also included controls for changing life circumstances. We are
therefore led to believe that the inverse U shape is a more robust description of the
relationship between well being and age than Easterlin imagined. In any event, whatever
the shape of the relationship between age and well being the overall impact is small in
comparison with the importance of other variables.
The marital status variable is highly significant although the coefficient itself is smaller
than reported by di Tella et al (2003). This could be a result of the choice of a different
16 In interpreting the signs of the coefficients the reader should be aware that happiness is coded so that low numbers indicate happiness and high numbers indicate unhappiness.
30
range for the dependent variable. In any event being married or with a steady partner has
a definite significant, powerful positive impact on well being.
The gender variable was also significant suggesting that women are marginally happier
than men. This result is consistent with the findings by di Tella et al (2003) and
Blanchflower and Oswald (2004a).
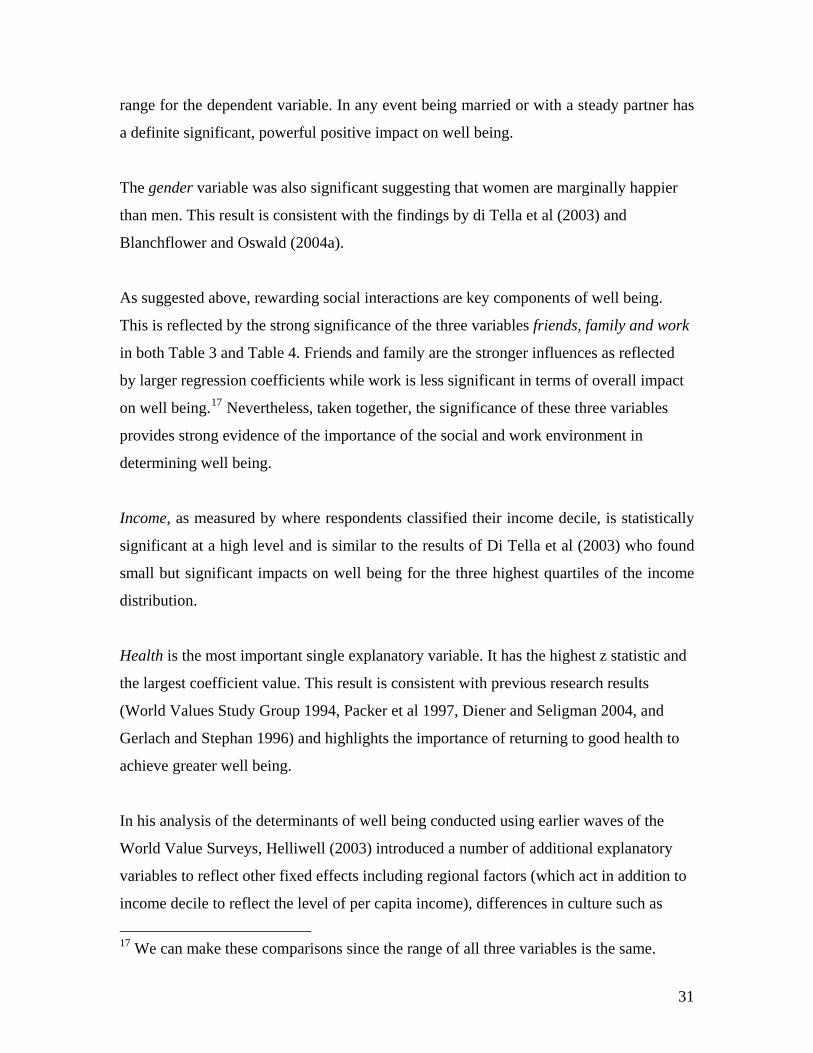
As suggested above, rewarding social interactions are key components of well being.
This is reflected by the strong significance of the three variables friends, family and work
in both Table 3 and Table 4. Friends and family are the stronger influences as reflected
by larger regression coefficients while work is less significant in terms of overall impact
on well being.17 Nevertheless, taken together, the significance of these three variables
provides strong evidence of the importance of the social and work environment in
determining well being.
Income, as measured by where respondents classified their income decile, is statistically
significant at a high level and is similar to the results of Di Tella et al (2003) who found
small but significant impacts on well being for the three highest quartiles of the income
distribution.
Health is the most important single explanatory variable. It has the highest z statistic and
the largest coefficient value. This result is consistent with previous research results
(World Values Study Group 1994, Packer et al 1997, Diener and Seligman 2004, and
Gerlach and Stephan 1996) and highlights the importance of returning to good health to
achieve greater well being.
In his analysis of the determinants of well being conducted using earlier waves of the
World Value Surveys, Helliwell (2003) introduced a number of additional explanatory
variables to reflect other fixed effects including regional factors (which act in addition to
income decile to reflect the level of per capita income), differences in culture such as
17 We can make these comparisons since the range of all three variables is the same.
31
trust and the availability of social capital. Many of these variables were statistically
significant. Also the overall variation in wellbeing, which can be thought of as the
combination of variation within a country and among countries, is heavily influenced by
the latter. Kahneman et al (2004) assert, for example, that the standard deviation of
country means of overall satisfaction is almost half of the average standard deviation of
individuals within countries. The question is whether their exclusion in our analysis will
bias the coefficients of the included variables.
A bias will occur only if the excluded variable is correlated with the included explanatory
variables. This is unlikely. First is the size of the sample which is quite large and second
is the results of several experiments which we made by including several additional
variables to reflect fixed effects. However significance levels would be affected by the
exclusion of relevant variables. Therefore we do include another regression which
contains several additional variables.
H = f (D, L, W) = b0 + b1 Age + b2 (Age)2 + b3 Gender + b4 Income
+ b5 Married + b6 Health + b7(Health)2 + b8 Unemployment + b9 Education
+ b10 Family + b11 Friends + b12 Work + b13 Social Status + b14 Trust + (3)
b15 Work/Leisure + b16 Region1 +……+ b20Region5
+ b21 Country Income + e
In Equation (3), a dummy variable to reflect country income is included. This variable
categorizes a country according to whether their per capita income is in low and low-
middle income category versus the upper-middle and high income category.18 The
presumption is that income level will be statistically significant, i.e. richer countries will
show a higher level of well being and the regression results confirm this. However the
regression results reported in Table 4 show that it is not significantly different from zero.
18 Income class is determined according to World Bank web site classification (2005).
32

Secondly we include a series of geographically motivated dummy variables a la Helliwell
(2003). They reflect different regions (former Soviet Union, Eastern Europe, Latin
America, Asia and other developing countries designated as Region1 to Region 5 with
industrial countries being the control group). The geographic dummy variables are
statistically significant. Using industrial countries as the baseline, the former Soviet
Union and Eastern Europe are much less happy than industrial countries while other
developing countries and Asia are marginally less happy. Latin America is somewhat
happier. These regional effects are similar to those reported by Helliwell (2003).
We included a trust variable to reflect the social cohesion and the desirability of the
respondent’s society. Trust is marginally significant and its coefficient is relatively small,
suggesting that the trustworthiness of society makes a relatively small impact on
happiness and well being.
Finally we include two variables to reflect whether the work/leisure choice and social
class had significant impacts on well being. The results suggest that both social class and
work/leisure attitudes are important determinants of well being. Work creates a greater
sense of well being since those who put higher weight on work appear to be happier
according to the results in Table 4. From the estimates reported in Table 3 we know that
those in higher income bracket are happier than those in the lower brackets. In addition
those who view themselves as being a member of higher social classes also seem to be
happier than their peers. Furthermore the regression coefficients for the income and
social class variables suggest that social class has a somewhat stronger impact on well
being.
The Pseudo-R2 value for the probit regression is 0.09. This is similar to the results
reported by di Tella et al for European panel data from 1975 to 1992 with over 130,000
observations and not an unusually low Pseudo-R2 for large cross sections samples.
33

In addition, we also conducted an ordered probit analysis for the earlier waves of the
World Value Survey 1981 to 199519. Probit results from earlier World Value Survey
waves data are generally consistent with our findings (see Table 4). The independent
variables are mostly statistically significant. Family, friends, health and unemployment
status all are important determinants of well-being. However there are a few interesting
deviations from the 1999-2002 results. Firstly, the 1981-1995 results suggest that men
are marginally happy than women. This result is the reverse of our earlier results for the
1999 – 2002 period and also the findings by di Tella et al (2004) and Blanchflower and
Oswald (2004a). This could be because there have been changes in work and social
circumstances between the 1980s and late 1990s. Greater equality and a wider range of
employment opportunities for women in business and industry could be responsible for
an increase in their well being. This is consistent with the general findings that minorities
are generally less happy probably because of discrimination both at work and by society
in general (Blanchflower and Oswald 2004a, Easterlin 2001a and Helliwell 2005). The
same may apply for women who were discriminated against more systematically in the
past. Work circumstances for women are likely to have improved over time and hence
explaining our current results that women are happier than men. However the difference
is only marginal.
Secondly, another difference between the two sets of findings is that in the analysis of
1981-1995 data, it appears that the relationship between the impact of leisure and work
on well being has shifted. Respondents appear to have put greater emphasis on leisure in
the earlier sample although the coefficient was not statistically significant. Values and
attitudes may have changed in the late 1990s, as there has been a greater emphasis on
work and its importance in determining well-being. The latter data set from 1999-2002
shows that work creates a greater sense of well-being since those who put greater weight
on work appear to be happier. (see Table 4).
19 Data downloaded from http://nds.umdl.umich.edu/cgi/s/sda/hsda2
34
Table 4 Ordered Probit Regression Statistics with Dummy Variables on Happiness
WVS waves 1999- 2002
Earlier WVS waves* 1981 -1990 -1995
Coefficient z-Statistic Coefficient z-StatisticFamily 0.190 9.597 0.366 10.759Friends 0.120 13.55 0.220 10.241Work 0.031 2.462 0.047 1.813Health 0.692 19.780 1.321 14.737
Health Squared -0.059 -7.834 -0.071 -4.263Sex -0.120 -9.083 0.101 3.264Age 0.024 7.886 0.082 5.681
Age Squared -0.0003 -7.547 -0.001 -6.419Marital Status -0.278 -18.106 -0.543 -15.822
Education 0.006 1.789 0.160 7.295Unemployment 0.122 6.853 0.370 8.712
Social Class 0.114 15.37 0.357 18.336Income Decile -0.027 -8.973 -0.028 -4.254
Trust 0.038 2.477 0.311 8.592Work vs Leisure -0.027 -4.884 0.004 0.271
FSU 0.602 17.72 EEUR 0.592 18.187
LATAM -0.059 -2.272 ASIA 0.150 5.324
OTHERDEV 0.242 9.491 COUNTRYINC -0.001 -0.083
Log Likelihood -31,507.15 -13,613.93
Psuedo R2 0.0927 0.156 Number of observations 31,668 28,463
* A simple Probit test was carried out for the earlier wave study from 1981-1995. The dependent variable was simply coded with a range of 0-1, with 0 as happy and 1 as unhappy.
V. CONCLUSIONS
If we piece together the results of happiness research with the concepts of homeostasis
and allostasis, we notice the motivating forces behind decision making in particular
35

situations. These include income and social status, whether respondents are working (as
opposed to being unemployed) and whether they are healthy and enjoying friends, family
and a congenial and trusting environment. Individuals act in response to shocks or
stresses in their lives including loss of job, poor health, lack of satisfying emotional and
social relationships (such as marital difficulties).
They try to make decisions that facilitate a return to a homeostatic equilibrium. While it
is difficult to measure these allostatic effects because of lack of available information on
the circumstances underlying these actions, we do know that individuals seek return to
the old homeostatic equilibrium and this could involve adapting to their new
circumstances. These decisions involve the interplay of cognitive and emotional factors.
By studying these interactions, we are better able to understand what motivates behavior.
We are also better able to gauge what kind of environments result in less stress and are
more conducive to happiness and an elevated sense of well being. Toward this end,
public policy can be directed to develop these kinds of environments.
APPENDIX : WORLD VALUE SURVEY VARIABLES AND DEFINITION A008: Feelings of happiness Taking all things together, would you say you are [1] Very happy [2] Quite happy [3] Not very happy [4] Not at all happy A001 – Family, how important is it in your life? A002 – Importance of Friends, how important is it in your life? A005 – Importance of Work [1] Very important [2] Rather important [3] Not very important [4] Not at all important
36

A009 – State of health. All in all, how would you describe your health these days? [1] Very good [2] Good [3] Fair [4] Poor [5] Very Poor X001 – Sex of respondent [1] Male [2] Female X003 – Age of respondent. This means that you are _________ years old (Uncoded) X007 – Marital Status: Are you currently [1] Married, Living together as married [0] otherwise X025 – Education: What is the highest education level that you have attained? [1] Inadequately completed elementary education [2] Completed compulsory elementary education [3] Incomplete secondary school: technical/vocational [4] Completed secondary school: technical/vocational [5] Incomplete secondary school: university preparatory school [6] Completed secondary school: university preparatory school [7] Some university without degree [8] University degree X025R – Education recoded [1] Low [2] Middle [3] High X028REC – Unemployment Recoded
37

[1] Unemployed [0] otherwise *excluding pensioners/retirees/housewives and students X045 – Social Class [1] Upper class [2] Upper middle class [3] Lower middle class [4] Working class [5] Lower class X047 – Income (country specific) We would like to know what group your household fall under, counting all wages, pensions and other income that comes in, before taxes and deductions. From lowest to highest A165 – Trust [1] Generally most people can be trusted [0] Need to be very careful C008 – Which point on the scale most clearly describes your weight on Work (including homework and housework as compared to leisure or recreation? [1] It is leisure that makes life worth living, not work [2] 2 [3] 3 [4] 4 [5] Work is what makes life worth living, not leisure
38
Figures
Figure 1 Risk-return trade off
risk
return
Risk return tradeoff
Source: Fiegenbaum and Thomas (1988, p. 98, Figure 1)
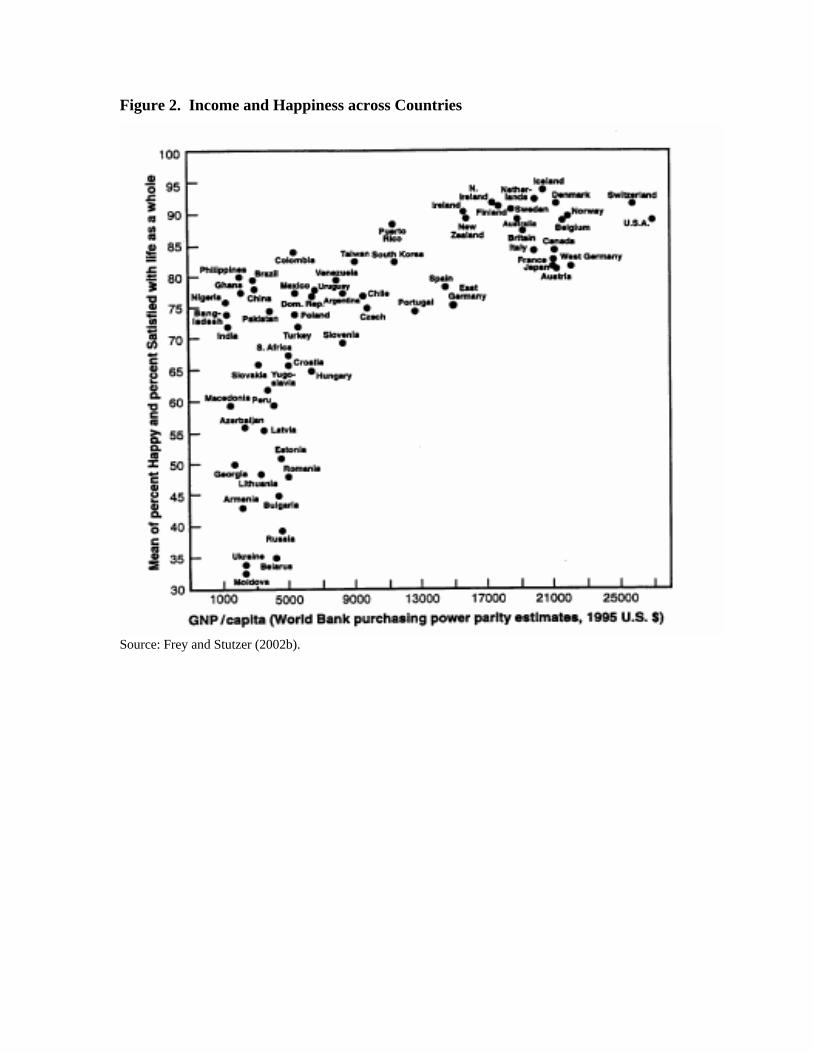
Figure 2. Income and Happiness across Countries
Source: Frey and Stutzer (2002b).
REFERENCES
Alesina, Alberto F., Di Tella R. and R. MacCulloch (2001). Inequality and Happiness: Are Europeans and Americans Different?, Discussion Paper 1938, Department of Economics, Harvard Business School-Business, Government and the International Economy Unit and Princeton University-Center for Health and Well-being, Harvard University.
Argyle, M. (1999). Causes and Correlates of Happiness, in: D. Kahneman, E. Deiner and N. Schwarts (eds.), Well Being: The Foundations of Hedonic Psychology. New York: Russel Sage Foundation: 353-73
Arrindell W.A., Hatzichristou C., Wensink J. and Rosenberg E. (1997). Dimensions of National Culture as Predictors of Cross-national Differences in Subjective Well-being, Personality and Individual Differences. 23: 37-53.
Baumeister, R.F. and M.R. Leary (1995). The Need to Belong: Desire for Interpersonal Attachments as a Fundamental Human Motivation, Psychological Bulletin. 117(3): 497-529.
Baumeister, R.F. and D.M. Tice (1990). Anxiety and Social Exclusion, Journal of Social and Clinical Psychology. 9: 165-195.
Blanchflower, David G and Andrew J. Oswald. (2004a). Well-being over time in Britain and the USA, Journal of Public Economics. 88(7): 1359-1386.
Blanchflower, David G. and Andrew J. Oswald (2004b) Money, Sex and Happiness: An Empirical Study, Scandinavian Journal of Economics. 106(3): 393-415.
Camerer C., Loewenstein G. and Prelec D. (2005). Neuroeconomics: How Neuroscience Can Inform Economics, Journal of Economic Literature. 34(1): 9-64
Cambell, A., Converse, P.E. and W.L. Rogers (1976). The Quality of American Life. New York: Sage
Campbell, Carl III (1993). Do Firms Pay Efficiency Wages? Evidence with Data at the Firm Level, Journal of Labor Economics. 11: 442-470.
Cannon, W.(1932) http://en.wikipedia.org/wiki/homeostasis.
Clark, Andrew E. (2001) What Really Maters in a Job? Hedonic Measurement Using Quit Data, Labour Economics. 8: 223-242
Clark, Andrew E. and Andrew J. Oswald(1994). Unhappiness and Unemployment, Economic Journal. 104(127): 648-59.
Clark, M.S. (1984) Record Keeping in Two Types of Relationships, Journal of Personality and Social Psychology. 47:549-557.
39

Clark, M.S. and J. Mills (1979). Interpersonal Attraction in Exchange and Communal Relationships, Journal of Personality and Social Psychology. 37: 12-14.
Clegg, C.W. (1983) Psychology of Employee Lateness, Absence and Turnover: A Methodological Critique and an Empirical Study, Journal of Applied Psychology. 68: 88-101.
Cunmins, Robert and Bob Nistico (2000). Personal Income and Subjective Well Being: A Review, Journal of Happiness Studies. 1:133-158 Davidson, Richard J., Kabat-Zinn, J., Schumacher, J., Rosenkranz, M., Muller, D.. Santorelli, S.F., Urbanowski, F., Harrington, A., Bonus, K. and John F. Sheridan (2003). “Alterations in Brain and Immune Function Produced by Mindfulness Meditation, Psychosomatic Medicine. 65: 564-570.
Di Tella, Rafael, MacCulloch, R.J. and Andrew J. Oswald (2003). The Macroeconomics of Happiness, The Review of Economics and Statistics. 85(4): 809-827.
Diener, E., Diener, M. and C. Diener (1995). Factors Predicting the Subjective Well-being of Nations, Journal of Personality and Social Psychology. 69: 851-864.
Diener, E. and M.E.P Seligman (2002) Very Happy People, Psychological Science. 13: 80-83.
Diener, E. and M.E.P Seligman (2004). Beyond Money: Toward an Economy of Well Being, Psychological Science in the Public Interest. 5(5): 1-30.
Duesenberry, James (1949). Income, Saving and the Theory of Consumer Behavior. Cambridge: Harvard University Press.
Doyle, Rodger. (2002). Calculus of Happiness, Scientific American Digital. 287(5): 32.
Easterlin, R.A. (2004). Life Cycle Happiness and its Sources. Mimeo, Department of Economics, University of Southern California.
Easterlin, R.A. (2001a). Income and Happiness: Towards a Unified Theory, Economic Journal. 111: 465-484.
Easterlin, R.A. (2001b). Life Cycle Welfare: Trends and Differences, Journal of Happiness Studies. 2: 1-12. Ferrer-i-Carbonell, A. and Paul Frojters (2004). How Important is Methodology for the Estimates of the Determinants of Happiness, The Economic Journal. 114 (July): 641-659. Fiegenbaum, A and H. Thomas (1988). Attitudes toward Risk and the Risk Return Paradox Prospect, Academy of Management Journal. 31(1): 85-107.
40

Friedman, M. (1957). A Theory of the Consumption Function. Chicago: University of Chicago Press.
Frey, Bruno S. and A. Stutzer (2000). Happiness, Economy and Institutions, The Economic Journal. 110: 918-938.
Frey, Bruno S. and A. Stutzer (2001). Happiness and Economics: How the Economy and Institutions Affect Well Being. Princeton, N.J.: Princeton University Press.
Frey, Bruno S and A. Stutzer (2002a). The Economics of Happiness, World Economics. 3 (1): 25-41.
Frey, Bruno S. and A. Stutzer (2002b). What Can Economists Learn from Happiness Research, Journal of Economic Literature. 40 (2): 402-435.
Gerlach, K. and G. Stephan (1996). A Paper on Unhappiness and Unemployment in Germany, Economic Letters. 52(3): 325-330.
Graham, Carol, Andrew Eggers and Sandip Sukhtankar (2004). Does happiness pay?An exploration based on panel data from Russia, Journal of Economic Behavior & Organization. 55: 319–342
Hamermesh, D.S. (2001). The Changing Distribution of Life Satisfaction, Journal of Human Resources. 36: 1-30.
Healy, Paul J. (2004). Group Reputation and Stereotypes as a Contract Enforcement Device, Working Paper, Carnegie Mellon University, Pittsburg. healy.tepper.cmu.edu/~pj/ papers/Healy-StereotypeContracts.pdf
Heffler, S., Smith, S., Keehan, S., Borger, C., Kent, Clemens M. and C. Truffer (2005). Trends: U.S. Health Spending Projections for 2004-2014, Health Affairs. 10.1377
Helliwell, J. (2003). How's Life? Combining Individual and National Variables to Explain Subjective Well-being, Economic Modelling. 20: 331-360.
Helliwell, J.F. (2005). Well-Being, Social Capital and Public Policy: What’s New, National Bureau of Economic Research (Cambridge, MA). Working Paper No. 11807.
Holmes, T.H. and R.H. Rahe (1967) The Social Readjustment Rating Scale, Journal of Psycosomatic Research. 11: 213-318.
Inglehart, R. (1990). Culture Shift in Advanced Industrial Society. Princeton: Princeton University Press.
Inglehart, R. and H. Klingemann (2000). Genes, Culture, Democracy, and Happiness, in: Ed Diener and E.M. Suh (eds.), Culture and Subjective Well-Being. Cambridge: MIT Press.
41

Iwao S. (1993). Japanese Women: Traditional Image and Changing Reality. New York: Free Press.
Kahneman D, Krueger, A.B., Schkade, D., Schwarz, N., and Arthur A. Stone (2004). A Survey Method for Characterizing Daily Life Experience: The Day Reconstruction Method (DRM), Science. 306(5702): 1776-1780.
Kahneman, D., Knetsch, J. and Thaler, R. (1991). The Endowment Effect, Loss Aversion, and Status Quo Bias: Anomalies, Journal of Economic Perspectives. 5(1): 193-206.
Kahneman, Daniel and Tversky, A. (1979). Prospect Theory: An Analysis of Decision Under Risk, Econometrica. 47: 263-291.
Kahneman, D. Krueger, A.B., Schkade, D. Schwartz, N. and Arthur A. Stone (2004). Toward National Well-being Accounts, American Economic Review. 94(2): 429-434.
Lane, Robert E. (2000). The Loss of Happiness in Market Democracies. New Haven: Yale University Press.
Layard, Richard (2005). Happiness: Lessons from a New Science. New York: Penguin Press.
Leary, M.R. (1990). Response to Social Exclusion: Social Anxiety, Jealously, Loneliness, Depression and Low Self-esteem, Journal of Social and Clinical Psychology. 9: 221-229
Lykken, David T. (2000). Happiness: The Nature and Nurture of Joy and Contentment. New York: St. Martin's Griffin.
Maddala, G. S., (1983), Limited dependent and qualitative variables in econometrics,Cambridge University Press, Cambridge
Magdol, L. (2002). Is moving gendered? The effects of residential mobility on the psychological well-being of men and women, Sex Roles. 47(11): 553-560.
Mc Adams, D.P. (1985). Motivation and Friendship, in: S. Duck and D. Perlman (eds.), Understanding Personal Relationships: An Interdisciplinary Approach. Beverly Hills: Sage Publications.
Mc Evily, B., Weber, R., Bicchiere, C. and Ho, V. (2003). Can Groups be Trusted? An Experimental Study of Collective Trust, CMU Working Paper, Carnegie Mellon University, Pittsburg. http://www.andrew.emu/user/rwe-ber/CollectiveTrust10.pdf
Mc Ewen BS and Seeman T. (1999). Protective and Damaging Effects of Mediators of Stress: Elaborating and Testing the Concept of Allostasis and Allostatic Load, Annals of the New York Academy of Science. 896: 30-47.
42

Miner, Andrew G. (2001). Experience Sampling Events, Moods, Behavior and Performance at Work, Unpublished doctoral dissertation, University of Illinois, Urbana, IL.]
Office of National Statistics Longitudinal Survey Development Team (2004) http://www.gad.gov.uk/life tables)
Oswald, Andrew J. (1997). Happiness and Economic Performance, Economic Journal. 107(445): 1815-31.
Oswald, Andrew, Di Tella R., and MacCulloch, R. (2001) Preferences over Inflation and Unemployment: Evidence from Surveys of Happiness, American Economic Review. 91: 335-341.
Packer, S., Husted, J., Cohen, S., and G. Tomlinson (1997). Psychopathology and Quality of Life, Journal of Psychiatry and Neuroscience. 22: 231-234.
Price, S.J. and P. C McKenry (1988). Divorce. Beverly Hills, CA. Sage
Ryff, C.D. (1995). Psychological Well-Being in Adult Life, Current Directions in Psychological Science. 4: 99-104
Scitovsky, T. (1976). The Joyless Economy: An Inquiry into Human Satisfaction and consumer dissatisfaction. New York : Oxford University Press.
Seligman, Martin E.P. (2002). Authentic Happiness: Using the New Positive Psychology to Realize Your Potential for Lasting Fulfillment. New York: Free Press.
Shepard, Paul. (1996). Traces of an Omnivore. Washington D.C.: Island Press. Slovic, P. (1984). Facts vs. fears: Understanding perceived risks, Science and Public Policy Seminar, Federation of Behavioral, Psychological and Cognitive Sciences, Washington D.C.
Spector, Paul E. (1997). Job Satisfaction: Application, assessment, cause and consequences. California: Sage Publications.
Spitzer, R.L., Kroenke, K., Linzer, R., Hahn, S.R., Williams, J.B., deGruy, F.V., Bridy, D. and M. Davies (1995). Health-related quality of life in primary care patients with mental disorders, Journal of the American Medical Association. 274: 1511-1517.
Sternberg, R.J. (1986). A triangular theory of love, Pschological Review. 93: 119-35.
Triandis, H.C. (1994). Culture and Social Behavior. New York: McGraw-Hill.
Triandis, H.C. (1995). Individualism and Collectivism. Boulder, CO: Westview Press.
43
Triandis H.C. (2000). Cultural Syndromes and Subjective Well-Being, in: Ed Diener and E.M. Suh (eds.), Culture and Subjective Well-Being, Cambridge: MIT Press: 13-36.
University of Michigan website. Numeric and Spatial Services http://nds.umdl.umich.edu/cgi/s/sda/hsda2
Veblen, T. (1994) The Theory of the Leisure Class. New York: Penguin Books.
Veenhoven, R. (1993). Happiness in Nations. Rotterdam: Risbo.
Veenhoven, R. (1994). Correlates of Happiness: 7837 Findings from 603 Studies in 69 Countries 1911-1994, 3 vols. Rotterdam: Erasmus University Press.
Veenhoven, R. (2001). Are the Russians as Unhappy as They Say They Are? Comparability of Self-Reports Across Nations, Journal of Happiness Studies. 2: 111-136.
Weiss, R.S. (1973). Loneliness: The experience of emotional and social isolation. Cambridge, MA: MIT Press.
Weiss, R.S. (1979) The emotional impact of marital separation, in: G. Levinson and O.C. Moles (eds.), Divorce and Separation: Context, causes and consequences. New York: Basic Books.
Winkelmann, L., and R. Winkelmann (1998). Why are the Unemployed so Unhappy? Evidence from Panel Data, Economica. 65: 1-15.
World Values Study Group (1994). World Values Survey 1981-1984 and 1990-1993. Inter-University Consortium for Political and Social Research, Ann Arbor: Institute for Social Research, University of Michigan.
World Value Survey website. http://www.worldvaluessurvey.org
Zak, Paul J. (2004). Neuroeconomics, Philosophical Transactions of the Royal Society Biology. 359: 1737-1748. Zak, Paul and S. Knack (2001). Trust and Growth, The Economic Journal. 111(4): 295-321.
44