honeycomb spectroelectrochemical cell kit guide · the honeycomb cell is a tool used to perform...
TRANSCRIPT

i DRU10004 (REV 001) - 7/2013
Honeycomb Spectroelectrochemical Cell
User Guide
Pine Research Instrumentation
2741 Campus Walk Avenue
Building 100
Durham, NC 27705
USA
http://www.pineinst.com/echem
Phone: 919.782.8320 Fax: 919.782.8323
Copyright © 2013 Pine Research Instrumentation

ii DRU10004 (REV 001 / 7/2013)
Table of Contents 1 Preface 1
1.1 Scope 1
1.2 Copyright 1
1.3 Trademarks 1
1.4 Limited Warranty 1
1.5 Use Limitation 1
1.6 Notes and Hints 2
1.7 Safety Notices 2
1.8 Technical Service Contact 2
1.9 Factory Return Service Address 3
2 Product Description 4
2.1 Included Components 6
2.2 Honeycomb Component Details 7
2.2.1 Quartz Cuvette Details 7 2.2.2 Honeycomb Electrode Specifications 8
2.3 Honeycomb Accessories 9
2.3.1 Cell Cables 9 2.3.2 Gas Purge Kits 10 2.3.3 Reference Electrodes 11
3 Background and Theory 12
3.1 Introduction to Absorption Spectroscopy 12
3.2 Introduction to Electrochemistry 13
3.3 Introduction to Spectroelectrochemistry 15
3.4 Common Spectroelectrochemical Experiments 17
3.4.1 Measurement of Transient Chemical Species or Equilibrium Spectra 17 3.4.2 Determination Electroactive Species Reduction Potential 18 3.4.3 Measurement of Electrochemical Kinetics 19
4 Instructions for Use 21
4.1 Cell Assembly 21
4.2 Prepare Honeycomb Cell for a Measurement 22
4.3 Connecting the Honeycomb Cell to a Potentiostat 26
4.4 Obtain Reference (Background) Spectrum 29
4.5 Obtain a Sample Spectrum 29
5 Example Experiments 30
5.1 Study of Methyl Viologen Radical Generated Electrochemically in situ 30
5.2 Study of Ferricyanide/Ferrocyanide Equilibrium 31
5.3 Measurement of Ferricyanide/Ferrocyanide Electrochemical Kinetics 33
5.4 Determination of Ferricyanide Standard Reduction Potential 34
6 Care and Storage 36
6.1 Cleaning the Honeycomb Electrodes 37
6.2 Cleaning the Quartz Cell 38
6.3 Cleaning the Cell Cap 39
6.4 Component Storage 39

iii DRU10004 (REV 001) - 7/2013
Table of Tables Table 1-1. Special Information Icons Used in this Document. ....................................................... 2
Table 1-2. Special Safety Icons Used in this Document. ................................................................. 2
Table 4-3. Pine Research Instrumentation Electrode Lead Color Code. .................................. 28
Table 5-4. Ferricyanide/Ferrocyanide Absorbance as a Function of Applied Potential. ...... 35
Table 6-1. Electrochemical Cleaning Parameters for Honeycomb Electrodes. ..................... 37

iv DRU10004 (REV 001 / 7/2013)
Table of Figures Figure 2-1. Light Passage through the Honeycomb Electrode. .................................................... 4
Figure 2-2. Illustrative Use and Connection to the Honeycomb Cell. ......................................... 5
Figure 2-3. Components Included in Honeycomb Spectroelectrochemical Cell Kit. ............. 6
Figure 2-4. Different Angles of the Quartz Cuvette. ........................................................................ 7
Figure 2-5. A Schematic Drawing of the Honeycomb Electrode Card. ..................................... 8
Figure 2-6. The Cables to Connect the Honeycomb Electrode to Potentiostat. ...................... 9
Figure 2-7. Purge Kits for use with the Honeycomb Cell. .............................................................. 10
Figure 2-8. Miniature External Reference Electrodes for the Honeycomb Cell. ...................... 11
Figure 3-1. Absorption Spectroscopy in a Cuvette. ...................................................................... 13
Figure 3-2. Spectroelectrochemical Analysis with a Mini-Grid Electrode. ................................ 16
Figure 3-3. Spectroelectrochemical Analysis with a Honeycomb Electrode. ......................... 18
Figure 4-4. A Typical UV-vis Light Source. ........................................................................................ 22
Figure 4-5. Spectroelectrochemical Component Setup. ............................................................ 28
Figure 5-1. Chemical Structure of Methyl Viologen Dication. ..................................................... 30
Figure 5-2. Absorption Spectra of Methyl Viologen and its Cation Radical. ........................... 31
Figure 5-3. Structure of Potassium Ferricyanide. ............................................................................ 31
Figure 5-4. Absorption Spectra of Ferricyanide and Ferrocyanide. ........................................... 32
Figure 5-5. Absorbance Transients of Ferricyanide/Ferrocyanide Redox Species. ................. 33
Figure 5-6. Absorption Spectra of Ferricyanide at Different Applied Potential. ...................... 35
Figure 5-7. Linear Relationship between Applied Potential and Concentration. ................... 36
Figure 6-1. Electrochemical CV Signature of an Au Honeycomb Electrode in Acid. ............ 38

1
DRU10004 (REV 001 / 7/2013)
1 Preface
1.1 Scope
This User Guide describes the basic functions of the Honeycomb
Spectroelectrochemical Cell Kit, hereafter referred to as the “Honeycomb Cell,”
including product specifications and limitations, product warranty, and other technical
information.
This guide is written for the professional scientist or engineer (or student of science and
engineering) and assumes a basic knowledge of scientific measurement and data
presentation. Portions of this manual devoted to electrochemical and spectroscopic
concepts assume some familiarity with these subjects.
1.2 Copyright
This publication may not be reproduced or transmitted in any form, electronic or
mechanical, including photocopying, recording, storing in an information retrieval
system, or translating, in whole or in part, without the prior written consent of Pine
Research Instrumentation.
1.3 Trademarks
All trademarks are the property of their respective owners.
1.4 Limited Warranty
LIMITED WARRANTY
The Honeycomb Spectroelectrochemical Cell Kit (hereafter referred to as the “INSTRUMENT”)
offered by Pine Research Instrumentation (hereafter referred to as “PINE”) is warranted to be
free from defects in material at the time of shipment to CUSTOMER. No part of the
INSTSRUMENT is specifically warrantied beyond the date received by the CUSTOMER.
This warranty being expressly in lieu of all other warranties, expressed or implied and all other
liabilities.
All specifications are subject to change without notice. The CUSTOMER is responsible for
charges associated with non-warranted repairs. This obligation includes but is not limited to
travel expenses, labor, parts and freight charges.
1.5 Use Limitation
The Honeycomb Cell is not designed for use in experiments involving human subjects
and/or the use of electrodes inside or on the surface of the human body.

2
DRU10004 (REV 001 / 7/2013)
1.6 Notes and Hints
Throughout this manual there are highlighted notes and information which are
indicated with special icons as shown below (see: Table 1-1).
Note:
Important or supplemental information.
Tip:
Useful hint or advice.
Table 1-1. Special Information Icons Used in this Document.
1.7 Safety Notices
Throughout this user guide there may be safety notices, which are indicated with
special icons as shown below (see: Table 1-2). When working with the Honeycomb Cell
and related accessories take heed and abide by all safety warnings. Failure to do so
may result in damage to property, personal injury, or both.
Caution:
Indicates information needed to prevent injury or death to a person or
to prevent damage to equipment.
Stop:
For a procedure involving user action or activity, this icon indicates a
point in the procedure where the user must stop the procedure.
Table 1-2. Special Safety Icons Used in this Document.
1.8 Technical Service Contact
For questions about proper operation of the Honeycomb Spectroelectrochemical Cell
Kit or other technical issues, please contact Pine Research Instrumentation directly using
the contact information below:
Pine Research Instrumentation
http://www.pineinst.com/echem
Phone: +1 (919) 782-8320
FAX: +1 (919) 782-8323

3
DRU10004 (REV 001 / 7/2013)
1.9 Factory Return Service Address
In the event that components of this kit must be returned to the factory for service,
please contact Pine Research Instrumentation (see contact information above) to
obtain a Return Material Authorization (RMA) form. Include a copy of this RMA form in
any and all shipping cartons and ship the cartons to the factory address below:
Pine Instrument Company
Attn: RMA #: <RMA number>
104 Industrial Drive
Grove City PA 16127
USA
Phone: +1 (724) 458-6391
Return Material Authorization Required!
Do not ship equipment to the factory address above without first
obtaining a Return Material Authorization (RMA) form from Pine
Research Instrumentation. Call +1 (919) 782-8320 for RMA.

4
DRU10004 (REV 001 / 7/2013)
2 Product Description
The Honeycomb Cell is a tool used to perform spectroelectrochemical experiments. It
consists of specially designed components to interrogate the intersection of
spectroscopic and electrochemical properties of chemical species.
The unique Honeycomb Cell features a patterned "honeycomb" electrode card that
mounts easily inside a thin layer quartz cuvette. A special cuvette cap securely holds
the honeycomb electrode card and a separate reference electrode in the proper
position within the cuvette. The working electrode is perforated with a honeycomb
pattern of holes, which allow light to pass through the electrode. The active surface of
the working electrode includes a metal coating along the inner walls of the holes. As
the light beam from the spectrometer passes through the holes, the beam grazes the
walls of each hole. Thus, the beam samples a relatively long pathlength. The figure
below illustrates the way in which light passes through the Honeycomb electrode card
(see: Figure 2-1).
Figure 2-1. Light Passage through the Honeycomb Electrode.
Electrical connections to the working and counter electrode (both located on the
card) are easily made via a convenient mini-B USB connector. Connection to the
separate miniature reference electrode is via a simple pin connection, which can
accept either an alligator clip or a pin-and-socket connection.

5
DRU10004 (REV 001 / 7/2013)
The quartz cuvette is designed to fit any UV-vis spectrometer. The standard 1 cm x 1 cm
cuvette fits nearly any sample holder. The Honeycomb Cell has been placed into an
Ocean Optics cuvette holder, for illustration purposes.
Figure 2-2. Illustrative Use and Connection to the Honeycomb Cell.

6
DRU10004 (REV 001 / 7/2013)
2.1 Included Components
The Honeycomb Cell is sold as a kit. The components of the Honeycomb Cell Kit are
shown and described below (see: Figure 2-3). Each component can be purchased
individually to supplement or replace parts of the original kit. Detailed descriptions are
provided in Section 2.2.
A Quartz Slotted Cell The Honeycomb electrode fits into the slot of the
quartz cell.
B Cell Cap Provides mechanical support for the
Honeycomb and reference electrodes.
C Honeycomb Electrodes Honeycomb Electrode Cards
D Miniature Ag/AgCl
Reference Electrode
Silver/Silver Chloride miniature gel reference
electrode.
E Plastic Fill Pipette Soft, non-scratching tips allow user to fill the
honeycomb channels of a working electrode
with electrolyte.
Figure 2-3. Components Included in Honeycomb Spectroelectrochemical Cell Kit.

7
DRU10004 (REV 001 / 7/2013)
2.2 Honeycomb Component Details
2.2.1 Quartz Cuvette Details
Use Caution: Quartz Cuvet is Fragile
The quartz cell is fragile and has thin walls. Use extreme caution when
handling the cell.
The Honeycomb quartz cuvette is designed for use with the Honeycomb electrode.
The quartz cuvette has a standard 1 cm x 1 cm footprint for use in most UV-vis
spectrometers. The lower half of the cell features two notches, which create a solution
reservoir and electrode chamber (see: Figure 2-4). Note that the reservoir if offset and
not centered in the cuvette. This is intentional and matches with the location of the
Honeycomb alignment groove in the cap.
Figure 2-4. Different Angles of the Quartz Cuvette.
If the Quartz Cell Breaks
The quartz cell is not covered by any warranty. The quartz cell can be
purchased separately should it need to be replaced.

8
DRU10004 (REV 001 / 7/2013)
2.2.2 Honeycomb Electrode Specifications
The Honeycomb Cell Kit includes two gold electrode cards and one platinum card.
The cards were designed to fit into a specially designed quartz cuvette, whose footprint
is a standard 1 cm 1 cm. Figure 2-3 shows the dimensions.
A 14.7 mm
B 17.0 mm
C 30.0 mm
D 12.0 mm
E 9.8 mm
F USB connector area (see inset)
Figure 2-5. A Schematic Drawing of the Honeycomb Electrode Card.
The thickness of the electrode card is 1.7 mm. The working electrode consists of
channels, drilled in a 19 element array, through the ceramic substrate. The interior walls
of the channels are coated with Au or Pt to form the working electrode. Each channel
is 0.50 mm in diameter and their center to center distance is 0.75 mm. A counter trace
counter electrodes
working electrode
F – USB connector (end view)

9
DRU10004 (REV 001 / 7/2013)
is placed on the surface of the ceramic, away from the channel area. In Figure 2-3 the
areas shaded in light gray indicate the sections coated with an insulating clear ceramic
layer.
2.3 Honeycomb Accessories
Accessories for the Honeycomb Cell include cables for making connection from the
potentiostat to the honeycomb working electrode and to the externally supplied
reference electrode. Gas purge kits for introducing inert gas into the
spectroelectrochemical cell (removing dissolved oxygen) are also available (see: Figure
2-4).
2.3.1 Cell Cables
The cell cable for the Honeycomb Cell is sold separately to accommodate the
appropriate potentiostat connection. Two USB-terminated cables are available: one
to connect to a Pine WaveNow or WaveNano potentiostat and another to connect to
any potentiostat (see: Figure 2-6).
A Generic Cable This cable is needed to access individual electrode
traces on a screen-printed honeycomb electrode. A
mini-USB connector is on one end of the cable, and
banana plugs terminate on the other end.
B WaveNow Cable This cable connects a honeycomb electrode directly
to a Pine portable potentiostat (WaveNow or
WaveNano). A break-out (white) socket connector on
the mini-USB end allows access to the externally
supplied reference electrode.
Figure 2-6. The Cables to Connect the Honeycomb Electrode to Potentiostat.

10
DRU10004 (REV 001 / 7/2013)
2.3.2 Gas Purge Kits
There are purge kits available to assist with purging, sparging, and blanketing of
solutions within the cell. For the Honeycomb Cell, two different kits should be used and
include the three-way valve purge kit and micro-connection purge kit (see: Figure 2-7).
The three-way valve purge kit contains 3/8” OD / 1/4" ID PVC tubing and three-way
PTFE valve to switch an inert purge gas to either bubbling under an electrolyte solution
or blanketing over the solution.
The micro-connection purge kits contains 1/8” OD / 1/16” ID PVC tubing, 1/16” OD /
1/32” ID PTFE tubing, 1/32” OD / 1/64” ID PEEK tubing, and male/female luer lock
connectors
A Three-Way Valve
Purge Kit
Connects purge gas (e.g. Nitrogen or Argon) to either
cell connection or micro-connection purge kit.
B Micro-Connection
Purge Kit
Kit connects three-way valve purge system to the
Honeycomb cell. The Kit contains:
Figure 2-7. Purge Kits for use with the Honeycomb Cell.

11
DRU10004 (REV 001 / 7/2013)
The three-way valve and micro-connection purge kits are designed to be used
together. The three-way valve purge kit links the purge gas source (e.g. Nitrogen or
Argon) with the three-way valve. From the three way valve, the micro-connection
purge kit connects to the Honeycomb cell for purging, sparging, and blanketing
solutions within the Honeycomb quartz cuvette.
2.3.3 Reference Electrodes
The Honeycomb Cell Kit contains a miniature Ag/AgCl gel reference electrode (see:
Figure 2-8). The Ag/AgCl electrode is ideal for aqueous sampling or systems where
chloride ion contamination is not of concern. The reference electrode has a ceramic
fritted tip, a 3.5 mm diameter glass body, and an overall length of 60 mm. The gel
inside is a saturated KCl solution.
Alternatively, a miniature silver wire pseudo reference electrode is also separately
available to fit the cell. The miniature reference electrodes can be purchased
separately from Pine (see: Figure 2-8).
Figure 2-8. Miniature External Reference Electrodes for the Honeycomb Cell.
Use Proper Orientation
Always ensure the Honeycomb electrode is inserted properly into the
quartz cuvette. The externally supplied reference electrode should
always be inserted behind the Honeycomb electrode, the side on which
there is no printing (with gold or platinum).
12
DRU10004 (REV 001 / 7/2013)
3 Background and Theory
3.1 Introduction to Absorption Spectroscopy
The Irradiance of light ( ) is defined as the energy per second per unit area of the light
beam ( ). When a light beam (of initial irradiance, ) passes through a colored
solution sample of length , the molecules in the solution can absorb some or all of the
light. Therefore, the irradiance of the exiting light beam ( ) depends on the extent of
light-molecule interactions and . The ratio of initial light beam irradiance to exiting
light beam irradiance is called Transmittance, T (see: Equation 1).
(1)
ranges from zero (the light passing through solution is 100% absorbed) to one (0% of
the light beam is absorbed). Another way to consider the extent to which molecules in
solution absorb light energy is by considering the Absorbance ( ), the logarithm of
Transmittance (see Equation 2).
( ) (2)
Some refer to Absorbance as optical density. The extent of Absorbance is described by
the Beer-Lambert relationship (see: Equation 3),
(3)
where is the molar absorption (extinction) coefficient ( ) of a light-absorbing
molecule, is the optical path length ( ); and is the concentration ( ).
By the Beer-Lambert relationship (see: Equation 3), absorbance ( ) is determined by
cell geometry ( ) and the chemical properties of solution ( ). Concentration ( ) is linearly proportional to absorbance ( ).
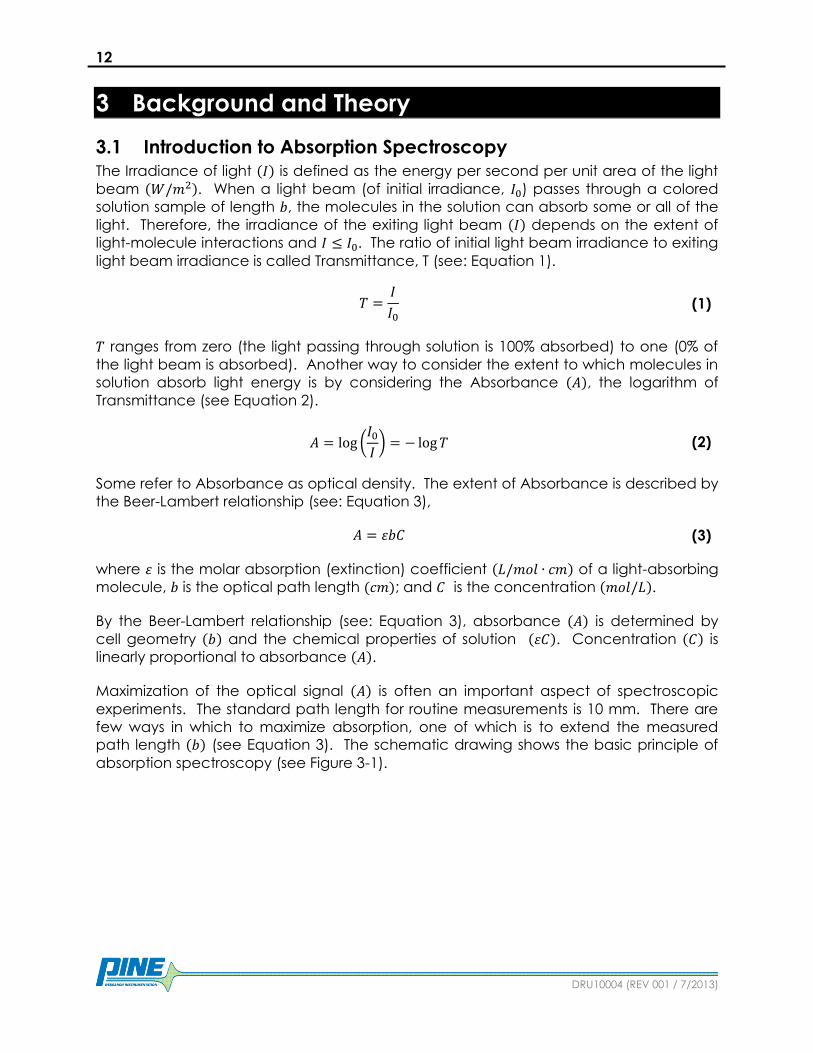
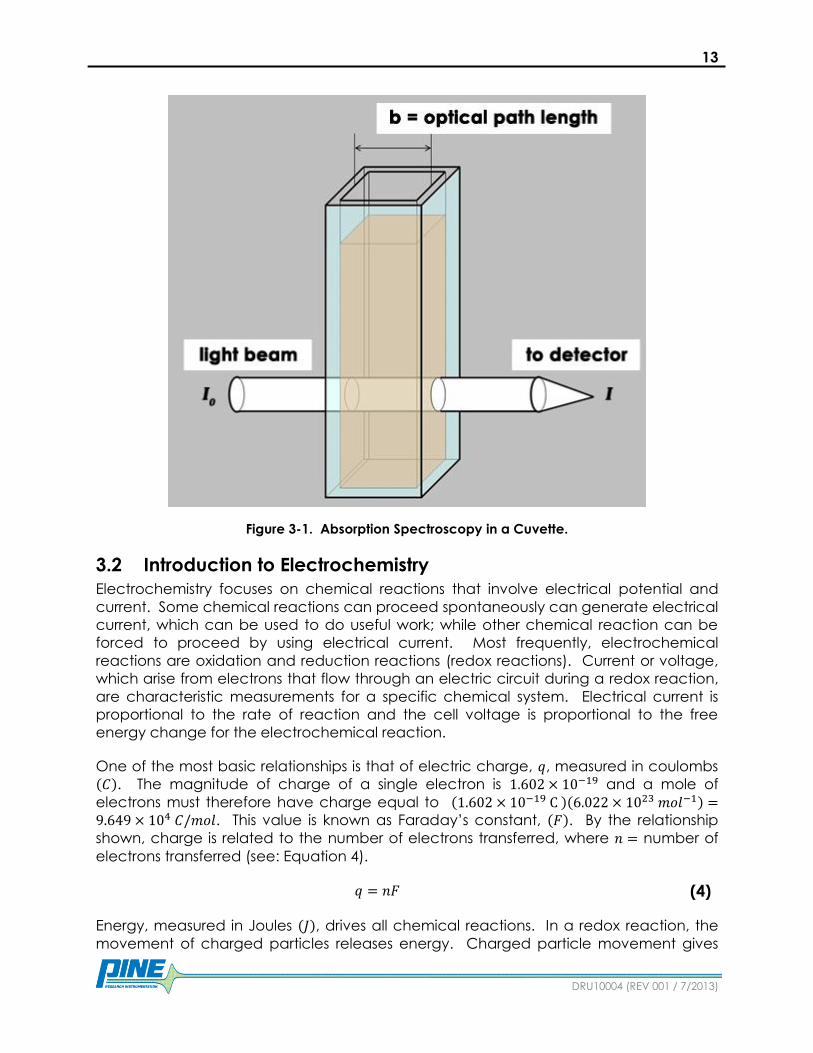
Maximization of the optical signal ( ) is often an important aspect of spectroscopic
experiments. The standard path length for routine measurements is 10 mm. There are
few ways in which to maximize absorption, one of which is to extend the measured
path length ( ) (see Equation 3). The schematic drawing shows the basic principle of
absorption spectroscopy (see Figure 3-1).
13
DRU10004 (REV 001 / 7/2013)
Figure 3-1. Absorption Spectroscopy in a Cuvette.
3.2 Introduction to Electrochemistry
Electrochemistry focuses on chemical reactions that involve electrical potential and
current. Some chemical reactions can proceed spontaneously can generate electrical
current, which can be used to do useful work; while other chemical reaction can be
forced to proceed by using electrical current. Most frequently, electrochemical
reactions are oxidation and reduction reactions (redox reactions). Current or voltage,
which arise from electrons that flow through an electric circuit during a redox reaction,
are characteristic measurements for a specific chemical system. Electrical current is
proportional to the rate of reaction and the cell voltage is proportional to the free
energy change for the electrochemical reaction.
One of the most basic relationships is that of electric charge, , measured in coulombs ( ). The magnitude of charge of a single electron is and a mole of
electrons must therefore have charge equal to ( )( ) . This value is known as Faraday’s constant, ( ). By the relationship
shown, charge is related to the number of electrons transferred, where number of
electrons transferred (see: Equation 4).
(4)
Energy, measured in Joules ( ), drives all chemical reactions. In a redox reaction, the
movement of charged particles releases energy. Charged particle movement gives

14
DRU10004 (REV 001 / 7/2013)
rise to an electrical potential difference ( ), measured in volts ( ). When a charged
particle moves through a potential difference, thermodynamic work ( ) is done (see:
Equation 5). Since potential difference is not a point source, it is sometimes denoted as
a difference, .
(5)
Gibb’s free energy ( ) is the negative value of the maximum electrical work possible
(see: Equation 6).
(6)
Therefore, the relationship between Gibb’s free energy and electrical potential
difference is established (see: Equation 7).
(7)
At standard conditions ( and ), free energy and electrical
potential are denoted as and and are often tabulated values useful for finding
free energy and potential differences at non-standard conditions.
For the following general chemical reaction (balanced, overall)
the reaction quotient ( ) is the ratio of the activity ( ) of each component, raised to its
stoichiometric coefficient. At low concentrations, activity closely follows concentration
(see: Equation 8).
[ ] [ ]
[ ] [ ] (8)
Free energy relates to the reaction quotient,
(9)
where is the universal gas constant ( ) and is temperature ( ) (see:
Equation 9). The relationships for free energy, electrical potential difference, and
reaction quotient combine to give the Nernst equation (see: Equation 10), a
fundamental relationship used in electrochemistry. If a system follows the Nernst
equation then the reaction is often said to be thermodynamically (or
electrochemically) reversible (i.e. Nernstian
[ ] [ ]
[ ] [ ] (10)
There are always two reactions occurring in the electrochemical cell; a reaction occurs
at the negative terminal (cathode) and at the positive terminal (anode). The Nernst
equation is most commonly used to determine the half cell potential, or the standard

15
DRU10004 (REV 001 / 7/2013)
reduction potential of one of the electrochemical reactions in the electrochemical cell.
The form of the Nernst equation given (see: Equation 10) is often simplified to only
consider the oxidized [ ] and reduced [ ] species of a half reaction, raised to their
stoichiometric coefficients (see Equation 11).
[ ]
[ ] (11)
The [ ] [ ] ratio from the Nernst equation can be interrogated during a
spectroelectrochemical experiment. Due to the confined reaction space within the
Honeycomb holes, the electrochemical reaction approaches exhaustive electrolysis
within the holes. The time to reach exhaustive electrolysis depends highly on the
kinetics of mass transport and electron transfer for the chemical species of interest.
In electrochemistry, it is common to write half cell reactions as reductions (see: Equation
12),
(12)
where is the number of electrons transferred in the half reaction, respresents an
electron, and and are the oxidized and reduced forms of the molecule,
respectively. Standard reduction potentials ( ) for electron transfer reactions are
useful in determining reduction potentials as non-standard or non-equilibrium conditions ( ). are thermodynamically calculated and do not consider kinetic limitations in the
heterogeneous or homogenous electron transfer rates.
Electrolysis is a general term for the process by which a chemical reaction is forced to
occur at an electrode due to an applied voltage. For a general reduction reaction
(see: Equation 12), applying a voltage which is (called an overpotential) will drive
the redox reaction at a faster rate; therefore, causing more charge to flow per unit
time. The quantity of charge that flows per unit time through a circuit is called current
(amperes, ) and 1 of current is the charge of 1 per second ( ). The
general equation for relating current ( ) to amount of chemical electrolyzed ( ) depends on time ( ) and number of electrons transferred in the half reaction ( ) (see:
Equation 13).
(13)
The term exhaustive electrolysis indicates that all moles of redox active species ( in
Equation 12) within the diffusional limit of the working electrode have been reduced (
in Equation 12).
3.3 Introduction to Spectroelectrochemistry
Spectroelectrochemistry includes a range of experimental techniques that provide
integrated information from both spectroscopy and electrochemistry. Among these
techniques, integration of UV-vis absorption spectroscopy and electrochemistry
represents a classical example that was studied during the pioneering days of this field.

16
DRU10004 (REV 001 / 7/2013)
In fact, the term “spectroelectrochemistry” often specifically refers to methods that
integrate UV-vis absorption and electrochemistry. The Honeycomb Cell was designed
for use with UV-vis absorption and electrochemistry.
In a typical spectroelectrochemical setup, the working electrode must permit
transmission of a collimated beam of light. Transparent and conductive electrodes,
such as indium tin oxide (ITO) electrodes, satisfy this requirement; however, ITO does not
permit passage of ultraviolet light. By comparison, mini-grid electrodes, electrodes
composed of thin strands of woven noble metals like platinum and gold, allow partial
transmission of UV light and are commonly used in spectroelectrochemical experiments
(see Figure 3-2).
A mini-grid electrode is made of thin metal wires of diameter , woven into a mesh of a
pitch distance . The mini-grid is inserted into a thin-layer cell of width , which is also
the optical path length in an absorption measurement.
Figure 3-2. Spectroelectrochemical Analysis with a Mini-Grid Electrode.
Electron transfer reactions (see: Equation 12) at the working electrode surface can lead
to a change in the optical absorption measured if the oxidized and reduced species
involved have significantly different molar extinction coefficients. According to the
Beer-Lambert relationship (see: Equation 3), the magnitude of absorbance change is
directly proportional to the optical path length b.
Exhaustive electrolysis is often desired in spectroelectrochemical experiments. It is
desirable to shorten the total electrolysis time for two reasons: 1) molecules can
become unstable (transient) upon oxidation or reduction and require rapid detection
17
DRU10004 (REV 001 / 7/2013)
before they are lost to irreversible chemical reactions; and 2) short equilibrium time
reduces total experiment time, useful when many spectra must be obtained at
equilibrium conditions. For example, the formal potential of a redox protein can be
mapped by measuring the ratio of redox species concentrations as a function of
applied electrode potential. The ratio of redox species concentration is obtained from
absorption spectrum at each potential when the redox pair reaches Nernstian
equilibrium at the electrode surface. Such a measurement depends upon exhaustive
electrolysis, which depending on the nature of the electron transfer kinetics, may take a
long time to achieve.
The equilibrium time of a thin-layer spectroelectrochemical cell can be estimated if
diffusion toward the working electrode is the rate limiting step (see: Equation 14),
(14)
where ( ) is the diffusion coefficient of a redox active molecule and ( ) is the
largest distance molecules have to travel to reach the nearest electrode surface. By
assuming typical grid dimensions ( ), standard cell dimensions ( ), and assuming a typical value for the diffusion coefficient ( ), the equilibrium time can be estimated ( ). If cell path
increases ten-fold in length to approximately 1 mm, the diffusional time increases 100
fold to 2000 . Therefore, there exists a clear tradeoff between measured signal
strength (absorbance) and the time required to obtain spectroelectrochemical
measurements.
The Honeycomb Spectroelectrochemical electrodes by Pine (see: Figure 3-3) feature
geometries that achieve longer path lengths than possible with classic mini grid
configurations. Primarily, the increased absorbance results from the substrate thickness
(1.7 mm) and through pore coating with active electrode material, which defines path
length. Compared to traditional mesh type electrodes, path length is about an order
of magnitude higher for Honeycomb electrodes. Radial diffusion within the small pores ( ) of the Honeycomb electrode pattern decreases the diffusion time, thereby
offering slightly higher absorbance than traditional mesh electrodes.
3.4 Common Spectroelectrochemical Experiments
3.4.1 Measurement of Transient Chemical Species or Equilibrium Spectra
A common application of UV-vis spectroelectrochemistry is to obtain absorption
spectra of transient species, which form because of electrochemical reactions. In such
an experiment, the electrode potential is initially biased at a potential where
electrochemical reactions do not occur. Then, potential is stepped to a value where a
transient species generates at the electrode surface due to electron transfer reactions.
Optical absorption measurement starts immediately after the potential step is applied.
The result is a mapping of the absorption spectrum signature as a function of applied
potential.

18
DRU10004 (REV 001 / 7/2013)
Figure 3-3. Spectroelectrochemical Analysis with a Honeycomb Electrode.
With certain electroactive species, signal strength (absorbance) initially increases as
potential increases as a function of time. After sufficient electrolysis time, absorption
reaches a limiting value after the electroactive species in solution have been
exhaustively electrolyzed.
If the transient species generated electrochemically is not stable (e.g. spontaneous
decomposition, homogenous chemical reaction, etc.), then the temporal resolution of
the optical absorption measurement must be improved to measure the signal that
arises from the short lived species. In this case, longer optical pathlength becomes
particularly desirable because it can compensate signal loss resulting from short
measurement time.
3.4.2 Determination Electroactive Species Reduction Potential
By UV-vis analysis of electrochemically active chemicals subjected to changes in
applied potential, certain absorbance peaks will grow and/or decay as a function of
applied potential. Specific wavelengths at which the absorbance change due to
applied potential are most notable can be followed to determine the reduction
potential of the chemical.
If an electrochemical reaction generates stable, measureable products, and if the
products quickly reach equilibrium concentrations (by exhaustive electrolysis), then
equilibrium absorbance spectra obtained at a series of electrochemical potentials can

19
DRU10004 (REV 001 / 7/2013)
be measured. In this case, the absorbance value is expected to follow the Nernst
equation (see: Equation 11).
Consider the general electrochemical reaction (see: Equation 12). If the applied
potential is , then is the dominant species within the diffusional limit of the
electrode. As potential is stepped , converts to at an increasing rate as the
potential step moves farther from . The UV-vis spectral changes observed during the
reduction and oxidation are a true response to applied electrode potential. Then
changes in absorbance represent the changes in concentration of and .
At a fixed wavelength, the relationship between [ ] [ ] and absorbance is a direct
proportion (see: Equation 15).
[ ]
[ ]
(15)
where is the absorbance of the solution at equilibrium for any applied potential, is
the absorbance of the fully oxidized species, and is the absorbance of the fully
reduced species. When sufficient absorbance spectra have been obtained at several
values of applied potential (typically, at least ten data points), a plot of applied
potential vs. [ ] [ ] (as determined from Equation 15) reveals a linear relationship.
From a linear regression of the data, one can find , number of electrons transferred in
the reaction, from the slope, which is equal to , and , standard reduction
potential, from the intercept of the regression curve.
The experiment described here is a well established technique to study redox proteins,
which often have intense absorption bands in the UV region. The main requirements for
successful data acquisition with this type of experiment are as follows:
1. The electron transfer reactions are reasonable fast so that equilibrium conditions
is reached within minutes.
2. The electrolysis time is comparable to the time to reach equilibrium.
3. The chemical species is stable, electrochemically reversible, and can be
resolved spectroscopically.
3.4.3 Measurement of Electrochemical Kinetics
Electrochemical kinetics involves several physical processes that occur simultaneously.
These processes include electron transfer at the electrode|electrolyte (heterogeneous
reaction), chemical reactions proceeding or following an electron transfer step
(homogenous reaction), surface effects (adsorption), and mass transport (such as
diffusional transport) to the electrode surface.
Spectroelectrochemistry assists in the elucidation of kinetic rates, relative to the
processes described previously. In general, a well established absorption peak,
corresponding to a particular redox species, is measured as a function of time. When
designing such an experiment, one has to trade off signal strength (absorbance) and
with time resolution.

20
DRU10004 (REV 001 / 7/2013)
If a sufficiently negative (reducing) potential is applied to the electrode, then the
electron transfer step is very fast. Conversely, a sufficiently positive (oxidizing) potential
drives the electron transfer at a faster rate as well. In any system, exhaustive electrolysis
will be achieved faster than bulk concentration equilibrium.
As absorbance is monitored at a specific wavelength, the absorbance vs. time plot
reveals important pieces of information about how fast exhaustive electrolysis can be
accomplished. Without electrical potential perturbation, the absorbance (at a fixed
wavelength) is constant and the concentrations of and do not change. As
potential is stepped (either positively or negatively), charge flows to balance the
applied potential, resulting in some being electrolyzed to (see: Equation 11). The
time to achieve exhaustive electrolysis of that is within the mass transport limit
(diffusional limit) of the system is related to the gradual decrease or increase in
absorbance. The diffusional time and exhaustive electrolysis time can be obtained
from such a plot.

21
DRU10004 (REV 001 / 7/2013)
4 Instructions for Use
Separate Reference (Background) and Sample Spectra may be
Required
The instructions given in Section 4 are applicable to both obtaining a
reference spectrum and a sample spectrum. Some users
experimental conditions may require cleaning the cell between
reference and sample spectra.
4.1 Cell Assembly
Use Caution: Wear Gloves
Do not touch optical surfaces.
Prepare the cell cap and cuvette.
The slot in the cap for the Honeycomb
electrode should align with the slot in the
quartz cuvette.
The photo shows alignment arrows and
dashed lines to clearly show the
orientation of the cap and cuvette.

22
DRU10004 (REV 001 / 7/2013)
Cap will fit loosely on the quartz cuvet.
The 3.5 mm OD hole in the cap (reference
electrode access) should be positioned
above the bulk well in the quartz cuvet.
4.2 Prepare Honeycomb Cell for a Measurement
Turn on the light source of your
spectrometer to stabilize the light
beam intensity.
Typically ~10 minutes is necessary.
Figure 4-4. A Typical UV-vis Light Source.
Warm the Spectrometer Lamp(s)
Spectroelectrochemistry often involves measuring small changes in
absorbance, so a very stable light source is essential.

23
DRU10004 (REV 001 / 7/2013)
Through the large hole on the cell cap, fill the quartz cell
with test solution.
The fill volume should be 1.1 mL to 1.3 mL. The plastic
pipettes have markings at the 1 mL interval.
Avoid Bubbles in Solution
Carefully fill the thin gap in the quartz cuvet to avoid introducing
bubbles.
Pre-fill the channels of a clean Honeycomb
electrode with the same electrolyte to be
measured.
Check to be sure that no air pockets are present
inside any of the channels.

24
DRU10004 (REV 001 / 7/2013)
Carefully Align Electrode in Quartz Cuvet and Cap
Ensure that the cell is assembled as designed. The Au or Pt pattern
should face the shorter quartz notch, which is the same side the light
beam should enter the cell.
Insert the Honeycomb electrode into the cell cap
assembly.
The Au or Pt pattern should also face the incoming
light for absorption measurements.
The face with printed Au or Pt pattern should point
away from the fill hole in the cap (also, where the
gel reference will be inserted).
The face with printed Au or Pt pattern should point away from the fill hole in the cap
(also, where the gel reference will be inserted).

25
DRU10004 (REV 001 / 7/2013)
Insert the reference electrode (miniature Ag/AgCl
gel or miniature pseudo Ag wire) and use the o-ring
to adjust the depth of immersion.
Install with Correct Orientation
Ensure the reference electrode is installed behind the Honeycomb
electrode. The reference electrode should be next to the bare
Honeycomb electrode substrate surface, not the patterned side.
Insert the Honeycomb cell (fitted with cap, Honeycomb electrode, and reference
electrode) into the cuvet holder of the UV-vis Spectrometer.
Determine the light beam path direction in your spectrometer. The diagram given
below shows the directionality of the Honeycomb electrode and cuvet relative to the
light beam source.
In the diagram below, the cuvet holder is a fiber optic cuvet holder. Your UV-vis
spectrometer may not have fiber optic connection.

26
DRU10004 (REV 001 / 7/2013)
4.3 Connecting the Honeycomb Cell to a Potentiostat
Use with Any Potentiostat
There are two cables available for the Honeycomb cell so it can be
used with any potentiostat, including the Pine WaveNow series.
To connect Honeycomb cell to a Pine WaveNow or WaveNano, use the reference
breakout cable.
Connect the HD-15 potentiostat connector to the WaveNow or WaveNano and mini-
USB connector to the top of the Honeycomb electrode.
A separate reference electrode breakout (white wire with barrel connector) should
connect to the pin of the externally supplied reference electrode.

27
DRU10004 (REV 001 / 7/2013)
To connect Honeycomb cell to other potentiostats, use the USB-to-banana cable
(generic cell cable).
Connect the working sense, working drive, and counter electrode banana jacks to
appropriate potentiostat cell cable leads.
Connect the potentiostat reference electrode lead directly to the externally supplied
reference electrode.
Separate Reference Electrode Connection
Note that the reference alligator clip from the potentiostat should be
connected directly to the pin on top of the externally supplied
reference electrode (gel Ag/AgCl or pseudo Ag). All other
potentiostat leads (working drive, working sense, and counter)
should be connected to the corresponding banana plugs on the
generic cable.
28
DRU10004 (REV 001 / 7/2013)
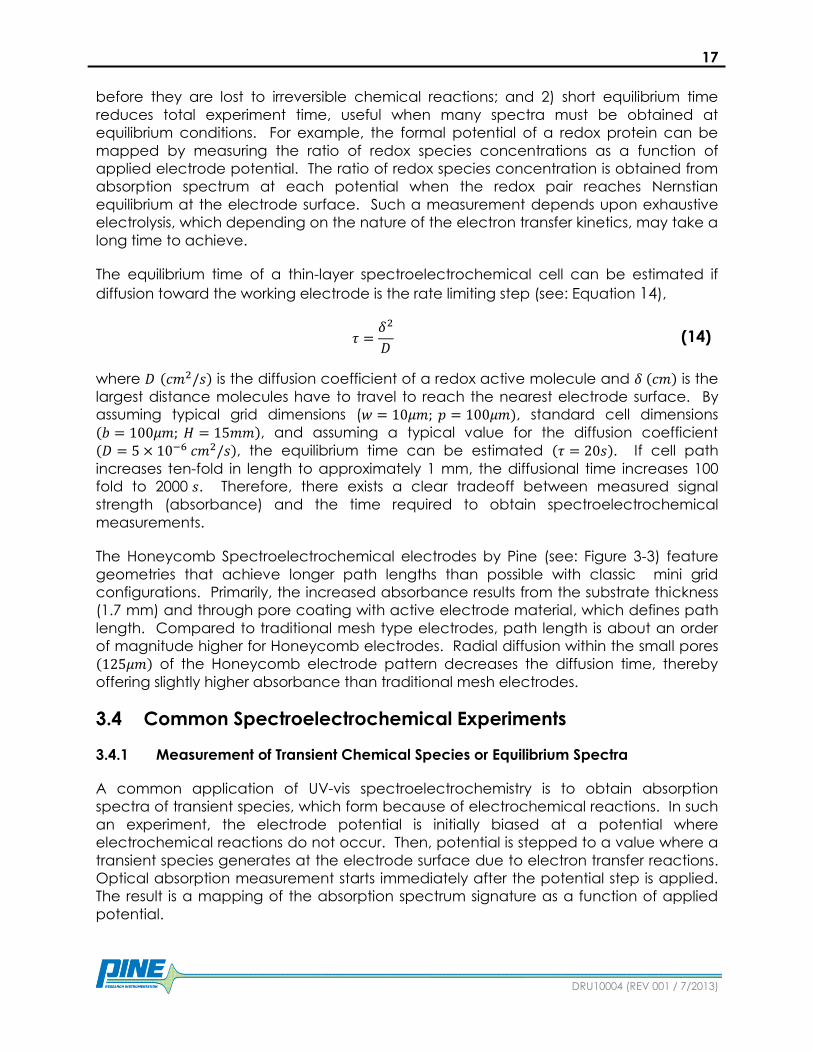
The Pine Research Instrumentation cell connection color code is given below, in Table
4-4. When using the generic cable to connect the Honeycomb electrode to the
potentiostat, connect potentiostat leads to the appropriate Pine color.
Color Description Abbr. Type
GREEN Counter Electrode CE Drive
WHITE Reference Electrode RE Sense
RED Primary Working Electrode K1 Drive
ORANGE Primary Working Electrode K1 Sense
BLACK Analog Ground/ DC Common Ground
Table 4-3. Pine Research Instrumentation Electrode Lead Color Code.
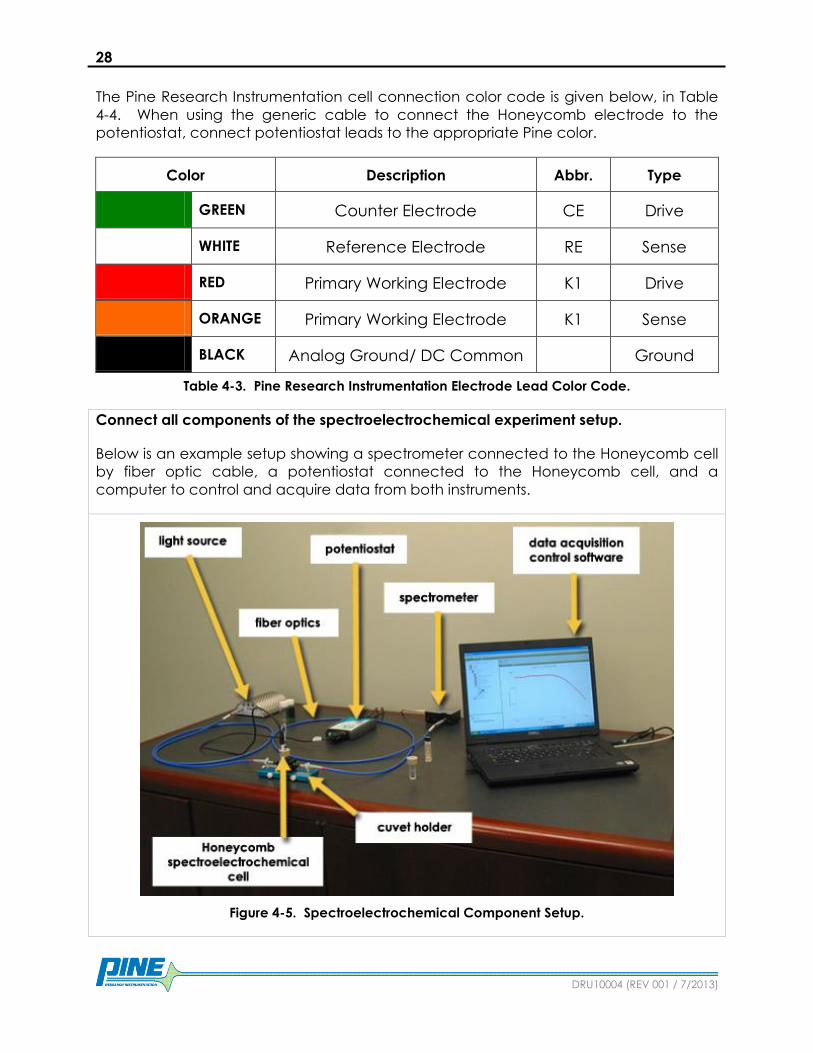
Connect all components of the spectroelectrochemical experiment setup.
Below is an example setup showing a spectrometer connected to the Honeycomb cell
by fiber optic cable, a potentiostat connected to the Honeycomb cell, and a
computer to control and acquire data from both instruments.
Figure 4-5. Spectroelectrochemical Component Setup.

29
DRU10004 (REV 001 / 7/2013)
4.4 Obtain Reference (Background) Spectrum
To record an absorbance spectrum, first collect a background spectrum with an
appropriate reference solution. The background spectrum will be subtracted from the
sample spectrum to compensate for any reflection, scattering, and absorption by the
cuvet, solvent, or electrolyte. Therefore, the true absorbance of the sample is
collected. It is ideal to select optically transparent solvents and background
electrolytes for spectroscopic experiments to minimize false changes in background
absorbance.
Important Information about the Reference Solution
The nature of the user’s chemistry will dictate the composition of the
reference solution. Some common reference solutions are:
Solvent
Solvent + background electrolyte
Solvent + background electrolyte + sample
(if one of the electrochemical forms is optically transparent at
a select electrochemical potential)
With all components in the system connected, obtain a reference spectrum.
The Honeycomb electrode should be inserted into the cuvette during this
measurement.
Save the reference spectrum.
Every spectrometer has its own unique software. The reference spectrum may have to
be subtracted manually.
4.5 Obtain a Sample Spectrum
As discussed previously in Section 3.4, there are some common spectroelectrochemical
experiments. Use of the Honeycomb cell requires method development by the user
and the steps will be specific to the chemical system under interrogation. This user
guide does not explain the steps of acquiring an absorption spectrum for each type of
spectroelectrochemical experiment. In general, the spectrometer and potentiostat
operate independently. There are several modes of operation possible. Here are three
possible options:
Obtain a sample spectrum without the potentiostat running. This type of
spectrum is like a traditional UV-vis absorption measurement.
Obtain a sample spectrum with the potentiostat at open circuit potential (OCP).
This type of spectrum is like a traditional UV-vis absorption measurement. OCP is
a reasonable potential to apply for the first experiment.
Use the potentiostat to perform electrolysis (typically a potential step
experiment) for some amount of time. After the electrolysis period, use the
spectrometer software to collect a spectrum as desired (wavelength range or
fixed wavelength).
30
DRU10004 (REV 001 / 7/2013)
5 Example Experiments
This section provides experimental data to highlight common uses of
spectroelectrochemistry. Refer to Section 3.4 for a theoretical discussion of the
experiments that follow. The Honeycomb cell was used in the following experiments.
5.1 Study of Methyl Viologen Radical Generated Electrochemically
in situ
Methyl viologen ( ) is a frequently employed electrochemical redox species. Due
to its highly reversible one electron transfer, is often used in conjunction with
biological systems as a rapid electron mediator between biological species in solution
and the electrode surface. The highly conjugated nature of (see: Figure 5-1)
lends itself to UV-visible spectroscopic interrogation as well as electrochemical studies.
Figure 5-1. Chemical Structure of Methyl Viologen Dication.
The first electron transfer reaction of reduces the dication to a cation radical
intermediate ( , see: Equation 16). This first step is electrochemically reversible. A
solution of is clear and colorless while its reduction product, , is a violet blue
color.
(16)
As electrode potential is held at an even higher reduction potential, a second electron
transfer reaction converts the violet blue to the neutral charged and light yellow
colored methyl viologen ( , see: Equation 17). This second oxidation is irreversible,
due to the insolubility and decomposition of MV. MV readily forms an adsorbed solid
layer on working electrodes.
( ) (17)
A solution of 0.1 mM MV2+ in 100 mM KNO3 served as the analytical solution for this
experiment. The absorption spectrum of (see: Figure 5-2, green trace) was
acquired at a potential (0.0 V vs. Ag/AgCl) where there was no faradaic (reduction)
current. Notice the predominant absorbance peak for at 258 nm.
Upon a potential step to -1000 mV vs. Ag/AgCl, the absorption spectrum of (see:
Figure 5-2, blue trace) shows a substantial change as compared to the spectrum.
The potential step to -1000 mV vs. Ag/AgCl was sufficiently reductive to convert all the
within the diffusional limit (inside the holes of the Honeycomb electrode) to . Spectroscopically, this is evident by absence of the absorbance peak at 258 nm and
appearance of peaks at 394 nm and 604 nm, not observed in the spectrum.

31
DRU10004 (REV 001 / 7/2013)
The experimental system was assembled as previously described (see: Figure 4-5). Data
were acquired with 0.7 s integration time and 4 scans per spectrum using a UV-vis
spectrometer system (Ocean Optics USB4000), CUV sample holder, fiber optics of 400
mm core diameter, and DT-mini-2-GS light source (3.8 watts deuterium, 1.2 watts
tungsten halogen).
Figure 5-2. Absorption Spectra of Methyl Viologen and its Cation Radical.
5.2 Study of Ferricyanide/Ferrocyanide Equilibrium
Potassium Ferricyanide ( [ ] ) is a commonly available, inexpensive, and well-
behaved electrochemical redox chemical (see: Figure 5-3).
Figure 5-3. Structure of Potassium Ferricyanide.
The oxidized form is called ferricyanide, [ ( ) ] and the reduced form is called
ferrocyanide, [ ( ) ] . The ferri/ferrocyanide system is generally reversible and is
soluble in water. Ferricyanide undergoes a one electron reduction to ferrocyanide,

32
DRU10004 (REV 001 / 7/2013)
which corresponds to a visual color change as well, from yellow to optically transparent
(see: Equation 18).
[ ( ) ] [ ( ) ]
(18)
A solution of 0.1 mM [ ( ) ] in 100 mM served as the analytical solution for this
experiment. The absorption spectrum of [ ( ) ] (see: Figure 5-4, green trace) was
acquired at a potential (-700 mV vs. Ag/AgCl). At -700 mV, all [ ( ) ] within the
diffusional limit of the electrode was electrolyzed to the clear and colorless form, [ ( ) ]
. At this potential, no significant absorbance peaks are observed.
Upon a potential step to 800 mV vs. Ag/AgCl, the absorption spectrum of [ ( ) ]
(see: Figure 5-4, blue trace) shows a substantial change as compared to the [ ( ) ]
spectrum. The potential step to -1000 mV vs. Ag/AgCl was sufficiently
oxidative to convert any the [ ( ) ] to the pale yellow form, [ ( ) ]
.
Spectroscopically, this is evident by the appearance of an absorbance peak at 418
nm.
The experimental system was assembled as previously described (see: Figure 4-5). Data
were acquired with 0.7 s integration time and 4 scans per spectrum using a UV-vis
spectrometer system (Ocean Optics USB4000), CUV sample holder, fiber optics of 400
mm core diameter, and DT-mini-2-GS light source (3.8 watts deuterium, 1.2 watts
tungsten halogen).
Figure 5-4. Absorption Spectra of Ferricyanide and Ferrocyanide.

33
DRU10004 (REV 001 / 7/2013)
5.3 Measurement of Ferricyanide/Ferrocyanide Electrochemical
Kinetics
As discussed (see: Sections 3.4 and 5.2), the kinetics of ferricyanide/ferrocyanide can
be interrogated with spectroelectrochemical experiments. From typical absorbance
spectrum at reductive and oxidative overpotentials (see: Figure 5-4) the spectral
signature of of [ ( ) ] shows two significant peaks at 302 nm and 418 nm.
A Plot of Applied
Potential
Square potential wave applied to the electrochemical
cell. The dominant species of the redox pair is stated on
the curve.
B Absorbance vs. Time
at a fixed Wavelength
Fixed wavelength measure of absorbance vs. time,
which can be decoupled for kinetic data.
Figure 5-5. Absorbance Transients of Ferricyanide/Ferrocyanide Redox Species.
A
B
302 nm
[ ( ) ]
[ ( ) ]
[ ( ) ]
418 nm

34
DRU10004 (REV 001 / 7/2013)
To estimate the electron transfer kinetics of the ferricyanide reaction (see: Equation 18),
one must monitor absorbance vs. time at a fixed wavelength, during a potential step
experiment (see: Figure 5-5).
Because the electron transfer reaction is fast at a high overpotential, the decay in
absorbance is related to the electron transfer rate (see: Figure 5-5). In this experiment,
potential was held constant for 100 s (where absorbance was measured at both
wavelengths, 302 nm and 418 nm). Then, a potential step (see Figure 5-5, plot A)
stepped to 800 mV vs. Ag/AgCl. The potential step induced reduction of [ ( ) ] to
[ ( ) ] and a simultaneous decay in absorbance at both 302 nm and 418 nm (see
Figure 5-5, plot A).
The decay in absorbance begins to approach a zero slope after about 60 seconds.
Thus, the time to reach exhaustive electrolysis is about 60 seconds. Therefore, the
diffusional time can be estimated as 30 seconds.
5.4 Determination of Ferricyanide Standard Reduction Potential
From Section 3.4, the standard reduction potential for chemical species can be
determined with spectroelectrochemistry. As discussed in Section 5.2, the for
ferricyanide (260 mV vs. Ag/AgCl) is the potential about which faradaic current will
arise (oxidative current when and reductive current when ). From the
Nernst Equation (see: Equation 11) the ratio of ferricyanide concentration ([ ( ) ]
[ ]) to ferrocyanide concentration ([ ( ) ] [ ]) is a function of applied potential.
In a spectroelectrochemical setup, the ratio of ferrocyanide concentration ([ ]) to
ferrocyanide concentration ([ ]) relates to a change in optical absorbance, as a
function of applied potential (see: Equation 15).
Here, applied potential was first stepped to 400 mV vs. Ag/AgCl. 400 mV is significantly
oxidative of ; therefore, it is reasonable to have achieved exhaustive electrolysis and
all ferri/ferrocyanide in the honeycomb electrode should be in the [ ( ) ] form.
The Honeycomb cell was held at 400 mV vs. Ag/AgCl for approximately 1 minute, after
which time a UV-vis absorbance spectrum was obtained. From previous experiments
(see: Sections 5.2 - 5.3) the peak at 418 nm corresponds to [ ( ) ] . The rate of
ferrocyanide oxidation is higher at greater overpotential, where absorbance is high and
the time to reach exhaustive electrolysis is small. As overpotential decreases (applied
potential increases in a negative direction toward , absorbance at 418 nm also
decreases (see: Figure 5-6). These data confirm the relationship between the Nernstian
ratio, ([ ] [ ]), and optical absorbance (see: Equation 15 and 11).

35
DRU10004 (REV 001 / 7/2013)
Figure 5-6. Absorption Spectra of Ferricyanide at Different Applied Potential.
The absorbance value at 418 nm for each spectrum as a function of applied potential
is tabulated below (see: Table 5-4). A plot of applied potential vs. ([ ] [ ]) shows a
linear agreement (see: Figure 5-7), as predicted by the Nernst Equation (see: Equation
11). The y-intercept is 262.85, which agrees well with the reported standard reduction
potential for ferricyanide in 1 M KNO3 (263 mV vs. Ag/AgCl).
Absorbance Potential
(mV) [O]/[R] ln [O]/[R]
0.772 400 - -
0.736 350 20.3 3.01
0.584 300 3.85 1.35
0.431 275 1.41 0.34
0.259 250 0.544 -0.61
0.151 225 0.257 -1.36
0.091 200 0.142 -1.95
Table 5-4. Ferricyanide/Ferrocyanide Absorbance as a Function of Applied Potential.
418 nm

36
DRU10004 (REV 001 / 7/2013)
Figure 5-7. Linear Relationship between Applied Potential and Concentration.
6 Care and Storage
Do not Traditionally Polish the Honeycomb Electrode
The ceramic Honeycomb electrodes cannot be cleaned with traditional
electrode polishing methods that include aluminum oxide slurries. The
electrode will be damaged with alumina slurries.
The electrochemical cleaning method can remove trace organic impurities adsorbed
on the surface and is effective at removing a monolayer of impurity. Some
applications, such as protein electrochemistry, may require post-cleaning steps such as
chemical modification of the electrode surface to increase the heterogeneous
electron transfer rate.
Users have Reported More Aggressive Methods
Some users have reported to us that a more aggressive cleaning
protocol may be necessary to refresh the Honeycomb electrodes. The
reader is directed to the scientific literature to consider alternative
cleaning methods appropriate for glass/ceramic substrates with thin
metal tracings.

37
DRU10004 (REV 001 / 7/2013)
6.1 Cleaning the Honeycomb Electrodes
Caution! Sulfuric Acid is Corrosive!
Sulfuric Acid (H2SO4) is a corrosive acid. Wear appropriate personal
protective equipment when handling sulfuric acid. Wear gloves. Do not
get sulfuric acid in contact with your skin, eyes, or mucous membranes.
Rinse any affected area with copious running water.
With the electrochemical cleaning method, one can qualitatively assess whether or
not the surface is clean by reviewing the resultant cyclic voltammograms.
To electrochemically clean the Honeycomb electrode, follow these steps:
1. Prepare a solution of 0.5 M H2SO4.
2. Use the plastic pipette to fill the working electrode holes in the Honeycomb
electrode.
3. Place the electrode in a cell (or small beaker) filled with the sulfuric acid.
4. Perform cyclic voltammetry repeatedly with the parameters given in Table 6-1.
5. Continue to repeat CV segments until the electrode is clean (see below).
6. Remove the Honeycomb card from solution and rinse the working electrode
holes with DI water using the plastic pipette.
Parameter Gold
Honeycomb Electrode
Platinum
Honeycomb Electrode
Number of Segments At least 20* At least 20*
Initial Potential -375 mV -300 mV
Upper Potential 1800 mV 1700 mV
Lower Potential -375 mV -300 mV
Final Potential -375 mV -300 mV
Sweep Rate 500 mV/s 500 mV/s
Electrolyte 0.5 M H2SO4 0.5 M H2SO4
Table 6-1. Electrochemical Cleaning Parameters for Honeycomb Electrodes.
*Depending on the chemical nature of use, more segments may be required to regenerate the surface.
The number of segments (or repeated cyclic voltammograms) is variable and depends
on the condition of the Honeycomb electrode prior to cleaning. Start with the
parameters given (see: Table 6-1).
38
DRU10004 (REV 001 / 7/2013)
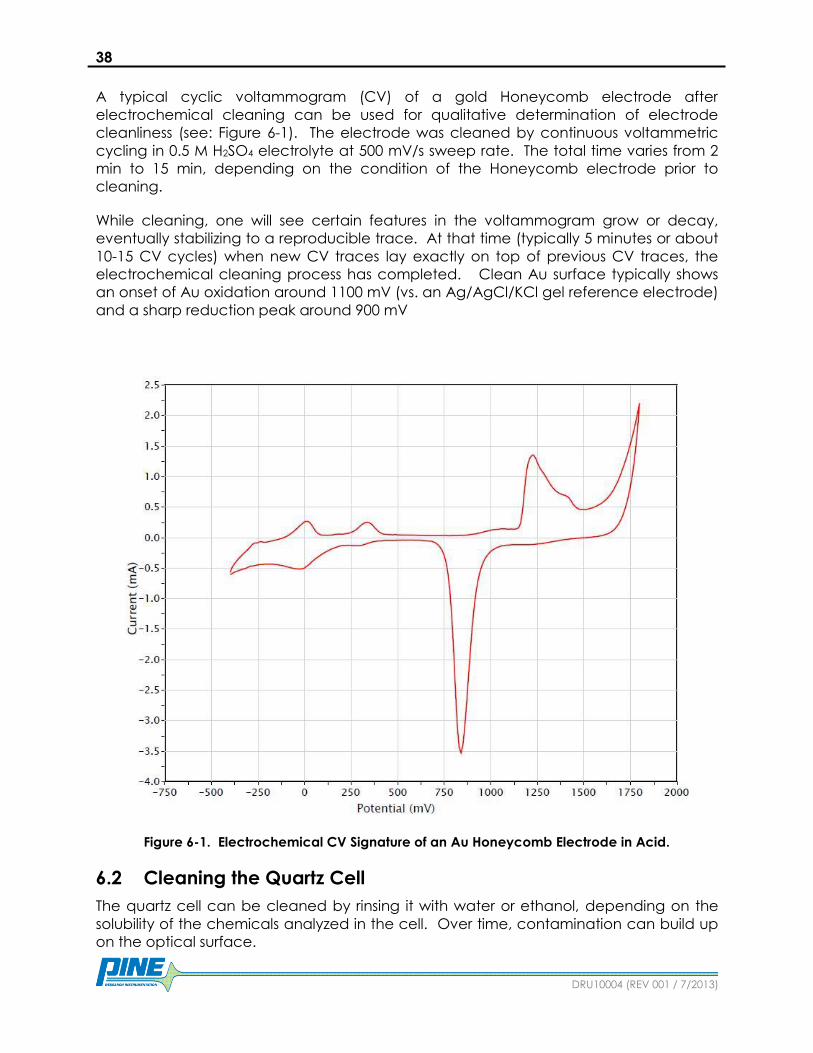
A typical cyclic voltammogram (CV) of a gold Honeycomb electrode after
electrochemical cleaning can be used for qualitative determination of electrode
cleanliness (see: Figure 6-1). The electrode was cleaned by continuous voltammetric
cycling in 0.5 M H2SO4 electrolyte at 500 mV/s sweep rate. The total time varies from 2
min to 15 min, depending on the condition of the Honeycomb electrode prior to
cleaning.
While cleaning, one will see certain features in the voltammogram grow or decay,
eventually stabilizing to a reproducible trace. At that time (typically 5 minutes or about
10-15 CV cycles) when new CV traces lay exactly on top of previous CV traces, the
electrochemical cleaning process has completed. Clean Au surface typically shows
an onset of Au oxidation around 1100 mV (vs. an Ag/AgCl/KCl gel reference electrode)
and a sharp reduction peak around 900 mV
Figure 6-1. Electrochemical CV Signature of an Au Honeycomb Electrode in Acid.
6.2 Cleaning the Quartz Cell
The quartz cell can be cleaned by rinsing it with water or ethanol, depending on the
solubility of the chemicals analyzed in the cell. Over time, contamination can build up
on the optical surface.

39
DRU10004 (REV 001 / 7/2013)
6.3 Cleaning the Cell Cap
The cap is made of PET plastic, and it can be cleaned by rinsing it with water or a
common organic solvent, followed by drying it under a stream of nitrogen or
compressed air.
6.4 Component Storage
All components should be cleaned and stored dry after each use.