hong kong sar - sigep · 95% of food supplies due to limited domestic production. ......
TRANSCRIPT

ITALIAN TRADE AGENCY ICE – Italian Trade Commission
Hong Kong Office
Suite 4001, Central Plaza Via Liszt 21, 00144 Roma, Italia 18 Harbour Road, Wanchai, Hong Kong T el : +39 0659921
T +852 28466500 F +852 28684779 www.ice.gov.it
[email protected] www.italtrade.com/hongkong Part. Iva 12020391004
Hong Kong SAR (Regione Amministrativa Speciale)
SIGEP 2018: Market Report
Aggiornamento: Dicembre 2017
Ufficio di Hong Kong
Suite 4001, Central Plaza
18 Harbour Road
Wanchai, Hong Kong
Telefono +852 2846 6500
Fax: +852 2868 4779
Email: [email protected]
www.ice.gov.it/paesi/asia/hongkong (italiano)
www.italtrade.com/hongkong (inglese)
www.italtrade.cn (中文)

ITALIAN TRADE AGENCY ICE – Italian Trade Commission
Hong Kong Office
Suite 4001, Central Plaza Via Liszt 21, 00144 Roma, Italia 18 Harbour Road, Wanchai, Hong Kong T el : +39 0659921
T +852 28466500 F +852 28684779 www.ice.gov.it
[email protected] www.italtrade.com/hongkong Part. Iva 12020391004
Throughout the years, Hong Kong companies have been purchasing large quantities of
imported food from abroad for both the local and mainland markets. Hong Kong imports over
95% of food supplies due to limited domestic production. It is one of the top markets in the
world for food and beverages, processed, fresh and frozen gourmet products. As the huge
demand of the mainland continues to grow, Hong Kong is well-position to become a
distribution and trading centre for imported food and beverage destined for China. Hong
Kong can also act as a product sale and market testing platform for foreign food companies
planning to develop the mainland market, and can formulate the right marketing and
promotional strategies for the products.
As just a brief note, there are roughly 400 bakery shops; more than 60 ice cream stores, and
more than 270 coffee shops in Hong Kong.
Hong Kong is one of the top markets in the world for food and beverages products. Many
Hong Kong food and beverages manufacturers deal directly with overseas importers and
supermarket chains. Hong Kong’s food and beverages trading companies have played a
pivotal role in introducing Western foods to mainland consumers, and in assisting smaller
producers based locally and on the Chinese mainland in selling abroad. Hong Kong also
serves as a trading hub for re-exports into mainland China, Macau and other neighboring
markets in Asia.
As shown in table 1, between January-July 2016, Hong Kong’s total exports of processed
food and beverages increased by 14%, reaching HK$33 billion. As illustrated in table 2,
Chinese mainland was the largest export market for Hong Kong’s processed food and
beverages (accounting for 38% of the total), followed by the Vietnam (26%). The food and
beverages industry in Hong Kong is largely related to re-export activities. These industry
players, in addition to importing and purchasing food and beverage from all over the world
for Hong Kong, have also contributed to turning Hong Kong into a trading centre for
processed food and beverage.

ITALIAN TRADE AGENCY ICE – Italian Trade Commission
Hong Kong Office
Suite 4001, Central Plaza Via Liszt 21, 00144 Roma, Italia 18 Harbour Road, Wanchai, Hong Kong T el : +39 0659921
T +852 28466500 F +852 28684779 www.ice.gov.it
[email protected] www.italtrade.com/hongkong Part. Iva 12020391004
Table 1 Performance of Hong Kong's Exports of Processed Food and Beverages, source: HKTDC
Table 2 Performance of Hong Kong's Exports of Processed Food and Beverages by Markets, source: HKTDC

ITALIAN TRADE AGENCY ICE – Italian Trade Commission
Hong Kong Office
Suite 4001, Central Plaza Via Liszt 21, 00144 Roma, Italia 18 Harbour Road, Wanchai, Hong Kong T el : +39 0659921
T +852 28466500 F +852 28684779 www.ice.gov.it
[email protected] www.italtrade.com/hongkong Part. Iva 12020391004
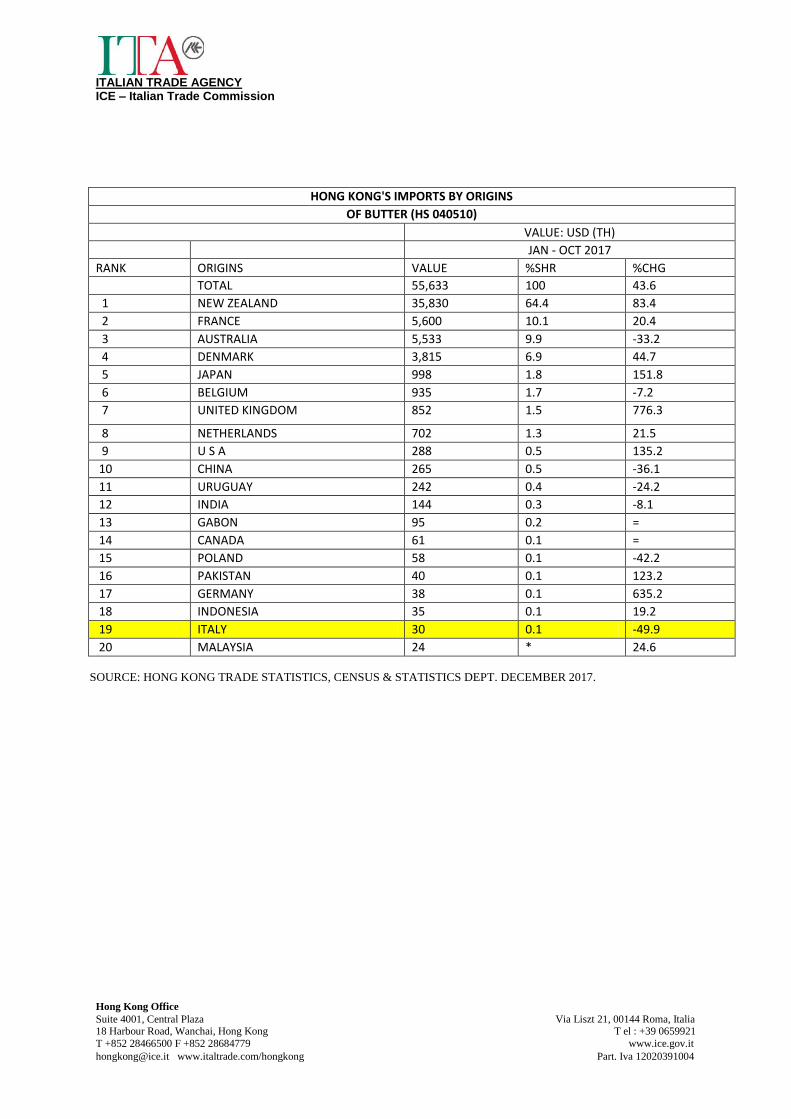
1. Ingredients (Ingredients for ice cream parlors, bakeries and catering
of confectionaries)
HONG KONG'S IMPORTS BY ORIGINS
OF BUTTER (HS 040510)
VALUE: USD (TH)
- 2014 - - 2015 - - 2016 -
RANK ORIGINS VALUE %SHR %CHG VALUE %SHR %CHG VALUE %SHR %CHG
TOTAL 55,353 100 21.2 49,720 100 -10.2 50,768 100 2.1
1 NEW ZEALAND 28,127 50.8 46.1 26,395 53.1 -6.2 27,717 54.6 5
2 FRANCE 5,331 9.6 44.9 4,812 9.7 -9.7 5,601 11 16.4
3 AUSTRALIA 13,162 23.8 6.6 10,509 21.1 -20.2 9,566 18.8 -9
4 DENMARK 4,656 8.4 13.2 4,249 8.5 -8.8 3,441 6.8 -19
5 JAPAN 252 0.5 -16.1 634 1.3 151.6 550 1.1 -13.3
6 BELGIUM 987 1.8 -61.6 214 0.4 -78.3 1,065 2.1 398
7 UNITED KINGDOM
47 0.1 5 156 0.3 228.5 108 0.2 -30.7
8 NETHERLANDS 661 1.2 -42.1 570 1.1 -13.8 630 1.2 10.6
9 U S A 383 0.7 -41.1 483 1 25.9 170 0.3 -64.8
10 CHINA 716 1.3 333.6 360 0.7 -49.7 695 1.4 93
11 URUGUAY 81 0.1 9.9 344 0.7 323.6 393 0.8 14.5
12 INDIA 246 0.4 203.8 146 0.3 -40.7 160 0.3 9.4
13 GABON - - - - - - - - -
14 CANADA 6 * = 90 0.2 .. - - -100
15 POLAND 99 0.2 = 47 0.1 -52.1 101 0.2 113.4
16 PAKISTAN 75 0.1 22.9 61 0.1 -18.2 26 0.1 -57.4
17 GERMANY 158 0.3 -69.5 3 * -97.8 5 * 50.8
18 INDONESIA 19 * -86.3 37 0.1 97.3 31 0.1 -16.4
19 ITALY 44 0.1 -70.2 40 0.1 -8.9 65 0.1 61.1
20 MALAYSIA - - -100 - - - 34 0.1 =
SOURCE: HONG KONG TRADE STATISTICS, CENSUS & STATISTICS DEPT. DECEMBER 2017.
ITALIAN TRADE AGENCY ICE – Italian Trade Commission
Hong Kong Office
Suite 4001, Central Plaza Via Liszt 21, 00144 Roma, Italia 18 Harbour Road, Wanchai, Hong Kong T el : +39 0659921
T +852 28466500 F +852 28684779 www.ice.gov.it
[email protected] www.italtrade.com/hongkong Part. Iva 12020391004
HONG KONG'S IMPORTS BY ORIGINS
OF BUTTER (HS 040510)
VALUE: USD (TH)
JAN - OCT 2017
RANK ORIGINS VALUE %SHR %CHG TOTAL 55,633 100 43.6
1 NEW ZEALAND 35,830 64.4 83.4
2 FRANCE 5,600 10.1 20.4
3 AUSTRALIA 5,533 9.9 -33.2
4 DENMARK 3,815 6.9 44.7
5 JAPAN 998 1.8 151.8
6 BELGIUM 935 1.7 -7.2
7 UNITED KINGDOM 852 1.5 776.3
8 NETHERLANDS 702 1.3 21.5
9 U S A 288 0.5 135.2
10 CHINA 265 0.5 -36.1
11 URUGUAY 242 0.4 -24.2
12 INDIA 144 0.3 -8.1
13 GABON 95 0.2 =
14 CANADA 61 0.1 =
15 POLAND 58 0.1 -42.2
16 PAKISTAN 40 0.1 123.2
17 GERMANY 38 0.1 635.2
18 INDONESIA 35 0.1 19.2
19 ITALY 30 0.1 -49.9
20 MALAYSIA 24 * 24.6
SOURCE: HONG KONG TRADE STATISTICS, CENSUS & STATISTICS DEPT. DECEMBER 2017.

ITALIAN TRADE AGENCY ICE – Italian Trade Commission
Hong Kong Office
Suite 4001, Central Plaza Via Liszt 21, 00144 Roma, Italia 18 Harbour Road, Wanchai, Hong Kong T el : +39 0659921
T +852 28466500 F +852 28684779 www.ice.gov.it
[email protected] www.italtrade.com/hongkong Part. Iva 12020391004
HONG KONG'S IMPORTS BY ORIGINS
OF FLOUR OF WHEAT OR OF MESLIN (SITC 04610)
VALUE: USD (TH)
- 2014 - - 2015 - - 2016 -
RANK ORIGINS VALUE %SHR %CHG VALUE %SHR %CHG VALUE %SHR %CHG TOTAL 117,872 100 -3.4 118,256 100 0.3 107,904 100 -8.8
1 CHINA 62,042 52.6 -11.6 60,849 51.5 -1.9 48,286 44.7 -20.6
2 JAPAN 21,854 18.5 -5 21,924 18.5 0.3 24,324 22.5 10.9
3 TAIWAN 10,327 8.8 19 11,128 9.4 7.8 11,536 10.7 3.7
4 VIETNAM 6,448 5.5 26.8 6,573 5.6 1.9 6,032 5.6 -8.2
5 KOREA REP 2,048 1.7 99.4 2,885 2.4 40.9 2,608 2.4 -9.6
6 SINGAPORE 4,319 3.7 62.4 3,454 2.9 -20 3,073 2.8 -11
7 THAILAND 2,594 2.2 3.8 2,134 1.8 -17.7 2,166 2 1.5
8 PHILIPPINES - - - 340 0.3 = 1,331 1.2 291.5
9 INDIA 1,111 0.9 11 1,317 1.1 18.6 1,688 1.6 28.2
10 SRI LANKA 3,080 2.6 -17.1 2,069 1.7 -32.8 1,827 1.7 -11.7
11 AUSTRALIA 490 0.4 39.5 794 0.7 62 1,274 1.2 60.3
12 CANADA 1,183 1 -21.2 1,058 0.9 -10.6 926 0.9 -12.5
13 FRANCE 337 0.3 110.1 433 0.4 28.2 449 0.4 3.7
14 UNITED KINGDOM
621 0.5 91.6 575 0.5 -7.5 680 0.6 18.3
15 ITALY 437 0.4 19.3 624 0.5 42.8 442 0.4 -29.1
16 INDONESIA 234 0.2 -22.8 163 0.1 -30.5 129 0.1 -21
17 PORTUGAL - - - - - - 181 0.2 =
18 TURKEY 185 0.2 -73.2 413 0.3 123.1 315 0.3 -23.7
19 U S A 276 0.2 75.3 631 0.5 128.9 242 0.2 -61.6
20 NEW ZEALAND - - -100 14 * = 42 * 201.8
SOURCE: HONG KONG TRADE STATISTICS, CENSUS & STATISTICS DEPT. DECEMBER 2017.

ITALIAN TRADE AGENCY ICE – Italian Trade Commission
Hong Kong Office
Suite 4001, Central Plaza Via Liszt 21, 00144 Roma, Italia 18 Harbour Road, Wanchai, Hong Kong T el : +39 0659921
T +852 28466500 F +852 28684779 www.ice.gov.it
[email protected] www.italtrade.com/hongkong Part. Iva 12020391004
HONG KONG'S IMPORTS BY ORIGINS
OF FLOUR OF WHEAT OR OF MESLIN (SITC 04610)
VALUE: USD (TH)
JAN - OCT 2017
RANK ORIGINS VALUE %SHR %CHG TOTAL 87,296 100 -1.9
1 CHINA 35,183 40.3 -12.6
2 JAPAN 22,683 26 15.1
3 TAIWAN 8,650 9.9 -9.4
4 VIETNAM 5,548 6.4 10.9
5 KOREA REP 2,922 3.3 34.4
6 SINGAPORE 2,194 2.5 -14.4
7 THAILAND 1,836 2.1 2.6
8 PHILIPPINES 1,440 1.6 42.8
9 INDIA 1,435 1.6 1.2
10 SRI LANKA 977 1.1 -38.1
11 AUSTRALIA 957 1.1 -7.1
12 CANADA 711 0.8 -2.2
13 FRANCE 552 0.6 61.5
14 UNITED KINGDOM 489 0.6 -17
15 ITALY 463 0.5 28.4
16 INDONESIA 279 0.3 161.2
17 PORTUGAL 230 0.3 64.5
18 TURKEY 211 0.2 -17.5
19 U S A 183 0.2 73.4
20 NEW ZEALAND 94 0.1 197.9
SOURCE: HONG KONG TRADE STATISTICS, CENSUS & STATISTICS DEPT. DECEMBER 2017.

ITALIAN TRADE AGENCY ICE – Italian Trade Commission
Hong Kong Office
Suite 4001, Central Plaza Via Liszt 21, 00144 Roma, Italia 18 Harbour Road, Wanchai, Hong Kong T el : +39 0659921
T +852 28466500 F +852 28684779 www.ice.gov.it
[email protected] www.italtrade.com/hongkong Part. Iva 12020391004
HONG KONG'S IMPORTS BY ORIGINS
OF SALT(INCLUDING TABLE SALT AND DENATURED SALT)AND PURE SODIUMCHLORIDE,WHETHER OR NOT IN AQUEOUS SOLUTION;SEA WATER. (HS 2501)
VALUE: USD (TH)
- 2014 - - 2015 - - 2016 -
RANK ORIGINS VALUE %SHR %CHG VALUE %SHR %CHG VALUE %SHR %CHG TOTAL 6,715 100 5.3 6,390 100 -4.8 6,849 100 7.2
1 CHINA 3,348 49.9 -11.8 3,346 52.4 -0.1 3,536 51.6 5.7
2 SPAIN 24 0.4 35.6 17 0.3 -28.8 16 0.2 -6.8
3 U S A 722 10.8 30.8 554 8.7 -23.3 671 9.8 21.1
4 NEW ZEALAND 308 4.6 46.4 242 3.8 -21.3 351 5.1 44.9
5 JAPAN 440 6.6 4.4 283 4.4 -35.6 451 6.6 59.2
6 MALAYSIA 48 0.7 -27.6 291 4.6 506.2 387 5.7 32.9
7 AUSTRALIA 600 8.9 40.3 466 7.3 -22.3 357 5.2 -23.5
8 PAKISTAN 36 0.5 150.1 19 0.3 -46.4 96 1.4 399.7
9 UNITED KINGDOM
217 3.2 60.9 301 4.7 38.9 239 3.5 -20.8
10 ITALY 193 2.9 164.1 184 2.9 -4.5 118 1.7 -36
11 GERMANY 113 1.7 -0.4 100 1.6 -11.4 79 1.2 -20.6
12 KOREA REP 51 0.8 64.7 71 1.1 37.7 89 1.3 26.1
13 FRANCE 149 2.2 103 134 2.1 -9.8 112 1.6 -16.5
14 NETHERLANDS 82 1.2 42.7 50 0.8 -38.2 57 0.8 12.8
15 THAILAND 39 0.6 -12.1 36 0.6 -7.7 61 0.9 69.3
16 BELGIUM 51 0.8 -62.6 39 0.6 -23.9 43 0.6 12.1
17 TAIWAN 113 1.7 62.3 113 1.8 -0.1 65 1 -42
18 INDIA 138 2 11.8 42 0.7 -69.2 7 0.1 -82.3
19 SINGAPORE 1 * -66.8 9 0.1 644.3 7 0.1 -14.4
20 SOUTH AFRICA - - - - - - - - -
SOURCE: HONG KONG TRADE STATISTICS, CENSUS & STATISTICS DEPT. DECEMBER 2017.
ITALIAN TRADE AGENCY ICE – Italian Trade Commission
Hong Kong Office
Suite 4001, Central Plaza Via Liszt 21, 00144 Roma, Italia 18 Harbour Road, Wanchai, Hong Kong T el : +39 0659921
T +852 28466500 F +852 28684779 www.ice.gov.it
[email protected] www.italtrade.com/hongkong Part. Iva 12020391004
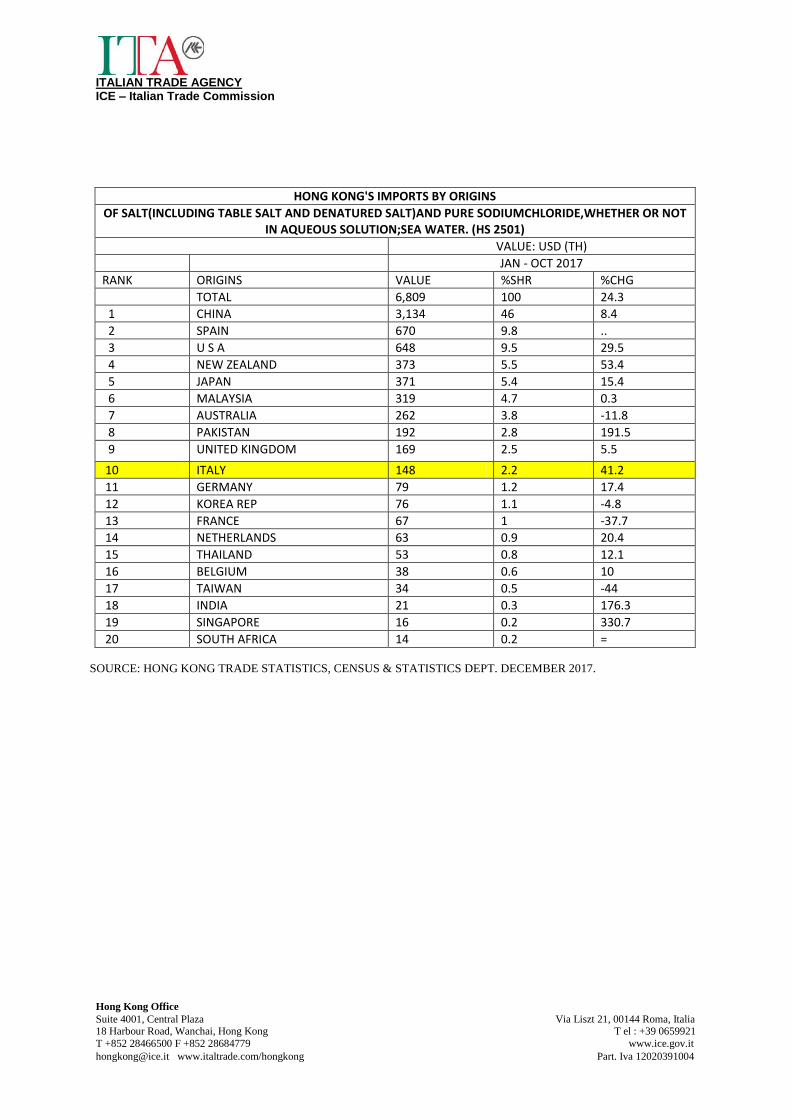
HONG KONG'S IMPORTS BY ORIGINS
OF SALT(INCLUDING TABLE SALT AND DENATURED SALT)AND PURE SODIUMCHLORIDE,WHETHER OR NOT IN AQUEOUS SOLUTION;SEA WATER. (HS 2501)
VALUE: USD (TH) JAN - OCT 2017
RANK ORIGINS VALUE %SHR %CHG TOTAL 6,809 100 24.3
1 CHINA 3,134 46 8.4
2 SPAIN 670 9.8 ..
3 U S A 648 9.5 29.5
4 NEW ZEALAND 373 5.5 53.4
5 JAPAN 371 5.4 15.4
6 MALAYSIA 319 4.7 0.3
7 AUSTRALIA 262 3.8 -11.8
8 PAKISTAN 192 2.8 191.5
9 UNITED KINGDOM 169 2.5 5.5
10 ITALY 148 2.2 41.2
11 GERMANY 79 1.2 17.4
12 KOREA REP 76 1.1 -4.8
13 FRANCE 67 1 -37.7
14 NETHERLANDS 63 0.9 20.4
15 THAILAND 53 0.8 12.1
16 BELGIUM 38 0.6 10
17 TAIWAN 34 0.5 -44
18 INDIA 21 0.3 176.3
19 SINGAPORE 16 0.2 330.7
20 SOUTH AFRICA 14 0.2 =
SOURCE: HONG KONG TRADE STATISTICS, CENSUS & STATISTICS DEPT. DECEMBER 2017.

ITALIAN TRADE AGENCY ICE – Italian Trade Commission
Hong Kong Office
Suite 4001, Central Plaza Via Liszt 21, 00144 Roma, Italia 18 Harbour Road, Wanchai, Hong Kong T el : +39 0659921
T +852 28466500 F +852 28684779 www.ice.gov.it
[email protected] www.italtrade.com/hongkong Part. Iva 12020391004
HONG KONG'S IMPORTS BY ORIGINS
OF SUGAR SYRUPS CONTAINING ADDED FLAVOURING OR COLOURING MATTER (94 KG) (HS 21069030)
VALUE: USD (TH)
- 2014 - - 2015 - - 2016 -
RANK ORIGINS VALUE %SHR %CHG VALUE %SHR %CHG VALUE %SHR %CHG
TOTAL 9,468 100 10.6 10,578 100 11.7 11,968 100 13.1
1 MALAYSIA 2,375 25.1 22.4 3,090 29.2 30.1 3,466 29 12.2
2 TAIWAN 1,334 14.1 30.8 1,556 14.7 16.7 2,508 21 61.1
3 U S A 1,917 20.2 -5.6 1,159 11 -39.6 1,103 9.2 -4.8
4 INDONESIA 1,270 13.4 2.7 1,275 12.1 0.4 1,314 11 3.1
5 CHINA 1,318 13.9 -2 2,601 24.6 97.2 2,497 20.9 -4
6 KOREA REP 253 2.7 316.5 198 1.9 -21.7 159 1.3 -19.8
7 ITALY 406 4.3 44.1 237 2.2 -41.6 275 2.3 15.8
8 JAPAN 58 0.6 47.6 79 0.8 37.4 171 1.4 115.6
9 PHILIPPINES 34 0.4 -71.1 - - -100 61 0.5 =
10 FRANCE 161 1.7 4.5 66 0.6 -58.9 117 1 76.8
11 SINGAPORE 60 0.6 -4.4 28 0.3 -54 34 0.3 22.3
12 SPAIN 47 0.5 76.3 11 0.1 -75.6 * * -98.5
13 UNITED KINGDOM
59 0.6 137.8 53 0.5 -9.9 29 0.2 -45
14 PAKISTAN - - - 30 0.3 = - - -100
15 INDIA 42 0.4 583 62 0.6 46.9 9 0.1 -84.9
16 THAILAND 19 0.2 132.6 10 0.1 -45.1 74 0.6 622.7
17 SWEDEN 2 * = 10 0.1 508 6 0.1 -39.3
18 NETHERLANDS - - - - - - 19 0.2 =
19 NEW ZEALAND
32 0.3 = 6 0.1 -79.9 15 0.1 129
20 CZECH REP - - - - - - - - -
SOURCE: HONG KONG TRADE STATISTICS, CENSUS & STATISTICS DEPT. DECEMBER 2017.
ITALIAN TRADE AGENCY ICE – Italian Trade Commission
Hong Kong Office
Suite 4001, Central Plaza Via Liszt 21, 00144 Roma, Italia 18 Harbour Road, Wanchai, Hong Kong T el : +39 0659921
T +852 28466500 F +852 28684779 www.ice.gov.it
[email protected] www.italtrade.com/hongkong Part. Iva 12020391004
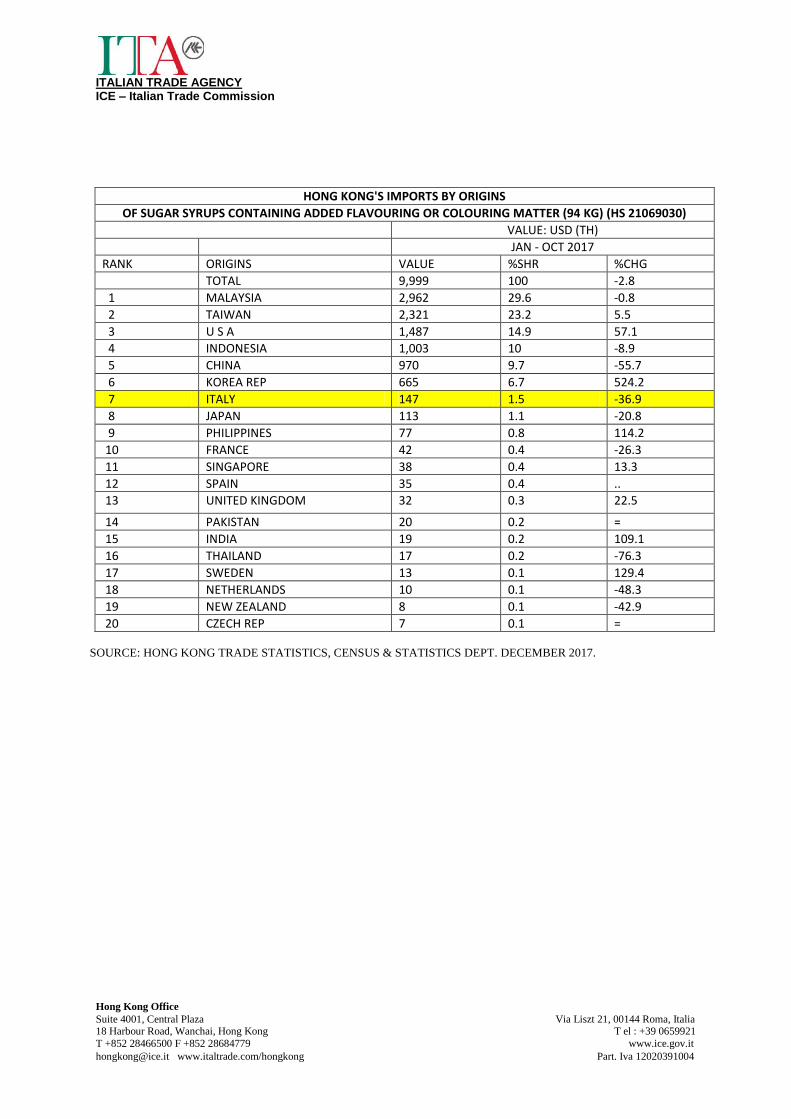
HONG KONG'S IMPORTS BY ORIGINS
OF SUGAR SYRUPS CONTAINING ADDED FLAVOURING OR COLOURING MATTER (94 KG) (HS 21069030) VALUE: USD (TH) JAN - OCT 2017
RANK ORIGINS VALUE %SHR %CHG TOTAL 9,999 100 -2.8
1 MALAYSIA 2,962 29.6 -0.8
2 TAIWAN 2,321 23.2 5.5
3 U S A 1,487 14.9 57.1
4 INDONESIA 1,003 10 -8.9
5 CHINA 970 9.7 -55.7
6 KOREA REP 665 6.7 524.2
7 ITALY 147 1.5 -36.9
8 JAPAN 113 1.1 -20.8
9 PHILIPPINES 77 0.8 114.2
10 FRANCE 42 0.4 -26.3
11 SINGAPORE 38 0.4 13.3
12 SPAIN 35 0.4 ..
13 UNITED KINGDOM 32 0.3 22.5
14 PAKISTAN 20 0.2 =
15 INDIA 19 0.2 109.1
16 THAILAND 17 0.2 -76.3
17 SWEDEN 13 0.1 129.4
18 NETHERLANDS 10 0.1 -48.3
19 NEW ZEALAND 8 0.1 -42.9
20 CZECH REP 7 0.1 =
SOURCE: HONG KONG TRADE STATISTICS, CENSUS & STATISTICS DEPT. DECEMBER 2017.

ITALIAN TRADE AGENCY ICE – Italian Trade Commission
Hong Kong Office
Suite 4001, Central Plaza Via Liszt 21, 00144 Roma, Italia 18 Harbour Road, Wanchai, Hong Kong T el : +39 0659921
T +852 28466500 F +852 28684779 www.ice.gov.it
[email protected] www.italtrade.com/hongkong Part. Iva 12020391004
HONG KONG'S IMPORTS BY ORIGINS
OF SUGARS AND SUGAR CONFECTIONERY (HS 17)
VALUE: USD (TH)
- 2014 - - 2015 - - 2016 -
RANK ORIGINS VALUE %SHR %CHG VALUE %SHR %CHG VALUE %SHR %CHG TOTAL 330,157 100 -1 338,546 100 2.5 320,100 100 -5.4
1 CHINA 71,181 21.6 -0.9 64,375 19 -9.6 63,294 19.8 -1.7
2 JAPAN 53,409 16.2 1 67,107 19.8 25.6 68,577 21.4 2.2
3 KOREA REP 61,521 18.6 -2.1 48,297 14.3 -21.5 51,670 16.1 7
4 THAILAND 32,609 9.9 1.8 38,189 11.3 17.1 29,678 9.3 -22.3
5 MALAYSIA 21,576 6.5 -12.1 16,803 5 -22.1 17,566 5.5 4.5
6 U S A 20,757 6.3 -9.3 24,353 7.2 17.3 21,202 6.6 -12.9
7 TAIWAN 8,558 2.6 -11.5 8,652 2.6 1.1 9,526 3 10.1
8 GERMANY 15,416 4.7 14.6 12,577 3.7 -18.4 11,096 3.5 -11.8
9 UNITED KINGDOM
6,166 1.9 -12.4 7,210 2.1 16.9 7,263 2.3 0.7
10 AUSTRALIA 4,016 1.2 -8.3 5,030 1.5 25.3 6,728 2.1 33.7
11 SWITZERLAND 8,497 2.6 5.6 7,804 2.3 -8.2 5,604 1.8 -28.2
12 NEW ZEALAND 1,227 0.4 -6.9 3,505 1 185.7 4,427 1.4 26.3
13 ITALY 4,024 1.2 18.7 3,610 1.1 -10.3 3,325 1 -7.9
14 TURKEY 842 0.3 84.6 1,661 0.5 97.4 1,463 0.5 -12
15 INDONESIA 3,181 1 -0.4 2,280 0.7 -28.3 2,739 0.9 20.1
16 CANADA 1,670 0.5 -18.8 1,891 0.6 13.2 2,192 0.7 15.9
17 NETHERLANDS 1,848 0.6 -22.3 3,386 1 83.2 2,531 0.8 -25.3
18 VIETNAM 1,445 0.4 62.5 1,334 0.4 -7.7 1,405 0.4 5.3
19 MACAU SAR 1,463 0.4 154.2 1,309 0.4 -10.6 1,192 0.4 -8.9
20 INDIA 875 0.3 6.5 866 0.3 -1 1,030 0.3 19
SOURCE: HONG KONG TRADE STATISTICS, CENSUS & STATISTICS DEPT. DECEMBER 2017.

ITALIAN TRADE AGENCY ICE – Italian Trade Commission
Hong Kong Office
Suite 4001, Central Plaza Via Liszt 21, 00144 Roma, Italia 18 Harbour Road, Wanchai, Hong Kong T el : +39 0659921
T +852 28466500 F +852 28684779 www.ice.gov.it
[email protected] www.italtrade.com/hongkong Part. Iva 12020391004
HONG KONG'S IMPORTS BY ORIGINS
OF SUGARS AND SUGAR CONFECTIONERY (HS 17)
VALUE: USD (TH)
JAN - OCT 2017
RANK ORIGINS VALUE %SHR %CHG TOTAL 260,410 100 3.6
1 CHINA 52,865 20.3 5.5
2 JAPAN 47,697 18.3 -10.8
3 KOREA REP 45,877 17.6 10.4
4 THAILAND 26,367 10.1 9.7
5 MALAYSIA 18,553 7.1 37.7
6 U S A 15,651 6 6.2
7 TAIWAN 10,188 3.9 45.6
8 GERMANY 8,774 3.4 -3.7
9 UNITED KINGDOM 6,339 2.4 7.6
10 AUSTRALIA 4,017 1.5 -25.6
11 SWITZERLAND 3,433 1.3 -26.6
12 NEW ZEALAND 3,096 1.2 -19.8
13 ITALY 2,061 0.8 -24.2
14 TURKEY 1,968 0.8 73.3
15 INDONESIA 1,946 0.7 -2.6
16 CANADA 1,883 0.7 18.9
17 NETHERLANDS 1,830 0.7 2.6
18 VIETNAM 1,055 0.4 -0.2
19 MACAU SAR 934 0.4 1.8
20 INDIA 862 0.3 -3.4
SOURCE: HONG KONG TRADE STATISTICS, CENSUS & STATISTICS DEPT. DECEMBER 2017.

ITALIAN TRADE AGENCY ICE – Italian Trade Commission
Hong Kong Office
Suite 4001, Central Plaza Via Liszt 21, 00144 Roma, Italia 18 Harbour Road, Wanchai, Hong Kong T el : +39 0659921
T +852 28466500 F +852 28684779 www.ice.gov.it
[email protected] www.italtrade.com/hongkong Part. Iva 12020391004
1.1 Certifications required by Hong Kong SAR
Mode / organizations
The Food and Environmental Hygiene Department of the Government of the Hong
Kong Special Administrative Region
Centre for Food Safety of the Government of the Hong Kong Special Administrative
Region
Under the Public Health and Municipal Services Ordinance, there are specific legal
requirements for the import of perishable or high-risk food namely, meat, milk, frozen
confections and marine products. In general, the control process involves a pre-entry import
licensing system, verification of health certificates and prior approval of source of
manufacture. In other words, local importers are required to apply for import permits, while
overseas exporters need to supply their agents or importers with necessary documentation
such as health certificates from their own government.
For importing ice cream/ frozen confection:
Food and Environmental Hygiene Department of the Government of the Hong Kong Special
Administrative Region is responsible for implementing territory-wide policies of food safety
control and enforcing the food legislation.
(a) The full name and address of the frozen confection processing plant;
(b) The law of the country of origin governing the production of frozen confections;
(c) Empty containers or wrappers of the frozen confection with labels;
(d) Information on the heat treatment method of the frozen confection and facilities, including
production equipment and water supply, in the processing plant;
(e) A certificate from an appropriate authority in the country of origin for the purpose of -
Certifying the effectiveness and efficiency of the heat treatment method in sterilizing the
frozen confection and that the products have been handled, processed and packed under
hygienic conditions
Showing the chemical and bacteriological quality of the products; and
(f) Details of ingredients, including colouring matters, stablisers and sweeting agents, etc.,
and their amount in the frozen confection.
For other imported food:
Food importers, through close liaison with exporting countries, are responsible for ensuring
that food items they procure comply with the local legislation. To help ensure hygienic
standards of food, importers are encouraged to obtain health certificates issued by health
authorities of countries of origin to accompany their imports certifying that the food products
concerned are fit for human consumption.
You should also follow the food legislation and guidelines.
The basic food law in Hong Kong is laid down in Part V of the Public Health and Municipal
Services Ordinance (Cap. 132). The main provisions cover general protection for food

ITALIAN TRADE AGENCY ICE – Italian Trade Commission
Hong Kong Office
Suite 4001, Central Plaza Via Liszt 21, 00144 Roma, Italia 18 Harbour Road, Wanchai, Hong Kong T el : +39 0659921
T +852 28466500 F +852 28684779 www.ice.gov.it
[email protected] www.italtrade.com/hongkong Part. Iva 12020391004
purchasers, offences in connection with sale of unfit food and adulterated food, composition
and labeling of food, food hygiene, seizure and destruction of unfit food.
Another food law in Hong Kong, the Food Safety Ordinance (Cap. 612), provides new food
safety control measures, including a registration scheme for food importers and food
distributors and a requirement for food traders to maintain proper records of the movements
of food to enhance food traceability. It also empowers the authorities to make regulations for
tightening import control on specific food types and to make orders to prohibit the import and
supply of problem food and order the recall of such food.
Labeling requirements:
All prepackaged food for sale in Hong Kong, whether imported or manufactured locally,
should comply with the mandatory nutrition labeling scheme and be marked and labeled
appropriately. It requires the food information of energy and seven specified nutrients to be
listed on food labels, namely, protein, carbohydrates, total fat, saturated fat, trans fat, sodium
and sugars.
1.2 Trends and opportunities
In recent decades, consumers tend to focus more on organic products, healthy (low-fat) food
products. Increasingly, responsible and health-conscious parents have been switching to
organic foods for their kids even if it's more costly.
Furthermore, Hong Kong now develops a new trend of home cooking. Hectic city dwellers
are usually burdened by enormous work pressures. However, cooking class now becomes a
popular choice, for example: dessert class, bakery class, Chinese and western cuisines class.
Attending cooking class nowadays is a fun and leisure hobby. Those with myriad affairs to
attend discover that preparing delicious dishes can be developed into a lifetime interest that
also relaxes their minds during the process.
Also, with the advent of bread machine and all the food process machines, people in Hong
Kong now enjoy and prefer cooking and preparing food with good quality ingredients at
home. Responsible and health-conscious parents have been switching to organic foods for
their kids even if it's more costly.
Various food safety issues raised consumers’ concerns about their daily food intake. They
were increasingly aware about the composition of processed food and beverages, as they
sought to minimise their consumption of chemical additives. These factors also impacted
consumer choice of health and wellness products during. Consumers were increasingly
turning to naturally healthy and organic variants as an alternative to the usual better for you
products.

ITALIAN TRADE AGENCY ICE – Italian Trade Commission
Hong Kong Office
Suite 4001, Central Plaza Via Liszt 21, 00144 Roma, Italia 18 Harbour Road, Wanchai, Hong Kong T el : +39 0659921
T +852 28466500 F +852 28684779 www.ice.gov.it
[email protected] www.italtrade.com/hongkong Part. Iva 12020391004
Foods categorized as natural and beneficial to health are fit with local consumers’ taste and
preference. The purchase of organic food is expecting to be a major trend in Hong Kong’s
food and beverage market. Local consumers are being more conscious on food safety issues
and nutrition values of food products, and demanding for safe, organic and health food
products. Consumers today prefer transparency in all products that they purchased. They are
more likely to consume products with clear indications and labels of nutritional value on the
package for health foods. There is positive perception of European countries as a supplier of
fresh, quality and safe products in the market.
As a result of the ageing population, consumers are seeking easy-to-prepare, high quality
nutritional foods to compensate for their lowered taste sensitivity. Food manufacturers are
introducing low carbohydrate or added sugar foods. The slimness culture in Hong Kong has
also given rise to the development of “dietary foods” that contain added fibre to make the
food more filling and delay digestion.
As consumers become more demanding in terms of food diversification and safety, product
segmentation in the food market is expected to become increasingly prevalent, leading to the
creation of distinct brands. At present, the battle is to establish those brands, with mid- to
high-end consumers expected to demonstrate a significant loyalty to companies that embody
the premium end of the sector.
Ice Cream and Frozen Desserts Market in Hong Kong
With the rapid advertising from retailers, the sales of ice cream retained a steady growth in
the market. Single portion dairy ice cream is the most common type of purchase as impulse
ice cream can be easily bought via local stores. In terms of local consumers’ taste, chocolate
coated vanilla ice cream or plain vanilla ice creams are the most popular. Various fruit or
green tea flavours offered by Japanese and Korean brands are also well-received by local
consumers. While ice cream sticks is more favourable over cone for Hong Kong consumers,
the mixture of outer chocolate layer, nuts within and ice cream inside is considered to be a
perfect match for many local consumers.
Coffee Market in Hong Kong
Driven by rising coffee culture, the coffee market is continued to grow in Hong Kong’s
market. With an increasing number of large chain coffee stores and personalized cafes, Hong
Kong is under growing popularity in coffee culture. Since coffee drinking seems as a
fashionable lifestyle among teenagers, the market segment has been enlarged to the younger
population. Sophisticated consumers are demanding for higher quality of food and beverage.
They are more likely to brew their preferred coffee at home and office. Consumers are likely
to own coffee machine for single-serve purpose. The most sought after machines for buyers
today are the higher-priced, single-serve, capsule-based varieties. As a result, the
consumption of coffee capsule was still big in 2017.

ITALIAN TRADE AGENCY ICE – Italian Trade Commission
Hong Kong Office
Suite 4001, Central Plaza Via Liszt 21, 00144 Roma, Italia 18 Harbour Road, Wanchai, Hong Kong T el : +39 0659921
T +852 28466500 F +852 28684779 www.ice.gov.it
[email protected] www.italtrade.com/hongkong Part. Iva 12020391004
Chocolate Market in Hong Kong
Chocolates are increasingly experimenting with new ingredients and flavors to meet changing
local consumer needs. They are also innovating new confectionery products, which have
reduced sugar and fat levels for health-conscious people. Innovation in the confectionery
market has eliminated the addition of ingredients and additives containing high sugar. Instead,
sugar-free products have been introduced in a bid to improve the health of the
consumers. Besides, the hot and humid climate from July till September in Hong Kong is a
major challenge to chocolate industry players. To retain consumers in hot seasons, some
chocolate shops serve drinks or ice cream to provide a variety of choices.
Bakery & Pastry Market in Hong Kong
Due to medical reasons, the perception among local consumers is that low sugar products are
healthier and more natural. Smaller versions of bakery items are appeal to consumers’ desire
to enjoy the taste and texture without worrying about calories. Mini-portion sizes of about
two to four bites are the growing trend, since carry less calories compared to their full-size
counterparts. Mini pies, petite croissants, and bite-sized cakes are the latest in this category.
1.3 Fairs in Hong Kong
The Hong Kong International Bakery Expo
A newly designated professional B2B trade platform, Hong Kong International Bakery
Expo (HKIBE), organized by the Vertical Expo Service, is set and targeted to tailor for the
industry, particularly the Asia-Pacific region. HKIBE provides the opportunities to meet with
buyers of bakery shop owners, food manufacturers, trading houses and agents, restaurants
and hotels, food service and distributors, professional associations, bakery institution and
media from mainly the South-East Asia countries and of course the Hong Kong local buyers.
http://www.hkbakeryexpo.com
HOFEX
HOFEX, is the largest biennial food and hospitality tradeshow in Asia-Pacific region, has
completed during in Hong Kong during 8 – 11 May 2017. It is organized by the Hong Kong
Exhibition Services Ltd and Allworld Exhibitions Ltd. In the 2017 HOFEX, there were over
2,500 international suppliers and distributors of food, beverages, foodservice equipment,
hospitality design and technology, including 50+ national pavilions, showcased their latest
quality products. HOFEX provides a remarkable return on investment that is unmatched by
other media. HOFEX offers a tremendous opportunity to showcase products and services in
the world's most lucrative markets. Also, HOFEX indulges their exhibitors and visitors with a
series of informative and mind-stimulating events ranging from culinary and wine
competitions to conference with expert advice on different topics. The next HOFEX will be
held from 7 – 10 May 2019 at Hong Kong Convention and Exhibition Centre, Hong Kong; to
continue serving as a premier meeting place to connect overseas suppliers with buyers from
China and other countries in Asia-Pacific.
http://www.hofex.com

ITALIAN TRADE AGENCY ICE – Italian Trade Commission
Hong Kong Office
Suite 4001, Central Plaza Via Liszt 21, 00144 Roma, Italia 18 Harbour Road, Wanchai, Hong Kong T el : +39 0659921
T +852 28466500 F +852 28684779 www.ice.gov.it
[email protected] www.italtrade.com/hongkong Part. Iva 12020391004
Food Expo
The Food Expo is a popular summer event, organized in Hong Kong by the Hong Kong
Trade Development Council (HKTDC) and held at the Hong Kong Convention and
Exhibition Centre in August every year. In 2017 Food Expo, more than 1,500 exhibitors from
26 countries and regions participated in the fair. The fair’s trade hall drew more than 21,000
trade buyers from 62 countries and regions, up one per cent year-on-year. Featuring a Trade
Hall and a Public Hall, the expo serves a wide variety of quality food products from all over
the world including bakery products, beverages, snacks, processed food, instant food, fruits &
vegetables, green & organic food, kitchenware, seasonings and seafood and provides
numerous business opportunities to buyers and spoiling public visitors with mouth-watering
delicacies.
http://www.hktdc.com/fair/hkfoodexpo-en
Restaurant and Bar Hong Kong
Restaurant and Bar Hong Kong (RBHK) is Asia’s leading fine dining and food exhibition. It
is organized by the Diversified Communication Hong Kong, and hold at the Hong Kong
Convention & Exhibition Centre in every September. With its unique position focusing on
the top-quality food service and the bar market, it has become the highlight event of the
industry, delivering top F&B professionals from Hong Kong, Macau and Guangdong. In
2017 Restaurant & Bar, the fair gathered 300 exhibitors, bringing high-quality food service
and solutions to top-end potential in-traders. It received response from more than 19,032
high-spending decision-makers, including head chefs, purchasing directors and restaurant
managers come to look for and are prepared to pay for the best.
http://www.restaurantandbarhk.com/expo
ITALIAN TRADE AGENCY ICE – Italian Trade Commission
Hong Kong Office
Suite 4001, Central Plaza Via Liszt 21, 00144 Roma, Italia 18 Harbour Road, Wanchai, Hong Kong T el : +39 0659921
T +852 28466500 F +852 28684779 www.ice.gov.it
[email protected] www.italtrade.com/hongkong Part. Iva 12020391004
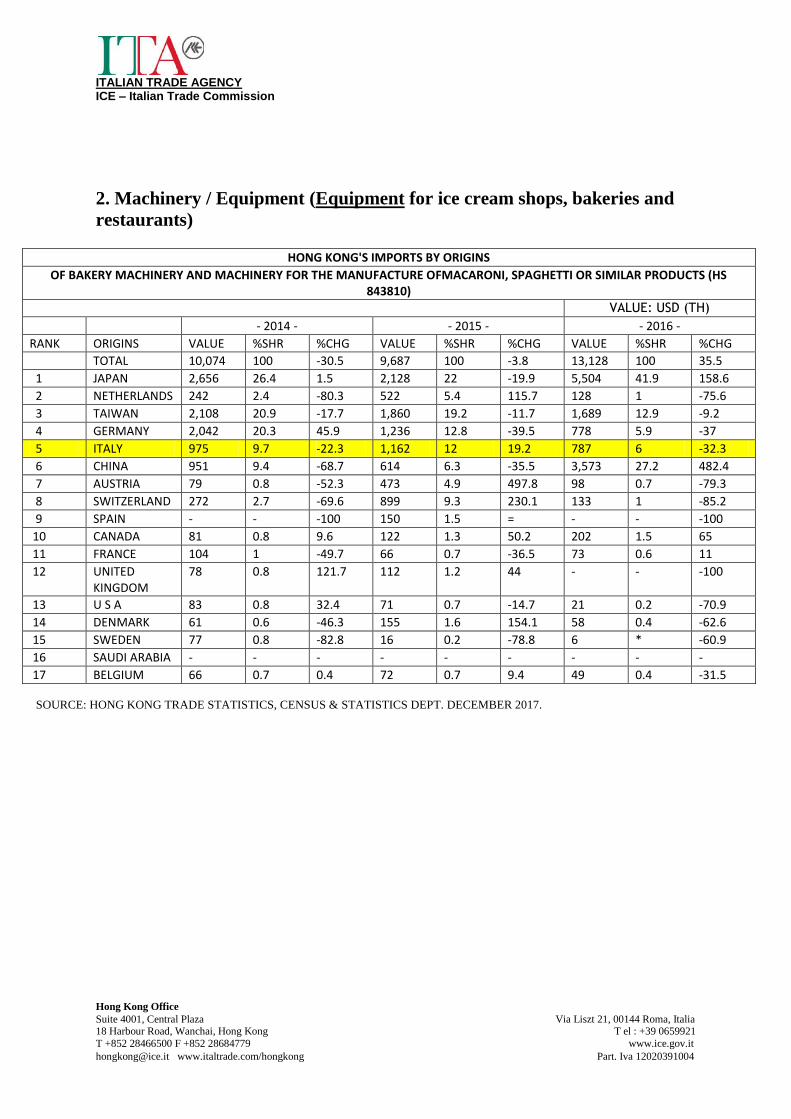
2. Machinery / Equipment (Equipment for ice cream shops, bakeries and
restaurants)
HONG KONG'S IMPORTS BY ORIGINS
OF BAKERY MACHINERY AND MACHINERY FOR THE MANUFACTURE OFMACARONI, SPAGHETTI OR SIMILAR PRODUCTS (HS 843810)
VALUE: USD (TH)
- 2014 - - 2015 - - 2016 -
RANK ORIGINS VALUE %SHR %CHG VALUE %SHR %CHG VALUE %SHR %CHG TOTAL 10,074 100 -30.5 9,687 100 -3.8 13,128 100 35.5
1 JAPAN 2,656 26.4 1.5 2,128 22 -19.9 5,504 41.9 158.6
2 NETHERLANDS 242 2.4 -80.3 522 5.4 115.7 128 1 -75.6
3 TAIWAN 2,108 20.9 -17.7 1,860 19.2 -11.7 1,689 12.9 -9.2
4 GERMANY 2,042 20.3 45.9 1,236 12.8 -39.5 778 5.9 -37
5 ITALY 975 9.7 -22.3 1,162 12 19.2 787 6 -32.3
6 CHINA 951 9.4 -68.7 614 6.3 -35.5 3,573 27.2 482.4
7 AUSTRIA 79 0.8 -52.3 473 4.9 497.8 98 0.7 -79.3
8 SWITZERLAND 272 2.7 -69.6 899 9.3 230.1 133 1 -85.2
9 SPAIN - - -100 150 1.5 = - - -100
10 CANADA 81 0.8 9.6 122 1.3 50.2 202 1.5 65
11 FRANCE 104 1 -49.7 66 0.7 -36.5 73 0.6 11
12 UNITED KINGDOM
78 0.8 121.7 112 1.2 44 - - -100
13 U S A 83 0.8 32.4 71 0.7 -14.7 21 0.2 -70.9
14 DENMARK 61 0.6 -46.3 155 1.6 154.1 58 0.4 -62.6
15 SWEDEN 77 0.8 -82.8 16 0.2 -78.8 6 * -60.9
16 SAUDI ARABIA - - - - - - - - -
17 BELGIUM 66 0.7 0.4 72 0.7 9.4 49 0.4 -31.5
SOURCE: HONG KONG TRADE STATISTICS, CENSUS & STATISTICS DEPT. DECEMBER 2017.

ITALIAN TRADE AGENCY ICE – Italian Trade Commission
Hong Kong Office
Suite 4001, Central Plaza Via Liszt 21, 00144 Roma, Italia 18 Harbour Road, Wanchai, Hong Kong T el : +39 0659921
T +852 28466500 F +852 28684779 www.ice.gov.it
[email protected] www.italtrade.com/hongkong Part. Iva 12020391004
HONG KONG'S IMPORTS BY ORIGINS
OF BAKERY MACHINERY AND MACHINERY FOR THE MANUFACTURE OFMACARONI, SPAGHETTI OR SIMILAR PRODUCTS (HS 843810)
VALUE: USD (TH) JAN - OCT 2017
RANK ORIGINS VALUE %SHR %CHG TOTAL 10,632 100 -8.9
1 JAPAN 2,990 28.1 -34.1
2 NETHERLANDS 2,362 22.2 ..
3 TAIWAN 2,115 19.9 50.6
4 GERMANY 1,829 17.2 171.3
5 ITALY 348 3.3 -53.5
6 CHINA 178 1.7 -95
7 AUSTRIA 165 1.6 68.7
8 SWITZERLAND 157 1.5 17.7
9 SPAIN 141 1.3 =
10 CANADA 131 1.2 -34.9
11 FRANCE 71 0.7 8.2
12 UNITED KINGDOM 54 0.5 =
13 U S A 36 0.3 73.8
14 DENMARK 28 0.3 -46.5
15 SWEDEN 14 0.1 117.2
16 SAUDI ARABIA 8 0.1 =
17 BELGIUM 6 0.1 -88.2
SOURCE: HONG KONG TRADE STATISTICS, CENSUS & STATISTICS DEPT. DECEMBER 2017.

ITALIAN TRADE AGENCY ICE – Italian Trade Commission
Hong Kong Office
Suite 4001, Central Plaza Via Liszt 21, 00144 Roma, Italia 18 Harbour Road, Wanchai, Hong Kong T el : +39 0659921
T +852 28466500 F +852 28684779 www.ice.gov.it
[email protected] www.italtrade.com/hongkong Part. Iva 12020391004
HONG KONG'S IMPORTS BY ORIGINS
OF ELECTRIC COFFEE OR TEA MAKERS (HS 851671)
VALUE: USD (TH)
- 2014 - - 2015 - - 2016 -
RANK ORIGINS VALUE %SHR %CHG VALUE %SHR %CHG VALUE %SHR %CHG TOTAL 119,605 100 12.6 102,473 100 -14.3 119,019 100 16.1
1 CHINA 110,292 92.2 14.7 94,361 92.1 -14.4 108,452 91.1 14.9
2 ITALY 4,666 3.9 -28.5 3,712 3.6 -20.5 3,018 2.5 -18.7
3 GERMANY 1,121 0.9 59.6 1,245 1.2 11 2,300 1.9 84.7
4 SWITZERLAND 604 0.5 12.1 201 0.2 -66.8 1,425 1.2 610.3
5 CZECH REP - - - - - - 86 0.1 =
6 UKRAINE - - - - - - - - -
7 ROMANIA 94 0.1 126.3 115 0.1 22.5 84 0.1 -26.9
8 U S A 76 0.1 -5.9 33 * -57.3 145 0.1 346.4
9 SLOVENIA 93 0.1 250.7 147 0.1 59.3 134 0.1 -8.9
10 PORTUGAL 859 0.7 73.2 1,002 1 16.6 996 0.8 -0.6
11 MALAYSIA 14 * .. 38 * 168.3 97 0.1 157.4
12 NETHERLANDS 332 0.3 13.8 171 0.2 -48.4 314 0.3 83.2
13 AUSTRALIA 479 0.4 -3 270 0.3 -43.7 707 0.6 162
14 FRANCE 154 0.1 36.2 115 0.1 -25.4 70 0.1 -39.3
15 UNITED KINGDOM 233 0.2 65.6 421 0.4 80.5 34 * -92
16 AUSTRIA - - -100 - - - - - -
17 FINLAND - - - - - - - - -
18 TAIWAN 161 0.1 941.3 193 0.2 19.8 79 0.1 -59.2
19 COLOMBIA 3 * = - - -100 - - -
20 JAPAN 46 * .. 263 0.3 475.8 189 0.2 -27.9
SOURCE: HONG KONG TRADE STATISTICS, CENSUS & STATISTICS DEPT. DECEMBER 2017.

ITALIAN TRADE AGENCY ICE – Italian Trade Commission
Hong Kong Office
Suite 4001, Central Plaza Via Liszt 21, 00144 Roma, Italia 18 Harbour Road, Wanchai, Hong Kong T el : +39 0659921
T +852 28466500 F +852 28684779 www.ice.gov.it
[email protected] www.italtrade.com/hongkong Part. Iva 12020391004
HONG KONG'S IMPORTS BY ORIGINS
OF ELECTRIC COFFEE OR TEA MAKERS (HS 851671)
VALUE: USD (TH)
JAN - OCT 2017
RANK ORIGINS VALUE %SHR %CHG TOTAL 150,617 100 60
1 CHINA 142,594 94.7 67.9
2 ITALY 2,545 1.7 -4.6
3 GERMANY 1,859 1.2 3.6
4 SWITZERLAND 1,187 0.8 -7.4
5 CZECH REP 568 0.4 ..
6 UKRAINE 369 0.2 =
7 ROMANIA 299 0.2 392.4
8 U S A 217 0.1 50.4
9 SLOVENIA 201 0.1 50.7
10 PORTUGAL 186 0.1 -81.3
11 MALAYSIA 152 0.1 81
12 NETHERLANDS 96 0.1 -65.9
13 AUSTRALIA 69 * -90.2
14 FRANCE 65 * -2.3
15 UNITED KINGDOM 50 * 48.6
16 AUSTRIA 28 * =
17 FINLAND 24 * =
18 TAIWAN 23 * -57.5
19 COLOMBIA 19 * =
20 JAPAN 18 * -86.4
SOURCE: HONG KONG TRADE STATISTICS, CENSUS & STATISTICS DEPT. DECEMBER 2017.

ITALIAN TRADE AGENCY ICE – Italian Trade Commission
Hong Kong Office
Suite 4001, Central Plaza Via Liszt 21, 00144 Roma, Italia 18 Harbour Road, Wanchai, Hong Kong T el : +39 0659921
T +852 28466500 F +852 28684779 www.ice.gov.it
[email protected] www.italtrade.com/hongkong Part. Iva 12020391004
HONG KONG'S IMPORTS BY ORIGINS
OF ELECTRO-MECHANICAL DOMESTIC FOOD GRINDERS, MIXERS, AND FRUITOR VEGETABLE JUICE EXTRACTORS, WITH SELF-CONTAINED ELECTRICMOTOR (HS 850940)
VALUE: USD (TH)
- 2014 - - 2015 - - 2016 -
RANK ORIGINS VALUE %SHR %CHG VALUE %SHR %CHG VALUE %SHR %CHG TOTAL 149,608 100 -9.7 123,321 100 -17.6 77,914 100 -36.8
1 CHINA 137,806 92.1 -11.4 108,485 88 -21.3 67,220 86.3 -38
2 SLOVENIA 1,238 0.8 316.7 1,007 0.8 -18.7 1,636 2.1 62.5
3 GERMANY 205 0.1 84.4 756 0.6 269.5 964 1.2 27.4
4 U S A 4,831 3.2 -18.2 6,793 5.5 40.6 3,525 4.5 -48.1
5 KOREA REP 1,506 1 43.8 1,250 1 -17 357 0.5 -71.5
6 ITALY 732 0.5 273.1 1,023 0.8 39.8 745 1 -27.2
7 MALAYSIA 588 0.4 -25.5 263 0.2 -55.2 758 1 187.9
8 FRANCE 739 0.5 166 391 0.3 -47.1 973 1.2 149.1
9 SWITZERLAND 84 0.1 -1.1 69 0.1 -18.1 81 0.1 17.2
10 AUSTRALIA 248 0.2 .. 118 0.1 -52.4 30 * -74.7
11 NETHERLANDS - - -100 293 0.2 = 179 0.2 -38.9
12 THAILAND 41 * 103.4 233 0.2 471.5 168 0.2 -27.8
13 TAIWAN 559 0.4 287.1 1,870 1.5 234.6 283 0.4 -84.8
14 NEW ZEALAND 644 0.4 = - - -100 89 0.1 =
15 JAPAN 84 0.1 -13.5 151 0.1 78.3 95 0.1 -37
16 HUNGARY 12 * -68 123 0.1 931.4 366 0.5 198.1
17 CZECH REP - - - - - - 104 0.1 =
18 POLAND 1 * -82.1 - - -100 5 * =
19 QATAR - - - - - - - - -
20 GREECE - - - - - - - - -
SOURCE: HONG KONG TRADE STATISTICS, CENSUS & STATISTICS DEPT. DECEMBER 2017.
ITALIAN TRADE AGENCY ICE – Italian Trade Commission
Hong Kong Office
Suite 4001, Central Plaza Via Liszt 21, 00144 Roma, Italia 18 Harbour Road, Wanchai, Hong Kong T el : +39 0659921
T +852 28466500 F +852 28684779 www.ice.gov.it
[email protected] www.italtrade.com/hongkong Part. Iva 12020391004
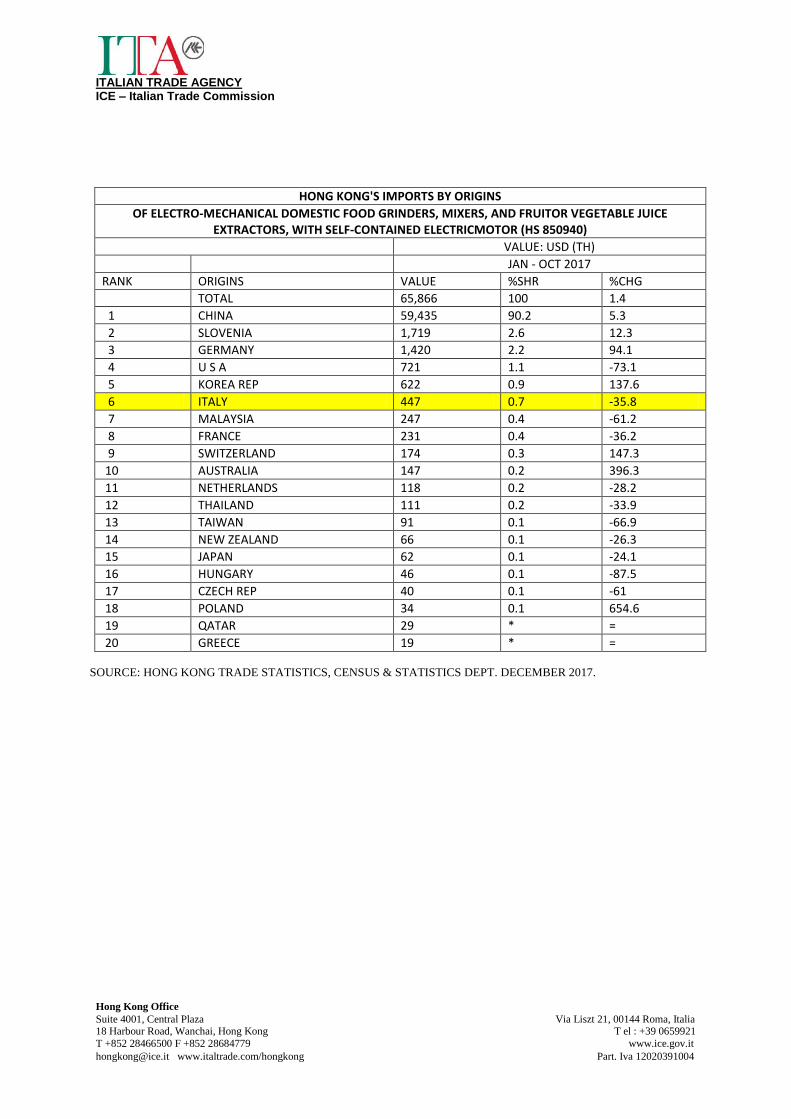
HONG KONG'S IMPORTS BY ORIGINS
OF ELECTRO-MECHANICAL DOMESTIC FOOD GRINDERS, MIXERS, AND FRUITOR VEGETABLE JUICE EXTRACTORS, WITH SELF-CONTAINED ELECTRICMOTOR (HS 850940)
VALUE: USD (TH)
JAN - OCT 2017
RANK ORIGINS VALUE %SHR %CHG TOTAL 65,866 100 1.4
1 CHINA 59,435 90.2 5.3
2 SLOVENIA 1,719 2.6 12.3
3 GERMANY 1,420 2.2 94.1
4 U S A 721 1.1 -73.1
5 KOREA REP 622 0.9 137.6
6 ITALY 447 0.7 -35.8
7 MALAYSIA 247 0.4 -61.2
8 FRANCE 231 0.4 -36.2
9 SWITZERLAND 174 0.3 147.3
10 AUSTRALIA 147 0.2 396.3
11 NETHERLANDS 118 0.2 -28.2
12 THAILAND 111 0.2 -33.9
13 TAIWAN 91 0.1 -66.9
14 NEW ZEALAND 66 0.1 -26.3
15 JAPAN 62 0.1 -24.1
16 HUNGARY 46 0.1 -87.5
17 CZECH REP 40 0.1 -61
18 POLAND 34 0.1 654.6
19 QATAR 29 * =
20 GREECE 19 * =
SOURCE: HONG KONG TRADE STATISTICS, CENSUS & STATISTICS DEPT. DECEMBER 2017.

ITALIAN TRADE AGENCY ICE – Italian Trade Commission
Hong Kong Office
Suite 4001, Central Plaza Via Liszt 21, 00144 Roma, Italia 18 Harbour Road, Wanchai, Hong Kong T el : +39 0659921
T +852 28466500 F +852 28684779 www.ice.gov.it
[email protected] www.italtrade.com/hongkong Part. Iva 12020391004
HONG KONG'S IMPORTS BY ORIGINS
OF REFRIGERATORS,FREEZERS AND OTHER REFRIGERATING OR FREEZINGEQUIPMENT,ELECTRIC OR OTHER;HEAT PUMPS OTHER THAN AIRCONDITIONING MACHINES OF HEADING 8415. (HS 8418)
VALUE: USD (TH)
- 2014 - - 2015 - - 2016 -
RANK ORIGINS VALUE %SHR %CHG VALUE %SHR %CHG VALUE %SHR %CHG TOTAL 242,517 100 2.8 217,628 100 -10.3 235,522 100 8.2
1 CHINA 97,137 40.1 5 97,508 44.8 0.4 107,183 45.5 9.9
2 THAILAND 36,912 15.2 -3 32,212 14.8 -12.7 31,951 13.6 -0.8
3 JAPAN 25,653 10.6 14.5 21,346 9.8 -16.8 21,507 9.1 0.8
4 U S A 18,560 7.7 6.1 11,829 5.4 -36.3 11,180 4.7 -5.5
5 GERMANY 9,278 3.8 -21.6 8,660 4 -6.7 10,878 4.6 25.6
6 ITALY 9,166 3.8 37.6 6,670 3.1 -27.2 6,957 3 4.3
7 VIETNAM 2,324 1 20.5 1,769 0.8 -23.9 3,694 1.6 108.9
8 TAIWAN 6,736 2.8 -36.7 6,929 3.2 2.9 6,045 2.6 -12.7
9 MALAYSIA 5,429 2.2 -9.3 4,238 1.9 -21.9 6,261 2.7 47.7
10 SINGAPORE 4,674 1.9 51.9 2,945 1.4 -37 4,607 2 56.4
11 KOREA REP 7,401 3.1 -5 6,338 2.9 -14.4 5,510 2.3 -13.1
12 POLAND 1 * .. 32 * .. 345 0.1 975.5
13 TURKEY 2,167 0.9 6.7 1,859 0.9 -14.2 1,872 0.8 0.7
14 FRANCE 2,164 0.9 -8.9 1,964 0.9 -9.2 1,460 0.6 -25.7
15 INDONESIA 1,477 0.6 19.5 1,677 0.8 13.5 2,779 1.2 65.7
16 UNITED KINGDOM
2,727 1.1 7.5 2,234 1 -18.1 2,554 1.1 14.3
17 AUSTRIA 29 * -79.8 351 0.2 .. 928 0.4 164.7
18 PHILIPPINES 1,017 0.4 29.6 62 * -93.9 582 0.2 842.4
19 DENMARK 1,360 0.6 22.9 1,034 0.5 -24 817 0.3 -21
20 ROMANIA 124 0.1 = 398 0.2 221.2 1,049 0.4 163.5
SOURCE: HONG KONG TRADE STATISTICS, CENSUS & STATISTICS DEPT. DECEMBER 2017.

ITALIAN TRADE AGENCY ICE – Italian Trade Commission
Hong Kong Office
Suite 4001, Central Plaza Via Liszt 21, 00144 Roma, Italia 18 Harbour Road, Wanchai, Hong Kong T el : +39 0659921
T +852 28466500 F +852 28684779 www.ice.gov.it
[email protected] www.italtrade.com/hongkong Part. Iva 12020391004
HONG KONG'S IMPORTS BY ORIGINS
OF REFRIGERATORS,FREEZERS AND OTHER REFRIGERATING OR FREEZINGEQUIPMENT,ELECTRIC OR OTHER;HEAT PUMPS OTHER THAN AIRCONDITIONING MACHINES OF HEADING 8415. (HS 8418)
VALUE: USD (TH)
JAN - OCT 2017
RANK ORIGINS VALUE %SHR %CHG
TOTAL 194,478 100 -0.9
1 CHINA 78,458 40.3 -11.3
2 THAILAND 29,154 15 10.2
3 JAPAN 22,767 11.7 29.1
4 U S A 10,489 5.4 6.9
5 GERMANY 8,388 4.3 -10.7
6 ITALY 7,574 3.9 36.2
7 VIETNAM 5,671 2.9 84.4
8 TAIWAN 5,446 2.8 16.7
9 MALAYSIA 3,809 2 -31.3
10 SINGAPORE 3,692 1.9 -9.7
11 KOREA REP 3,419 1.8 -26.8
12 POLAND 1,577 0.8 ..
13 TURKEY 1,533 0.8 -8.8
14 FRANCE 1,421 0.7 -0.8
15 INDONESIA 1,387 0.7 -41.6
16 UNITED KINGDOM 1,305 0.7 -11.7
17 AUSTRIA 1,269 0.7 45.4
18 PHILIPPINES 1,206 0.6 156.5
19 DENMARK 969 0.5 45.1
20 ROMANIA 886 0.5 -15.5
SOURCE: HONG KONG TRADE STATISTICS, CENSUS & STATISTICS DEPT. DECEMBER 2017.

ITALIAN TRADE AGENCY ICE – Italian Trade Commission
Hong Kong Office
Suite 4001, Central Plaza Via Liszt 21, 00144 Roma, Italia 18 Harbour Road, Wanchai, Hong Kong T el : +39 0659921
T +852 28466500 F +852 28684779 www.ice.gov.it
[email protected] www.italtrade.com/hongkong Part. Iva 12020391004
2.1 Certifications required by Hong Kong SAR, also in terms of safety in the
workplace
Mode and Organizations
Occupational Safety and Health Council (OSHC) of the Hong Kong Special
Administrative Region
Labour Department of the Hong Kong Special Administrative Region
The Factories and Industrial Undertakings Ordinance (Chapter 59), the Occupational Safety
and Health Ordinance (Chapter 509) and the (Chapter 56) are the main legislation on
occupational safety and health administered by the Labour Department. Requirements for
ensuring the safety and health of employees at work are laid down in the ordinances and their
subsidiary regulations.
The Occupational Safety and Health Ordinance provide for the safety and health protection to
employees in workplaces, both industrial and non-industrial. It is basically an enabling
ordinance setting out requirements in general terms.
They also provide occupational Safety Service; carry out by Occupational Safety Officers.
They:
Enforce the Occupational Safety and Health Ordinance, the Factories and Industrial
Undertakings Ordinance and their subsidiary Regulations through inspection of
workplaces to ensure that the requirements on safety, health and welfare are complied
with
Carry out accident investigations and give advice to employers and employees on how
to reduce existing workplace hazards
Offer free advice to owners in the planning and layout of factories and workplaces,
and in-plant/in-house safety programme
Provide support services to instil safety concepts to the public at large with a view to
inculcating a safety culture among employers and employees and securing their
commitment to self-regulation to bring in a safety management approach in keeping
with the Occupational Safety Charter
Operate the Occupational Safety and Health Training Centre which provides training
for government and non-government personnel in occupational safety and health.
ITALIAN TRADE AGENCY ICE – Italian Trade Commission
Hong Kong Office
Suite 4001, Central Plaza Via Liszt 21, 00144 Roma, Italia 18 Harbour Road, Wanchai, Hong Kong T el : +39 0659921
T +852 28466500 F +852 28684779 www.ice.gov.it
[email protected] www.italtrade.com/hongkong Part. Iva 12020391004
2.2 Trends and opportunities
Hong Kong, as an international city, can also help foreign companies explore markets in
other parts of Asia. European and American food producers opting to set up branch
companies and factories in Asia would find confidence investing in Hong Kong because of
the favourable business environment, sound legal system and intellectual property rights (IPR)
protection offered by Hong Kong. Moreover, Hong Kong’s simple customs clearance
procedures for imported food raw materials can ensure a stable supply of raw materials and
smooth operation of production lines for food factories.
Hong Kong is an ideal platform for doing business in Asia, especially for market entry to
China. As Western countries have taken on Eastern food consumption trends, Hong Kong
serves as a gateway to provide Western food-stuffs, including equipment and machinery.
Hong Kong is a popular venue for hosting regional headquarters or representative offices for
multinational companies to manage their businesses in the Asia Pacific. By setting up branch
companies in Hong Kong, foreign companies can stay close to the Asian market, particularly
the China market.
According to the Hong Kong’s Trade Statistics, the total of Hong Kong’s imports by origins
resulted in an overall increase. For instance, the total number of bakery machinery (HS
843810) grew from 2014 - USD 10,074 (thousand) to 2016 – USD 13,128 (thousand).
Generally speaking, the Asian-produced machines maintained a leading position in the
market. China had long been the top importer in machinery over the past three years, namely
in electric coffee or tea makers (HS 851671), electro-mechanical domestic food machinery
(HS 850940) and freezing equipment sectors (HS 8418). Apart from the mentioned sectors,
Japan was the largest exporter in the bakery machinery and machinery sector (HS 843810),
followed by the Netherlands. In addition, Italy recorded a positive performance in both
electro-mechanical domestic food machinery (HS 850940) and freezing equipment (HS 8418)
sectors. In terms of electro-mechanical domestic food machinery (HS 850940), the Italian
import marked a notable growth from 2014 – USD 732 (thousand) to 2016 – USD 745
(thousand). In terms of freezing equipment (HS 8418), after a drop in 2015, the Italian import
increased by 4.3%, from 2015 – USD 6,670 (thousand) to 2016 – USD 6,957 (thousand). Due
to the increase of bakery stores and restaurants in Hong Kong, this results to greater demand
for Italian-made machines in the market, providing high-quality in the food and beverage
industry.
ITALIAN TRADE AGENCY ICE – Italian Trade Commission
Hong Kong Office
Suite 4001, Central Plaza Via Liszt 21, 00144 Roma, Italia 18 Harbour Road, Wanchai, Hong Kong T el : +39 0659921
T +852 28466500 F +852 28684779 www.ice.gov.it
[email protected] www.italtrade.com/hongkong Part. Iva 12020391004
3. Guide to the Market
3.1 Payment Method
For performing business in Hong Kong, it is fairly common to pay with cash / payment in
advance / cheque / letter of credit (L/C).
The L/C cycle operates in the following way: after a buyer and a seller have entered into a
sales contract, the buyer applies for a L/C from an issuing bank. Upon receiving the L/C, the
seller would check its authenticity with an advising bank. Having confirmed the L/C is
correct, the seller exports the goods and prepares a series of documents such as Inspection
Certificate, Bill of Lading etc., proving to its negotiating bank that the goods shipped are in
accordance with the buyer’s standard. Before the negotiating bank releases money to the
seller, it will check on face value that the submitted documents tally with the buyer’s
instruction. Thereafter, the negotiating bank will forward the documents to the buyer through
its issuing bank.
3.2 Elements of issues relating to transport and customs clearance
The Customs and Excise Department (C&ED) of the Hong Kong Special Administrative
Region, attaches great importance to the protection and facilitation of legitimate trade and
industry in addition to upholding the trading integrity of the Hong Kong Special
Administrative Region (HKSAR). Risk management is employed on selection of cargo for
examination to ensure Customs intervention at control points is kept to the minimal.
Also, for import clearance:
Documents required to facilitate Customs clearance are
Manifests;
Import / export licence or removal permit (if required);
Copy of detention notice (if applicable); and / or
Other supporting documents such as bill of lading, airway bill, invoice, packing list
etc.

ITALIAN TRADE AGENCY ICE – Italian Trade Commission
Hong Kong Office
Suite 4001, Central Plaza Via Liszt 21, 00144 Roma, Italia 18 Harbour Road, Wanchai, Hong Kong T el : +39 0659921
T +852 28466500 F +852 28684779 www.ice.gov.it
[email protected] www.italtrade.com/hongkong Part. Iva 12020391004
3.3 Reference of major chains for bakery, café, chocolate, pastry and ice-cream
Bakery –
Arome - https://www.aromebakery.com.hk
Maxims - http://www.maxims.com.hk
Yamazaki - http://www.yamazaki.hk
Café –
Pacific Coffee - http://www.pacificcoffee.com
Simply life - http://www.simplylife.com.hk
Starbucks - http://www.starbucks.com.hk
Chocolate –
Godiva - https://www.godiva.com.hk
La Maison du Chocolat - http://www.lamaisonduchocolat.hk
Leonidas - http://www.leonidas.com.hk
Pastry –
Paul Lafayet - http://www.paullafayet.com
Jean-Paul Hevin - http://www.jeanpaulhevin.com.hk
Pierre Herme - http://www.pierreherme.com
Ice-cream –
Haagen Dazs - http://haagen-dazs.com.hk
XTC - http://www.xtc.com.hk
3.4 Other information
Currently, the packaged food and beverage handled by Hong Kong logistics companies are
mostly high-priced products, e.g. imported chocolates, cheese, and premium frozen meat /
dessert. Since such food products must be stored under 0-4°C or -18°C, sealed seamless cold
chain management is required during transportation. As most mainland logistics companies
fail to control the temperature in the course of delivery, the food can easily go bad. On the
contrary, Hong Kong logistics companies can provide a series of high value-added services.
For instance, starting from the time the food products are received, Hong Kong logistics
companies would take the temperature and make a record. In the course of loading/unloading
the seamless refrigerated containers in the cold storage and picking up/delivering the goods
from the cold storage, temperature control is in place throughout the whole process. The
refrigerated cargo fleet is equipped with GPS and can provide information on logistics for the
clients at any time. Before handing the goods over to the recipient, infrared thermometers are
used to measure the temperature to ensure that it is up to standard. Since the management of
Hong Kong logistics companies is stringent, many foreign food producers/suppliers wishing
to develop the mainland market prefer to cooperate with Hong Kong companies.

ITALIAN TRADE AGENCY ICE – Italian Trade Commission
Hong Kong Office
Suite 4001, Central Plaza Via Liszt 21, 00144 Roma, Italia 18 Harbour Road, Wanchai, Hong Kong T el : +39 0659921
T +852 28466500 F +852 28684779 www.ice.gov.it
[email protected] www.italtrade.com/hongkong Part. Iva 12020391004
Associations:
The Hong Kong Food Council
Hong Kong Food Industry Association (formerly the Hong Kong Food Council) was
established in 1984, is an independent and non-profit organizations, including members of
Hong Kong's major food industry groups and manufacturers. The past 14 years, they actively
organize seminars and different types of activities, and its main objectives include:
Communicate with the local food industry, research and perform investigation all
issues related to the food.
Safeguard the common interests of our food industry.
Gathering information, organizing seminars and carry out various activities to
promote food hygiene standards. Also, protect public health, and to promote the
understanding and the relevant issues of the industry.
Food Research and promotional activities in the industrial and trade
http://www.hkfc.org.hk
Hong Kong Chefs Association
Hong Kong Chefs Association (HKCA) is a non-profit making organization established in
1991. The HKCA takes an active part in supporting and soliciting essential food activities in
Hong Kong such as fun food fiestas, charity fund raising events, major local culinary
competitions as well as social and educational events. In addition, it encourages members to
participate in international culinary competitions held globally to share professional
knowledge and experiences. The HKCA promote and advance friendly relations between and
among persons within kitchen and hospitality management.
http://www.hongkong-chefs.com
Hong Kong Bakery and Confectionery Association
The Hong Kong Bakery and Confectionery Association were established in the 1987,
regarding on the bakery and confectionaries in Hong Kong. They aim to raise the technical
standard of the profession, to train and motivate the people in the bakery and confectionery
sector, as well as to make bakery and confectionery business a prosperous and thriving trade
in Hong Kong.
http://www.todaybaking.hk
The Hong Kong Food, Drink & Grocery Association
The Hong Kong Food, Drink & Grocery Association (The FDGA) is an industry issues
driven association. The FDGA was founded about 30 years ago and is well recognized by the
industry, Government and other stakeholders. It was established to provide a platform for
companies in manufacturing, importing, marketing and distribution of branded food, drink or
grocery products in Hong Kong. Its members will review and discuss industry issues, decide
on action where necessary and communicates with the media, industry or Government on
these issues.
http://www.fdga.org.hk/index.php