hong kong’s etf market as a door to global investment
TRANSCRIPT
September 2019 RESEARCH REPORT HONG KONG'S ETF MARKET AS A DOOR TO GLOBAL INVESTMENT
Chief China Economist’s Office Hong Kong Exchanges and Clearing Limited
12 September 2019
CONTENTS
Page
Summary ........................................................................................................................................ 1
1. ETFs have become attractive to global investors ..................................................................... 2
1.1 Why are ETFs more popular than mutual funds? ............................................................ 2
1.2 Overview of global and regional ETF markets ................................................................. 3
1.3 Recent product developments to support the growth of ETF markets ............................. 7
2. The growth of the Mainland and Hong Kong ETF markets can be complementary to each other....................................................................................................................................... 10
2.1 Strong diversification demand from Mainland investors ................................................. 10
2.2 Hong Kong ETF market as a platform for global investments ........................................ 15
2.3 Complementary nature of the Mainland and Hong Kong ETF markets .......................... 17
3. Hong Kong’s edges as the Asia-Pacific hub for issuing and trading ETFs .............................. 18
3.1 Issuers’ considerations to issue ETFs in Hong Kong .................................................... 18
3.2 Factors supporting the liquidity of ETFs in Hong Kong .................................................. 20
4. Conclusion ............................................................................................................................. 22
Appendix. Comparison between ETFs and LOFs in the Mainland and ETFs in Hong Kong ........ 23
Hong Kong’s ETF market as a door to global investment 12 September 2019
1
SUMMARY
Exchange traded funds (ETFs) have become increasingly popular in global markets. These
products are more cost-effective, convenient and transparent than traditional mutual funds, leading
to rapid growth in both the global number of ETFs and their assets under management (AUM).
The growth is accompanied by innovation and diversification of products as well as increased use
of fixed-income ETFs. While the growth in the US and European ETF markets continued, the ETF
growth momentum in Asia Pacific is remarkable. Hong Kong has been one of the leading ETF
markets in Asia Pacific while the Mainland ETF market is growing significantly in recent years to be
the second largest in Asia Pacific upon Mainland investors’ increasing acceptance to passive
investments.
In respect of passive investments, Mainland investors can currently invest only in ETFs listed in the
Mainland. Equity ETFs on a large variety of Mainland indices have dominated the market. Money
market ETFs have become attractive owing to better yields than deposit rates. In addition to ETFs,
listed open-ended funds (LOFs), which are traded like ETFs, provide convenient investment
choices of active returns. However, ETFs and LOFs on global equity indices have been subject to
time delay to receive cash in case of redemptions in the primary market. Besides, Mainland-listed
funds are traded in the Renminbi (RMB) only. These hint at the potential demand of Mainland
investors for access to the Hong Kong ETF market for global asset allocation and international
currency exposure.
The Hong Kong ETF market is a door to global investment. It offers products on diversified asset
classes from global markets and a well-established institutional investor base to support market
liquidity. The Hong Kong ETF market offers a high degree of global equity market exposures,
including Hong Kong stocks, Mainland A shares, Asia-Pacific and other overseas equities. It also
covers asset classes of fixed income and currency as well as commodities in the global markets.
In addition, a number of ETFs on global indices are traded in multiple currencies, including the
Hong Kong dollar (HKD), the RMB and/or the US dollar (USD), which can fit the diverse needs of
global investors. ETF investors in Hong Kong can also enjoy the high market depth, competitive
tax savings as well as an ecosystem of associated risk management tools. The Hong Kong ETF
market is also attractive to issuers who can enjoy a relatively market-friendly regulatory
environment, a broad base of global institutional investors and an effective market making
mechanism that ensures secondary market liquidity and facilitates arbitrage activities in the
primary market. Besides, ETF issuers in Hong Kong can benefit from the geographical advantage
of “Trade Asia in Asia” for hedging risks in the underlying markets for their Asian products.
Hong Kong is well-positioned to be Asia’s ETF marketplace for the issuance and trading of ETFs.
The Hong Kong ETF market can not only meet the needs of global investors, but also the demand
by Mainland investors potentially. Given the relatively low institutional participation for supporting
ETF primary market activities and the limited ETF coverage of global assets in the Mainland
market, the Hong Kong ETF market with diverse products and investor base would be attractive to
Mainland investors who have shown growing interests in ETF investments. Conversely, the large
variety of ETFs on Mainland assets in the Mainland market would also be attractive to global
investors in Hong Kong. The potential mutual access of the Mainland and Hong Kong ETF
markets1 would facilitate a more balanced mix of investors in the ETF primary and secondary
markets on both sides, accompanied by a widened spectrum of ETF products. Further
development in Mainland-Hong Kong market connectivity in respect of the ETF segment will
therefore be conducive to the mutual growth of the two markets.
1 Subject to regulatory approval.
Hong Kong’s ETF market as a door to global investment 12 September 2019
2
1. ETFS HAVE BECOME ATTRACTIVE TO GLOBAL INVESTORS
An exchange traded fund (ETF) is an open-ended fund2 traded like a stock that tracks the
performance of the underlying assets. The world’s first ETF was launched in Canada in 1990,
tracking a benchmark equity index. It was followed by the US in 19933, Japan in 1995, Hong
Kong in 1999 and Europe in 2000. Subsequently, the global ETF market has experienced
significant growth. An increasing number of ETFs are listed and traded in global markets and
the coverage of underlying assets is extended from equities to other asset classes, including
bonds, commodities and baskets of assets. In particular, the growth in Asia has accelerated in
recent years.
Hong Kong has been one of the leading ETF markets in Asia. It was the first mover to issue
and trade ETF in Asia Pacific (excluding Japan) back in 1999 when the Tracker Fund (tracking
the Hang Seng Index (HSI)) was launched. Hong Kong was also the first in the world to offer
ETFs on underlying assets in the Mainland or on Renminbi (RMB) assets. These include the
first A-share ETF4 launched in 2004 (a synthetic ETF5 tracking the FTSE China A50 Index),
the first physical A-share ETF (tracking an A-share index through RMB Qualified Foreign
Institutional Investor (RQFII) scheme with dual counters traded in both Hong Kong dollars
(HKD) and RMB) launched in 20126, the first offshore RMB bond ETF in Asia launched in June
2013 and the first ETF tracking the onshore bond market in Mainland China launched in
February 2014.
The Hong Kong ETF market has now developed into a platform of diversified asset classes
from global markets traded in multiple currencies to meet the needs of global investors. The
market can serve as a regional issuing and trading hub of ETFs to meet the growing market
demand of global and Asia-Pacific investors, particularly from Mainland China.
ETFs have become increasingly popular as an asset class not only in Hong Kong, but also in
global markets. Why are ETFs so popular in global and regional markets? How does product
innovation contribute to this? These are discussed in the following subsections.
1.1 Why are ETFs more popular than mutual funds?
Prior to the launch of ETFs, mutual funds have been a popular choice of investment funds
since their first launch in 1920s7. However, the growth in demand for ETFs has been higher
than that in mutual funds in recent years, evidenced by the investment flows during market
correction in late 2018. It was reported that the redemption of mutual funds reached US$56.2
2 An open-ended fund is an investment fund that can issue and redeem units of the fund. Investors can buy the fund units directly
from the fund manager.
3 In the US, the first ETF (traded on the New York Stock Exchange (NYSE)) was launched in 1993, tracking the S&P 500 Index. Prior
to this, the American Stock Exchange and the Philadelphia Stock Exchange offered “Index Participation Shares” (like futures that
have long and short positions for every share) in May 1989 that allowed investors to buy or sell an interest in an equity market
without having to purchase the individual stocks. Owing to lawsuits by US regulators, the federal court ruled that the shares were
actually a futures contract (i.e., a derivative product) and therefore could not trade on a stock exchange. (Source: Foucher, I. and K.
Gray. (2014) “Exchange-traded funds: Evolution of benefits, vulnerabilities and risks”, Bank of Canada’s Financial System Review,
December 2014 issue, pp.37-46.)
4 See Dennison, T. (2018), “International investing and the importance of breaking the country box”, Invest Outside the Box:
Understanding Different Asset Classes and Strategies, Palgrave Macmillan, pp.228-278.
5 A synthetic ETF is an ETF replicating the performance of an underlying index using derivatives and swaps rather than using
underlying physical securities as in the case of a physical ETF.
6 Source: “First RQFII A-share ETF to debut at HKEX”, HKEX’s News Releases, 16 July 2012.
7 Source: Divakaran, S., S. Buxton, St. Giles, M. Valentine and S. Atamuratova. (2015) “Mutual funds in developing markets:
Addressing challenges to growth”, World Bank’s Working Paper, No. 100976.
Hong Kong’s ETF market as a door to global investment 12 September 2019
3
billion during the week ended 19 December 2018 which was the highest since October 2008.
On the contrary, ETFs received an inflow of US$25.2 billion during the same week8.
Compared to traditional mutual funds, ETFs not only provide for creation and redemption
activities, but also allow secondary trading activities on a stock exchange, contributing to
higher liquidity. It is convenient to trade ETFs in the secondary market when the exchange
market is open. Besides, market makers of ETFs are obliged to provide bid-ask quotes to
ensure the secondary market liquidity. The number of ETF units available for trading in the
secondary market is determined by the creation or redemption of ETF units in the primary
market between participating dealers9 and ETF issuers. The arbitrage activities between
primary and secondary markets, based on the demand and supply, help mitigate the premium
over or discount to the net asset value (NAV)10 of an ETF.
In respect of costs to the issuer, the average expense ratio11 of ETFs in the US was 0.23% in
2016, compared to 0.73% for index-tracking mutual funds and 1.45% for actively managed
mutual funds12. Investors can therefore enjoy lower fund management fees for investments in
ETFs than investments in mutual funds. Certain global investors also enjoy lower taxes for
investments in ETFs and these include the withholding tax advantage of 15% of Irish
Undertakings Collective Investment in Transferable Securities (UCITS) ETFs over mutual
funds when investing in the US13.
In respect of transparency, the information of an ETF is usually readily available on its own
website that includes timely disclosure of the full portfolios (usually on a daily basis).
1.2 Overview of global and regional ETF markets
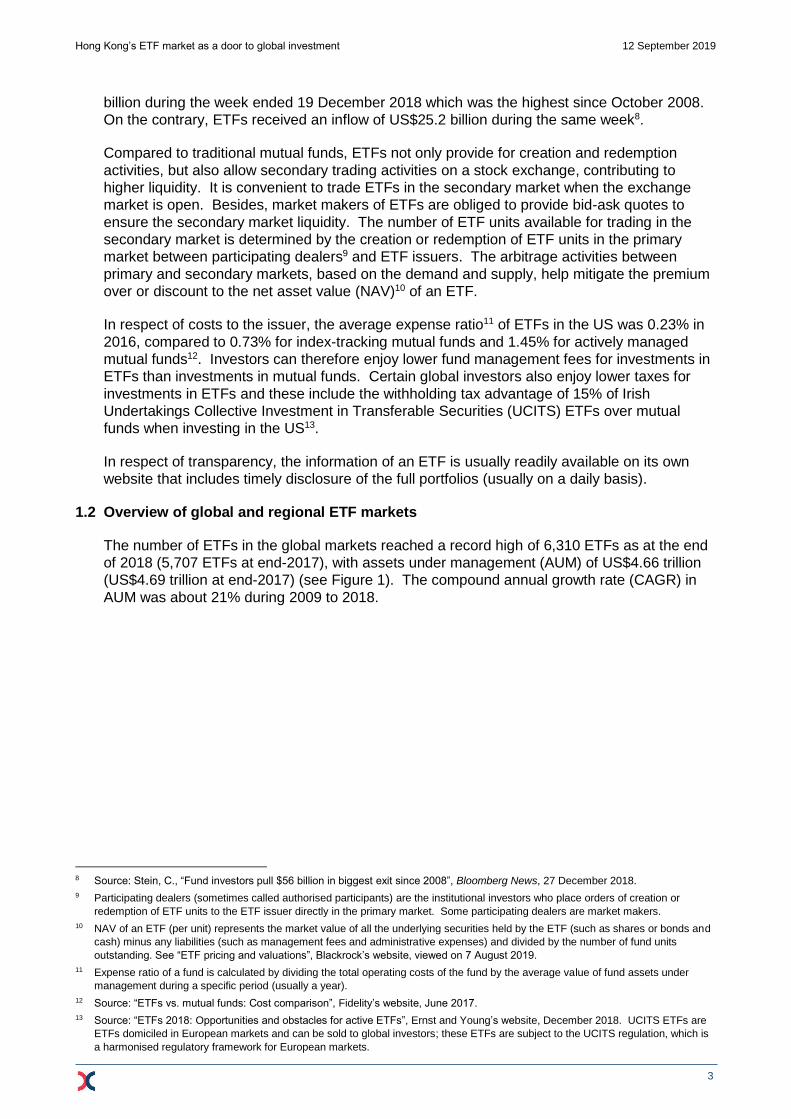
The number of ETFs in the global markets reached a record high of 6,310 ETFs as at the end
of 2018 (5,707 ETFs at end-2017), with assets under management (AUM) of US$4.66 trillion
(US$4.69 trillion at end-2017) (see Figure 1). The compound annual growth rate (CAGR) in
AUM was about 21% during 2009 to 2018.
8 Source: Stein, C., “Fund investors pull $56 billion in biggest exit since 2008”, Bloomberg News, 27 December 2018.
9 Participating dealers (sometimes called authorised participants) are the institutional investors who place orders of creation or
redemption of ETF units to the ETF issuer directly in the primary market. Some participating dealers are market makers.
10 NAV of an ETF (per unit) represents the market value of all the underlying securities held by the ETF (such as shares or bonds and
cash) minus any liabilities (such as management fees and administrative expenses) and divided by the number of fund units
outstanding. See “ETF pricing and valuations”, Blackrock’s website, viewed on 7 August 2019.
11 Expense ratio of a fund is calculated by dividing the total operating costs of the fund by the average value of fund assets under
management during a specific period (usually a year).
12 Source: “ETFs vs. mutual funds: Cost comparison”, Fidelity’s website, June 2017.
13 Source: “ETFs 2018: Opportunities and obstacles for active ETFs”, Ernst and Young’s website, December 2018. UCITS ETFs are
ETFs domiciled in European markets and can be sold to global investors; these ETFs are subject to the UCITS regulation, which is
a harmonised regulatory framework for European markets.
Hong Kong’s ETF market as a door to global investment 12 September 2019
4
Figure 1. AUM and number of ETFs in global markets (2004 – 2018)
Source: “ETFGI reports ETFs and ETPs listed globally gather net inflows of US$76.24 billion during December 2018,
2nd Highest on record”, ETFGI press release on etfgi.com, 9 January 2019.
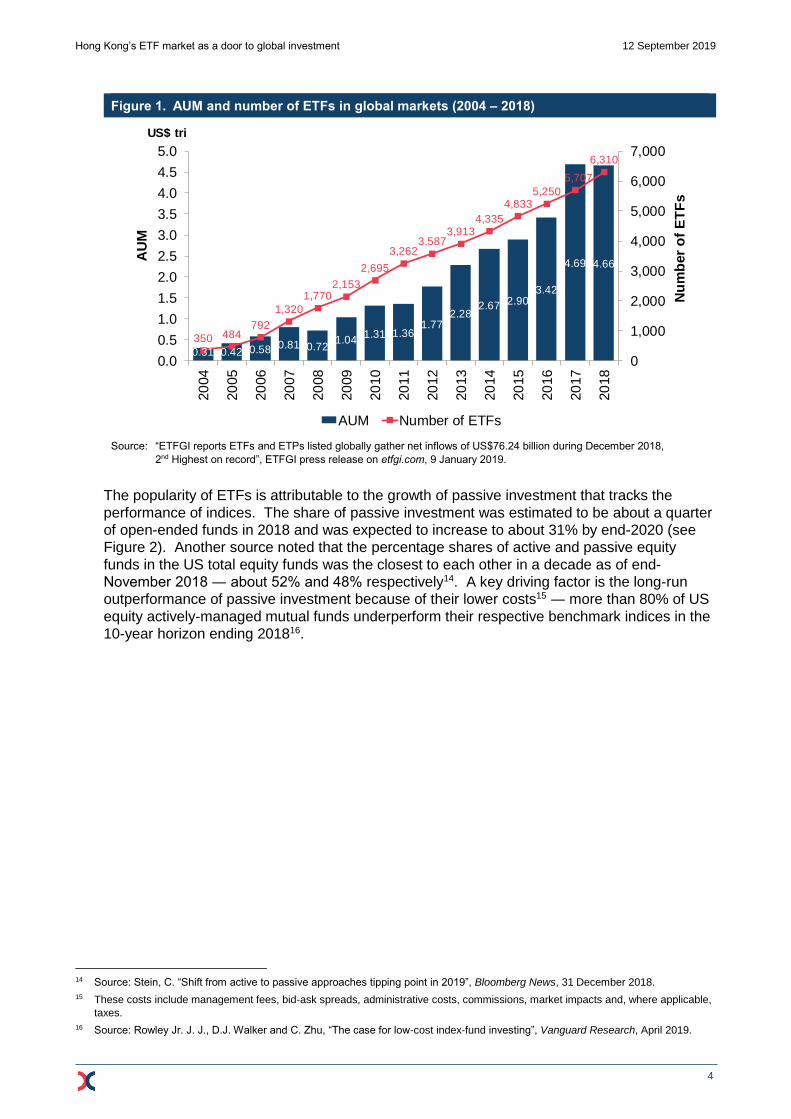
The popularity of ETFs is attributable to the growth of passive investment that tracks the
performance of indices. The share of passive investment was estimated to be about a quarter
of open-ended funds in 2018 and was expected to increase to about 31% by end-2020 (see
Figure 2). Another source noted that the percentage shares of active and passive equity
funds in the US total equity funds was the closest to each other in a decade as of end-
November 2018 ― about 52% and 48% respectively14. A key driving factor is the long-run
outperformance of passive investment because of their lower costs15 ― more than 80% of US
equity actively-managed mutual funds underperform their respective benchmark indices in the
10-year horizon ending 201816.
14 Source: Stein, C. “Shift from active to passive approaches tipping point in 2019”, Bloomberg News, 31 December 2018.
15 These costs include management fees, bid-ask spreads, administrative costs, commissions, market impacts and, where applicable,
taxes.
16 Source: Rowley Jr. J. J., D.J. Walker and C. Zhu, “The case for low-cost index-fund investing”, Vanguard Research, April 2019.
0.31 0.42 0.58 0.81 0.72 1.04
1.31 1.36 1.77
2.28 2.67 2.90
3.42
4.69 4.66
350 484 792
1,320
1,770 2,153
2,695
3,262 3,587
3,913 4,335
4,833 5,250
5,707
6,310
0
1,000
2,000
3,000
4,000
5,000
6,000
7,000
0.0
0.5
1.0
1.5
2.0
2.5
3.0
3.5
4.0
4.5
5.0
20
04
20
05
20
06
20
07
20
08
20
09
20
10
20
11
20
12
20
13
20
14
20
15
20
16
20
17
20
18
Number and assets under management of ETFs globally (2004-2018)
AUM Number of ETFs
AU
M
Nu
mb
er
of
ET
Fs
US$ tri
Hong Kong’s ETF market as a door to global investment 12 September 2019
5
Figure 2. Share of active and passive funds in global markets (% of all open-ended funds)
(2011 – 2020)
Note: The figures after 2016 are not actual statistics but estimates by Ernst and Young.
Source: “Global ETF Research 2017 ― Reshaping around the investor”, published on Ernst and Young’s website, 2017.
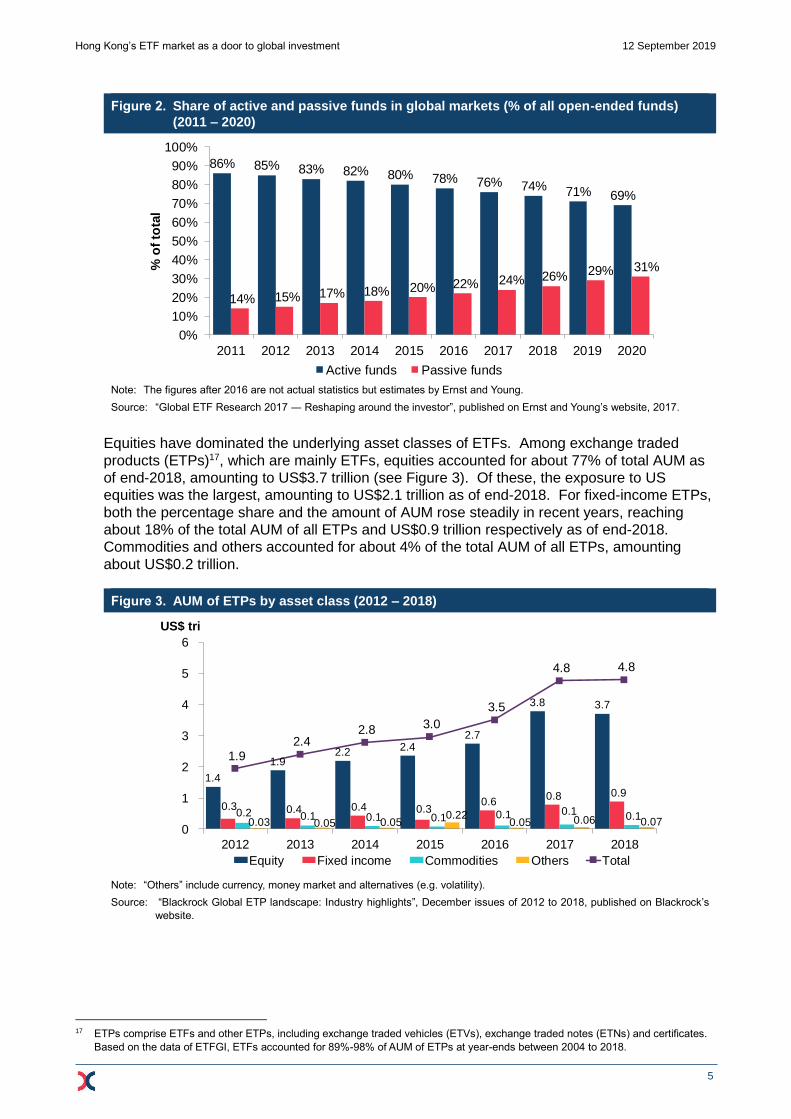
Equities have dominated the underlying asset classes of ETFs. Among exchange traded
products (ETPs)17, which are mainly ETFs, equities accounted for about 77% of total AUM as
of end-2018, amounting to US$3.7 trillion (see Figure 3). Of these, the exposure to US
equities was the largest, amounting to US$2.1 trillion as of end-2018. For fixed-income ETPs,
both the percentage share and the amount of AUM rose steadily in recent years, reaching
about 18% of the total AUM of all ETPs and US$0.9 trillion respectively as of end-2018.
Commodities and others accounted for about 4% of the total AUM of all ETPs, amounting
about US$0.2 trillion.
Figure 3. AUM of ETPs by asset class (2012 – 2018)
Note: “Others” include currency, money market and alternatives (e.g. volatility).
Source: “Blackrock Global ETP landscape: Industry highlights”, December issues of 2012 to 2018, published on Blackrock’s
website.
17 ETPs comprise ETFs and other ETPs, including exchange traded vehicles (ETVs), exchange traded notes (ETNs) and certificates.
Based on the data of ETFGI, ETFs accounted for 89%-98% of AUM of ETPs at year-ends between 2004 to 2018.
86% 85% 83% 82% 80% 78% 76% 74% 71% 69%
14% 15% 17% 18% 20% 22% 24% 26% 29% 31%
0%
10%
20%
30%
40%
50%
60%
70%
80%
90%
100%
2011 2012 2013 2014 2015 2016 2017 2018 2019 2020
% o
f to
tal
Share of active and passive funds in global markets (% of all open-ended funds) (2011-2020)
Active funds Passive funds
1.4
1.9 2.2 2.4
2.7
3.8 3.7
0.3 0.4 0.4 0.3 0.6
0.8 0.9
0.2 0.1 0.1 0.1 0.1 0.1 0.1 0.03 0.05 0.05
0.22 0.05 0.06 0.07
1.9 2.4
2.8 3.0
3.5
4.8 4.8
0
1
2
3
4
5
6
2012 2013 2014 2015 2016 2017 2018
AUM of ETP by asset class (2012-2018)
Equity Fixed income Commodities Others Total
US$ tri
Hong Kong’s ETF market as a door to global investment 12 September 2019
6
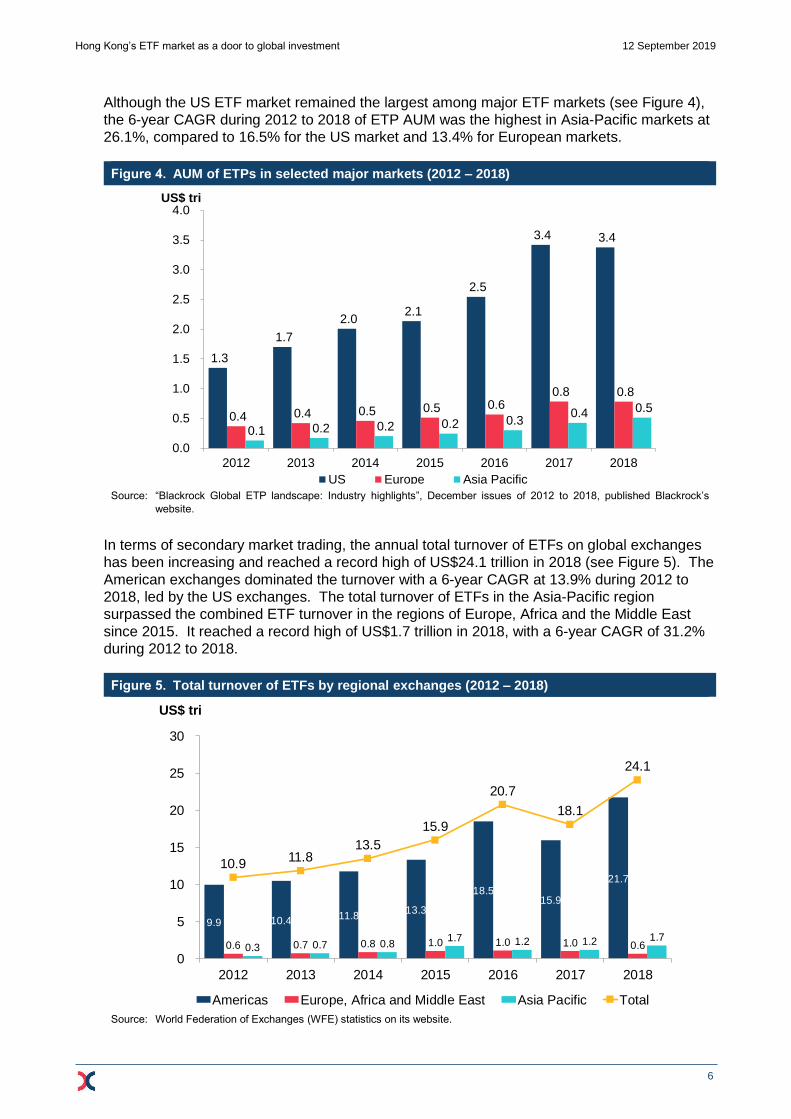
Although the US ETF market remained the largest among major ETF markets (see Figure 4),
the 6-year CAGR during 2012 to 2018 of ETP AUM was the highest in Asia-Pacific markets at
26.1%, compared to 16.5% for the US market and 13.4% for European markets.
Figure 4. AUM of ETPs in selected major markets (2012 – 2018)
Source: “Blackrock Global ETP landscape: Industry highlights”, December issues of 2012 to 2018, published Blackrock’s
website.
In terms of secondary market trading, the annual total turnover of ETFs on global exchanges
has been increasing and reached a record high of US$24.1 trillion in 2018 (see Figure 5). The
American exchanges dominated the turnover with a 6-year CAGR at 13.9% during 2012 to
2018, led by the US exchanges. The total turnover of ETFs in the Asia-Pacific region
surpassed the combined ETF turnover in the regions of Europe, Africa and the Middle East
since 2015. It reached a record high of US$1.7 trillion in 2018, with a 6-year CAGR of 31.2%
during 2012 to 2018.
Figure 5. Total turnover of ETFs by regional exchanges (2012 – 2018)
Source: World Federation of Exchanges (WFE) statistics on its website.
1.3
1.7
2.0 2.1
2.5
3.4 3.4
0.4 0.4 0.5 0.5 0.6 0.8 0.8
0.1 0.2 0.2 0.2 0.3 0.4 0.5
0.0
0.5
1.0
1.5
2.0
2.5
3.0
3.5
4.0
2012 2013 2014 2015 2016 2017 2018
AUM of ETPs in selected global markets (2012-2018)
US Europe Asia Pacific
US$ tri
9.9 10.4 11.8 13.3
18.5 15.9
21.7
0.6 0.7 0.8 1.0 1.0 1.0 0.6 0.3 0.7 0.8 1.7 1.2 1.2 1.7
10.9 11.8
13.5
15.9
20.7
18.1
24.1
0
5
10
15
20
25
30
2012 2013 2014 2015 2016 2017 2018
Total ETF turnover by region (US$ trillion)(2012-2018)
Americas Europe, Africa and Middle East Asia Pacific Total
US$ tri
Hong Kong’s ETF market as a door to global investment 12 September 2019
7
In the fastest growing Asia-Pacific region, the Japanese ETF market is the largest in terms of
AUM, accounting for 62% of the total in the region as of end-2017 while each of the Mainland
and Hong Kong markets accounted for 9% of the regional total respectively18. Another source
noted that the AUM of ETFs in the Japanese market reached US$309 billion as of end-June
2018 ― the largest in Asia Pacific, followed by US$37 billion in the Mainland market, US$36
billion in the Korean market and US$34 billion in the Hong Kong market19.
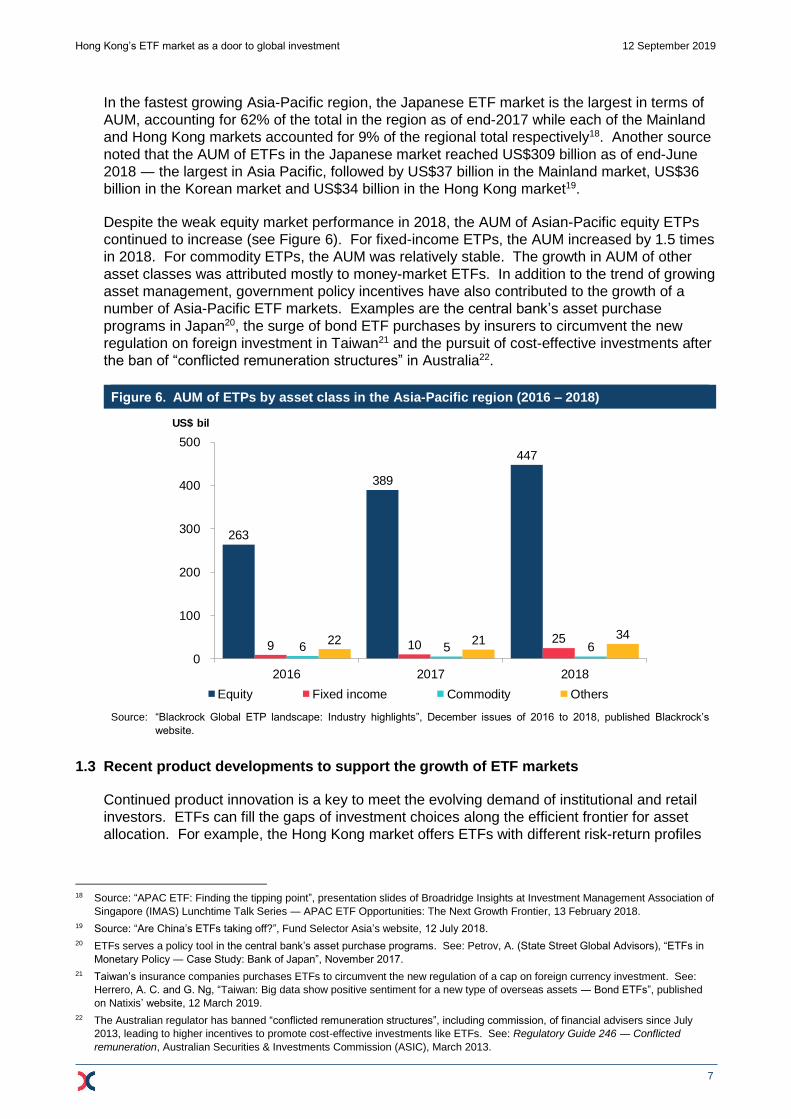
Despite the weak equity market performance in 2018, the AUM of Asian-Pacific equity ETPs
continued to increase (see Figure 6). For fixed-income ETPs, the AUM increased by 1.5 times
in 2018. For commodity ETPs, the AUM was relatively stable. The growth in AUM of other
asset classes was attributed mostly to money-market ETFs. In addition to the trend of growing
asset management, government policy incentives have also contributed to the growth of a
number of Asia-Pacific ETF markets. Examples are the central bank’s asset purchase
programs in Japan20, the surge of bond ETF purchases by insurers to circumvent the new
regulation on foreign investment in Taiwan21 and the pursuit of cost-effective investments after
the ban of “conflicted remuneration structures” in Australia22.
Figure 6. AUM of ETPs by asset class in the Asia-Pacific region (2016 – 2018)
Source: “Blackrock Global ETP landscape: Industry highlights”, December issues of 2016 to 2018, published Blackrock’s
website.
1.3 Recent product developments to support the growth of ETF markets
Continued product innovation is a key to meet the evolving demand of institutional and retail
investors. ETFs can fill the gaps of investment choices along the efficient frontier for asset
allocation. For example, the Hong Kong market offers ETFs with different risk-return profiles
18 Source: “APAC ETF: Finding the tipping point”, presentation slides of Broadridge Insights at Investment Management Association of
Singapore (IMAS) Lunchtime Talk Series ― APAC ETF Opportunities: The Next Growth Frontier, 13 February 2018.
19 Source: “Are China’s ETFs taking off?”, Fund Selector Asia’s website, 12 July 2018.
20 ETFs serves a policy tool in the central bank’s asset purchase programs. See: Petrov, A. (State Street Global Advisors), “ETFs in
Monetary Policy ― Case Study: Bank of Japan”, November 2017.
21 Taiwan’s insurance companies purchases ETFs to circumvent the new regulation of a cap on foreign currency investment. See:
Herrero, A. C. and G. Ng, “Taiwan: Big data show positive sentiment for a new type of overseas assets ― Bond ETFs”, published
on Natixis’ website, 12 March 2019.
22 The Australian regulator has banned “conflicted remuneration structures”, including commission, of financial advisers since July
2013, leading to higher incentives to promote cost-effective investments like ETFs. See: Regulatory Guide 246 ― Conflicted
remuneration, Australian Securities & Investments Commission (ASIC), March 2013.
263
389
447
9 10 25
6 5 6 22 21 34
0
100
200
300
400
500
2016 2017 2018
ETP AUM by asset class - Asia Pacfic
Equity Fixed income Commodity Others
US$ bil
Hong Kong’s ETF market as a door to global investment 12 September 2019
8
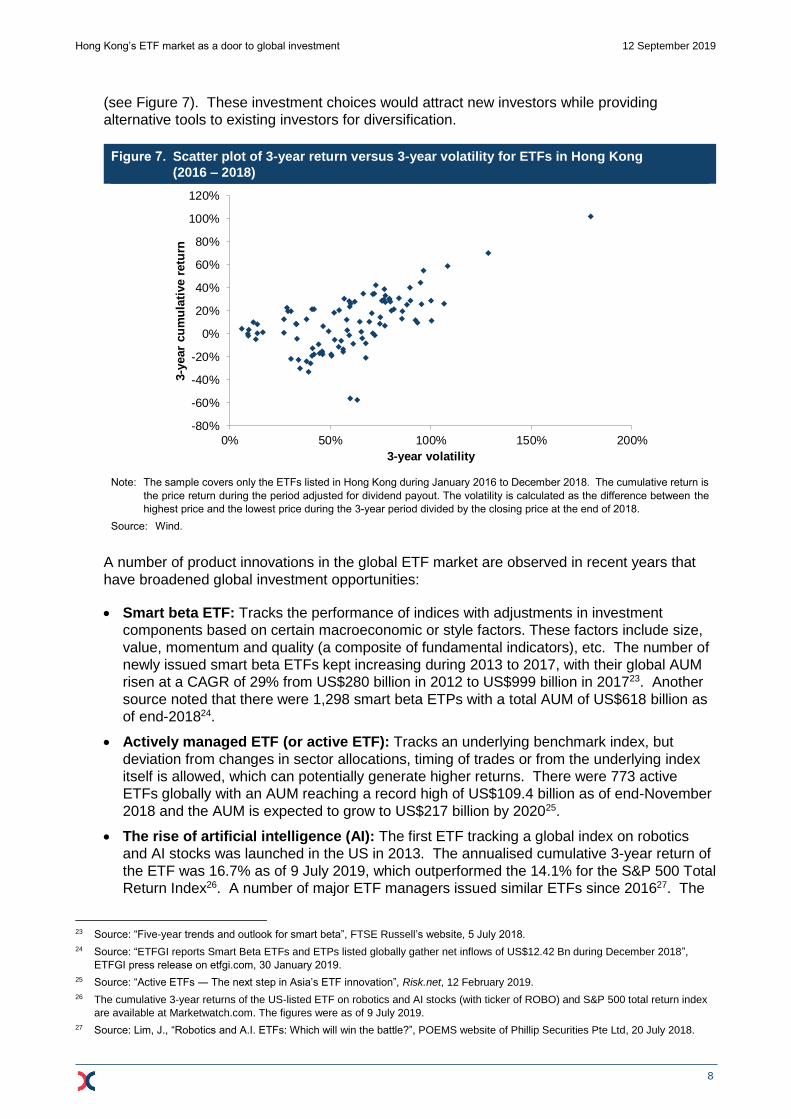
(see Figure 7). These investment choices would attract new investors while providing
alternative tools to existing investors for diversification.
Figure 7. Scatter plot of 3-year return versus 3-year volatility for ETFs in Hong Kong
(2016 – 2018)
Note: The sample covers only the ETFs listed in Hong Kong during January 2016 to December 2018. The cumulative return is
the price return during the period adjusted for dividend payout. The volatility is calculated as the difference between the
highest price and the lowest price during the 3-year period divided by the closing price at the end of 2018.
Source: Wind.
A number of product innovations in the global ETF market are observed in recent years that
have broadened global investment opportunities:
Smart beta ETF: Tracks the performance of indices with adjustments in investment
components based on certain macroeconomic or style factors. These factors include size,
value, momentum and quality (a composite of fundamental indicators), etc. The number of
newly issued smart beta ETFs kept increasing during 2013 to 2017, with their global AUM
risen at a CAGR of 29% from US$280 billion in 2012 to US$999 billion in 201723. Another
source noted that there were 1,298 smart beta ETPs with a total AUM of US$618 billion as
of end-201824.
Actively managed ETF (or active ETF): Tracks an underlying benchmark index, but
deviation from changes in sector allocations, timing of trades or from the underlying index
itself is allowed, which can potentially generate higher returns. There were 773 active
ETFs globally with an AUM reaching a record high of US$109.4 billion as of end-November
2018 and the AUM is expected to grow to US$217 billion by 202025.
The rise of artificial intelligence (AI): The first ETF tracking a global index on robotics
and AI stocks was launched in the US in 2013. The annualised cumulative 3-year return of
the ETF was 16.7% as of 9 July 2019, which outperformed the 14.1% for the S&P 500 Total
Return Index26. A number of major ETF managers issued similar ETFs since 201627. The
23 Source: “Five-year trends and outlook for smart beta”, FTSE Russell’s website, 5 July 2018.
24 Source: “ETFGI reports Smart Beta ETFs and ETPs listed globally gather net inflows of US$12.42 Bn during December 2018”,
ETFGI press release on etfgi.com, 30 January 2019.
25 Source: “Active ETFs ― The next step in Asia’s ETF innovation”, Risk.net, 12 February 2019.
26 The cumulative 3-year returns of the US-listed ETF on robotics and AI stocks (with ticker of ROBO) and S&P 500 total return index
are available at Marketwatch.com. The figures were as of 9 July 2019.
27 Source: Lim, J., “Robotics and A.I. ETFs: Which will win the battle?”, POEMS website of Phillip Securities Pte Ltd, 20 July 2018.
-80%
-60%
-40%
-20%
0%
20%
40%
60%
80%
100%
120%
0% 50% 100% 150% 200%
3-y
ear
cu
mu
lati
ve r
etu
rn
3-year volatility
3-year return vs 3-year volatility of ETFs in Hong Kong (2018)
Hong Kong’s ETF market as a door to global investment 12 September 2019
9
first AI-powered ETF tracks the performance of 30-70 stocks or real estate investment
trusts (REITs) in the US market with high probabilities of outperformance over the next 12
months, based on the interpretation of market information by the AI system. The ETF was
launched in the US market on 18 October 2017. The first-year performance of 11.8%
outperformed the 8.1% for the S&P 500 Index during the same period and was reportedly
better than those for 87% of all actively managed funds28. The same ETF issuer launched
another ETF in the US in June 2018, which covers a portfolio of 80-250 stocks in global
markets with the support of the same AI system.
Leverage and inverse (L&I) product: Delivers a multiple or the opposite of the return of
the underlying index with the use of futures or swaps. The number of L&I products in global
markets rose from 608 as of end-2013 to 901 as of end-June 2018, and the AUM of these
products rose from US$53.2 billion to US$79.9 billion during the same period29.
Environmental, Social and Governance (ESG) investing: Supports the sustainable
development of an economy but the definition or framework of ESG assessment varies
across asset managers. A survey in 2018 found that about 99% of institutional investors in
the Greater China region considered that ESG factors are important30. The number of ESG
ETFs rose from 47 as of end-2013 to 208 as of end-2018 and their AUM rose from US$5
billion to US$23 billion during the same period31.
Fixed-income ETF: The AUM of fixed-income ETPs rose from US$780 billion as of end-
2017 to US$882 billion as of end-201832. Of this, the AUM of ETPs with exposures to US
treasuries rose from US$55 billion to US$130 billion. The AUM of ETPs with exposures to
emerging markets’ debts (excluding corporate bonds) rose from US$51 billion to US$58
billion during the same period. This may be driven by the inclusion of Chinese bonds into
global bond indices, which is facilitated by the onshore access through Bond Connect.
Such growth in fixed-income ETFs may signal investors’ increasing interests in debt
instruments. A survey on global institutional investors showed that 60% of respondents
considered bond ETFs as an alternative vehicle for fixed-income exposure33. One
underlying reason for the increase in the interest in bond ETFs may be the higher capital
efficiency than buying the underlying bonds34.
Cross-listing of ETFs: Cross-listing (or mutual recognition) of ETFs broadens the range of
asset classes available to investors in a single market. In Europe, an ETF is often listed
across multiple European exchanges to accommodate investors’ preference to trade ETFs
and settle the transactions on their home exchanges. There were 2,260 ETPs listed in
Europe with 7,278 listings on 27 exchanges as of end-2017, compared with 2,116 ETPs
listed in the US on 4 exchanges35. In Hong Kong, 24% of ETFs were cross-listed from
other jurisdictions as of end-June 201736.
One of the key reasons for product developments of ETFs is to meet the diversification needs
of institutional investors. According to a survey in 2017, 51% of global institutions (vs 39% of
Asian institutions) rated asset allocation (through core and tactical strategies) as the most
28 Source: Ponczek, S., “Robot ETF leaves pros in dust, scoring wind on small-cap fliers”, Bloomberg News, 19 October 2018.
29 Source: “ETFGI reports that assets invested in leveraged and inverse ETFs and ETPs listed globally reached $79.9 billion at the
end of June 2018”, ETFGI press release on etfgi.com, 31 July 2018.
30 Source: “Ready to grow: ETF opportunities in Greater China”, Brown Brothers Harriman’s website, April 2018.
31 Source: Wilson, D, “China, Hong Kong must look offshore for ESG ETFs”, published on Fund Selector Asia’s website, 31 January
2019.
32 Source: “Blackrock Global ETP landscape: Industry highlights”, issues in December 2017 and December 2018, Blackrock’s website.
33 Source: McCollum, A., “Institutions turn to ETFs for bond market liquidity”, issued by Greenwich Associates, 18 September 2018.
34 See “Growing an institutional footprint in Asia’s ETF market”, Risk.net, 19 November 2018.
35 Source: Crigger, L., “New light shines on Europe ETF trading”, ETF.com, 18 April 2018.
36 Source: Securities and Futures Commission (SFC) research paper, “Hong Kong market and topical issues in the ETF space”,
published on the SFC’s website, 16 January 2018. (Referred to as the "SFC ETF Paper 2018".)
Hong Kong’s ETF market as a door to global investment 12 September 2019
10
important factor for ETF purchases37. Other uses of ETFs found by the survey include risk
management or hedging, rebalancing/transitional allocation, interim beta for transition, cash
equitisation for reducing idle cash, “liquidity sleeves” for providing liquidity and risk
management (e.g. through L&I products).
2. THE GROWTH OF THE MAINLAND AND HONG KONG ETF MARKETS CAN BE
COMPLEMENTARY TO EACH OTHER
The growth of Asia’s ETF market is expected to continue. The parallel growth in the Mainland
and Hong Kong ETF markets will be complementary to each other and is expected to
accelerate on further increase in market connectivity. A study predicted that the percentage
share in the total AUM of Asia-Pacific ETFs will rise from 9% in 2017 to 19% by 2025 for
Mainland ETFs and from 9% to 18% for Hong Kong, but fell from 62% to 40% for Japanese
ETFs in the same period38. The same study expected that about 75% of new net ETF inflows
into Asia-Pacific markets will come from Japan, Mainland China and Hong Kong during 2018
to 2025.
2.1 Strong diversification demand from Mainland investors
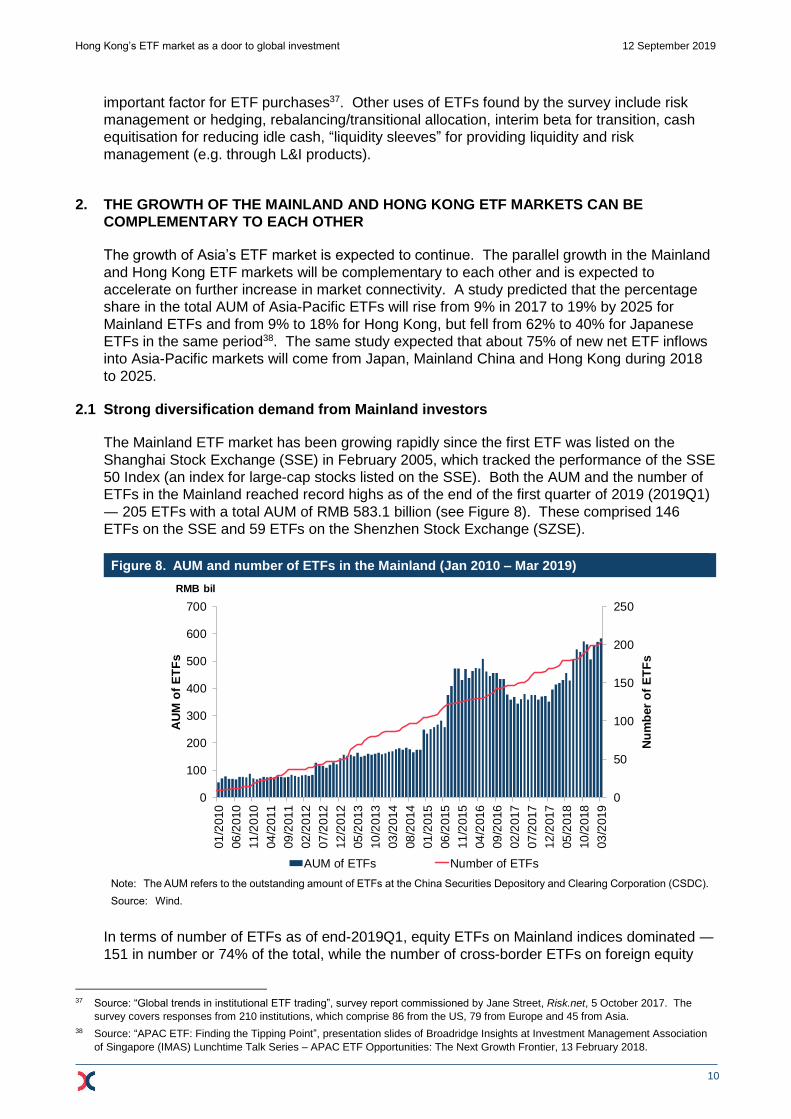
The Mainland ETF market has been growing rapidly since the first ETF was listed on the
Shanghai Stock Exchange (SSE) in February 2005, which tracked the performance of the SSE
50 Index (an index for large-cap stocks listed on the SSE). Both the AUM and the number of
ETFs in the Mainland reached record highs as of the end of the first quarter of 2019 (2019Q1)
― 205 ETFs with a total AUM of RMB 583.1 billion (see Figure 8). These comprised 146
ETFs on the SSE and 59 ETFs on the Shenzhen Stock Exchange (SZSE).
Figure 8. AUM and number of ETFs in the Mainland (Jan 2010 – Mar 2019)
Note: The AUM refers to the outstanding amount of ETFs at the China Securities Depository and Clearing Corporation (CSDC).
Source: Wind.
In terms of number of ETFs as of end-2019Q1, equity ETFs on Mainland indices dominated ―
151 in number or 74% of the total, while the number of cross-border ETFs on foreign equity
37 Source: “Global trends in institutional ETF trading”, survey report commissioned by Jane Street, Risk.net, 5 October 2017. The
survey covers responses from 210 institutions, which comprise 86 from the US, 79 from Europe and 45 from Asia.
38 Source: “APAC ETF: Finding the Tipping Point”, presentation slides of Broadridge Insights at Investment Management Association
of Singapore (IMAS) Lunchtime Talk Series – APAC ETF Opportunities: The Next Growth Frontier, 13 February 2018.
0
50
100
150
200
250
0
100
200
300
400
500
600
700
01
/2010
06
/2010
11
/2010
04
/2011
09
/2011
02
/2012
07
/2012
12
/2012
05
/2013
10
/2013
03
/2014
08
/2014
01
/2015
06
/2015
11
/2015
04
/2016
09
/2016
02
/2017
07
/2017
12
/2017
05
/2018
10
/2018
03
/2019
Nu
mb
er
of
ET
Fs
AU
M o
f E
TF
s
AUM and number of ETFs in Mainland
AUM of ETFs Number of ETFs
RMB bil
Hong Kong’s ETF market as a door to global investment 12 September 2019
11
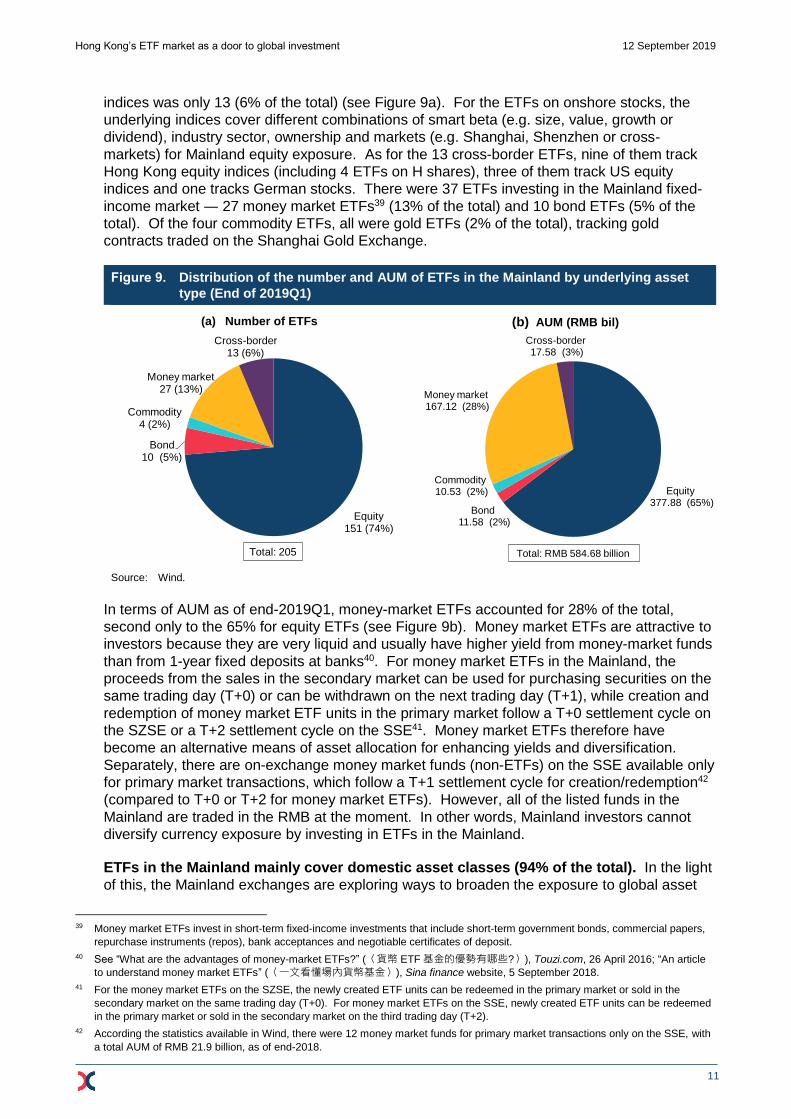
indices was only 13 (6% of the total) (see Figure 9a). For the ETFs on onshore stocks, the
underlying indices cover different combinations of smart beta (e.g. size, value, growth or
dividend), industry sector, ownership and markets (e.g. Shanghai, Shenzhen or cross-
markets) for Mainland equity exposure. As for the 13 cross-border ETFs, nine of them track
Hong Kong equity indices (including 4 ETFs on H shares), three of them track US equity
indices and one tracks German stocks. There were 37 ETFs investing in the Mainland fixed-
income market ― 27 money market ETFs39 (13% of the total) and 10 bond ETFs (5% of the
total). Of the four commodity ETFs, all were gold ETFs (2% of the total), tracking gold
contracts traded on the Shanghai Gold Exchange.
Figure 9. Distribution of the number and AUM of ETFs in the Mainland by underlying asset
type (End of 2019Q1)
(a) Number of ETFs
(b) AUM (RMB bil)
Source: Wind.
In terms of AUM as of end-2019Q1, money-market ETFs accounted for 28% of the total,
second only to the 65% for equity ETFs (see Figure 9b). Money market ETFs are attractive to
investors because they are very liquid and usually have higher yield from money-market funds
than from 1-year fixed deposits at banks40. For money market ETFs in the Mainland, the
proceeds from the sales in the secondary market can be used for purchasing securities on the
same trading day (T+0) or can be withdrawn on the next trading day (T+1), while creation and
redemption of money market ETF units in the primary market follow a T+0 settlement cycle on
the SZSE or a T+2 settlement cycle on the SSE41. Money market ETFs therefore have
become an alternative means of asset allocation for enhancing yields and diversification.
Separately, there are on-exchange money market funds (non-ETFs) on the SSE available only
for primary market transactions, which follow a T+1 settlement cycle for creation/redemption42
(compared to T+0 or T+2 for money market ETFs). However, all of the listed funds in the
Mainland are traded in the RMB at the moment. In other words, Mainland investors cannot
diversify currency exposure by investing in ETFs in the Mainland.
ETFs in the Mainland mainly cover domestic asset classes (94% of the total). In the light
of this, the Mainland exchanges are exploring ways to broaden the exposure to global asset
39 Money market ETFs invest in short-term fixed-income investments that include short-term government bonds, commercial papers,
repurchase instruments (repos), bank acceptances and negotiable certificates of deposit.
40 See “What are the advantages of money-market ETFs?” (〈貨幣 ETF基金的優勢有哪些?〉), Touzi.com, 26 April 2016; “An article
to understand money market ETFs” (〈一文看懂場內貨幣基金〉), Sina finance website, 5 September 2018.
41 For the money market ETFs on the SZSE, the newly created ETF units can be redeemed in the primary market or sold in the
secondary market on the same trading day (T+0). For money market ETFs on the SSE, newly created ETF units can be redeemed
in the primary market or sold in the secondary market on the third trading day (T+2).
42 According the statistics available in Wind, there were 12 money market funds for primary market transactions only on the SSE, with
a total AUM of RMB 21.9 billion, as of end-2018.
Equity151 (74%)
Bond10 (5%)
Commodity4 (2%)
Money market27 (13%)
Cross-border13 (6%)
Number of ETFs in the Mainland
Total: 205
Equity377.88 (65%)
Bond11.58 (2%)
Commodity10.53 (2%)
Money market167.12 (28%)
Cross-border17.58 (3%)
AUM of ETFs in Mainland
Total: RMB 584.68 billion
Hong Kong’s ETF market as a door to global investment 12 September 2019
12
classes, including cooperation with global exchanges. The SSE and the Tokyo Stock
Exchange under the Japan Exchange Group (JPX) cross-listed the first batch of ETFs with
underlying assets on each other’s market on 25 June 2019 under the China-Japan ETF
Connectivity Scheme. Under the scheme, a Japanese or Chinese ETF issuer develops a
different class of fund units called “feeder ETF” that invests in at least 90% of a target ETF
listed on the other exchange, subject to quotas under the Qualified Foreign Institutional
Investor (QFII) and Qualified Domestic Institutional Investor (QDII) schemes. The target ETF
should have been listed for more than one year and should have enough liquidity in the home
market. For the first batch of 4 ETFs cross-listed on the SSE, three of them track Nikkei 225
index and one tracks the Tokyo Stock Price Index (TOPIX). They amounted to a total AUM of
RMB 509 million as of 21 June 201943. The average daily turnover of these ETFs was RMB
161.8 million during the first week and fell to RMB 65.1 million during the second week44.
In the Mainland listed fund market, listed open-ended funds (LOFs) are listed and traded
on exchanges like ETFs. Similar to ETFs, LOFs are liquid and convenient tools for investing
in different underlying asset classes, including stocks, bonds, mixed strategy (with both stocks
and bonds), commodities and cross-border investments (through QDIIs). LOFs usually adopt
active strategies with the aim to outperform benchmarks and hence have higher management
expenses than ETFs.
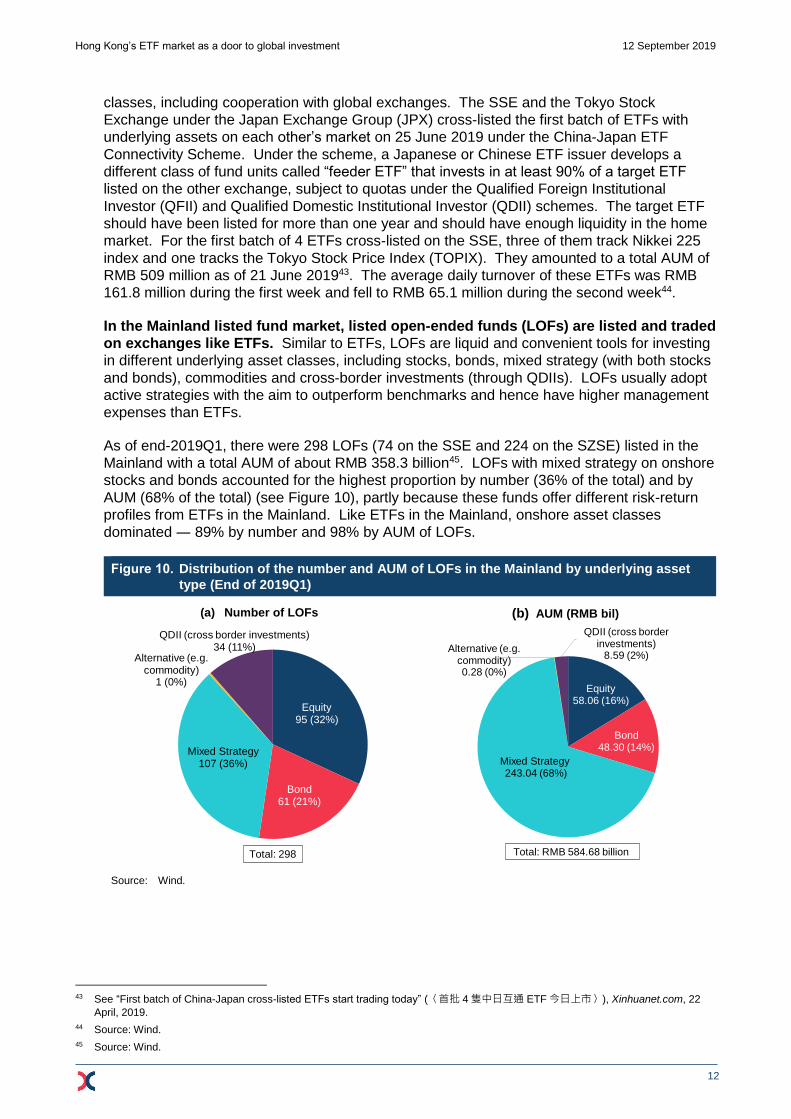
As of end-2019Q1, there were 298 LOFs (74 on the SSE and 224 on the SZSE) listed in the
Mainland with a total AUM of about RMB 358.3 billion45. LOFs with mixed strategy on onshore
stocks and bonds accounted for the highest proportion by number (36% of the total) and by
AUM (68% of the total) (see Figure 10), partly because these funds offer different risk-return
profiles from ETFs in the Mainland. Like ETFs in the Mainland, onshore asset classes
dominated ― 89% by number and 98% by AUM of LOFs.
Figure 10. Distribution of the number and AUM of LOFs in the Mainland by underlying asset
type (End of 2019Q1)
(a) Number of LOFs
(b) AUM (RMB bil)
Source: Wind.
43 See “First batch of China-Japan cross-listed ETFs start trading today” (〈首批 4隻中日互通 ETF今日上市〉), Xinhuanet.com, 22
April, 2019.
44 Source: Wind.
45 Source: Wind.
Equity95 (32%)
Bond61 (21%)
Mixed Strategy107 (36%)
Alternative (e.g. commodity)
1 (0%)
QDII (cross border investments)34 (11%)
Breakdown of LOF by asset class (Number)
Total: 298
Equity58.06 (16%)
Bond48.30 (14%)
Mixed Strategy243.04 (68%)
Alternative (e.g. commodity)0.28 (0%)
QDII (cross border investments)
8.59 (2%)
Breakdown of LOF by asset class (Number)
Total: RMB 584.68 billion
Hong Kong’s ETF market as a door to global investment 12 September 2019
13
In addition to ETFs and LOFs, Mainland-listed funds also include structured funds46.
The mother fund units are divided into sub-units (structured funds) with different expected
risks and incomes, among which part or all of the fund unit types may be traded. The creation
and redemption can be conducted only for mother units but not for sub-units. The mother fund
units of structured funds on the SSE are LOFs47 and those on the SZSE are not listed and
traded on the exchange. To protect retail investors, entry barriers are imposed since May
2017 for an investor to trade structured funds. These include a minimum asset value of RMB
300,000 during the past 20 trading days and the requirement to sign a risk disclosure
statement with the broker. In contrast, there are no minimum requirements on assets for
investors to trade ETFs and LOFs. As of end-2018, there were 122 structured funds (each
with A class and B class of sub-units), with a total AUM of RMB 111.0 billion. Similar to ETFs
and LOFs, the investment scope of structured funds is mainly confined to onshore stocks and
bonds.
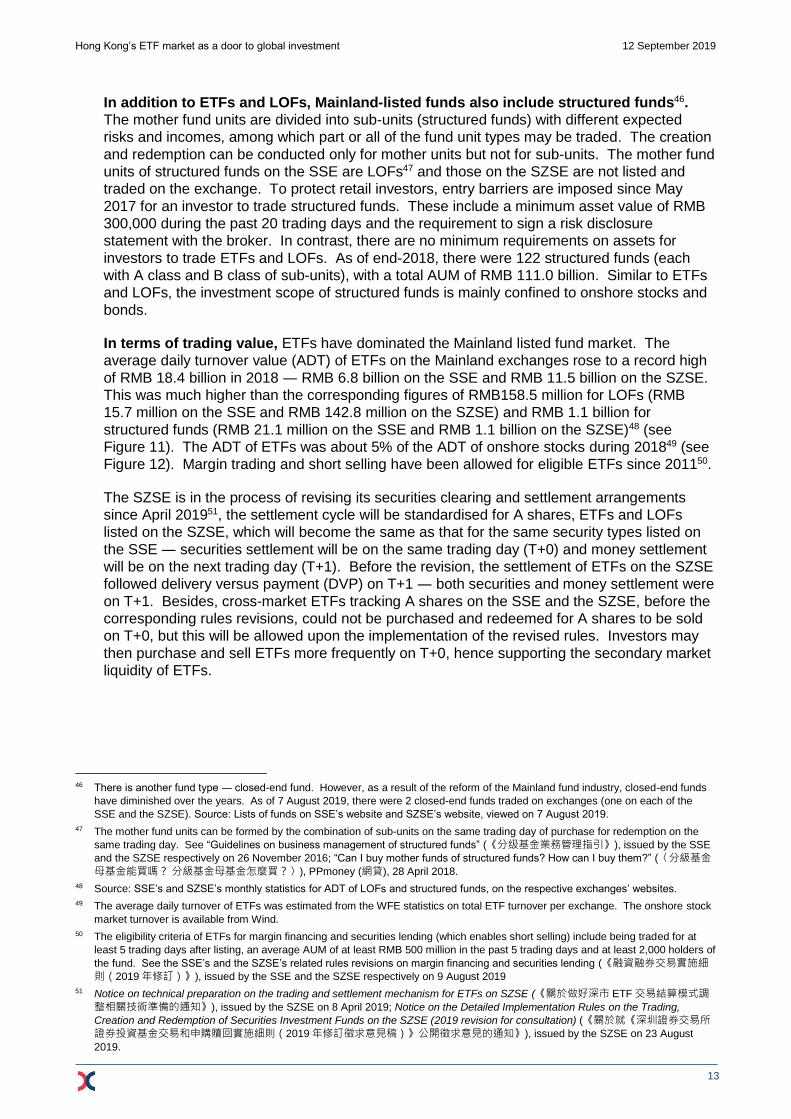
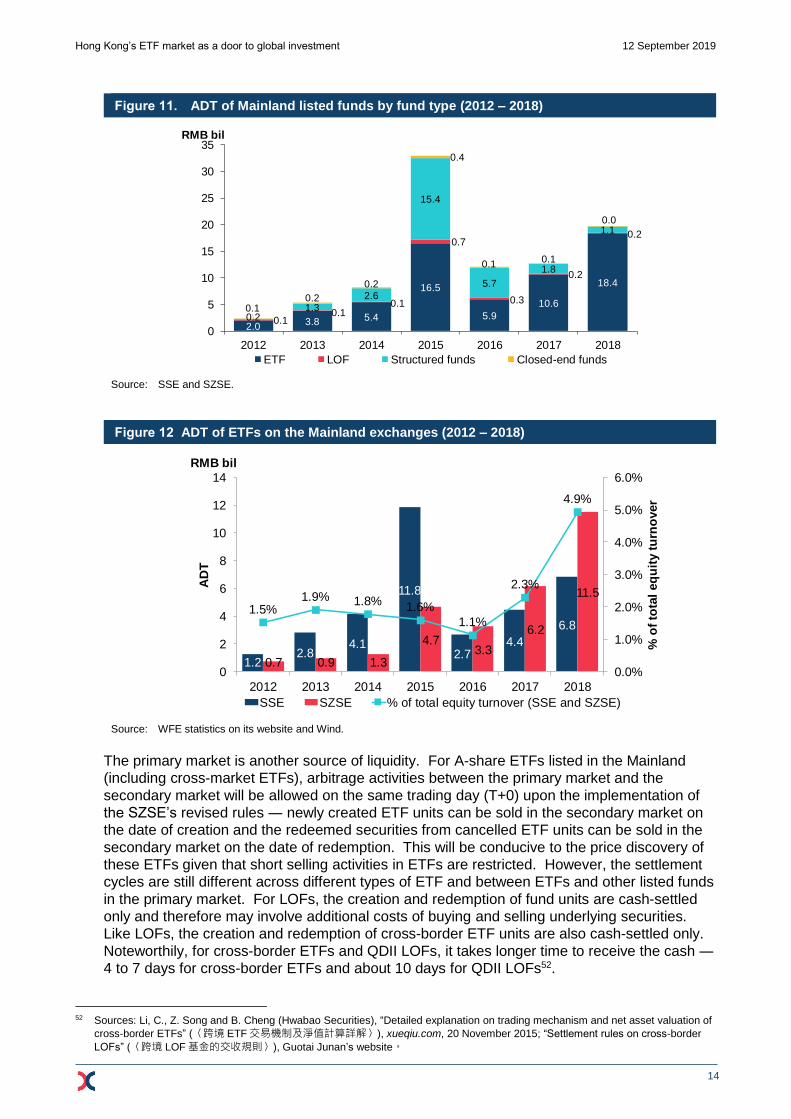
In terms of trading value, ETFs have dominated the Mainland listed fund market. The
average daily turnover value (ADT) of ETFs on the Mainland exchanges rose to a record high
of RMB 18.4 billion in 2018 ― RMB 6.8 billion on the SSE and RMB 11.5 billion on the SZSE.
This was much higher than the corresponding figures of RMB158.5 million for LOFs (RMB
15.7 million on the SSE and RMB 142.8 million on the SZSE) and RMB 1.1 billion for
structured funds (RMB 21.1 million on the SSE and RMB 1.1 billion on the SZSE)48 (see
Figure 11). The ADT of ETFs was about 5% of the ADT of onshore stocks during 201849 (see
Figure 12). Margin trading and short selling have been allowed for eligible ETFs since 201150.
The SZSE is in the process of revising its securities clearing and settlement arrangements
since April 201951, the settlement cycle will be standardised for A shares, ETFs and LOFs
listed on the SZSE, which will become the same as that for the same security types listed on
the SSE ― securities settlement will be on the same trading day (T+0) and money settlement
will be on the next trading day (T+1). Before the revision, the settlement of ETFs on the SZSE
followed delivery versus payment (DVP) on T+1 ― both securities and money settlement were
on T+1. Besides, cross-market ETFs tracking A shares on the SSE and the SZSE, before the
corresponding rules revisions, could not be purchased and redeemed for A shares to be sold
on T+0, but this will be allowed upon the implementation of the revised rules. Investors may
then purchase and sell ETFs more frequently on T+0, hence supporting the secondary market
liquidity of ETFs.
46 There is another fund type ― closed-end fund. However, as a result of the reform of the Mainland fund industry, closed-end funds
have diminished over the years. As of 7 August 2019, there were 2 closed-end funds traded on exchanges (one on each of the
SSE and the SZSE). Source: Lists of funds on SSE’s website and SZSE’s website, viewed on 7 August 2019.
47 The mother fund units can be formed by the combination of sub-units on the same trading day of purchase for redemption on the
same trading day. See “Guidelines on business management of structured funds” (《分级基金業務管理指引》), issued by the SSE
and the SZSE respectively on 26 November 2016; “Can I buy mother funds of structured funds? How can I buy them?” (〈分級基金
母基金能買嗎? 分級基金母基金怎麼買?〉), PPmoney (網貸), 28 April 2018.
48 Source: SSE’s and SZSE’s monthly statistics for ADT of LOFs and structured funds, on the respective exchanges’ websites.
49 The average daily turnover of ETFs was estimated from the WFE statistics on total ETF turnover per exchange. The onshore stock
market turnover is available from Wind.
50 The eligibility criteria of ETFs for margin financing and securities lending (which enables short selling) include being traded for at
least 5 trading days after listing, an average AUM of at least RMB 500 million in the past 5 trading days and at least 2,000 holders of
the fund. See the SSE’s and the SZSE’s related rules revisions on margin financing and securities lending (《融資融券交易實施細則(2019年修訂)》), issued by the SSE and the SZSE respectively on 9 August 2019
51 Notice on technical preparation on the trading and settlement mechanism for ETFs on SZSE (《關於做好深市 ETF交易結算模式調
整相關技術準備的通知》), issued by the SZSE on 8 April 2019; Notice on the Detailed Implementation Rules on the Trading,
Creation and Redemption of Securities Investment Funds on the SZSE (2019 revision for consultation) (《關於就《深圳證券交易所證券投資基金交易和申購贖回實施細則(2019年修訂徵求意見稿)》公開徵求意見的通知》), issued by the SZSE on 23 August
2019.
Hong Kong’s ETF market as a door to global investment 12 September 2019
14
Figure 11. ADT of Mainland listed funds by fund type (2012 – 2018)
Source: SSE and SZSE.
Figure 12 ADT of ETFs on the Mainland exchanges (2012 – 2018)
Source: WFE statistics on its website and Wind.
The primary market is another source of liquidity. For A-share ETFs listed in the Mainland
(including cross-market ETFs), arbitrage activities between the primary market and the
secondary market will be allowed on the same trading day (T+0) upon the implementation of
the SZSE’s revised rules ― newly created ETF units can be sold in the secondary market on
the date of creation and the redeemed securities from cancelled ETF units can be sold in the
secondary market on the date of redemption. This will be conducive to the price discovery of
these ETFs given that short selling activities in ETFs are restricted. However, the settlement
cycles are still different across different types of ETF and between ETFs and other listed funds
in the primary market. For LOFs, the creation and redemption of fund units are cash-settled
only and therefore may involve additional costs of buying and selling underlying securities.
Like LOFs, the creation and redemption of cross-border ETF units are also cash-settled only.
Noteworthily, for cross-border ETFs and QDII LOFs, it takes longer time to receive the cash ―
4 to 7 days for cross-border ETFs and about 10 days for QDII LOFs52.
52 Sources: Li, C., Z. Song and B. Cheng (Hwabao Securities), “Detailed explanation on trading mechanism and net asset valuation of
cross-border ETFs” (〈跨境 ETF交易機制及淨值計算詳解〉), xueqiu.com, 20 November 2015; “Settlement rules on cross-border
LOFs” (〈跨境 LOF基金的交收規則〉), Guotai Junan’s website。
2.03.8 5.4
16.5
5.9
10.6
18.4
0.10.1
0.1
0.7
0.3
0.2
0.2
0.21.3
2.6
15.4
5.7
1.8
1.1
0.10.2
0.2
0.4
0.10.1
0.0
0
5
10
15
20
25
30
35
2012 2013 2014 2015 2016 2017 2018
Turnover of listed funds by fund type (2012-2018)
ETF LOF Structured funds Closed-end funds
RMB bil
1.2 2.8
4.1
11.8
2.7 4.4
6.8
0.7 0.9 1.3
4.7 3.3
6.2
11.5
1.5%1.9% 1.8% 1.6%
1.1%
2.3%
4.9%
0.0%
1.0%
2.0%
3.0%
4.0%
5.0%
6.0%
0
2
4
6
8
10
12
14
2012 2013 2014 2015 2016 2017 2018
% o
f to
tal
eq
uit
y t
urn
over
AD
T
Average daily turnover of ETFs in Mainland (RMB billion)(2012-2018)
SSE SZSE % of total equity turnover (SSE and SZSE)
RMB bil
Hong Kong’s ETF market as a door to global investment 12 September 2019
15
To summarise, Mainland investors may demand investment diversification through ETFs.
Rising interests in ETFs by Mainland investors were observed from the growing market size
and trading activities of the Mainland ETF market. However, Mainland-listed funds are
dominated by funds on domestic assets (mainly equity) while the supply of listed funds on
global assets was limited. The time delay to receive cash from the redemption of listed funds
on global assets may constrain the liquidity of these funds. In the light of these, it would be
beneficial to Mainland investors if they have access to the Hong Kong ETF market which
provides more varieties of global asset classes (see Section 2.2).
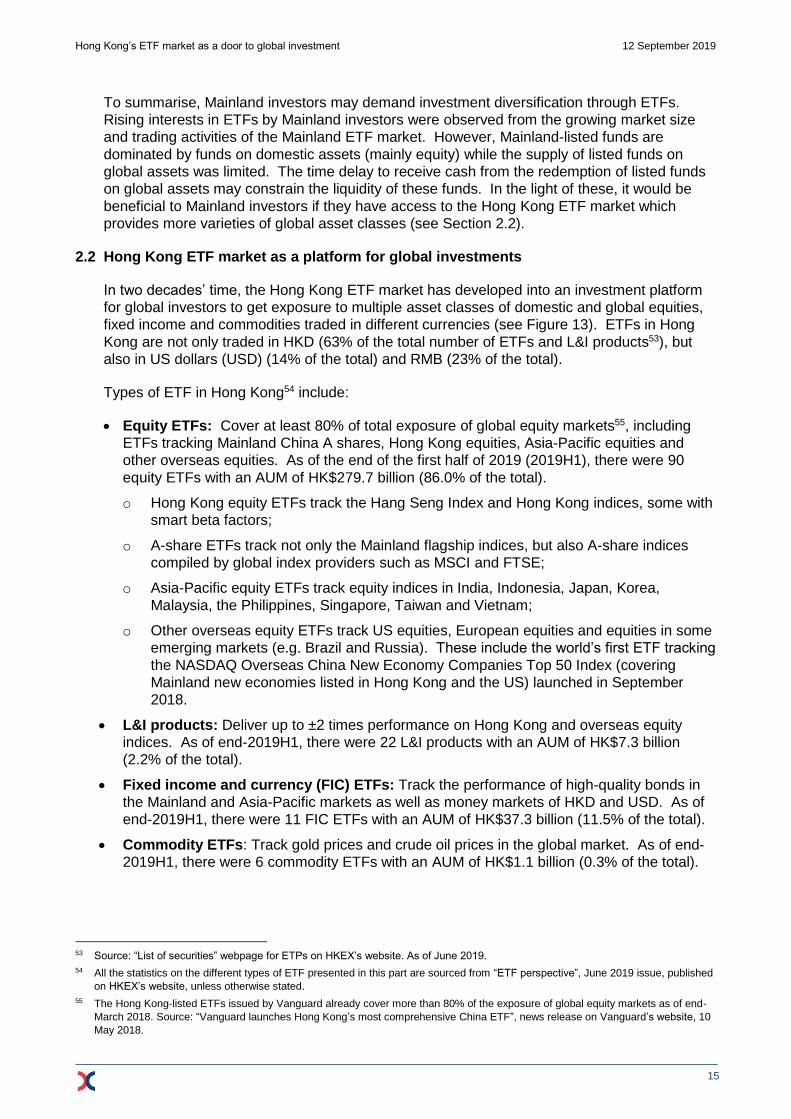
2.2 Hong Kong ETF market as a platform for global investments
In two decades’ time, the Hong Kong ETF market has developed into an investment platform
for global investors to get exposure to multiple asset classes of domestic and global equities,
fixed income and commodities traded in different currencies (see Figure 13). ETFs in Hong
Kong are not only traded in HKD (63% of the total number of ETFs and L&I products53), but
also in US dollars (USD) (14% of the total) and RMB (23% of the total).
Types of ETF in Hong Kong54 include:
Equity ETFs: Cover at least 80% of total exposure of global equity markets55, including
ETFs tracking Mainland China A shares, Hong Kong equities, Asia-Pacific equities and
other overseas equities. As of the end of the first half of 2019 (2019H1), there were 90
equity ETFs with an AUM of HK$279.7 billion (86.0% of the total).
o Hong Kong equity ETFs track the Hang Seng Index and Hong Kong indices, some with
smart beta factors;
o A-share ETFs track not only the Mainland flagship indices, but also A-share indices
compiled by global index providers such as MSCI and FTSE;
o Asia-Pacific equity ETFs track equity indices in India, Indonesia, Japan, Korea,
Malaysia, the Philippines, Singapore, Taiwan and Vietnam;
o Other overseas equity ETFs track US equities, European equities and equities in some
emerging markets (e.g. Brazil and Russia). These include the world’s first ETF tracking
the NASDAQ Overseas China New Economy Companies Top 50 Index (covering
Mainland new economies listed in Hong Kong and the US) launched in September
2018.
L&I products: Deliver up to ±2 times performance on Hong Kong and overseas equity
indices. As of end-2019H1, there were 22 L&I products with an AUM of HK$7.3 billion
(2.2% of the total).
Fixed income and currency (FIC) ETFs: Track the performance of high-quality bonds in
the Mainland and Asia-Pacific markets as well as money markets of HKD and USD. As of
end-2019H1, there were 11 FIC ETFs with an AUM of HK$37.3 billion (11.5% of the total).
Commodity ETFs: Track gold prices and crude oil prices in the global market. As of end-
2019H1, there were 6 commodity ETFs with an AUM of HK$1.1 billion (0.3% of the total).
53 Source: “List of securities” webpage for ETPs on HKEX’s website. As of June 2019.
54 All the statistics on the different types of ETF presented in this part are sourced from “ETF perspective”, June 2019 issue, published
on HKEX’s website, unless otherwise stated.
55 The Hong Kong-listed ETFs issued by Vanguard already cover more than 80% of the exposure of global equity markets as of end-
March 2018. Source: “Vanguard launches Hong Kong’s most comprehensive China ETF”, news release on Vanguard’s website, 10
May 2018.
Hong Kong’s ETF market as a door to global investment 12 September 2019
16
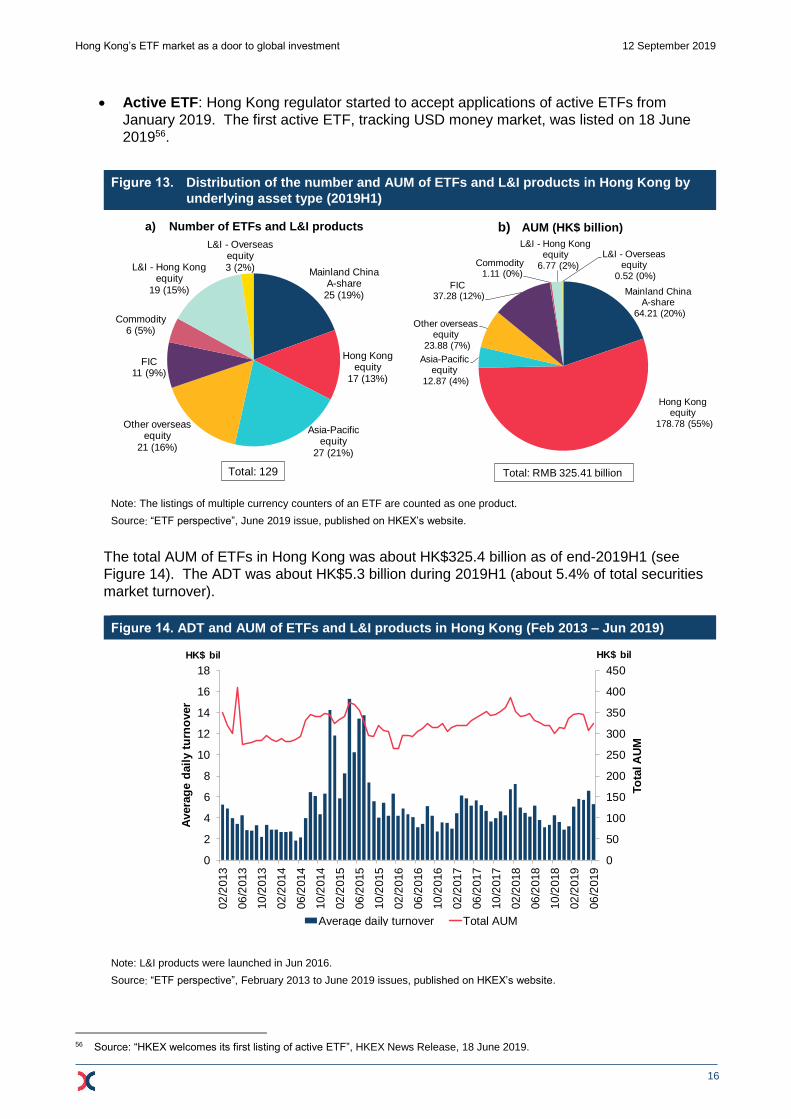
Active ETF: Hong Kong regulator started to accept applications of active ETFs from
January 2019. The first active ETF, tracking USD money market, was listed on 18 June
201956.
Figure 13. Distribution of the number and AUM of ETFs and L&I products in Hong Kong by
underlying asset type (2019H1)
a) Number of ETFs and L&I products
b) AUM (HK$ billion)
Note: The listings of multiple currency counters of an ETF are counted as one product.
Source: “ETF perspective”, June 2019 issue, published on HKEX’s website.
The total AUM of ETFs in Hong Kong was about HK$325.4 billion as of end-2019H1 (see
Figure 14). The ADT was about HK$5.3 billion during 2019H1 (about 5.4% of total securities
market turnover).
Figure 14. ADT and AUM of ETFs and L&I products in Hong Kong (Feb 2013 – Jun 2019)
Note: L&I products were launched in Jun 2016.
Source: “ETF perspective”, February 2013 to June 2019 issues, published on HKEX’s website.
56 Source: “HKEX welcomes its first listing of active ETF”, HKEX News Release, 18 June 2019.
Mainland China A-share
25 (19%)
Hong Kong equity
17 (13%)
Asia-Pacific equity
27 (21%)
Other overseas equity
21 (16%)
FIC11 (9%)
Commodity6 (5%)
L&I - Hong Kong equity
19 (15%)
L&I - Overseas equity3 (2%)
Distribution of Number of ETFs in Hong Kong (2019H1)
Total: 129
Mainland China A-share
64.21 (20%)
Hong Kong equity
178.78 (55%)
Asia-Pacific equity
12.87 (4%)
Other overseas equity
23.88 (7%)
FIC37.28 (12%)
Commodity1.11 (0%)
L&I - Hong Kong equity
6.77 (2%)
L&I - Overseas equity
0.52 (0%)
Distribution of AUM of ETFs in Hong Kong (2019H1)
Total: RMB 325.41 billion
0
50
100
150
200
250
300
350
400
450
0
2
4
6
8
10
12
14
16
18
02
/2013
06
/2013
10
/2013
02
/2014
06
/2014
10
/2014
02
/2015
06
/2015
10
/2015
02
/2016
06
/2016
10
/2016
02
/2017
06
/2017
10
/2017
02
/2018
06
/2018
10
/2018
02
/2019
06
/2019
To
tal A
UM
Avera
ge d
ail
y t
urn
over
Trading and AUM of ETFs in Hong Kong
Average daily turnover Total AUM
HK$ bil HK$ bil
Hong Kong’s ETF market as a door to global investment 12 September 2019
17
Institutional investors accounted for over 81% of the ETF turnover in Hong Kong during 2016
and the first half of 2017 and the average transaction size of ETFs doubled from HK$224,000
during 2007 to HK$459,000 during the first half of 201757. A potential driver for institutional
investor participation would be the growing number of global asset managers in Hong Kong ―
the number of licensed asset management companies in Hong Kong rose by 14% from 1,300
as of end-2016 to 1,477 as of end-2017 and further to 1,643 as of end-201858. Besides, they
are interested in fixed-income ETFs, which are treated as alternatives for fixed-income
exposure ― a survey in 201859 showed that 83% of institutional investors in Hong Kong
already invested in fixed-income ETFs, which was higher than 78% for equity ETFs and 25%
for commodity ETFs.
The Hong Kong ETF market is characterised by diverse asset-class exposures and a broad
institutional investor base. The market’s edges on the issuance and trading of ETFs further
support the prosperity of the market. These are discussed in Section 3.
2.3 Complementary nature of the Mainland and Hong Kong ETF markets
The product composition, investor base and market access of the ETF market in the Mainland
and Hong Kong are very different. Yet, both markets demonstrate the growing appetite of
investors for ETF investments. (The features of ETFs and LOFs in the Mainland as well as
ETFs in Hong Kong are summarised in the Appendix.)
In the Mainland, the growing interests in ETFs and the high proportion of ETFs on domestic
assets may hint at the demand for asset diversification by Mainland fund investors. However,
Mainland fund investors can only invest in global assets through funds under the QDII scheme
and the mutual recognition of funds agreement with Hong Kong, as well as a few cross-listed
Japanese ETFs (see Section 2.1). On the contrary, Hong Kong ETFs cover a wide range of
Asia-Pacific and overseas equities as well as other global asset classes including fixed
income, currency and commodity. These ETF products could be considered as alternatives
for Mainland investors.
In respect of investor base, retail investors are dominated in the Mainland market, who
accounted for about 86% of turnover value in A-share market during 201860. The relatively
low degree of institutional investor participation may limit the growth of trading activities in the
ETF primary market (creation/redemption of ETF units), which is important to reduce the
premium or discount to an ETF’s NAV, in other words, to achieve a fair pricing of an ETF. The
global institutional investor base in Hong Kong could be complementary to the investor base in
the Mainland to support the growth of the Mainland ETF market.
Hong Kong, on the other hand, is already an ETF marketplace with a wide range of asset
classes covering Mainland and global assets. However, the range of Mainland asset classes
is still rather limited. Take A-share ETFs as an example. About a half of Hong Kong-listed A-
share ETFs track the popular A-share indices in Mainland ― out of 25 A-share ETFs as of
end-June 2019, there were 8 ETFs tracking the CSI 300 Index and 4 ETFs tracking the FTSE
China A50 Index61. In comparison, Mainland A-share ETFs not only track the headline
indices, but also indices of different sectors, ownership and smart betas (e.g. growth, value
57 Source: “SFC ETF Paper 2018”.
58 Source: SFC, “Asset and Wealth Management Activities Survey”, 2017 and 2018 issues, published on the SFC website. (Referred
to as the “SFC Asset Management Survey 2018” for the 2018 issue.)
59 Source: “Ready to grow: ETF opportunities in Greater China”, published on Brown Brothers Harriman’s website, April 2018.
60 Source: Mee, K. and G, Ralston, “Compelling characteristics of the A-shares market”, published on Insight webpage of Schroders’
website, 27 March 2019.
61 Source: “List of securities” webpage for ETPs on HKEX’s website.
Hong Kong’s ETF market as a door to global investment 12 September 2019
18
and dividend, etc). More diversified product composition in the Hong Kong ETF market, e.g.
through access to Mainland ETFs, could contribute to attracting new investors worldwide.
In respect of trading activities, ETF turnover in the Hong Kong market is rather concentrated
on a relatively small number of products ― the five ETFs62 with the highest turnover value
accounted for 90% of total ETF turnover value during 2019H1. Mainland investors may have
different appetite of ETF investments across different asset classes. Opening access of Hong
Kong ETF market to Mainland investors could be a potential driver of growth for the secondary
market trading activities of Hong Kong ETFs.
Given the complementary nature of products and investors in the Mainland and Hong Kong, a
potential increase of Mainland-Hong Kong market connectivity in the ETF market could meet
investors’ different investment appetite and improve the liquidity of the ETF primary and
secondary markets on both sides. This could also further strengthen Hong Kong’s edges as
the Asia-Pacific hub for ETFs as discussed in Section 3.
3. HONG KONG’S EDGES AS THE ASIA-PACIFIC HUB FOR ISSUING AND TRADING ETFS
3.1 Issuers’ considerations to issue ETFs in Hong Kong
Given the growing demand for global passive investments, the number of issuers (or ETF
managers) in the Hong Kong ETF market has grown steadily. The number of ETF managers
rose from 7 in 2008 to 21 in 2012 and to 27 in 201863, despite the withdrawal of some ETF
managers from the market due to keen competition and changing market sentiment. The
attractiveness of the Hong Kong ETF market to issuers lies in the factors discussed below.
First, the presence of a global investor base with increasing demand for ETFs. In 2018,
62% of the funding sources of asset and wealth management in Hong Kong came from global
investors64, including global asset managers with Asia-Pacific operations headquartered in
Hong Kong. These global investors have been investing in Mainland securities through Hong
Kong, which are facilitated by Stock Connect, Bond Connect, and QFII and RQFII schemes.
The optimism over the inclusion of A shares into global indices would further accelerate the
inflows. Besides, the demand of local institutions for ETF investments is expected to rise. For
pensions in Hong Kong, the AUM of Mandatory Provident Fund (MPF) schemes reached
HK$813 billion as of end-2018 with an average yearly inflow of about HK$40 billion65.
Mandatory Provident Fund Authority (MPFA) accepted 131 ETFs as index-tracking collective
investment schemes (ITCIS) into the investment scope of MPF schemes in Hong Kong66.
Second, the rising number of market makers support the market liquidity. In Hong Kong,
an ETF is required to have at least one market maker. The number of ETF market makers,
which can be proprietary trading firms or investment banks, increased from 14 in 2008 to 24 in
2012 and to 33 in 201867. Market makers make profits on arbitrage activities between the
primary and secondary markets and their activities provide liquidity to secondary trading of the
62 These comprise five ETFs tracking FTSE China A50 Index, CSI 300 Index, HSI and Hang Seng China Enterprises Index (HSCEI)
respectively. Source: HKEX.
63 The figures on 2008 and 2012 (up to May) are sourced from the presentation slides at HKEX’s seminar on RQFII ETFs on 19 June
2012 (see “HKEX hosts seminar on RQFII ETFs”, HKEX News Release, 19 June 2012); the figure in 2018 (as of end-2018) is
sourced from the “List of securities” webpage for ETPs on HKEX’s website.
64 Source: SFC Asset Management Survey 2018.
65 Source: “Mandatory Provident Fund Schemes Statistical Digest”, MPFA’s website, December 2018.
66 Source: MPFA’s website (as of 13 May 2019).
67 The figures in 2008 and 2012 (up to May) are sourced from the presentation slides at HKEX’s seminar on RQFII ETFs on 19 June
2012 (see “HKEX hosts seminar on RQFII ETFs”, HKEX News release, 19 June 2012); the figure in 2018 (as of end-2018) is
sourced from the “List of securities” webpage for ETPs on HKEX’s website.
Hong Kong’s ETF market as a door to global investment 12 September 2019
19
ETFs. Market makers are obliged to input market making orders upon an occurrence of a
“wide spread” for at least 3 minutes. The market making order may range from 4 to 32
spreads depending on the ETF68. Market makers have to submit two-sided market making
orders with 3 to 30 spreads (depending on the ETF) within 90 seconds for 3 minutes. In fact,
certain ETFs are usually being quoted to the tightest spread in accordance to the spread table.
Market makers may provide even tighter quotes if the tick sizes in the spread table can be
reduced for ETFs, which have been suggested by market participants. The market making
obligations would help smoothen out the demand for redemption during market correction.
For example, during the Mainland stock market correction in 2015, although there were major
redemptions, these redemption requests on ETF managers were met in an orderly manner
without activating any redemption tools such as redemption suspension or gate69.
Third, the “Trade Asia in Asia” trading philosophy highlights Hong Kong’s geographical
advantage for ETFs on Asian underlying assets. In addition to time zone preference, asset
managers in Hong Kong are experienced in investing in Asia-Pacific assets and over 65% of
assets managed in Hong Kong were invested in Asia Pacific during 2014 to 201870. ETF
liquidity tends to go with the availability of trading in the underlying assets due to hedging
needs. The bid-ask spread, i.e. the trading cost, usually decreases with increasing liquidity.
The bid-ask spread can be wider for US ETFs on underlying assets in international markets,
which may be closed when the US market is still trading71. When the underlying market is
opened, ETF managers and market makers can hedge their risks in the underlying markets
and are more willing to support the liquidity of the ETF. Otherwise, they need to rely on
estimating the fair value when the underlying market is closed. Therefore, the liquidity of ETFs
in Hong Kong on Asian underlying assets tends to be better than those in American and
European time zones.
Fourth, the market-friendly regulatory environment supports the issuance of a diverse
range of ETFs. The Hong Kong market regulator, the Securities and Futures Commission
(SFC), seeks to strike a balance between market development and investor protection72. To
support product innovation, the SFC approved the launch of L&I products in February 2016
amid the rising demand in Asian markets. L&I products are designed for sophisticated trading-
oriented investors with short-term investment horizon. To avoid excessive risk taking, the SFC
capped the leverage factor at two times, alongside with requiring warnings as upfront
disclosure in offering documents and different naming from ETFs73. Since July 2017, the SFC
has accelerated the authorisation of investment funds with a target to limit the processing time
of an application to within 2 months for “Simple Applications” and within 6 months for
“Complex Applications”74. Effective from January 2019, the SFC extended the coverage of
68 ETPs are classified into 5 groups (A-E) which determine the market making obligations. Prior to the listing of an ETP, HKEX will
consult the individual ETP issuer and market makers and set the ETP’s grouping. See “Market making arrangements of exchange
traded products”, information sheet on the HKEX website, viewed on 26 June 2019.
69 See “SFC ETF Paper 2018”.
70 Source: SFC Asset Management Survey 2018.
71 Source: Hammond, O. H., M. Lieder, “Debunking myths about ETF liquidity”, published on JP Morgan Asset Management’s website,
May 2015.
72 The authorisation of ETFs in Hong Kong as “collective investment scheme” is governed by the Code on Unit Trusts and Mutual
Funds (“UT Code”) of the SFC while authorised ETFs can be listed once they meet the requirements set out in Chapter 20 of the
Listing Rules of the Stock Exchange of Hong Kong (SEHK).
73 See Circular on Leveraged and Inverse Products, issued by the SFC, 5 February 2016; Supplemental Circular on Leveraged and
Inverse Products, issued by the SFC, 14 March 2019; “How do L&I Products differ from ETFs?”, the Chin Family website, 8 May
2019.
74 See Circular to Management Companies of SFC-authorised unit trusts and mutual funds - Launch of pilot revamped process to
enhance the processing of post authorisation applications, issued by SFC, 30 June 2017. “Complex Applications” refer to those
with new and/or change of appointment of key operators, change of place of domicile of SFC-authorised funds, merger of SFC-
authorised funds, termination of SFC-authorised funds involving specific issues or material issues and/or policy implications relating
to the application. Otherwise, the applications will be classified as “Simple Applications”.
Hong Kong’s ETF market as a door to global investment 12 September 2019
20
authorisation to include active ETFs75. It also issued new provisions for UCITS funds
(including ETFs domiciled in Europe) in December 2018 to provide more clarity on the cross-
listing process, which has been streamlined since 200776. These efforts of the regulator to
support market growth are accompanied by the imposition of certain safeguards to protect
ETF investors’ interests. For example, the SFC requires synthetic ETFs to have a marker “X”
to be placed at the beginning of the short names and an asterisk (*) with an annotation of
warning in English and Chinese, and imposes collateral requirements of at least 120% of
gross counterparty risk exposure for equity collateral of synthetic ETFs77.
3.2 Factors supporting the liquidity of ETFs in Hong Kong
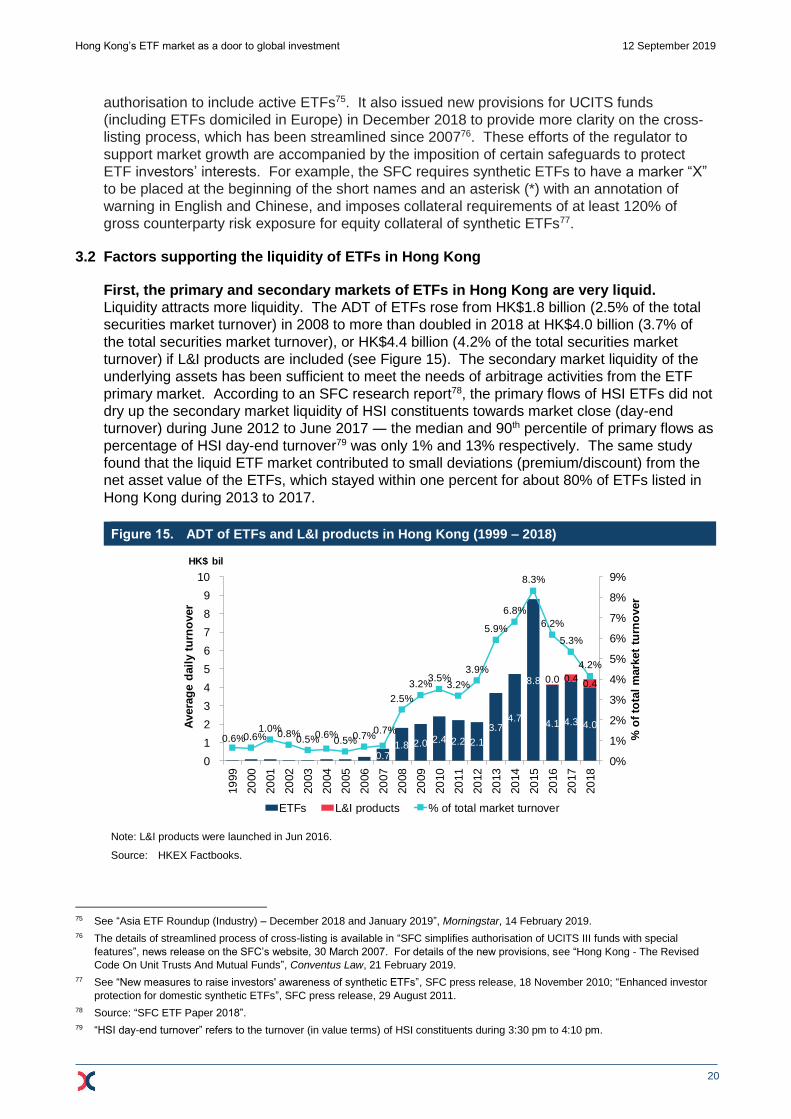
First, the primary and secondary markets of ETFs in Hong Kong are very liquid.
Liquidity attracts more liquidity. The ADT of ETFs rose from HK$1.8 billion (2.5% of the total
securities market turnover) in 2008 to more than doubled in 2018 at HK$4.0 billion (3.7% of
the total securities market turnover), or HK$4.4 billion (4.2% of the total securities market
turnover) if L&I products are included (see Figure 15). The secondary market liquidity of the
underlying assets has been sufficient to meet the needs of arbitrage activities from the ETF
primary market. According to an SFC research report78, the primary flows of HSI ETFs did not
dry up the secondary market liquidity of HSI constituents towards market close (day-end
turnover) during June 2012 to June 2017 ― the median and 90th percentile of primary flows as
percentage of HSI day-end turnover79 was only 1% and 13% respectively. The same study
found that the liquid ETF market contributed to small deviations (premium/discount) from the
net asset value of the ETFs, which stayed within one percent for about 80% of ETFs listed in
Hong Kong during 2013 to 2017.
Figure 15. ADT of ETFs and L&I products in Hong Kong (1999 – 2018)
Note: L&I products were launched in Jun 2016.
Source: HKEX Factbooks.
75 See “Asia ETF Roundup (Industry) – December 2018 and January 2019”, Morningstar, 14 February 2019.
76 The details of streamlined process of cross-listing is available in “SFC simplifies authorisation of UCITS III funds with special
features”, news release on the SFC’s website, 30 March 2007. For details of the new provisions, see “Hong Kong - The Revised
Code On Unit Trusts And Mutual Funds”, Conventus Law, 21 February 2019.
77 See “New measures to raise investors' awareness of synthetic ETFs”, SFC press release, 18 November 2010; “Enhanced investor
protection for domestic synthetic ETFs”, SFC press release, 29 August 2011.
78 Source: “SFC ETF Paper 2018”.
79 “HSI day-end turnover” refers to the turnover (in value terms) of HSI constituents during 3:30 pm to 4:10 pm.
0.7 1.8 2.0 2.4 2.2 2.1
3.7 4.7
8.8
4.1 4.3 4.0
0.0 0.4 0.4
0.6%0.6%1.0%
0.8%0.5%
0.6%0.5%
0.7%0.7%
2.5%
3.2%3.5%
3.2%
3.9%
5.9%
6.8%
8.3%
6.2%
5.3%
4.2%
0%
1%
2%
3%
4%
5%
6%
7%
8%
9%
0
1
2
3
4
5
6
7
8
9
10
19
99
20
00
20
01
20
02
20
03
20
04
20
05
20
06
20
07
20
08
20
09
20
10
20
11
20
12
20
13
20
14
20
15
20
16
20
17
20
18
% o
f to
tal
mark
et
turn
over
Avera
ge d
ail
y t
urn
over
Average daily turnover of ETFs and L&I products and the share of total turnover
ETFs L&I products % of total market turnover
HK$ bil
Hong Kong’s ETF market as a door to global investment 12 September 2019
21
Second, the competitive total cost of ownership (TCO) supports “Trade Asia in Asia”
through the Hong Kong ETF market. According to HKEX80, the TCO for ETF investment
includes trading costs (e.g. bid-ask spread and broker commissions) and holding costs (e.g.
investor-level taxation and costs associated with tracking difference81 that include
management fees, transaction costs and taxation at investment level and fund level). For
trading costs, the Hong Kong Government extended the waiver of stamp duty to all ETFs in
Hong Kong since February 2015. Besides, market makers in Hong Kong enjoy lower cost of
trading to facilitate their market making activities as they are exempted from the exchange’s
trading fee (0.005%) and the regulator’s transaction levy (0.0027%). As for holding costs,
taxation is a key component in that investors’ return is affected by three tiers of taxation ―
investment level, fund level and investor level. In fact, a study82 highlighted that Hong Kong’s
expanding bilateral tax treaty network and domestic tax rules are favourable for cost reduction.
The same study concluded that ETFs in Hong Kong should be the most tax efficient among
major markets when investing in Japanese equities and Mainland corporate bonds.
Third, multiple currency counters of ETFs facilitate usage by asset managers. ETFs in
Hong Kong can be traded in multiple currencies, including HKD, RMB and/or USD. This
allows the Hong Kong market to list and trade ETFs on Mainland-listed securities in RMB.
ETF trading in RMB is supported by the extended coverage of the HKEX-provided RMB Equity
Trading Support Facility (TSF) beginning in August 201283. Certain ETFs tracking US
securities and global indices are not only traded in HKD and RMB, but also in USD. These
currency counters expand the investment choices for exposure to different currencies. To
further improve the liquidity of USD counters, suggestions were raised by market participants
on either having a spread table of tick sizes harmonised with the HKD counter or allowing
deviations from the “one-to-one conversion” rule (under which each unit of multiple counters of
the same ETF must have the same NAV) to narrow the differences of tick size across counters
of the same ETF84.
Fourth, an ecosystem of risk management products in Hong Kong meet the needs of
ETF investors. To hedge the market risk of ETFs in Hong Kong, stock futures and options of
the top five ETFs by turnover value85 are available. Index futures and options on the HSI and
HSCEI as well as index futures on the CES China 120 Index and MSCI Asia ex-Japan Index
are available for hedging the market risks of ETFs on these Hong Kong, Mainland and Asian
equity indices. The benefits of these hedging tools in Hong Kong are recognised by market
participants, who call for continued futures and options product innovation on more diversified
underlyings. For gold ETFs, gold futures traded in USD and CNH are available for hedging
the market risk of fluctuations in gold prices. To hedge for the currency risk of ETFs,
deliverable USD/CNH futures and options as well as cash-settled futures on EUR/CNH,
JPY/CNH, AUD/CNH and CNH/USD are available for investing in HKD, RMB and USD
counters of ETFs.
80 See “Exchange Traded Fund Handbook”, published on HKEX’s website, viewed on 8 August 2019.
81 Tracking difference is the difference in returns between an ETF and the underlying benchmark over a certain period of the time
while tracking error is commonly calculated as the standard deviation of the differences in returns between an ETF and the
underlying benchmark over a certain period of time.
82 Source: “ETF taxation report for investors 2019 (Hong Kong)”, report commissioned by the HKEX, published on Ernst & Young’s
website, 2019.
83 See “Circular on extension of the product type coverage of the RMB equity trading support facility (TSF) on 6 August 2012”, issued
by HKEX, 30 July 2012.
84 Under the “one-to-one conversion” rule, the USD counter usually has a larger tick size as a percentage of the unit price than the
HKD counter. This gives rise to spread cost concerns of brokers providing inter-counter transfer services for customers.
85 See Section 2.3 above on the top five ETFs.
Hong Kong’s ETF market as a door to global investment 12 September 2019
22
4. CONCLUSION
Investments in ETFs have become increasingly popular. The advantages of investing in ETFs
versus mutual funds include convenience, cost effectiveness, high liquidity and transparency.
Among global markets, Asia Pacific is the fastest growing ETF market on rising investor
demand for portfolio diversification, particularly from Mainland investors.
Mainland ETF market has grown quickly to meet onshore investors’ diversification demand,
led by equity ETFs on Mainland indices and money market ETFs. In addition to ETFs, LOFs
provide exposures of active returns, led by mixed strategy funds on onshore securities. Given
the Mainland investors’ growing desire for global asset allocation and their high acceptance of
passive investments through ETFs, the limited supply of cross-border ETFs and LOFs on
global underlying assets and the lack of multiple currency exposure in the Mainland market
hint at the potential domestic demand for access to the Hong Kong ETF market.
The Hong Kong ETF market is a door to global investment, particularly for Mainland investors.
It offers products on diversified asset classes from global markets and a well-established
institutional investor base to support market liquidity. An ecosystem of global issuers and
investors have supported the development of the Hong Kong ETF market. For issuers, they
enjoy the strong demand from global investors, effective market making mechanism,
geographical advantage of “Trade Asia in Asia” and the market-friendly regulatory
environment. For investors, they can trade ETFs in the liquid primary and secondary markets
with tax advantages, multiple currency counters, and the support of an ecosystem of risk
management tools.
Hong Kong is well-positioned to be Asia’s ETF marketplace. Staying close to global market
trends will be crucial to continue the success of the Hong Kong ETF market. Market
enhancements could include further expanding the coverage of underlying asset markets and
supporting product innovations to meet investors’ diverse needs. The wide range of
exposures covered by Hong Kong ETFs not only meet the needs of global investors, but also
Mainland investors potentially. In comparison, the variety of exposures in Mainland assets
covered by Mainland ETFs could be attractive to global investors. In addition, the potential
mutual access of the two ETF markets would facilitate a more balanced mix of investors in the
ETF primary and secondary markets on both sides. Further development in Mainland-Hong
Kong market connectivity in respect of the ETF segment will help broaden the investor base
and increase liquidity in both markets. This will be conducive to the mutual growth of the two
markets.
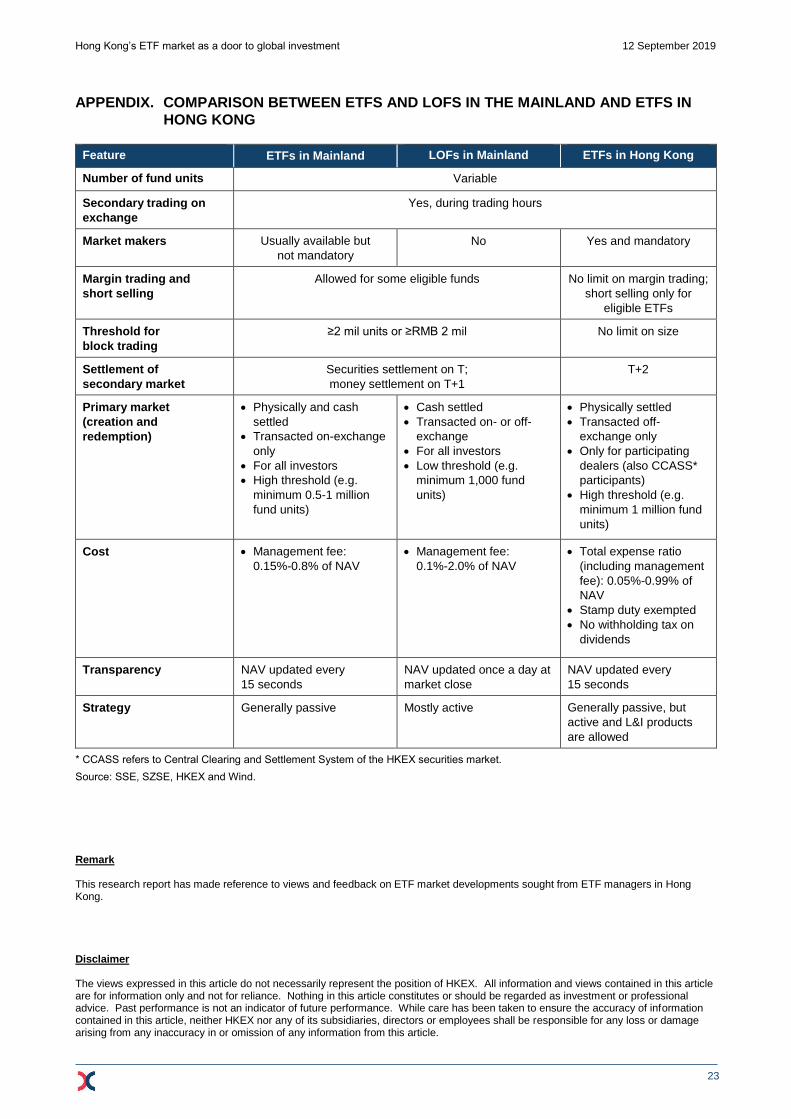
Hong Kong’s ETF market as a door to global investment 12 September 2019
23
APPENDIX. COMPARISON BETWEEN ETFS AND LOFS IN THE MAINLAND AND ETFS IN
HONG KONG
Feature ETFs in Mainland LOFs in Mainland ETFs in Hong Kong
Number of fund units Variable
Secondary trading on
exchange
Yes, during trading hours
Market makers Usually available but
not mandatory
No Yes and mandatory
Margin trading and
short selling
Allowed for some eligible funds No limit on margin trading;
short selling only for
eligible ETFs
Threshold for
block trading
≥2 mil units or ≥RMB 2 mil No limit on size
Settlement of
secondary market
Securities settlement on T;
money settlement on T+1
T+2
Primary market
(creation and
redemption)
Physically and cash
settled
Transacted on-exchange
only
For all investors
High threshold (e.g.
minimum 0.5-1 million
fund units)
Cash settled
Transacted on- or off-
exchange
For all investors
Low threshold (e.g.
minimum 1,000 fund
units)
Physically settled
Transacted off-
exchange only
Only for participating
dealers (also CCASS*
participants)
High threshold (e.g.
minimum 1 million fund
units)
Cost Management fee:
0.15%-0.8% of NAV
Management fee:
0.1%-2.0% of NAV
Total expense ratio
(including management
fee): 0.05%-0.99% of
NAV
Stamp duty exempted
No withholding tax on
dividends
Transparency NAV updated every
15 seconds
NAV updated once a day at
market close
NAV updated every
15 seconds
Strategy Generally passive Mostly active Generally passive, but
active and L&I products
are allowed
* CCASS refers to Central Clearing and Settlement System of the HKEX securities market.
Source: SSE, SZSE, HKEX and Wind.
Remark This research report has made reference to views and feedback on ETF market developments sought from ETF managers in Hong Kong.
Disclaimer The views expressed in this article do not necessarily represent the position of HKEX. All information and views contained in this article are for information only and not for reliance. Nothing in this article constitutes or should be regarded as investment or professional advice. Past performance is not an indicator of future performance. While care has been taken to ensure the accuracy of information contained in this article, neither HKEX nor any of its subsidiaries, directors or employees shall be responsible for any loss or damage arising from any inaccuracy in or omission of any information from this article.