honig navigation by judgment october 2014sites.bu.edu/neudc/files/2014/10/paper_59.pdf ·...
TRANSCRIPT
Navigation by Judgment: Organizational Autonomy in the Delivery of Foreign Aid
Dan Honig*
October 2014 This work examines an understudied component of aid effectiveness, the organizational features of international development organizations (IDOs). This paper examines whether, when, and how organizational autonomy affects project success. It employs regression analysis of a novel dataset—evaluations of over 14,000 projects from nine international development organizations—using self-‐evaluated project outcomes as a measure of success, the State Fragility Index as a measure of environmental unpredictability, and both expert surveys and a measure constructed from organization-‐level responses to Paris Declaration monitoring surveys as measures of aid organization autonomy. The key finding is that organizational autonomy matters to project success, with increasing returns to autonomy in fragile states and in project domains where it is more difficult to externally observe (and thus contract on) outcomes. Comparing recipient-‐country environments one standard deviation above and below the mean, a relatively high-‐autonomy development organization would see a difference of about .05 points in performance on a six-‐point scale, while a relatively low-‐autonomy development organization would see more than 10 times the difference. High-‐autonomy organizations, then, see more consistent performance across countries. This effect is concentrated in sectors in which it is difficult to contract on accurate output measures (such as capacity building) rather than in sectors in which such measurement is relatively straightforward (such as road construction). Inasmuch as measurement (particularly legitimacy-‐seeking output measurement) is a constraint on organizational autonomy, this augurs for less organizational navigation by measurement and more organizational navigation by judgment in more unpredictable environments and less contractible task domains.
*I thank the National Science Foundation Graduate Research Fellowship for its support under grant# DGE-‐1144152. Matt Andrews, Sam Asher, Nancy Birdsall, Mark Buntaine, Andreas Fuchs, Peter Hall, Steve Knack, Aart Kraay, Jenny Mansbridge, Sheila Page, Woody Powell, Lant Pritchett, Simon Quinn, Steve Radelet, Tristan Reed, Alasdair Roberts, Evan Schofer, Ryan Sheely, Beth Simmons, Martin Steinwand, Mike Tierney, Dustin Tingley, Eric Werker, Michael Woolcock, and many others, including participants in academic seminars in the US, UK, and Thailand and at international development organizations & think tanks in the US and UK have all provided helpful comments on earlier versions of these ideas and/or this work. Many thanks to Yi Yan & Smriti Sakhamuri for their research assistance. A number of individuals contracted via the online job hire platform Odesk have also contributed to this work via their data compiling and cleaning assistance. I can be reached at [email protected].

1
Although the uniqueness of the foreign aid agency’s task has been recognized and understood, the organizational environment that such a task requires has never been specified…. I ascribe problem results to an organizational, rather than a historical, determinism. – Judith Tendler (Tendler 1975, p. 9, 110) [USAID suffers from] Obsessive Measurement Disorder (OMD), an intellectual dysfunction rooted in the notion that counting everything in government programs (or private industry and increasingly some foundations) will produce better policy choices and improve management… [Relatedly] demands of the oversight committees of Congress for ever more information, more control systems, and more reports have diverted professional USAID (and now MCC) staff from program work to data collection and reporting requirements. –Andrew Natsios, former administrator, US Agency for International Development (Natsios 2010, p. 8)
INTRODUCTION
In 2006, Liberia was just emerging from two decades of conflict. A strong Minister
of Health was looking for international help in improving Liberia’s woeful health statistics,
among the world’s worst.1 Faced with a ministry that had not produced a financial
statement in over a decade and having no idea where funds allocated to the ministry were
flowing, the Minister approached the US Agency for International Development (USAID)
about establishing an office of financial management. USAID declined. The Minister then
approached the UK’s Department for International Development (DFID), which was excited
by the idea and quickly began to implement it.2 At a point when it was still too early to
measure the new office’s performance and generate quantitative data, DFID staff on the
ground realized that their mission was not succeeding. They used their judgment that the
wrong personnel had been assigned and arranged to have them replaced. Today, the
Liberian health ministry’s office of financial management is thriving, praised for its
professionalism and effectiveness.
In the same country, in the same ministry, both DFID and USAID wished to support
the same reform-‐minded Minister by putting the ministry in greater control of external
funding. DFID set in motion the development of a pooled fund—a collective funding
mechanism with contributions from multiple donors and a governing board composed of
donor and health ministry representatives. While at least some of the critical USAID
decision makers would have liked to contribute to the fund, Congressional restrictions
1 These accounts come from related qualitative work and, while no citations are provided here, are well sourced in the related qualitative piece, available on request. 2 Later, following a conversation with the US Ambassador and his intervention, USAID did indeed offer to provide support to establish the unit, though on a much slower timeline than that of DFID.

2
prevented USAID from comingling its funds in this way; USAID ultimately set up a parallel
system with much higher transaction costs and predetermined performance targets which,
due to Liberia’s inherent unpredictability, require frequent and costly revision.
In South Africa in the mid-‐2000s, both USAID and DFID wished to strengthen
municipal governments. DFID’s primary mode of engagement was to embed flexible
advisers in municipal governments and let them guide support over the long term. USAID
considered a similar strategy but initially rejected it, in part because it would be difficult to
develop consistent measures for these activities. USAID instead initially worked primarily
via the delivery of trainings, an approach for which the outputs (such as the number of
participants and trainings) could be more easily measured.
The aid industry abounds with tales of projects where organizational rules got in the
way of field staff doing what they were there to do by constraining the design,
implementation, or revision of projects; a great number of these stories focus on the
constraints of measurement and reporting. While one could reasonably argue that there is
a systematic bias in these kinds of stories, with aid professionals only reporting the cases
where constraint hurts performance and not the myriad cases where constraint prevented
errors or kept things on track, these tales suggest that organizational features are a
possible unexplored margin for explaining variation in development project outcomes.
This work explores the roles of measurement and autonomy in organizational
performance. It investigates the contexts in which more reliance on the perceptions and
decisions of field staff—what I call organizational navigation by judgment—fares better
than navigation by measurement; that is, the attempt to “pay for performance” by
monitoring and contracting on output measures. This study focuses in particular on how
environmental unpredictability and task observability and contractibility influence the
optimal balance of judgment and measurement.
Quantitative output metrics follow New Public Management practices very much in
the mainstream (e.g. Hood 1991), and serve the important purpose of allowing progress to
be tracked and goals achieved. Measuring what people do and motivating them
accordingly has a clear and compelling intuition in its favor, one that resonates with
anyone who has ever seen a child’s eyes get brighter at the promise of something they
desire after their homework is completed. Aligning tangible rewards with production
3
aligns employees’ incentives with firms, ensuring that employees are contributing to a
firm’s bottom line with greater rewards for a greater contribution. In the last few decades
new public management (NPM) has increasingly carried over private sector incentive
schemes into the public sector. (Christensen and Laegreid 2011; Hood 1991, 2004; Lorenz
2012; Pollitt and Bouckaert 2011). Conventional wisdom is that measurement and
management regimes that set targets and manage towards them are signs of a high-‐
performing organization. This view is the dominant one in the aid discourse today, with
organizations increasingly moving towards measurement and management through
targets and indicators which are linked to externally verifiable data so as to improve
accountability and work towards what many in development term the “results agenda”.
(Gulrajani 2011) A number of leading IDOs have come together, in fact, to form a “Global
Partnership on Output-‐Based Aid”, which looks to contract directly on output targets.3 I
challenge this conventional wisdom, arguing that under certain conditions measurement
regimes are not just an indicator of conditions for low performance but also directly causal
of reduced performance towards organizational ends.
The judgment vs. output measurement debate is very much a live one in
development at the moment, with scholars noting the ongoing debate among practitioners
and a number of scholars arguing for a more iterative, agent judgment-‐driven approach
which plans less ex-‐ante and instead adapts to the soft, contextual information of recipient
country environments. (Andrews, Pritchett, and Woolcock 2012; Barder 2009; Booth
2013; Easterly 2014; Ramalingam 2013) There have been, however, few empirics to shed
light on this debate – what is the best way to manage development?
The net effect of an organizational control regime which focuses on the measurable
in a drive to achieve results has never been put to rigorous evaluation, in part because no
single agency has sufficient variation with regards to the de jure control regime to allow for
causal inference from any study of organizational constraints within it. 4 Do more
autonomous International Development Organizations (IDOs) – those with less need to
manage up to their political authorizing environments – lead to more successful project
3 The GPOBA is at www.gpoba.org. 4 This is not to suggest there is no intra-‐agency variation in autonomy/control -‐ only that it is difficult to study empirically as it often depends on features for which quantitative data is scarce.
4
outcomes and more efficient aid? Do agencies with more autonomous field agents – those
facing fewer constraints and thus able to navigate more by judgment – fare better? Do such
effects vary systematically across different kinds of countries or project task domains?
Development aid has been linked to outcomes as varied as governance quality and
inclusiveness, economic development trajectories, and civil war; delivering aid more
effectively is one of critical import to a variety of real-‐world outcomes. (Bräutigam and
Knack 2004; Clemens, Radelet, and Bhavnani 2004; Fearon, Humphreys, and Weinstein
2009; Nielsen et al. 2011) The question of optimal autonomy and optimal measurement
schemes is also one every organization must make; a better understanding of the
topography, the dimensions which augur for or against more output measurement or more
autonomy, has the potential for vast practical impact well beyond development’s shores.
This paper brings to bear an original cross-‐IDO dataset, incorporating over 14,000
unique development projects into what is now the world’s largest cross-‐organizational
database to incorporate development outcomes.5 Because of the nature of the data, it is not
possible to examine the direct effect of organizational autonomy on project success,
although my related qualitative work does just this.6 The present work instead focuses on
heterogeneity as regards the effect of autonomy on project outcomes, exploring the returns
to autonomy in conditions of differential environmental unpredictability and in
differentially measurable task domains.
THEORY
Principal-‐agent models similar to that employed here have long been used in
bureaucratic politics and public administration, with discretion and autonomy principal
levers employed in these models. (Alesina and Tabellini 2008; Calvert, McCubbins, and
5 While the movement for aid information transparency has made impressive strides in the past few years, most of the progress to data has been on inputs – on spending data and financial flows. No other source (including the International Aid Transparency Initiative, the OECD Development Assistance Committee’s Creditor Reporting System, and the AidData archive) includes systematic information on the results of projects in a way tractable to quantitative analysis for any donor other than the World Bank, which also makes these data public and easily accessible from the Bank’s website (the only such donor to do so). 6 This qualitative analysis complements the present quantitative investigation and does find that autonomy has a positive net effect on project performance in all but the most predictable environments and measurable tasks, where the net effect of autonomy may be negative.
5
Weingast 1989; Carpenter 2001; Gailmard and Patty 2013; Huber and McCarty 2004;
Huber and Shipan 2002, 2006)
As regards international development, the complex political authorizing
environments of aid givers (de Mesquita and Smith 2009) and the distortions they
sometimes give rise to (Barnett and Finnemore 2003) naturally provides variation which
can be empirically exploited regarding the characteristics of aid agencies. Numerous
scholars have framed international development agencies as organizations in which the
interplay between political principals and IDOs, and IDOs and their agents, play critical
roles in organizational functioning and outputs. (Hawkins et al. 2006; Nielson and Tierney
2003) As for bureaucrats in such agencies, there is good reason to think that they
substantially influence what occurs, and matter critically to organizational rules and
success. (Johns 2007; Johnson and Urpelainen 2014)
It is surprising, then, that there has been so little empirical work on international
organizations that animates the agents, rather than the principal, despite calls to do so.
(Hawkins and Jacoby 2006) This work responds to Wilson’s call to begin to both focus on
organizational systems and begin with front line workers in understanding organizations.
(Wilson 1989; 23, 33-‐34) It aims to respond to what some have called “Wilson’s
Challenge”, namely “Ignorance of variation and complexity, and the consequent failure to
recognize the importance of internal organization.” (Chang, Figueiredo, and Weingast 2001,
p.271). This work is also among the first to take up Dixit’s (2002) call for empirics that do
“not seek sweeping universal findings of success or failure of performance-‐based incentives
or privatization, but should try to related success or failure to specific characteristics like
multiple dimensions and principals, observability of outputs and inputs, and so on.” (p.724)
Some types of task are more tractable to measurement and external monitoring
than others. If an organization is constructing a building, there are clear standards of
output quality that can be observed or contracted on. If an organization is training
teachers, it is much harder to develop appropriate short-‐term output measures against
which results can be measured. The notion that tasks are inherently different and pose
different measurement challenges is well articulated in the management control systems
literature on private sector contexts and is a critical part of some of the most prominent
6
theorizing in the public administration literature on bureaucratic functioning and
contracting (Brown and Potoski 2003, 2005; Wilson 1989).
Soft Information vs. External Monitorability
It is only natural to think that output measurement will enhance organizational
performance; if one wishes to achieve something, measurement allows one to know the
distance traveled and provide incentives to managers and staff to reach organizational
goals. As World Bank President Robert Zoellick put it in a major public address, “We know
that a focus on results is absolutely key for donors [those who contribute funds to the
World Bank], for clients [those who receive funds from the World Bank], and for us.”
(Zoellick 2010) President Zoellick’s words suggest that improving performance is not the
only reason to measure, however; measuring results is also important to those who
contribute funds to IDOs, with IDOs justifying themselves via demonstration of quantitative
accomplishments. Measurement also benefits IDOs by allowing them to seem more
accountable, to report to political authorizing environments and ultimately to the rich
polities that provide their funding. This focus on the measurable, then, is in part a form of
normative isomorphism (DiMaggio and Powell 1983), with the measurement regime
serving organizational legitimacy. This is not its only role, of course; measurement is also
genuinely felt by many to be the way forward in ensuring aid accomplishes its objectives.
This work examines whether measurement, particularly output measurement, is in
fact a universal virtue. While measurement and control have clear benefits, they also have
costs; an agent who is constrained either by controls or quantitative output targets is by
definition less autonomous and as such is relatively less able to seek the best course based
on the environment they encounter and their instincts regarding same. The literature on
commensuration (e.g. Espeland and Stevens 1998) suggests that measurement is not a
neutral act; a focus on data tends to lead to a devaluation of that which cannot be as easily
counted or tracked. Fifty years of scholarship has noted this kind of contracting also
serves to reduce flexibility, which may be advantageous in some contexts but deleterious in
others. (Grossman and Hart 1986; Laffont and Tirole 1988; Macaulay 1963; Williamson
1983)
In the language of contract theory, the hypothesis here is that contracting on
outcomes (via output measurement and incentives to meet them) is the first best solution;
7
however, this first best is unreachable in many (perhaps the vast majority) of foreign aid
task domains. In these environments an organization will be best served by pursuing the
second best solution to contracting, which is to devolve control to field level agents,
empowering them to deliver aid in a manner which best incorporates soft information – to
navigate by judgment. An IDO that navigates more by measurement should see the gap in
its relative performance driven by sectors where outcomes are more difficult to observe, as
where measurement is easy, frequent, and unlikely to lead to distortions it should not be
the inferior strategy.
Few organizations will fully forsake either measurement or judgment; there are no
IDOs that do not use any quantitative measurement, nor are there any that navigate
without allowing agents any autonomy. There is nonetheless a tradeoff between
measurement and agent autonomy (and thus organizational navigation by judgment) that,
while intuitive, is rarely incorporated into the design of aid delivery. Agencies are arrayed
along a continuum between navigation by measurement and navigation by judgment.
There is heterogeneity with regards to the extent to which what an IDO or its staff does is
driven by measurements like project output measures (for example, the number of road
miles constructed or the number of individuals trained) and the extent to which is
acceptable to rely on one’s judgment as the basis for a decision.
The optimal level of autonomy is contingent (following Lawrence and Lorsch 1967)
on features of the task and environment. Measurement is more difficult for some tasks
than for others; in tasks that are not tractable to output measurement, management by
measurement may prove ineffective but nonetheless crowd out the agent autonomy
necessary for optimal organizational performance. In the context of international
development, Pritchett and Woolcock describe tasks for which discretion may be necessary
as those for which [d]elivery requires decisions by providers to be made on the basis of information that is important but inherently imperfectly specified and incomplete… the right decision depends on conditions (“states of the world”) that are difficult to assess (ex ante or ex post), and hence it is very difficult to monitor whether or not the right decision is taken (2004, p. 9).
One could imagine a community governance project in rural Afghanistan as such a
task; the “correct” implementation would seem to be hard to specify ex-‐ante and would
need to rely on judgments by properly placed agents, judgments which would be difficult to
8
assess from the outside either ex-‐ante or ex-‐post. In such an environment, autonomy
might prove critical to success. On the other hand, a road construction project in Turkey
seems to be a task for which one could imagine clear performance-‐based measures and a
predictable, externally observable sequence of events; measurement of outputs and
management from above might well prove the superior strategy.
The difference between these two contexts would seem to be the degree to which
tacit knowledge (Polanyi 1966) or soft information is critical to success. Stein defines soft
information as [i]nformation that cannot be directly verified by anyone other than the agent who produces it. For example, a loan officer who has worked with a small-‐company president may come to believe that the president is honest and hardworking—in other words, the classic candidate for an unsecured “character loan.” Unfortunately, these attributes cannot be unambiguously documented in a report that the loan officer can pass on to his superiors (2002, p. 1892).
In international development implementation, soft information includes (but is not
limited to) assessments of ministry personnel and their motivations, how to structure or
revise a project to maximize its likelihood of being in the interests of important political
actors and thus fully implemented, or simply whether a project under implementation is
headed in the right direction. Many things that are hard to codify and communicate up a
hierarchy may well be critical to a development project’s success.7
Soft information can only be collected by agents who are properly placed, and
following Aghion and Tirole (1997) will only be collected by agents who have the incentive
to do so. If agents or organizations do not have the autonomy to incorporate this
information into their decisions, there is no incentive to bother collecting it. An IDO that
fails to provide the space for agents to gather soft information will have less of it to
incorporate into decision-‐making. In environments where soft information is necessary,
then, Aghion & Tirole (1997) find, therefore, that in environments where this information
is necessary, field-‐level agents will need real (not just formal) authority; only via a grant of
7 This line of argument shares much with a separate literature on observability and top-‐down control pioneered by James Scott’s Seeing Like a State and the myriad “Seeing Like…” publications it has spawned. Soft information is, on this view, a first cousin of mētis, which Scott defines as “a wide array of practical skills and acquired intelligence in responding to a constantly changing natural and human environment” (Scott 1998, p. 313).

9
autonomy will they gather and incorporate the information necessary for optimal
organizational performance.
Autonomy allows field staff to make judgments about program design, management,
and revision that rely on soft information; to navigate by judgment. Autonomy also leads to
better quality staff (who migrate where they have the power to make decisions) and
superior organizational learning. Agent autonomy, then, can allow an organization to (a)
take more initiative in gathering soft information and incorporating it into decision making
and organizational learning, (b) focus on elements of performance not contracted on via
targets, and (c) increase motivation and retention, potentially increasing employee
quality.8 This may allow organizations to get greater results with fewer controls, in a
parallel to the Bohnet, Frey, and Huck suggestion that it may be possible to get “More Order
with Less Law”. (Bohnet, Frey, and Huck 2001)
However, autonomy is not unambiguously positive; autonomous agents can use
their autonomy in ways that do not benefit the organization. They may be more
susceptible to capture and corruption (Tirole 1994). They may also simply act in ways not
desired by their supervisors; this is why Aghion and Tirole (1997) frame the other side of
the autonomy tradeoff as a loss of control. It is possible to have too much autonomy; agents
and agencies may use their freedom to drive projects in the wrong direction. If this were
the dominant effect of autonomy, one would expect that more autonomous agencies would
show poorer performance, even more so in contexts where it is harder to get feedback
about their performance—that is, in more unpredictable environments and task domains
where monitoring is harder. As this alternative theory makes predictions precisely the
inverse of those outlined below, this work’s empirical results will allow us to see which of
these effects dominates.9
8 The mechanisms by which the incorporation of soft information by autonomous agencies and agents leads to better decisions and more successful development projects are explored in greater depth in qualitative case studies (Honig forthcoming). 9In the abstract, I would hypothesize that the relationship between autonomy and project success is an inverted parabola, with some optimal point. In the observed universe of IDOs the data suggests a more linear relationship; that is to say, no IDOs – even those with relatively greater autonomy -‐ are at or past the inflection point, making it difficult to assess empirically where precisely the first derivative of the function reaches zero or becomes negative.

10
This study focuses on organizational autonomy (relative to its political authorizing
environment) and field staff autonomy (relative to their supervisors or headquarters).
These two levels of autonomy co-‐vary, as demonstrated empirically below. The less stable
an IDO’s authorizing environment, the more it will need to justify itself and the more it will
rely on quantitative targets, precluding the incorporation of soft information into decision
making. Put another way, constraints on autonomy roll downhill. To return to the opening
vignette, the organizational constraints that Congress puts on USAID translate into
constraints on the agents in the field. Table 1 below contrasts the less secure authorizing
environment USAID faces with that of DFID, concluding with each organization’s ranking
on the measure of organizational autonomy that will be a key independent variable in this
work.
Table 1: Comparison of USAID and DFID's Political Authorizing Environment
Political status of aid
agency head Budget security Response to 2008 financial crisis
Workplace satisfaction surveys
Rank (out of 33) on autonomy measure used in this study
DFID Full ministerial rank, limited coordination with Foreign Affairs
Three-‐year budget allocations; few
earmarks
Only ministry spared from across-‐the-‐board cuts; budget has continued to increase
Top 2% 3
USAID Head of USAID
(Administrator) reports to State Department
Yearly, often delayed; USAID budget heavily
earmarked
Cutting aid-‐funding promises literally the first thing
mentioned by Obama ticket (as candidate)
Bottom third 29
Sources: 2012 US Federal Employee Viewpoint Survey Global Satisfaction Index (USAID 25th of 36); 2013 UK Civil Service People Survey Employee Engagement Index (DFID tied for 2nd of 98); Biden-‐Palin Debate, October 2 2008; author.
I theorize that less autonomous IDOs—those with less room to maneuver in their
political authorizing environments—will respond by focusing on measurement and on
“managing up”; that is, by responding to politics and the concerns of those who authorize
the organization’s funding and thus carefully justifying the organization’s actions and
programs to a greater extent than is the case for more secure, more autonomous IDOs. This
will, in turn, put constraints on the actions of field-‐level agents, limiting their autonomy and
their ability to navigate by judgment. As a result of these dynamics, the decisions of a less
autonomous IDO will incorporate less soft information.

11
These insights echo those of Nobel laureate economist Elinor Ostrom and her team,
who argue in an analysis of the Swedish International Development Agency (SIDA) that
“the broader institutional context of the donor agency has a profound effect on the
relationships between recipient and beneficiary organizations, contractors, and the
individuals working with the aid agency” and affects agency staff’s decisions (Gibson et al.
2005, p. 156). They also argue for decentralization to the field, in part to give staff the
autonomy and incentive to overcome what they see as “significant asymmetries” of local
knowledge—that is, tacit knowledge or soft information ( p. 42).
Predictions Across Recipient Environment and Task Domain
IDOs only rarely vary their delivery mechanisms to fit environment and task,
although what is appropriate for Turkish road construction may not be the right solution
for Afghan community empowerment.10 In keeping with a long line of scholarship in
organizational behavior, one would expect an interaction between organizational form and
task environment (Brechin 1997; Lawrence and Lorsch 1967; Thompson 1967). The
argument that the more unpredictable the work process or the greater the environmental
volatility, the higher the optimal level of agent discretion and autonomy also has a lengthy
pedigree in the literature (Dobbin and Boychuk 1999; M and Simon 1958; Thompson
1967), although this study is the first empirical quantitative application of this theory to
international development organizations of which I am aware.11
In more unpredictable environments, the ability of more autonomous agencies and
agents to more appropriately adapt projects will be in greater demand, as will project
design and implementation which incorporates soft information. More unpredictable
environments are also inherently less legible to external actors. In those developing
countries characterized by greater predictability, the name on the door of a government
unit is well correlated with the activities that take place within and medium-‐ and long-‐term
plans have some reasonable chance of proceeding apace, with predictable risks to
10 Some IDOs have special mechanisms for states newly emerging from conflict or for “fragile” states. 11 This argument also has parallels in the political science literature, particularly in James Q. Wilson’s (1989) notion of procedural organizations (for which outputs can be observed but outcomes cannot) and Jane Mansbridge’s (2009) notion of a selection model for agents in the political sphere in contexts where sanctions are unlikely to be effective due to the periodicity of the potential to sanction and the difficulty of monitoring.
12
implementation. In other developing countries, none of this is the case. The more
predictable (the more naturally legible to a distant principal) the context, the less a failure
to incorporate soft information into decision making will impede project success.
That we might expect this dynamic to be at play in international development is
suggested by the 2011 World Bank World Development Report, which argues for adapting
the modality of assistance to the level of country risk (which one might think of as
covarying with unpredictability). The WDR also suggests the link to measurement
hypothesized here, saying “Standard development measures… are excellent long-‐term
goals and indicators, but they are not always helpful in fragile situations in the short term.
These indicators move too slowly to give feedback on the speed and direction of progress.”
(World Bank 2011, pgs. 209-‐210) Analysis of Would Bank projects is consistent with this,
demonstrating that WB project performance declines in less predictable contexts. Chauvet,
Collier, & Duponchel (2010) find that the probability of a World Bank’s project success
increases as peace lasts and the country becomes more stable.
This argument is also quite compatible with one of the most intriguing in
international development bureaucracy, that of Rasul and Rogger (2013); they find that
autonomy is beneficial even in the Nigerian civil service, a context Fukuyama (2013)
specifically suggests might warrant control and less autonomy might be needed due to low
capacity. Extending the argument put forward here, it is possible in the Nigerian context
that environmental unpredictability’s need for greater autonomy trumps the lack of
direction that might result from the interaction of higher autonomy and lower capacity.
The nature of the task itself will make measurement more appropriate in some
contexts than in others. In sectors where outputs that can be measured easily, frequently,
and quickly (such as the distribution of a vaccine) are tightly linked to desired outcomes
(such as the acquisition of immunity), measurement can be of great benefit in cutting
through the complexity of process and ensuring that the aid achieves desired outcomes.
But when the gap between the observable and thus contractible output and the desired
outcome is greater—for example, when focusing on governance reforms or when seeking
to improve a health system rather than build health clinics—a control regime that
circumscribes agencies and agents’ zone of independent action (either through tighter
explicit supervision or through intense application of measurement) is suboptimal.

13
IDOs’ propensity to measure is also consistent with the oft-‐repeated stylized fact
that many of aid’s most impressive recent achievements are in health, particularly in
vaccine and medicine delivery, domains that are particularly tractable to direct
measurement. Pritchett and Woolcock suggest that what works in these task domains will
likely not be optimal in others, with optimal aid delivery mechanisms necessarily
endogenous to the nature of a task, including the degree to which discretion is necessary in
its implementation (Pritchett and Woolcock 2004; Woolcock 2013).
In sum, then, I am arguing that navigation by measurement will be most useful for
relatively routine tasks and/or relatively predictable environments where (a) the desired
outcomes are verifiable and thus contractible and (b) it is easy to make frequent non-‐
distortionary measurements which will also be stable, avoiding Goodhart’s Law problems.
Navigation by judgment, on the other hand, will be most useful when (a) tasks are difficult
to routinize and/or environments are relatively unpredictable and (b) it is hard to define
appropriate targets ex-‐ante or find good measures.
DATA AND SPECIFICATIONS
It would be ideal to have time-‐varying data on organizational autonomy for every
IDO, including variation at the country (or even project) level. The data available only
varies at the IDO level and is time-‐invariant.12 This work therefore cannot test directly for
the effect of autonomy on success directly, as different IDOs have different measurement
standards; a rating of 4 given by the German Development Bank (KfW) may or may not
mean a project is more successful than one that received a rating of 3 from the
International Fund for Agricultural Development. This work can, however, examine the
differential performance of IDOs with varying levels of autonomy in interaction with other
explanatory variables, thus leveraging the idea that a rating of 4 given by KfW means a
project succeeded better than a project assigned a 3 by KfW.
I examine two such interactions—whether there are increasing returns to autonomy
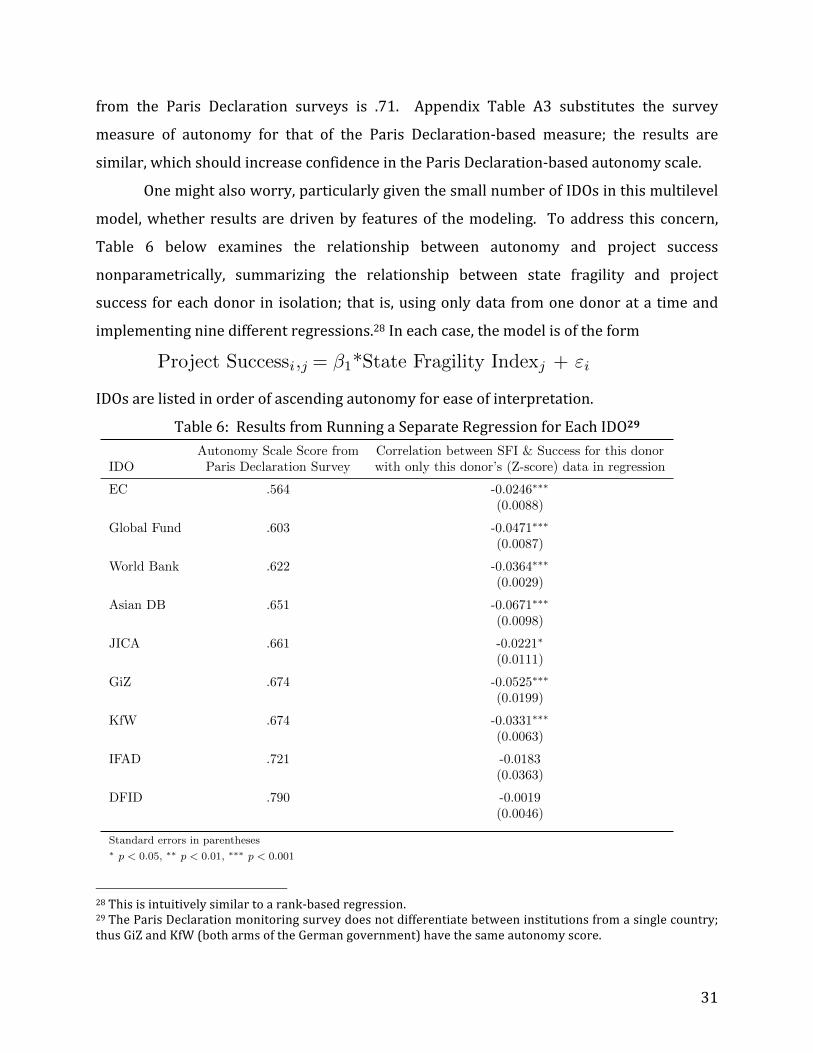
in more unpredictable environments and whether the relationship between autonomy and 12 This study’s focus on measurement at the organizational level is not intended to suggest there is not recipient and recipient-‐year variation in autonomy, only that this is the level at which measurement is most clean and broad. Controls below ensure that my results are not biased by these other levels of variation in autonomy.
14
project success is changed based on the external observability and monitorability of project
task domains. The relationship between project autonomy and environmental
unpredictability is an observable implication of the soft-‐information mechanism posited
above, with soft information in greater demand in contexts that are more rapidly changing.
The monitorability of task domains is, in a sense, a scope condition; in task domains where
measurement is more appropriate, we might expect that returns to soft information will be
nil and that an IDO oriented towards acquiring this information will fare less well than one
which focuses on externally observable “hard” information.
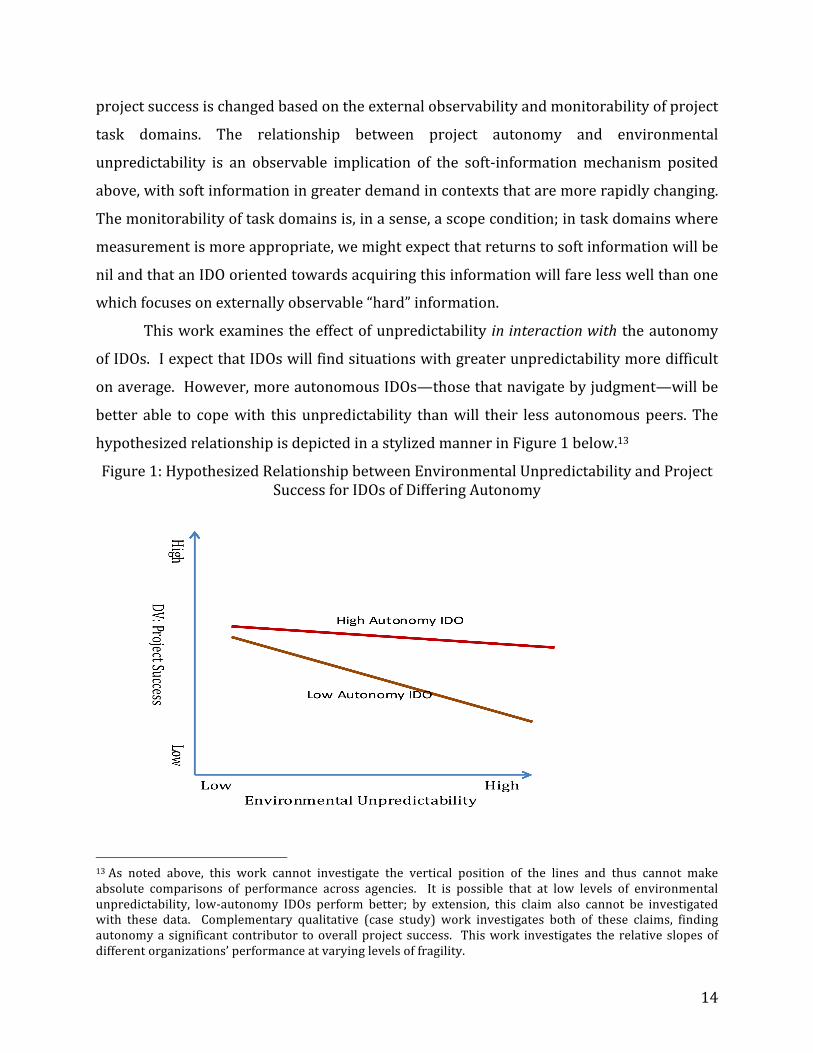
This work examines the effect of unpredictability in interaction with the autonomy
of IDOs. I expect that IDOs will find situations with greater unpredictability more difficult
on average. However, more autonomous IDOs—those that navigate by judgment—will be
better able to cope with this unpredictability than will their less autonomous peers. The
hypothesized relationship is depicted in a stylized manner in Figure 1 below.13
Figure 1: Hypothesized Relationship between Environmental Unpredictability and Project Success for IDOs of Differing Autonomy
13 As noted above, this work cannot investigate the vertical position of the lines and thus cannot make absolute comparisons of performance across agencies. It is possible that at low levels of environmental unpredictability, low-‐autonomy IDOs perform better; by extension, this claim also cannot be investigated with these data. Complementary qualitative (case study) work investigates both of these claims, finding autonomy a significant contributor to overall project success. This work investigates the relative slopes of different organizations’ performance at varying levels of fragility.

15
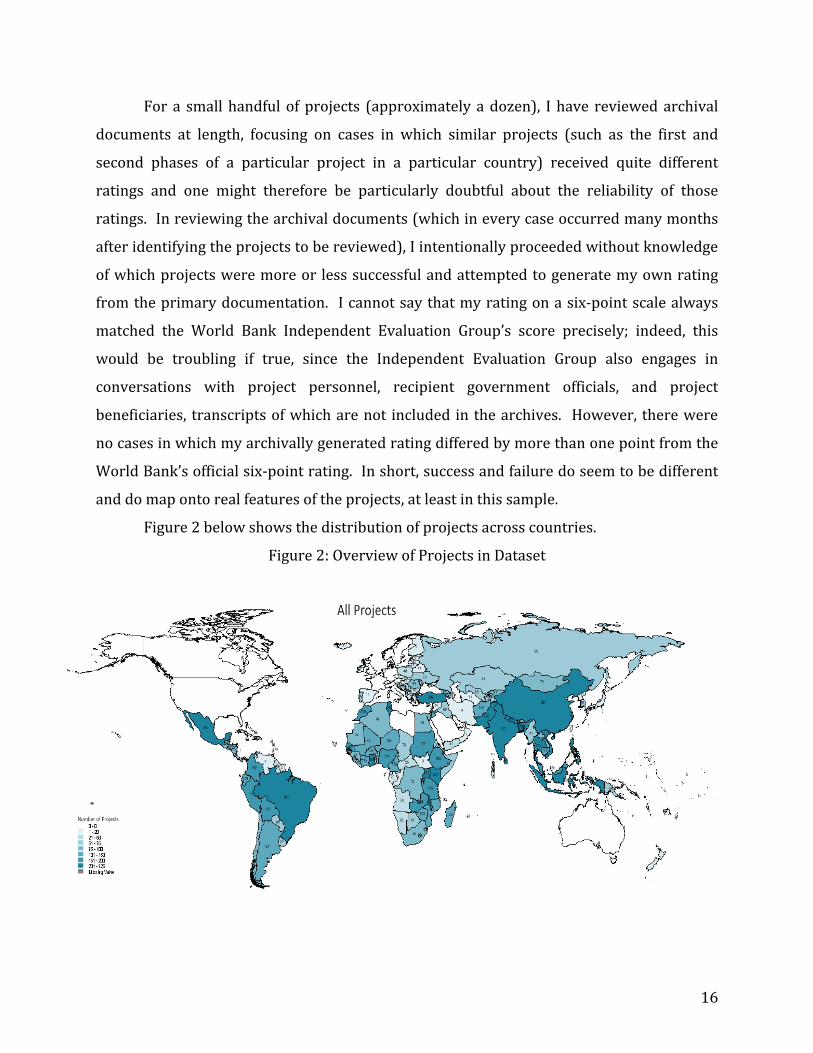
I examine differential returns to autonomy in a dataset that I compiled of over
14,000 unique projects in 178 countries carried out by nine donor agencies over the past
50 years. The nine agencies are the European Commission (EC), the UK’s Department for
International Development (DFID), the Asian Development Bank (AsDB), the Global Fund
for AIDS, Tuberculosis, and Malaria (GFATM), the German Development Bank (KfW), the
World Bank (WB), the Japanese International Cooperation Agency (JICA), the German
Society for International Cooperation (GiZ), and the International Fund for Agricultural
Development (IFAD). 14 This dataset is unique in systematically including project
performance data, discussed in greater detail in footnote 5 above. To the extent possible, I
have either coded myself or audited the coding by research assistants of thousands of
individual project evaluation documents. In cases where IDOs provided data in summary
form, evaluation documents have been located where possible for a subset of projects to
confirm the accuracy of the transmitted data.
It is also possible, of course, for the data to be accurate in the sense of correctly
reflecting an organization’s assessment, but for that assessment to bear little connection to
the actual performance of the project. The reliability of these data and the econometric
means of systematically testing it will be discussed below; however, to the extent possible, I
have also attempted to validate these evaluations by returning to primary documentation.
The World Bank archives uniquely allows access, following an extended vetting and
declassification process, to primary project documents, including correspondence between
project staff and between World Bank staff and national governments, back-‐to-‐office
reports and (often handwritten) notes by those monitoring projects, detailed financial and
performance indicators, and the detailed evaluation reports that draw in part on these
documents and which generate the outcome data for inclusion in this data set. 14 I thank the European Commission, the UK’s Department for International Development, the Asian Development Bank, the Global Fund for AIDS, Tuberculosis, and Malaria, and the German Development Bank for providing data. World Bank data used in this analysis are publicly available. Data for the Japanese International Cooperation Agency (JICA), the German Society for International Cooperation (GiZ), and the International Fund for Agricultural Development were assembled from individual project completion reports by Odesk-‐contracted research assistants under my supervision, with the compiled data then sent back to the originating agency for comment and/or correction. GiZ was kind enough to respond with corrections, which were incorporated; JICA wished it to be made clear that these data were generated by me rather than by JICA and that it is not responsible for them. I am currently in discussions with potential archives regarding how best to institutionalize the maintenance and updating of these data as a resource for researchers and practitioners.
16
For a small handful of projects (approximately a dozen), I have reviewed archival
documents at length, focusing on cases in which similar projects (such as the first and
second phases of a particular project in a particular country) received quite different
ratings and one might therefore be particularly doubtful about the reliability of those
ratings. In reviewing the archival documents (which in every case occurred many months
after identifying the projects to be reviewed), I intentionally proceeded without knowledge
of which projects were more or less successful and attempted to generate my own rating
from the primary documentation. I cannot say that my rating on a six-‐point scale always
matched the World Bank Independent Evaluation Group’s score precisely; indeed, this
would be troubling if true, since the Independent Evaluation Group also engages in
conversations with project personnel, recipient government officials, and project
beneficiaries, transcripts of which are not included in the archives. However, there were
no cases in which my archivally generated rating differed by more than one point from the
World Bank’s official six-‐point rating. In short, success and failure do seem to be different
and do map onto real features of the projects, at least in this sample.
Figure 2 below shows the distribution of projects across countries.
Figure 2: Overview of Projects in Dataset
17
Data Collection
There is no existing cross-‐IDO database of project outcome data. This data therefore
had to be collected from each IDO in the sample individually. I approached every OECD
bilateral aid agency in the top 10 in terms of the volume of official development assistance
aid delivered directly (not via a multilateral agency) in 2010 (the last available data when
this research commenced). This includes agencies in the US, Germany, the UK, France,
Japan, Canada, Norway, Australia, Sweden, and Denmark. All of the biggest multilateral aid
agencies (the European Commission, UN Development Programme, World Bank, African
and Asian Development Banks, and Global Fund) were approached, as were other agencies
with which I had links (for example, Irish Aid, International Fund for Agricultural
Development, Food and Agriculture Organization, and International Monetary Fund).
There were two basic reasons to exclude an agency: either it did not collect project-‐
level outcome data with a holistic project outcome rating (e.g., Canada, United States,
Sweden, UNDP) or I could not get access to that data despite repeated attempts (e.g.,
African Development Bank).
Project Success
The key dependent variable in the analysis below is overall project success, a
holistic rating undertaken by independent evaluators (either external evaluation
contractors or independent evaluation units) or by project staff in project completion
reports. For most IDOs, project success is an ordinal variable ranging from 1 to 6, with 6
being “Highly Satisfactory” and 1 being “Highly Unsatisfactory.”15 Some organizations
evaluate projects on alternative scales (such as a four-‐point scale, with 4 being best); I
transform all scales to be on a consistent six-‐point scale and employ IDO fixed effects in all
models that use this six-‐point scale. I also employ a z-‐transformed version of this variable
in the analysis when IDO fixed effects are absent. This process effectively de-‐means project
success, just as employing IDO fixed effects would do.
The generation of z-‐scores and the use of IDO fixed effects helps to avoid spurious
interpretations by putting each IDO’s project results on an identical parallel scale.
15 These are the World Bank’s designations. No IDO has significantly different names/standards in this regard, which would in any case be removed by IDO fixed effects.

18
Interpreting directly between IDOs (for example, determining which IDO is most
successful) is not possible with these data, given that they are based on separate
measurement frameworks used by different IDOs. This work limits itself to claims about
comparative relative performance; e.g. the performance of more autonomous IDOs is less
affected by environmental unpredictability than is that of their less autonomous peers.
The underlying construct employed by different IDOs for measuring the success of
projects is relatively consistent, with an OECD-‐wide standard for bilateral IDOs. A given
project’s rating is intended to incorporate a project’s relevance, effectiveness, efficiency,
sustainability, and impact.16 Multilateral IDOs in the sample either use this standard
explicitly or something closely related, such as the World Bank’s focus on impact,
sustainability, and quality of preparation and implementation.
Autonomy
Organizational autonomy is measured at the IDO level and is proxied in two ways:
by a scale drawn from the Paris Declaration monitoring indicators and by a direct field
survey of aid experts. These measures focus on organizational and field staff autonomy, as
described above.
To build the autonomy scale, I take five measures from Paris Declaration monitoring
surveys, a mechanism designed to monitor the commitments made by parties (including
IDOs) to this international agreement to improve aid quality and impact. The measures
used are indicative of either an IDO’s propensity to devolve control over project
implementation to recipient countries or the degree of autonomy the agency itself has
relative to its political authorizing environment. The first group includes indicators of the
extent to which an organization values control (and is thus a proxy for the field-‐level
autonomy of the staff): the use of recipient-‐country public financial management (PFM)
systems; the use of recipient-‐country procurement systems; and the avoidance of parallel
implementation units.17
The second group includes indicators of the autonomy of the agency itself relative to
its political authorizing environment, which, in turn, constrains the autonomy of the field
16 http://www.oecd.org/dac/evaluation/daccriteriaforevaluatingdevelopmentassistance.htm. 17 Parallel implementation units are separate units inside recipient countries that use donor standards and thus give donors more control/separation of funds or procurement.

19
staff. These indicators are, first, the degree to which aid is untied; that is, the extent to
which it is not required that funds be spent on goods and services produced by the donor
country. A high level of tying is a sign of an IDO’s need to build political consensus for aid
by serving domestic political constituencies and thus reflects more insecure footing in the
IDO’s political authorizing environment. The second is the predictability of the aid; that is,
the extent to which ex-‐ante estimates of aid volume are proved accurate ex-‐post. Research
suggests that variations are very donor-‐dependent and linked to IDO funding insecurity
(Celasun and Walliser 2008; Desai and Kharas 2010). In many cases political meddling by
actors in the political authorizing environment (e.g. members of Congress) also contributes
to aid unpredictability (Interviews).
The two subscales are reasonably well correlated (.42) and principal components
analysis yields a single component with relatively equal primary principal component
loading from each measure. The overall scale has a Cronbach’s alpha of .798.18 This
provides some confidence that these measures and the two subscales map the same
essential facts regarding IDOs and thus provide suggestive evidence for my conjecture that
the two levels of autonomy measured here are linked, in that field-‐level autonomy is largely
endogenous to an organizations’ relationship with its political authorizing environment.
The results presented below are robust to dropping either subscale as well as to dropping
any single measure. A dendrogram with the scale’s component mapping is included in the
Appendix (Table A6) and indicates scale de-‐composition to be as predicted given the
underlying theory. The scale used here is a time-‐invariant measure formed from the
average of the three waves (2005, 2007, and 2010) of the Paris Declaration survey.19
Given the critical role of measurement of autonomy to the empirical strategy, I
attempted to validate the Paris Declaration scale with more direct measurement. I
conducted a small-‐scale direct field survey of aid experts—individuals who have
18 This is for the full autonomy scale with all IDOs; restricting the sample to IDOs with project outcome data, the Cronbach’s alpha is .742. 19 The autonomy scale is a simple average of the five measures except in the case of multilaterals (AsDB, WB, IFAD, EC), for which tied aid is not calculated; in these cases, the scale is an average of the remaining four measures. The three waves of Paris Declaration surveys (2005, 2007, 2010) are averaged here, in keeping with expert advice that these were effectively multiple mappings of the same facts, with insufficient time for organizations to change significantly between the first wave in 2005 and the last wave in 2010. Results are robust to using any wave and dropping any wave of the survey.

20
substantial development experience or whose jobs bring them into contact with a wide
variety of donors.20 A typical role for one of these respondents would be a senior position
in the aid management unit of a recipient government’s ministry of finance. Respondents
rated a number of development agencies (including but not limited to those in the sample)
on a scale of 1 to 7 in response to the following question: To what degree do you believe the in-‐country field office/bureau of the agencies listed below (presented in random order) are enabled to make decisions with a significant impact on the direction, nature, or quality of development projects? Please only respond for those agencies you have had exposure to either via working with the agencies or discussions with colleagues.
The survey N is 28, with varying coverage for different donors.21 This is a small but
well-‐informed sample; methodological studies suggest small numbers of high-‐quality
respondents will prove more accurate than significantly larger samples that lack expertise
(Leuffen, Shikano, and Walter 2012). Moreover, this survey is well correlated with the Paris
Declaration-‐based scale (.71), providing an additional level of confidence in the accuracy of
the Paris Declaration-‐based measure.
Environmental Unpredictability
Environmental unpredictability is measured via the State Fragility Index (SFI) of the
Polity IV/Integrated Network for Societal Conflict Research (Center for Systemic Peace
2012). This index incorporates security, governance, economic development, and social
development measures and has two subscales: effectiveness and legitimacy. The two
subscales are highly correlated (.66) and Cronbach’s alpha (.78) suggests that they map the
20 The survey has a concentration of nationals and internationals with expertise in Liberia and South Africa (as these are case study countries for my related qualitative work). The survey N is limited by the small number of individuals in any given country who can make expert inter-‐donor comparisons (this generally excludes employees of development agencies, who can only speak intelligently regarding their own organization). 21 This is the remaining N after removing surveys which were not substantively responsive or gave indications of nonsense answers; the two largest reasons for exclusion were (a) rating the Asian Development Bank despite stating that all relevant development-‐related work experience was in an African country (where the Asian Development Bank does not function) or (b) rating the survey’s anchoring vignettes such that the most autonomous text was evaluated as being just as autonomous or less autonomous than the least autonomous text.
21
same underlying construct.22 While the analysis below looks at the aggregate SFI measure,
results are robust to dropping either subscale.
More fragile contexts are inherently less predictable; predictability and fragility are
often linked explicitly in development practice, with practitioners speaking about the
difficult and unpredictable nature of fragile states (Ghani, Lockhart, and Carnahan 2005;
Institute of Development Studies 2014; Weijer 2012). Fragility is in some sense the
likelihood that the current equilibrium will break down or change rapidly, but makes no
claim as to what positive state of the world will replace it.
Sector
In order to determine project sectors for observability and contractibility, I use
OECD Development Assistance Committee (DAC) sector and purpose codes, standard
classifications that are usually assigned by the IDOs themselves in their databases/project
reports or their reports on aid flows to DAC.23 Even the more specific of these (the five-‐digit
purpose codes) leave much to be desired. One can’t look, for example, at the delivery of
antiretroviral drugs to HIV/AIDS patients specifically, as the relevant sector (Sexually
Transmitted Disease control including HIV/AIDS) includes such things as public awareness
and social marketing campaigns, strengthening of countries’ HIV/AIDS response programs,
and projects that focus on prevention in addition to treatment, as well as entirely unrelated
STDs such as syphilis. One might wish to zero in on vaccine delivery, but this is under a
code (Basic Health Care) that also includes such things as nutrition services, support for
nursing care, and strengthening of rural health systems. Thus, this work cannot
systematically code sectors as observable or unobservable and will instead examine
sectors (largely infrastructure) in which observability/contractibility is relatively clear and
compare the results to those of related sectors that are less observable.
Addressing Potential Organizational Selection Out of Difficult Contexts/Sectors
In the original dataset employed below, two organizations—the Global Fund for
Aids, Tuberculosis, and Malaria and the International Fund for Agricultural Development—
work in particular sectors. Of the rest, all IDOs have projects in 10 of 16 of the broad
22In the sample data. 23 In a small number (fewer than 5%) of cases, codes are assigned by me or by research assistants whom I supervised, based on the detailed contents of project reports.

22
sectors (Education, Health, and so on) coded in the data.24 Four broad sectors have
participation from all but one IDO. Only the two smallest sectors, “Communications” and
“Business and Other Services”—accounting for only 3% (342 of 10,857) of the total
projects for which sector codes are available— fail to have projects from two IDOs. We see,
then, that donors are doing similar things across sectors. They are also doing them in the
same countries. The majority of IDOs in this sample overlap in the majority of developing
countries; the vast majority of projects in this sample (77%) occur in countries in which 3
or fewer IDOs are absent.
This speaks to a remarkable lack of selection into—and out of—countries and
sectors in response to realized organizational performance that, in turn, provides a unique
context for empirical examination. In any case, the empirical models employed below will
include controls for both sector and recipient-‐country fixed effects, ensuring that any
minor differences in sectoral or country focus are not driving the findings.
Summary Statistics of Key Variables
Table 2 below presents summary statistics for the variables that form the core of the
analysis.
Table 2: Summary Statistics for Key Variables
The coverage of the State Fragility Index, one of the key covariates, only begins in
1994, thus limiting the analysis to the nearly 10,000 projects of that time period. However,
this also limits the mismatch between the periodicity of this data and the Paris Declaration
monitoring surveys from which the autonomy scale is drawn, which were conducted from
2005-‐2011.
24 By “broad sectors,” I mean the two-‐digit sectors of the DAC’s sectoral classification scheme, excluding here debt relief and humanitarian assistance.
Variable Obs Mean Std. Dev. Min MaxOverall Project Success (6 pt scale) 14610 4.235 1.203 1 6Overall Project Success (z scores) 14610 0 1 -3.53 2.011State Fragility Index 9546 12.486 4.996 0 25Project Size (USD Millions) 9957 29.194 74.299 .004 4015Autonomy (from Paris Declaration scale) 14961 .654 .058 .564 .79Autonomy (from expert survey) 13389 3.96 .516 3 6
1
23
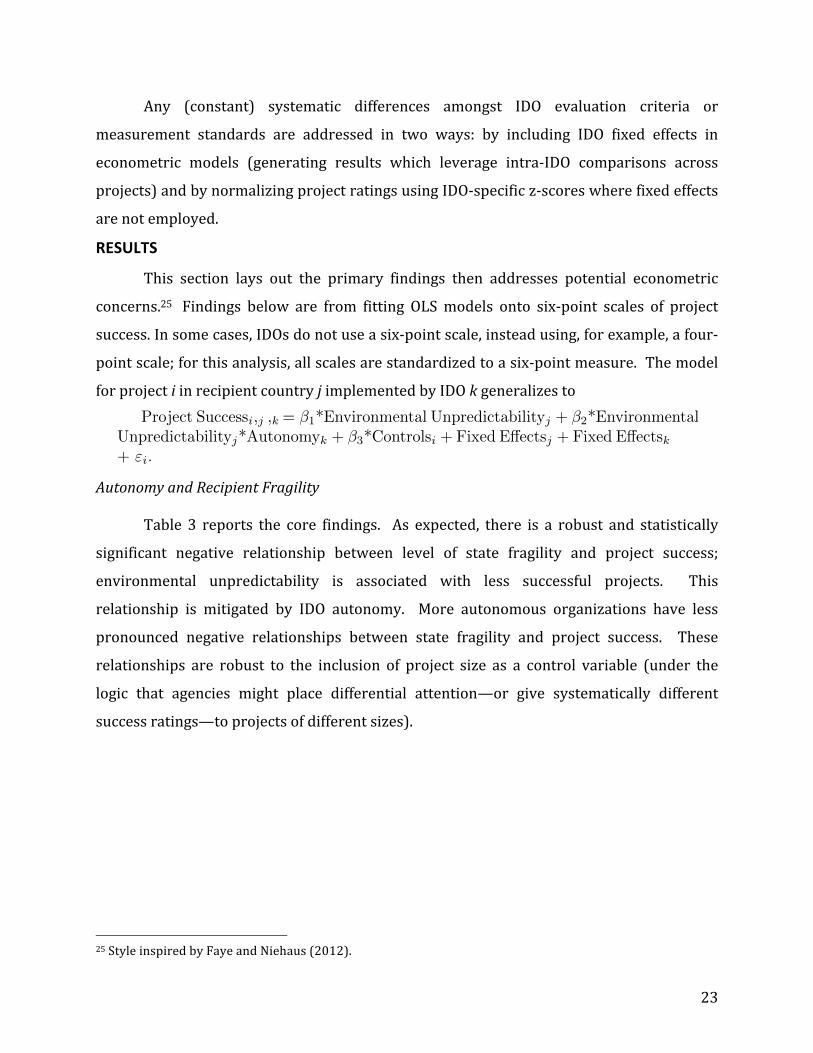
Any (constant) systematic differences amongst IDO evaluation criteria or
measurement standards are addressed in two ways: by including IDO fixed effects in
econometric models (generating results which leverage intra-‐IDO comparisons across
projects) and by normalizing project ratings using IDO-‐specific z-‐scores where fixed effects
are not employed.
RESULTS
This section lays out the primary findings then addresses potential econometric
concerns.25 Findings below are from fitting OLS models onto six-‐point scales of project
success. In some cases, IDOs do not use a six-‐point scale, instead using, for example, a four-‐
point scale; for this analysis, all scales are standardized to a six-‐point measure. The model
for project i in recipient country j implemented by IDO k generalizes to
Autonomy and Recipient Fragility
Table 3 reports the core findings. As expected, there is a robust and statistically
significant negative relationship between level of state fragility and project success;
environmental unpredictability is associated with less successful projects. This
relationship is mitigated by IDO autonomy. More autonomous organizations have less
pronounced negative relationships between state fragility and project success. These
relationships are robust to the inclusion of project size as a control variable (under the
logic that agencies might place differential attention—or give systematically different
success ratings—to projects of different sizes).
25 Style inspired by Faye and Niehaus (2012).
Project Successi,j ,k = �1*Environmental Unpredictabilityj + �2*Environmental
Unpredictabilityj*Autonomyk + �3*Controlsi + Fixed E↵ectsj + Fixed E↵ectsk
+ "i.
1
24
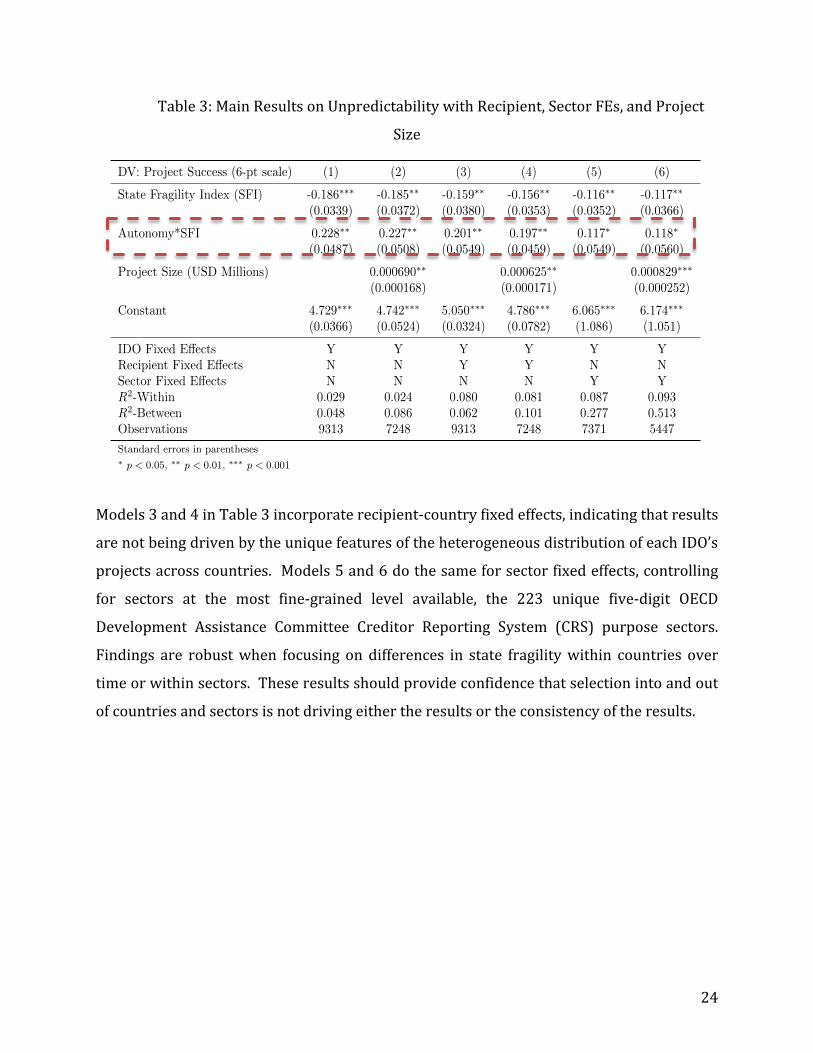
Table 3: Main Results on Unpredictability with Recipient, Sector FEs, and Project
Size
Models 3 and 4 in Table 3 incorporate recipient-‐country fixed effects, indicating that results
are not being driven by the unique features of the heterogeneous distribution of each IDO’s
projects across countries. Models 5 and 6 do the same for sector fixed effects, controlling
for sectors at the most fine-‐grained level available, the 223 unique five-‐digit OECD
Development Assistance Committee Creditor Reporting System (CRS) purpose sectors.
Findings are robust when focusing on differences in state fragility within countries over
time or within sectors. These results should provide confidence that selection into and out
of countries and sectors is not driving either the results or the consistency of the results.
DV: Project Success (6-pt scale) (1) (2) (3) (4) (5) (6)
State Fragility Index (SFI) -0.186⇤⇤⇤ -0.185⇤⇤ -0.159⇤⇤ -0.156⇤⇤ -0.116⇤⇤ -0.117⇤⇤
(0.0339) (0.0372) (0.0380) (0.0353) (0.0352) (0.0366)
Autonomy*SFI 0.228⇤⇤ 0.227⇤⇤ 0.201⇤⇤ 0.197⇤⇤ 0.117⇤ 0.118⇤
(0.0487) (0.0508) (0.0549) (0.0459) (0.0549) (0.0560)
Project Size (USD Millions) 0.000690⇤⇤ 0.000625⇤⇤ 0.000829⇤⇤⇤
(0.000168) (0.000171) (0.000252)
Constant 4.729⇤⇤⇤ 4.742⇤⇤⇤ 5.050⇤⇤⇤ 4.786⇤⇤⇤ 6.065⇤⇤⇤ 6.174⇤⇤⇤
(0.0366) (0.0524) (0.0324) (0.0782) (1.086) (1.051)
IDO Fixed E↵ects Y Y Y Y Y YRecipient Fixed E↵ects N N Y Y N NSector Fixed E↵ects N N N N Y YR2-Within 0.029 0.024 0.080 0.081 0.087 0.093R2-Between 0.048 0.086 0.062 0.101 0.277 0.513Observations 9313 7248 9313 7248 7371 5447
Standard errors in parentheses
⇤ p < 0.05, ⇤⇤ p < 0.01, ⇤⇤⇤ p < 0.001
1
25
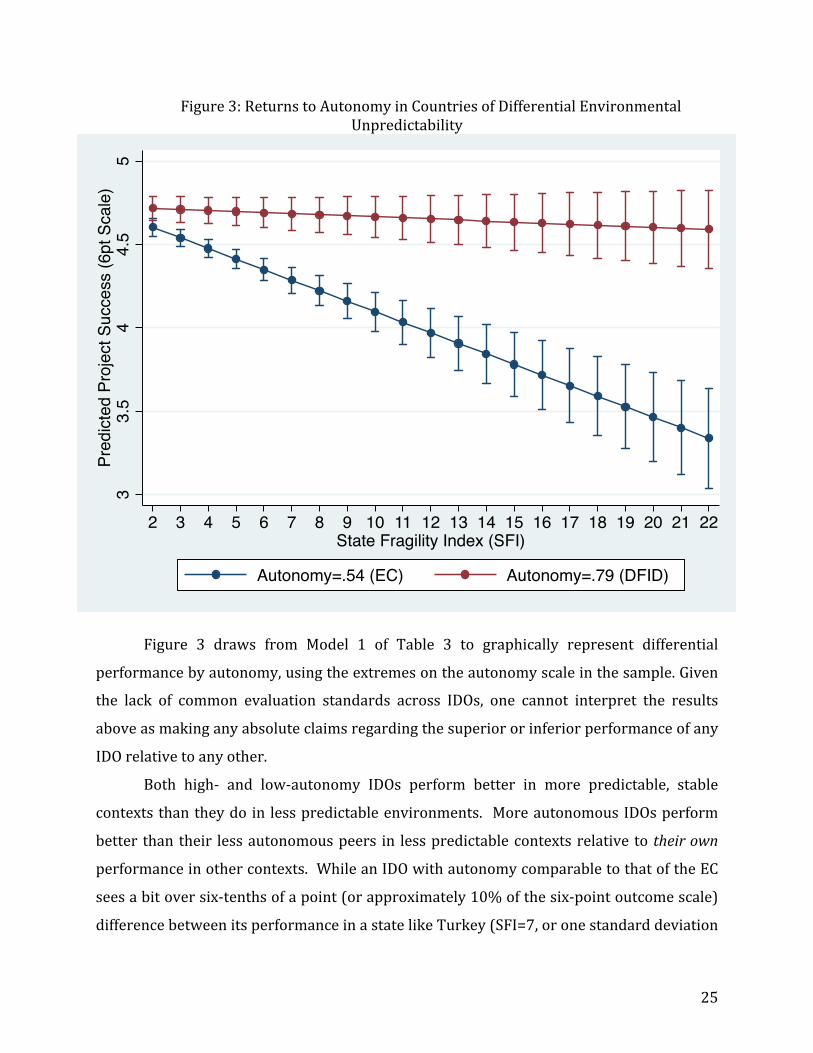
Figure 3: Returns to Autonomy in Countries of Differential Environmental Unpredictability
Figure 3 draws from Model 1 of Table 3 to graphically represent differential
performance by autonomy, using the extremes on the autonomy scale in the sample. Given
the lack of common evaluation standards across IDOs, one cannot interpret the results
above as making any absolute claims regarding the superior or inferior performance of any
IDO relative to any other.
Both high-‐ and low-‐autonomy IDOs perform better in more predictable, stable
contexts than they do in less predictable environments. More autonomous IDOs perform
better than their less autonomous peers in less predictable contexts relative to their own
performance in other contexts. While an IDO with autonomy comparable to that of the EC
sees a bit over six-‐tenths of a point (or approximately 10% of the six-‐point outcome scale)
difference between its performance in a state like Turkey (SFI=7, or one standard deviation
33.
54
4.5
5Pr
edic
ted
Proj
ect S
ucce
ss (6
pt S
cale
)
2 3 4 5 6 7 8 9 10 11 12 13 14 15 16 17 18 19 20 21 22State Fragility Index (SFI)
Autonomy=.54 (EC) Autonomy=.79 (DFID)
26
more stable than the mean) and its performance in a state like Rwanda (SFI=17, or one
standard deviation below the mean), an IDO with autonomy comparable to that of DFID
sees only about .03 of a point (or approximately .05% of the six-‐point outcome scale) in
performance differential.
The model in Table 3 does not incorporate a base term for IDO autonomy; as a time-‐
invariant measure at the IDO level, it is collinear to IDO fixed effects. For interpretive
purposes, this is not a problem as this paper makes no claims about the direct effect of
autonomy on project success. The inclusion of IDO fixed effects precludes any bias in the
interaction term that might otherwise result from a failure to include the base term in the
interaction. However, Appendix Table A1 replicates Table 3, incorporating the IDO-‐
autonomy base term and dropping IDO fixed effects. While we cannot learn much from the
coefficient on the base term (as the IDO-‐specific z-‐score outcome measure precludes any
direct comparison between IDOs), it is worth noting that without IDO fixed effects, it
becomes much easier to interpret the R2 terms; Model 1 suggests that autonomy and state
fragility (and their interaction) are jointly explaining a remarkably large share (R2-‐
between=.54) of the variance in differential normalized project success amongst IDOs.
Appendix Table A2 adds a series of fixed effects to the main findings. Inclusion of
time fixed effects (either yearly or in five-‐year periods) does nothing to diminish the
association between autonomy and recipient unpredictability. The result remains robust
to including time*IDO fixed effects and time*recipient fixed effects.26 These results should
allay any concerns that the primary results are driven by heterogeneous IDO project
performance over time or by heterogeneous entry of IDOs into and out of recipient
countries over time.
Extensions
This work has argued that the gathering and incorporation of soft information is the
primary channel through which autonomy impacts project performance. We might expect, 26 The inclusion of time*recipient effects necessitates using five-‐year periods rather than individual years; at approximately 180 recipients*30 years, this generates nearly 5000 dummy variables and thus would severely restrict degrees of freedom/analytic leverage, not to mention requiring advanced computing capacity to generate output. The models in Appendix Table A2 do not include project size (though all findings are robust to its inclusion), as missing data on project size leads to significantly smaller samples when it is included and project size is of little substantive significance to the relationship between the key independent variables and project success.
27
then, the returns to having an in-‐country office to be higher for more autonomous IDOs,
who are thus better able to incorporate soft information into decisions. Appendix Table A7
provides suggestive support for this hypothesis.
A thread of recent scholarship has argued that IDO support stimulates isomorphic
mimicry in recipient-‐country governments, with the result of de jure reform but little de
facto progress and a divorcing of formal organizational form from function (Andrews
2011b, 2013; Buntaine, Buch, and Parks 2013). One could interpret this finding as
suggestive evidence that the same is true of the IDOs themselves; that while many IDOs
open offices, it is only for the more autonomous IDOs that offices actually lead to improved
project performance, presumably via better incorporation of soft information by properly
placed field agents. If field agents are less autonomous, it is more difficult to translate the
de jure organizational form of having an in-‐country office into something that contributes
to de facto improvement in project performance.
Another way to investigate the relationship between unpredictability and autonomy
this result would be via other proxies for environmental unpredictability beyond the state
fragility index employed here, such as the World Bank (World Governance Indicators)
measure of violence. This measure interacts with autonomy just as theory would predict,
with more autonomous IDOs associated with increasing returns in more violent (and thus
unpredictable) environments. But this result is not statistically significant and, when
included in a model which also includes the state fragility index, the relationship between
the interaction of violence*autonomy and project success becomes very weak.
One might also think that a more corrupt environment (as measured by Transparency
International’s Corruption Perception Index) is trickier to navigate without incorporating
soft information and thus that autonomy should be more valuable for IDOs in more corrupt
environments. But once again, the results are in the predicted direction but only weakly so
and do not rise to statistical significance.
Autonomy and Task Domain Observability
Environmental unpredictability is not the only relevant factor in estimating the
anticipated returns to soft information, and hence to autonomy. An anti-‐corruption
program is very difficult to evaluate and measure and is therefore a context in which we

28
should expect to see quite large returns to incorporating soft information; this is less true
of power plant construction, where each part of the process can be easily defined and
measured. An IDO attempting to build a power plant can simply contract on observable
quantifiable metrics, incentivizing staff to deliver; this would mitigate the need for soft
information and thus for autonomy. For such tasks, navigation by measurement might
indeed be the more effective strategy. Delivering dams and promoting democracy are very
different tasks that may well call for different delivery mechanisms and levels of
measurement relative to staff autonomy; that is, for a different optimal point on the
navigation-‐by-‐measurement—navigation-‐by-‐judgment continuum.
Being able to contract on outcomes does not necessarily mean an IDO will do so,
which adds noise to any attempt to observe the relationship between task-‐domain
observability and the role of soft information. Indeed, significant forces in the aid
community—including the World Bank’s focus on Performance-‐Based Financing, the
Center for Global Development-‐initiated push for Cash on Delivery, and, one might argue,
much of the thrust of both the Gates Foundation and the US President’s Emergency Plan for
AIDS Relief—have argued that IDOs insufficiently contract on outcomes when they can and
ought do so. Bill Gates, for example, has highlighted the importance of measuring vaccine
transmission and coverage rates rather than simply sending out health personnel to
conduct vaccine drives (Gates 2013).27 If IDOs do not, in fact, manage based on observable
outcomes when they can—perhaps focusing instead on input-‐based metrics—it is more
ambiguous how we might expect the relationship between autonomy and project success
to vary across the observability of task domain.
The messiness of foreign aid sector classifications further complicates this picture,
as discussed above; sectors commonly include both the observable (such as antiretroviral
drug delivery) and the less observable (such as public awareness and social outreach
campaigns around HIV) in the same sector. The sectors are most straightforward with
regard to tangible infrastructure, which is relatively externally observable and contractible.
27 It is worth noting that, in the same document, Gates also seems to implicitly endorse this work’s conditional view that measurement’s role depends on its ability to provide timely, appropriate, nondistortionary feedback. He says, for example, “You can achieve amazing progress if you set a clear goal and find a measure that will drive progress toward that goal” (p.1), which seems to imply that a well-‐aligned measure is a necessary condition for measurement to be optimally beneficial.

29
Road and power line construction are clearly task domains for which audits and
performance incentives can work and for which we can use the first best solution of
contracting on outcomes.
Tables 4 and 5 below therefore focus, on the one hand, on purpose codes related to
infrastructure construction or observable service delivery (for which we might not expect
to see as strong a relationship between autonomy and outcome) and, on the other hand, on
purpose codes which focus on related policy or administration tasks but are more difficult
to observe. Focusing on related but difficult-‐to-‐observe domains helps to ensure that the
results are not driven by something like the fact that it is much easier to deliver electricity
than to deliver education.
Table 4: Relationship between Autonomy and State Fragility by Sector (Outcomes Easily Observed; Sector by CRS Code)
Table 5: Relationship between Autonomy and State Fragility by Sector (Outcomes Difficult to
Observe; Sector by CRS Code)
DV: Project Success (6-pt scale) (1) (2) (3) (4)Transportation Agricultural Policy Social/Welfare Services All Administration/Management & Administration (Administration, Capacity Building) Policy Management
State Fragility Index (SFI) -1.030⇤⇤⇤ -0.670⇤⇤⇤ -0.371⇤⇤⇤ -0.151⇤⇤⇤
(0.0271) (0.123) (0.0178) (0.0125)
Autonomy*SFI 1.716⇤⇤⇤ 0.928⇤⇤ 0.561⇤⇤⇤ 0.192⇤⇤⇤
(0.0407) (0.182) (0.0305) (0.0195)
Constant 2.978⇤⇤⇤ 4.587⇤⇤⇤ 4.508⇤⇤⇤ 4.554⇤⇤⇤
(0.0266) (0.246) (0.0288) (0.0210)
IDO Fixed E↵ects Y Y Y YR2-Within 0.234 0.077 0.025 0.019R2-Between 0.058 0.437 0.031 0.296Observations 39 55 160 1530
Standard errors in parentheses
⇤ p < 0.05, ⇤⇤ p < 0.01, ⇤⇤⇤ p < 0.001
1
30
There is no relationship between autonomy and project success in the first set of
task domains, where the focus is on constructing something or delivering a tangible and
relatively easily monitorable service, but the relationship is relatively strong in related
administrative sectors. These results are consistent with my contention that task domain
mediates the relationship between project success and environmental unpredictability.
One might worry that these results are driven by idiosyncratic features of the
distribution of donors across project domains or by some nonsystematic mechanism other
than sector observability. To alleviate this concern, Appendix Table A8 creates dummy
variables for those sectors described as observable/unobservable in the tables above and
considers them in the context of the data as a whole. The results confirm those in Tables 4
and 5.
While there is no evidence that navigation by measurement is the better
organizational strategy in more observable task domains, neither is there evidence that
navigation by judgment is better. This provides further evidence that considering the
effects of measurement is critical in determining where measurement is likely to have a
negative effect on project success—that is, in harder-‐to-‐observe task domains—and where
its effects are likely to be more ambiguous and potentially beneficial. Soft information
seems to matter to development success, with more autonomous agencies thus better able
to manage more unpredictable contexts and task domains less tractable to navigation by
measurement. This suggests that autonomy can have positive effects inasmuch as it
provides support for the acquisition and use of soft information.
ROBUSTNESS
This work attempts to explore the data in a way that assuages as many concerns
about the veracity of the analysis or its broader applicability as possible
One might be concerned that the autonomy measure is not actually mapping
autonomy. As noted in the data description, I conducted a small survey of aid experts in the
field who come into contact with a wide range of IDOs (largely as consultants or as
employees of developing country governments) and thus can make expert inter-‐IDO
assessments. The correlation between this survey measure and the autonomy scale drawn
31
from the Paris Declaration surveys is .71. Appendix Table A3 substitutes the survey
measure of autonomy for that of the Paris Declaration-‐based measure; the results are
similar, which should increase confidence in the Paris Declaration-‐based autonomy scale.
One might also worry, particularly given the small number of IDOs in this multilevel
model, whether results are driven by features of the modeling. To address this concern,
Table 6 below examines the relationship between autonomy and project success
nonparametrically, summarizing the relationship between state fragility and project
success for each donor in isolation; that is, using only data from one donor at a time and
implementing nine different regressions.28 In each case, the model is of the form
IDOs are listed in order of ascending autonomy for ease of interpretation.
Table 6: Results from Running a Separate Regression for Each IDO29
28 This is intuitively similar to a rank-‐based regression. 29 The Paris Declaration monitoring survey does not differentiate between institutions from a single country; thus GiZ and KfW (both arms of the German government) have the same autonomy score.
Project Successi,j = �1*State Fragility Indexj + "i.
1
Autonomy Scale Score from Correlation between SFI & Success for this donorIDO Paris Declaration Survey with only this donor’s (Z-score) data in regression
EC .564 -0.0246⇤⇤⇤
(0.0088)
Global Fund .603 -0.0471⇤⇤⇤
(0.0087)
World Bank .622 -0.0364⇤⇤⇤
(0.0029)
Asian DB .651 -0.0671⇤⇤⇤
(0.0098)
JICA .661 -0.0221⇤
(0.0111)
GiZ .674 -0.0525⇤⇤⇤
(0.0199)
KfW .674 -0.0331⇤⇤⇤
(0.0063)
IFAD .721 -0.0183(0.0363)
DFID .790 -0.0019(0.0046)
Standard errors in parentheses
⇤ p < 0.05, ⇤⇤ p < 0.01, ⇤⇤⇤ p < 0.001
1

32
As expected, greater state fragility has a more negative and statistically significant
relationship with project success for less autonomous donors. This confirms—using an
approach that does not rely on the parameterization of the interaction term—that higher
levels of autonomy mitigate the inverse relationship between the State Fragility Index and
project success.
One might be worried that results are driven by quirks in the variance of outcomes.
Appendix Table A9 examines this concern in a simple nonparametric manner, by dividing
state fragility and autonomy scores at their respective means and then examining the
variance in project success z-‐score by autonomy and state fragility quadrant, and finds no
cause for concern. Table A9 also shows another nonparametric way of testing the intuition
underlying the core findings. Both low-‐ and high-‐autonomy IDOs do better in contexts of
lower state fragility. However, the gap between low-‐ and high-‐SFI contexts is larger for
low-‐autonomy IDOs (approximately .26 SD) than for high-‐autonomy IDOs (.1 SD). This
should give further confidence that the main results are not driven by idiosyncratic
features of the modeling.
Another concern might be that these data rely on evaluations of project success
made by the agencies themselves. One might worry that an agency with a fragile
relationship with its political authorizing environment would, in addition to being less
autonomous, have a greater incentive to self-‐evaluate projects to have been successes.
Anecdotally, interviews suggest that such behavior occurs in at least some cases.
Alternately, one might think that career-‐concerned agents have every incentive to evaluate
their own projects as successes.
Either of these dynamics would reduce the variation in the outcome measure—the
differential performance between agencies and within agencies across context, domain,
and time. Either of these dynamics would therefore reduce the likelihood of Type I error
(false positives) while increasing the likelihood of Type II error (false negatives) and thus
ought not to diminish our confidence in the principal findings.
The involvement of independent evaluation units also mitigates against this type of
dynamic. In cases where projects are evaluated by implementation staff, the frequent
rotation of IDO staff also means that it is by no means certain that the staff involved in
33
project evaluation would see their careers best served by positive evaluations. In any case,
Appendix Table A4 controls for the type of evaluation; that is, whether the data source is an
internal review by project staff, a review conducted by an IDO’s own independent
evaluation unit, or a review conducted by an externally contracted evaluator.
Interestingly, Table A4 suggests that none of these particular types of evaluator
evaluates projects systematically differently than any other. The relationship between
autonomy and state fragility remains unchanged, giving some comfort that evaluation bias
is not driving the results.
Placebo Tests One might be concerned that, despite the survey of aid experts, what this paper calls
autonomy is in fact mapping a more general construct of good donor practice. If this were
the case, the results might provide reassurance that the consensus wisdom on what
constitutes good development—articulated, in part, by the very Paris Declaration from
whose monitoring surveys the autonomy measure employed above is constructed—is on
point. These results would not, however, suggest that organizational autonomy is an
important factor, nor necessarily that soft information is critical in aid delivery.
To address this, I run a series of placebo tests, examining whether other measures of
good donor conduct yield the same relationship with the data observed for the autonomy
measure. Table 7 gives summary statistics on two alternate scales which aim to measure
and compare IDOs’ practices: the Commitment to Development Index (CDI) and the Quality
of Official Development Assistance (QuODA) (Birdsall and Kharas 2010).30 In both cases, I
also look at the subscales that seem most relevant—CDI’s Aid component and QuODA’s
Maximizing Efficiency and Fostering Institutions subscales. There is some overlap between
these measures and my autonomy scale (which is repeated below for ease of reference).
The CDI aid index penalizes tied aid (a component of the autonomy scale); untied aid is also
a component of QuODA’s Maximizing Efficiency measure. QuODA’s Fostering Institutions 30 The CDI is an annual product of the Center for Global Development; the QuODA is an occasional product of the Brookings Institution in collaboration with the Center for Global Development (the last wave was in 2009). The CDI has a number of components (Aid, Investment, Migration, Environment, Security, and Technology) which assess the commitment of nations (multilateral organizations such as the World Bank are not included) to assisting the developing world. The QuODA has four components: Maximizing Efficiency, Transparency and Learning, Reducing Burden, and Fostering Institutions. All components of both the CDI and the QuODA involve a variety of submeasures. CDI is available here; QuODA is available here.
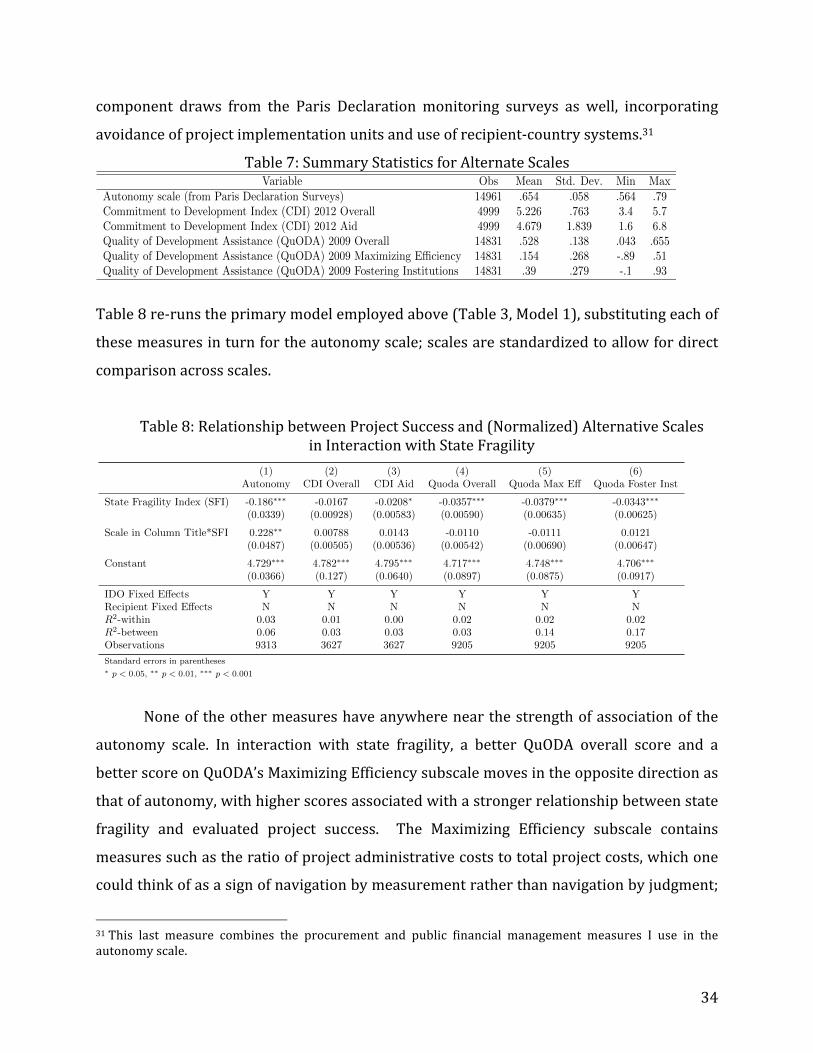
34
component draws from the Paris Declaration monitoring surveys as well, incorporating
avoidance of project implementation units and use of recipient-‐country systems.31
Table 7: Summary Statistics for Alternate Scales
Table 8 re-‐runs the primary model employed above (Table 3, Model 1), substituting each of
these measures in turn for the autonomy scale; scales are standardized to allow for direct
comparison across scales.
Table 8: Relationship between Project Success and (Normalized) Alternative Scales in Interaction with State Fragility
None of the other measures have anywhere near the strength of association of the
autonomy scale. In interaction with state fragility, a better QuODA overall score and a
better score on QuODA’s Maximizing Efficiency subscale moves in the opposite direction as
that of autonomy, with higher scores associated with a stronger relationship between state
fragility and evaluated project success. The Maximizing Efficiency subscale contains
measures such as the ratio of project administrative costs to total project costs, which one
could think of as a sign of navigation by measurement rather than navigation by judgment;
31 This last measure combines the procurement and public financial management measures I use in the autonomy scale.
Variable Obs Mean Std. Dev. Min MaxAutonomy scale (from Paris Declaration Surveys) 14961 .654 .058 .564 .79Commitment to Development Index (CDI) 2012 Overall 4999 5.226 .763 3.4 5.7Commitment to Development Index (CDI) 2012 Aid 4999 4.679 1.839 1.6 6.8Quality of Development Assistance (QuODA) 2009 Overall 14831 .528 .138 .043 .655Quality of Development Assistance (QuODA) 2009 Maximizing E�ciency 14831 .154 .268 -.89 .51Quality of Development Assistance (QuODA) 2009 Fostering Institutions 14831 .39 .279 -.1 .93
1
(1) (2) (3) (4) (5) (6)Autonomy CDI Overall CDI Aid Quoda Overall Quoda Max E↵ Quoda Foster Inst
State Fragility Index (SFI) -0.186⇤⇤⇤ -0.0167 -0.0208⇤ -0.0357⇤⇤⇤ -0.0379⇤⇤⇤ -0.0343⇤⇤⇤
(0.0339) (0.00928) (0.00583) (0.00590) (0.00635) (0.00625)
Scale in Column Title*SFI 0.228⇤⇤ 0.00788 0.0143 -0.0110 -0.0111 0.0121(0.0487) (0.00505) (0.00536) (0.00542) (0.00690) (0.00647)
Constant 4.729⇤⇤⇤ 4.782⇤⇤⇤ 4.795⇤⇤⇤ 4.717⇤⇤⇤ 4.748⇤⇤⇤ 4.706⇤⇤⇤
(0.0366) (0.127) (0.0640) (0.0897) (0.0875) (0.0917)
IDO Fixed E↵ects Y Y Y Y Y YRecipient Fixed E↵ects N N N N N NR2-within 0.03 0.01 0.00 0.02 0.02 0.02R2-between 0.06 0.03 0.03 0.03 0.14 0.17Observations 9313 3627 3627 9205 9205 9205
Standard errors in parentheses
⇤ p < 0.05, ⇤⇤ p < 0.01, ⇤⇤⇤ p < 0.001
1
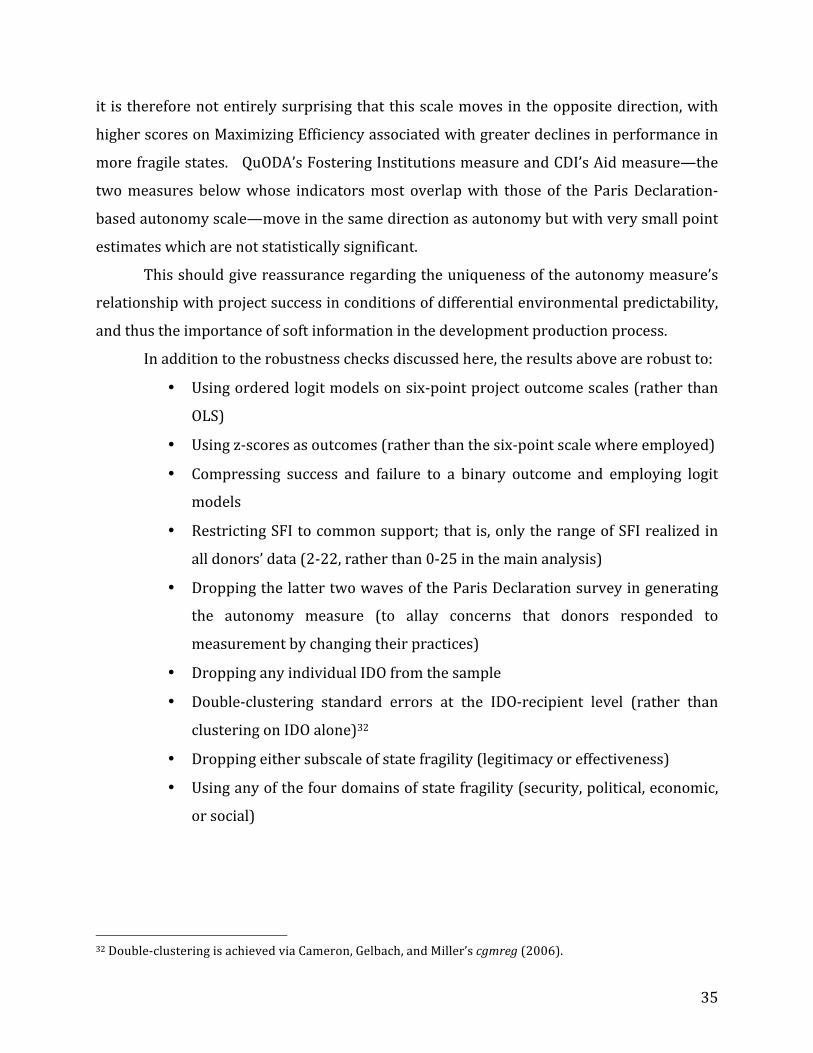
35
it is therefore not entirely surprising that this scale moves in the opposite direction, with
higher scores on Maximizing Efficiency associated with greater declines in performance in
more fragile states. QuODA’s Fostering Institutions measure and CDI’s Aid measure—the
two measures below whose indicators most overlap with those of the Paris Declaration-‐
based autonomy scale—move in the same direction as autonomy but with very small point
estimates which are not statistically significant.
This should give reassurance regarding the uniqueness of the autonomy measure’s
relationship with project success in conditions of differential environmental predictability,
and thus the importance of soft information in the development production process.
In addition to the robustness checks discussed here, the results above are robust to:
• Using ordered logit models on six-‐point project outcome scales (rather than
OLS)
• Using z-‐scores as outcomes (rather than the six-‐point scale where employed)
• Compressing success and failure to a binary outcome and employing logit
models
• Restricting SFI to common support; that is, only the range of SFI realized in
all donors’ data (2-‐22, rather than 0-‐25 in the main analysis)
• Dropping the latter two waves of the Paris Declaration survey in generating
the autonomy measure (to allay concerns that donors responded to
measurement by changing their practices)
• Dropping any individual IDO from the sample
• Double-‐clustering standard errors at the IDO-‐recipient level (rather than
clustering on IDO alone)32
• Dropping either subscale of state fragility (legitimacy or effectiveness)
• Using any of the four domains of state fragility (security, political, economic,
or social)
32 Double-‐clustering is achieved via Cameron, Gelbach, and Miller’s cgmreg (2006).
36
Sample Selection and Generalizability As described in the data section, inclusion in the sample requires a willingness to
make results public or to disclose them to me. It also requires that an agency actually
collect a holistic project-‐level indicator of success, which not all of them do. (USAID and
UNDP could not be included because they do not generate such an indicator.) This makes
the IDOs included in this analysis a convenience sample and thus raises concerns regarding
broader generalizability.
To the extent that both organizational measurement decisions and, particularly, the
willingness to make data public are plausibly correlated to an agency’s autonomy—and
Table A5 in the Appendix, which lists agencies by autonomy, suggests they may well be—
this certainly is a threat to generalizability that must be considered in examining these
quantitative results in isolation.33 That said, it seems that the most straightforward effect of
this type of sample selection would be to bias the sample away from the least autonomous
agencies, who would have the least stable relationships with their political authorizing
environments and as a result might be least likely to make information public. This would
make findings in favor of the mooted hypotheses less likely, particularly if one were to
believe that the “true” shape of the relationship between autonomy and success is an
inverted parabola (see footnote 9).
Conclusion
There is a real tradeoff between navigation by judgment and navigation by
measurement, with the optimal strategy for a given project depending critically on features
of the environment. Autonomy is critical in facilitating organizational responsiveness to
complex and unpredictable environments.
How foreign aid is delivered matters. It matters not just as an abstract concern
regarding efficiency but tangibly to the lives of literally hundreds of millions of people. The
dimensions along which navigation by judgment and navigation by measurement augur for
better or worse organizational performance—argued here to be task contractibility and
environmental unpredictability—matter well beyond the confines of IDOs, with potential
33 Work using qualitative case study data examining the same hypotheses, referenced above, is not subject to the same concern and finds results consistent with those of this work.

37
relevance to a range of organizations, particularly those that often work in novel and
complex contexts or task domains.
This work finds that more autonomous IDOs—those that navigate by judgment to a
greater degree—see their performance decline less in more fragile contexts than does the
performance of their less autonomous peers that navigate by measurement. Variation in
authorizing environments and in the lack of “slack” between organization and authorizers
accounts for much of these differences in realized organizational autonomy, with quite
substantial potential impacts on development outcomes and consequently on
developmental trajectories and conflicts.
These finding rely on an original dataset, the world’s largest such aid project
performance dataset. I intend for this data to soon enter the public domain, where it can
be of use to other scholars of international organizations, comparative politics, and foreign
aid.
In some instances, output measurement may well improve organizational
performance; when working in relatively predictable environments and relatively
observable task domains, navigation by measurement may well be the superior strategy. In
less predictable environments and less observable task domains, this measurement crowds
out the organization’s ability to incorporate soft information. The more unpredictable the
environment, the more important it is to have power and decision-‐making sit with those
most likely to see change coming and respond proactively—that is, to navigate by
judgment. This means not simply formally decentralizing decision making by creating an
in-‐country office, but also relying on that office to make decisions of consequence.
There are, of course, countless sources of variance in project outcomes. Even on the
most charitable reading of the results, autonomy and state fragility jointly explain no more
than 55% of the variance in (normalized) inter-‐IDO project success in the sample. Poor
institutional environments, lack of political will, and corruption are commonly mooted as
causal of foreign aid delivery failure and this paper does nothing to suggest they are not.34
34 In related qualitative case study work, I argue that project selection and development is endogenous to IDO autonomy. I further argue that a significant share of the variance in realized political will is not just a matter of who the recipient-‐country actors are but also of the process by which they are engaged and the flexibility of the project design. I would argue, therefore, that realized political will in a project portfolio is in part (though not entirely) a function of IDO autonomy.
38
An IDO’s organizational features differ from these items, however, in that they are
wholly controlled by those providing the funds. Organizational design is the “low-‐hanging
fruit” of international development, the factor in development outcomes arguably most
changeable by Western governments and polities. By the estimate of one interviewee with
long experience at the United Nations Development Programme (UNDP), approximately
30% of all staff time is spent on measurement design and reporting (Interviews). For fiscal
year 2013, this works out to approximately $350 million;35 if a move towards more
navigation by judgment and less navigation by output measurement were to reduce this
figure by even 25%, the administrative savings—not to mention the efficiency gains from
greater impact of UNDP’s nearly nine billion dollars in annual development spending—
would be quite significant. Optimal design will not ensure that foreign aid is universally
successful, but it will ensure that those features that are wholly under the control of donor
countries are calibrated so as to give aid the best chance to realize maximum impact.
IDOs—and the aid industry more broadly—offer scholars of organizational strategy
and behavior the prospect of a relatively unexplored area where one might expect large
effect sizes, novel contexts in which to generate theory or explore its boundaries, and
substantively significant potential impacts for research findings. Potential margins of
future research include intra-‐IDO autonomy within agencies, projects, and countries; hiring
and staff review processes and incentives; performance measurement (both in the human
resources sense and in the organizational/project performance sense); staff rotation
practices; and the role of staff quality,36 including the feedback loop between staff quality
and work environment.
Where output measurement and tight control by distant principals work well,
management by measurement should be used to better deliver vaccines or more efficiently
build electricity transmission infrastructure. But where foreign aid has the potential to
make the most difference -‐ in the most fragile states – measurement is the least useful, with
35 This is drawn from UNDP’s estimates of administrative and policy coordination cost (United Nations Development Programme 2013, p. 6). 36 One recent paper from the World Bank research department finds that who supervises a project—that is, individual-‐level fixed effects—plays a greater role in project success than any other feature of the project (Denizer, Kaufmann, and Kraay 2013).

39
navigation by judgment the optimal strategy. My findings suggest that not only are we not
doing all we can to improve aid delivery, the move towards measurement and control
across all aid sectors in recent years may actually be making things worse in some sectors.
Measurement may lead to the construction of many successful dams but leave recipient
countries without the capacity building necessary to manage and maintain those dams or
to put the electricity to use. If our drive for results leads us to control aid too tightly, we
may end up accomplishing precisely the opposite of what we intend.

40
Appendix Table A1: Main Results including base autonomy term with Recipient-‐country,
Sector Fixed Effects
Table A2: Expanding Fixed Effects for Robustness
DV: Project Success (Z-score) (1) (2) (3) (4) (5) (6)
Autonomy (PD Scale) -1.859⇤⇤ -2.295⇤⇤⇤ -1.892⇤⇤⇤ -2.184⇤⇤⇤ -0.331 -0.584(0.664) (0.493) (0.403) (0.294) (0.675) (0.714)
State Fragility Index (SFI) -0.141⇤⇤⇤ -0.159⇤⇤⇤ -0.133⇤⇤⇤ -0.142⇤⇤⇤ -0.0924⇤⇤ -0.103⇤⇤⇤
(0.0260) (0.0260) (0.0230) (0.0183) (0.0290) (0.0310)
Autonomy*SFI 0.170⇤⇤⇤ 0.194⇤⇤⇤ 0.165⇤⇤⇤ 0.177⇤⇤⇤ 0.0934⇤ 0.107⇤
(0.0392) (0.0353) (0.0343) (0.0279) (0.0452) (0.0475)
Project Size (USD Millions) 0.000617⇤⇤⇤ 0.000436⇤ 0.000518⇤
(0.000129) (0.000209) (0.000208)
Constant 1.587⇤⇤⇤ 1.892⇤⇤⇤ 1.207⇤⇤ 1.401⇤⇤ 1.578 1.760(0.433) (0.361) (0.454) (0.436) (1.018) (1.026)
IDO Fixed E↵ects N N N N N NRecipient Fixed E↵ects N N Y Y N NSector Fixed E↵ects N N N N Y YR2-Within 0.026 0.022 0.078 0.079 0.088 0.095R2-Between 0.536 0.054 0.003 0.057 0.105 0.337Observations 9313 7248 9313 7248 7371 5447
Standard errors in parentheses
⇤ p < 0.05, ⇤⇤ p < 0.01, ⇤⇤⇤ p < 0.001
1
DV: Project Success (6-pt scale) (1) (2) (3) (4)
State Fragility Index (SFI) -0.185⇤⇤⇤ -0.183⇤⇤⇤ -0.100⇤ -0.0934⇤
(0.0333) (0.0347) (0.0342) (0.0359)
Autonomy*SFI 0.227⇤⇤ 0.222⇤⇤ 0.161⇤⇤ 0.151⇤⇤
(0.0475) (0.0499) (0.0347) (0.0369)
Constant 4.720⇤⇤⇤ 4.294⇤⇤⇤ 3.317⇤⇤⇤ 2.947⇤⇤⇤
(0.0847) (0.0379) (0.437) (0.459)
IDO Fixed E↵ects Y Y Y YYear Fixed E↵ects Y Y N NYear*IDO Fixed E↵ects N Y N N5-yr ’bin’ Fixed E↵ects N N Y YRecipient Fixed E↵ects N N Y YRecipient* 5-yr bin FEs N N Y YIDO*5-yr bin FEs N N N YR2-Within 0.031 0.048 0.145 0.149R2-Between 0.063 0.014 0.073 0.128Observations 9313 9313 9313 9313
Standard errors in parentheses
⇤ p < 0.05, ⇤⇤ p < 0.01, ⇤⇤⇤ p < 0.001
1
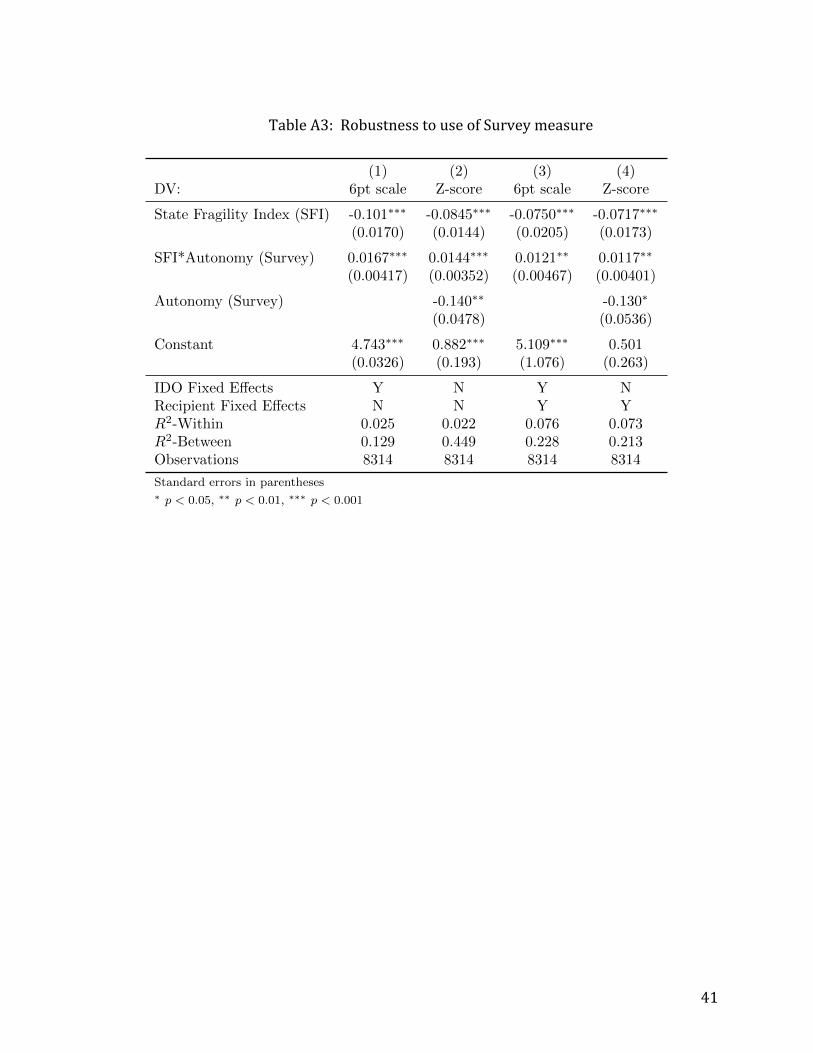
41
Table A3: Robustness to use of Survey measure
(1) (2) (3) (4)DV: 6pt scale Z-score 6pt scale Z-score
State Fragility Index (SFI) -0.101⇤⇤⇤ -0.0845⇤⇤⇤ -0.0750⇤⇤⇤ -0.0717⇤⇤⇤
(0.0170) (0.0144) (0.0205) (0.0173)
SFI*Autonomy (Survey) 0.0167⇤⇤⇤ 0.0144⇤⇤⇤ 0.0121⇤⇤ 0.0117⇤⇤
(0.00417) (0.00352) (0.00467) (0.00401)
Autonomy (Survey) -0.140⇤⇤ -0.130⇤
(0.0478) (0.0536)
Constant 4.743⇤⇤⇤ 0.882⇤⇤⇤ 5.109⇤⇤⇤ 0.501(0.0326) (0.193) (1.076) (0.263)
IDO Fixed E↵ects Y N Y NRecipient Fixed E↵ects N N Y YR2-Within 0.025 0.022 0.076 0.073R2-Between 0.129 0.449 0.228 0.213Observations 8314 8314 8314 8314
Standard errors in parentheses
⇤ p < 0.05, ⇤⇤ p < 0.01, ⇤⇤⇤ p < 0.001
1
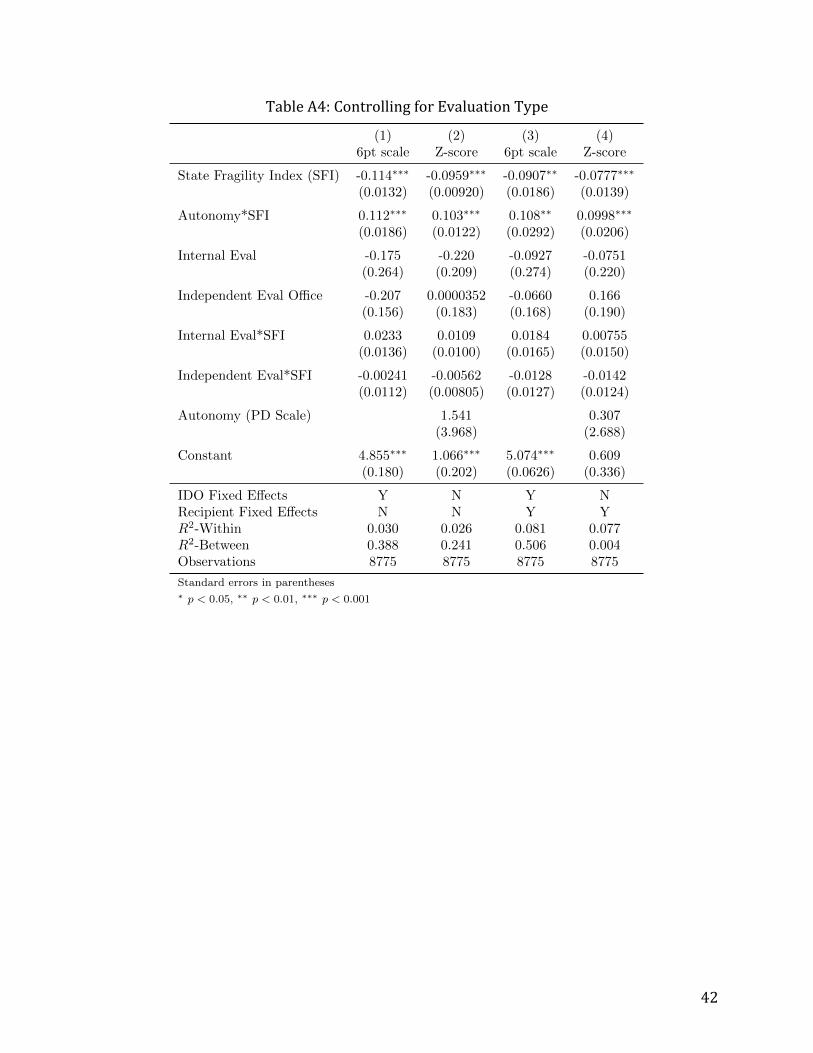
42
Table A4: Controlling for Evaluation Type
(1) (2) (3) (4)6pt scale Z-score 6pt scale Z-score
State Fragility Index (SFI) -0.114⇤⇤⇤ -0.0959⇤⇤⇤ -0.0907⇤⇤ -0.0777⇤⇤⇤
(0.0132) (0.00920) (0.0186) (0.0139)
Autonomy*SFI 0.112⇤⇤⇤ 0.103⇤⇤⇤ 0.108⇤⇤ 0.0998⇤⇤⇤
(0.0186) (0.0122) (0.0292) (0.0206)
Internal Eval -0.175 -0.220 -0.0927 -0.0751(0.264) (0.209) (0.274) (0.220)
Independent Eval O�ce -0.207 0.0000352 -0.0660 0.166(0.156) (0.183) (0.168) (0.190)
Internal Eval*SFI 0.0233 0.0109 0.0184 0.00755(0.0136) (0.0100) (0.0165) (0.0150)
Independent Eval*SFI -0.00241 -0.00562 -0.0128 -0.0142(0.0112) (0.00805) (0.0127) (0.0124)
Autonomy (PD Scale) 1.541 0.307(3.968) (2.688)
Constant 4.855⇤⇤⇤ 1.066⇤⇤⇤ 5.074⇤⇤⇤ 0.609(0.180) (0.202) (0.0626) (0.336)
IDO Fixed E↵ects Y N Y NRecipient Fixed E↵ects N N Y YR2-Within 0.030 0.026 0.081 0.077R2-Between 0.388 0.241 0.506 0.004Observations 8775 8775 8775 8775
Standard errors in parentheses
⇤ p < 0.05, ⇤⇤ p < 0.01, ⇤⇤⇤ p < 0.001
1
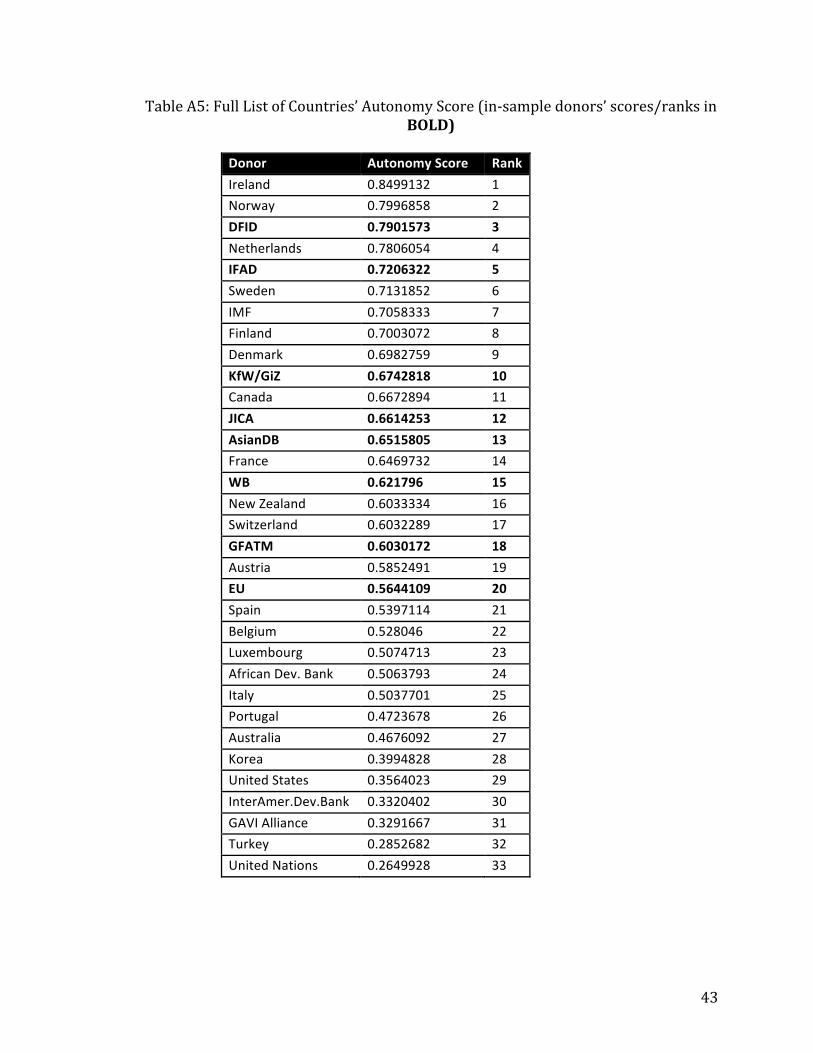
43
Table A5: Full List of Countries’ Autonomy Score (in-‐sample donors’ scores/ranks in BOLD)
Donor Autonomy Score Rank Ireland 0.8499132 1 Norway 0.7996858 2 DFID 0.7901573 3 Netherlands 0.7806054 4 IFAD 0.7206322 5 Sweden 0.7131852 6 IMF 0.7058333 7 Finland 0.7003072 8 Denmark 0.6982759 9 KfW/GiZ 0.6742818 10 Canada 0.6672894 11 JICA 0.6614253 12 AsianDB 0.6515805 13 France 0.6469732 14 WB 0.621796 15 New Zealand 0.6033334 16 Switzerland 0.6032289 17 GFATM 0.6030172 18 Austria 0.5852491 19 EU 0.5644109 20 Spain 0.5397114 21 Belgium 0.528046 22 Luxembourg 0.5074713 23 African Dev. Bank 0.5063793 24 Italy 0.5037701 25 Portugal 0.4723678 26 Australia 0.4676092 27 Korea 0.3994828 28 United States 0.3564023 29 InterAmer.Dev.Bank 0.3320402 30 GAVI Alliance 0.3291667 31 Turkey 0.2852682 32 United Nations 0.2649928 33
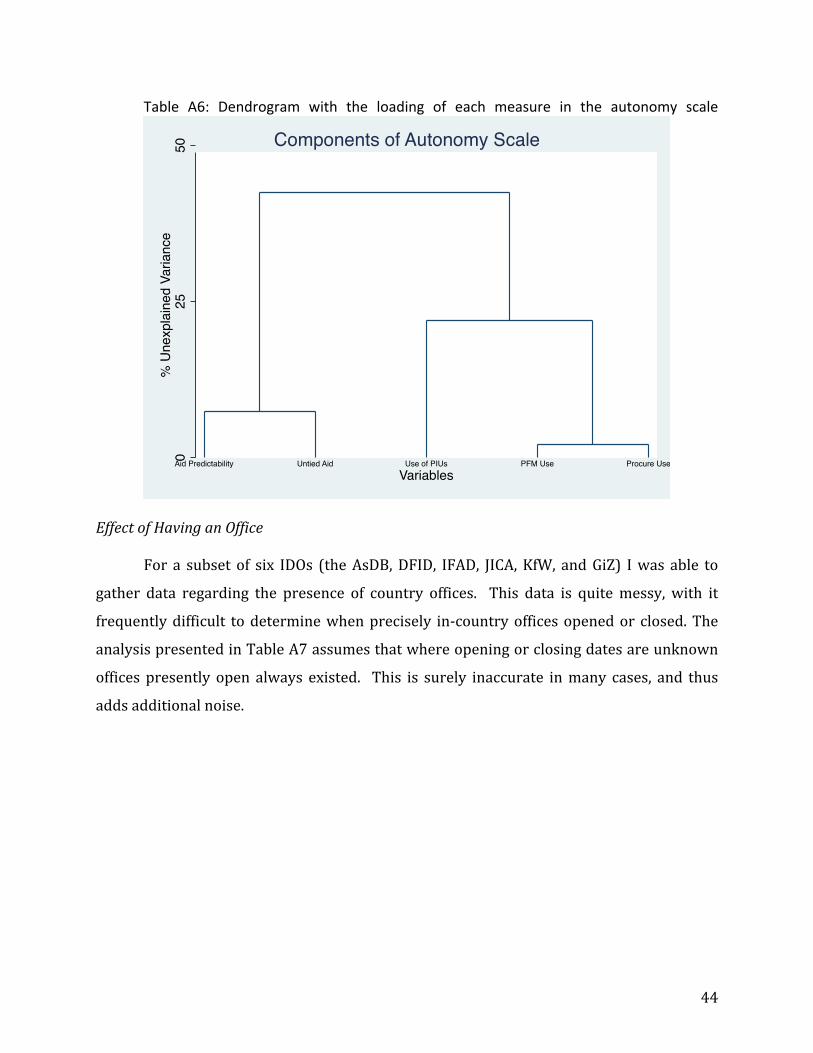
44
Table A6: Dendrogram with the loading of each measure in the autonomy scale
Effect of Having an Office
For a subset of six IDOs (the AsDB, DFID, IFAD, JICA, KfW, and GiZ) I was able to
gather data regarding the presence of country offices. This data is quite messy, with it
frequently difficult to determine when precisely in-‐country offices opened or closed. The
analysis presented in Table A7 assumes that where opening or closing dates are unknown
offices presently open always existed. This is surely inaccurate in many cases, and thus
adds additional noise.
025
50%
Une
xpla
ined
Var
ianc
e
Aid Predictability Untied Aid Use of PIUs PFM Use Procure UseVariables
Components of Autonomy Scale
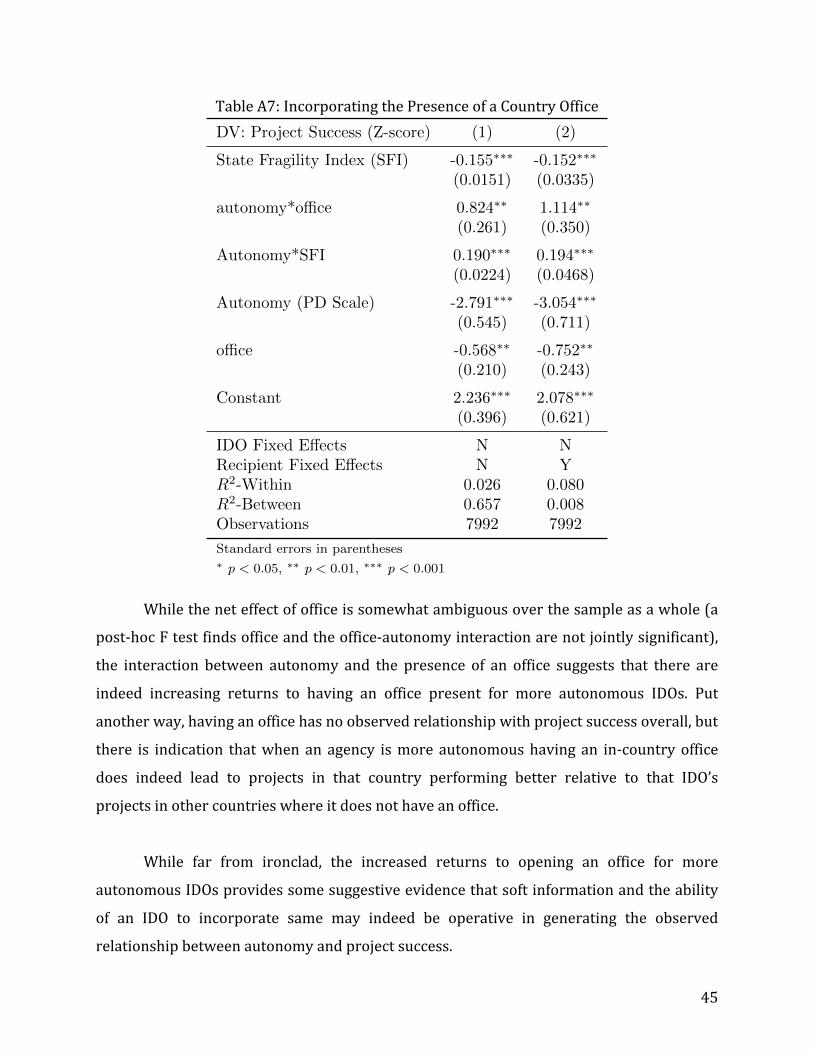
45
Table A7: Incorporating the Presence of a Country Office
While the net effect of office is somewhat ambiguous over the sample as a whole (a
post-‐hoc F test finds office and the office-‐autonomy interaction are not jointly significant),
the interaction between autonomy and the presence of an office suggests that there are
indeed increasing returns to having an office present for more autonomous IDOs. Put
another way, having an office has no observed relationship with project success overall, but
there is indication that when an agency is more autonomous having an in-‐country office
does indeed lead to projects in that country performing better relative to that IDO’s
projects in other countries where it does not have an office.
While far from ironclad, the increased returns to opening an office for more
autonomous IDOs provides some suggestive evidence that soft information and the ability
of an IDO to incorporate same may indeed be operative in generating the observed
relationship between autonomy and project success.
DV: Project Success (Z-score) (1) (2)
State Fragility Index (SFI) -0.155⇤⇤⇤ -0.152⇤⇤⇤
(0.0151) (0.0335)
autonomy*o�ce 0.824⇤⇤ 1.114⇤⇤
(0.261) (0.350)
Autonomy*SFI 0.190⇤⇤⇤ 0.194⇤⇤⇤
(0.0224) (0.0468)
Autonomy (PD Scale) -2.791⇤⇤⇤ -3.054⇤⇤⇤
(0.545) (0.711)
o�ce -0.568⇤⇤ -0.752⇤⇤
(0.210) (0.243)
Constant 2.236⇤⇤⇤ 2.078⇤⇤⇤
(0.396) (0.621)
IDO Fixed E↵ects N NRecipient Fixed E↵ects N YR2-Within 0.026 0.080R2-Between 0.657 0.008Observations 7992 7992
Standard errors in parentheses
⇤ p < 0.05, ⇤⇤ p < 0.01, ⇤⇤⇤ p < 0.001
1
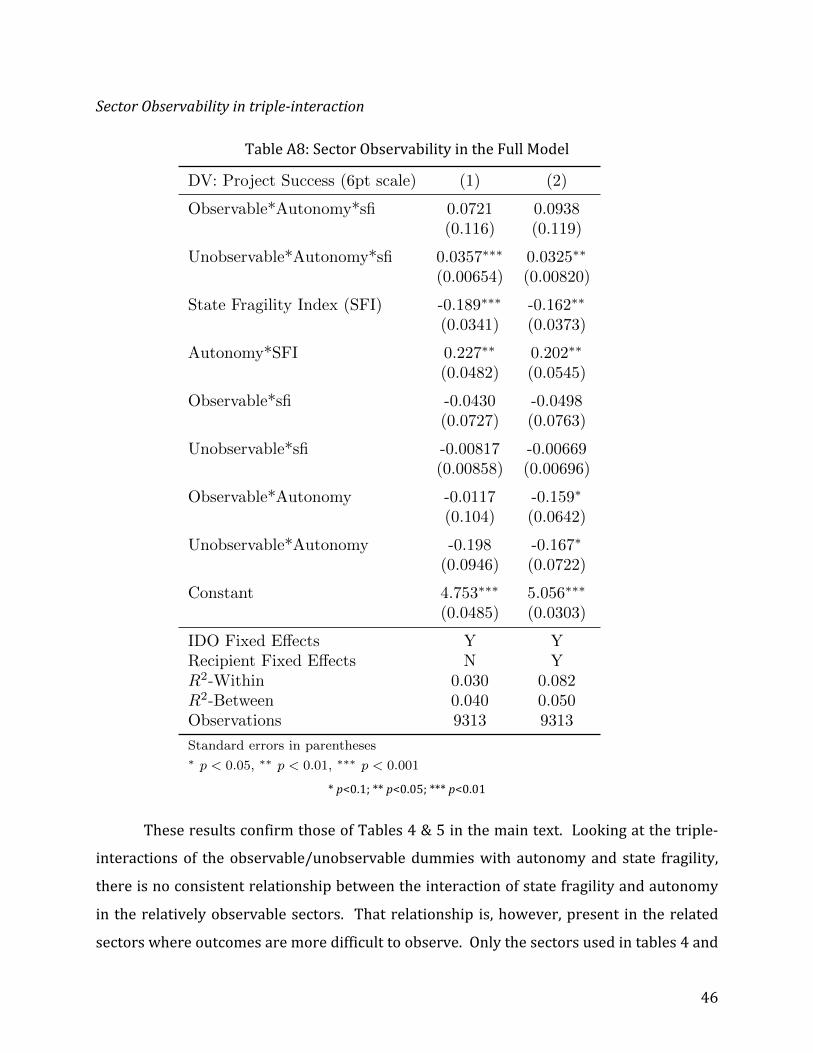
46
Sector Observability in triple-‐interaction
Table A8: Sector Observability in the Full Model
* p<0.1; ** p<0.05; *** p<0.01
These results confirm those of Tables 4 & 5 in the main text. Looking at the triple-‐
interactions of the observable/unobservable dummies with autonomy and state fragility,
there is no consistent relationship between the interaction of state fragility and autonomy
in the relatively observable sectors. That relationship is, however, present in the related
sectors where outcomes are more difficult to observe. Only the sectors used in tables 4 and
DV: Project Success (6pt scale) (1) (2)
Observable*Autonomy*sfi 0.0721 0.0938(0.116) (0.119)
Unobservable*Autonomy*sfi 0.0357⇤⇤⇤ 0.0325⇤⇤
(0.00654) (0.00820)
State Fragility Index (SFI) -0.189⇤⇤⇤ -0.162⇤⇤
(0.0341) (0.0373)
Autonomy*SFI 0.227⇤⇤ 0.202⇤⇤
(0.0482) (0.0545)
Observable*sfi -0.0430 -0.0498(0.0727) (0.0763)
Unobservable*sfi -0.00817 -0.00669(0.00858) (0.00696)
Observable*Autonomy -0.0117 -0.159⇤
(0.104) (0.0642)
Unobservable*Autonomy -0.198 -0.167⇤
(0.0946) (0.0722)
Constant 4.753⇤⇤⇤ 5.056⇤⇤⇤
(0.0485) (0.0303)
IDO Fixed E↵ects Y YRecipient Fixed E↵ects N YR2-Within 0.030 0.082R2-Between 0.040 0.050Observations 9313 9313
Standard errors in parentheses
⇤ p < 0.05, ⇤⇤ p < 0.01, ⇤⇤⇤ p < 0.001
1
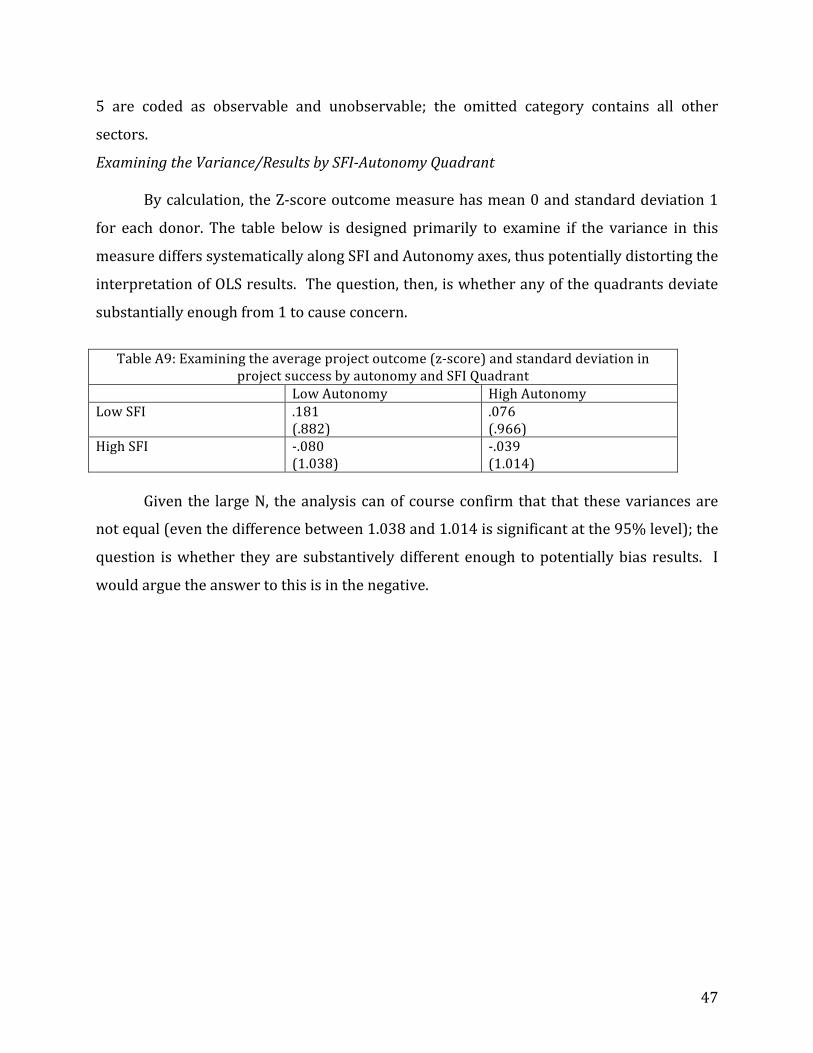
47
5 are coded as observable and unobservable; the omitted category contains all other
sectors.
Examining the Variance/Results by SFI-‐Autonomy Quadrant
By calculation, the Z-‐score outcome measure has mean 0 and standard deviation 1
for each donor. The table below is designed primarily to examine if the variance in this
measure differs systematically along SFI and Autonomy axes, thus potentially distorting the
interpretation of OLS results. The question, then, is whether any of the quadrants deviate
substantially enough from 1 to cause concern.
Table A9: Examining the average project outcome (z-‐score) and standard deviation in
project success by autonomy and SFI Quadrant Low Autonomy High Autonomy Low SFI .181
(.882) .076 (.966)
High SFI -‐.080 (1.038)
-‐.039 (1.014)
Given the large N, the analysis can of course confirm that that these variances are
not equal (even the difference between 1.038 and 1.014 is significant at the 95% level); the
question is whether they are substantively different enough to potentially bias results. I
would argue the answer to this is in the negative.

48
References
Aghion, Philippe, and J. Tirole. 1997. “Formal and Real Authority in Organizations.” Journal of political economy 105(1):1–29.
Alesina, Alberto, and Guido Tabellini. 2008. “Bureaucrats or Politicians? Part II: Multiple Policy Tasks.” Journal of Public Economics 92(3-‐4):426–47.
Andrews, Matt. 2011. “Which Organizational Attributes Are Amenable to External Reform? An Empirical Study of African Public Financial Management.” International Public Management Journal 14(2):131–56.
Andrews, Matt. 2013. The Limits of Institutional Reform in Development: Changing Rules for Realistic Solutions. Cambridge University Press.
Andrews, Matt, Lant Pritchett, and Michael Woolcock. 2012. Escaping Capability Traps Through Problem Driven Iterative Adaptation (PDIA).
Barder, Owen. 2009. Beyond Planning: Markets and Networks for Better Aid.
Barnett, Michael N., and Martha Finnemore. 2003. “The Politics, Power, and Pathologies of International Organizations.” International Organization 53(04):699–732.
Birdsall, Nancy, and HJ Kharas. 2010. Quality of Official Development Assistance Assessment.
Bohnet, I., BS Frey, and S. Huck. 2001. “More Order with Less Law: On Contract Enforcement, Trust, and Crowding.” American Political Science Review 95(1):131–44.
Booth, David. 2013. Facilitating Development: An Arm’s Length Approach to Aid.
Bräutigam, DA, and Stephen Knack. 2004. “Foreign Aid , Institutions, and Governance in Sub-‐Saharan Africa.” Economic development and cultural change 52(2):255–85.
Brechin, Steven. 1997. Planting Trees in the Developing World: A Sociology of International Organizations. Johns Hopkins University Press.
Buntaine, Mark T., Benjamin P. Buch, and Bradley C. Parks. 2013. Why the “Results Agenda” Produces Few Results: An Evaluation of the Long-‐Run Institutional Development Impacts of World Bank Environmental Projects.
Calvert, R., M. McCubbins, and B. Weingast. 1989. “A Theory of Political Control and Agency Discretion.” American journal of political … 33(3):588–611.
Cameron, AC, J. Gelbach, and DL Miller. 2006. Robust Inference With Multi-‐Way Clustering. Cambridge, MA.
49
Canales, Rodrigo. 2013. “Weaving Straw into Gold: Managing Organizational Tensions Between Standardization and Flexibility in Microfinance.” Organization Science (February).
Carpenter, Daniel P. 2001. The Forging of Bureaucratic Autonomy: Reputations, Networks, and Policy Innovation in Executive Agencies, 1862-‐1928. Princeton University Press.
Celasun, O., and J. Walliser. 2008. “Predictability of Aid: Do Fickle Donors Undermine Aid Effectiveness?” Economic Policy (July).
Center for Systemic Peace. 2012. “State Fragility Index.”
Chang, KH, Rui J. P. de Figueiredo, and Barry Weingast. 2001. “Rational Choice Theories of Bureaucratic Control and Performance.” Pp. 271–92 in Elgar companion to public choice, edited by William F. Shugart and Laura Razzolini. Elgar.
Chauvet, L., P. Collier, and M. Duponchel. 2010. “What Explains Aid Project Success In Post-‐Conflict Situations?” World Bank Policy Research Working Paper.
Christensen, Tom, and Per Laegreid. 2011. The Ashgate Research Companion to New Public Management. Ashgate Publishing, Ltd.
Clemens, By Michael A., Steven Radelet, and Rikhil Bhavnani. 2004. “Counting Chickens When They Hatch : The Short-‐Term E ¤ Ect of Aid on Growth.” Center for Global Development Working Paper 44.
Denizer, Cevdet, Daniel Kaufmann, and Aart Kraay. 2013. “Good Countries or Good Projects? Macro and Micro Correlates of World Bank Project Performance.” Journal of Development Economics 105:288–302.
Desai, RM, and H. Kharas. 2010. The Determinants of Aid Volatility.
DiMaggio, PJ, and W. Powell. 1983. “The Iron Cage Revisited: Institutional Isomorphism and Collective Rationality in Organizational Fields.” American sociological review 48(2):147–60.
Dixit, A. 2002. “Incentives and Organizations in the Public Sector: An Interpretative Review.” Journal of Human Resources 37(4):696–727.
Dobbin, F., and T. Boychuk. 1999. “National Employment Systems and Job Autonomy: Why Job Autonomy Is High in the Nordic Countries and Low in the United States, Canada, and Australia.” Organization Studies 20(2):257–91.
Easterly, William. 2014. The Tyranny of Experts: How the Fight Against Global Poverty Suppressed Individual Rights (Google eBook). Perseus Books Group.
50
Espeland, WN, and ML Stevens. 1998. “Commensuration as a Social Process.” Annual review of sociology 24(1998):313–43.
Faye, Michael, and Paul Niehaus. 2012. “Political Aid Cycles.” American Economic Review 102(7):3516–30.
Fearon, JD, Macartan Humphreys, and JM Weinstein. 2009. “Can Development Aid Contribute to Social Cohesion after Civil War? Evidence from a Field Experiment in Post-‐Conflict Liberia.” The American Economic Review 99(2).
Fukuyama, Francis. 2013. “What Is Governance?” Governance 26(3):347–68.
Gailmard, Sean, and John W. Patty. 2013. Learning While Governing: Expertise and Accountability in the Executive Branch. University of Chicago Press.
Gates, Bill. 2013. 2013 Gates Foundation Annual Letter.
Ghani, A., Clare Lockhart, and M. Carnahan. 2005. Closing the Sovereignty Gap : An Approach to State-‐Building.
Gibson, Clark, Krister Andersson, Elinor Ostrom, and Sujai Shivakumar. 2005. The Samaritan’s Dilemma: The Political Economy of Development Aid. Oxford University Press.
Grossman, SJ, and OD Hart. 1986. “The Costs and Benefits of Ownership: A Theory of Vertical and Lateral Integration.” The Journal of Political Economy 94(4):691–719.
Gulrajani, Nilima. 2011. “Transcending the Great Foreign Aid Debate: Managerialism, Radicalism and the Search for Aid Effectiveness.” Third World Quarterly 32(2):199–216.
Hawkins, Darren G., and Wade Jacoby. 2006. “How Agents Matter.” Pp. 199–228 in Delegation and Agency in International Organizations.
Hawkins, Darren G., David A. Lake, Daniel L. Nielson, and Michael J. Tierney. 2006. “Delegation under Anarchy: States, International Organizations, and Principal-‐Agent Theory.” Pp. 3–38 in Delegation and Agency in International Organizations, edited by Darren G. Hawkins, David A. Lake, Daniel L. Nielson, and Michael J. Tierney.
Honig, Daniel. 2015. “Letting the Driver Steer: Organizational Autonomy and Country Context in Foreign Aid (Dissertation: Theory, Case Studies, and Large-‐N Analysis).”
Hood, Christopher. 1991. “A Public Management for All Seasons?” Public Administration 69(1):3–19.
51
Hood, Christopher. 2004. “The Middle Aging of New Public Management: Into the Age of Paradox?” Journal of Public Administration Research and Theory 14(3):267–82.
Huber, John D., and Nolan McCarty. 2004. “Bureaucratic Capacity, Delegation, and Political Reform.” American Political Science Review 98(3):481–94.
Huber, John D., and Charles R. Shipan. 2002. Deliberate Discretion: The Institutional Foundations of Bureaucratic Autonomy. Cambridge University Press.
Huber, John D., and Charles R. Shipan. 2006. “Politics, Delegation, and Bureaucracy.” Pp. 256–72 in The Oxford Handbook of Political Economy, edited by Robert E. Goodin. Oxford University Press.
Institute of Development Studies. 2014. “Conflict and Fragility.” 1–2. Retrieved (http://www.ids.ac.uk/idsresearch/conflict-‐and-‐fragility).
Johns, Leslie. 2007. “A Servant of Two Masters: Communication and the Selection of International Bureaucrats.” International Organization 61(02):245–75.
Johnson, Tana, and Johannes Urpelainen. 2014. “International Bureaucrats and the Formation of Intergovernmental Organizations: Institutional Design Discretion Sweetens the Pot.” International Organization 68(01):177–209.
Laffont, JJ, and Jean Tirole. 1988. “The Dynamics of Incentive Contracts.” Econometrica: Journal of the Econometric Society 56(5):1153–75.
Lawrence, Paul R., and Jay William Lorsch. 1967. Organization and Environment: Managing Differentiation and Integration. Harvard Business School Press.
Leuffen, Dirk, S. Shikano, and S. Walter. 2012. “Measurement and Data Aggregation in Small-‐N Social Scientific Research.” European Political Science 1–20.
Lorenz, Chris. 2012. “If You’re So Smart , Why Are You under Surveillance? Universities, Neoliberalism, and New Public Management.” Critical inquiry 38(3):599–629.
Macaulay, Stewart. 1963. “Non-‐Contractual Relations in Business: A Preliminary Study.” American sociological review 28(1):55–67.
Mansbridge, Jane. 2009. “A ‘Selection Model’ of Political Representation.” Journal of Political Philosophy 17(4):369–98.
March, James G., and Herbert Alexander Simon. 1958. Organizations. Wiley.
De Mesquita, Bruce Bueno, and Alastair Smith. 2009. “A Political Economy of Aid.” International Organization 63(02):309.
52
Nielsen, Richard a., Michael G. Findley, Zachary S. Davis, Tara Candland, and Daniel L. Nielson. 2011. “Foreign Aid Shocks as a Cause of Violent Armed Conflict.” American Journal of Political Science 55(2):219–32.
Nielson, Daniel L., and Michael J. Tierney. 2003. “Delegation to International Organizations: Agency Theory and World Bank Environmental Reform.” International Organization 57(02):241–76.
Polanyi, Michael. 1966. The Tacit Dimension. Doubleday.
Pollitt, Christopher, and Geert Bouckaert. 2011. Public Management Reform: A Comparative Analysis -‐ New Public Management, Governance, and the Neo-‐Weberian State. Oxford University Press.
Pritchett, Lant, and Michael Woolcock. 2004. “Solutions When the Solution Is the Problem: Arraying the Disarray in Development.” World Development 32(2):191–212.
Ramalingam, Ben. 2013. Aid on the Edge of Chaos: Rethinking International Cooperation in a Complex World. Oxford University Press.
Stein, JC. 2002. “Information Production and Capital Allocation: Decentralized versus Hierarchical Firms.” The Journal of Finance LVII(5).
Tendler, Judith. 1975. Inside Foreign Aid. Johns Hopkins University Press.
Thompson, James D. 1967. Organizations in Action: Social Science Bases of Administrative Theory. Transaction Publishers.
United Nations Development Programme. 2013. UNDP Integrated Budget Estimates for 2014-‐2017 (DP/2013/41).
Weijer, Frauke De. 2012. Rethinking Approaches to Managing Change in Fragile States.
Williamson, Oliver E. 1983. Markets and Hierarchies: Analysis and Antitrust Implications : A Study in the Economics of Internal Organization. Free Press.
Wilson, James Q. 1989. Bureaucracy: What Government Agencies Do And Why They Do It. Basic Books.
Woolcock, M. 2013. “Using Case Studies to Explore the External Validity of ‘Complex’ Development Interventions.” Evaluation 19(3):229–48.
World Bank. 2011. World Development Report 2011: Conflict, Security, and Development. World Bank.
Zoellick, Robert B. 2010. “Speech to the Annual Meetings Plenary, 8 October 2010.” 1–16.