hoping for economic recovery, preparing for health reform: a … › wp-content › uploads › 2013...
TRANSCRIPT

medicaid
kaiser commiss ion o n
uninsureda n d t h e
Hoping for Economic Recovery, Preparing for Health Reform: A Look at Medicaid Spending, Coverage and Policy Trends
Results from a 50-State Medicaid Budget Survey for State Fiscal Years 2010 and 2011
Prepared by Vernon K. Smith, Ph.D., Kathleen Gifford and Eileen Ellis Health Management Associates
and Robin Rudowitz and Laura Snyder Kaiser Commission on Medicaid and the Uninsured Kaiser Family Foundation
September 2010

medicaiduninsureda n d t h e
kaiser commission
The Kaiser Commiss ion on Medicaid and the
Uninsured prov ides in format ion and analys is
on heal th care coverage and access for the
low- income popula t ion , wi th a specia l focus
on Medicaid ’s ro le and coverage o f the
uninsured. Begun in 1991 and based in the
Kaiser Fami ly Foundat ion ’s Washington, DC
of f ice , the Commiss ion is the larges t
opera t ing program of the Foundat ion . The
Commiss ion ’s work is conducted by
Foundat ion s ta f f under the guidance o f a b i -
par t isan group o f na t ional leaders and
exper ts in heal th care and publ ic po l icy.
J a m e s R . T a l l o n
C h a i r m a n
D i a n e R o w l a n d , S c . D .
E x e c u t i v e D i r e c t o r
Hoping for Economic Recovery, Preparing for Health Reform: A Look at Medicaid Spending, Coverage and Policy Trends
Results from a 50-State Medicaid Budget Survey for State Fiscal Years 2010 and 2011
Prepared by Vernon K. Smith, Ph.D., Kathleen Gifford and Eileen Ellis Health Management Associates
and Robin Rudowitz and Laura Snyder Kaiser Commission on Medicaid and the Uninsured Kaiser Family Foundation
September 2010

medicaid
kaiser commiss ion o n
uninsureda n d t h e
Hoping for Economic Recovery, Preparing for Health Reform: A Look at Medicaid Spending, Coverage and Policy Trends
Results from a 50-State Medicaid Budget Survey for State Fiscal Years 2010 and 2011
Prepared by Vernon K. Smith, Ph.D., Kathleen Gifford and Eileen Ellis Health Management Associates
and Robin Rudowitz and Laura Snyder Kaiser Commission on Medicaid and the Uninsured Kaiser Family Foundation
September 2010

Acknowledgements
Medicaid staffs in virtually every state have seen administrative budgets trimmed and workloads increase as ongoing budget shortfalls have increasingly affected state governments. Especially in this year, we thank the public servants who administer the nation’s Medicaid programs in all 50 states and the District of Columbia who completed the survey on which this study is based, provided information about their programs, participated in structured interviews and responded to our follow-up questions. Without the help of these Medicaid officials, this study could not be done. Given the challenges these staff are facing, we are truly grateful for their assistance.
We offer special thanks to Dennis Roberts at Health Management Associates who developed and managed the database. His work is always excellent and for several years has been invaluable to our work on this survey. David Fosdick and Jenna Walls from Health Management Associates assisted with data analysis, editing and writing the case studies and we thank them for their excellent work.

00 3
Table of Contents
Executive Summary..................................................................................................... 5
Introduction ............................................................................................................. 10
1. Medicaid Today ..................................................................................................... 10
2. Medicaid and the Economy .................................................................................. 15
3. Recent Legislative Action ...................................................................................... 16
4. National Health Reform and Medicaid ................................................................. 17
Methodology ............................................................................................................ 20
Survey Results for Fiscal Years 2010 and 2011 ........................................................... 22
1. State Fiscal Conditions and Overall Impact of ARRA ............................................ 22
A. State Fiscal Conditions...................................................................................... 22 B. Impact of ARRA ................................................................................................. 24
2. Medicaid Spending and Enrollment Growth Rates .............................................. 26
A. Total Medicaid Spending Growth ..................................................................... 27 B. State General Fund Spending Growth for Medicaid ........................................ 29 C. Medicaid Enrollment Growth ........................................................................... 31
3. Medicaid Policy Initiatives for FY 2010 and FY 2011 ............................................ 32
A. Changes in Provider Reimbursement ............................................................... 33 B. Eligibility and Enrollment Process Changes ...................................................... 36 C. Premium Changes ............................................................................................. 41 D. Copayment Requirements ................................................................................ 41 E. Benefits Changes .............................................................................................. 43 F. Long-Term Care and Home and Community–Based Services .......................... 45 G. Prescription Drug Utilization and Cost Control Initiatives ............................... 51
4. Delivery System Changes, Quality Initiatives ........................................................ 54
A. Delivery System Changes ................................................................................. 54 B. Quality and Quality Improvement Initiatives ................................................... 60 C. Health Information Technology ....................................................................... 64
5. Key Issues in Implementing Health Reform .......................................................... 68
6. Looking Ahead: Perspectives of Medicaid Directors ........................................... 71
Conclusion ................................................................................................................ 73

004
Appendix A: State Survey Responses ....................................................................... 74
Appendix A-1: Positive Policy Actions Taken in the 50 States and the District of Columbia, FY 2010 and FY 2011 .................................................................................... 75
Appendix A-2: Cost Containment Actions Taken in the 50 States and the District of Columbia, FY 2010 and FY 2011 .................................................................................... 76
Appendix A-3: Provider Taxes in Place in the 50 States and the District of Columbia, FY 2010 and FY 2011 .......................................................................................................... 77
Appendix A-4a: Eligibility, Premium and Application Renewal Process Related Actions Taken in the 50 States and the District of Columbia, FY 2010 ..................................... 78
Appendix A-4b: Eligibility, Premium and Application Renewal Process Related Actions Taken in the 50 States and the District of Columbia, FY 2011 ..................................... 82
Appendix A-5a: Benefit Related Actions Taken in the 50 States and the District of Columbia, FY 2010 ........................................................................................................ 85
Appendix A-5b: Benefit Related Actions Taken in the 50 States and the District of Columbia, FY 2011 ........................................................................................................ 88
Appendix A-6a: Pharmacy Cost Containment Actions in Place in the 50 States and the District of Columbia, FY 2010 ........................................................................................ 91
Appendix A-6b: Pharmacy Cost Containment Actions Taken in the 50 States and the District of Columbia, FY 2010 and FY 2011 ................................................................... 92
Appendix A-7: Medicaid Care Management Actions Taken in the 50 States and the District of Columbia, FY 2010 and 2011........................................................................ 93
Appendix A-8: Medicaid Quality Measures in Place in the 50 States and the District of Columbia, FY 2010 and 2011 ........................................................................................ 94
Appendix B: Profiles of Selected States: .................................................................... 95
Alabama Case Study ...................................................................................................... 96
Colorado Case Study ................................................................................................... 101
Maryland Case Study .................................................................................................. 106
Appendix C: Survey Instrument ............................................................................... 110

00 5
Executive Summary
At the end of state fiscal year (FY) 2010 and heading into FY 2011, states were still in the midst of the worst economic downturn since the Great Depression with high unemployment, severely depressed revenues and increased demand for services, including Medicaid. While most states expect to see the impact of the recession last for the next few years, they are hoping that 2011 will be a turning point moving toward economic recovery. State economies were bolstered by federal fiscal relief from the American Recovery and Reinvestment Act of 2009 (ARRA) which provided a temporary increase in the federal Medicaid matching rate (known as the “Federal Medical Assistance Percentage,” or “FMAP”) from October 2008 through December 2010. Legislation to provide states with a scaled back extension of this fiscal relief through June 2011 was enacted in August 2010; however, this was after most states had adopted budgets for FY 2011. Even as states continue to grapple with historically difficult budget conditions, they are planning for the implementation of the Patient Protection and Affordable Care Act (ACA), major health reform legislation which envisions an expanded role for Medicaid and the states. While there are many health reform implementation challenges, states will benefit from a dramatic reduction in the number of uninsured and access to new federal funding associated with expanded Medicaid coverage as well as new funding for demonstrations to improve Medicaid delivery systems.
For the tenth consecutive year, the Kaiser Commission on Medicaid and the Uninsured (KCMU) and Health Management Associates (HMA) conducted a survey of Medicaid officials in all 50 states and the District of Columbia to track trends in Medicaid spending, enrollment and policy initiatives. This report also includes background on the Medicaid program, as well as current issues facing the program. Findings are presented for FYs 2010 and 2011.
Fiscal relief funds in ARRA provided critical assistance to states in FYs 2009 and 2010; an extension of these funds through the end of FY 2011 was enacted but at a lower level than those originally approved in ARRA (ES-1). Pressure from the recession remained severe throughout FY 2010 and into FY 2011. The national unemployment rate remained high at 9.6 percent in August after reaching 9.9 percent in April of this year, up from 4.9 percent when the recession began in December 2007. States experienced the sharpest decline in revenues on record, had to close unprecedented budget shortfalls of an estimated $194 billion for FY 2010 and had to handle increased demand for public programs like Medicaid. Nearly all states have cut spending across state programs and for state employees. An estimated $87 billion in fiscal relief from ARRA, provided to states through an enhanced FMAP, helped to close budget shortfalls and to support Medicaid programs in FY 2009 and FY 2010. In August 2010, Congress extended a scaled back version of the Medicaid fiscal relief through June 2011, but because the FMAP extension occurred more than a month after the state fiscal year had begun for all but three states and the District of Columbia, states were forced months earlier to make tough budget decisions or assume the extension of relief in developing their FY 2011 budgets. A full
ES-1
How States Used ARRA Enhanced Medicaid Funding in FY 2009 and FY 2010
28
35
37
38
41
43
29
38
36
44
33
36
Avoided or Restored Eligibility Cuts
Avoided or Reduced Provider Rate Cuts
Avoided Benefit Cuts
Closed or Reduced State General Fund Shortfall
Helped Pay for Increases in Medicaid Enrollment
Closed or Reduced Medicaid Budget Shortfall
FY 2009 FY 2010
SOURCE: KCMU survey of Medicaid officials in 50 states and DC conducted by Health Management Associates, 2009 and 2010.

006
extension of the ARRA enhanced FMAP was estimated to cost $24 billion, however Congress passed a scaled back version with $16.1 billion in federal Medicaid funding. Given the late passage and phased down funding, many states will need to reexamine their FY 2011 budgets. For example, Virginia was able to reverse a provider rate cut and a benefit cut when ARRA funds were extended; however, other states that may have counted on a larger amount of federal fiscal relief may need to take additional actions to control costs.
As a result of the recession, Medicaid spending and enrollment growth significantly exceeded projections and continued to accelerate in FY 2010; in FY 2011, growth will remain high but is expected to taper somewhat (ES-2). Total Medicaid spending growth averaged 8.8 percent across all states in FY 2010, the highest rate of growth in eight years and well above original projections for FY 2010 of 6.3 percent growth. Medicaid Directors overwhelmingly attributed the growth to higher than expected increases in caseload due to the recession. Enrollment growth averaged 8.5 percent in FY 2010, significantly higher than the 6.6 percent growth projected at the start of FY 2010. States projected that Medicaid enrollment would grow at a still strong but somewhat slower rate for FY 2011 of 6.1 percent. For Medicaid spending in FY 2011, initial legislative appropriations authorized total spending growth that would average 7.4 percent above FY 2010 spending. As occurred in FY 2010, this initial rate of growth may understate actual spending increases for FY 2011, since Medicaid officials in over two-thirds of states believed that initial FY 2011 legislative appropriations could be insufficient. The federal government and states share in the financing of Medicaid.
The ARRA enhanced FMAP reduced the state costs for Medicaid. The ARRA enhanced FMAP reduced the state costs for Medicaid, resulting in an average decline in state general fund spending for Medicaid of 7.1 percent in FY 2010, following a drop of 10.9 percent in FY 2009, offset by larger increases in federal spending for the program. These drops represent the only declines in state spending for Medicaid in the program’s history.
Even with the relief from ARRA, nearly every state implemented at least one new Medicaid policy to control spending in FYs 2010 and 2011 with more states turning to provider cuts (ES-3). In FY 2010, 48 states implemented at least one new policy to control cost and 46 states plan to do so in FY 2011 with some states reporting program reductions in multiple areas. While many states mentioned that ARRA helped to avoid or mitigate provider rate cuts, states still took action in this area. In FY 2010, 39 states implemented a provider rate cut or freeze compared to 33 states in FY 2009. In FY 2011, 37 states have planned provider rate restrictions. More than any other area, provider rates are linked to economic conditions. Under budget pressure, states turn to rate cuts to have an immediate budget impact and when conditions improve states are able to restore or enhance rates. States must balance the need to control costs with ensuring that provider rates are sufficient to maintain participation and access to services for enrollees. ACA funded the Medicaid and CHIP Payment and Access Commission that is
ES-2
Percent Change in Total Medicaid Spending and Enrollment, FY 1998 – FY 2011
NOTE: Enrollment percentage changes from June to June of each year. Spending growth percentages in state fiscal year. SOURCE: Enrollment Data for 1998-2009: Medicaid Enrollment in 50 States, KCMU. Spending Data from KCMU Analysis of CMS Form 64 Data for Historic Medicaid Growth Rates. FY 2010 and FY 2011 data based on KCMU survey of Medicaid officials in 50 states and DC conducted by Health Management Associates, September 2010.
4.7%
6.8%8.7%
10.4%
12.7%
8.5%7.7%
6.4%
1.3%
3.8%
5.8%7.6%
8.8%7.4%
-1.9%
0.4%
3.2%
7.5%9.3%
5.6%4.3%
3.2%
0.2%-0.7%
3.1%
7.5%8.5%
6.1%
1998 1999 2000 2001 2002 2003 2004 2005 2006 2007 2008 2009 2010
Spending Growth Enrollment Growth
2011 Adopted

00 7
charged with preparing reports and recommendations to Congress on ways in which to improve access to care for enrollees.
In FY 2010, 20 states implemented benefit restrictions, the largest number in one year since the surveys began in 2001 and double the number from FY 2009. In addition to this record level of benefit restrictions in FY 2010, 14 states have planned benefit restrictions in FY 2011. These benefit restrictions include the elimination of covered benefits as well as the application of utilization controls or limits for existing benefits. For example, several states eliminated all or some adult dental services including Arizona, California, Hawaii and Massachusetts. A number of states also imposed limits on benefits such as imaging services, medical supplies or durable medical equipment, therapies or personal care services.
ARRA helped to protect Medicaid eligibility and even with tight budgets many states reported some eligibility expansions or enrollment simplifications. To be eligible for the enhanced federal matching funds in ARRA, states could not restrict their Medicaid eligibility standards, methodologies or procedures more than those in place on July 1, 2008. 1 The ACA maintained the ARRA maintenance of eligibility requirements for adults through 2014 and for children through 2019 as part of health reform. Despite severe budget circumstances, 41 states in FY 2010 and 27 states in FY 2011 implemented or have plans to expand or simplify eligibility processes. Many eligibility changes are expected to affect only a small number of beneficiaries, but a few states are implementing broader reforms and eligibility expansions such as Colorado and Wisconsin. Connecticut and the District of Columbia have already taken advantage of a new option in health reform to cover childless adults in advance of this requirement in 2014. Some of the efforts to streamline enrollment could help states qualify for performance bonus payments that were enacted as part of the Children’s Health Insurance Program Reauthorization Act (CHIPRA).
1 In FY 2010 and FY 2011, New Mexico imposed a wait list on its State Coverage Initiative that counted as an eligibility restriction but was allowed under the MOE requirements.
ES-3
State Policy Actions Implemented in FY 2010and Adopted for FY 2011
Adopted FY 2011FY 2010
States with Expansions / Enhancements
36 41
15
323627
16
32
Provider Payments Eligibility Benefits Long Term Care
39 37
1 1
2014 18
10
States with Program RestrictionsNOTE: Past survey results indicate not all adopted actions are implemented. Provider payment restrictions include rate cuts for any provider or freezes for nursing facilities or hospitals.
SOURCE: KCMU survey of Medicaid officials in 50 states and DC conducted by Health Management Associates, September 2010.

008
While the majority of states continue to expand and improve options for community based long-term care, there are fewer states adopting these policies compared to previous years. States are continuing to expand home and community-based long-term care services (HCBS), but at a slightly slower pace than in previous years. Overall, 32 states took actions that expanded long-term care (LTC) services in FY 2010 (primarily expanding HCBS programs), and 32 states planned expansions for FY 2011. However, the number of states adopting new HCBS waivers or expanding existing waivers decreased to 23 in FY 2010 and 22 in FY 2011 compared to 27 in FY 2009 and 38 in FY 2008, suggesting that some states may be postponing additional balancing efforts due to difficult state fiscal conditions. In FY 2010, 18 states implemented utilization controls and other reductions on LTC services to contain costs and 10 states plan to do so in FY 2011. While states can restrict services in HCBS programs or the availability of other long-term care services, the ARRA maintenance of eligibility (MOE) requirements prohibit changes in eligibility. For example, states are prohibited from increasing stringency in institutional level of care determination processes or from reducing waiver capacity as of July 1, 2008. The ACA included a number of new long-term care options designed to increase community based long-term care. A few states are moving forward with new HBCS state plan options, and while there is not guidance from CMS, states seemed interested in the State Balancing Incentive Payment Program and the Community First Choice Option.
States continue to adopt policies to manage and coordinate care, to improve quality and to expand the use of health information technology. Thirteen states in FY 2010 and 20 states in FY 2011 implemented or plan to expand managed care by expanding service areas, adding eligibility groups, requiring enrollment into managed care or implementing managed long-term care initiatives. Sixteen states in FY 2010 and 13 states in FY 2011 are implementing new or expanded disease management programs. States are also moving forward with new medical home models as well as initiatives to care for those dually eligible for Medicare and Medicaid. The ACA includes a number of provisions related to improving care delivery in Medicaid such as a new Health Home option to provide enhanced funding for coordination of care activities for individuals with chronic care needs; the creation of the CMS Innovation Center to test payment and delivery models, the creation of the Federal Coordinated Health Care Office to coordinate policies for dual eligibles and several demonstration and grant programs. States also continue to expand the use of health information technology (HIT) activities to improve efficiency, costs, quality and patient safety. States have a major role in the adoption and meaningful use of electronic health records (EHRs) and health information exchanges (HIEs) aided by new federal funding that was included in ARRA. Nearly all states have received CMS approval for enhanced Medicaid funding (at a 90 percent match) to conduct planning for the EHR Incentive Program.
As states continue to grapple with historically difficult budget conditions, they must also plan for the implementation of the ACA which envisions new roles for Medicaid and for states. Under health reform, Medicaid will be expanded to cover nearly all individuals with incomes below 133 percent of poverty resulting in a large adult expansion in most states, particularly adults without dependent children who had historically been barred from coverage under the program. This expansion provides the foundation for new coverage under health reform. Not surprisingly, Medicaid officials are playing a lead role in preparing for health reform implementation, in many cases alongside insurance commissioners. Some of the key challenges that states will face in implementing reform include implementing the Medicaid expansion, transitioning to a new income eligibility methodology for Medicaid, setting up Health Insurance Exchanges and re-designing eligibility systems to coordinate with the Exchanges. These challenges are magnified by recent administrative cuts and state workforce reductions limiting states’ capacity to focus on new responsibilities. Many states said that they need

00 9
timely regulations and guidance as well as financial support to help them move forward and meet tight implementation timelines.
Looking forward, states are hoping that the economy starts to improve as they plan to implement historic health reform legislation. Despite the tough economy, Medicaid directors reported that they were able to maintain the program’s core mission and objectives and achieve some program improvements. In the near future, even if the economy begins to improve at the national level, the impact of the recession for states will persist for several years. Looking forward to FY 2012, the state share of Medicaid spending will increase dramatically (by as much as 25 percent or more) due to the expiration of the enhanced FMAP on June 30, 2011; while state revenues are almost certain to remain below pre-recession levels. In addition to the effects of the economic downturn, Medicaid directors see preparing for the implementation of health reform as a huge opportunity as well as the next major challenge. Health reform will dramatically reduce the number of uninsured and provide access to new federal funding associated with expanded Medicaid coverage, but it will not be easy to implement. In many states, new leadership and staff will take over the responsibilities of planning for and implementing health reform after the 2010 elections. Even in the face of daunting challenges, Medicaid remains the foundation of coverage for low-income Americans as well as a critical safety net in today’s health care system, and the program is poised to fulfill an even larger role under health reform.

0010
Introduction
At the end of state fiscal year (FY) 2010 and heading into FY 2011, states were still in the midst of the worst economic downturn since the Great Depression. State budgets are expected to continue to see the adverse effects of the recession with severely depressed state revenues and higher demand for human services, including Medicaid. States do not anticipate revenues to return to pre-recession levels for several years; although many states hope 2011 will at least be a turning point and the beginning of stronger state revenue growth. State economies were bolstered by federal fiscal relief through the American Recovery and Reinvestment Act of 2009 (ARRA) which provided a temporary increase in the federal Medicaid matching rate (known as the “Federal Medical Assistance Percentage,” or “FMAP”) from October 2008 through December 2010. Mid-summer, after almost all states had already adopted budgets with uncertainty about an extension of this funding, legislation to extend federal fiscal relief in Medicaid through June 2011 was enacted but with lower levels of funding than many states had anticipated. Even as states continue to grapple with historically difficult budget conditions, they are also planning for the implementation of the Patient Protection and Affordable Care Act (ACA). States are expected to play key roles in implementing both Medicaid and private insurance coverage changes. Medicaid will be the foundation for the ACA coverage expansion, which will achieve major reductions in the number of uninsured.
For the tenth consecutive year, the Kaiser Commission on Medicaid and the Uninsured (KCMU) and Health Management Associates (HMA) conducted a survey of Medicaid officials in all 50 states and the District of Columbia to track trends in Medicaid spending, enrollment and policy initiatives. This report also includes background on the Medicaid program, as well as current issues facing the program including how states are preparing for the implementation of national health reform. Findings are presented for state fiscal years (FYs) 2010 and 2011.
1. Medicaid Today
Medicaid serves multiple roles in the health care system. Medicaid provides health coverage and long-term care services and supports for 60 million low-income Americans including nearly 30 million low-income children, 15 million adults and 14 million elderly and people with disabilities. The program also provides assistance to 8.8 million low-income Medicare beneficiaries (dual eligibles) who rely on Medicaid to pay Medicare premiums and cost-sharing and to cover critical benefits Medicare does not cover, such as long-term care. Medicaid plays a major role in our country’s health care delivery system, accounting for about one-sixth of all health care spending in the U.S., nearly half of all nursing home care, and critical funding for a range of safety-net
Figure 1
Medicaid Today
Health Insurance Coverage
29.5 million children & 15 million adults in low-income
families; 14 million elderly and persons with disabilities
State Capacity for Health Coverage
Federal share ranges 50% to 76%; ARRA FMAP ranges 62% to 85%
MEDICAID
Support for Health Care System and Safety-net
16% of national health spending; 40% of long-term care services
Assistance to Medicare Beneficiaries
8.8 million aged and disabled — 19% of Medicare
beneficiaries
Long-Term Care Assistance
1 million nursing home residents; 2.8 million
community-based residents

00 11
providers. Finally, Medicaid represents the largest source of federal revenue to states, which supports state capacity to finance health coverage (Figure 1).
Medicaid is financed by states and the federal government. The Medicaid program is jointly funded by states and the federal government. In 2008, total Medicaid expenditures climbed to nearly $339 billion.2 The federal government guarantees matching funds to states for qualifying Medicaid expenditures, which includes payments states make for covered Medicaid services provided by qualified providers to eligible Medicaid enrollees. The FMAP is calculated annually using a formula set forth in the Social Security Act. The FMAP is inversely proportional to a state’s average personal income, relative to the national average. States with lower average personal incomes have higher FMAPs. Personal income data is lagged, so data used for FY 2010 is from the three years of 2006 to 2008. According to the statutory formula, for 2011, the FMAP varies across states from a floor of 50 percent to a high of 74.73 percent (Figure 2)3; however, states are receiving an enhanced FMAP as a result of the American Recovery and Reinvestment Act (ARRA), which increased the range of FMAPs from 61.59 percent to 84.86 percent (this is discussed later in the report).4 Each state receives federal matching funds after a state pays qualified providers for services and then submits a claim to the federal government for the funds.
Medicaid represents the largest share of federal revenues to states. Medicaid provides financing for a range of health care providers within communities across the country, supporting jobs, income and economic activity. The economic impact of Medicaid is magnified by the matching formula. At a minimum, states draw down $1 of federal money for every dollar of state funds spent on Medicaid; while on the flip side, states must cut at least $2 in program spending to save $1 in state funds. Federal Medicaid dollars represent the single largest source of federal grant support to states, accounting for an estimated 44 percent of all federal grants to
2Medicaid Primer. Kaiser Commission on Medicaid and the Uninsured. June 2010. http://www.kff.org/medicaid/upload/7334-04.pdf. 3 In FY 2011, 13 states had an FMAP at the statutory minimum of 50.0 percent: AK, CA, CO, CT, MD, MA, MN, NH, NJ, NY, VA, WA, and WY. The FMAP for IL is 50.2 percent. In addition, the FMAP is set in statute for the territories at 50 percent, with a cap on federal matching funds. 4 Federal Register, August 26, 2010 (Vol. 75, No. 165), pp 52530- 52532, at http://frwebgate.access.gpo.gov/cgi-bin/getdoc.cgi?dbname=2010_register&docid=fr26au10-58.pdf.
Figure 3
20.7% 16.3%
43.6%21.6% 34.5%
11.5%
57.7% 49.2% 44.9%
Total Spending General Fund Federal Funds
Distribution of Spending In the States, FY 2008
SOURCE: National Association of State Budget Officers, 2008 State Expenditure Report, Dec. 2009
Elementary & Secondary EducationMedicaid All Other
$1,502 Billion $687 Billion $394 Billion
Figure 2
WY
WI
WV
WA
VA
VT
UT
TX
TN
SD
SC
RIPA
OR
OK
OH
ND
NC
NY
NM
NJ
NH
NVNE
MT
MO
MS
MN
MI
MA
MD
ME
LA
KYKS
IA
INIL
ID
HI
GA
FL
DC
DE
CT
COCA
ARAZ
AK
AL
NOTE: Does not reflect the enhanced FMAPs granted to states under ARRA.SOURCE: http://aspe.hhs.gov/health/fmap11.htm
68 – 75 percent (10 states including DC)60 – 67 percent (18 states)51 – 59 percent (9 states)50 percent (14 states)
Statutory Federal Medical Assistance Percentages (FMAP), FY 2011

0012
states in FY 2008. On average, states spend about 16 percent of their own funds on Medicaid, making it the second largest program in most states’ general fund budgets following spending for elementary and secondary education, which represented 35 percent of state spending in FY 2008 (Figure 3). Half of Medicaid enrollees are children, but most Medicaid spending is for the elderly and people with disabilities. About three-quarters of the beneficiaries served by the program are children and non-disabled adults, mostly parents. The elderly and people with disabilities represent just one-quarter of the share of program enrollees, but account for nearly 70 percent of program spending because these groups tend to have higher utilization of acute and long-term care services (Figure 4). In fact, Medicaid data show that just 5 percent of Medicaid enrollees account for more than half (57%) of program spending.5 Dual eligibles represent a small portion of Medicaid enrollees, but a high percentage of costs. Nearly 9 million elderly and persons with disabilities rely on both the Medicare and Medicaid programs to obtain needed health and long-term services. These “dual eligibles” accounted for only 15 percent of Medicaid enrollment, but 39 percent of Medicaid expenditures in federal fiscal year 2007 (Figure 5). These same individuals accounted for 21 percent of Medicare enrollment and over 36 percent of Medicare spending in federal fiscal year 2006.6 These dual eligibles rely on Medicaid to pay Medicare premiums, cost sharing, and to cover critical benefits not covered by Medicare, such as long-term care. Prescription drug coverage for the duals was transitioned from Medicaid to the Medicare Part D program on January 1, 2006, but states are required to finance a portion of this coverage through a payment to the federal government, often referred to as the “Clawback.” Continued efforts to improve coordination between Medicare and Medicaid and across acute and long-term care services are necessary to achieve savings and better quality of care for beneficiaries.
5 Medicaid Primer. Kaiser Commission on Medicaid and the Uninsured. June 2010. http://www.kff.org/medicaid/upload/7334-04.pdf. 6 Kaiser Family Foundation analysis of the CMS Medicare Current Beneficiary Survey Cost and Use file, 2006.
Figure 4
Enrollees Expenditures on benefits
Medicaid Enrollees and Expendituresby Enrollment Group, FFY 2007
Children 20%
Elderly 25%
Disabled 42%
Adults 12%Children49%
Elderly 10%Disabled 15%
Adults25%
Total = 58 million Total = $300 billion
SOURCE: Kaiser Commission on Medicaid and the Uninsured and Urban Institute estimates based on 2007 MSIS and CMS64 data.
Figure 5
Dual Eligibles’ Share of Medicaid Enrollment and Spending, FFY 2007
15%39%
Enrollment Spending
Non-Dual
Dual
58 million $300.0 billion
Source: Urban Institute estimates based on data from MSIS and CMS Form 64, prepared for the Kaiser Commission on Medicaid and the Uninsured, 2010.

00 13
States administer Medicaid within broad federal guidelines. Within the federal guidelines, each state decides who qualifies for coverage, what medical benefits to cover, how much to pay medical providers who serve enrolled individuals, whether to use managed care or another delivery system, how the program is organized and administered, and how to use Medicaid to address state policy priorities such as covering uninsured children and adults. Eligibility levels vary significantly across states. To be eligible for Medicaid today, individuals must meet income and resource requirements and also fall into one of the categories of eligible populations. The federal government sets minimum eligibility levels for coverage, and then states have the option to expand eligibility to higher incomes. In December 2009, 46 states and the District of Columbia have set the Medicaid/CHIP income eligibility level for children at or above 200 percent of the federal poverty level (FPL), but Medicaid coverage for parents is more limited with only 16 states and the District of Columbia at or above 100 percent of the FPL and 34 states setting levels below 100 percent of the FPL (Figures 6 and 7). Median coverage for the elderly and people with disabilities is about 75 percent of poverty (tied to the levels for Supplemental Security Income or SSI). Prior to the passage of health reform in March 2010, states could not cover adults without dependent children under Medicaid without a federal waiver. Low-income and high-need individuals covered by Medicaid generally do not have access to employer-based or other private coverage.
Medicaid provides affordable and comprehensive benefits reflecting the health and long-term care needs of the population it serves. Medicaid provides a comprehensive benefits package of acute and long-term care services that has been designed to meet the needs of the low-income and high-need populations served by the program. For example, Medicaid covers an array of supportive and enabling services for high-need populations such as transportation, durable medical equipment, case management, and habilitation services, that are often not covered by private insurance plans. Medicaid also provides protections against high out-of-pocket expenses by prohibiting or limiting premiums and cost-sharing requirements.
Figure 6
Children’s Eligibility for Medicaid/CHIP by Income, December 2009
AZ AR
MS
LA
WA
MNND
WY
ID
UTCO
OR
NV
CA
MT
IA
WI MI
NE
SD
ME
MOKS
OHIN
NY
IL
KY
TNNC
NH
MA
VT
PA
VAWV
CTNJ
DE
MD
RI
HI
DC
AK
SCNM
OK
GA
TX
IL
FL
AL
< 200% FPL (4 states)
250% or higher FPL (24 states, including DC)200-249% FPL (23 states)
*The federal poverty line (FPL) for a family of three in 2009 is $18,310 per year.**IL uses state funds to cover children above 200% FPL. MA uses state funds to 400% FPL. SOURCE: Based on a national survey conducted by KCMU with the Center on Budget and Policy Priorities, 2009.
Figure 7
Medicaid Eligibility for Working Parents by Income, December 2009
AZ AR
MS
LA
WA
MNND
WY
ID
UTCO
OR
NV
CA
MT
IA
WI MI
NE
SD
ME
MOKS
OHIN
NY
IL
KY
TNNC
NH
MA
VT
PA
VAWV
CTNJ
DE
MD
RI
HI
DC
AK
SCNM
OK
GA
TX
IL
FL
AL
50% - 99% FPL (17 states)< 50% FPL (17 states)
100% FPL or Greater (17 states, including DC)
Note: The federal poverty line (FPL) for a family of three in 2009 was $18,310 per year.SOURCE: Based on a national survey conducted by Kaiser Commission on Medicaid and the Uninsured with the Center on Budget and Policy Priorities, 2009.

0014
Most Medicaid enrollees receive care through private managed care plans. The majority of low-income families on Medicaid receive their health coverage through private managed care organizations under contract with the state to provide comprehensive services and a provider network for beneficiaries (Figure 8). Through managed care arrangements and primary care case management, states have moved to both secure better access to primary care services and restrain costs. Many states have used managed care and pay-for-performance programs as a vehicle to improve the quality of services provided to Medicaid beneficiaries. Medicaid enrollees fare as well as the privately insured populations on important measures of access to primary care, even though they are sicker and more disabled (Figure 9). Accounting for the health needs of its beneficiaries, Medicaid is a low-cost program with lower per capita spending than private insurance.
Medicaid is the dominant source of coverage and financing for long-term care services and supports. Medicaid plays a critical role for low-income people of all ages with long-term care needs. Persons 65 and older constitute over half (55%) of those who use Medicaid long-term care services, but roughly one-third (34%) are individuals under age 65 with a disability and another 11 percent are adults and children with long-term care needs.7 Unlike Medicare, which primarily covers physician and hospital-based acute care services, Medicaid covers long-term care services needed by people to live independently in the community such as home health care and personal care, as well as services provided in institutions such as nursing homes. Spending on long-term care services represents over a third of total Medicaid spending. Medicaid has evolved to become the primary payer for long-term care
7 Long-Term Services and Supports: The Future Role and Challenges for Medicaid. Kaiser Commission on Medicaid and the Uninsured. September 2007.
Figure 9
Access to Care: Medicaid Comparable to Private Insurance
10%4%
11%
2%
10%
3% 4%1%
52%
30%24%
14%
Medicaid Private UninsuredPercent Reporting:
Adults Adults Children
No Usual Source of Care
Needed Care but Did Not Get It Due
to Cost ** In the past 12 monthsNOTE: Respondents who said usual source of care was the emergency room were included among those not having a usual source of careSOURCE: KCMU analysis of 2008 NHIS data
Children
Figure 10
1990 1995 2000 2002 2004 2006 2008
Home and Community-BasedInstitutional Care
Growth in Medicaid Long-Term Care Expenditures, FY 1990 – FY 2008
In Billions:
$32
$54
$75
87%
80%70%
13%
20%
30%
32%
68%
$92$100
63%
37%
$109
41%
59%
Note: Home and community-based care includes home health, personal care services and home and community-based service waivers.SOURCE: Kaiser Commission on Medicaid and the Uninsured and Urban Institute analysis of HCFA/CMS-64 data.
58%
42%
$115
Figure 8
Medicaid Managed Care Penetration Rates by State, June 2009
AZ AR
MS
LA
WA
MNND
WY
ID
UTCO
OR
NV
CA
MT
IA
WI MI
NE
SD
ME
MOKS
OHIN
NY
IL
KY
TNNC
NH
MA
VT
PA
VAWV
CTNJ
DE
MD
RI
HI
DC
AK
SCNM
OK
GA
TX
IL
FL
AL
Note: Unduplicated count. Includes managed care enrollees receiving comprehensive and limited benefits.SOURCE: Medicaid Managed Care Enrollment as of June 30, 2009. Centers for Medicare and Medicaid Services, special data request, July 2010.
81 – 100 percent (21 states including DC)71 – 80 percent (10 states)51 – 70 percent (17 states)0 - 50 percent (3 states)
U.S. Average = 71.7%

00 15
services and supports to low-income individuals. Over the past two decades, spending on Medicaid home and community-based services has been growing as more states attempt to reorient their long-term care programs by increasing access to home and community-based service options. In 2008, spending on home and community-based services accounted for 42 percent of total Medicaid long-term care spending, up from 13 percent in 1990 (Figure 10).
2. Medicaid and the Economy
Headed into state fiscal year 2011, the national unemployment rate remained persistently high. State revenues were plummeting and states are facing budget shortfalls of at least $260 billion for FY 2011 through 2012.8 During an economic downturn, unemployment rises and puts upward pressure on Medicaid. As individuals lose employer-sponsored insurance and incomes decline, Medicaid enrollment, and therefore spending, increase. At the same time, increases in unemployment have a negative impact on revenues, making it even more difficult for states to pay their share of Medicaid spending increases. Specifically, a 1 percentage point increase in unemployment is expected to result in 1 million more Medicaid and CHIP enrollees and an additional 1.1 million uninsured, while state revenues are projected to fall by 3 to 4 percent (Figure 11). Recent census data show that the number of Americans without health insurance increased by 4.4 million or 16.7 percent in 2009 to hit 50.7 million.9 The data also show an increase in Medicaid coverage of 5.1 million resulting in a record high percentage and number of people covered by Medicaid.
8 Johnson, Nicholas, Phil Oliff and Erica Williams. An Update on State Budget Cuts: At Least 46 States Have Imposed Cuts that Hurt Vulnerable Residents and the Economy. Center on Budget and Policy Priorities. August 4, 2010. http://www.cbpp.org/cms/index.cfm?fa=view&id=1214 9 Income, Poverty, and Health Insurance Coverage in the United States: 2009. United States Census Bureau. September 2010.
Figure 11
SOURCE: Medicaid, SCHIP and Economic Downturn: Policy Challenges and Policy Responses, Kaiser Commission on Medicaid and the Uninsured, April 2008
1%
Increase in National Unemployment Rate
=1.0 1.1
Increase in Medicaid and
CHIP Enrollment
(million)
Increase in Uninsured(million)
&
Effect of a 1% Point Increase in Unemployment
3 - 4%
Decrease in State Revenues

0016
3. Recent Legislative Action
Children’s Health Insurance Program Reauthorization Act of 2009 (CHIPRA). CHIPRA was one of the first pieces of legislation passed by the 111th Congress and signed by President Obama on February 4, 2009. Many of the provisions in CHIPRA have direct implications for state Medicaid programs. The Act extends and expands the State Children’s Health Insurance Program (now referred to as CHIP, not SCHIP) which was enacted as part of the Balanced Budget Act of 1997 (BBA). CHIPRA added $33 billion in federal funds for children’s coverage in Medicaid and CHIP through 2013 and was expected to provide coverage to 4.1 million children who otherwise would have been uninsured by 2013.10 CHIPRA provided fiscal incentives, new tools, and outreach funding for states to enroll children who are eligible but not enrolled in Medicaid and CHIP programs. The legislation included some new coverage options for states including allowing the use of Medicaid and CHIP to cover legal immigrant children and pregnant women during their first five years of residency, reversing a 5 year ban originally imposed in 1996 as part of welfare reform. CHIPRA phased out coverage for some adults that had been covered by CHIP through a waiver, giving states the option to transition these adults to Medicaid. Additionally, CHIPRA focused on access and quality by establishing MACPAC, a new Commission to focus on access and payment policies in Medicaid and CHIP and by funding initiatives related to quality measures and electronic health records.
American Recovery and Reinvestment Act (ARRA). In an effort to boost an ailing economy, Congress enacted and President Obama signed the ARRA on February 17, 2009. The overall package, expected to cost $787 billion, included significant funding for health care and state fiscal relief. Specifically, the Act included an estimated $87 billion for a temporary increase in the federal share of Medicaid costs from October 2008 through December 2010. This was the single most significant source of fiscal relief to states in the ARRA. Similar to relief provided in 2003 during the last economic downturn, these funds were designed to help support state Medicaid programs during a time of increased demand and when states are least able to afford their share of the program. The FMAP increase included a “hold-harmless” clause, a base FMAP rate increase, and then additional funding for states with significant increases in unemployment. After several failed attempts, in August 2010, Congress passed a scaled down extension (through June 2011) of the enhanced Medicaid funds that stepped down the ARRA enhanced FMAP and reduced the cost of the extension from $24 billion to $16.1 billion.
10 State Children’s Health Insurance Program (CHIP): Reauthorization History. Kaiser Commission on Medicaid and the Uninsured. February 2009. http://www.kff.org/medicaid/upload/7743-02.pdf.

00 17
4. National Health Reform and Medicaid
On March 23, 2010, President Obama signed comprehensive health reform, the Patient Protection and Affordable Care Act (ACA; Public Law 111-148), into law. The law will significantly expand options for affordable coverage through a Medicaid expansion and through subsidies for low to moderate income individuals to purchase coverage through newly established Health Insurance Exchanges. Under the new law, employer sponsored coverage will remain the dominant source of coverage for most Americans. ACA bolsters health coverage options by requiring individuals to have health insurance and by making changes to the health insurance markets. In terms of Medicaid, health reform builds on many of Medicaid’s current roles by expanding coverage with additional federal financing for that new coverage and by adding additional options for providing long-term care supports and for coordinating care for dual eligibles (Figures 12 and 13).11
Coverage. More specifically, by January 1, 2014, Medicaid will be expanded to provide eligibility to nearly all low-income people under age 65 with incomes below 133 percent of the federal poverty level ($14,404 for an individual or about $29,326 for a family of four in 2009).12 For most Medicaid enrollees, income will be based on modified adjusted gross income without an assets test or resource test.13 As a result, millions of low-income adults without children who currently cannot qualify for coverage (except in a handful of states with waivers), as well as many low-income parents and, in some instances, children now covered through the Children’s Health Insurance Program (CHIP), will be made eligible for Medicaid (Figure 14). In addition, the health reform law is expected to result in more people who already are eligible for Medicaid under current rules learning about and signing up for coverage. In total, Medicaid, along with CHIP, is expected to cover an additional 16 million people by 2019.14
11 Medicaid and the Children’s Health Insurance Program Provisions in the New Health Reform Law. Kaiser Family Foundation, April 2010. 12 As under prior law, undocumented immigrants will remain ineligible for Medicaid and CHIP, and only certain legal immigrants can secure coverage. 13 There is a special deduction to income equal to five percentage points of the poverty level raising the effective eligibility level to 138% of poverty. The legislation maintains existing income counting rules for the elderly and groups eligible through another program like foster care, low-income Medicare beneficiaries and Supplemental Security Income (SSI). 14 Congressional Budget Office, “H.R. 4872, Reconciliation Act of 2010 (Final Health Care Legislation)” (March 20, 2010).
Figure 12
Promoting Health Coverage
Medicaid Coverage(up to 133% FPL)
Employer-Sponsored Coverage
Exchanges(subsidies 133-400%
FPL)IndividualMandate
Health Insurance Market Reforms
Universal Coverage
Figure 13
Medicaid Today and Tomorrow
Health Insurance Coverage for Certain Categories
Minimum floor forHealth Insurance Coverage
to 133% FPL
Assistance forDuals / Long-Term Care
Support forHealth Care System
AdditionalFederal Financing
for Coverage
Additional Options Long-Term Care /
Coordination for Duals
Shared FinancingStates and Federal Govt.
MEDICAID

0018
Financing. The new law provides full federal financing (100 percent federal) for those newly eligible for Medicaid from 2014 to 2016 and then phases down the federal contribution to 90 percent by 2020. States will receive their current match rates for individuals currently eligible for Medicaid. An expansion or transition matching rate is designed to provide some additional federal help to expansion states (those that had expanded coverage for adults to at least 100 percent of poverty prior to the enactment of health reform). These states will receive a phased-in increase in their federal match rate for childless adults so that by 2019 it will equal the enhanced matching rate available for newly-eligible adults. 15 The Congressional Budget Office (CBO) estimates that the federal Medicaid/CHIP costs due to coverage related changes under health reform will be $434 billion from 2010 to 2019. The federal government is expected to finance about 95 percent of the costs of new coverage with the states paying the remaining 5 percent over the 2014 to 2019 period.16 Benefits and Access. The new law provides all newly-eligible adults with a benchmark benefit package or benchmark-equivalent package that meets the minimum essential health benefits available in the Health Insurance Exchange.17 ACA makes some other important changes to Medicaid benefits and access such as: increasing Medicaid payments for primary care to 100 percent of the Medicare payment rates for 2013 and 2014 with 100 percent federal financing for the increased payment rates; funding and broadening the scope of the Medicaid and CHIP Payment and Access Commission (MACPAC) to include all eligible individuals (not just children); establishing the Center for Medicare and Medicaid Innovation to test payment and service delivery models to improve quality and efficiency, and funding pilot programs for medical homes and accountable care organizations.
15 It appears that AZ, DE, HI, ME, MA, NY and VT are eligible for this transition match rate for current coverage of childless adults below any enrollment caps that may be in place. 16 Holahan, John and Irene Headen. Medicaid Coverage and Spending in Health Reform: National and State-by-State Results for Adults at or Below 133% FPL. Kaiser Commission on Medicaid and the Uninsured. May 2010. 17 Explaining Health Reform: Benefits and Cost-Sharing for Adult Medicaid Beneficiaries. Kaiser Family Foundation, August 2010.
Figure 14
235%
185%
64%38%
0%
75%
Children Pregnant Women
Working Parents
Jobless Parents
Childless Adults
Elderly and Individuals
with Disabilities
Note: Medicaid income eligibility for most elderly and individuals with disabilities is based on the income threshold of Supplemental Security Income (SSI).SOURCE: Based on a national survey conducted by the Center on Budget and Policy Priorities for Kaiser Commission on Medicaid and the Uninsured, 2009.
Median Medicaid/CHIP Income Eligibility Thresholds, 2009
Minimum Medicaid Eligibility under Health Reform = 133%FPL

00 19
Long-Term Care. ACA also includes new options to provide long-term care services including the Community First Choice Option in Medicaid to allow states to provide community-based attendant supports and services to individuals with incomes up to 150% of poverty who require an institutional level of care through a state plan amendment (SPA) and provides states with an enhanced federal matching rate of an additional six percentage points for reimbursable expenses in the program. ACA extends funding for Medicaid Money Follows the Person Rebalancing Demonstration Programs through 2016. The law requires the Secretary to improve coordination of care for dual eligibles through a new office within the Centers for Medicare and Medicaid Services.18 Key State Responsibilities. Many of the provisions in ACA will be implemented by the states and these responsibilities include Medicaid and private insurance. Some key state responsibilities will be to expand Medicaid, transition to a new definition of income for Medicaid, develop adequate provider networks to serve Medicaid, set up Health Insurance Exchanges (new market places for coverage), provide for coordination in enrollment across Medicaid, CHIP and Exchange coverage, develop eligibility and enrollment systems that are consumer-friendly and technology enabled and enforce new insurance market regulations.
18 Medicaid Long-Term Services and Supports: Key Changes in the Health Reform Law. Kaiser Family Foundation, June 2010.

0020
Methodology
The Kaiser Commission on Medicaid and the Uninsured (KCMU) commissioned Health Management Associates (HMA) to prepare this report based on a survey of Medicaid directors in all 50 states and the District of Columbia to track trends in Medicaid spending, enrollment and policy making. This report is based on the 2010 survey and discussions with Medicaid directors and staff based on each state’s response to the survey.
This is the fifteenth KCMU/HMA survey of Medicaid officials to address these issues. Including this survey, ten surveys have been conducted at the beginning of state fiscal years 2002 through 2010, and five mid-year surveys have been conducted during times of economic downturn in fiscal years (FYs) 2002, 2003, 2004, 2009 and 2010, when many states made mid-year Medicaid policy changes due to shortfalls in state revenues.19
The KCMU/HMA Medicaid survey on which this report is based was conducted in July and August 2010. The survey was designed to document the policy actions states had taken in the previous year, state FY 2010, and new policy initiatives that they had implemented or expected to implement in state FY 2011, which had begun for most states on July 1, 2010.20 At the time each state survey was finalized, the FY 2010 Medicaid budget had been adopted by the Legislature in all states except California and Michigan. For these two states, the survey responses reflected the revised proposed Executive budget. Responses to the survey for these states were re-confirmed in mid-September 2010, but remained subject to change depending on the outcome of state budget decisions.
The 2010 survey instrument was designed to provide information that was consistent with previous surveys.21 As with previous surveys, specific questions were added to reflect current issues. For this survey, new questions related to the impact of cuts to Medicaid administrative budgets and state plans for implementing federal health reform were added.
Medicaid directors and other Medicaid staff provided data for this report in response to a written survey and telephone interview. The survey was sent to each Medicaid director in June 2010. The surveys were completed and telephone interviews occurred in July and August 2010. The telephone discussions provided an opportunity to review the written responses or to conduct the survey itself, if the survey had not been completed in advance. These interviews are an integral part of the survey and have proven to be invaluable to clarify and ensure complete responses and to record the nuances of state actions. For most states, the interview included the Medicaid director along with Medicaid policy or budget staff. In a limited number of cases, the interview was delegated to a Medicaid policy or budget
19 The mid-fiscal year 2010 report issued February 2010 is at: http://www.kff.org/medicaid/8049.cfm. The previous annual budget survey report issued September 2009 is at: http://www.kff.org/medicaid/7985.cfm. For previous survey results, see the following links: http://www.kff.org/medicaid/7815.cfm; http://www.kff.org/medicaid/7699.cfm; http://www.kff.org/medicaid/7569.cfm; http://www.kff.org/medicaid/7392.cfm; http://www.kff.org/medicaid/7001.cfm; http://www.kff.org/medicaid/kcmu4137.cfm; http://www.kff.org/medicaid/4082-index.cfm. 20 Fiscal years begin on July 1 for all states except for: New York on April 1; Texas on September 1; Alabama, Michigan and the District of Columbia on October 1. 21 The survey instrument is in Appendix C to this report.

00 21
official. Survey responses were received from all 50 states and the District of Columbia. In one state, responses were provided for most but not all questions.
Each annual survey focuses on policy directions, policy changes and new initiatives. The survey does not attempt to catalog all current policies. This survey asked state officials to describe policy changes that occurred in FY 2010, the previous fiscal year, and new policy changes that were implemented or would be implemented in FY 2011. The survey asks only for policy changes already implemented in FY 2010 or FY 2011, or for which there was a definite decision to implement in FY 2011. Policy changes under consideration but for which a definite decision has not yet occurred are not included, even though they may be implemented during FY 2011. Previous surveys have documented that some actions listed at the time of the survey as definitely planned for implementation might not be implemented in the upcoming year. Medicaid policy initiatives often involve complex administrative changes, computer system updates, specific advance notice requirements and various political, legal and fiscal considerations. As a result, planned policy changes that are adopted and scheduled for implementation sometimes are delayed or reconsidered.
This report also includes case studies of three states (Alabama, Colorado and Maryland.) These state profiles provide specific examples of policy changes states are making, including program expansions and improvements as well as cutbacks, as they deal with the fiscal challenges common across states in FY 2010 and FY 2011. The state case studies are included in Appendix B of the report.
Where possible, the results from previous surveys are referenced to provide context and perspective for the results of this survey and to illustrate trends. For example, Medicaid cost containment actions identified in this survey are compared to information from previous surveys to show the number of states adopting specific cost containment actions over the period from FY 2008 to FY 2011.
Annual rates of growth for Medicaid spending and enrollment are calculated as weighted averages across all states. For FY 2010 and FY 2011, average annual Medicaid spending growth was calculated using weights based on the most recent available state Medicaid expenditure data, as reported by the National Association of State Budget Officers (NASBO) State Expenditure Report, December 2009. Average annual Medicaid enrollment growth is calculated using weights based on state enrollment data reported by state officials to HMA for the Kaiser Commission on Medicaid and the Uninsured for the month of June 2009. For years prior to the periods covered by the KCMU/HMA surveys, Medicaid spending and enrollment data are based on estimates prepared for KCMU by the Urban Institute using data from Medicaid financial management reports (CMS Form 64), adjusted for state fiscal years.

0022
Survey Results for Fiscal Years 2010 and 2011
1. State Fiscal Conditions and Overall Impact of ARRA
Key Section Findings: States experienced the deepest economic downturn since the Great Depression throughout FY 2009 and
FY 2010 and heading into FY 2011 with high unemployment persisting, depressed revenues and high demand for public programs including Medicaid.
All states used ARRA funds to address Medicaid and state budget funding shortfalls, to support Medicaid enrollment growth and to help avoid or mitigate program restrictions with many states reporting multiple uses of ARRA funds in 2010.
States adopted their FY 2011 budgets amid uncertainty about whether Congress would extend ARRA beyond December 2010. By the time Congress acted to pass a scaled back ARRA extension through June 2011, most states had already adopted their FY 2011 budgets with over half assuming a full extension of ARRA funds. This means many states will need to make adjustments to their budgets in the middle of the fiscal year.
A. State Fiscal Conditions
States experienced the deepest economic downturn since the Great Depression throughout FY 2009 and FY 2010. As states adopted their budgets for fiscal year 2011, the continued effects of the economic recession, including rising unemployment, depressed revenues and higher demands for public programs, including Medicaid, left them facing severe budget shortfalls. The national unemployment rate remained high at 9.6 percent in August after reaching 9.9 percent in April of this year, up from 4.9 percent since the start of the recession in December 2007. In August 2010, thirteen states had unemployment rates above 10 percent (Figure 15). Since the start of the recession, 7.6 million individuals have lost their jobs and there are an estimated 14.9 million unemployed. The number of long-term unemployed (those jobless for 27 weeks and over) has reached 6.2 million. Among those working, 8.9 million want to work full-time but have had to settle for part-time employment.22 Nearly all states faced budget gaps in FY 2009, FY 2010 and heading into FY 2011. At least 46 states faced a budget shortfall at the start of fiscal year 2011, collectively totaling $121 billion. Looking forward to 2012, 23 states already estimate budget gaps of 10 percent or more. While tax revenue is starting to increase again for states, it is still far below pre-recession levels. Data for the first quarter of
22 The Employment Situation – August 2010. Bureau of Labor Statistics, September 3, 2010.
Figure 15
States with Unemployment Rates at Various Levels, August 2010
SOURCE: State and territory figures from the Table 3, Regional and State Employment and Unemployment: August 2010, Bureau of Labor Statistics. (Figures are preliminary.)
RI
DC
CA
GA
SC
MI
AL
FL
IL
OR
NV
TN
KY
NC
OH
ND
SD
NE
UTVA
MT
WY
IA
OK
VT
NH
AR
KS
HI
MDCO
NM
LA
MN
TX
CT
DE
AK
ME
PA
WIID NY
WV
AZ
MA
WA
MO
MS
NJIN
3.5% - 7.4% (14 states)7.5% - 9.9% (24 states including DC)10% - 16% (13 states)
US Average: 9.6% in August 2010

00 23
2010 (January through March), show state tax revenue up by 2.5% from the same period in 2009, the first positive growth in such figures since second quarter of 2008 (Figure 16). Unlike the federal government, states are legally required to balance their budgets. States can use reserves or rainy day funds, increase taxes or cut spending to achieve a balanced budget during periods of economic stress. Nearly all states have reduced program spending to balance their budgets and in the large majority of states, some actions are expected to impact vulnerable residents. A recent report shows that 46 states and the District of Columbia are enacting cuts in all major program areas including health care, K-12 education, higher education, and services for the elderly and disabled.23 At least 43 states and DC have made cuts to state employees by reducing wages and implementing layoffs, furlough days, and hiring freezes.24 These cuts to the state work force affect Medicaid programs, making it more challenging to administer the program and process applications. These cuts to programs and workforce would have undoubtedly been much more severe without the federal relief provided through American Recovery and Reinvestment Act of 2009 (ARRA) in the form of an enhanced Medicaid match rate. In assessing the economic situation in their states, Medicaid directors in this survey noted the effects of the economic downturn on Medicaid and state revenues. Representative of all but a few states was one director’s observation that “the state economy, like many others, is struggling to overcome recession impacts; budget shortfalls are significant and will continue for the foreseeable future.” In only one state, North Dakota, was the economy regarded as strong at the beginning of FY 2011.
23 Nicholas Johnson, Phil Oliff and Erica Williams, “An Update on State Budget Cuts,” CBPP. August 4, 2010. 24 Ibid
Figure 16
State Tax Revenue, 1999 – 2010
-20%
-15%
-10%
-5%
0%
5%
10%
15%
1989 1990 1991 1992 1993 1994 1995 1996 1997 1998 1999 2000 2001 2002 2003 2004 2005 2006 2007 2008 2009 2010
SOURCE: Percent change in quarterly state tax revenue, US Census Bureau
-9.4%
15.9%
-11.5%
-16.5%
2.5%
-11.4%

0024
B. Impact of ARRA
Recognizing that states were facing a fiscal emergency that would make it difficult to maintain essential services, including Medicaid, Congress enacted the American Recovery and Reinvestment Act of 2009 (ARRA), which the President signed into law on February 17, 2009. The largest component of state fiscal relief was provided through a temporary increase in the FMAP for states. Under ARRA, there were three factors included in the legislation that are used to calculate a state’s FMAP increase: First, the legislation provides a “hold-harmless” clause to prevent states from receiving a formula-driven reduction in their FMAP. Second, all states received a 6.2 percent base increase in their FMAP. Third, states with significant increases in unemployment over a base rate received a 5.5 percent, 8.5 percent or 11.5 percent reduction in their state share of Medicaid costs. The base rate is the lowest three month average of the state’s unemployment rate since January 2006. With ARRA, over half of all states had FMAPs at 70 percent or greater (Figure 17).
The ARRA provided immediate fiscal relief to states through Medicaid. Once the funds were earned through payments for qualified Medicaid expenditures to medical providers, the federal matching funds were available to use as determined by the state. To receive the enhanced federal financing, states had to comply with provider prompt payment requirements and could not restrict eligibility standards, methods or procedures beyond those in effect on July 1, 2008. The ARRA enhanced FMAP did not apply to payments for eligibility expansions implemented on or after July 1, 2008.
This survey addressed the question of how states used the ARRA funds that flowed through Medicaid. Based on responses to this survey, all states reported that they used the ARRA enhanced Medicaid funding as it was intended, both to address Medicaid funding shortfalls and to address budget shortfalls across state programs (Figure 18). The ARRA funds clearly assisted state Medicaid programs and helped them avoid or mitigate program restrictions that would have occurred otherwise. In FY 2010, states were more likely than in FY 2009 to indicate they were using ARRA funds to help pay for increases in Medicaid enrollment or to address a Medicaid budget shortfall, as opposed to an overall state general fund shortfall. Well over half of states indicated that the ARRA funds were used in five or more of the six listed options, meaning that in these states, a wide range of budget-driven restrictions likely would have occurred without
Figure 18
How States Used ARRA Enhanced Medicaid Funding in FY 2009 and FY 2010
28
35
37
38
41
43
29
38
36
44
33
36
Avoided or Restored Eligibility Cuts
Avoided or Reduced Provider Rate Cuts
Avoided Benefit Cuts
Closed or Reduced State General Fund Shortfall
Helped Pay for Increases in Medicaid Enrollment
Closed or Reduced Medicaid Budget Shortfall
FY 2009 FY 2010
SOURCE: KCMU survey of Medicaid officials in 50 states and DC conducted by Health Management Associates, 2009 and 2010.
Figure 17
WY
WI
WV
WA
VA
VT
UT
TX
TN
SD
SC
RIPA
OR
OK
OH
ND
NC
NY
NM
NJ
NH
NVNE
MT
MO
MS
MN
MI
MA
MD
ME
LA
KYKS
IA
INIL
ID
HI
GA
FL
DC
DE
CT
COCA
ARAZ
AK
AL
NOTE: Reflects the enhanced FMAPs granted to states under ARRA.SOURCE: Federal Register, August 26, 2010 (Vol. 75, No. 165), pp 52530- 52532, at http://frwebgate.access.gpo.gov/cgi-bin/getdoc.cgi?dbname=2010_register&docid=fr26au10-58.pdf
78 – 82 percent (10 states including DC)70 – 77 percent (18 states)63 – 69 percent (7 states)62 percent (14 states)
Enhanced Federal Medical Assistance Percentages (FMAP), FY 2011

00 25
these federal funds provided through Medicaid.
States began FY 2011 with the ARRA enhanced FMAP scheduled to expire midway through the state fiscal year on December 31, 2010. In adopting their budgets, 26 states and the District of Columbia had assumed the extension through the end of the 2011 fiscal year. After much debate over the funding source, Congress passed a partial extension in August that stepped down the ARRA enhanced FMAP. Instead of a continuation of the 6.2 percentage point base increase they received under ARRA, states will receive a 3.2 percentage point increase for the third quarter (January-March 2011) and a 1.2 percentage point increase for the fourth quarter (April-June 2011), which reduced the cost of the extension from $24 billion to $16.1 billion. Given that the passage of this measure occurred after nearly all states had adopted their budgets for FY 2011, it is likely that many states will need to make mid-year budget adjustments.
As states begin to think about developing their 2012 budgets, they are encouraged by the positive economic signs that are emerging, but know that state revenue recovery is still a few years into the future. Also headed into FY 2010, the end of the enhanced FMAP on June 30, 2011, will substantially increase Medicaid costs for every state – by 25 percent or more for a typical state – even before other increases driven by caseload growth, reimbursement changes or changes in utilization. State officials are concerned that this increase will contribute to significant state budget shortfalls in 2012 unless state revenues recover more rapidly than current projections would indicate.

0026
2. Medicaid Spending and Enrollment Growth Rates
Key Section Findings: Medicaid spending increased on average by 8.8 percent across all states in FY 2010, the highest rate of
growth in eight years. Legislatures had initially authorized growth of 6.3 percent, but spending increased at a faster pace than expected due to strong enrollment related to the recession (Figure 19).
For only the second year in the program’s history, state general fund spending on average declined in FY 2010 due to the ARRA enhanced FMAP, which decreased the state costs for Medicaid. The drop in 2010 was 7.1 percent, following a drop of 10.9 percent in 2009. For FY 2011, 26 states and DC assumed an extension of the ARRA enhanced FMAP and 24 states did not. This assumption significantly affected assumptions about state general fund spending, but on average, states expected their share of Medicaid costs to increase.
Enrollment growth averaged 8.5 percent in FY 2010, significantly higher than the 6.6 percent growth projected at the start of FY 2010. Driven by the economic downturn, this growth rate represented the highest rate of growth in eight years and the second highest rate of growth in two decades. States are now seeing signs that growth in Medicaid enrollment is leveling off and for FY 2011, states projected that Medicaid enrollment would grow at a somewhat slower rate of 6.1 percent (Figure 20).
For FY 2011, initial legislative appropriations authorized total spending growth that would average 7.4 percent above FY 2010 spending, still high but somewhat lower than FY 2010. As occurred in 2010, this initial rate of growth may understate the eventual actual spending increase for FY 2011, since Medicaid officials in over two-thirds of states believed there was at least a 50-50 chance that initial FY 2011 legislative appropriations would be insufficient, including one-third of states where a Medicaid budget shortfall was regarded as almost certain.
Figure 20
Percent Change in Total Medicaid Spending and Enrollment, FY 1998 – FY 2011
4.7%
6.8%8.7%
10.4%
12.7%
8.5%7.7%
6.4%
1.3%
3.8%
5.8%7.6%
8.8%7.4%
-1.9%
0.4%
3.2%
7.5%9.3%
5.6%4.3%
3.2%
0.2%-0.7%
3.1%
7.5%8.5%
6.1%
1998 1999 2000 2001 2002 2003 2004 2005 2006 2007 2008 2009 2010
Spending Growth Enrollment Growth
NOTE: Enrollment percentage changes from June to June of each year. Spending growth percentages in state fiscal year. SOURCE: Enrollment Data for 1998-2009: Medicaid Enrollment in 50 States, KCMU. Spending Data from KCMU Analysis of CMS Form 64 Data for Historic Medicaid Growth Rates. FY 2010 and FY 2011 data based on KCMU survey of Medicaid officials in 50 states and DC conducted by Health Management Associates, September 2010.
2011 Adopted
Figure 19
Projected and Actual Total Medicaid Spending and Enrollment Growth for FY 2010
6.3% 6.6%
8.8% 8.5%
Total Spending Growth Enrollment Growth
Projected for FY 2010 Actual for FY 2010
SOURCE: KCMU survey of Medicaid officials in 50 states and DC conducted by Health Management Associates, September 2009 and September 2010.

00 27
A. Total Medicaid Spending Growth
Total Medicaid spending includes all payments to Medicaid providers for Medicaid covered services provided to enrolled Medicaid beneficiaries. This definition includes “disproportionate share” (DSH) payments to hospitals that qualify for special payments to subsidize part of the costs of care for persons on Medicaid or that are uninsured. State obligations to finance a portion of the Medicare Part D prescription drug benefit for dual Medicare-Medicaid enrollees (the Clawback) 25 and Medicaid administrative costs are excluded from total Medicaid spending. The sources of financing for total Medicaid spending include federal and state, and in some states, also local funds.26
Total Medicaid Spending Growth in Fiscal Year 2010. In state fiscal year 2010, total annual Medicaid spending increased on average by 8.8 percent.27 By comparison, the original legislative appropriation for FY 2010 averaged 6.3 percent, meaning that legislatures added considerable funding to Medicaid during the course of the fiscal year. The average annual increase of 8.8 percent in FY 2010 was the highest rate of growth in eight years, slightly less than the double-digit rates of growth recorded in the previous recession in 2001 and 2002 (Figure 21).
Medicaid spending growth is closely tied to changes in economic conditions, which drives changes in Medicaid enrollment, as well as growth in health care costs in the overall health care market place. From its inception, Medicaid was designed to be counter-cyclical, so Medicaid spending would be expected to increase more rapidly in an economic downturn, and more slowly when the economy is thriving. Looking back over the past decade, for example, Medicaid spending increased rapidly going into the last recession, including growth exceeding 25 Medicare Part D transferred fiscal responsibility for prescription drugs for dual eligibles from Medicaid to Medicare, effective on January 1, 2006. Federal law required states to finance a portion of these costs through a payment to the federal government generally known as the “Clawback,” to help finance Medicare Part D. The Clawback formula approximates what a state would have paid in state funds for the prescription drug expenditure transferred to Medicare, discounted over a ten-year period from 10 to 25 percent. By law the Clawback is a source of financing for Medicare and is not a Medicaid expenditure, although many states continue to budget the Clawback payment as a part of Medicaid. For this survey, Medicaid expenditures exclude state Clawback payments when calculating spending growth. In March 2010, CMS released guidance specifying that states could apply ARRA funds to help reduce state clawback payments; however, they are still not counted as Medicaid spending. (http://www.cms.gov/smdl/downloads/SMD10004.pdf) 26 For this and previous surveys, Medicaid agencies were asked to use a consistent definition of expenditures from year to year in their calculation of annual rates of growth of total Medicaid spending. The definition is determined by each state and is known to vary across states. In some states, for example, Medicaid-financed spending under the control of another agency such as a mental health or public health agency may be included, and in other states not included. The national rates of growth in Medicaid spending reported here are the weighted averages of growth rates reported by each state, with the weights based on actual expenditures for each state in FY 2008, the most recent year for which state-by-state national data were available. 27 FY 2010 spending levels were preliminary at the time of this survey, pending the official closing of the fiscal year books.
Figure 21
Total Medicaid Spending Growth, FY 1996 – FY 2011
4.1%3.4%
4.7%
6.8%
8.7%
10.4%
12.7%
8.5%7.7%
6.4%
1.3%
3.8%
5.8%
7.6%
8.8%
7.4%
1996 1997 1998 1999 2000 2001 2002 2003 2004 2005 2006 2007 2008 2009 2010 2011
Strong Economy, Welfare Reform,
Enrollment Declines, Managed Care
1995-1998
Health Care Cost Growth 1998-
2000
Economic Downturn, Enrollment & Cost Growth,
2000-2003
Economic Recovery, Slower Enrollment Growth
2004-2006
NOTE: Data for State Fiscal Years, for total Medicaid spending, including state, ,local and federal funds.
SOURCE: Historic Medicaid Growth Rates from KCMU Analysis of CMS Form 64 Data, FY 2008, 2009 and 2010 based on KCMU survey of Medicaid officials in 50 states and DC conducted by Health Management Associates, 2010.
Low Enrollment Growth & Rx Spending for Duals
Moved to Part D 2006-2007
Economic Downturn 2008-2011
Adopted

0028
ten percent per year in 2001 and over 12 percent in 2002. Then, as the economy improved and enrollment growth slowed, spending growth declined to record low rates of 1.3 percent in FY 2006 and 3.8 percent in FY 2007. Slow growth in FY 2007 was also impacted by the January 1, 2006 implementation of Medicare Part D, which assumed what had been Medicaid’s responsibility for prescription drugs for dual Medicaid – Medicare enrollees.28 In 2008, the economy again began to slow, causing enrollment to grow and spending to increase. Annual average Medicaid spending growth rebounded to 5.8 percent in FY 2008, then accelerated to 7.6 percent in FY 2009 and 8.8 percent in 2010. High Medicaid spending growth occurred just as state revenues plummeted throughout 2009 placing fiscal strain on states facing budget shortfalls that would have required dramatic program cutbacks were it not for the ARRA enhanced FMAP.
Total Medicaid Spending Growth for Fiscal Year 2011. Most state Medicaid budgets for FY 2011 were adopted between March and June of 2010, before the state fiscal year began on July 1(for all but four states and the District of Columbia). State legislatures were considering fiscal year 2011 budgets at a time of historic fiscal stress at the state level, during the debate and adoption of historic health reform legislation at the federal level and amid uncertainty about whether Congress would extend the ARRA enhanced FMAP scheduled to expire mid-way through the next fiscal year. In this context, legislatures adopted Medicaid budgets for FY 2011 that authorized annual increases in total Medicaid spending that averaged 7.4 percent across all states and the District of Columbia.
The appropriated average annual increase in total Medicaid spending of 7.4 percent for FY 2011 is higher than the initial appropriation for the previous year FY 2010 of 6.3 percent, but well below the actual growth for FY 2010 of 8.8 percent. If the initial appropriations for FY 2011 prove to be on target, it would mark the first slowing in the rate of growth in total Medicaid spending since 2006. The initial appropriations are based on a number of assumptions about the upcoming year, including assumptions about whether fiscal relief would be extended, savings from specific cost containment strategies, and projections for Medicaid enrollment growth. States will monitor the Medicaid spending trends throughout the year and as necessary initiate mid-year actions to slow the pace of Medicaid spending or seek additional funding. In over two-thirds of states, Medicaid officials indicated that the likelihood of a Medicaid budget shortfall in FY 2011 was at least 50 – 50, including officials in one-third of states that said it was virtually certain. This means that the actual annual average increase in Medicaid spending in FY 2011 could exceed the initial legislative authorization.
Factors Contributing to Growth in Total Medicaid Spending in FY 2010 and FY 2011. For FY 2010 and 2011, for nearly all states the single most significant factor in Medicaid spending growth is the growth in the number of persons enrolled in the program. For the most part, the enrollment growth was related to the economic downturn and high levels of unemployment. However, a few states mentioned specific eligibility expansions or enrollment simplifications adopted by the state to add coverage for uninsured children or adults. About one-third of the states also mentioned health care inflation and specific provider rate increases, especially as it affected rates paid to hospitals, nursing homes or other providers whose reimbursement is related to cost as another factor contributing to growth in Medicaid spending.
28 States continue to pay the federal government part of the cost of prescription drugs for dual eligibles through a payment generally referred to as the “Clawback.” However, the Clawback is classified as a source of financing for Medicare and is not counted as a Medicaid expenditure.

00 29
About a quarter of states also attributed spending growth to observed increases in the utilization of services.
Medicaid programs continue to take actions designed to slow the rate of Medicaid spending in response to severe budget pressures. Among factors that helped to slow the rate of growth in spending in FY 2010 and FY 2011, provider rate cuts or freezes were listed most frequently. In addition, state officials mentioned enhanced utilization controls, disease management, care coordination and case management programs, an expansion of managed care, benefit adjustments, home and community-based services and initiatives that move patients from nursing homes to the community, program integrity initiatives and other program efficiencies. Policy changes relating to eligibility, rates, benefits, pharmacy, long-term care and delivery system changes are described in more detail later in this report.
B. State General Fund Spending Growth for Medicaid
Even though both state and federal governments jointly pay for total Medicaid expenditures, it is the cost to the state that is most relevant to state decision makers. When making decisions about Medicaid payment rates, benefits or eligibility, state policy makers first consider the cost to the state. Often when discussing Medicaid spending, the focus of state decision makers is on the federal share and the federal Medicaid matching rate, known as the FMAP, which determines the federal share. The state share is what remains after the federal government pays its portion of total Medicaid spending. The FMAP formula is designed so states with lower average incomes receive higher FMAPs.
Total Medicaid spending and the state share of Medicaid spending typically grow at about the same pace; however differences can result from changes in the FMAP, contributions from local governments, tobacco tax funding, special financing arrangements and provider tax revenue. Twice in the last decade, Congress has enacted temporary enhancements to the FMAP to provide fiscal relief to states. The first occurred in 2003 and 2004 during the last recession, when Congress increased FMAPs by 2.95 percentage points for five quarters, thereby providing fiscal relief to states that totaled $10 billion. The second was with the ARRA enhanced FMAP but this time Congress allocated a much larger sum – a total of $87 billion over nine quarters, retroactive to October 2008 and extending through December 2010. As a result of the ARRA enhanced funds, the state share of Medicaid spending decreased in FY 2009 and FY 2010. This was the first time in the history of the Medicaid program that there had been a decrease in annual state Medicaid spending.
With the ARRA enhanced FMAP in place, state general fund spending on Medicaid declined by 10.9 percent in FY 2009 and by 7.1 percent for FY 2010. These decreases in the state cost of Medicaid occurred at the same time that total Medicaid spending increased by 7.6 percent in FY 2009 and by 8.8 percent in FY 2010. Declines in the state share of Medicaid funding did not occur during 2003 and 2004 because the additional federal funding was much smaller ($10 billion) than provided by ARRA (Figure 22).
Figure 22
Total and State Funds Medicaid Spending Growth FY 2000 – FY 2011
8.7%
10.4%
12.7%
8.5%7.7%
6.4%
1.3%
3.8%
5.8%7.6%
8.8%7.4%
8.4%9.9%
12.9%
5.5% 4.9%
10.1%
3.0%4.0%
5.7%
-10.9%
-7.1%
13.1%
2000 2001 2002 2003 2004 2005 2006 2007 2008 2009 2010
Total State General Fund
Enhanced FMAP / Federal Fiscal Relief
(2003-2005)
NOTE: State Fiscal Years. SOURCE: Historic Medicaid Growth Rates, KCMU Analysis of CMS Form 64 Data; FY 2008, 2009 and 2010, KCMU survey of Medicaid officials in 50 states and DC conducted by Health Management Associates, 2010.
ARRA Enhanced FMAP (2009-2011)
2011 Adopted

0030
States began FY 2011 with the ARRA enhanced FMAP scheduled to expire midway through the state fiscal year budgets on December 31, 2010, and with uncertainty about whether Congress would extend the enhanced FMAP. At the state level, the uncertainty over the enhanced FMAP extension forced states to make a decision about whether to assume its extension or not when adopting the FY 2011 budget. For many states in the midst of severe budget shortfalls, it was a decision about whether to cut Medicaid or other programs, or take a chance that Congress would act. By the time Congress adopted the extension, budgets for FY 2011 were already adopted by all states except California and Michigan. When adopting Medicaid budgets for FY 2011, a total of 26 states and DC indicated that the Medicaid budget assumed a six-month full extension of the ARRA enhanced FMAP and 24 states indicated that the Medicaid budget did not assume an extension.29
Across all 50 states, appropriations for the state share of Medicaid costs for FY 2011 averaged growth of 13.1 percent. However, the states that assumed a full extension of the ARRA enhanced FMAP differed significantly from those that did not. Across the 27 states (including DC) that assumed a full extension of the ARRA enhanced FMAP in their FY 2011 budgets, the annual growth in state Medicaid funds budgeted for FY 2011 averaged 5.3 percent. Across the 24 states that did not assume an extension of the enhanced FMAP and budgeted a return to regular FMAP on January 1, 2011, the annual growth in state Medicaid funds averaged 25.6 percent. (The two groups of states did not differ with respect to the average appropriation for total Medicaid spending, with each appropriating growth that averaged 7.4 percent.) The dramatic difference in growth in state funds, 5.3 percent vs. 25.6 percent, underscores the importance of the FMAP extension to state budgets, and what the impact would have been if the enhanced FMAP had not been extended (Figure 23).
Since the Congressionally-adopted FMAP extension is a phase-down and not a full extension of the ARRA enhanced FMAP in place until December 2010, the actual experience of states during FY 2011 will differ even for states that assumed an extension. Among states that did not budget for an enhanced FMAP extension, the additional federal funds will provide fiscal relief for state budget and Medicaid shortfalls. Some states had prepared a contingency list of actions to take if the extension did occur, including increasing funding for education or reducing proposed cuts to Medicaid. Among states that assumed a full extension of the ARRA enhanced FMAP, rather than a phase down, some will need to find additional funds or make changes to achieve additional savings.
29Included among the 26 states that assumed an FMAP extension are California and Michigan, whose budgets were not adopted at the time of the survey. The proposed budgets in these states assumed an extension.
Figure 23
Estimated Growth in State Share of Medicaid for FY 2011
5.3%
25.6%
13.1%
Assumed ARRA Extension (27 States)
Did Not Assume ARRA Extension (24 States)
Average

00 31
The wide difference between those states that did and those states that did not assume an extension also points to the impact states will experience in FY 2012 when the enhanced FMAP is phased out on June 30, 2011. In FY 2012, the state cost of Medicaid will be at least one-fourth to one-third higher than in FY 2011, depending on state circumstances, due just to the end of the enhanced FMAP and without consideration of any other factors that may affect state costs such as changes in eligibility, enrollment, utilization, provider rates, benefits or eligibility. 30
C. Medicaid Enrollment Growth
Driven by high levels of unemployment, the number of people enrolled in Medicaid has increased substantially in the past 3 years, and this growth has been the primary driver of overall Medicaid spending. In FY 2010, Medicaid enrollment increased by 8.5 percent, significantly higher than the 6.6 percent growth anticipated when states adopted their FY 2010 budgets. This represented the highest rate of growth in 8 years and only the second time since 1992 that enrollment has grown this fast. In FY 2010, enrollment increased in every state except Tennessee and in more than a quarter of the states, the annual growth exceeded 10 percent (Figure 24). 31
By the end of FY 2010 and into early FY 2011, Medicaid directors in some states said that they were seeing signs that the high rate of growth in enrollment might be slowing. The Medicaid directors attributed this possibility to economic conditions that were not yet good but at least were no longer worsening.32 Across all states, the number of persons enrolled in Medicaid was projected to increase on average by 6.1 percent in FY 2011, significant, but slower than the rate in FY 2010. Only ten states expected the growth rate in FY 2011 to exceed the rate of growth they experienced in FY 2010.
Throughout the current economic downturn, Medicaid officials indicated that growth in enrollment was primarily among children and families affected by the economy. Growth continues to occur among persons with disabilities and persons over age 65, but this growth is less variable since it is primarily driven by demographic trends rather than by the economy. 30 For states with a base FMAP of 50% and an ARRA enhanced FMAP of 61.59% through December 2010, the enhanced FMAP will phase down in the January-March quarter to 58.77% and in the April-June quarter to 56.88%, before returning to the base rate of 50% in July 2011. Depending on actual spending trends through the year, the FY 2011 FMAP will average just under 60%, and the state share just over 40%. For FY 2012, the FMAP returns to 50.0%, an increase of almost 25% in the state share of Medicaid spending due specifically to the change in the federal matching rate. States with the highest base FMAPs, such as Arkansas and Mississippi, will see FY 2012 increases in the state share by over 30%. 31 In Tennessee, enrollment for children and families reached a record level, but caseload increases related to the economy were offset by the disenrollment of about 100,000 individuals on SSI who had retained Medicaid eligibility pending the outcome of a lawsuit. 32 “State Medicaid Agencies Prepare for Health Care Reform While Continuing to Face Challenges from the Recession.” Kaiser Commission on Medicaid and the Uninsured, August 2010.
Figure 24
Change in Medicaid Enrollment, FY 1998 – FY 2011
Annual growth rate:
-1.8%
0.4%
3.2%
7.5%
9.3%
5.6%
4.3%
3.2%
0.2%
-0.6%
3.0%
5.4%
8.5%
6.1%
1998 1999 2000 2001 2002 2003 2004 2005 2006 2007 2008 2009 2010 2011
Note: Enrollment percentage changes from June to June of each year. SOURCE: For 1998-2008: Medicaid Enrollment in 50 States: June 2009 Data Update, KCMU, February 2010. FY 2010 and FY 2011 based on KCMU survey of Medicaid officials in 50 states and DC conducted by Health Management Associates, 2010.

0032
3. Medicaid Policy Initiatives for FY 2010 and FY 2011
Key Section Findings: In FY 2010, 48 states implemented at least one new policy to control Medicaid costs and 46 states
planned to do so in FY 2011. Some states reported program reductions in multiple areas and also reported that mid-year budget reductions were possible.
The impact of the recession is especially evident in changes to provider payment rates. While ARRA enhanced matching funds were used to avoid or lessen the extent of provider rate cuts, rates cuts or freezes were still prevalent. A total of 39 states restricted provider rates in FY 2010 and 37 states have restricted or plan to restrict provider rates in FY 2011.
Twenty states implemented benefit restrictions (elimination of benefits or implementation of utilization controls) in FY 2010 – the largest number of states reporting benefit cuts in one year since the annual surveys began in 2001. Fourteen states reported plans for benefit reductions or restrictions in FY 2011.
Requirements to maintain eligibility as a condition of receiving the ARRA enhanced matching funds prevented eligibility restrictions in FY 2010, and health reform included similar MOE provisions that extend through 2014 for adults and through 2019 for children. For FY 2010, 41 states made enhancements to eligibility standards or enrollment and renewal processes and for FY 2011, 27 states have plans to do so.
States are continuing to expand home and community-based long-term care services (HCBS), but at a slightly slower pace than in previous years. Overall, 32 states took actions that expanded LTC services in FY 2010 (primarily expanding HCBS programs), and 32 states planned expansions for FY 2011. However, the number of states adopting new HCBS waivers or expanding existing waivers decreased to 23 in FY 2010 and 22 in FY 2011 compared to 27 in FY 2009 and 38 in FY 2008, suggesting that some states may be postponing additional balancing efforts due to difficult state fiscal conditions. More states are implementing utilization controls and other reductions on LTC services to contain costs.
State by state policy actions including cost containment and program expansions are listed in Appendices A-1 and A-2.
Figure 25
State Policy Actions Implemented in FY 2010and Adopted for FY 2011
36 41
15
323627
16
32
States with Expansions / Enhancements
States with Program Restrictions
Adopted FY 2011FY 2010
Provider Payments Eligibility Benefits Long Term Care
39 37
1 1
2014 18
10
NOTE: Past survey results indicate not all adopted actions are implemented. Provider payment restrictions include rate cuts for any provider or freezes for nursing facilities or hospitals.
SOURCE: KCMU survey of Medicaid officials in 50 states and DC conducted by Health Management Associates, September 2010.

00 33
A. Changes in Provider Reimbursement
Rate Changes. State actions around provider rate changes are directly related to state fiscal conditions. Rate changes have an immediate impact on state budgets. During the economic downturn from 2001 to 2004, every state froze of cut provider payment rates to control costs, but starting in 2005, as the economy improved, states were less likely to cut and more likely to increase provider rates. During this recession, states again turned to provider rate cuts to control costs. Due to the maintenance of eligibility requirements in ARRA and then in ACA, states cannot make eligibility cuts, leaving states with few levers to control spending. Provider rates are an important determinant of provider participation and access to services for Medicaid beneficiaries, so cutting Medicaid rates (which are typically lower than Medicare or commercial insurance) can jeopardize provider participation in the program and access.
While the ARRA enhanced FMAP mitigated some of the rate cuts that might have occurred, the trend from FY 2008 through FY 2010 has been an increase in the number of states either cutting provider rates or freezing rates for what have traditionally been considered “cost-based” providers (hospitals and nursing homes). In addition there has been a marked reduction in the number of providers that are receiving rate increases. As shown in Figure 26, these trends have affected every major category of Medicaid providers.
Overall for FY 2010, 36 states reported rate increases for any provider type and 39 states reported rate cuts for any provider. FY 2010 marked the first year since the end of the last recession where more states reported rate restrictions than increases with the exception of the managed care organization (MCO) category. Compared to what states had adopted for FY 2010, fewer states were able to follow through with rate increases than had planned to and states also had to make additional mid-year budget cuts. For example, according to last year’s survey results, 44 states planned rate increases for all providers, 24 for hospitals and 29 for MCOs in FY 2010. When surveyed this year, only 36 states reported increases for any provider, 18 for hospitals and 22 for MCOs in FY 2010. Looking at cuts, only 13 states originally planned cuts for physicians but 20 states actually made physician payment rate cuts in FY 2010.
In general, states are planning for fewer rate cuts in FY 2011, but also fewer rate increases compared to FY 2010. However, many states indicated that they expect Medicaid budget shortfalls. Given this prospect, additional mid-year rate cuts across provider groups can be expected during FY 2011. In some states, provider rate changes will be affected by what they had assumed in terms of the enhanced FMAP extension. For example, Virginia did not assume an extension of the enhanced FMAP in their FY 2011 budget and reported cutting physician rates by 3 percent effective July 1, 2010. The state released a provider bulletin announcing those cuts and also indicating that they would not
Figure 26
2016
1 15
2127
8 514
3933
20
10
25
3730
12 9
29
States with Provider Rate Changes FY 2008 – FY 2011
48
35
2731
4647
2419
29
3736
18
8
2226
36
21
8
20 22
Any Provider Inpatient Hospital MCOs Nursing HomesPhysicians
States with Rate Increases
States with Rate RestrictionsNOTE: Past survey results indicate adopted actions are not always implemented. Any provider also includes dentists and outpatient hospital providers. Rate restrictions include rate cuts for any provider and also frozen rates for inpatient hospitals and nursing homes.SOURCE: KCMU survey of Medicaid officials in 50 states and DC conducted by Health Management Associates, September 2008, September 2009, and September 2010.
FY 2009FY 2008 FY 2010 Adopted FY 2011
0034
be implemented if the enhanced FMAP were extended.33 On the other hand, Michigan did assume the full ARRA enhanced FMAP extension in the FY 2011 budget and counted on these funds for a MCO rate increase. Given that the enhanced FMAP extension provided less funding than originally anticipated, this rate increase may be scaled back.
Institutional providers like hospitals and nursing homes are more likely than other providers to have inflation adjustments built into their rates, so they are less likely than other provider groups to experience cuts. However, given the severe budget circumstances, these providers have experienced rate freezes and reductions. For FY 2010, a total of 33 states restricted hospital payment rates including 14 states that froze rates and 19 states that reduced rates. For FY 2011, 17 states planned hospital rate freezes and 13 states planned hospital cuts for a total of 37 planned rate restrictions. For nursing homes, the 25 rate restrictions in FY 2010 included 14 freezes and 11 cuts and the 29 planned restrictions for FY 2011 includes 20 rate freezes and 9 cuts.
MCOs are generally protected from rate cuts by the requirement that states pay actuarially sound rates; however, there are ten states that cut MCO rates in FY 2010 and nine states cutting MCO rates for FY 2011. These cuts generally reflect the fact that the underlying provider rates have been cut. In prior recessions, physician rates have not been increased, but have seldom been cut by many states. This survey shows that 20 states actually cut some or all Medicaid physician rates in FY 2010 and 12 states plan such cuts for FY 2011. Several states mentioned that their physician cuts applied to specialists and that either primary care physicians or “evaluation and management” fees were not subject to the rate reductions. Very few states have been able to increase any physician rates in either FY 2010 or FY 2011 and some of these increases have been small or targeted. Prior to the recession, many states had implemented rate increases for dentists in an effort to promote participation of dentists in the program and expand access. However, fiscal pressures resulted in 13 states with cuts to dental rates in FY 2010 and 7 states that adopted cuts to dental rates in FY 2011.34
While the survey does not ask states the magnitude of the provider rate cuts or increases, several states making significant rate changes reported these statistics:
Iowa made mid-year cuts to all provider rates by factors ranging from 2.5 percent to 5.0 percent in FY 2010 due to a decline in state revenues. For FY 2011 the hospitals and nursing homes are receiving rate increases of 15 percent and 14 percent respectively, which are financed by new hospital and nursing home taxes.
Kansas made mid-year rate cuts of 10 percent for all providers in FY 2010, but has restored all of the cuts in FY 2011. Kansas is also rebasing Medicaid fees to a flat percentage of Medicare;
Louisiana, having cut inpatient hospital rates by 3.5% in FY 2009, cut inpatient hospital rates by 12.1 percent in FY 2010 and an additional 4.6 percent in FY 2011; and
Oklahoma made across-the-board 3.25% rate cuts in FY 2010, but is increasing physician rates and leaving other provider rates untouched for FY 2011.
33 “Memo to Providers: Physician Rate Changes and Medicaid Coverage of the Current Procedural Terminology (CPT) Consultation Codes and Adult Vision Services.” Virginia Department of Medical Assistance Services, May 27, 2010. http://www.dmas.virginia.gov/downloads/pdfs/mm-ratech_physician_cpt.pdf. 34 In FY 2010, 13 states reported cuts to dental rates (AZ, CO, IA, IN, KS, LA, MN, NC, NM, OH, OK, UT, WA) and 7 states (CO, DC, LA, MN, TX, VA, WA) adopted cuts to dental rates in FY 2011.

00 35
Key ACA Changes Affecting Provider Reimbursement
Primary Care Reimbursement Increase. The ACA increases payments in fee-for-service and managed care for primary care services provided by primary care doctors (family medicine, general internal medicine or pediatric medicine) to 100 percent of the Medicare payment rates for 2013 and 2014 and provides 100 percent federal financing for the difference in rates based on rates applicable on July 1, 2009. Primary care services are defined as those linked to evaluation and management billing codes and services related to immunizations.
MACPAC. The ACA also appropriates $11 million for FY 2010 (with $9 million from Medicaid and $2 million from CHIP) to broaden the scope of the Medicaid and CHIP Payment and Access Commission (MACPAC) to include adult services (including duals) and clarifies the topics for review including eligibility policies, enrollment and retention processes, coverage policies, quality of care, and interactions with Medicare and Medicaid.
Provider Taxes: As state tax revenues remain far below pre-recession levels, Medicaid programs increasingly rely upon provider assessment programs as a means of generating non-Federal matching funds for Medicaid programs. Almost every state now has at least one Medicaid provider tax. The number of states reporting the use of at least one Medicaid provider tax remained at 46 for FY 2010 and increased to 47 for FY 2011. (See Appendix A-3 for state-specific information on provider taxes by category of providers). Survey responses also suggest that the number of assessments programs and the tax rates imposed through these programs will continue to grow.
Figure 27 demonstrates the growth in the number of provider assessments by states. Survey responses indicate 34 total hospital provider taxes in FY 2011 compared to 19 in FY 2008; 34 assessments on Intermediate Care Facilities for the Developmentally Disabled (ICF/MR-DD) in FY 2011 compared to 28 in FY 2008; and 38 nursing homes taxes in FY 2011 compared to 33 in FY 2008.
As states sought additional revenues, Medicaid agencies also reported increases in the rate of the assessments imposed upon provider groups. In FY 2010, states reported an increase in tax rates for 27 tax programs and reductions in tax rates for two provider tax programs. This trend continues in 2011; states anticipate increased tax rates in twenty-two provider tax programs and there were no anticipated reductions in provider tax rates reported.
New or expanded provider taxes are often directly linked to provider rate increases. As mentioned earlier, hospitals and nursing homes are receiving rate increases of 15 percent and 14 percent respectively in FY 2011 in Iowa, which are financed by new hospital and nursing home taxes. Georgia was also able to increase inpatient hospital rates as a result of a new provider assessment.
In FY 2010, five managed care provider taxes were eliminated, driven by changes in Federal policy, (effective in July of 2009) that restricted the ability of states to tax managed care organizations to enhance Medicaid rates.
Figure 27
States With Medicaid Provider Taxes FY 2008 – FY 2011
45
19
2833
16
46
23
29
35
17
46
2933
37
12
47
34 3438
11
Any Provider Inpatient Hospital MCOsNursing HomesICF/MR-DD
ICF/MR-DD facilities are Intermediate Care Facilities for persons with mental retardation or developmental disabilities. SOURCE: KCMU survey of Medicaid officials in 50 states and DC conducted by Health Management Associates, September 2008, September 2009, and September 2010.
FY 2009FY 2008 FY 2010 Adopted FY 2011

0036
B. Eligibility and Enrollment Process Changes
Medicaid eligibility standards determine who can qualify for the program. The enrollment and renewal process impacts how hard or easy it is to apply for coverage, and therefore affects the likelihood that those who are eligible will successfully enroll or have their coverage renewed.
The American Recovery and Reinvestment Act (ARRA) protected eligibility from cuts and impose more restrictive enrollment and renewal processes for FY 2009 and FY 2010. As mentioned earlier, as a condition of accepting additional federal fiscal relief through the ARRA, states are required to agree to maintenance of eligibility (MOE) provisions. Specifically, ARRA requires each state to ensure that the eligibility standards, methodologies, or procedures under its Medicaid State Plan as well as under any waivers or demonstration programs, are not more restrictive than those in effect on July 1, 2008. For FY 2009, several states had to reverse or abandon restrictions to be eligible for ARRA funds. Since the enhanced federal matching funds were extended through June 2011, this MOE requirement was also extended. The ACA also included MOE provisions that are in place until Health Insurance Exchanges are in operation, expected to be 2014 for adults and the MOE provisions apply to children in Medicaid and CHIP through 2019.
These MOE provisions are important because during economic downturns, states often seek to reduce Medicaid caseload and therefore spending by making changes to eligibility criteria and application processes. During the last economic downturn, fiscal relief prevented changes in eligibility standards; however, without prohibitions on restrictions to enrollment processes, many states made changes such as increases in the documentation requirements or increasing the frequency for eligibility determinations, which had immediate effects on slowing caseload growth. Many of these types of changes were reversed as states emerged from the last downturn. In FYs 2007 and 2008, several states implemented significant Medicaid coverage initiatives to help reduce the number of uninsured.
While states are required to maintain eligibility levels and enrollment procedures, most states have taken actions to expand Medicaid eligibility or make the enrollment and renewal processes easier despite the continued downturn in the economy. In FY 2010, 41 states made positive eligibility and application process changes and 27 states have plans to do so in FY 2011 (Figure 28). More detail about these changes related to eligibility standards and application processes are detailed below. This information includes states that took advantage of new eligibility options made available from recent legislation including the CHIPRA and the ACA.
Figure 28
7 5 21 1 01 1 01 1 0
States With Eligibility Changes FY 2008 – FY 2011
3327
2330
15
25
41
322627
17 17
Total Changes Eligibility Standards Application and Renewal
States with Expansions / Enhancements
States with Program RestrictionsNOTE: Past survey results indicate adopted actions are not always implemented. A maintenance of eligibility prohibited eligibility restrictions in FY 2009 – 2011. Three eligibility restrictions occurred: In FY 2009 RI restricted eligibility for parents because legislation had been passed prior to the MOE. In FY 2010 and FY 2011, NM imposed a wait list on its state coverage initiative. SOURCE: KCMU survey of Medicaid officials in 50 states and DC conducted by Health Management Associates, September 2008, September 2009, and September 2010.
FY 2009FY 2008 FY 2010 Adopted FY 2011

00 37
Key ARRA and CHIPRA Changes Affecting Medicaid Eligibility and Enrollment ARRA Maintenance of Eligibility (MOE). As a condition of accepting additional federal fiscal relief through the ARRA, states are required to agree to MOE provisions. Specifically, section 5001 of ARRA requires each state to ensure that the eligibility standards, methodologies, or procedures under its Medicaid State Plan as well as under any waivers or demonstration programs, are not more restrictive than those in effect on July 1, 2008. ARRA Transitional Medical Assistance (TMA) Option. ARRA allowed states to remove the quarterly income reporting requirement and reduced the months a family must have had Medicaid to qualify for TMA when family income increased. Option to cover recent legal immigrant children and pregnant women (ICHIA). The CHIPRA provided states the option to extend Medicaid and/or CHIP coverage to otherwise eligible pregnant women and children who are legal immigrants who have been in the country for less than five years. Express Lane Eligibility (ELE). The ELE option allows states to use information and eligibility findings from other public benefit programs, such as food stamps, child care or school meals programs – and from state tax forms – to facilitate an eligibility determination for children’s health coverage. Performance Bonuses. States that implement 5 out of 8 enrollment and renewal procedures in Medicaid and CHIP (12-month continuous eligibility, no asset test or administrative verification of assets, no in-person interview, use of common forms and uniform procedures, administrative renewal, ELE, presumptive eligibility and premium assistance in CHIP) and meet specified enrollment targets can qualify for a performance bonus. SSA Data Match. This option, effective January 1, 2010 will allow states to conduct data matches with SSA to substantiate US citizenship for determining eligibility for Medicaid and CHIP.
Key ACA Changes Affecting Medicaid Eligibility and Enrollment Maintenance of Eligibility (MOE). The ACA has further extended the ARRA MOE provision. ACA provides that states must, until Health Insurance Exchanges are operational, maintain eligibility standards, methodologies and procedures that were in place on March 23, 2010. One exception to this requirement is for non-pregnant, non-disabled adults with incomes that exceed 133% of the federal poverty level in states certifying that they project a budget shortfall. For children, current eligibility levels must be maintained through 2019. New Coverage Requirements and Options. In 2014, states will be required to expand coverage to nearly all non-elderly individuals under 133 percent of poverty ($14,400 for an individual in 2009). For most Medicaid enrollees, a 5 percent income disregard will apply making the effective eligibility 138 percent of poverty, and eligibility will be based on Modified Adjusted Gross Income without an asset test. ACA provides states with the option to cover childless adults under a state plan amendment (SPA) beginning April 1, 2010. ACA also allows states to expand family planning services to non-pregnant low-income men and women35 through a SPA beginning March 23, 2010. Financing for New Coverage. ACA provides full federal financing for those newly eligible for Medicaid fin 2014-2015 and then phases down the federal contribution to 90 percent by 2020. States will receive the regular Medicaid match rate for individuals already eligible for coverage under rules in place December 1, 2009. There is an expansion state match rate designed to provide some additional help to states that had been leaders in providing expanded coverage to parents and childless adults under Medicaid. States that take advantage of the option to expand coverage to childless adults prior to 2014 will be eligible for the regular match rate until 2014, when these individuals could qualify for the higher “newly eligible match rate”. 36
35 Income level of this new eligibility group is not to exceed that of the state’s current income eligibility level for pregnant women. Centers for Medicare and Medicaid Services; SMDL#10-013; July 2, 2010. 36 Financing New Medicaid Coverage Under Health Reform: The Role of the Federal Government and the States. Kaiser Commission on Medicaid and the Uninsured, May 2010.

0038
Changes to Eligibility Standards. Due to the ARRA requirements, virtually all states were prohibited from implementing any eligibility cuts.37 Even in the face of significant economic stress, 32 states were able to expand Medicaid eligibility standards in FY 2010 and 17 states have expansions planned for FY 2011.38 These expansions vary widely in their scope. Nearly half of all states adopted or plan to adopt the ICHIA option included in CHIPRA to cover legal immigrants (pregnant women or children) in the country for less than five years; however many of these states had previously covered legal immigrants using solely state funds. In these states, this represents a change in financing, but not new coverage. Key eligibility expansions are highlighted in Table 1 below.
Table 1: Key Eligibility Expansions Type of Expansion States in FY 2010 States in FY 2011
Adopted CHIPRA option to cover Legal Permanent Residents with Less than 5 Years of Residency (ICHIA Option under CHIPRA)39
CA, CO, CT, DC, IA, IL, MA, ME, MN, MT, NJ, NM, NY, OR, PA, RI, VA, WA, WI DE, NE, NC, TX
Income: Increase an Income Limit or Earned Income Disregard CO, FL, IN, IA, ND, RI AK, CA, IA, LA, OR Assets: Increase Limits, Eliminate Test, or Change How an Asset is Counted CT, IN, LA, MT, NY, OR, VA, WI
TMA modifications under ARRA AK, CT, FL, ID, MT, NY OR, SC, SD Implement or Expand a Family Planning Waiver
or State Plan WI CA, CT, IN, MT, NH, WY 12 month Continuous Eligibility (other than TMA) MT, NM, OH, OR KS, NY Presumptive Eligibility IN, IA, OH KS Childless Adults under ACA Option CT, DC
Childless Adults under Waiver MI, WI CA, DC New Buy-In or TWWIAA option DE, MT IL, TX Cover Youth Aging out of Foster Care MN, OR Optional Coverage Extension for Afghan Immigrants FL, OK
While most eligibility changes affected a small number of beneficiaries, several of the expansions were significant. 37 The only eligibility cuts listed in FY 2010 and FY 2011 are enrollment limitations that New Mexico has placed on its State Coverage Initiative. This waiting list is possible within the MOE requirements. 38 As part of the MIPPA requirements, all states were required to increase the asset limits for low-income Medicare beneficiaries participating in the “Medicare Savings Program” through which state Medicaid programs pay Medicare premiums and Medicare copayments for the lowest income beneficiaries. Since this was a federal mandate for all states and the provision only affects individuals for whom Medicare is their primary source of health care coverage, this increased asset limit was not counted for this report. As these new MIPPA requirements more than doubled the minimum asset limits for MSP recipients as of January 1, 2010, some states expect significant increases in this component of their Medicaid programs. 39 States adopting ICHIA were cross-referenced with preliminary results from Findings of a 50 State Survey of Eligibility Rules, Enrollment and Renewal Procedures, and Cost-Sharing Practices in Medicaid and CHIP for Children and Parents During 2010. Kaiser Commission on Medicaid and the Uninsured (forthcoming) and information from CMS. States that reported adopting the ICHIA option in the forthcoming survey results and not in this survey include: IL, ME, NE, NC, PA, RI, and TX. Additionally, HI and MD implemented the ICHIA option in FY 2009 and therefore are not included in the table above.

00 39
Connecticut. On April 1, 2010, Connecticut became the first state to implement the childless adult coverage option under ACA. This expansion is expected to cover 47,000 individuals.
Colorado. On May 1, 2010, Colorado increased the income limit for Medicaid for low-income parents from 60 percent to 100 percent of poverty. The state estimates that this expansion will cover 12,000 individuals.
District of Columbia. On July 1, 2010, DC became the second state to implement the childless adult coverage option under ACA. This would move coverage from the District’s state-funded coverage program (the Alliance) to Medicaid. The new option is expected to cover 32,000 individuals in DC. For FY 2011, DC has requested permission to convert Disproportionate Share Hospital (DSH) funds to expand the Alliance program to cover approximately 5,000 individuals with incomes between 133% and 200% of FPL.
Ohio. On April 1, 2010, Ohio implemented presumptive eligibility and twelve months continuous eligibility for children. These two initiatives are expected to increase enrollment by nearly 41,000 children in Ohio as part of their efforts to increase enrollment under the Secretary’s Challenge: Connecting Kids to Coverage.
Wisconsin. In January 2009, the state expanded coverage to childless adults with incomes up to 200% FPL through an 1115 Waiver program called BadgerCare Plus Core, beginning with those already enrolled in county-funded medical programs. In July 2009 (FY 2010), there was a further expansion of childless adults to the program, adding an additional 57,000 individuals.
The survey asked states about any plans to expand eligibility to childless adults under the new ACA option prior to 2014. Most states reported that the current fiscal situation would limit their ability to find the state match to take advantage of this option – these expansions would need to be financed at the regular state match until 2014 and would not qualify for enhanced match under the ARRA. Four states - Colorado, Delaware, New Jersey and Washington - indicated such an expansion was possible. New Jersey has a state plan amendment pending at CMS (submitted on June 29, 2010). Delaware is looking at the possibility of converting an existing 1115 waiver to the ACA state plan option. Colorado, which currently has some coverage strategies for this population, is researching its options. Washington reports that it has submitted an 1115 demonstration waiver that would allow the ACA early expansion option to sustain coverage for approximately 90,000 persons through the use of federal funds to finance the state's Basic Health and Medical Care Services programs. California also indicated that they had hopes in FY 2011 to expand its current waiver authority to cover childless adults in a limited number of California counties.
Many other states that currently cover childless adults under waivers either plan to keep their existing waivers or are still assessing their options. A number of these states reported that they are planning to keep their waivers in place and not take advantage of the state plan option because they have the ability to impose or maintain a cap on enrollment under their waivers.

0040
Changes to Enrollment and Renewal Processes. Due to the ARRA MOE requirements, restrictions to the enrollment and renewal processes were prohibited.40 In FY 2010, 26 states implemented changes that would streamline or simplify the application and renewal process. Only 17 states indicate plans for simplification in FY 2011. Many of these changes would help to qualify states for the Medicaid performance bonus FMAP authorized by CHIPRA. The most common changes reported were:
Expansion or implementation of the ability to submit applications or renew Medicaid eligibility on-line (17 states).
Implementation of Express Lane Eligibility (7 states).41
Increased use of available data for renewals – described as exparte renewals, administrative renewals or passive renewals to reduce the documentation burden for recipients and to reduce workloads for staff (8 states).
Other application related changes for FY 2010 and 2011 include elimination of a requirement for “in person” renewals (3 states), and extending the redetermination period to 12 months for one or more groups of enrollees (2 states).
The survey also asked states if they have implemented or plan to implement the option to use SSA to conduct a data match for citizenship and identity. Twenty-one states had adopted this data matching option and another 26 states reporting they expect to do so.42
Details on these changes to eligibility standards, along with information about application and renewal process changes for FY 2010 and FY 2011 are described in Appendices A-4a and A-4b.
40 New Hampshire reported that requirements for verification of assets will likely be strengthened based on CMS audit findings. 41AL, IA, LA, NJ, and OR have SPAs approved for ELE; CO has submitted a SPA and KS reported that they plan to adopt ELE in 2011. 42 Four states indicated they had no plans to implement the automated match with the Social Security Administration and 4 states indicated that they did not know if the process had been implemented. This response was most likely to occur in states where the Medicaid director is not in the same agency as the Medicaid eligibility process.

00 41
C. Premium Changes
Federal rules limit the ability of states to impose premiums or enrollment fees upon Medicaid recipients. States are permitted to charge premiums to individuals accessing Medicaid coverage through an 1115 waiver program or through a Medicaid “buy in” program available to working individuals with disabilities without access to affordable employer-provided health coverage. The Federal Deficit Reduction Act of 2005, provided authority to states to charge premiums upon eligible children and families with household incomes above 150 percent of poverty.
State responses indicate little change in the use of premiums in recent years. The survey identified 59 Medicaid premium programs operated in 36 states, similar numbers to what was reported in FY 2009 (58 programs in 35 states). Four states indicated they had created a new Medicaid premium program in FY 2010 or planned to do so in FY 2011. States identified three Medicaid programs with premium increases and two programs with implemented or anticipated premium reductions.
Additional information on changes in FY 2010 or FY 2011 to premium programs by state is reported in Appendix A-4a and A-4b.
D. Copayment Requirements
Prior to the Deficit Reduction Act in 2005, federal law limited Medicaid copayments to nominal amounts, generally defined as $3 or less per service, and also prohibited states from applying copayments to certain services (e.g., emergency services) or certain eligibility groups (children and pregnant women). Subject to certain limits and exemptions, however, the DRA now provides new authority for states to charge greater than nominal cost-sharing for certain eligibility groups and most services and also vary the cost-sharing requirements by eligibility group. States may also now elect to make cost-sharing enforceable – that is, allow a provider to deny rendering services if the copayment requirement is not met.
Copayment requirements are used to varying degrees by most state Medicaid programs: a total of 45 states (including DC) have copayment requirements, including five states that impose copayments only on drugs. Only six states (Connecticut, Hawaii, New Jersey, Nevada, Texas and Washington) reported having no copayment requirements at all. Consistent with the findings from the 2009 survey, most states have not turned to new copayment requirements to help cope with worsening state fiscal conditions (although a modest uptick occurred from FY 2010 to FY 2011). Given the statutory limits, and the fact that providers are often unable to collect these copayments (resulting in reduced reimbursement to the provider that the
Figure 29
States Imposing New or Higher CopaymentsFY 2003 – FY 2011
17
20
89
2 3 2 1
5
2003 2004 2005 2006 2007 2008 2009 2010 Adopted 2011
Number of States
SOURCE: KCMU survey of Medicaid officials in 50 states and DC conducted by Health Management Associates, October 2004, 2005, 2006, and 2007 and September 2008, 2009 and 2010.

0042
state Medicaid program will not make up) some states may be reluctant to impose new or higher copayment requirements at a time when they are also freezing or reducing provider reimbursement rates. Other states may believe that they have gone as far as they can go for low income populations in using copayments as a cost control tool. Only one state in FY 2010 and five states in FY 2011 reported imposing new or higher copayment requirements (Figure 29). Three of these six states, however, imposed multiple new requirements (Table 2).
Table 2: New or Increased Copayment Requirements
Only one state, North Dakota, reported reducing or eliminating copayments in FY 2010 (reducing the copayment requirement on non-emergency use of the emergency room from $6 to $3 per visit). Two states reported plans to reduce or eliminate copayments in FY 2011: Delaware will eliminate its copayment on non-emergency transportation and Minnesota will reduce the copayment requirement on non-emergency use of the emergency room from $6 to $3.50 per visit.
In this year’s survey, no state reported using, or having plans to use, DRA authority to impose greater than nominal copayment requirements or to vary copayment obligations by eligibility group. Five states (Idaho, Indiana, Kentucky, Utah and Wisconsin) reported that copayment requirements were enforceable in FY 2010 for at least one eligibility group as allowed by the DRA (one more than in FY 2009). One state (Arizona) reported plans to take advantage of the DRA authority to make copayments enforceable in FY 2011.
State Requirements Implemented or Planned
Arizona New for prescription drugs ($2.30) New for non-emergency outpatient visits ($3.40) New for physical, occupational and speech therapy visits ($2.30) The following copayments will be made enforceable for the Temporary Medical
Assistance population: $4.00 for prescription drugs (generics or if a generic is not available); $10.00 for brand name prescription drugs; $30.00 for non-emergency use of the emergency room; and $5.00 per office visit.
Copayment requirements previously approved under Section 1115 waiver will be implemented for childless adults as a result of a court order lifting an injunction.
California Using waiver authority to impose new requirements (on both adults and children) for emergency department services, physician and clinic visits, prescription drugs, dental services and inpatient hospital services (contingent on both state budget resolution and CMS approval)
Massachusetts Increase for generic and over-the-counter drugs from $2.00 to $3.00 (with some exceptions)
North Carolina New for emergency room Oklahoma Inpatient hospital stays increased to $10.00 per day (up to a maximum of
$90.00 per stay) Most practitioners (including physicians, optometrists, and outpatient
behavioral health), home health visits and durable medical equipment increased to $3.00
Prescription drugs (except preferred generics) increased to $2.00 for scripts up to $29.99 and $3.00 for scripts equal to or greater than $30.00
Vermont Increased deductible and copayment requirements in Catamount Health program (under waiver authority)

00 43
E. Benefits Changes
The ARRA enhanced FMAP funds allowed many states to avoid or mitigate the severity of Medicaid benefit reductions that would otherwise have been enacted in FYs 2010 and 2011. Despite this fiscal relief, many states were forced to further reduce state Medicaid expenditures and turned to benefit reductions in many cases to do so. In fact, 20 states reported benefit reductions for FY 2010 – the largest number of states reporting benefit cuts in one year since the annual surveys began in 2001. Fourteen states reported plans for benefit reductions or restrictions in FY 2011 (Figure 30). A few states also mentioned the potential for additional mid-year reductions depending upon evolving state budget conditions and legislation at the federal level (still pending at the time of the survey) to extend the enhanced FMAP. One state (Virginia), reversed a planned cut in vision services for FY 2011 when the enhanced FMAP was extended by Congress in August 2010.
Benefit restrictions reflect the elimination of a covered benefit or the application of utilization controls for existing benefits. Of the 20 states in FY 2010 and 14 states in FY 2011 reporting cuts or eliminations, eight states in FY 2010 and four in FY 2011 reported one or more benefit eliminations in FY 2010 or FY 2011 as described in the Table 3. Fifteen states in each year (including some of the states listed in Table 3), applied more narrowly targeted limits or utilization controls to existing benefits as described in Table 4.
In addition to states reducing benefits, 15 states in FY 2010 and 16 states in FY 2011 also reported plans to expand benefits – similar to the number reporting expansions in FY 2009 (15) but somewhat fewer than in FY 2008 (19 states). These totals include eight states in FY 2010 and five states in FY 2011 restoring, expanding or adding mental health or substance abuse services, two states in FY 2010 and three states in FY 2011 that expanded coverage for smoking cessation or other preventive services, three states in FY 2010 and one state in FY 2011 restoring or expanding vision benefits, and two states in FY 2010 and four states in FY 2011 that are restoring or expanding dental benefits.
Additional information on changes in FY 2010 or FY 2011 to benefits by state is reported in Appendices A-5a and A-5b.
Figure 30
States Cutting or Restricting BenefitsFY 2003 – FY 2011
18 19
7
15
63
10
20
14
2003 2004 2005 2006 2007 2008 2009 2010 Adopted 2011
Number of States
SOURCE: KCMU survey of Medicaid officials in 50 states and DC conducted by Health Management Associates, October 2004, 2005, 2006, and 2007 and September 2008 , 2009 and 2010.

0044
Table 3: Benefit Eliminations by State
State FY 2010
Arizona Denture coverage and specified dental services
California Multiple optional services for non-pregnant, non-institutionalized adults including acupuncture,
dental ( with exceptions), audiology, speech, optometry, podiatry, psychology services and chiropractic services and incontinence creams and washes
Connecticut Over-the-counter drugs (OTCs) except insulin, insulin syringes, and nutritionals for tube fed individuals
Hawaii Dental coverage (except emergency services) New Hampshire Chiropractic care benefits
New Mexico Bariatric surgery. (The state also limited routine adult vision services and appliances) Oregon Non-medical vision services. (The state also reduced dental services and denture coverage)
Virginia Disease management program. (The state also expanded mental health and dental prior authorizations requirements)
FY 2011 Arizona Most dental care, podiatry services, insulin pumps, percussive vests, bone-anchored
hearing aids, cochlear implants, specified transplants, well exams, certain microprocessor-controlled prosthetics, all orthotics, and non-emergency transportation for childless adults (The state is also limiting outpatient physical therapy visits to 15 visits per contract year)
Kansas Attendant care provided in the local education agency setting. (The state is also limiting hospice services to 210 days)
Massachusetts Restorative dental services and dentures. (The state is also limiting coverage for most acute inpatient hospital stays to only the first 20 days)
North Carolina Obesity surgery, panniculectomy procedures, and maternal outreach worker program services. (The state is also imposing new coverage restrictions on breast surgery and personal care services and increasing its medical necessity standard)
Table 4: Benefit Limitations by Service Category and State
Benefits Limited 201043 2011
Chiropractic services – Minnesota Dental or denture services Minnesota, Ohio, Oregon, Virginia,
Washington New Jersey, New Mexico,
Washington Home health services Kansas –
Hospice – Kansas Imaging services Colorado, Iowa, Wyoming Vermont
Inpatient hospital stays – Massachusetts Medical supplies or DME Nevada, Ohio, Washington California, New Mexico, Virginia
Mental health services Nevada, Virginia Indiana Over-the-counter drugs New Jersey, Washington –
Occupational, physical or speech therapy – Arizona, New Hampshire, Vermont, Virginia
Personal care services Minnesota, Nevada, North Carolina, Washington DC, North Carolina, Washington
Physician visits – California Podiatry – New Hampshire
Targeted case management and Katie Beckett program eligibility Maine –
Vision services New Mexico, Wyoming
43 Illinois reported unspecified small quantity and durational limits.

00 45
Preventive Services. Section 4106 of the ACA provides states with a financial incentive to provide preventive services (identified by the U.S. Preventive Services Task Force) and adult vaccines without imposing cost sharing requirements. States that do so will receive a one percentage point increase in their FMAP for those services and vaccines beginning in January 2013. This year’s survey asked states whether they would qualify for this FMAP increase. The vast majority of states (35) answered “don’t know at this time”.
DRA Benefit Flexibility. Prior to the DRA, all states were required to cover a set of mandatory services and states could receive federal match for covering optional services including prescription drugs, dental care and personal care services. Generally, states had to offer the same set of services to all individuals covered by Medicaid in the state. The DRA allowed states to replace the traditional Medicaid benefits with “benchmark” plans and provided new flexibility that allowed states to vary benefits across beneficiary groups and across areas in the state. The DRA maintained Early Periodic Screening Diagnosis and Treatment (EPSDT) services as a wrap around for children.
Previous reports have described the DRA benchmark plans implemented by eight states44 in FY 2007 and FY 2008. No states, however, reported adopting a DRA benchmark plan in FY 2010 or plans to do so in FY 2011. Virginia, however, reported eliminating its disease management DRA benchmark plan in 2010. Also, West Virginia and Wisconsin reported amending their DRA Benchmark Plans in FY 2010 to expand EPSDT coverage and eliminate mental health service limits. Wisconsin also added non-emergency transportation coverage.
F. Long-Term Care and Home and Community–Based Services
Medicaid is the nation’s primary payer for long-term care (LTC) covering a continuum of services ranging from home and community-based services (HCBS), that allow persons to live independently in their own homes or in the community, to institutional care provided in nursing facilities and ICFs/MR-DD. Over the last two decades, states have steadily increased the amount of resources directed at HCBS options. This year’s survey suggests that this trend is continuing, but at a slightly slower pace than previously. Also, as is the case for acute care benefits, more states are implementing utilization controls and other reductions on LTC services to contain costs.
In FY 2010, 32 states took actions that expanded LTC services (primarily expanding HCBS programs), and 32 states planned expansions for FY 2011. This compares to 32 states taking actions to expand LTC services in FY 2009, 42 states in FY 2008 and 35 states in FY 2007.
44 West Virginia, Idaho, Kentucky, Virginia, Washington, Kansas, South Carolina and Wisconsin.
Figure 31
Long Term Care Policy Actions FY 2007 – FY 2011
35 4232 32 32
2007 2008 2009 2010 Adopted 2011
States with LTC Expansions / Enhancements
States with LTC Program Restrictions
7 8 8
1810
SOURCE: KCMU survey of Medicaid officials in 50 states and DC conducted by Health Management Associates, September 2009 and September 2010.

0046
Conversely, a total of 18 states in FY 2010 and 10 states in FY 2011 took action to constrain LTC services (compared to eight in FY 2009, eight in FY 2008 and seven in FY 2007) (Figure 31). In total for both years, 13 different states reported institutional reductions and 13 different states reported HCBS reductions.
The following section details state actions to both expand and control long-term care services in both institutional and community-based settings. This section also includes results from survey questions about certain DRA-related long-term care state options and new options under the ACA.
HCBS Programs. This year’s survey found that states are continuing to work on reorienting their Medicaid long-term care delivery systems towards more community-based services. States efforts to expand HCBS options for long-term care are driven by consumer demand, the United States Supreme Court decision in Olmstead v. L.C. in June 1999 that stated that the unjustified institutionalization of people with disabilities is a violation of the Americans with Disabilities Act, and an effort to control long-term care costs which represent a third of total Medicaid spending.
As in past years, the most commonly reported LTC expansion change in FY 2010 and FY 2011 was adopting new HCBS waivers or expanding existing waivers (including home and community-based services delivered through Section 1115 Research and Demonstration waivers). While still the most common action, the number of states reporting this type of expansion decreased to 23 in FY 2010 and 22 in FY 2011 compared to 27 in FY 2009 and 38 in FY 2008 suggesting that some states may be postponing additional balancing efforts due to difficult state fiscal conditions. Other examples of LTC expansions include adding additional services to an existing HCBS waiver and expanding PACE programs (Figure 32).45
States’ ability to impose certain HCBS restrictions is currently limited by the ARRA maintenance of eligibility (MOE) requirements. ARRA conditions receipt of the ARRA enhanced FMAP on maintenance of the eligibility standards, methodologies and procedures in effect on July 1, 2008. Because of the link between eligibility for Medicaid long-term care services and Medicaid eligibility generally, CMS has determined that the following actions will be considered violations of the ARRA MOE requirement:46
45 The “Program of all All-Inclusive Care for the Elderly” (PACE) is a capitated managed care benefit for the frail elderly provided by a not-for-profit or public entity that features a comprehensive medical and social service delivery system. It uses a multidisciplinary team approach in an adult day health center supplemented by in-home and referral service in accordance with participants' needs. 46 CMS State Medicaid Director Letter, SMD#09-005, ARRA#5. August 19, 2009.
Figure 32
Medicaid Long-Term Care Expansions, Implemented in FY 2008 – FY 2011
5
12
8
22
6
12
5
23
3
6
12
27
1
10
8
38
Enhanced Institutional
Services
Added Additional Services to
HCBS Waiver
Implemented or Expanded PACE
New or Expanded HCBS
Waiver
SOURCE: KCMU survey of Medicaid officials in 50 states and DC conducted by Health Management Associates, September 2009 and 2010.
FY 2008 FY 2009 FY 2010 Adopted FY 2011

00 47
Increasing stringency in institutional level of care determination processes that results in individuals losing actual or potential eligibility for Medicaid pursuant to institutional eligibility rules or in the special eligibility group for HCBS waiver participants under 42 CFR 435.217.
Adjusting cost neutrality calculations for section 1915(c) waivers from the aggregate to the individual, resulting in individuals being dropped from waiver coverage or hindered from moving out of an institutional setting.
Reducing occupied waiver capacity for section 1915(c) HCBS waivers.
Reducing or eliminating section 1915(c) waiver slots that were funded by the legislature but unoccupied as of July 1, 2008.
The ACA also contains an eligibility MOE provision that requires states to maintain eligibility for adults until January 1, 2014 and for children in Medicaid and CHIP until October 1, 2019. Further guidance is needed to determine if CMS will construe the ACA MOE provision to prohibit the same HCBS actions as the ARRA MOE.
While most states already have limits in place for their community-based services such as coverage limits, enrollment caps, and waiting lists for services, this year’s survey found that nine states in FY 2010 and six states in FY 2011 imposed additional restrictions directed at HCBS programs and services (compared to only two states in FY 2009). These reductions and restrictions are described in Table 5. Also, four states in FY 2010 and three states in FY 2011 are making reductions to personal care services (which are included and counted under section “E. Benefit Changes” in Table 4).

0048
Table 5: HCBS Reductions and Restrictions
State FY 2010 Reductions and Restrictions Colorado Imposed state level prior authorization on non-medical transportation
Florida Terminated an Alzheimer’s Disease waiver
Kansas Restricted oral health, assistive technology, comprehensive support and sleep cycle support services and also reduced personal service hour limits
Louisiana Implemented an evidence-based resource allocation system for its waiver for persons with
developmental disabilities and reduced the average person cost (which allowed more people to be served coverage).
Minnesota Reduced budget allocations for low needs enrollees in the elderly waiver
New Jersey Revised the medical necessity criteria for Medical Day Care Services so that the need for physical
therapy, occupational therapy, speech therapy or medication management alone is no longer sufficient to satisfy prior authorization criteria.
New Mexico Reduced respite service hours and environmental modification expenditures and eliminated reimbursement for the installation of emergency response devices
North Carolina Applied utilization controls to community support services South Carolina Decreased the number of aged and disabled waiver slots to 2007- 2008 levels
FY 2011 Reductions and Restrictions Iowa Imposed prior authorization on certain HCBS services including home and vehicle
modifications Missouri Plans to cap Adult Day Health Care services to five days per week
New Hampshire
Is reducing the number of persons served in its long-term care programs
North Carolina
Is eliminating community support services
South Carolina
Plans to cap its HIV/AIDs waiver slots at 2007-2008 levels
Virginia Is planning to reduce allowable respite care hours
Institutions. Six states in FY 2010 and five states in FY 2011 took positive action to remove restrictions on, or enhanced, institutional services. In FY 2010, Arkansas implemented “homestyle” as a nursing facility type (and modified reimbursement rates to accommodate this change) and also implemented an enhanced care add-on for ICF/MR facilities; Georgia implemented a nursing facility quality enhancement initiative; Illinois modified its nursing facility reimbursement system to reflect the costs of caring for ventilator dependent patients; Michigan liberalized its certificate of need policy for nursing facilities associated with a medical school; Mississippi liberalized its bed-hold47 policy for dialysis and chemotherapy treatment outside of a nursing home, and New York increased the availability of Medicaid assisted living by adding nursing home beds. In FY 2011, Alabama and Georgia reported plans to modify their nursing facility reimbursement systems to reflect the costs of caring for ventilator dependent patients; California plans to implement a nursing facility pay-for-performance model; Michigan plans to increase its coverage of Medicare cross-over claims and Utah said it will approve a new ICF/MR-DD facility.
In FY 2010, 13 states implemented cost controls related to institutional placements (compared to only six in FY 2009) and four of these states are planning additional reductions in FY 2010. Examples include: 47A bed hold day is defined as a day when the resident is not in the facility and has exhausted the allowable Medicaid leave days and the facility holds the bed for their return.

00 49
Efforts to reduce the size of or close state-owned Mental Health/Mental Retardation facilities (Louisiana, Massachusetts, Oregon and Texas);
Increasing minimum occupancy standards to reduce the number of nursing home beds (Indiana);
Reductions in payments for bed-holds (New Jersey, New Mexico and New York);
Reductions in Medicare cross-over claims payments (Missouri and Nebraska);
Increases in level of care standards for nursing facilities compared to HCBS waiver placements (Rhode Island);48
Elimination of coverage for certain high risk intervention group homes for children (North Carolina); and
New limits on private non-medical institutional care (Maine).
Other LTC Actions. A few states also reported other LTC policy initiatives underway to improve the delivery of LTC services and increase community-based alternatives. These initiatives are not counted as institutional or community-based expansions or restrictions in this survey, but were additional LTC actions reported by the states. State policies included the implementation of institutional quality enhancement reviews; initiatives to implement or expand Aging Disability Resource Centers, development of a uniform assessment system to address statewide consistency for authorization of HCBS services; and investments to develop new community providers. Finally, seven states in FY 2010 (California, Florida, Massachusetts, New York, Oregon, Tennessee, and Wisconsin) and six states in FY 2011 (Illinois, New York, Rhode Island, Tennessee, Texas and Wisconsin) have or will implement or expand LTC managed care programs.
Long-Term Care Partnership Programs. LTC Partnership Programs established by the Deficit Reduction Act (DRA) are designed to increase the role of private long-term care insurance in financing long-term care services by allowing persons who purchase qualified long-term care insurance policies to shelter some or all of their assets when they apply for Medicaid after exhausting their policy benefits. Twenty-nine49 states reported having in place a Long-Term Care Partnership Program before FY 2010; two states (Louisiana and Maine) reported implementing a program in FY 2010; four states (Illinois, Vermont, Washington, and West Virginia) indicated that they were planning to implement a program in FY 2011 (which would bring the total implementing to about two-thirds of all states); nine states reported no plans to implement and six states responded “don’t know.”
The ACA included a number of new long-term care options described in the box below.
48 This change was permissible under the MOE requirements of ARRA because the legislation was adopted in the legislative session prior to the MOE requirements. 49 Four of the 29 states that reported having plans in place before FY 2010 (California, Connecticut, Indiana and New York) have had demonstration model programs underway since 1992 and did not utilize DRA authority.

0050
Key ACA Provisions Affecting Long-Term Care
HCBS State Plan Option. The DRA gave states a new option to offer home and community-based services through a Medicaid State Plan Amendment rather than through a 1915(c) waiver. Responding to low state take-up, effective October 1, 2010, the ACA builds on the DRA authority by expanding eligibility under this option to individuals with incomes up to 300% of the maximum SSI payment and by making a number of other changes to address state concerns. However, the ACA also eliminated the states’ ability to cap enrollment or maintain a waiting list. Only four states (Colorado, Iowa, Nevada and Maine) reported having the HCBS State Plan option in place prior to FY 2010.
State Balancing Incentive Payments Program. Beginning in October 2011, the program makes additional Medicaid matching funds available to states that meet certain requirements for expanding the percentage of long-term care spending for HCBS (and reducing the percentage of long-term care spending for institutional services). To qualify, a state must explain how it will expand and diversify HCBS and be approved for funding by CMS.
Community First Choice (CFC) Option. Beginning in October 2011, states electing this state plan option to provide Medicaid-funded home and community-based attendant services and supports will receive an FMAP increase of six percentage points for CFC services.
Money Follows the Person (MFP) Rebalancing Demonstration. The ACA continues the existing MFP grant funding50 for states for another five years and also reduces the length of time a person is required to reside in an institutional setting before they are eligible to participate in this program (previously at least six months, but now at least 90 consecutive days).
Community Living Assistance Services and Supports Program (CLASS). ACA establishes a national, voluntary insurance program for purchasing community living services and supports known as the CLASS Act. CLASS is designed to expand options for people who become functionally disabled and require long-term care services and supports. Adults with multiple functional limitations, or cognitive impairments, will be eligible for benefits if they have paid monthly premiums for at least five years and have been employed during three of those five years. Adults who meet eligibility criteria will receive a cash benefit to purchase non-medical services. The amount of the cash benefit is based on the degree of impairment or disability, averaging no less than $50 per day. CLASS is financed by voluntary premium contributions paid by working adults, either through payroll deductions or direct contributions. If an individual is eligible for both CLASS program benefits and long‐term care services and supports under Medicaid, CLASS benefits will be used to offset the costs of Medicaid. However, consumers will be permitted to retain 50 percent of the cash benefit if they are receiving Medicaid HCBS and 5 percent if they are receiving Medicaid institutional services. The effective date of the CLASS program is January 1, 2011. The HHS Secretary is expected to define the CLASS benefit by October 2012 with enrollment to begin subsequently. Because of the five-year vesting requirement, the first CLASS program payouts will not occur until 2017.
50 A total of 30 states and DC were awarded MFP grants in 2007 totaling $1.4 billion to reduce reliance on institutional care by transitioning individuals from institutions to the community. The demonstration program provides an enhanced FMAP (75-90%) for an individual’s costs for 12 months from the date of institutional discharge.

00 51
The survey asked states about implementation of the HCBS State Plan Option and also whether they were interested in taking advantage of the new long-term care options in the ACA when they became available. Two states (Wisconsin and Washington) reported implementing the HCBS State Plan Option in FY 2010, and six states indicated plans to implement this option in FY 2011 (California, Georgia, New Jersey, North Carolina, Oregon, and Texas).
Many states did not know if they would apply for the State Balancing Incentive Payment Program or the Community First Choice Option (CFC) likely reflecting, in part, the lack of CMS guidance at the time of the survey. However, among those that had looked at these programs, 18 states reported that they were going to apply or possibly going to apply for the balancing incentive program, and 16 states responded similarly for the CFC option. This year’s survey also asked states to indicate whether they planned to extend a current MFP grant or planned to apply to become a new MFP grantee. Twenty-nine states indicated that they would apply for an extension and 7 states responded that they would apply as a new grantee. Only two current grantees indicated that they would not apply for an extension. Another five states responded that they would not apply as a new grantee.
G. Prescription Drug Utilization and Cost Control Initiatives
To control spiraling drug costs, the vast majority of states dramatically reformed their pharmacy benefit programs between 2001 and 2005 by adopting or enhancing preferred drug lists (PDLs), prior authorization programs, supplemental rebate programs, state maximum allowable cost (“state MAC”) programs and other cost containment measures. While the implementation of the Medicare drug benefit in 2006 reduced direct Medicaid drug spending by nearly half (as dual eligibles shifted from Medicaid to Medicare coverage), states have continued to refine and enhance their pharmacy programs.
The survey identified the number of states that had certain pharmacy cost containment measures in place at the beginning of the survey period. At the beginning of FY 2010, the number of states reporting measures in place was unchanged from FY 2009 for most categories except two additional states reported having prior authorization programs in place in FY 2010 and one less state reported having a PDL in place in 2010 (Figure 33).51
51 Hawaii reported discontinuing its PDL and supplemental rebate program in FY 2009. Oregon reinstated its supplemental rebate program in FY 2009.
Figure 33
Medicaid Pharmacy Cost Containment Measures in Place in FY 2010
16
26
44
44
44
48
Script limits
Multi-state Purchasing Coalition
State MAC Program
Supplemental Rebates
Preferred Drug List
Prior Authorization (outside PDL)
SOURCE: KCMU survey of Medicaid officials in 50 states and DC conducted by Health Management Associates, September 2010.

0052
Thirty-eight states in FY 2010 and 30 in FY 2011 implemented cost-containment initiatives in the area of prescription drugs, comparable to the numbers in FYs 2009 and 2008. As has been true in past surveys, the majority of actions reported were additions, expansions or refinements of existing prior authorization programs, PDLs, supplemental rebate programs, and state MAC programs. In 2010, however, Nebraska implemented a new PDL program, while Nebraska and North Carolina both implemented new supplemental rebate programs and reported plans to join a multi-state purchasing pool. Also, new state MAC programs were implemented in DC and Rhode Island in FY 2010 and were planned in FY 2011 for Alaska and New Jersey. Compared to 2009, however, there were fewer states reporting reductions for each category except for a small increase in the number of states reporting dispensing fee cuts and cuts to ingredient cost reimbursements in FY 2010 (Figure 34).
Several states reported other types of pharmacy cost containment measures for FY 2010 and FY 2011 including: six states (Kansas, Kentucky, Maine, Mississippi, Virginia, and Wisconsin), imposed more restrictive quantity or refill limits; four states (Arizona, California, Massachusetts and Oklahoma) increased drug copayment requirements; four states (Indiana, Michigan, Missouri and Ohio) that carved pharmacy benefits (or additional drug classes) out of their managed care contracts; four states (North Carolina, New Hampshire, Pennsylvania and Wisconsin) implemented efforts that focus on specialty pharmacy products; three states (California, Georgia and South Carolina) reduced reimbursement to physicians for physician administered drugs; two states (Massachusetts and Wisconsin) added preferred medical supplies (including diabetic test strips) to the PDL, two states (South Carolina and Washington) implemented utilization controls on mental health drugs prescribed for children; Rhode Island implemented a generic first dispensing policy; New Jersey reduced capitation rates to long-term care pharmacies; Washington implemented a case management program for clients using narcotics; Kentucky initiated pharmacy audits, planned to impose prior authorization when a prescriber is not enrolled as a Medicaid provider, and tightened the over-the-counter drug formulary; and Wisconsin is requiring the dispensing of a 100-day supply.
Finally, a number of states reported pharmacy-related expansions or reversals of previous pharmacy cost containment actions including increasing dispensing fees (Alabama, Alaska,
Figure 34
Medicaid Prescription Drug Policy Changes FY 2009 – FY 2011
2
2
6
10
8
1
7
10
11
11
3
4
8
16
15
Script Limits
Reduced Dispensing Fee
AWP Less Greater Discount
More Rx Under Prior Authorization
New or Lower State MAC Rates
SOURCE: KCMU survey of Medicaid officials in 50 states and DC conducted by Health Management Associates, September 2009 and 2010.
FY 2009 FY 2010 Adopted FY 2011

00 53
Connecticut, Michigan, Montana, Oregon), increasing ingredient cost reimbursement (North Carolina and South Carolina), discontinuing a state MAC program (Oregon), withdrawing from a multi-state purchasing pool (Georgia), eliminating a limit on monthly prescriptions for children (West Virginia), implementing a generic incentive fee (Missouri), adding coverage for smoking cessation products (Tennessee), and implementing a medication therapy management program that includes cognitive service payments to pharmacies (Wisconsin).
Key ACA Changes Affecting Pharmacy Rebates
Rebate Amounts. The ACA includes provisions impacting Medicaid pharmacy rebates including new mandatory minimum rebate amounts. Prior to the ACA, federal law required pharmaceutical manufacturers to provide rebates on drugs purchased through state Medicaid programs. Those rebates were shared by the federal government and each state based on each state’s individual federal Medicaid matching rate.52 Many states had also negotiated additional supplemental rebates which were shared between the federal government and the states in the same manner. The ACA increased the federally required minimum rebate amount, but provided that the amount of the increase would be payable 100 percent to the federal government instead of being shared with the states. For states with supplemental rebate programs, this results in a loss of rebate revenue.
Managed Care and Rebates. The ACA also allows states for the first time to collect rebates on drugs purchased for Medicaid recipients by managed care organizations operating under capitated arrangements. Whether a state will benefit from this provision will depend on whether the state has capitated managed care arrangements, and if so, whether prescription drugs are currently “carved-in” or “carved-out” of those arrangements.
This year’s survey asked states whether the ACA pharmacy rebate changes were expected to have an overall positive, negative or neutral fiscal impact. About half of the states expected the pharmacy rebate changes under the ACA to have a negative fiscal impact, while nine states expected the changes to have a positive fiscal impact. Although the ACA rebate provisions have already taken effect, a number of states cited the need for additional CMS guidance before they would be able to fully evaluate the fiscal impact. The survey also asked states whether the new ACA authority to collect rebates on managed care prescriptions would be likely to cause a state to “carve-in” pharmacy benefits to its managed care arrangements. Two states reported plans to implement new managed care programs that include “carved-in” pharmacy benefits.53 Eight states answered “no.” The remaining states indicated that drugs were already carved in or that the new requirement was “not applicable” due to the lack of capitated managed care in the state.
See Appendices A-6a and A-6b for more detail on pharmacy cost containment actions.
52 For example, a state with a 60 percent FMAP (Federal Medical Assistance Percentage) would retain 40 percent of the rebate and the federal government would retain 60 percent. 53 Illinois reported plans to implement an integrated care pilot and Mississippi is implementing the Coordinated Access Network.

0054
4. Delivery System Changes, Quality Initiatives
Key Section Findings: States continue to adopt policies to manage and coordinate care. Thirteen states in FY 2010 and 20
states in FY 2011 implemented or plan to expand managed care by expanding service areas, adding eligibility groups, requiring enrollment into managed care or implementing managed long-term care initiatives. Sixteen states in FY 2010 and 13 states in FY 2011 are implementing new or expanded disease management programs. States are also moving forward with new medical home models as well as initiatives to care for those dually eligible for Medicare and Medicaid.
Medicaid programs continue to develop and expand initiatives to measure and improve quality across delivery systems. States use HEDIS and CAHPS as well as other measures to rate plan and provider performance and structure programs to incentive quality such as pay for performance.
The ACA includes a number of provisions related to improving care delivery in Medicaid such as a new Health Home option to provide enhanced funding for coordination of care activities for individuals with chronic care needs; the creation of the CMS Innovation Center to test payment and delivery models, the creation of the Federal Coordinated Health Care Office within CMS to improve coordination between the Medicare and Medicaid programs on behalf of dual eligibles and several demonstration and grant programs.
States also continue to expand the use of health information technology (HIT) activities to improve efficiency, costs, quality and patient safety. States have a major role in the adoption and meaningful use of electronic health records (EHRs) and health information exchanges (HIEs) aided by new federal funding that was included in the ARRA. Nearly all states have received CMS approval for enhanced Medicaid funding (at a 90 percent match) to conduct planning for the EHR Incentive program.
A. Delivery System Changes
Managed Care. In contrast to trends in the commercial market, managed care continues to thrive in Medicaid. In 2010, managed care plans accounted for a 19 percent share of commercial insurance, down from 25 percent in 2004.54 Meanwhile, enrollment in managed care among Medicaid enrollees continues to increase. According to CMS, the proportion of Medicaid enrollees in any form of managed care has increased to 71 percent. The number of Medicaid enrollees in comprehensive health plans nationally increased by 2.4 million to over 23 million over the year ending in June 2009, and the number in state-operated Primary Care Case Management Programs increased by over 600,000 to 7.3 million over the same annual period. A total of 34 states contract with comprehensive health plans and 30 states have a PCCM. These counts include 16 states plus the District of Columbia that only contract with HMOs; 12 states with only a PCCM program; and 18 states with both HMOs and a PCCM.
54 Employer Health Benefits 2010 Annual Survey, Kaiser Family Foundation, 2010. http://ehbs.kff.org/

00 55
All states except Alaska and Wyoming have at least some Medicaid enrollees in at least one form of managed care. The most prevalent form of managed care in Medicaid is prepaid, capitated at-risk HMOs operating as licensed health care delivery systems. These systems must meet a number of stringent federal regulatory requirements, including standards for adequacy of a provider network that must be geographically accessible to Medicaid enrollees, standards for the quality of providers and requirements for credentialing, documenting timeliness of appointments and for primary and specialty care, and for data on access, care provided, rates of utilization and the quality of care. Managed care organizations must demonstrate quality improvement, and the state must contract with an external quality review organization to audit health plan records to ensure that the data and the care meet standards of high quality. Reimbursement is capitated, and federal rules require that the capitation payments be paid at a level that is “actuarially sound.”55
Medicaid managed care also includes Primary Care Case Management (PCCM) programs, which are systems of care organized and managed by the Medicaid agency itself or a contractor. PCCM programs vary from state to state, but all seek to assure a medical home with a primary care provider (PCP) and to provide structure to the delivery system that allows for the measurement, monitoring and improvement of quality of care. The PCP is usually paid a small per member, per month case management fee, but other services are usually paid on a fee-for-service basis. Some states have developed partial capitation models for their PCCM that bundle primary care services within a single rate. The most advanced are “Enhanced PCCM,” models that generally have incorporated many of the care coordination, care management, medical home and quality improvement features of a licensed managed care organization.
Medicaid programs continue to develop, expand and improve their managed care programs. In FY 2010, a total of 13 states expanded service areas, added eligibility groups to managed care, required enrollment into managed care or implemented new long-term care managed care programs. For FY 2011, a total of 20 states (including six states in the FY 2010 group) adopted such policies (Figure 35). The most common managed care policy changes involved adding counties to existing service areas, adding the “Aged, Blind and Disabled” (ABD) eligibility group into managed care, and changing requirements so enrollment in managed care is mandatory rather than voluntary for specific groups such as the ABD category. However, mandatory enrollment of dual eligibles in managed care is prohibited.
55 Federal requirements for Medicaid managed care, including payment rates, quality assessment and performance improvement, external quality review, protections for persons enrolled in managed care, state contracts with managed care organizations, and other requirements, are found at 42 CFR 438.
Figure 35
Medicaid Managed Care Changes FY 2009 – FY 2011
19
9
6 7 6
13
4 35
7
20
8
11
6 6
Any of these Changes
Expanded Service Areas
Added Eligibility Groups
Added Mandatory Enrollment
Long-Term Care Managed Care
Note: Changes to long-term care managed care not asked in 2008 survey.
SOURCE: KCMU survey of Medicaid officials in 50 states and DC conducted by Health Management Associates, 2009 and 2010.
Number of States
FY 2009 FY 2010 Adopted FY 2011

0056
Long-Term Care Managed Care. Many states are examining strategies to integrate acute and long-term care within an organized managed care delivery system. States are undertaking a number of initiatives to organize and coordinate care for this population. In California, some health plans have expanded to incorporate LTC. In Illinois, the “Integrated Care Delivery System” is including clients in long-term care. In Texas, the Star-Plus program, which manages both long-term and acute-care, is being expanded to include additional counties. Altogether, seven states in FY 2010 and six in FY 2011 listed initiatives related to managing care for those in long-term care. In addition, several states are expanding sites for the Program for All-Inclusive Care for the Elderly (PACE).
Initiatives for Dual Eligibles. States continue to explore methods to control cost and improve the structure of Medicaid coverage to individuals dually eligible for Medicaid and Medicare services. State efforts to impact this population are constrained by the fact that Medicaid is typically not the primary payer for health services to dual eligibles and dual eligibles tend to have higher health care needs than other Medicaid populations. State responses suggest continued interest in exploring new methods for structuring coverage for dual eligibles. Thirteen states reported current development of changes in payment or delivery systems for dual eligibles. These efforts tend to focus upon program changes that would permit greater integration of payment, service delivery and administration of health services between Medicare and Medicaid.
The Medicare Modernization Act of 2003 created a new managed care option for Medicare recipients with greater health needs. New Medicare Advantage plans called Special Needs Plans (SNPs) would be available to Medicare recipients who are institutionalized, suffer from a severe or disabling chronic condition or who are dually eligible for both Medicare and Medicaid. In 2010, twenty-two states reported that they contracted with a Medicare Advantage SNP to provide coverage to dual eligibles. In 2011, the number of states contracting with SNPs is anticipated to grow to twenty-five. The ACA reauthorizes SNPs through 2013 and maintains through 2012 the current moratorium on geographic expansion by dual eligible SNPs that do not have Medicaid contracts. At that time, all dual eligible plans operating in a state must have contracts with the state Medicaid agency.
Two new centers created by ACA have implications for dual eligibles. First, ACA establishes the Federal Coordinated Health Care Office within CMS to align Medicare and Medicaid financing, benefits administration, oversight rules and policies for duals. ACA also establishes within CMS a new Center for Medicare and Medicaid Innovations to test, evaluate, and expand in Medicare, Medicaid and CHIP different payment structures and service delivery models that foster patient-centered care, improve quality, and slow cost growth. The law states that CMS shall "give preference to models that also improve the coordination, quality and efficiency" of care for Medicare beneficiaries, Medicaid beneficiaries, and dual eligibles. The initiatives that evolve from these two Centers have the potential to achieve a level of coordination between Medicaid and Medicare that was not possible under previous law.

00 57
Medical Homes. For three decades, Medicaid programs have used the term “medical home” in the context of HMOs and PCCM programs. One of the goals of managed care has been to assure that every Medicaid patient was connected to a primary care provider who provided a medical home. As defined in practice, a medical home has come to mean a place the patient could count on 24 hours a day for primary and preventive care and for coordination of specialty care. Over the years, Medicaid programs have set standards for availability, access and quality. In recent years, the term “medical home” has taken on a more specific meaning, with more rigorous standards and expectations. The National Committee on Quality Assurance (NCQA) has established a “Physician Practice Connections® - Patient Centered Medical Home™” program which sets specific benchmarks for providers and recognizes those who meet the standards as medical home providers.56 The interest in medical homes extends across all health insurers and payers, and Medicaid is participating in medical home pilots or programs in at least a dozen states.57
A modern definition of a “patient centered medical home” emphasizes assurance of primary care and a long-term, stable relationship between provider and patient, the provision of “person-focused” coordinated and comprehensive care. It includes elements of quality such as the use of electronic medical records and electronic prescribing, pro-active case management, patient education, measurement and reporting on performance and reimbursement incentives that reward increased quality of care.
Over the past year, a number of states have examined the potential of developing or enhancing a medical home policy or program in Medicaid. In this survey, a dozen states listed specific activities targeted at developing or recognizing medical homes in Medicaid. California, for example, included a medical home in its latest Medicaid waiver proposal. New York has incentive payments for providers meeting the standards set by the agency. Florida looked at the medical home options in depth pursuant to legislative language establishing a task force for this purpose.58 The Maryland Health Quality and Cost Council is developing recommendations for a medical home initiative. Other states are also looking at developing reimbursement methodologies or otherwise recognizing medical homes. Those indicating in this survey that they were implementing specific medical home initiatives include Iowa, Illinois, Massachusetts, Nebraska, North Carolina, Oregon, Tennessee, Texas, Utah and Wisconsin.
The ACA established the “State Option to Provide Health Homes for Enrollees with Chronic Conditions” effective January 2011. The option provides 90% match for health home services (such as care management, care coordination and health promotion). A total of 33 states indicated that they likely will elect to establish health homes under this new authority, with an additional 16 states indicating that it was too early to know yet if they would adopt the option and they were awaiting further guidance from CMS.
56 NCQA. See: http://www.ncqa.org/tabid/631/Default.aspx 57 National Academy for State Health Policy, “State Involvement in Multi-Payer Medical Home Initiatives,” November 2009. See: http://www.nashp.org/sites/default/files/MedHomes_State_Chart_11-2009.pdf 58 For the report of the Florida Medical Home Task Force see: http://ahca.myflorida.com/Medicaid/deputy_secretary/recent_presentations/medical_home_tf/medicaid_medical_home_task_force_report_020110.pdf

0058
Disease and Care Management. A core competence of Medicaid programs is the care of persons with complex medical situations and chronic conditions and diseases. Data show that a relatively small proportion of Medicaid beneficiaries account for a relatively large share of Medicaid costs. About half of all Medicaid spending is for less than five percent of Medicaid enrollees with much of this spending focused on individuals with chronic conditions. The goal of disease management and care management programs is to assure appropriate care, improve quality and to assure that Medicaid funds are being used wisely in the care of individuals with specific conditions. The programs began as special programs to provide case management for individuals with specific diagnoses. Over time, programs have evolved to provide more comprehensive chronic care management that spans specific diseases and considers the whole person and all conditions. Several states have integrated these programs into broader integrated care programs or incorporated them into the Medicaid contracts for capitated health plans. Over both FY 2010 and FY 2011, a total of 23 states indicated that they were implementing or had implemented new policies or programs for disease management or care coordination. These included 16 states in FY 2010 and 13 states in FY 2011 (with four states included in both years) (Figure 36). Consistent with a trend to incorporate the disease management function in broader care coordination, four states were moving to include the disease management function within the requirements of managed care organizations with whom they contract. The Illinois integrated Care Delivery System, for example, now specifies that MCOs will be responsible for all aspects of an enrollee’s care, including disease management, care management and chronic care management. Montana changed to a partnership with community health centers to manage high cost and high risk care. In Texas, a new health management program will replace the current disease management program.
Other states, such as Oregon and Pennsylvania, were expanding the scope of disease management within integrated care delivery systems or expecting a more comprehensive set of services focused on the whole person, including co-morbidities, without regard to a specific disease. Indiana is moving its PCCM program toward a disease management focus. Iowa expanded the scope if its care management program. In Massachusetts, two pilot programs were initiated to expand care and disease management programs to persons with HIV and to the severely disabled. In South Dakota, the Medicaid program added one FTE for case management of high cost cases. Wisconsin is examining a new program for persons not in managed care, with particular focus on high risk individuals, including women who are pregnant, persons who are high users of the emergency room for pain management and persons using mental health services. On the other hand, Nebraska and Virginia ended a disease management program.
Figure 36
New or Expanded Medicaid Disease Management or Care Management Initiatives
FY 2009 – FY 2011
12
16
13
2009 2010 Adopted 2011
SOURCE: KCMU survey of Medicaid officials in 50 states and DC conducted by Health Management Associates, 2009 and 2010.
Number of States

00 59
Key ACA Provisions Related to Medicaid Care Delivery Systems and Quality
Health Home Option: ACA established the “State Option to Provide Health Homes for Enrollees with Chronic Conditions” effective January 2011. The option provides a 90% match for health home services (such as care management, care coordination and health promotion). A total of 33 states indicated that they likely will elect to establish health homes under this new authority, with an additional 16 states indicating that it was too early to know yet if they would adopt the option and they were awaiting further guidance from CMS. CMS Innovation Center (CMI). The CMI is a center established January 2010 designed to test, evaluate, and expand in Medicare, Medicaid and CHIP different payment structures, and methodologies to foster patient-centered care, improve quality, and slow cost growth. The CMI has explicit authority to allow states to test and evaluate integrated care for dual eligibles. Federal Coordinated Health Care Office (FCHCO). The FCHCO was established March 1, 2010, within CMS to align Medicare and Medicaid financing, benefits administration, oversight rules and policies for dual eligibles. Demonstration and Grant Authority. ACA included a number of new demonstrations and grants focused on service delivery and payment reform. Medicaid Integrated Care Hospitalization Demonstration Program: Up to eight states will be selected to use bundled payments to promote integration of care around hospitalization. Medicaid Global Payment System Demonstration: Up to five states will be selected to test paying a safety net hospital system or network using a global capitated payment model. Pediatric Accountable Care Organization Demonstration Project: Will allow pediatric providers to organize as accountable care organizations (ACOs) and share in federal and state Medicaid cost savings. Medicaid Emergency Psychiatric Demonstration Project: Will provide Medicaid payments to institutions for mental diseases (IMDs) for adult enrollees requiring stabilization of an emergency condition. Medicaid Chronic Disease Incentive Payment Program: Will provide states grants to test approaches that encourage behavior modification for healthy lifestyles. Medicaid Quality Measurement Program. ACA establishes a new program to develop and advance quality measures for adults in Medicaid. A similar initiative for children was included in CHIPRA.
Demonstrations and Grants in ACA. ACA created a number of demonstrations and grants related to service delivery and payment reform. This year’s survey asked states about their likelihood of applying for these grants. Specific Medicaid opportunities in ACA include integrated care with bundled payments to hospitals, global payments for safety net hospitals, pediatric accountable care organizations, payments for psychiatric emergency stabilization in institutions for mental disease and incentive payments to reduce chronic disease and encourage healthy lifestyles. Because CMS had not issued guidance related to these grant opportunities at the time of the survey, most states responded that they did not know if they would apply. Other states commented on the lack of state administrative resources to pursue demonstration opportunities.
The ACA grant opportunity garnering the greatest state interest was the Chronic Disease Incentive Payment Program with 26 states indicating that they were “very likely” or “somewhat likely” to apply. One state official noted that his state was “very positive” about all the demonstration opportunities and would apply for as many as possible. Another state official referred to the demonstrations as “natural steps for us.” Finally, another state official commented that the state had added a “payment reform director” position responsible for looking at reform options and at multi-payer strategies.

0060
B. Quality and Quality Improvement Initiatives
In recent years, a primary focus of Medicaid programs has been on measuring the quality of care provided to those receiving care through Medicaid across delivery systems, including managed care organizations – both HMOs and state operated PCCM programs – as well as care provided in the fee-for-service system. The attention to quality in Medicaid has paralleled a similar interest among commercial payers and has been facilitated by information technology tools for data collection and analysis as well as by the development of a range of measures for almost all aspects of health care delivery and outcomes. In recent years, efforts have been made to develop measures specific to the interests of Medicaid and the populations it serves. Medicaid programs are now able to set standards, and assess quality, quality improvements and health plan performance in a way never previously possible, and to use the information to structure reimbursement, bonuses and other program policies to achieve improved outcomes.
Health Plan Performance: States that contract with managed care organizations use the Healthcare Effectiveness Data and Information Set (HEDIS®), a standard set of benchmark measures developed by the National Committee on Quality Assurance, or other measures designed at the state level to address specific policy priorities. HEDIS® measures were developed first for the commercially-insured population but have been adapted now to focus more specifically on populations served by Medicaid. States typically choose a subset of the HEDIS® measures for Medicaid populations, such as well-child EPSDT visits, immunization status, prenatal and postpartum care, breast or cervical cancer screening, management of antidepressant medications or comprehensive diabetes care. Data for these measures is derived from the database for paid claims and from a review of medical charts. Some Medicaid programs have developed their own HEDIS-like measures to address state-specific policy priorities. Medicaid health plans that are accredited by NCQA report performance for 26 HEDIS® measures.59
HEDIS® or HEDIS-like measures were used by 46 states and the District of Columbia in FY 2010 and 2011 to monitor quality of care for individuals served in managed care, including HMOs or state-administered Primary Care Case Management programs, or in fee-for-service.60 Two states, Alabama and Connecticut, began use of these measures in 2010 (Figure 37).61
59 National Committee for Quality Assurance. Accessed September 7, 2010: http://www.ncqa.org/tabid/855/Default.aspx. 60 The use of HEDIS® or HEDIS® - like measures by type of plan was addressed in last year’s survey. The following is from the 2009 report: Of 43 states reporting use of HEDIS® or like measures in 2009, 36 states used them for health plans, 22 states for PCCMs or fee-for-service; 15 states with both MCOs and PCCMs or FFS, and seven states only with PPCMs or FFS. 61 Idaho, Mississippi, North Dakota and South Dakota did not report that they used HEDIS measures.

00 61
Surveys of Patient Experience: Medicaid programs also conduct surveys to determine the consumer perspective on health care quality, access and other indicators of patient satisfaction. The most commonly used tool is the Consumer Assessment of Healthcare Providers and Systems (CAHPS®). The federal Agency for Healthcare Research and Quality (AHRQ) developed CAHPS® to measure consumer experiences with health plans and health care providers. Medicaid agencies sometimes adapt the survey to focus on specific issues of interest in that state; however, when surveys are conducted in accordance with CAHPS guidelines, the data can be submitted by states or health plans to a national database and compared with national benchmarks.
A total of 42 states and the District of Columbia reported that they conduct surveys of patient experiences with the health care they received, the timeliness and accessibility of appointments for primary care providers and for specialists, and their satisfaction with the care they received in FY 2010 and 2011. States often conduct these surveys on a cycle of every two or three years.62
Public Reporting of Health Plan Performance: All Medicaid programs that collect HEDIS and CAHPS data use it for internal analysis, to ensure compliance with program requirements and to reward or penalize plans based on their performance. Increasingly, states also publish information on health plan performance. In some states, HEDIS®, CAHPS® and other data on performance of health plans and Medicaid providers is used to create a report card distributed to Medicaid enrollees when they choose a health plan. In other states the information is on a website or in annual reports. A total of 41 states indicated in this survey that they report information, as well as use the information for analysis and determination of areas needing improvement, the calculation of bonus payments based on performance and sanctions when performance benchmarks are not met, and as criteria 62 Data on the use of CAHPS® surveys by type of plan was collected in last year’s survey but not this survey. The following is from the 2009 report: Of 39 states reporting use of CAHPS® in 2009, 34 states indicated they used CAHPS or similar surveys for health plan enrollees, including 14 states that used CAHPS or similar surveys for populations in a health plan and PCCM or FFS; 19 states used CAHPS® or similar surveys for populations in a PCCM or in FFS, including five states that used these surveys only for these populations.
Figure 37
States with Selected Medicaid Quality InitiativesFY 2010
18
34
41
43
47
MCO Accreditation*
P4P for MCOs and other Providers*
Public Reporting of Health Plan
Performance
CAHPS® or Similar for MCOs, PCCM or
FFS
HEDIS® or Similar for MCOs, PCCM or FFS
NOTE: Data for two measures from 2009 survey. MCO Accreditation includes states that require or reward accreditation.
SOURCE: KCMU survey of Medicaid officials in 50 states and DC conducted by Health Management Associates, September 2010.
Number of States

0062
when selecting health plans in a competitive procurement. In addition, health plans also report data to NCQA, available on the NCQA website, and US News and World Report annually ranks Medicaid health plans.63 Health plan rankings will be published by Consumer Reports beginning in the fall of 2010.64
Pay for Performance for Health Plans and Other Providers: Medicaid programs can provide financial incentives to health plans and other providers to reward and encourage high performance. The previous annual survey documented that Medicaid programs had “pay for performance” policies and performance-based reimbursement methodologies in place in 32 states in FY 2009. These included financial incentives such as bonus payments for exceeding performance benchmarks, and non-financial incentives such as auto-enrollment of Medicaid members into higher performing plans. The previous survey found that 34 states planned to have such policies in place in FY 2010. The current survey did not directly address this question of pay for performance. Instead in this survey, states were asked to list specific examples of quality strategies. As discussed below, a large number of states listed pay for performance strategies, and no state indicated they were ending their policies on pay for performance.
Health Plan Accreditation: States are able to require as a condition of participation with Medicaid that health plans are accredited by a recognized standard-setting organization such as NCQA. Accreditation provides assurance that providers serving Medicaid enrollees meet high standards for care; that the structure, processes and performance of the plans are monitored and that mechanisms are in place for ongoing quality improvement. NCQA reports that 25 states recognized NCQA accreditation either as a requirement or for deeming that certain state requirements were met. From the 2009 survey, the number of states that required or rewarded plans for accreditation by a nationally recognized accrediting organization such as NCQA was 14 in FY 2009, and 18 in FY 2010.
State Strategies for Quality Improvement. States are now undertaking a wide range of strategies to improve quality and improve the effectiveness of health care delivery. To be able to describe these strategies in greater detail, the 2010 survey asked for the first time for states to identify promising policies, initiatives and strategies currently operating in their programs that are designed to improve health care performance and quality in Medicaid in managed care plans and PCCM programs. This question was not designed to provide a comprehensive description of its full quality improvement strategy. The strategies were listed separately for managed care organizations and PCCM programs, as described below.
63 See: http://health.usnews.com/sections/health/health-plans/index.html 64 See: http://www.consumerreports.org/health/home.htm

00 63
Quality Improvement Initiatives for Managed Care Organizations
Arizona has a comprehensive system for monitoring MCO contracts, including Performance Improvement Projects with focused work groups to improve effectiveness of service delivery and quality, utilize evidence-based research and promising practices. Regulatory action is triggered when MCOs do not meet standards. Michigan publishes a Consumer Guide report card on health plan performance for beneficiaries using a star rating system. Michigan also uses a Performance Bonus system, with payments based on health plan performance on quality measures that are changed annually, according to priorities and areas needing improvement. New York has a comprehensive Quality Incentive Program and a Risk Adjusted Capitation Methodology. Ohio will have a Statewide Collaborative to reduce avoidable Emergency Department visits by September 2011. Pennsylvania uses quality benchmarks and monitors program performance in access and quality of care, using 13 performance measures modeled after HEDIS. Providers receive incentive payments or penalties based on their performance on each measure. Rhode Island relies on performance incentives and strong, clear contract requirements. Tennessee requires NCQA certification of health plans and public reporting of quality measures. Texas MCOs are at-risk for 1% of the capitation rate, based on plan performance. A Quality Challenge Award rewards MCOs with superior clinical quality, service delivery, access to care, and member satisfaction.
Quality Improvement Initiatives for Primary Care Case Management Programs Alabama conducts medical record reviews and client surveys, monitors complaints and grievances, conducts focus studies and performance improvement projects, with a focus on maternity care, smoking cessation, asthma and diabetes. Colorado uses quality report cards for PCCM performance compared to MCO performance. Illinois profiles PCPs to measure performance. Quality Assurance Nurses visit PCPs to institute quality improvements. PCPs can receive annual bonus payments based on performance. Maine provides incentive payments based on 15 measures. North Carolina established clinical protocols to identify best practices, improve care and lower cost. Oklahoma changed reimbursement to reduce the C-Section rate, implemented a “never-events” policy, offered incentives for generics and immunizations, and limited ER use and to doctors at a higher tier of a medical home. Pennsylvania uses quality benchmarks and monitors program performance in access and quality of care, using 13 performance measures modeled after HEDIS. Providers receive incentive payments or penalties based on their performance on each measure. Texas selects high risk/high cost PCCM clients and uses case managers to coordinate care and engage clients on self-identified goals. Vermont has a performance-based PCCM which provides an additional fee for providers participating in chronic care management.

0064
C. Health Information Technology
A New Era for Medicaid and the Use of Technology. The past several years have seen unprecedented opportunities for the entire health sector to prepare for greater use of health information technology (HIT). As the potential payoffs have become more widely understood, major efforts have been made across both the public and private sectors to facilitate the adoption of technologies with proven efficiency, costs, quality and patient safety benefits. In particular, states are playing a major role in promoting the adoption and meaningful use of electronic health records (EHRs) and health information exchanges (HIEs), and state Medicaid programs are often key players in these efforts.
Medicaid Transformation Grants authorized by the Deficit Reduction Act of 2005 were an important impetus for states to devote more serious attention to the use of technology to improve the effectiveness and efficiency of the Medicaid program. Under this authority, the federal government awarded $150 million to 35 states in 2007 and 2008 to fund a variety of specific HIT projects without the requirement of state matching funds – a feature that made these grants even more attractive to states.65
Often in partnership with private insurers and employers, states were able to facilitate the development and use of HIEs, electronic prescribing (e-Prescribing), EHRs, electronic clinical decision support (CDS) systems, tele-medicine, electronic claims submission, electronic surveillance in a pharmacotherapy risk management, and other approaches to improving care, promoting greater transparency in health information and reducing waste or abuse in the system. Without question, these grants had a significant impact on state efforts to improve program operations and health outcomes, while also generating a number of key lessons.
At the same time, Medicaid programs have been responsible for major system upgrades involving the Medicaid Management Information System (MMIS). In each state, the MMIS is the sophisticated claims processing and information retrieval system through which most Medicaid policies are translated into payment. In addition, some Medicaid programs have added data warehouse and advanced analytic capabilities to improve and better manage their programs, identify patterns in provider billings and encounters that impact clinical care and examine population health issues. States preparing to procure, modify or upgrade the MMIS find their priorities are dominated by this major undertaking.
All states are now preparing for two major system updates that are not unique to Medicaid but which are consuming a large share of current system resources and have near-term implementation deadlines. The first is the January 1, 2012 date for converting systems to the new version 5010 for electronic health care transactions, including all eligibility and billing information. Along with all health care providers, insurers and health plans, Medicaid systems must be updated, which involves system development, staff training, testing and revision of many instructions, manuals and other materials. The 5010 changes must be in place before the conversion to ICD-10,
65 For detailed descriptions of state Transformation Grant initiatives, see: http://www.cms.gov/MedicaidTransGrants/Downloads/MTGAwardsCombined.pdf

00 65
the next major change. The ICD (International Classification of Diseases) defines the codes used on medical claims and is periodically updated to recognize the evolution of medical practice. The ICD-10 will be beneficial when it is implemented, allowing more precise reimbursement methodologies using more comprehensive data on procedures and diagnoses, but it involves a very complex conversion which must be in place by October 1, 2013. Implementation of these changes will tax the systems resources at the state level.
ARRA and HIT. Medicaid’s role in HIT was dramatically expanded in February 2009 with the adoption of ARRA. Two titles within ARRA constitute the Health Information Technology for Economic and Clinical Health (HITECH) Act. The HITECH Act authorized $2 billion in grant programs administered though the Office of the National Coordinator for Health Information Technology (ONC) to establish and support HIE infrastructure, and also an estimated $27 billion in incentives for Medicare and Medicaid eligible providers who meaningfully use EHRs. These grants are to be administered by CMS and state Medicaid agencies. The key objective is “meaningful use,” which includes a broad list of criteria that demonstrate that EHRs are supporting improvements in the delivery of health care, including using the records to enter clinical orders and to prescribe drugs. Meaningful use also includes providing patients with electronic versions of their health information, and electronic reporting on measures of the quality of care. The goal is to move the entire country toward “electronically connected, information-driven medical care.”66
With these and other HIT changes, the federal government has recognized that states will require new resources. Nearly all states received CMS approval for enhanced Medicaid match at the 90 percent rate to conduct planning for the EHR Incentive program. As a first task, Medicaid agencies must develop and receive CMS approval for their State Medicaid HIT Plan (SMHP) that defines Medicaid’s strategy and operations for administering the EHR program and supporting eligible providers to adopt and meaningfully use certified EHR technology to improve health quality, safety and efficiency. Medicaid agencies must obtain CMS approval of an Implementation Advance Planning Document to modify the MMIS or other systems as well as other activities defined by CMS.
The HITECH Act defines a clear role for Medicaid agencies to administer the payment incentive program to encourage eligible professionals and hospitals to meaningfully use EHRs. Final rules that define “meaningful use” were issued by the federal government on July 13, 2010. The incentives are quite significant, with payments over six years per clinician participating in Medicaid of up to $63,750, or up to $44,000 for clinicians through Medicare. Clinicians can receive incentives from Medicaid only if at least 30 percent of their patients are on Medicaid (20 percent for pediatricians) and can participate with only one program, either Medicaid or Medicare. For Medicaid participating providers, the first year incentive payment can be up to $21,250, with five subsequent annual payments of up to $8,500.
66 David Blumenthal and Marilyn Tavenner, “The ‘Meaningful Use’ Regulation for Electronic Health Records,” The New England Journal of Medicine, August 5, 2010.

0066
The requirements of HITECH were clearly on the minds of Medicaid officials as the 2010 survey was conducted in July and August 2010. Medicaid programs in virtually every state are now working on HIT initiatives themselves and participating with other state agencies and with stakeholders throughout the health care system on HIT. At the time of the survey, the meaningful use regulations were being finalized and issued, and states were preparing and seeking CMS approval of the required State Medicaid HIT Plan, pursuant to which they will begin implementation of incentive payments to qualifying providers. They were focusing on the incentive payments program for EHRs and how this program will dovetail with the broader state HIT strategies.
The attention focused on HIT was clearly seen in state Medicaid-related HIT initiatives underway in 2010 and planned for 2011. Even within the clear priorities of 5010, ICD-10, HIEs and Medicaid Transformation Grant initiatives, and preparing for the ARRA / HITECH responsibilities in the immediate future, the range of HIT initiatives across state Medicaid programs is quite diverse and Medicaid’s role in HIT is quite significant.
To illustrate the breadth of state Medicaid HIT activities, examples from seven states – large and small – were selected as broadly representative of Medicaid HIT activities across the states. Together, the picture that emerges is of Medicaid working with the entire health care community in many ways to use HIT to help improve the health care system for the entire population.

00 67
Select HIT Initiatives
Arizona: Arizona used its Medicaid Transformation Grant to create the Arizona Medical Information Exchange, which is now part of a single state exchange. The state submitted a draft Medicaid HIT Plan in July 2010 describing how it would pay Medicaid incentives to eligible providers and hospitals. The agency anticipates registering eligible Medicaid providers and hospitals by June 2011. The state anticipates paying about $500 million to eligible providers and hospitals over the course of six years. California: Medi-Cal received $2.4 million in 2010 to plan the Medi-Cal Electronic Health Record Incentive Program under ARRA. By the end of 2010, a detailed State Medicaid Health Information Technology Plan will delineate current EHR usage in California and procedures for implementing the EHR incentive program. The department will distribute $2.4 billion of ARRA funds to Medicaid providers and hospitals for the installation, upgrade and meaningful use of EHRs over the following ten years. The incentive program is coordinated with other ARRA-funded HIT efforts in California, including the regional extension centers, the establishment of health information exchanges, e-prescribing, lab reporting, and tele-health. Missouri: MO HealthNet [Medicaid] providers have access to e-prescribing, lab results and continuity of care (CCD) document viewer through the CyberAccess web portal, and also have access to an EHR-lite tool DirectAccess, MO HealthNet participates in planning for statewide HIE through MO HITECH (AARA), contributing staff and co-chairs for workgroups; and providing data for current state utilization of electronic tools. MO HealthNet also will participate in the work of building a statewide health exchange. North Dakota: Medicaid participated in statewide HIE initiatives; used a Medicaid Transformation Grant to create a web portal through which pharmacies can submit claims electronically with real time adjudication, and co-hosted statewide HIT privacy and security conference. Using ARRA funding, ND will develop processes for EHR incentives. Replacement of MMIS is also in process. New York: New York implemented a pilot of the Medicaid e-Prescribing Incentive Program which provides an incentive for each Medicaid drug prescription. Prescribers receive $ .80 per prescription, and pharmacies $ .20. Adoption of e-prescribing is one of the key ARRA criteria for 'meaningful use' of EHRs. The Medicaid Medication History Project provides a beneficiary claims-based medication history to clinicians and hospitals for the past 180 days and includes supplies, over-the-counter medications, and certain durable medical equipment. The Child Health Information Integration Project links maternal and child health databases to provide coordination and communication to improve outcomes, reduce duplication, and permit more effective follow-up on conditions identified in initial screenings. Vermont: VT spent FY 2010 understand the scope and impact of ARRA and the HITECH Act on Vermont's integrated approach to health care reform and HIT. Beginning in FY 2011, the statewide HIE will be built out to every Hospital Service Area supporting meaningful use for eligible providers and the Provider Incentive payment program is planned go live pending CMS approval of the State Medicaid HIT Plan. Medicaid will conduct outreach to providers about meaningful use, provider incentives, and the adoption and upgrades of EHR systems. Vermont is also linking its Medicaid, human service, mental health, substance abuse, and other public health IT systems to provide a platform for connectivity to and from the HIE network. Wisconsin: Through Medicaid Transformation Grant funding, Wisconsin takes part in two regional HIEs. The Wisconsin Health Information Exchange (WHIE) exchange allows emergency department practitioners to access patient medical history for participating health systems and payers. The Wisconsin Health Information Organization (WHIO) is a repository for health care claims data for analysis and comparative performance reports for providers and population health evaluations. The data mart contains data for more than 2.8 million individuals including over 300,000 Medicaid FFS members and over 280,000 Medicaid Dual FFS members, and in October 2010 will add Medicaid HMO encounter data and four additional health plan data contributors. In FY 2011, the Medicaid EHR incentive program will be implemented.

0068
5. Key Issues in Implementing Health Reform
As states continue to grapple with historically difficult budget conditions, they must also plan for the implementation of the ACA, which assigns significant new roles to states related to both Medicaid and private insurance coverage changes. In particular, states face new administrative challenges as they prepare for the Medicaid eligibility expansion that is to occur in 2014 including implementing a new income eligibility methodology and re-designing eligibility systems to interface with new Health Insurance Exchanges. While still very early in the implementation stages of health reform, this year’s survey asked for state responses to six open-end questions related to the process of planning for health care reform implementation and various impacts, implications and challenges. State responses are summarized below.
The Medicaid agency role in preparing for federal health care reform (including how Medicaid will work with the state insurance department). Most states indicated that the Medicaid agency was involved in some type of interagency planning effort that also included the state insurance department. Not surprisingly, in many cases interagency workgroups were convened and/or led by the Governor’s Office and in three cases, the Lieutenant Governor played a leadership role. A few states reported the formation of a formal new coordinating body or office to oversee health care reform planning efforts including the:
Health Reform Cabinet in Connecticut;
Health Reform Coordinating Council in Maryland;
Health Care Reform Council in Michigan;
Office of Health Care Reform in New Mexico;
Federal Health Care Reform Cabinet in New York; and
Wisconsin Office of Health Care Reform.
In a few cases (e.g., Colorado, Nevada and Vermont), survey respondents indicated that the Medicaid agency (or the umbrella agency that Medicaid resides in) is playing the lead role in health care reform planning. In Oregon, the newly created Oregon Health Authority (that will be comprised of most state health-related programs including Medicaid) will work with the Oregon Insurance Division to implement the Health Insurance Exchanges and other aspects of the health care reform law. Utah reported that its currently operating insurance exchange is housed within the Governor’s Office of Economic Development as it is considered a small business economic development issue.
Finally, while all states reported that some planning efforts were underway, a few states indicated that, because a new Governor would be elected this fall, a number of planning efforts or decisions were being deferred so that the incoming Administration could formulate its own policy.

00 69
The implications of the new “Modified Adjusted Gross Income (or “MAGI”) eligibility standard, including impacts on the current eligibility system. The ACA will require states to use a new income eligibility methodology known as “Modified Adjusted Gross Income, or “MAGI” in 2014. Planning for this transition to MAGI and developing the eligibility systems to accommodate both the Medicaid expansion and the new income methodology was highlighted as a key priority for many states in preparing to implement health reform. States also noted that these changes and new eligibility systems will take time, so states need to think about these issues now to be ready for implementation in 2014. This survey asked states to comment on the implications of moving to MAGI and the implications for eligibility systems. A number of states indicated that they were still evaluating the impact of the change to MAGI and several states commented that they needed additional CMS guidance to fully assess the implications of MAGI. In moving to MAGI, states mentioned that new links would be needed with the Internal Revenue Service (to obtain tax return information for the MAGI calculation). With regard to systems, seven states reported that they would likely need new eligibility systems to accommodate these changes; nine states said that a new system may be needed; five states indicated that they were currently in the process of procuring or implementing a new eligibility system and would have to build in the new ACA requirements; eight states reported the need for extensive or significant system changes; and two states said that new systems were not needed in their state. One state noted that while their current system may not be capable of meeting all ACA requirements, the state did not believe there was sufficient time or funding to build a new system so they were exploring the development of a new eligibility engine to wrap around (and lay on top of) the current system. Finally, one state expressed interest in having discussions with CMS about the potential role for a national vendor once eligibility standards and rules became uniform across the states. A number of states highlighted the fiscal impact of the systems issues and the need for additional federal funding support. The ACA provides enhanced federal funding for newly-eligible individuals (determined under the MAGI standard), while retaining the current federal matching rates for individuals who were eligible for Medicaid when health reform was enacted. Several states specifically commented on the potential difficulty of maintaining dual systems (capable of determining eligibility under the old standards and the new MAGI standard). One Medicaid director summed up these challenges in the following way:
“Building the new eligibility systems will take time, including procurements, writing computer codes, testing the system, and training workers. None of this can begin until HHS issues guidance on the specifications for the eligibility system, including how income will be calculated, the extent to which the 'old' Medicaid eligibility rules must be retained in parallel with the new rules, and other elements. States need HHS to accelerate the development and release of this guidance.”

0070
Potential role of the Medicaid agency in determining the eligibility for subsidies in the Exchange. Under the new law, there are requirements that eligibility for Medicaid and subsidies in the new Health Insurance Exchanges be coordinated with a single application form, on-line applications, and integrated screening and enrollment requirements. To help achieve this coordination, the law allows exchanges to contract with Medicaid agencies to perform the eligibility and subsidy determinations for those purchasing coverage in the Exchange. In this survey, states were asked if they were planning to take advantage of this option. The vast majority of states (33) indicated that Medicaid’s role in determining eligibility for Exchange subsidies was not yet known while a few states (5) indicated that it was likely or possible that the Medicaid agency would do subsidy eligibility determinations. Another five indicated that the Exchange function would probably not be housed in Medicaid but did not elaborate on how subsidies would be determined. Three states said that Medicaid would play a “primary” or “large” role and officials in one state responded that they did not know if the state would have a state-run Exchange. In some cases, states indicated that the governance and management of the Exchange would be determined in the 2011 state legislative session.
Opportunities for state savings in implementing health reform. While there has been a lot of attention on the state costs as well as the new federal revenues flowing to states associated with the Medicaid expansion under health reform, the expansion of coverage also has the potential to offset other states costs (such as current costs for uncompensated care). Outside the coverage expansions, there are a number of new provisions that could also affect state budgets. In this survey states were asked if they had identified opportunities for savings in Medicaid that would result from health reform. A number of states indicated that they were still evaluating the fiscal impact of the health reform law. Eighteen states said that they did not expect savings or that savings identified in some areas would be more than offset by added costs in other areas (i.e., lost revenue from the changes to the prescription drug rebates in Medicaid or the state costs of expanded Medicaid enrollments). Seventeen states indicated there would be savings and another three said there may be savings. In some cases, these were states that were already covering higher income populations through a Medicaid expansion or state-only program and therefore expected to receive new federal funding to offset current state costs. Other states cited savings in behavioral health or chronic care programs, savings from reduced uncompensated care costs or cost-shifting or potential savings from payment reforms. The biggest challenges for Medicaid in implementing health care reform. States were asked to identify the biggest challenges for Medicaid in implementing health reform. Most states identified multiple health care reform implementation challenges. The most commonly cited (by 25 states) was the lack of sufficient staff resources to accomplish all of the required health care reform tasks – made even more challenging in many states by staffing reductions, freezes and furlough days. A similar number of states (24) emphasized the fiscal impact and/or the lack of sufficient funding for implementation tasks. Other frequently cited challenges were various IT and systems issues (15 states), Exchange interface and related issues (10 states), provider access issues (9 states), Medicaid eligibility issues (9 states), tight timelines (8 states), competing demands including ICD-10 implementation and ARRA HIT initiatives (6 states) and the challenges presented by the expected large increase in Medicaid eligibles (6 states).

00 71
States also responded that they needed timely and detailed regulations and guidance on all ACA provisions that states are responsible for implementing. Specifically, states mentioned the need for more information and guidance related to Health Insurance Exchanges, the definition of a benchmark benefit package, pharmacy rebates, medical homes, payment reform and accountable care organizations (ACOs) and the need for additional administrative funding.
6. Looking Ahead: Perspectives of Medicaid Directors
Notwithstanding the significant challenges and issues for Medicaid in the future, Medicaid officials were quick to point to recent achievements and accomplishments that were all the more remarkable because of they were accomplished in a time of extreme fiscal restraint and cutbacks. Medicaid directors noted that state policy makers had worked hard to preserve the core mission of Medicaid during the economic downturn, and that program cuts that were made had been targeted and chosen with an eye toward minimizing the impact on beneficiaries and their health care. Some mentioned that decisions on program cuts were made in a collaborative way with stakeholder involvement. As one Medicaid director put it: “In these insanely difficult times, we continue to be a functioning organization, implementing reforms that will improve quality and availability of care.” In addition, Medicaid directors pointed with pride first to their staff, their commitment and how they responded to the challenges such as layoffs and furloughs. Looking into the future, Medicaid directors listed two over-riding issues that Medicaid programs will face over the next year or two. The first relates to the continuing stress on state budgets due to the ongoing effects of the economic downturn. Medicaid caseloads are expected to continue to grow at a significant rate, ensuring upward pressure on overall Medicaid spending but with few ways left to slow spending growth after years of looking at every possible cost containment option. The Congressional extension of the enhanced FMAP will ease the pressure on the state general fund cost of Medicaid for the balance of state fiscal year 2011, but the state share of Medicaid costs will jump dramatically in FY 2012, when most states anticipate that revenues will remain depressed. The experience from previous recessions indicates that state revenue recovery usually lags an economic upturn, sometimes by two or three years, so states are again bracing for difficult budget years in FY 2011 and FY 2012. The second major issue that Medicaid directors see for the future relates to the new role for Medicaid under health reform and the limited time to prepare for implementation in 2014. Medicaid officials have spent considerable time understanding the implications of the many provisions of the ACA that affect them, including the expansion of eligibility with the potential for a completely redesigned Medicaid eligibility system with a new standardized definition of income. In addition, Medicaid officials see a new paradigm for Medicaid that will require new relationships with the health insurance system through the new state Health Insurance Exchanges. The ACA also offers numerous opportunities for demonstrations, pilots and other initiatives through which Medicaid can take a leadership role in improving performance of the health care system. Preparing for implementation and fulfilling the promise of health reform over the next few years will be a challenge given the current fiscal circumstances.

0072
Without question, Medicaid directors communicated an awareness of how significant the job is that lies immediately ahead, and how difficult it would be to accomplish all that needs to be done even in the best of circumstances. Even with the daunting challenges of the economic downturn and ongoing state budget shortfalls, they are preparing as best they can for an expanded role for Medicaid in the health care system of the future.

00 73
Conclusion
For state Medicaid programs, the past year has been a period of almost unprecedented fiscal stress. State budgets have been stretched by drops in state revenues at a time when budgetary demands have been increasing for Medicaid and public programs. States have responded with cuts across state programs, including Medicaid, as well as administrative cuts that have affected all state workers including those who administer Medicaid. It has not been easy to handle the ever-increasing demands of managing Medicaid at a time of layoffs, furloughs, hiring freezes and other budgetary actions that have limited the resources available to administer one of the largest programs in state budgets. States saw strong enrollment and spending growth in Medicaid, well above original projections for FY 2010. Federal funding from ARRA, delivered to states via an enhanced federal matching rate for Medicaid, has been the most significant factor in the fiscal survival of states over the past two years and will provide help to states through June 2011. States have been able to use these funds not just to address the costs of increasing Medicaid caseloads and higher Medicaid costs, but also to address overall state budget shortfalls. For Medicaid, these ARRA funds avoided or ameliorated what inevitably would have been quite significant cuts in all aspects of the program. However, even with the ARRA enhanced FMAP, nearly all states found it necessary to make Medicaid cuts in both FY 2010 and 2011, particularly in the areas of provider rates and benefits. ARRA maintenance of eligibility provisions protected Medicaid eligibility during this time of fiscal stress. Yet, despite fiscal stress, many states made advancements in eligibility or enrollment processes and continued working toward rebalancing their long-term care delivery systems. Medicaid programs also continue to focus on initiatives to improve quality and expand the use of information technology. Looking forward, states are hoping that the economy starts to improve as they plan to implement historic health reform legislation. In the near future, even if the economy begins to improve at the national level, the impact of the recession will persist for states for several years. Looking forward to FY 2012, the state share of Medicaid spending will increase dramatically due to the expiration of the enhanced FMAP on June 30, 2011, while state revenues are almost certain to remain severely depressed. In addition to dealing with the effects of the recession, Medicaid directors see preparing for the implementation of health reform as a huge opportunity as well as the next major challenge. Health reform will dramatically reduce the number of uninsured and provide access to new federal funding associated with expanded Medicaid coverage, but it will not be easy to implement. In many states, new leadership and staff will take over responsibilities for health reform implementation following changes after the 2010 elections. Even in the face of daunting challenges, Medicaid remains the foundation of coverage for low-income Americans and a critical safety net in today’s health care system, and the program is poised to fulfill an even larger role under health reform.

0074
Appendix A: State Survey Responses

00 75
Appendix A‐1Positive Policy Actions Taken in the 50 States and the District of Columbia
FY 2010‐2011
2010 2011 2010 2011 2010 2011 2010 2011 2010 2011 2010 2011Alabama X X X X XAlaska X X X X X X Arizona X XArkansas X X X X X XCalifornia X X X X X X X X XColorado X X X X X X XConnecticut X X X X XDelaware X X X X X XDistrict of Columbia X X X X X XFlorida X X X X X X XGeorgia X X X X XHawaii X X X XIdaho XIllinois X X X XIndiana X X X X X X XIowa X X X X XKansas X X X X XKentucky X X X XLouisiana X X X X X X X X XMaine X X XMaryland X X X X XMassachusetts X X X X X XMichigan X X X X X X X XMinnesota X X X X X XMississippi X X X XMissouri X X XMontana X X X X X XNebraska X X X X X X X XNevada X XNew Hampshire X XNew Jersey X X X X XNew Mexico X XNew York X X X X X X X X X XNorth Carolina X XNorth Dakota X X X X X X X XOhio X X X X X X XOklahoma X X X X XOregon X X X X X XPennsylvania X X X X X X XRhode Island X X XSouth Carolina X X X X XSouth Dakota X XTennessee X X X XTexas X X X X X X X XUtah X X XVermont X X X X X XVirginia X X XWashington X X X X XWest Virginia X X X XWisconsin X X X X X X XWyoming X X X X XTotal 36 36 15 16 32 17 26 17 1 3 32 32
StatesLong Term Care Expansions
Provider Payment
Benefit Expansions
Eligibility Expansions
Simplification to Application/
Decreased Co‐Payments

0076
Appendix A‐2 Cost Containment Actions Taken in the 50 States and the District of Columbia
FY 2010‐2011
2010 2011 2010 2011 2010 2011 2010 2011 2010 2011 2010 2011 2010 2011Alabama X XAlaska X XArizona X X X X X XArkansasCalifornia X X X X X X XColorado X X X X X XConnecticut X X X XDelaware X X XDistrict of Columbia X X XFlorida X XGeorgia X X X XHawaii X XIdaho X XIllinois X X XIndiana X X X X XIowa X X X X XKansas X X X X X XKentucky X XLouisiana X X X X XMaine X X X X X X XMaryland X XMassachusetts X X X X X X X XMichigan X X X XMinnesota X X X X XMississippi X XMissouri X X X X X XMontana X XNebraska X XNevada X X XNew Hampshire X X X X X X XNew Jersey X X X X X X XNew Mexico X X X X X X X XNew York X X X X XNorth Carolina X X X X X X X X XNorth DakotaOhio X X X XOklahoma X X X XOregon X X X XPennsylvania X X X XRhode Island X X X X XSouth Carolina X X X XSouth Dakota X X XTennessee X XTexas X X X X X XUtah X X X XVermont X X X X XVirginia X X X X X X XWashington X X X X X XWest Virginia X XWisconsin X X X XWyoming X X xTotal 39 37 37 30 20 14 1 1 0 0 1 5 18 10
StatesLTCProvider
PaymentsPharmacy Controls
Benefit Reductions
Eligibility Cuts Changes to Application
Copays

00 77
Appendix A‐3Provider Taxes in Place in the 50 States and the District of Columbia
FY 2010‐2011
2010 2011 2010 2011 2010 2011 2010 2011 2010 2011 2010 2011Alabama X X X X X X X XAlaska Arizona X X X XArkansas X X X X X X X XCalifornia X X X X X X X X XColorado X X X X X X X XConnecticut X X X XDelaware District of Columbia X X X X X X X X X XFlorida X X X X X X X XGeorgia X X X X XHawaii Idaho X X X X X XIllinois X X X X X X X XIndiana X X X X X XIowa X X X X X X XKansas X X X X XKentucky X X X X X X X X X XLouisiana X X X X X X X XMaine X X X X X X X X X XMaryland X X X X X X X X X XMassachusetts X X X X X X X XMichigan X X X X X X XMinnesota X X X X X X X X X X X XMississippi X X X X X X X XMissouri X X X X X X X X X XMontana X X X X X X X XNebraska X X X XNevada X X X XNew Hampshire X X X X X XNew Jersey X X X X X X X X X X X XNew Mexico X X X X X XNew York X X X X X X X X X XNorth Carolina X X X X X XNorth Dakota X X X XOhio X X X X X X X XOklahoma X X X XOregon X X X X X X X X XPennsylvania X X X X X X X X X XRhode Island X X X X X X X X X XSouth Carolina X X X X X XSouth Dakota X X X XTennessee X X X X X X X X XTexas X X X X X XUtah X X X X X X XVermont X X X X X X X X X XVirginia X XWashington X X X X X X X XWest Virginia X X X X X X X XWisconsin X X X X X X X X X XWyoming Total 29 34 33 34 37 38 12 11 14 15 46 47
Other* Any Provider TaxStates
Hospitals ICF/MR‐DD Nursing Facilities Managed Care Organizations

0078
Appendix A-4a Eligibility, Premium and Application Renewal Process Related Actions
Taken in the 50 States and the District of Columbia FY 201067
State Eligibility, Premium and Application Changes Alabama Application & Renewal (+): Express Lane Eligibility for renewals implemented.
Alaska Children (+): Alaska no longer prohibits eligibility for children under the age of 19 when the household voluntarily drops insurance coverage within the previous 12 months, and the household income is greater than 150% but less than 175% of the federal poverty guidelines for Alaska. (50; 10/1/2009) Parents (+): Alaska allow 12 months of Transitional Medicaid without requiring periodic reports on changes in income. (1,200; 9/1/2009) Application & Renewal (+): Alaska implemented 12-month renewals periods for all Medicaid recipients. (10/1/2009) Application & Renewal (nc): For the Medicare Saving Programs an automated referral process with SSA was established. (1/1/2010)
Arizona Application & Renewal (+): Renewal applications can be completed online. (9/2009 )
Arkansas Application & Renewal (+): Online renewal process. (9/1/2009) Premiums (nc): Premiums for ARHealthNet (HIFA Waiver) are being increased.
California Children & Pregnant Women (+): Implemented the CHIPRA ICHIA option, retroactive to 2009. (4/1/2010) ARRA Maintenance of Eligibility (nc): New programs were started to retain Medi-Cal eligibility for those seniors and persons with disabilities losing SSI due to the SSP reductions. (20,000; 7/1/2009) Application & Renewal (nc): Under MIPPA, counties have been instructed to use the Low Income Subsidy (LIS) application as a Medicare Savings Program application. Application & Renewal (+): Counties treat the LIS application as a Medicaid (Medi-Cal) application. (7/1/2009)
Colorado Parents (+): Increased eligibility for parents from 60% to 100% FPL. (12,000; 5/1/2010) Pregnant Women (+): Implemented the CHIPRA ICHIA option. (600; 7/1/2009) Application & Renewal (+): Revised medical application to include all medical programs; Rules to allow Ex Parte redeterminations. Application & Renewal (+): Online Screening Tool and ability to check benefits; DRA Citizenship/Identity rules Programmed into eligibility system.
Connecticut Childless Adults (+): Childless adult expansion under ACA. (47,000; 4/1/2010) Children & Pregnant Women (+): Implemented the CHIPRA ICHIA option for children and pregnant women. (5/1/2010) Parents & Children (+): Eliminated quarterly reporting requirements for families on TMA. (7/1/2009) Nursing Home Resident (+): Increased assets that a community spouse can keep. (5/1/2010)
Delaware Disabled (+): Implemented a buy-in program for disabled workers. (50; 10/1/2010) Premiums (NEW): New Ticket to Work program has premiums.
District of Columbia
Childless Adults (+): Implemented the ACA option to expand coverage to childless adults up to 133% FPL. This will move coverage from the District’s state-funded coverage program (the Alliance) to Medicaid. (32,000; 7/1/2010). Children (+): Implemented the CHIPRA ICHIA option. (800 to 1000; 10/1/2009)
Florida All Eligibility Groups (+): Excludes 2010 census income from income. (Unknown, 9/21/2009). All Eligibility Groups (+): Elimination of 8-month time limit for Iraqi and Afghani special immigrants. (2 families, 2/11/2010) Children (+): Exclusion of Workforce Investment Act income for children. (Minimal, 11/1/2009) Children (+): Interim eligibility for up to 90 days for child victims of human trafficking. (1; 6/7/2010) Children (nc): Delink Title IV-E Adoption assistance eligibility from 1996 AFDC standards. (0; 10/1/2009) Parents & Children (+): Adopted 12-month eligibility period for Transitional Medicaid. (2; 12/30/2009) Aged & Disabled (+): Spousal impoverishment standards increase. (Minimal, 7/1/2009) Application & Renewal (+): Foster care application process via the Florida Safe Family Network information system. (8/2009)
67 Positive changes counted in this report are denoted with (+). Negative changes counted in this report are denoted with (-). Changes that were not counted as positive or negative in this report, but were mentioned by states in their responses, are denoted with (nc). Premiums were counted as (nc) unless the premium as newly applied, which was denoted as (NEW).

00 79
State Eligibility, Premium and Application Changes Application & Renewal (+): Clarification in citizenship requirement for Presumptively Eligible Newborns. (Unknown; 3/6/2009) Application & Renewal (+): Revision of the Florida KidCare application form and plan to improve the transition of KidCare applicants and recipients between KidCare partner programs. Application & Renewal (nc): Documentation for Haitian evacuees - by short term waiver authority. (Minimal, 2/9/2010)
Georgia
Hawaii
Idaho Parents & Children (+): Eliminated quarterly income reporting requirement for TMA. (7/1/2009)
Illinois Parents (+): State plan amendment approved 5/11/2010 which moves funding for parents with income up to 185% FPL from state-only to Title XIX under 1902(a)(10)(A)(ii). (0; Effective retroactive to 10/1/2007) Pregnant Women & Children (+): Implemented CHIPRA ICHIA option.
Indiana Parents & Pregnant Women (+): Asset Disregard of 529 Educational Savings Accounts and income disregard for census temporary workers. (SPAs to be submitted) Pregnant Women (+): Presumptive Eligibility for pregnant women.
Iowa Children (+): Implemented CHIPRA ICHIA option. (246; 7/1/2009) Children (+): Implemented presumptive eligibility. (TBD, 3/1/2010) Pregnant Women & Infants (+): Expanded coverage to 300% FPL. (5,000; 7/1/2009) Application & Renewal (+): Online application. Application & Renewal (+): Implement a 14-day grace period for applications and renewals. (1/1/2010) Application & Renewal (+): Performance Bonus Initiatives: Implement Express Lane Eligibility. (10,000; 6/1/2010) Premiums (nc): Premium reduction for Medicaid Employed Persons with Disabilities. (7/20/2009)
Kansas Application & Renewal (+): Implementation of new simplified Family Medical application form.
Kentucky
Louisiana Dual Eligibles (+): 1902(r) (2) Disregard all vehicles and CSV of all life Insurance for Medicare savings programs. (60; 1/1/2010) Application & Renewal (+): Redesign and revision of application forms, renewal forms and processes to implement Express Lane Eligibility. (13,993; 12/1/2009) Application & Renewal (+): Additional administrative renewal of cases meeting certain criteria (e.g. child related cases within 75% of income limit).
Maine Pregnant Women & Children (+): Implemented CHIPRA ICHIA option. Childless Adults (nc): Continuation of waiting list for MaineCare. (10,000 as of 07/2009 )
Maryland Application & Renewal (nc): The Medicare Savings Program application became declaratory for assets as required under MIPPA. Application & Renewal (+): Passive redetermination process initiated for the premium part of the Children's Health Program.
Massachusetts Pregnant Women & Children (+): Implemented CHIPRA ICHIA option. (6,500; 8/29/2009) Application & Renewal (+): MassHealth members can view their information online and submit changes electronically for the following items: homeless status, residential address; mailing address; telephone number; ethnicity/race and pregnancy. (2/2010) Application & Renewal (+): Streamlined the annual redetermination of MassHealth nursing facility residents by using data matching. This annual administrative renewal process establishes a specified definition of 'stable' eligibility factors . Several systems’ data matches support the reliability for this administrative renewal process. Continue to work to expand the concept to additional populations who represent stable criteria. (Began 4/2010) Application & Renewal (+): MassHealth Application revisions related to parental affidavit for identify verification for a child under age 16 and Iraqi/Afghan special immigrant codes. Eligibility determination logic will be enhanced to afford applicants/members a time limited benefit pending submission of citizenship/identity or immigration verifications. Application & Renewal (+): Reformat the application flow of both paper and electronic applications in an effort to minimize conflicting or blank member responses. (5/2010) Application & Renewal (+): MassHealth extended the window of electronic data matching capacity with the Registry of Vital Statistics to include birth years back to 1958. (8/2009) Application & Renewal (nc): As required by the Medicare Improvements for Patients and Providers Act of 2008, (MIPPA), the state began to perform a Medicare Savings Program (Qualified Medicare Beneficiaries, Specified Low-Income Medicare Beneficiaries, Qualified Individuals) determination based on information provided electronically via Social Security's Medicare Part D Low Income Subsidy Application. (1/2010)
Michigan Childless Adults (+): Adult Benefits Waiver (converted from CHIP to Medicaid). (62,000; 1/1/2010) Application & Renewal (+): Simplified redetermination form.

0080
State Eligibility, Premium and Application Changes Minnesota Pregnant Women & Children (+): Implemented CHIPRA ICHIA. (1,200; 7/1/2010)
Children (+): Children in foster care on 18th birthday deemed Medicaid eligible without premium or insurance barrier. Premiums (nc): Decreased for MinnesotaCare families. Premiums (nc): Eliminated premiums for children with family incomes under 200% FPG.
Mississippi
Missouri Premiums (nc): Premiums for the mandated Buy-in program for Medicare Part A and Part B both increased in FY 2010.
Montana Children (+): Asset test removed, 12 month continuous eligibility implemented. (10,649; 10/1/2009) Parents (+): 12 months continuous eligibility under TMA. (10/1/2009) Disabled (+): Added Medicaid for Workers with Disabilities (Medicaid buy-in through Ticket to Work). (43; 7/1/2010) Children (+): Implemented CHIPRA ICHIA option. (50; 1/1/2010) Dual Eligible (nc): Increase asset limits for Medicare Savings Programs per MIPPA. (100; 1/1/2010) Native Americans (nc): Excluding from resource test for all programs the first purchase with excluded Native American funds, including first transfer of excluded funds into non-excluded account. (10; 1/1/2010)
Nebraska Application & Renewal (+): Attestation of citizenship in application form. Application & Renewal (+): Implemented ACCESS Nebraska - phased in online application process for all public assistance programs.
Nevada Application & Renewal (+): Implemented a one page renewal form and verify changes only.
New Hampshire
New Jersey Pregnant Women & Children (+): Implemented CHIPRA ICHIA option. (11,000; retroactive to 4/1/2009) Application & Renewal (+): Implemented administrative renewals for family programs (not ABD).
New Mexico Children (+): Implementing 12 month continuous eligibility. (2,100; 10/1/2009) Pregnant Women & Children (+): Implemented CHIPRA ICHIA option. (3,000; 10/1/2009) Working Adults (-): Implemented waiting list for State Coverage Insurance (SCI). (11/1/2009)
New York Non-SSI Medicaid (+): Eliminate resource test for Non-SSI-Related Medicaid applicants and recipients. (1,023,000; 1/1/2010) Adults (+): Eliminate resource test for Family Health Plus (FHP) applicants and recipients. (399,000; 1/1/2010) Children & Pregnant Women (+): Implemented CHIPRA ICHIA option. (47,000; retroactive to 4/1/2009) Parents (+): Eliminated quarterly income reporting for Transitional Medical Assistance (TMA). (7/1/2009). Application & Renewal (+): Eliminate the personal interview requirement for Medicaid and FHP applicants.
North Carolina
North Dakota Medically Needy (+): Increased medically needy standard to 83% of FPL (from 58% for 1 person and from 44% for 2 persons). (7/1/2009) Application & Renewal (+): Online application system.
Ohio Children (+): Continuous eligibility for children. (26,358; 4/1/2010) Children (+): Presumptive eligibility for children. (14,208; 4/1/2010) Application & Renewal (+): Elimination of face-to-face redetermination for ABD Medicaid. Application & Renewal (+): Change from six to 12 month redetermination for parents. Application & Renewal (+): Elimination of an optional form at redetermination for all populations.
Oklahoma Non-Citizens (+): Allow an additional 2 month period of coverage for Afghans with special immigrant status.
Oregon Families (+): Expansion of premium subsidy programs to children in families through 300% FPL. (Unknown, 1/1/2010) Children (+): Expansion of coverage to youth aging out of Foster Care until age 21. (400/year, 5/1/2010) Children (+): Eliminate asset test. (10/1/2009) Children (+): Implemented CHIPRA ICHIA option. (10/1/2009) Children (+): Implementation of 12 month continuous eligibility for children. (10/1/2009) Parents (+): Adopting the changes allowed per ARRA to eliminate the requirement for families to have TANF medical for 3 of the previous 6 to 1 of the 6 previous months for TMA. (10/1/2009) Adults (+): Reopening OHP Standard, Oregon's Medicaid expansion demonstration for adults. Also includes adults with children. (25,000, 10/1/2009) Application & Renewal (+): Added application assisters. Application & Renewal (+): Implemented an interactive online application.
Pennsylvania Pregnant Women & Children (+): Implemented ICHIA option. Application & Renewal (+): Population of known eligibility data on renewal forms. Application & Renewal (+): Redesign of client notices using easy to understand text and form layout.

00 81
State Eligibility, Premium and Application Changes Rhode Island Aged & Disabled (+): Spousal impoverishment applied to HCBS provided LTC eligible couples in addition to
institutionally provided LTC eligible couples; applied all long-term care eligible couples. (2,000; 7/1/2009) Pregnant Women & Children (+): Implemented ICHIA option.
South Carolina Parents & Children (+): TMA - changed 3 of 6 months rule to 1 of 6 months. (less than 100, 7/1/2009)
South Dakota Parents & Children (+): Eliminated TMA quarterly income reporting requirement. (10/1/2009)
Tennessee
Texas Breast and Cervical Cancer (+): Re-defined "active treatment" services and expanded it to include active disease surveillance for triple-negative receptor breast cancer. Women who are receiving this type of treatment for this type of cancer will now be eligible to receive or continue receiving MBCC. Only affects the Medicaid for Breast and Cervical Cancer (MBCC) population. (Unknown, 1/1/2010) Newborn (+): Newborn child is no longer required to reside with the Medicaid birth mother to remain eligible for newborn Medicaid coverage. CHIPRA change. (Unknown, 12/1/2009) Application & Renewal (+): Medicaid applicants who declare themselves to be U.S. citizens and do not provide verification of citizenship, will be allowed a period of reasonable opportunity to provide verification of citizenship. CHIPRA changes which affect all Medicaid groups. (Unknown, 1/1/2010) Application & Renewal (+): Allowed the use of Texas Workforce Commission quarterly income as verification if the preferred methods of income verification are not available at the time the application or renewal is processed. This increases the timeliness therefore providing benefits faster to households. All Medicaid groups - low income families, pregnant women, and children. (0; 2/1/2010)
Utah Application & Renewal (nc): LIS application for cost sharing - Federal mandate under MIPPA. Premiums (nc): Premiums for the PCN program were eliminated for Native Americans.
Vermont Application & Renewal (+): Application process for premium assistance was streamlined. Application & Renewal (+): Modernization project underway to change front-end of eligibility process including: implementing a web-based application, a 1-800 number. A pilot program will begin in FY 2010; full implementation expected in December 2010. Premiums (nc): Premiums were increased in employer-sponsored Catamount Health Program.
Virginia Children (+): Implemented CHIPRA ICHIA option. (5,696; implemented 2/2010, but retroactive to 4/2009) ARRA Maintenance of Eligibility (nc): Reversed recently enacted policy counting the value of a life estate - due to ARRA. (implemented 7/1/2009, but retroactive to February 2009)
Washington Native Americans (nc): ARRA changes for Native Americans - money received from extracting resources is not income, but is an exempt resource in month received. (7/1/2009) Pregnant Women & Children (+): Implemented CHIPRA ICHIA change. (7/1/2009) Application & Renewal (+): Simplified application for specific medical programs implemented; electronic signatures allowed for online Medicaid applications.
West Virginia
Wisconsin Pregnant Women & Children (+): Implemented CHIPRA ICHIA option. (500; 10/1/2009) Children (+): Eliminate asset test all kids. (10; 10/1/2009) Children & Parents (+): Changed premium assist to voluntary program. (10, 10/1/2009) Adults (+): Added males (aged 15-44) to Family Planning Waiver. (Unknown, 5/1/2010) Childless Adults (+): Further expansion of childless adult waiver to 200% of FPL. (57,000; 7/15/2009) Application & Renewal (+): Introducing online renewal process around December 2009. Application & Renewal (+): Pre-printed renewal form.
Wyoming Application & Renewal (+): Implementing an online screening tool. (4/1/2010)

0082
Appendix A-4b Eligibility, Premium and Application Renewal Process Related Actions
Taken in the 50 States and the District of Columbia FY 201168
State Eligibility, Premium and Application Changes Alabama Application & Renewal (+): Express Lane Eligibility Implementation.
Alaska Aged & Disabled (+): Alaska updated its special long-term income standard to 300% of current SSI income standard ($1,656/month). The income standard had previously been frozen at 2003 levels. (0; 9/1/2010)
Arizona
Arkansas
California Childless Adults (+): Plans to expand coverage under childless adult waiver under 133% FPL in select counties. (Unknown, 9/1/2010) Adults (nc): Family Planning State Plan Amendment is possible in FY 2011. (Unknown) Disabled (+): Expand Ticket to Work eligibility to 250% of Federal poverty level. (Unknown) Application & Renewal (+): Will be implementing an online public version of the joint application used for enrollment of children into the Healthy Families Program (CHIP) and a screening tool for the percent poverty programs for children under Medi-Cal. The joint electronic application is known as Health-e-App.
Colorado Adults (nc): Possibly implement the ACA Family Planning State Plan option in FY 2011. Application & Renewal (+): Implement interfaces to eliminate paper for citizenship, identity and income. Application & Renewal (+): Implement Express Lane Eligibility using criteria from other agencies. Application & Renewal (+): Changed rules to permit passive and telephone redeterminations.
Connecticut Adults (+): Connecticut is planning to apply for a family planning waiver. (Unknown)
Delaware Pregnant Women & Children (+): Implemented CHIPRA ICHIA option. (previously covered under a State-only program). (400; 7/1/2010)
District of Columbia
Childless Adults (+): Under ACA option to cover childless adults, program has requested an expansion 133% to 200% of Federal Poverty Level (DSH funded). (5,000; 10/1/2010)
Florida Application & Renewal (+): Systemic Alien Verification for Entitlements (SAVE) verification not required after application unless change to alien status. (Unknown, 7/14/2010)
Georgia
Hawaii
Idaho Premiums (nc): New sliding scale premium for Katie Beckett enrollees. (Due to ARRA, payment of premium will be optional. Awaiting CMS approval.)
Illinois Disabled (+): Implemented Ticket to Work (TWWIIA) Medically Improved under 1902(a)(10)(A)(ii)(XVI). (10; 10/1/2010)
Indiana Adults (+): New Family Planning Waiver to 150% of FPL. (Awaiting CMS approval). Application & Renewal (+): Eligibility renewals to be completed through use of a mail-in form.
Iowa Disabled (+): Increase in the SSI-related Med. income limits due to any SSI cost-of-living increase. (48,000; 1/1/2011). Premiums (nc):1115 Waiver (Iowa Care). As part of the 1115 renewal, CMS is requiring reduction in the premiums for those above 150% of FPL. Premiums are being eliminated for those between 100% and 150% FPL.
Kansas Adults (+): Continuous eligibility. (7/1/2010) All Medicaid Eligible Groups (+): Simplify income counting for eligibility determination. (Unknown, 10/1/2010) Children (+): Presumptive Eligibility expansion. (8/1/2010) Parents (+): Transitional Medicaid extended. (7/1/2010) Application & Renewal (+): Implement Express Lane eligibility. (1/1/2011) Application & Renewal (+): Passive Renewal for children. Application & Renewal (+): Modified and pre-populated renewal form.
68 Positive changes counted in this report are denoted with (+). Negative changes counted in this report are denoted with (-). Changes that were not counted as positive or negative in this report, but were mentioned by states in their responses, are denoted with (nc). Premiums were counted as (nc) unless the premium as newly applied, which was denoted as (NEW).

00 83
State Eligibility, Premium and Application Changes Kentucky
Louisiana Aged & Disabled (+): The State plans to take advantage of a new CMS interpretation permitting Home and Community-Based Services waiver consumers to spend-down to special income standard (300% of SSI). (Unknown, 1/1/2011) Adults (nc): Change from Family Planning waiver to state plan option. (Unknown) Application & Renewal (+): Implement Express Lane Eligibility. (07/01/2010 ) Application & Renewal (+): Implement Spanish Version Online Applications. (7/1/2010)
Maine
Maryland
Massachusetts Michigan
Minnesota Application & Renewal (+): The State created an online application for recipients of services through the State Health Access Program (SHAP).
Mississippi
Missouri
Montana Adults (+): Family Planning State Plan Amendment implemented. (3,000–6,000; 9/1/2010) Application & Renewal (+): Created online application, a common application for children’s Medicaid and CHIP. Premiums (NEW): Medicaid for Workers with Disabilities is a buy-in program. (7/1/2010)
Nebraska Pregnant Women & Children (+): Implemented ICHIA option. Premiums (NEW): Children on the1915 (c) waiver for children with Autism Spectrum Disorder. Households with income at or greater than 150% FPL would be subject to a sliding scale premium.
Nevada
New Hampshire Adults (nc): Potential for Family Planning State option. (Unknown) Application & Renewal (+): Development of a centralized call center. Application & Renewal (+): Expansion of the NH Electronic Application System (NH EASY) to allow for electronic applications to be submitted by individual applicants. Application & Renewal (nc): Potential implementation of federally mandated asset verification system. Application & Renewal (nc): Potential implementation of voluntary receipt of electronic notices. Application & Renewal (nc): Potential implementation of a 'passive' redetermination system.
New Jersey
New Mexico Adults (-): Plan to expand waiting list for State Coverage Insurance (SCI) by preventing employer groups enlisting new enrollees. (6,062; Unknown)
New York Adults (+): Implement 12 months continuous coverage for adults. (61,000, 1/1/2011) Parents (+): Transitional Medical Assistance extended from 6 months to 12 months. (10/1/2010) Other (+): Elimination of the prohibition on state employees enrolling in Family Health Plus. (9/1/2010) Application & Renewal (+): Implement a statewide enrollment center to take telephone renewals for community Medicaid coverage. Application & Renewal (+): Automatic Finger Imaging System eliminated. (7/1/2010)
North Carolina Pregnant Women & Children (+): Implemented ICHIA option.
North Dakota
Ohio Application & Renewal (+): Implement real-time online application. (10/1/2010)
Oklahoma Application & Renewal (+): Online Enrollment (pushed back from 2010)
Oregon Application & Renewal (+): Further simplification in online application for Medicaid only. Application & Renewal (+): Implemented Express Lane Eligibility via SNAP.
Pennsylvania Application & Renewal (+): Redesign of Medicare Savings Program application and renewal forms using easy to understand text and simplifies form layouts. Application & Renewal (nc): Automation of Medical Improvements for Patients and Providers Act (MIPPA) eligibility within the Client Information System. (Unknown, 7/2011)
Rhode Island
South Carolina
South Dakota
Tennessee
Texas Disabled Children (+): Implemented a Medicaid Buy-in for Children Program for children with a disability under age 19.

0084
State Eligibility, Premium and Application Changes Pregnant Women & Children (+): Implemented ICHIA option.
Utah Application & Renewal (+): Developed an online Medicaid eligibility renewal tool. Application & Renewal (+): Implemented ex-parte/administrative renewals.
Vermont Premium Assistance Program (+): Expansion of Premium Assistance Program to Medicaid on voluntary basis. (35; 7/1/2010) Application & Renewal (+): Online submittal of application.
Virginia
Washington Application & Renewal (nc): Exploring the possibility of simplifying application process for children with Express Lane eligibility.
West Virginia Application & Renewal (nc): Evaluating option for Medicaid to adopt CHIP passive renewal process to enable State to become eligible for CHIPRA Performance Bonus
Wisconsin Adults (nc): Family Planning State Plan Option (conversion of current waiver). (52,000; 11/1/2010)
Wyoming Adults (+): Family planning waiver for women between the ages of 16 and 45. (Waiver approved by CMS. Now considering state plan option.)

00 85
Appendix A-5a Benefit Related Actions Taken in the 50 States and the District of Columbia
FY 201069 State Benefit Change
Alabama
Alaska Arizona All Adults (-): Eliminated coverage of medically necessary dentures and specified dental services. (October
1, 2009) Arkansas Adults (+): Added limited dental coverage.
California Non-institutionalized, Non-Pregnant Adults (-): Eliminated acupuncture. Non-institutionalized, Non-Pregnant Adults (-): Eliminated dental (with exceptions). Non-institutionalized, Non-Pregnant Adults (-): Eliminated audiology and speech services. Non-institutionalized, Non-Pregnant Adults (-): Eliminated optometry services. Non-institutionalized, Non-Pregnant Adults (-): Eliminated podiatry. Non-institutionalized, Non-Pregnant Adults (-): Eliminated psychology services. Non-institutionalized, Non-Pregnant Adults (-): Eliminated chiropractic services. Non-institutionalized, Non-Pregnant Adults (-): Eliminated incontinence creams and washes. (All cuts listed apply to both managed care and fee for service July 1, 2009)
Colorado Children (+): Add coverage for fluoride varnish for Medicaid children, ages 0 through 4, in conjunction with an oral evaluation and counseling with a primary caregiver after performing a risk assessment. All (-): All outpatient clinics will be required to obtain prior authorization for non-emergent CT, non-emergent MRI and all PET scans.
Connecticut All Adults (-): Eliminated coverage of OTCs except insulin, insulin syringes, and nutritionals for tube fed individuals or those who cannot ingest in any other way.
Delaware
District of Columbia
Florida Georgia Hawaii All Adults (-): Dental benefits reduced to emergency only. (August 2009)
Idaho
Illinois All (-): Small quantity and duration limitations implemented. (October 1, 2009)
Indiana
Iowa All (-): Added prior authorization requirement for imaging services. (March 1, 2010) Kansas All: (-): Placed limits on home health visits. (March 1, 2010)
Kentucky
Louisiana
Maine Adults (-): Adding functional eligibility limits on Targeted Case Management and Private Non-Medical Institutional services. Children (-): Tightened Katie Becket functional eligibility standard.
Maryland All (+): Added a targeted case management benefit for adults with serious mental illness and children with serious emotional handicaps. (September 2009) Expansion Adults (+): Added substance abuse and ER services to the 1115 Primary Adult Care Program.
Massachusetts
Michigan All (+): Added coverage of occupational therapy services in physician offices. (February 2010)
Minnesota All Adults (-): Applied dental service limits including limits on x-rays and dentures. (January 2010) All Adults (-): Applied utilization controls to Personal Care Attendant (PCA) services including delivering provider training, limiting hours that can be worked monthly, adopting new background study and supervision requirements for PCA workers and implementing improved assessment and authorization processes.
Mississippi
69 Positive changes counted in this report are denoted with (+). Negative changes counted in this report are denoted with (-). Changes that were not counted as positive or negative in this report, but were mentioned by states in their responses, are denoted with (nc).

0086
State Benefit Change Missouri Montana
Nebraska All (+): Added coverage for birthing centers. (March 1, 2010) All (+): Added coverage for school-based clinics. (April 1, 2010) All (+): Added coverage for secure psychiatric residential rehabilitative services. (June 2010)
Nevada Children(-): Added medical necessity criteria to children’s mental health rehabilitation services. All Adults (+): Restored coverage for non-medical vision services. (July 2009) All Adults (-): Added prior authorization requirements for personal care PT and OT. (November 2009) All Adults (-): Limited diapers and incontinence pads to 6 per day. (March 2010)
New Hampshire All (-): Eliminated chiropractic benefit.
New Jersey All (-): Eliminated coverage of specific cough, cold and cosmetic drugs. (July 1, 2009)
New Mexico Aged & Disabled (+): Adding coverage for Intensive Outpatient services for substance abuse and removing restrictions on limited substance abuse treatment. All Adults (-): Eliminated coverage of bariatric surgery and limited routine adult vision services and appliances to one every three years (36 months) rather than one every two years (24 months). (May 14, 2010)
New York Children & Pregnant Women (+): Added coverage for smoking cessation counseling services. (January 1, 2010) All (+): Adding coverage cardiac rehabilitation; substance abuse screening, brief intervention, and referral for treatment (Emergency Department). ( January 1, 2010)
North Carolina Aged & Disabled (-): Utilization controls applied to personal care services.
North Dakota All Adults (+): Expanded coverage for optometric services by increasing eye exam and eyeglass replacement policy from 1 every 3 years to 1 every 2 years.
Ohio All Adults (-): Restricted dental visits and certain DME items. (January 1, 2010)
Oklahoma
Oregon Non-Pregnant Adults (-): Eliminated vision services when prescribed for acuity only reduced dental services and denture coverage. (January 1, 2010)
Pennsylvania All (+): Added psychiatric rehabilitation services. (May 1, 2010)
Rhode Island
South Carolina South Dakota
Tennessee Texas All (+): Expanded ambulance services to cover advanced life support services and added coverage for
evaluation and management including oral medication management for tuberculosis services. (September 1, 2009) All (+): added coverage for cardiac rehabilitation services and subcutaneous injection ports for self-administered injections as a benefit. (October 1, 2009) All (+): provided rabies prophylaxis and expanded coverage of non-solid organ transplants. (February 1, 2010) All (+): Expanded allergy skin testing. (April 1, 2010) All (+): Expanded covered pulmonary function studies. (April 1, 2010) All (+): Expanded IV therapy and supplies, added commode chairs, and expanded miscellaneous DME coverage. (April 1, 2010) All (+): Expanded vision services to include expanded coverage of UV lenses and coverage of polycarbonate lenses with specific diagnoses and conditions. (April 1, 2010) All (+): Added coverage of nipple tattooing as part of reconstructive procedures for clients over age 18. (June 1, 2010) Children (+): Expanded hearing aid services and supplies and made developmental testing and assessment a benefit as part of Texas Health Steps Visits. (September 1, 2009) Children (+): Made screening brief intervention and referral to treatment (SBIRT) for alcohol and drug abuse a benefit for ages 10-20 years. (October 1, 2009) Children (+): added environmental lead investigations as a payable benefit for Texas Health Steps. (July 1, 2010) All Adults (+): Added coverage for annual preventive well exams, including preventive testing and vaccine/toxoid administration. (January 1, 2010) All Adults (+): Made colorectal cancer screening a benefit for adults over age 50. (February 1, 2010)
Utah Non-Pregnant Adults (+): Coverage for PT and OT therapies restored to levels in effect prior to 11/1/08. (July 1, 2009)
Vermont All Adults (+): Coverage for limited chiropractic services reinstated.

00 87
State Benefit Change Virginia All (-): Expanded prior authorization to additional mental health services. July 1, 2009)
All (-): Implemented prior authorization of certain dental services. (October 2009) All (-): Eliminated a disease management program. (November 2009)
Washington All Adults (-): DME benefit reduced including elimination of coverage for bath support equipment, enteral nutrition and automated blood pressure cuffs, and new quantity limits on certain medical supplies including incontinence and diabetic supplies and on non-sterile gloves. (July and August 2009) All Adults (-): Reduced dental services. (July 2009) All Adults (-): Reduced in-home personal care hours by an average of 4% based on the acuity level of the care recipients with the largest reductions made to lower acuity clients and the smallest reductions made to higher acuity clients. (July 2009) All (-): Restricted over-the-counter drugs and prescription products used to treat cough and cold symptoms. (September 2009)
West Virginia Non-Disabled Adults and Children (+): Added EPSDT services and revised mental health parity provisions of DRA Benchmark benefit package.
Wisconsin Adults (+): Added coverage for screening, brief intervention and referral to treatment (SBIRT) services for individuals with or at-risk for substance use-related problems for Medicaid Standard Plan, Benchmark Plan and Core Plan. (January 1, 2010) Expansion Adults (+): Added podiatry services. (January 1, 2010) Expansion Adults (+): Added home health services post-hospitalization. (January 1, 2010) Expansion Adults (+): Added hospice services added to Core Plan. (January 1, 2010) Expansion Adults (+): Added transportation services for members of a Benchmark Plan. (April 10, 2010) Children (+): For children in Benchmark plans, expanded EPSDT coverage (April 10, 2010) Children (+): For children in Benchmark plans, eliminated limits on mental health /substance abuse services. (May 10, 2010)
Wyoming All (-): Reduced coverage on ultrasounds and other radiology and on coverage for eyeglasses (less frequent replacement) and tightened other prior authorization requirements. (January 2010)

0088
Appendix A-5b Benefit Related Actions Taken in the 50 States and the District of Columbia
FY 201170 State Benefit Change
Alabama
Alaska All Adults (+): Expanded dollar cap for adult dentures. All (+): Added Targeted Case Management for traumatic brain injury.
Arizona All Adults (-): Eliminating most dental care, podiatry services. (October 1, 2010) All Adults (-): Eliminating insulin pumps, percussive vests, bone-anchored hearing aids, cochlear implants, and all orthotics. (October 1, 2010) All Adults (-): Eliminating specified transplants. (October 1, 2010) All Adults (-): Eliminating well exams. (October 1, 2010) All Adults (-): Eliminating certain microprocessor-controlled prosthetics. (October 1, 2010) All Adults (-): Outpatient physical therapy limited to 15 visits per contract year. (October 1, 2010) Expansion Adults (-): Eliminating non-emergency transportation. (October 1, 2010)
Arkansas
California Non-institutionalized, Non-Pregnant Adults (+): Restored optometry benefit. (by court order, July 27, 2010) Non-institutionalized, Non-Pregnant Adults (-):Will cap DME and certain medical supplies. Non-institutionalized, Non-Pregnant Adults (-): Limit prescriptions to six per month. Non-institutionalized, Non-Pregnant Adults (-): Limit physician visits to 10 per year.
Colorado Pregnant Women (+): Will increase access to smoking cessation counseling. (October 2010) Adults (+): Added SBIRT services (screening, brief intervention and referral to treatment) for substance abuse. (August 2010) All (+): Will increase number of procedures allowed by unsupervised dental hygienists (upon CMS approval). Children (+): Extending hospice eligibility from 6 months to 9 months or less (upon CMS approval).
Connecticut
Delaware
District of Columbia
All (nc): Converted non-emergency medical transportation brokerage arrangement from an administrative activity to a State Plan benefit under DRA authority. (July 1, 2010) All Adults (-): Capping personal care assistance hours at 1,040 per year. (January 1, 2011)
Florida Georgia Children (+): Will allow pediatricians to apply fluoride varnishes. Hawaii
Idaho
Illinois
Indiana All (-): Added utilization controls on Medicaid mental health rehabilitation option services. (July 2010)
Iowa All (nc): Began Applying the CMS National Correct Coding Initiative edits in the Medicaid claims processing system.
Kansas All (-): Eliminated reimbursement of attendant care provided in the local education agency setting. (July 1, 2010) All (-): Will limit hospice services to 210 days. (October 1, 2010)
Kentucky
Louisiana Children (+): Implementing Coordinated Systems of Care for children and youth at risk of out of home placement. (January 2011) Children (+): Added pediatric day health care. (eff. date TBD) Pregnant Women (+): Will implement tobacco cessation services. (eff. date TBD) All (+): Implementing diabetes self-management training. (eff. date TBD)
Maine
Maryland
70 Positive changes counted in this report are denoted with (+). Negative changes counted in this report are denoted with (-). Changes that were not counted as positive or negative in this report, but were mentioned by states in their responses, are denoted with (nc).

00 89
State Benefit Change Massachusetts Adults in MassHealth Standard, CommonHealth and Family Assistance (-): Eliminated restorative dental
services (filings), crowns, endodontic services (root canals), periodontic services (deep scalings), dentures (full, partial or repair) and surgical procedures related to full or partial dentures. (July 1, 2010) Adults in Commonwealth Care at or below 100% FPL (-): Eliminated restorative dental services (fillings), crowns, endodontic services (root canals), periodontic services (deep scalings, gingivectomy), dentures (full, partial or repair) and house call/home visit. (July 1, 2010) All Adults (-): Most acute inpatient hospital stays will be covered for only the first 20 days. (October 1, 2010)
Michigan All (+): Adding coverage of ambulatory surgical centers. (January 2011)
Minnesota All Adults (-): Limited number of chiropractic visits per year to 12. (July 1, 2010) Pregnant women (+): Adding coverage for birthing centers. (January 2011)
Mississippi Children (+): Allowing medical providers to be reimbursed for an oral health assessment and application of fluoride varnish for children under age three.
Missouri Montana
Nebraska All (+): Added coverage for pediatric feeding clinics. (July 1, 2010)
Nevada
New Hampshire All (+): Hospice benefit implemented. (July 2010) All (-) : Added prior authorization requirements for podiatry and occupational therapy visits over a specified limit. (July 2010) All (-): Will eliminate cap on physician and emergency department visits. (December 2010)
New Jersey All (-): Orthodontic services restricted to persons with severe medical needs. (July 1, 2010)
New Mexico All Adults (-): Reduced frequency of panoramic and full mouth intra oral x-rays from once every 3 years to once every 5 years for adults. (August 1, 2010) All Adults (-): Reduced frequency and amounts allowed for disposable medical supplies. (August 1, 2010)
New York All Adults (+): Expanding substance abuse screening services.
North Carolina All (-): Applying additional PCS utilization controls. (January 1, 2011) All (-): Increasing medical necessity standard. (January 1, 2011) All Adults (-): Eliminating coverage for surgery for clinically severe obesity and panniculectomy procedures. (October 1, 2010) All Adults (-): Imposing new coverage restrictions on breast surgery. (October 1, 2010) All Adults (-): Eliminating Maternal Outreach Worker program. (September 1, 2010)
North Dakota
Ohio
Oklahoma
Oregon Pennsylvania
Rhode Island Aged and Disabled (+): Will add smoking cessation. (September 1, 2010) Aged and Disabled (+): SBIRT services (screening, brief intervention and referral to treatment) for substance abuse. (September 1, 2010)
South Carolina All (nc): Restructured rehabilitative behavioral health services benefit as required by CMS. (July 1, 2010) South Dakota All Adults (+): Coverage of liver transplants added. (July 1, 2010)
Tennessee Texas All (+): Adding substance abuse services for adults. Phase I implementation includes the following outpatient
services: assessment, ambulatory detoxification, chemical dependency counseling, and medication assisted therapy (September 2010). Phase II includes the following services provided in a residential setting: detoxification and treatment (January 1, 2011). All (+): Expanding coverage for total parenteral nutrition services and parenteral nutrition infusion pumps from under 21 to all ages and adding coverage for implantable infusion pumps. (early 2011) Adults, Children and Pregnant Women (+): Adding a comprehensive substance abuse benefit for children and adults to include: medically supervised, residential or outpatient detoxification, medication management, residential and outpatient services, specialized residential services for women and outpatient chemical dependency counseling. (September 1, 2010 with phase-in of residential services January 1, 2011) Children (nc): Realigning orthodontic services including payment methodology. (Spring 2011)
Utah
Vermont Adults (-): Limited number of PT, OT and speech therapy visits. (July 15, 2010) All (-): Added prior authorization requirements for radiology services. (July 1, 2010) All (-): Reduced number of covered drug tests. (July 1, 2010)

0090
State Benefit Change Virginia All (-): Modified current limit for incontinence supplies. (July 1, 2010)
Adults (-): Revised the annual limit and prior authorization requirements on PT, OT and speech therapy. (August 1, 2010)
Washington All Adults (-): Eliminated dental coverage for cast metal partials (resin only), immediate dentures, palliative emergent treatment and deep IV and non-IV conscious sedation (except for developmentally disabled adults) and limited denture coverage to two complete per lifetime. All Adults (-): Reduced in-home personal care hours associated with incontinence and special diets. (July 2010) All Adults (+): Partially restored in-home personal care hours reduced on July 1, 2009. (July 1, 2010)
West Virginia Wisconsin
Wyoming All (+): Added coverage for private residential treatment facilities. (July 1, 2010)

00 91
Appendix A‐6aPharmacy Cost Containment Actions in Place in the 50 States and the District of Columbia
FY 2010‐2011
StatesPreferred Drug
List
Prior Authorization
Program
Supplemental Rebates
Multi‐State Purchasing Coalition
Script LimitsState MAC Progam
Full or Partial MC Carve‐out
Alabama X X X X XAlaska X X X XArizonaArkansas X X X X XCalifornia X X X X XColorado X X X XConnecticut X X X X XDelaware X X X X X XDistrict of Columbia X X X XFlorida X X X XGeorgia X X X X XHawaii X XIdaho X X X X XIllinois X X X X X XIndiana X X X XIowa X X X X X XKansas X X X X XKentucky X X X X X XLouisiana X X X X X XMaine X X X X X XMaryland X X X X X XMasschusetts X X X XMichigan X X X X X XMinnesota X X X X XMississippi X X XMissouri X X X XMontana X X X XNebraska X X XNevada X X X X XNew Hampshire X X X X XNew Jersey XNew Mexico X X X XNew York X X X X X XNorth Carolina X X XNorth Dakota X XOhio X X X XOklahoma X X X X XOregon X X X X X XPennsylvania X X X X X XRhode Island X X X XSouth Carolina X X X X X XSouth Dakota X XTennesee X X X X X X XTexas X X X X X XUtah X X X X X XVermont X X X X XVirginia X X X XWashington X X X XWest Virginia X X X X X X XWisconsin X X X X X XWyoming X X X X XTotal 44 48 44 26 16 44 15

0092
Appendix A‐6bPharmacy Cost Containment Actions Taken in the 50 States and the District of Columbia
FY 2010‐2011
2010 2011 2010 2011 2010 2011 2010 2011 2010 2011 2010 2011 2010 2011 2010 2011 2010 2011 2010 2011Alabama X X X X XAlaska X X X XArizona XArkansasCalifornia X X X XColorado X X X X X X XConnecticut XDelaware XDistrict of Columbia XFloridaGeorgia X X XHawaiiIdahoIllinoisIndiana XIowa X X X XKansas X X X X X X XKentucky X X XLouisiana XMaine X X X XMarylandMassachuesetts X X XMichigan X X X XMinnesotaMississippi X X XMissouri X XMontana X X X XNebraska X X XNevadaNew Hampshire x X X X X X XNew Jersey X X X XNew Mexico X XNew York X X X X X X XNorth Carolina X X X X XNorth DakotaOhio X XOklahoma X X XOregon X X X XPennsylvania X X X X X X X X X XRhode Island X XSouth Carolina X X X X X XSouth Dakota XTennesseeTexas X XUtah X X X X X X X X XVermont X X XVirginia X X X X X X X X XWashington X X X X XWest Virginia X X X X X X X XWisconsin X X X X X X X X XWyomingTotal 1 2 7 3 10 6 22 17 11 10 16 9 2 0 11 8 4 0 11 14
States
Multi‐State Purchasing Coalition
New/Lower State MAC
Carve‐outOther Actions
Impose Script Limits
Reduce Disp Fee
Reduce Ingredient
Cost
Preferred Drug List
More Drugs/Prior Authorization
Suplemental Rebates

00 93
Appendix A‐7Medicaid Care Management Actions Taken in the 50 States and the District of Columbia
FY 2010‐2011
2010 2011 2010 2011Alabama AlaskaArizonaArkansas California X X X XColorado X XConnecticut X X DelawareDistrict of ColumbiaFlorida X XGeorgia X Hawaii IdahoIllinois X X X XIndiana X XIowa X XKansasKentucky XLouisiana X XMaine X XMarylandMassachusetts X X X XMichigan XMinnesota MississippiMissouri XMontana X X Nebraska X XNevada New HampshireNew Jersey New Mexico New York X X X North Carolina X XNorth DakotaOhio X OklahomaOregon X XPennsylvania X XRhode Island X X XSouth Carolina XSouth Dakota XTennessee X XTexas X XUtah XVermont XVirginia X X Washington X West Virginia XWisconsin X X XWyomingTotal 13 20 16 13
Managed Care Policy Changes: New Service Areas, Populations, Mandatory Groups or Managed LTC
Initiatives
New Disease Management or Chronic Case Management
InitiativesStates

0094
Appendix A‐8Medicaid Quality Measures in Place in the 50 States and the District of Columbia
FY 2010‐2011
Public Reporting of
MCO In Place 2009
In Place 2010
In Place 2011
In Place 2009
In Place 2010
In Place 2011
2010
Alabama X X XAlaska X X X XArizona X X X X X X XArkansas X X X X X X XCalifornia X X X X X X XColorado X X X X X X XConnecticut X X X X X XDelaware X X X X X X XDistrict of Columbia X X X X X XFlorida X X X X X X XGeorgia X X X X X X XHawaii X X X X X X XIdahoIllinois X X X X X X XIndiana X X X X X X XIowa X X X X X X XKansas X X X X X X XKentucky X X X X X XLouisiana X X X X X X XMaine X X X X X XMaryland X X X X X X XMassachusetts X X X X X X XMichigan X X X X X X XMinnesota X X X X X X XMississippiMissouri X X X X X X XMontana X X X XNebraska X X X X X X XNevada X X X X X XNew Hampshire X X X X X XNew Jersey X X X X X X XNew Mexico X X X X X X XNew York X X X X X X XNorth Carolina X X X XNorth DakotaOhio X X X X X X XOklahoma X X X X X X XOregon X X X X X X XPennsylvania X X X X X X XRhode Island X X X X X X XSouth Carolina X X X X X X XSouth Dakota Tennessee X X X X X X XTexas X X X X X X XUtah X X X X X X XVermont X X X X X X XVirginia X X X X X X XWashington X X X X X X XWest Virginia X X X X X X XWisconsin X X X X X X XWyoming X X X X X XTotal 45 47 47 43 43 43 41
HEDIS® or Similar Performance Measures: MCOs
CAHPS® or Similar Patient Surveys: MCOsStates

00 95
Appendix B: Profiles of Selected States:
Alabama
Colorado
Maryland

0096
Alabama Case Study
Alabama has two operating budgets, both of which require balancing. The Education Trust Fund (ETF), funded primarily with income, property and sales taxes, supports education-related programs. This revenue source tends to fluctuate with economic conditions so the state created the Proration Prevention Account (PPA) rainy day fund to help mitigate the impact of fluctuations. The General Fund (GF) budget supports other government programs, including Medicaid, through a mix of more stable revenue sources including insurance premium taxes, oil and gas severance taxes, but these tend to be slow growing sources leaving the GF prone to structural deficit when program growth exceeds revenue growth.71 The Alabama Trust Fund, which receives royalties and lease payments from oil and natural gas drilling interests in Alabama coastal waters, serves as additional reserve for both ETF and GF budgets. The state’s constitution requires proration of the state’s operating budgets when revenues are insufficient to cover appropriations. Alabama budget concerns began in 2008 when Governor Riley depleted the Proration Prevention Account to avoid cuts to education programs. Alabama’s fiscal year begins on October1 and in November 2008, citizens voted for a constitutional amendment to create a rainy day account for the General Fund, and to expand the PPA. FY 2009 revenues fell sharply and in spite of additional reserves, before the year was over, the Governor called for an 11 percent cut in education programs, and a 10 percent cut in most General Fund programs.72 In FY 2010, the state relied on ARRA funding to plug a $1.2 billion budget gap. Approximately $500 million went into the ETF for education and $1 billion into the General Fund. The FY 2011 GF budget Governor Bob Riley signed on April 21, 2010 totals $1.57 billion, a decrease of about $32.8 million from that budgeted in FY 2010 and $216 million less than FY 2009 appropriations.73
FY 2009 Actual FY 2010 Budgeted FY 2011 Enacted
Education Trust Fund $5,707,308,868 $5,326,190,270 $5,495,772,478
State General Fund Medicaid Agency
$1,787,325,974 $ 452,045,954
$1,604,257,314 $ 307,968,537
$1,571,450,000 $ 345,310,381
71 Arise Citizens’ Policy Project; On the Brink: Alabama’s Looming Budget Shortfalls; Fact Sheet; July 31, 2009. 72 Ibid. 73 Alabama Legislative Fiscal Office, Budget and Fiscal Information; State General Fund FY 2011 as Enacted: accessed September 8, 2010 at http://www.lfo.state.al.us/budget-fiscal.htm. FY 2010 total includes reappropriated FY 2009 reversions and estimated increases to FY 2010 appropriations as of December 31, 2009.

00 97
Projected FY 2011 revenue remains approximately 9 percent below FY 2007 revenue collections from personal income, sales and corporate taxes.74 Unemployment stood at 9.7 percent in July 2010 (preliminary data) down from peak in January and February 2010 of 11.1 percent, substantially higher than the national average.75 Alabama’s economy, after a slow recovery from hurricane Katrina, suffered an additional setback when the Deepwater Horizon oil rig operating off the coast exploded, spilling millions of barrels of oil into Gulf waters. Impact of the Oil Spill In 2009 an estimated 21 million people visited Alabama, spending over $9.3 billion and generating approximately $679 million in state and local tax revenue.76 The Gulf Coast area accounts for approximately 35 percent of travel related expenditures, and two Gulf Coast counties, Baldwin and Mobile account for $3.1 billion in travel-related spending and 35 percent (approximately 56,300 jobs) of all travel related employment in the state.77 The oil spill resulting from the explosion of British Petroleum’s (BP) Deepwater Horizon oilrig in April took a huge bite out of the summer tourism industry concentrated in these coastal areas, but also affected Alabama’s economy throughout the state. In a study of the potential impact of the spill, researchers estimate businesses in Alabama’s gulf regions will lose up to 41percent of tourism revenue in the 12 months following the spill relative to “business as usual”. In addition, based on experience in similar disasters, the area could take up to three years to return to its baseline economy.78 In August 2010, Governor Riley submitted a $148 million claim to BP for the estimated loss in state revenue coming from the region of the spill. On the same day the Governor submitted the claim, Alabama Attorney General Troy King filed lawsuits against BP, Transocean and Halliburton seeking unspecified economic and punitive damages (King recently lost in the GOP primary election).79 BP has suspended discussions regarding the claim pending resolution of the lawsuit.
74 HMA analysis of National Association of State Budget Officers; Fiscal Survey of the States: June 2010, June 2009 and June 2008. 75 Current Population Survey; Local Area Unemployment Statistics: http://www.bls.gov/lau/. 76 Alabama Tourism Department; Travel Economic Impact Report 2009 77 Ibid. 78 Oxford Economics; Potential Impact of the Gulf Oil Spill on Tourism; A report prepared for the U.S. Travel Association; July 2010. 79 Phillip Rawls; Alabama AG sues BP, others over Gulf oil spill; AP Associated Press Aug 12, 2010

0098
Alabama Focuses on Coverage for Children and with HIT The Alabama Medicaid program serves approximately 872,000 individuals80 through Primary Care Case Management. The $5.2 billion program relies heavily on federal funds, with the state contributing just $345 million of the total for FY 2011. The state reported that relative high federal financial participation rate, ARRA enhanced funding and conservative management of the program generally helped Alabama avoid major cuts to the program. While state spending decreased in FY 2009, overall state and federal appropriations increased from $4.8 billion in FY 2009 to $5.2 billion in FY 2011. The FY 2011 Medicaid GF state budget increased $37 million over that budgeted for FY 2010, but assumed full extension of the ARRA enhanced FMAP, or about $196 million. The legislation enacted by Congress, however, with its phase-down of the federal enhancement over the 6-month extension, provided Alabama with only $133 million in additional Medicaid funding.81 The state’s challenge is to identify around $64 million in additional savings in FY 2011, or about 18 percent of its state-funded Medicaid budget.82 In spite of economic and budget restraints, the Alabama Medicaid Agency is leading the state to make remarkable progress in the area of children’s coverage and health information technology. Alabama excelled during trying economic times is in streamlining processes and removing barriers to enrolling children into Medicaid and the Children’s Health Insurance Program (CHIP). In December 2009, Alabama was one of nine states that received a federal performance bonus award for its effective use of innovative processes to enroll children. Alabama received $39.1 million of the $72.6 million awarded – the largest award by far.83 To receive the performance bonuses states had to meet performance goals set in the Children’s Health Insurance Reauthorization (CHIPRA) law. States were to adopt a minimum of five of eight program features known to simplify enrollment, and document increases in enrollment over the course of a year (2009). Alabama adopted five program features:
Continuous eligibility Liberalization of asset requirements Elimination of in-person interviews Use of same application and renewal form, and Automatic/administrative renewal
80 Alabama Medicaid website; Monthly eligibles by aid category; data is for July 2010; http://www.medicaid.alabama.gov/resources/eligibility_statistics.aspx. . 81 Federal Funds Information for States; Senate Proposal Would Extend ARRA FMAP, Create Education Jobs Fund; Issue Brief 10-32; July 30, 2010; Accessed through Sunshine Review website, August 2010: http://sunshinereview.org/index.php/Alabama_state_budget. 82 Mary Orndorff; Aid from Congress not Enough to Cover Alabama’s Medicaid Budget Shortfall; The Birmingham News, August 11, 2010. See Also Alabama Medicaid Agency website: Medicaid newsletter, April 30, 2010 http://www.medicaid.state.al.us/news/news_articles.aspx?tab=2. 83 US Department of Health and Human Services; States Get Bonuses for Boosting Enrollment in Children's Health Coverage; News Release December 17, 2009; Accessed 09/10 at: http://www.hhs.gov/news/press/2009pres/12/20091217a.html.

00 99
States were eligible for an enhanced bonus if they met a target threshold increase in enrollment. Alabama increased enrollment of children by 39 percent and was the only state to receive the enhanced funding, a remarkable achievement for any Medicaid program, but especially for one frequently described as “bare bones.”84 In 2010, Alabama continued to make improvements to its application process by implementing Express Lane Eligibility and by using the SSA data match to verify citizenship. In the area of HIT, Alabama is moving toward a statewide Health Information Exchange independent of Medicaid with a guiding philosophy of “One patient, one record, regardless of payer, regardless of provider.”85 To jumpstart Alabama’s HIT progress, the state received a $7.6 million Medicaid Transformation Grant in 2007 for an initiative called Together for Quality. Together for Quality actively involved multiple stakeholders including physicians, Blue Cross Blue Shield of Alabama, and a host of others in a public-private collaborative to develop an electronic health record based on a medical home model. The resulting QTool provides e-prescribing and clinical decision support. The system houses patient summary information and health history with an added overlay of clinical rules and alerts targeting asthma and diabetes. The system is freestanding or can connect to an electronic medical record system. Led by the Alabama Medicaid Agency, the Together for Quality initiative expanded this system to incorporate two additional elements. Q4U is a comprehensive chronic care management program initially piloted in eight counties involving physicians in 54 practices. The goal of Q4U is to use the electronic health records system to prevent strokes, kidney failure, amputations and other complications associated with chronic disease. Qx is a data exchange between state health and human service agencies on common clients. The platform allows interoperability between disparate systems with a goal to improve workflow and interagency coordination through a paperless behind-the-scenes process. In February 2010, the state received an ARRA funded grant totaling $10.5 million through the State Health Information Exchange Cooperative Agreement Program.86 The grant sets the foundation for expanding Alabama’s initial progress to develop a statewide health information exchange that meets federal requirements for “meaningful use”. The state continues to work with a broad base of stakeholders to determine future design for the system and has established the Alabama Health
84 Office of Governor Bob Riley; Alabama Medicaid receives $39.1 million bonus for efforts to enroll uninsured children; Press Release, December 17, 2009; http://www.medicaid.state.al.us/documents/News/News_Releases/Governor_Announces_$39_Million_Performance_Bonus_12-17-09.pdf. 85 Carol H. Steckel, Commissioner, Alabama Medicaid Agency; Letter to Office of National Coordinator for Health Information Technology, application for funding under the Health Information Exchange Cooperative Agreement Program; September 10, 2009. 86 American Recovery and Reinvestment Act of 2009, Title XIII - Health Information Technology, Subtitle B—Incentives for the Use of Health Information Technology, Section 3013, State Grants to Promote Health Information Technology; See also: Office of National Coordinator for Health Information Technology: State Health Information Exchange Cooperative Agreement Program; http://healthit.hhs.gov/portal/server.pt?open=512&objID=1488&parentname=CommunityPage&parentid=58&mode=2&in_hi_userid=11113&cached=true.

00100
Information Exchange Advisory Commission along with several workgroups to address various elements of the initiative. Other Medicaid policy changes implemented in FY 2010 or planned for FY 2011 are described below: Provider Rates In FY 2010, nursing facility rates and inpatient hospital payments (funded through a provider tax) increased. In FY 2011:
– Inpatient hospital payments increased, funded through a provider tax – Nursing facility rates increased .
Long-Term Care In FY 2011
– Will implement a community transition waiver effective January, 2011. – Will expand the consumer-directed Personal Choices Program to two counties (Mobile and Baldwin)
effective October, 2011. – Will implement a PACE program in October, 2011. – Will add coverage for ventilator-dependent NF residents (January, 2011).
Prescription Drug Controls and Limits Pharmacy dispensing fee increased near the end of FY 2010 with a change to the basis for pharmacy
ingredient cost reimbursement from AWP to ACC. While the dispensing fee increased, the state expects overall savings of $51 million from the pharmacy changes.
Managed Care In FY 2010, expanded chronic disease management program to additional counties. In FY 2011:
– Will expand PCCM disease management to additional geographic areas. – Working to transition a PCCM Medical Home program from 1915(b) waiver status to State Plan
benefit (effective April, 2011). Application and Renewal Process In 2010:
– Implemented Express Lane eligibility. – Adopted data matching process with Social Security Administration for citizenship verification.
Other Actions Exploring feasibility of managed long-term care. Continuing work on a statewide clinical health information exchange (HIE) through work of an Advisory
Commission and six workgroups; anticipate establishing statewide HIE in FY 2011 with capability for analytical and data reporting, including quality measures.

00 101
Colorado Case Study
Colorado state budget policy is constrained by a number of constitutional and statutory limits not found in most other states. Most notable is the Taxpayer Bill of Rights (TABOR), part of the Colorado’s state Constitution, which limits the state’s revenue growth to the sum of inflation plus population growth in the previous calendar year. Revenue collections in excess of this limit must be refunded to taxpayers, unless voters decide the State can retain the excess. State law also mandates a minimum 4 percent state General Fund reserve requirement (although this minimum was temporarily reduced to 2 percent for FYs 2009 and 2010), and Amendment 23 (another constitutional provision approved by the voters in 2000) requires per-pupil funding to be increased each year by the rate of inflation plus 1 percent through FY 2011 and by the rate of inflation each year afterward.
As state policymakers struggled to deal with the effects of the recession on the state’s budgets for FYs 2009, 2010, and 2011, they were assisted by a TABOR “time out” passed by voters in November 2005 (Referendum C) to help the state recover from the previous economic downturn. Referendum C allowed the State to retain all revenues for the five year period ending June 30, 2010 resulting in an additional $3.6 billion in revenue over the time-out period. Further, because Referendum C bases the new TABOR limit for FY 2011 on the highest state revenue year during the five-year time out period (FY 2008), no taxpayer refunds are likely to be required through FY 2013.87
Despite the TABOR relief, Governor Bill Ritter and state lawmakers were forced to cut over $2.2 billion88 to balance the books for FYs 2009 and 2010 including imposing furloughs on state employees, cutting Medicaid provider reimbursements, tapping cash balances in dedicated funds, closing a women’s prison and suspending a property tax break for seniors – while also relying on millions of dollars of federal stimulus funds.89 Continued revenue declines, however, resulted in a projected $1.3 billion deficit for FY 2011 facing lawmakers as they convened in early 2010. Several measures were taken to close the gap:
Several sales and use tax exemptions were suspended or eliminated for direct mailings, industrial fuel, candy and soda, standardized software sales and out-of-state retailer sales, among others.90
State contributions to the Public Employees’ Retirement Association were cut by 2.5 percent (and offset by an increase in the employee contribution rate).91
Base appropriations for the total K-12 education program were reduced by $260 million from the original FY 2010 appropriation, a 4.56 percent reduction. The state share for this program
87 Office of State Planning and Budgeting, June 2010 Revenue Forecast, accessed at http://www.colorado.gov/cs/Satellite?blobcol=urldata&blobheader=application%2Fpdf&blobkey=id&blobtable=MungoBlobs&blobwhere=1251638310289&ssbinary=true (hereafter “OSPB June 2010 Revenue Forecast”). 88 Office of Governor Bill Ritter, Jr., “Gov. Ritter Submits $340 Million Balancing Plan,” Press Release February 18, 2010. 89 Tsunami, July 2009. 90 Office of Governor Bill Ritter, Jr., “Gov. Ritter Signs Bills Suspending Special Tax Breaks,” Press Release February 24, 2010. 91 Joint Budget Committee, FY 2010-2011 Budget Package and Long Bill Narrative. March 26, 2010 accessed at http://www.state.co.us/gov_dir/leg_dir/jbc/10LBNarrative.pdf.

00102
dropped 8.04 percent during this timeframe – the first reduction to K-12 funding since passage of Amendment 23 in 2000.92
State colleges and universities were given authority to raise in-state tuition by up to 9 percent each year for the next five years without approval from the Colorado Commission on Higher Education.93
Looking Ahead
While state economic forecasters reported in June that recessionary pressures were easing in Colorado and state tax collections were beginning to show signs of improvement,94 the sluggish recovery continues to place pressure on state finances. On June 9, 2010, the Department of Colorado Health Care Policy and Financing notified Medicaid providers that the state had declared a “fiscal emergency” and would be delaying provider payments totaling $38 million by two weeks in an attempt to allow the state to end its fiscal year on June 30, 2010 with the statutorily required General Fund reserve balance.95 Also, on August 23, 2010, Governor Ritter announced a plan to close a nearly $60 million revenue shortfall in the FY 2011 budget resulting from the ARRA enhanced FMAP extension being approved by Congress at a phased-down level rather than fully extended for FY 2011 as the state’s budget assumed. The plan included state personnel savings from leaving positions vacant or delaying hiring, reductions to the Department of Corrections, and transfers of dedicated fund cash balances to the General Fund. The state also faces a likely budget deficit of $500 million to $1 billion for FY 2012, along with a new Governor and at least four new members on the six-member Joint Budget Committee charged with crafting state budgets.96
Finally, Colorado voters will consider three ballot measures this fall (Amendment 60, Amendment 61, and Proposition 101) that seek to reduce taxes and, observers say, could collectively reduce the state’s General Fund by 25 percent.97
92 Section 17 of Article IX of the Constitution states that the required increase in spending can be waived if Colorado’s personal income grew less than 4.5 percent between the two previous calendar years. Personal income in Colorado grew by 4.7% in 2008 and personal income declined by 1.1% in 2009. Joint Budget Committee, FY 2010-2011 Budget Package and Long Bill Narrative, March 26, 2010, accessed at http://www.state.co.us/gov_dir/leg_dir/jbc/10LBNarrative.pdf. 93 Ibid. 94 OSPB June 2010 Revenue Forecast. 95 Jennifer Brown, “Colorado Delays Medicaid Payments,” Denver Post, June 17, 2010, accessed at http://www.denverpost.com/ci_15314188; June 9, 2010 Medicaid Provider Bulletin, accessed at http://www.colorado.gov/cs/Satellite?blobcol=urldata&blobheader=application%2Fpdf&blobkey=id&blobtable=MungoBlobs&blobwhere=1251635757063&ssbinary=true. 96 Office of Gov. Bill Ritter, Jr.; Gov. Ritter Announces Budget-Balancing Plan. Press Release August 23, 2010. 97 David Harrison, “In Colorado, Concern Over Anti-Tax Measures,” Stateline.org, The Pew Center on the States, May 21, 2010, accessed at http://www.stateline.org/live/details/story?contentId=486326.

00 103
Health Reform Initiatives
Despite the economic downturn and resulting budget crises, Colorado has taken many steps forward in expanding health coverage and reforming its healthcare delivery system. The process, which began under Governor Owens with the creation of the Blue Ribbon Commission for Health Reform (the “208 Commission”), flourished under Governor Ritter’s leadership, with the announcement of his Building Block Strategy in the spring of 2008 and the passage of the Health Care Affordability Act in 2009.
Building on the efforts of the 208 Commission, Governor Ritter’s Building Block strategy was designed to approach health care reform in a step-wise fashion addressing cost and quality infrastructure issues before expanding eligibility.98 The three-year strategy announced in February 2008 sought to expand access, establish a Center for Improving Value in Health Care, improve efficiency in both the private market and public programs, and increase transparency. 99
Continuing the work of both the 208 Commission and the Building Blocks strategy, the Colorado legislature passed and Governor Ritter signed the Health Care Affordability Act of 2009. The Act raises $600 million in new revenue through a hospital provider fee (supported by hospitals) to increase hospital reimbursement rates and fund Medicaid and CHIP eligibility expansions for children and pregnant women up to 250 percent of the FPL, parents up to 100 percent of the FPL, and childless adults up to 100 percent of the FPL. The Act also created a Medicaid buy-in program for disabled adults and children up to 450 percent of the FPL, and provided continuous eligibility for 12 months for children in Medicaid.100 The hospital provider fee was approved by CMS in April 2010101 and the expansion of coverage to children and parents was effective May 1, 2010.102
Other Developments
Colorado obtained a HRSA State Health Access Program (SHAP) Grant in September 2009 for its Comprehensive Health Access Modernization Program (CO-CHAMP). The SHAP grant provides five years of funding for a total of almost $43 million for the program, which seeks to improve access to Colorado’s public programs by streamlining eligibility and increasing outreach efforts through a number of means. Projects under the program include the Maximizing Outreach, Retention and
98 “Building Blocks for Health Care Reform: Pieces of the Whole,” Colorado Medicine, May/June 2008, accessed at http://www.cms.org/DocCongress/BuildingBlocksCMMay-June08.pdf. 99 Office of Governor Bill Ritter, Jr., “Gov. Ritter Announces ‘Building Blocks for Health Care Reform’ Package,” Press Release February 13, 2008. 100 House Bill 09-1293, accessed at http://www.leg.state.co.us/Clics/CLICS2009A/csl.nsf/billcontainers/D71C48DD229F80CD872575540079F3A0/$FILE/1293_enr.pdf. 101 Office of Governor Bill Ritter, Jr., “Gov. Ritter Praises Federal Approval of Colorado’s Landmark Health Care Act. Press Release April 1, 2010. 102 Colorado Child Health Plus Eligibility website, http://www.cchp.org/index.cfm?action=eligibility&language=eng.

00104
Enrollment (MORE) Grant program and implementing Express Lane Eligibility for Free and Reduced Lunch populations.103
The Department of Health Care Policy and Financing is also planning to implement an Accountable Care Collaborative (ACC) in January 2011 as part of its Medicaid reform efforts. The ACC is intended to act as “a regional model of accountability for improving health, functioning and self-sufficiency of all Medicaid clients while controlling costs, reducing unexplained variation in care, improving timely access to care, enhancing client and provider satisfaction and coordinating care across provider settings and social services.”104
Finally, on April 20, 2010, Governor Ritter issued an Executive Order creating a new inter-agency task force to oversee the implementation of the multiple aspects of federal health care reform. The Executive Director of the Department of Health Care Policy and Financing was tapped to chair the new “Interagency Health Reform Implementing Board.”105
Other actions related to Medicaid taken by the state in FY 2010 or planned for FY 2011 are described below:
Provider Rates In FY 2010, rates for inpatient hospitals, managed care organizations and physicians with the
exception of primary care were cut 4.5%, while rates for primary care physicians and dentists were cut 2.5%.
In FY 2011, rates for inpatient hospitals, physicians, dentists, and managed care organizations were cut an additional 1%.
In FY 2010 and FY 2011, reimbursement rates for nursing homes were frozen rather than cut due to an increase in their provider fee.
Eligibility, Application and Renewal Changes In FY 2010:
– Expanded eligibility to lawfully residing pregnant women within the 5 year wait period pursuant to the Immigrant Children’s Health Improvement Act (ICHIA) option enacted under CHIPRA, impacting an estimated 600 individuals (July 2009).
– Expanded eligibility to Medicaid parents from 60% to 100% of the FPL, increasing enrollment by an estimated 12,000 (May 2010).
– Revised the medical application to include all medical programs and adopted rules to allow Ex Parte redeterminations.
– Implemented an online screening tool and ability to check benefits. – Programmed DRA Citizenship/Identity rules into the eligibility system.
In FY 2011: – Will implement interfaces to eliminate paper for citizenship, identity and income. – Will implement Express Lane Eligibility using criteria from other agencies. – Will adopt rules to permit passive and telephone redeterminations. – Planning to implement the ACA Family Planning State Plan Option.
103 Department of Health Care Financing website, CO-CHAMP page, accessed at http://www.colorado.gov/cs/Satellite?c=Page&childpagename=HCPF%2FHCPFLayout&cid=1251574721186&pagename=HCPFWrapper. 104 “Factsheet on Accountable Care Collaborative.” Department of Health Care Policy and Financing. June 2010. 105 Office of Governor Bill Ritter, Jr.; Colorado Begins to Implement National Health Reform, Press Release April 20, 2010.
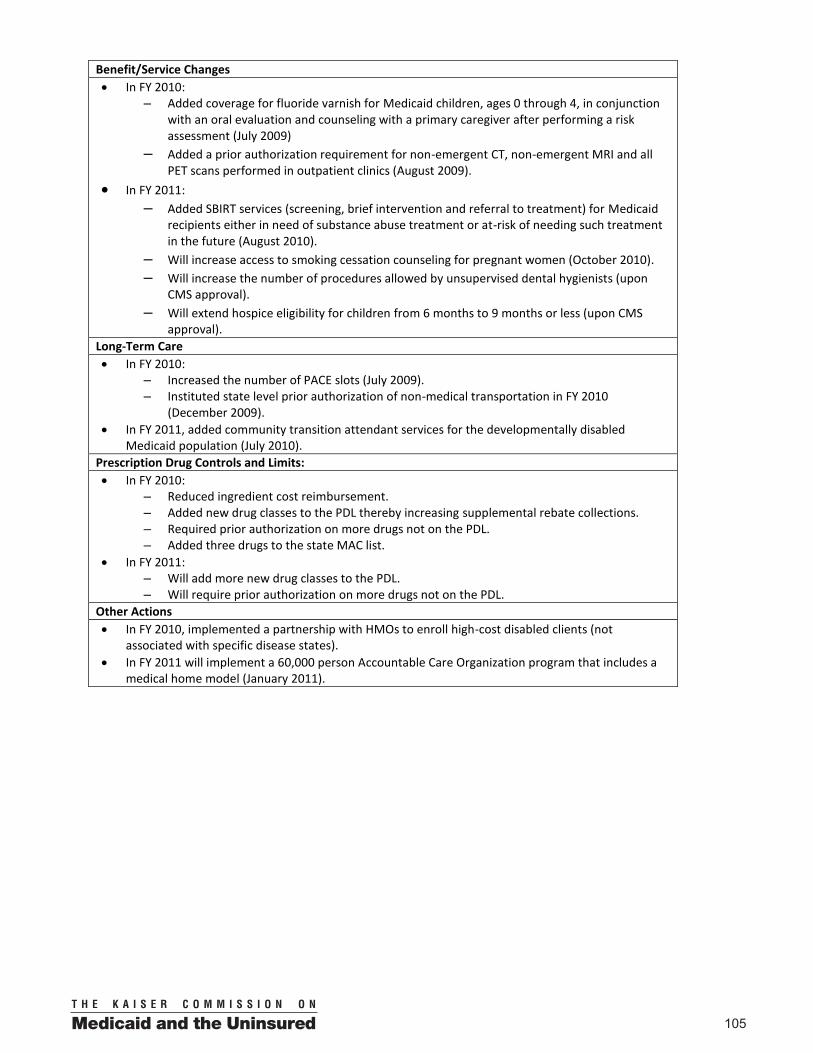
00 105
Benefit/Service Changes In FY 2010:
– Added coverage for fluoride varnish for Medicaid children, ages 0 through 4, in conjunction with an oral evaluation and counseling with a primary caregiver after performing a risk assessment (July 2009)
– Added a prior authorization requirement for non-emergent CT, non-emergent MRI and all PET scans performed in outpatient clinics (August 2009).
In FY 2011: – Added SBIRT services (screening, brief intervention and referral to treatment) for Medicaid
recipients either in need of substance abuse treatment or at-risk of needing such treatment in the future (August 2010).
– Will increase access to smoking cessation counseling for pregnant women (October 2010). – Will increase the number of procedures allowed by unsupervised dental hygienists (upon
CMS approval). – Will extend hospice eligibility for children from 6 months to 9 months or less (upon CMS
approval). Long-Term Care In FY 2010:
– Increased the number of PACE slots (July 2009). – Instituted state level prior authorization of non-medical transportation in FY 2010
(December 2009). In FY 2011, added community transition attendant services for the developmentally disabled
Medicaid population (July 2010). Prescription Drug Controls and Limits: In FY 2010:
– Reduced ingredient cost reimbursement. – Added new drug classes to the PDL thereby increasing supplemental rebate collections. – Required prior authorization on more drugs not on the PDL. – Added three drugs to the state MAC list.
In FY 2011: – Will add more new drug classes to the PDL. – Will require prior authorization on more drugs not on the PDL.
Other Actions In FY 2010, implemented a partnership with HMOs to enroll high-cost disabled clients (not
associated with specific disease states). In FY 2011 will implement a 60,000 person Accountable Care Organization program that includes a
medical home model (January 2011).

00106
Maryland Case Study
Maryland is a wealthy state with higher per capita personal income (4th highest in the nation)106 and a lower rate of unemployment (7.1% in July 2010 compared to the 9.5% national average107) than most other states. Nevertheless, state revenues were severely impacted by the national recession resulting in substantial budget shortfalls in FYs 2009 and 2010 requiring the state to rely upon spending cuts, fund transfers (including a drawdown of reserve balances) and federal stimulus funds to balance the budget. After the passage of the FY 2010 budget, state revenue collections continued to weaken forcing the Maryland Board of Public Works to undertake three rounds of additional budget cuts in July, August and November of 2009 totaling over $1 billion. These cuts included state employee salary reductions, furlough days and lay-offs as well as Medicaid provider rate cuts, higher education savings, and local aid reductions.108
Governor O’Malley’s proposed budget for FY 2011 included an additional $1 billion in cuts from the baseline, eliminated hundreds of additional positions and for the first time in at least 40 years, provided for a General Fund spending level that was lower than the level four years before.109 The proposed budget also relied on federal stimulus funding and one-time transfers to close a projected $1.9 billion FY 2011 shortfall, but left projected annual shortfalls of $2 billion or more for FYs 2012 through 2015.
On April 10, 2010, the Maryland legislature enacted a FY 2011 budget largely similar to Governor O’Malley’s proposal but requiring additional cost containment measures to reduce projected out-year budget shortfalls to between $1.5 and $1.6 billion.110 Like the Governor’s proposal, the budget includes approximately $900 million in federal stimulus funds111 and also assumes the ARRA enhanced FMAP funding will be fully extended for six months generating an additional $389 million.112 The enacted budget increases funding for education but provides for a significant funding cut for local road projects. With some exceptions, most other state program budgets were flat-lined or reduced.113 Also, the budget includes a directive that the Governor cut 500 executive
106 State Per Capita Personal Income 2009, Bureau of Economic Analysis, U.S. Department of Commerce, March 25, 2010, accessed at http://www.bea.gov/newsreleases/regional/spi/2010/pdf/spi0310pc_fax.pdf. 107 Regional and State Employment and Unemployment – July 2010, Bureau of Labor Statistics, U.S. Department of Labor, August 20, 2010, accessed at http://www.bls.gov/news.release/pdf/laus.pdf. 108 August 25, 2009 Press Release: “Governor Outlines $454 Million in Budget Cuts,” and November 18, 2009 Press Release: “Governor Martin O’Malley Brings FY 2010 Spending Reductions to Over $1 Billion,” Office of Governor Martin O’Malley, , accessed at www.governor.maryland.gov. 109 Maryland FY 2011 Budget Highlights, Maryland Department of Budget and Management, January 20, 2010, accessed at http://dbm.maryland.gov/agencies/operbudget/Documents/2011/FY2011BudgetHighlights.pdf. 110 Maryland Budget Summary Fiscal Year 2011, Maryland Budget and Tax Policy Institute, April 24, 2010, accessed at http://www.marylandpolicy.org/documents/budgetoverviewenactedfy11.pdf. 111 Aaron C. Davis, “Maryland Legislators Reach Deal on Budget Over Roads, Teacher Pensions,” Washington Post, April 9, 2010, accessed at http://www.washingtonpost.com/wp-dyn/content/article/2010/04/08/AR2010040805623.html (hereafter, “A. Davis, April 9, 2010”). 112 “FMAP Extension and the Impact on the States,” National Conference of State Legislatures, April 29, 2010, accessed at http://www.ncsl.org/documents/fiscal/NALFOEnhancedFMAPExtension.pdf. 113 A. Davis, April 9, 2010.

00 107
branch positions and includes a $6 million allocation for state employee buyouts.114 New funding was authorized, however, for business tax credits relating to the hiring of unemployed Marylanders, incentives to attract and grow biotechnology companies, and to double funding for the Chesapeake and Atlantic Coastal Bays Trust Fund.115
The FY 2011 budget provides over $6 billion in total funds for Medicaid and the Maryland Children’s Health Program which together are expected to provide access to medical care for more than 800,000 Marylanders in FY 2011 - 200,000 more than were covered prior to FY 2008.116 Other health care-related legislation enacted during the 2010 session includes the Maryland False Claims Act (allowing the State to recover damages and penalties from persons who defraud Medicaid and other state health plans and programs), legislation establishing a framework for a patient centered medical home program and a bill authorizing nurse practitioners to provide primary care.117
Preparing for Health Care Reform
Immediately following the passage of the federal health care reform law, Governor O’Malley issued an Executive Order on March 24, 2010 creating the Maryland Health Care Reform Coordinating Council (HCRCC) and charging it with the task of submitting to the Governor by January 1, 2011 a comprehensive document with health care reform policy recommendations and implementation strategies.118 Co-chaired by the Lieutenant Governor and the Secretary of the Department of Health and Mental Hygiene, the HCRCC is comprised of various state agency officials and legislative members and has formed the following six workgroups open to public participation:
Exchange and Insurance Market Workgroup;
Entry Into Coverage Workgroup;
Outreach and Education Workgroup;
Public Health, Safety Net and Special Populations Workgroup;
Health Care Workforce Workgroup; and
Health Care Delivery System Workgroup.
The workgroups will carry out focused research, analysis and evaluation of options with the goal of providing the HCRCC with a summary of different perspectives on core issues, areas of agreement and suggestions. The HCRCC will then use this information to prepare its recommendations to the Governor.
114 Alan Brody, “Lawmakers Sign Off on $32B State Budget,”Gazette.Net, April 11, 2010 accessed at http://www.gazette.net/stories/04112010/polinew80850_32568.php. 115 Maryland Fiscal 2011 Budget, Maryland Department of Budget and Management, May 2010, accessed at http://www.governor.maryland.gov/documents/FY11Budget.pdf. 116 Ibid. 117 April 13, 2010 Press Release: “Governor O’Malley Signs Legislation Moving Maryland Forward,” Office of Governor Martin O, accessed at www.governor.maryland.gov/pressreleases/100413.asp. 118 Executive Order 01.01.2010.07 accessed at http://www.governor.maryland.gov/documents/100324HealthcareEO.pdf.

00108
On July 26, 2010, the HCRCC presented an interim report to the Governor providing a fiscal impact analysis of the ACA on the State of Maryland prepared by the Hilltop Institute, a nationally recognized research center at the University of Maryland Baltimore County. According to the analysis, the ACA will generate substantial savings to the state of Maryland totaling $829 million between fiscal years 2011 and 2020. The savings will grow over time and peak in FY 2019. The report further noted that when fully implemented, the ACA would cut Maryland’s uninsured rate in half (decreasing the rate from 14% to 6.7%).119
Other actions related to Medicaid taken by the state in FY 2010 or planned for FY 2011 are described below.
Eligibility Changes In FY 2010, the Medicare Savings Program application became declaratory for assets and a passive
redetermination process was initiated for the premium part of the Children's Health Program that has a premium.
Provider Rates In FY 2010
– Effective July 1, 2009 decreased physician rates (with some exceptions) to achieve an overall total savings of $11.5 million ($4.5 million in state funds).120
– Nursing facility rates reduced by 2%.121 – Dental rates increased for oral surgery and endodontic care.
In FY 2011 – Physician fees remain at FY 2010 levels except reimbursement for physician Medicare cross-over claims
(for dual eligibles) will be reduced for certain codes.122 – Nursing facility rates increased by 2% (funded by provider assessment).123
Benefit Changes In FY 2010
– Added a targeted case management benefit for adults with serious mental illness and children with serious emotional handicaps (September 2009).
– Added substance abuse and ER services to the 1115 Primary Adult Care Program. Long-Term Care In FY 2010
– Additional services added to the Waiver for Older Adults and the Autism Waiver (July 1, 2009). – Additional slots added to the Traumatic Brain Injury and Community Pathways waivers (July 1, 2009). – Residential Treatment Center demonstration waiver implemented.
Implemented nursing facility pay-for-performance measures July 1, 2010.
119 Health Care Reform Coordinating Council Interim Report, July 26, 2010, accessed at http://www.healthreform.maryland.gov/interimreport.html. 120 June 9, 2010 letter from John M. Colmers, Secretary, Maryland Department of Health and Mental Hygiene to Senators Currie and Middleton and Representatives Conway and Hammen, accessed at http://www.dhmh.state.md.us/reports/pdf/2010/jun10/Medicaid/IN_19-807_MA_physicianfee.pdf, (hereafter, “J. Colmers, June 9, 2010 letter”). 121 April 14, 2010 letter from John M. Colmers, Secretary, Maryland Department of Health and Mental Hygiene to Senator Miller and Speaker Busch, accessed at http://www.dhmh.state.md.us/reports/pdf/2010/apr10/Medicaid/HG_19-310_SB0101_MA_Assessment_on_Nursing_Facilities.pdf. 122 J. Colmers, June 9, 2010 letter. 123 Nursing Home Transmittal No. 228, July 14, 2010 accessed at http://www.dhmh.state.md.us/mma/trans/FY11/PT_02-11_rev.pdf.

00 109
Managed Care In late FY 2011, will implement an all-payer medical home initiative for 50 practices and 200 providers. Other Increases in hospital and nursing facility providers assessments in FY 2010 and FY 2011. Releasing three HIT-related RFPs in FY 2011 to procure vendors to 1) assess Medicaid’s capacity to implement
EHRs, 2) gather information from providers on factors influencing their decision to implement EHRs, and 3) develop State Medicaid HIT Plan.

00110
K A I S E R C O M M I S S I O N O N Medicaid and the Uninsured HEALTH MANAGEMENT ASSOCIATES
1
MEDICAID BUDGET SURVEY FOR STATE FISCAL YEARS 2010 AND 2011
This survey is being conducted by Health Management Associates for the Kaiser Commission on Medicaid and the Uninsured. If you have any questions, please call Vern Smith at (517) 318-4819.
Return Completed Survey to: [email protected] (e-mail preferred) (Or mail or FAX to: Vernon K. Smith, Ph.D., Health Management Associates,
120 N. Washington Square, Suite 705, Lansing, MI 48933; FAX: (517) 482-0920)
State Name
Phone Email Date 1. The State Economic/Budget Situation and Enhanced FMAP Issues
a. Very briefly, how would you describe the economy in your state and its current direction?
b. Is your state projecting an overall state budget shortfall for FY 2011? Yes No c. How has your state used the ARRA enhanced Medicaid FMAP? (Check all that apply.)
i. Closed/reduced a Medicaid budget shortfall v. Helped fund caseload increases ii. Avoided/reduced provider rate cuts vi. Closed/reduced a state general fund shortfall
iii. Avoided benefit cuts vii. Other: iv. Avoided/restored eligibility cuts
Additional comments: c. Has your legislature enacted the Medicaid budget for FY 2011? Yes No d. Does the state’s enacted FY 2011 budget (or proposed FY 2011 budget) assume an extension of the
ARRA enhanced Medicaid FMAP through June 30, 2011? Yes No e. Looking now at the FY 2011 Medicaid appropriation (or the expected appropriation), how likely is a
Medicaid budget shortfall in your opinion? (Check one)
Almost certain no shortfall Not
likely 50-50 Likely Almost certain to be a shortfall
2. Medicaid Expenditure Growth: State Fiscal Years 2009, 2010 and 2011
a. For each year, please indicate the annual percentage change in total Medicaid expenditures for each source of funds. (Please exclude administration and Medicare Part D clawback payments).
Sss Fiscal Year (generally, July 1 to June 30)
Percent Change for Each Fund Source
State Local or Other Federal All Fund
Sources FY ending in 2009 (FY 2009) i. Percentage change: FY 2009 over FY 2008 % % % %
FY ending in 2010 (FY 2010) ii. Est. Percentage Change: FY 2010 over FY 2009 % % % %
FY ending in 2011 (FY 2011) iii. Est. Percentage Change: FY 2011 over FY 2010 % % % %
Comments:
b. Does your state use local or county funds to meet the non-federal share of the state’s Medicaid expenditures (excluding IGTs from public providers and provider assessments)? Yes No
Appendix C: Survey Instrument

00 111
K A I S E R C O M M I S S I O N O N Medicaid and the Uninsured HEALTH MANAGEMENT ASSOCIATES
2
3. Factors Driving Expenditure Changes
Excluding the ARRA enhanced FMAP, what would you consider the most significant factors contributing to increases or decreases in your total Medicaid spending in FY 2010 and FY 2011 (e.g., enrollment, healthcare inflation, rate changes, utilization, specific policy changes, etc.)?
FY 2010 FY 2011 a. Upward
Pressure i. Most significant factor? ii. Other significant factors?
b. Downward Pressure
i. Most significant factor? ii. Other significant factors?
4. Medicaid Enrollment 2010 over 2009 2011 over 2010 (proj.) a. Overall % enrollment growth/decline (+/–): i. % ii. %
b. Please describe what you believe are the key factors or pressures that contributed to increases or decreases in enrollment in FY 2010, and will do so in FY 2011.
In FY 2010:
In FY 2011
Comments (e.g., on enrollment changes for specific eligibility groups):
5. Medicaid Administrative Capacity
a. In FY 2010, did your agency take action to reduce administrative expenditures? Yes No b. In FY 2011, will your agency take action to reduce administrative expenditures? Yes No c. If you answered “yes” to (a) or (b), please indicate all strategies used to make such reductions. Type of Reduction ‘10 ‘11 Type of Reduction ‘10 ‘11 Hiring freezes Travel restrictions Layoffs Reduction in training Compressed work schedules (e.g., 4-day work week)
Eliminate, reduce or renegotiate contracted services
Furloughs Other
Incentives for Early Retirement
Comments:
6. Provider Payment Rates
a. Compared to the prior year, please indicate by provider type any rate increases (include COLA or inflationary increases) or decreases implemented in FY 2010 or to be implemented in FY 2011. Use “+” for an increase, “ – “ for a decrease and “0” for no change. Optional: if available, please indicate actual percentage change as well.
Provider Type FY 2010 FY 2011 i. Inpatient hospital
ii. Doctors iii. Dentists iv. Managed care organizations v. Nursing homes vi. Pharmacy dispensing fees
b. Please indicate if any rate changes in FY 2010 had an impact on provider access or participation:

00112
K A I S E R C O M M I S S I O N O N Medicaid and the Uninsured HEALTH MANAGEMENT ASSOCIATES
3
Comments (e.g., whether rate changes were court-ordered/litigation-related, etc.):
7. Provider Taxes/Assessments
Please list any provider taxes in place in FY 2009, new and changes for FY 2010 and FY 2011.
Provider Group Subject to Tax
In place FY 2009
New in: Discontinued in: Increased, Decreased or No Change (+, -, or 0) in:
Change Federally
Mandated? FY 10? FY‘11? FY ‘10? FY ‘11? In FY ‘10? In FY ’11? a. Hospitals b. ICF/MR-DD c. Nursing Facilities d. MCOs e. Other: f. Other:
Comments (e.g., regarding replacement of MCO tax, other federal impacts, etc.):
8. Medicaid Eligibility Standards
a. Describe changes in Medicaid eligibility standards* implemented in FY 2010 or planned for FY 2011. Under “Nature of Impact,” use “+” if the change is an expansion, “—“ for a restriction or “0” for a change with a neutral affect. If there are no eligibility changes to report, please check the box on line “iii.” (Exclude changes in CHIP-funded programs.)
Year Nature of Eligibility Change and Affected Eligibility Groups
Effective Date
Est. Number of People Affected
Nature of Impact (+, –
, or 0)
By Waiver
Authority
i. FY 2010 A. B.
ii. FY 2011 A. B.
iii. No changes in either FY 2010 or FY 2011
* “Eligibility standards” include income standards, asset tests, retroactivity, continuous eligibility, treatment of asset transfer or income, enrollment caps or buy-in options (including Ticket to Work and Work Incentive Improvement Act or the DRA Family Opportunity Act). If applicable, include adoption of the new Family Planning State Plan Option and the CHIPRA “ICHIA” option (cover lawfully residing immigrant children and pregnant women without 5 year waiting period).
b. Early Childless Adult Expansion Option. Will your state expand eligibility to childless adults prior to January 2014 under the new Affordable Care Act (ACA) state plan option? (Check one)
Yes Possibly Yes Not Likely No Don’t know
Comments:

00 113
K A I S E R C O M M I S S I O N O N Medicaid and the Uninsured HEALTH MANAGEMENT ASSOCIATES
4
9. Application/ Renewal Process
a. Describe any changes to the application or renewal process.* Under “Nature of Impact,” use “+” if the change is a liberalization, “—“ for a restriction or “0” for a change with a neutral effect. Note if the change is designed to qualify for a CHIPRA Bonus. If there are no changes to report, please check the box on line “iii”.
Year Application or Renewal Process Change Nature of Impact (+, –, or 0)
CHIPRA Bonus
Related?
i. FY 2010 A. B.
ii. FY 2011 A. B.
iii. No changes in either FY 2010 or FY 2011
*Application changes include changes in forms, verification or face to face interview requirements, frequency of redeterminations or renewals, new on-line enrollment systems, etc.).
b. Did your state adopt the option (available January 1, 2010) of verifying citizenship through a data matching process with the Social Security Administration?
Yes Not yet, but expect to No, and do not expect to Don’t know Comments :
10. Benefits
a. Describe below any change in benefits implemented during FY 2010 or planned for FY 2011. Under “Nature of Impact,” use “+” for expansions, “—“ for reductions and restrictions or “0” for changes with an overall neutral affect. If there are no benefit changes to report for either year, please check the box on line “iii”.
Year Nature of Benefit Change
Effective Date
Eligibility Groups Affected
Nature of Impact (+, –,
or 0)
By DRA Authority
By Waiver Authority
i. FY 2010
A. B. C. D.
ii. FY 2011
A. B. C. D.
iii. No changes in either FY 2010 or FY 2011
Comments : b. Does your state qualify for the 1 percentage point FMAP increase for preventive services starting in
2013? (e.g. includes recommended preventive services with no cost sharing)? Yes No Don’t know
Comments on FMAP increase for preventive services:

00114
K A I S E R C O M M I S S I O N O N Medicaid and the Uninsured HEALTH MANAGEMENT ASSOCIATES
5
11. Premiums
Please list any Medicaid eligibility group subject to a premium requirement (including a buy-in program) and whether changes were made in FY 2010 or will be made in FY 2011.
Eligibility Group Subject to a Premium Requirement
In Place in FY 2009?
New, Increased, Decreased, Eliminated or No Change
(New,+, -, Elim., or 0) By DRA
Authority? By Waiver Authority?
FY ‘10? FY ’11?
a.
b.
c.
Comments :
12. Cost Sharing
a. Does your state require copays (check one)? Yes Yes, but only for drugs No copays
b. Are copayments enforceable for any eligibility group as allowed by the DRA (check one)? Yes No Plan to implement in FY 2011 N/A
c. Please describe any changes in beneficiary cost sharing in FY 2010 and FY 2011 and indicate whether the cost sharing was newly implemented. Under “Nature of Impact,” use “+” if the change is an increase, “—“ for a decrease or “0” for changes with an overall neutral affect. If there are no cost sharing changes to report for either year, please check the box on line “iii.”
Year Nature of Cost Sharing Change Effective Date Eligibility Groups Affected
Nature of
Impact (+, –, or
0)
By Waiver Authority
?
i. FY 2010 A. B. C.
ii. FY 2011 A. B. C.
iii. No changes in either FY 2010 or FY 2011
Comments :
13. Long Term Care Policy
Briefly identify LTC changes implemented during FY 2010 or planned for FY 2011. Under “Nature of Impact,” use “+” for expansions, “—“ for reductions and restrictions or “0” for changes with an overall neutral affect. If there are no changes to report for either year, please check the box on line “c.” (Exclude rate and tax changes reported under questions 6 and 7). Where applicable, indicate if the change was made possible by the DRA.

00 115
K A I S E R C O M M I S S I O N O N Medicaid and the Uninsured HEALTH MANAGEMENT ASSOCIATES
6
Year
Nature of Long Term Care Policy Change Effective Date
Nature of Impact (+,
–, or 0)
a. FY 2010
i. Community Service Changes*
A. B. C.
ii. Institutional Changes**
A. B.
iii. Other A.
B.
b. FY 2011
i. Community Service Changes*
A. B. C.
ii. Institutional Changes**
A. B.
iii. Other A. B.
c. No changes in either FY 2010 or FY 2011 * Community service changes include changes to waiver slots or services, state plan personal care services, PACE sites, nursing home diversion/transition programs, level of care requirements, etc. ** Institutional changes include changes to bed-hold policies, Medicare cross-over payments, bed moratoriums, level of care requirements, quality enhancement initiatives, etc.
d. Current State Options. Has your state exercised in FY 2010, or will exercise in FY 2011, the following LTC options?
LTC Option Implemented:
Plan to in FY 2011
No Plans to Implement
Discontinuing in 2010 or 2011
Don’t know Before
FY 2010 In FY 2010
i. HCBS State Plan Option ii. Long Term Care Partnership Program
e. Future LTC Options. Will your state apply for or elect the new Affordable Care Act (ACA) options listed below when they are available? (Check one)
State Option Yes Possibly Yes Not Likely No Not
eligible Don’t know
i. State Balancing Incentive Payments Program
ii. Community First Choice Option
f. Money Follows the Person Rebalancing Demonstration. Has your state participated in, or does your state plan to participate in the MFP Rebalancing Demonstration? (Check one)
Already a grantee; will likely apply for extension
Already a grantee; not likely to apply for extension
Yes, will apply as new grantee
No, will not apply as a new grantee
Don’t know
g. Please briefly describe any other efforts or initiatives underway in your state to expand community-based long term care options:
Comments :

00116
K A I S E R C O M M I S S I O N O N Medicaid and the Uninsured HEALTH MANAGEMENT ASSOCIATES
7
14. Prescription Drug Policy
What new prescription drug policies were implemented during FY 2010 or are planned for FY 2011? Please briefly describe those that apply. Under “Nature of Impact,” use “+” if the change is an expansion, “—“ for reductions and restrictions or “0” for changes with an overall neutral affect. If there are no changes to report for either year, please check the box on line “i.”
Program or Policy Policy in place at
end of FY 2009?
(Check all that apply)
Year Nature of Change
Nature of
Impact (+, –, or
0)
a. Change in dispensing fees
2010 2011
b. Change in ingredient cost
2010 2011
c. Preferred Drug List (PDL)
2010 2011
d. Prior authorization w/out PDL
2010 2011
e. Supplemental rebates
2010 2011
f. Joined a multi-state pool
2010 2011
g. Limits on number of Rx per month
2010 2011
h. State MAC program
2010 2011
i. Managed Care Rx Carve-out
2010 2011
j. Other:
2010 2011
k. No changes in either FY 2010 or FY 2011
l. Affordable Care Act Pharmacy Rebate Impacts. i. Are the ACA pharmacy rebate changes (including both the new mandatory minimum rebate
requirement and the new managed care rebate authority) expected to have an overall positive, negative or neutral fiscal impact on your state? (Check one)
Positive Negative Neutral Don’t Know ii. Comments on the fiscal impact:
iii. As a result of the ACA’s new authority to collect rebates on managed care prescriptions, is your state likely to “carve-in” pharmacy benefits to its managed care arrangements?
Yes No Rx already included Don’t know N/A
Other comments on pharmacy policy changes:

00 117
K A I S E R C O M M I S S I O N O N Medicaid and the Uninsured HEALTH MANAGEMENT ASSOCIATES
8
15. Medicaid Quality and Access
a. HEDIS© and CAHPS©. Please indicate with an “X” below if HEDIS measures were used or CAHPS consumer surveys conducted for Medicaid FFS, PCCM or Risk-based Managed Care:
In Place in 2009 New in 2010 New in 2011 HEDIS CAPHS
i. Please describe how these measures were used? (e.g. selective or preferential contracting, reporting, auto-enrollment, bonus payments, etc. )
b. State Medicaid programs have pursued multiple quality strategies* in recent years to improve the efficiency and effectiveness of health care delivery while reducing costs. Please identify / describe the most promising Medicaid quality initiatives for each of these four categories:
Delivery System Description of Quality Strategy
i. Capitated Managed Care A. B.
ii. PCCM A. B.
iii. Fee For Service A. B.
iv. Long Term Care A. B.
* Examples in addition to HEDIS and CAHPS include quality report cards, P4P and other payment incentives, value-based purchasing efforts, prevention and wellness programs, consumer education and more.
c. Has your state undertaken any initiatives to monitor or improve access to care? Yes No i. If “yes,” briefly describe:
Comments:
16. Medicaid Health Information Technology (HIT) Initiatives
a. Many State Medicaid programs have undertaken or participated in Health Information Technology initiatives, including ePrescribing, Health Information Exchange, EHR or EMR initiatives, Please describe Medicaid-related initiatives undertaken in FY 2010 and planned in FY 2011, indicating those related to Medicaid Transformation Grants, ARRA or other funding.
In FY 2010:
In FY 2011
b. Has your state applied for enhanced federal matching funds for state planning activities necessary to implement the ARRA electronic health record (EHR) incentive program?
Yes No, but plan to No, do not plan to Don’t know Comments:

00118
K A I S E R C O M M I S S I O N O N Medicaid and the Uninsured HEALTH MANAGEMENT ASSOCIATES
9
17. Managed Care
a. During FY 2010, were non-dually eligible aged or disabled populations enrolled in capitated managed care? Yes No
b. What managed care program or policy actions were implemented during FY 2010, or will be implemented in FY 2011? Please briefly describe those that apply.
Program or Policy Actions Actions Implemented FY 2010
Actions To Be Implemented FY 2011
i. Expand/contract PCCM or MCO geographic service areas ii. Enroll new eligibility groups (please specify)
iii. Change from voluntary to mandatory enrollment (specify by eligibility category)
iv. Implement/expand long term care managed care
v. Implement or expand disease management, care management for high cost/complex cases, or a chronic care management program (if applicable, specify disease state)
vi. Implement a medical home initiative vii. Other actions:
c. Medical/Health Home State Plan Option. Will your state elect the new ACA state plan option to establish Health Homes (also known as medical homes)? (Check one)
Yes Possibly Yes Not Likely No Don’t know
Comments:
18. Initiatives for Dual Eligibles
a. Is your state developing new payment or delivery system programs specifically for dual eligibles? Yes No If “yes,” please briefly describe:
b. In FY 2010, did your Medicaid program contract with one or more Medicare Advantage Special Needs Plans (SNPs)? Yes No
i. If “no,” will your Medicaid program begin contracting with one or more Medicare Advantage SNPs in FY 2011? Yes No Don’t know
Comments:
19. Section 1115 Waivers
a. Is your state currently planning to implement a Section 1115 Medicaid waiver or waiver amendment in FY 2011? Yes No
b. If yes, has it been approved? Yes No, still being developed No, pending at CMS
i. Please briefly describe key waiver goals and features:
c. Please briefly describe any pending issues in your state relating to an upcoming renewal of a Section 1115 Medicaid reform waiver:
Comments:

00 119
K A I S E R C O M M I S S I O N O N Medicaid and the Uninsured HEALTH MANAGEMENT ASSOCIATES
10
20. Federal Health Reform: Medicaid Demonstration Opportunities
Indicate the likelihood of your state applying for the listed Affordable Care Act Medicaid demonstrations:
ACA Medicaid Grant/Demonstration Opportunities Very Likely
Some-what Likely
Not Likely
Don’t Know
a. Medicaid Integrated Care Hospitalization Demonstration Program: Up to 8 states will be selected to use bundled payments to promote integration of care around hospitalization.
b. Medicaid Global Payment System Demonstration: Up to 5 states will be selected to test paying a safety net hospital system or network using a global capitated payment model.
c. Pediatric Accountable Care Organization Demonstration Project: Allows pediatric providers to organize as ACOs and share in federal and state Medicaid cost savings.
d. Medicaid Emergency Psychiatric Demonstration Project: Provides Medicaid payments to Institutions of Mental Disease for adult enrollees requiring stabilization of an emergency condition.
e. Medicaid Chronic Disease Incentive Payment Program: State grants to test approaches to encourage behavior modification for healthy lifestyles.
21. Federal Health Reform: Looking Forward a. Please briefly describe the Medicaid agency role in your state in preparing for federal health care reform
(e.g. how will Medicaid work with the state insurance department?):
b. How would you describe the implications of the new “Modified Adjusted Gross Income (or, “MAGI”) eligibility standard (including whether you will need a new eligibility system):
c. What role do you expect the Medicaid agency to play in determining the eligibility for subsidies in the exchange?
d. Do you see opportunities for state savings in implementing health reform (e.g. from reducing uncompensated care payments or from other state health programs)?
e. What are the biggest challenges you see in implementing health reform?
f. What Information do states need from CMS to move forward with implementing reform?
22. Outlook for Medicaid in the Future
What do you see as the most significant issues, challenges or opportunities Medicaid will face over the next year or two?
This completes the survey. Thank you very much.


T h e K a i s e r F a m i l y F o u n d a t i o n i s a n o n - p r o f i t , p r i v a t e o p e r a t i n g f o u n d a t i o n d e d i c a t e d t o p r o v i d i n gi n f o r m a t i o n a n d a n a l y s i s o n h e a l t h c a r e i s s u e s t o p o l i c y m a k e r s , t h e m e d i a , t h e h e a l t h c a r e c o m m u n i t y ,a n d t h e g e n e r a l p u b l i c . T h e F o u n d a t i o n i s n o t a s s o c i a t e d w i t h K a i s e r P e r m a n e n t e o r K a i s e r I n d u s t r i e s .

1 3 3 0 G S T R E E T N W , W A S H I N G T O N , D C 2 0 0 0 5
P H O N E : ( 2 0 2 ) 3 4 7 - 5 2 7 0 , F A X : ( 2 0 2 ) 3 4 7 - 5 2 7 4
W E B S I T E : W W W . K F F . O R G / K C M U
A d d i t i o n a l c o p i e s o f t h i s r e p o r t ( # 7579 ) a r e a v a i l a b l e o n t h e K a i s e r F a m i l y F o u n d a t i o n ’ s w e b s i t e a t w w w . k f f . o r g .T h i s p u b l i c a t i o n ( # 8 1 0 5 ) i s a v a i l a b l e o n t h e K a i s e r F a m i l y F o u n d a t i o n ’s w e b s i t e a t w w w. k f f . o r g .