hopwood grutter, and gratz€¦ · 1 changes in affirmative action in the era of hopwood, grutter,...
TRANSCRIPT
0
CHANGES IN AFFIRMATIVE ACTION
IN THE ERA OF HOPWOOD, GRUTTER, AND GRATZ*
Grant H. Blume
University of Washington
Mark C. Long
University of Washington
(corresponding author)
Abstract: Affirmative action in college admissions was effectively banned in Texas by the Hopwood ruling in 1997, by voter referenda in California and Washington in 1996 and 1998, and by administrative decisions in Florida in 1999. The Hopwood and Johnson rulings also had possible applicability to public colleges throughout Alabama, Georgia, Louisiana, and Mississippi. The Supreme Court’s 2003 decision in the Grutter and Gratz cases reaffirmed but limited the legal basis for affirmative action in colleges. This paper uses nationally representative data on the admissions decisions of high school students in 1992 and 2004 to estimate the magnitude of the change in affirmative action in admissions decisions (i.e., how these policy changes affected the relative likelihood of admission of minority and non-minority applicants). We find substantial declines in levels of affirmative action practiced by highly selective colleges nationwide, and particularly large and significant declines in the states affected by bans and the Hopwood and Johnson rulings. This decline in affirmative action in these states also affected the local availability of affirmative action to students who lived in adjacent states, particularly when the adjacent states lacked highly selective colleges. Keywords: College Admission; Affirmative Action; Institutional Response to Policy; Geographic Proximity JEL classification: D63; H73; H83; I23; I28; J15; J24; J78
* Grant Blume received support for this project from the US Department of Education, Institute of Education Sciences (#R305B090012). We would like to thank the National Center for Education Statistics for access to the restricted-use version of the National Education Longitudinal Study of 1988 and Education Longitudinal Study of 2002, and helpful suggestions by Cory Koedel, Jeff Smith, and audience members at presentations at the University of Washington and the Association for Public Policy Analysis and Management conference. The authors are accountable for all views expressed and any errors.

1
CHANGES IN AFFIRMATIVE ACTION
IN THE ERA OF HOPWOOD, GRUTTER, AND GRATZ
Abstract: Affirmative action in college admissions was effectively banned in Texas by the Hopwood ruling in 1997, by voter referenda in California and Washington in 1996 and 1998, and by administrative decisions in Florida in 1999. The Hopwood and Johnson rulings also had possible applicability to public colleges throughout Alabama, Georgia, Louisiana, and Mississippi. The Supreme Court’s 2003 decision in the Grutter and Gratz cases reaffirmed but limited the legal basis for affirmative action in colleges. This paper uses nationally representative data on the admissions decisions of high school students in 1992 and 2004 to estimate the magnitude of the change in affirmative action in admissions decisions (i.e., how these policy changes affected the relative likelihood of admission of minority and non-minority applicants). We find substantial declines in levels of affirmative action practiced by highly selective colleges nationwide, and particularly large and significant declines in the states affected by bans and the Hopwood and Johnson rulings. This decline in affirmative action in these states also affected the local availability of affirmative action to students who lived in adjacent states, particularly when the adjacent states lacked highly selective colleges.
1. Introduction
Affirmative action in college admissions has been under continuous challenge for 40
years (Holzer & Neumark, 2006). In the late 1990s, these resistance efforts made headway
leading to bans in affirmative action in public colleges in California, Florida, Texas, and
Washington (and court decisions had possible applicability to public colleges throughout
Alabama, Georgia, Louisiana, and Mississippi, and arguably private colleges in Texas). In 2003,
the Supreme Court’s decisions in the Grutter and Gratz cases clarified the legality of the use of
affirmative action in admissions, but also limited the mechanisms by which colleges could
advantage minority applicants in admissions decisions. This paper seeks to answer the following
questions: (1) How has the magnitude of the preference given to minority applicants (i.e.,
affirmative action) changed during this period in the states directly affected?, (2) How has
affirmative action changed nationally and in states other than CA-FL-TX-WA-AL-GA-LA-MS
in response to the requirements imposed by the Grutter and Gratz Supreme Court rulings as well
as changes in the political climate?, (3) How have these changes affected affirmative action
offered by colleges nearby the student, including at colleges adjacent to states that were directly
limited?
We use nationally representative student data from 1992 and 2004 to estimate an
underrepresented minority (i.e., black, Hispanic, or Native American) student’s probability of
admission compared to an observably similar nonminority (i.e., white or Asian American)

2
student at the same postsecondary institution.1 We find substantial and significant preferences
given to minority students in 1992 in highly selective institutions and no significant differences
between the levels of affirmative action practiced by colleges in CA-FL-TX-WA-AL-GA-LA-
MS versus other states. By 2004, we find insignificant changes in affirmative action in other
states, but dramatic and significant declines in CA-FL-TX-WA-AL-GA-LA-MS (and significant
difference-in-differences). Using parameter estimates of students’ desire to enroll in nearby and
in-state institutions, we illustrate how changes in affirmative action affected the supply of
affirmative action at nearby selective institutions. We find substantial reductions in nearby
affirmative action in the directly affected states, which has notable spillovers for students living
in Arizona, Nevada, and Idaho (which completely lack highly selective intuitions).
In the next section, we present the history of changes in the policy environments in these
states and the Grutter and Gratz cases, and discuss the literature that estimates levels and
changes in affirmative action. In sections 3 and 4 we discuss our methodology to estimate
affirmative action at the individual, college, and county levels and discusses our data. Section 5
gives our results and Section 6 concludes with a discussion of implications for policymakers.
2. Affirmative Action Policy Environment and Literature
2.1 Changes in the policy environment
The affirmative action policy environment that has emerged in the past seventeen years is
defined by a complex web of voter initiatives, judicial rulings, and gubernatorial executive
orders which limit the use of affirmative action at public and private colleges. The
constitutionality of affirmative action was precariously settled by Justice Powell’s deciding
opinion in the 1978 Regents of the University of California v. Bakke case. The Powell decision
allowed for affirmative action to be used only to promote diversity (unless the college had a
specific history of racial discrimination that was remedied by affirmative action) and only if race
was one factor considered among many others (i.e., quotas could not be used). However, only
parts of Justice Powell’s decision were concurred with by two blocks of four other justices.
1 We will use the word “minority” as short-hand for “underrepresented minority.” Prior research finds insignificant differences in the treatment of white and Asian applicants, and between black and Hispanic applicants, both nationally (Long, 2004) and at specific institutions in Texas prior to the Hopwood ruling (Long and Tienda, 2008).

3
Thus, without a single decision receiving full backing by a majority of the justices, the Bakke
decision was clearly challengeable.
2.1a Texas
The 1996 Hopwood v. Texas ruling by the Fifth Circuit Court of Appeals did not consider
the Powell decision in Bakke to be binding and found that diversity did not serve a compelling
government interest as necessary to meet the constitutional requirements established by other
Supreme Court decisions. The Hopwood decision was interpreted by Texas Attorney General
Morales to ban affirmative action in public colleges and private colleges (that accept federal
funding) in Texas.2 The Texas legislature responded to the elimination of affirmative action by
enacting a law that guaranteed Texas high school students in the top 10% of their graduating
class admission to any Texas public university. This policy mechanism, commonly known as a
“top-x%” program (Long, 2004) is predicated on the notion that given de facto racial segregation
in a state’s high schools, the composition of top-x% graduates will contain many minority
students, and thus may lead to an increase in college attendance of minority students. In addition
to the top 10% program which was put into place after the Hopwood ruling, universities such as
the University of Texas-Austin and Texas A&M University also created scholarship programs
specifically geared at “high-poverty inner-city high schools with weak college-going traditions”
(Domina, 2007, 202). After the Grutter ruling, UT-Austin announced that they restarted using
affirmative action in 2005 (Faulkner, 2005), while Texas A&M opted not to do so (Winter,
2004). UT-Austin’s decision has prompted a court challenge, Fisher v. the University of Texas
at Austin, which will be heard on appeal by the U.S. Supreme Court this year. The key in this
case is whether the top-10% plan and other efforts have sufficiently increased diversity such that
direct use of the applicant’s race is unnecessary.
2.1b California
The California electorate ended affirmative action at public institutions with the passage
of Proposition 209 in 1996. This statewide elimination of affirmative action was preceded by the
elimination of affirmative action at the University of California in July, 1995, by a vote of the
University of California Regents known as SP-1. A number of statewide and institutional policy
responses emerged in response to California’s affirmative action ban. The University of
2 There were no subsequent challenges that would have tested Morales interpretation, and the Supreme Court did not hear an appeal of the Hopwood case, furthering confusion about what was and was not permissible.
4
California introduced a top four-percent program and implemented a dual admission/guaranteed
transfer agreement policy with junior colleges; University of California campuses and most
California State University campuses also increased outreach to minority students after the
passage of Proposition 209 (Laird, 2005). In October, 2011, Governor Brown vetoed a bill
which would have allowed public colleges to consider race in admissions decisions citing
concerns that it would potentially violate Proposition 209 and lead to costly legal battles
(Azevedo & Vincent, 2011).
2.1c Washington
In 1998 Washington State voters passed Initiative 200 (I-200) which banned affirmative
action at public colleges and universities. The language Washington voters approved was nearly
identical to California’s Proposition 209 (Moses & Yun, 2009). This similarity is attributed in
large part to the involvement in both initiative processes of Ward Connerly, former regent of the
University of California and outspoken critic of affirmative action in college admissions (Laird,
2005). Public universities in Washington, like in other states which banned affirmative action,
responded to I-200’s passage with increased outreach to minority communities (Blume, 2010).
Unlike California, Texas, and Florida, however, public universities in Washington did not
implement any sort of top x% program after the elimination of affirmative action. Although a
1997 challenge to affirmative action at the University of Washington eventually reached the U.S.
Supreme Court, Smith v. University of Washington Law School was rendered moot by the
Grutter and Gratz rulings and returned to the 9th Circuit Court of Appeals.
2.1d Florida
In November, 1999, Florida governor Jeb Bush signed Executive Order 99-281 to
eliminate affirmative action in government employment, state contracting, and higher education
admissions (Bush, 1999). Known as the “One Florida” initiative, this executive order directed the
state’s higher education Board of Regents to “implement a policy prohibiting the use of racial or
gender set-asides, preferences or quotas in admission to all Florida institutions of Higher
Education, effectively immediately” (Bush, 1999, 2). With affirmative action eliminated the
Board of Regents in Florida amended their existing admissions policy to add the “Talented 20
Program” which guaranteed public high school students graduating in the top 20% of their class
admission to the Florida state university system (Horn & Flores, 2003). Similar to the California

5
top x% plan implemented after the passage of Proposition 209, Florida’s top x% plan guaranteed
admission to the state’s university system, not a specific campus.
2.1e Other States
The affirmative action policy environment has evolved due to court and voter challenges
in states beyond California, Florida, Texas, and Washington. In 2001, the University of Georgia
discontinued the use race as an admissions factor after the Eleventh Circuit Court of Appeals
ruled against the use of affirmative action in Johnson v. Board of Regents of the University of
Georgia. It is unclear the extent to which universities in the Eleventh Circuit’s jurisdiction,
which includes Alabama, Florida, and Georgia, felt bound by the Johnson ruling, although it is
reasonable to believe that they may have concluded that affirmative action practices were on
shaky constitutional grounds and may have perceived the Johnson ruling as reflecting declining
political and social support for affirmative action practices. Although the 2003 Grutter ruling
superseded the Johnson ruling and would have allowed a return to race-based affirmative action,
the University of Georgia continued to not use race as a factor in admissions decisions post-
Grutter (Lyn, 2008).3
Louisiana and Mississippi are located in the 5th Circuit Court of Appeals jurisdiction, and
thus were subject to the Hopwood ruling during the years 1997-2003. However, some ambiguity
exists as federal consent decrees required colleges in these states to address racial segregation
(Grodsky & Kalogrides, 2008, 29). Again, colleges in these states may have nonetheless
perceived the Hopwood ruling to suggest declining political and judicial interest in minority
representation. Since we find no evidence to the contrary, like others (e.g. Bowen & Rudenstine,
2003; Schmidt, 2004) we consider Louisiana and Mississippi post-affirmative action states
because of the Hopwood decision and Alabama and Georgia to be post-affirmative action states
due to the Johnson ruling (Hebel, 2000; Hebel, 2001). We test for changes in affirmative action
in CA-FL-TX-WA versus other states (including and excluding AL-GA-LA-MS) and CA-FL-
TX-WA-AL-GA-LA-MS versus other states.
3 Our model predicts a very small amount of affirmative action at the University of Georgia given its level of selectivity (MSATACT (defined below) = 1,032 in 2004). We estimate larger magnitudes of affirmative action for more selective institutions in Georgia (e.g., Emory University and Georgia Tech), and thus there was potentially larger impact at these institutions if they felt bound by the Johnson ruling. While the 11th Circuit Court of Appeals includes Alabama it was unclear to what extent Alabama was bound by the Johnson ruling given existing federal desegregation order at the University of Alabama (CNN, 2001). As of 2007, Alabama, Louisiana, Mississippi, and Tennessee remained under statewide higher education desegregation orders (United States Commission on Civil Rights, 2007, p. 20).

6
Voter referenda in Michigan (2006), Nebraska (2008), and Arizona (2010) produced
statewide bans in affirmative action, while a similar referendum failed in Colorado in 2008. A
three-judge panel of the 6th Circuit Court of Appeals ruled in 2011 that “Michigan voters did not
have the right in 2006 to ban public colleges and universities from considering race and ethnicity
in admissions” (Jaschik, 2011). This ruling was subsequently thrown out but is currently being
reconsidered by the full 6th Circuit Court (Associated Press, 2012). Finally, the state legislature
in New Hampshire banned affirmative action for public colleges in the state in 2011. These
policy changes took place in years after the time of our data, and thus are not evaluated.
2.1f Grutter and Gratz
The admissions systems at the University of Michigan for the law school and for
undergraduates were challenged in the Grutter v. Bollinger and Gratz v. Bollinger cases. In
rejecting the undergraduate admissions system in Gratz but upholding the law school’s
admission system Grutter in 2003, the Supreme Court struck down the use of assigning points in
the admissions process based on an applicant’s race but validated the use of race as one factor
among many in an admissions decision so long as it is part of a holistic review of an applicant
and so long as race does not have a uniform impact (as would follow from a point system).
Moreover, the Grutter ruling held that for the use of an applicant’s race to be permissible, the
college would need to exhaust other non-race-based methods to increase diversity (which is at
the heart of the current Fisher v. Texas case). These rulings, particularly the need for holistic
review, have made it more costly for universities to practice affirmative action. Further, these
rulings apply to both private and public colleges. In this context, we might expect to see declines
in the aggregate magnitude of affirmative action being practiced by colleges. Our expectation is
then to see declines nationwide in the period we study (1992 to 2004), but particular declines in
states that are bound by voter referenda in 2004 (CA and WA) or administrative decision (FL),
and states affected by the Hopwood and Johnson rulings (TX, AL, GA, LA, and MS), as their
universities had not had sufficient time to adjust to the Grutter ruling.
2.1g Assessing the “post-affirmative action” policy environment
Each state in which affirmative action was unambiguously banned for all public colleges
(CA-FL-TX-WA) put into place an alternative policy or collection of policies with an explicit or
implicit goal to increase minority student enrollments in the absence of formal race-based
affirmative action policies. For example, California, Texas, and Florida implemented some

7
version of a top x% plan upon eliminating affirmative action. These states’ top x% plans,
however, vary widely in terms of their complexity (Horn & Stella, 2003) and their effectiveness
at maintaining or increasing levels of minority enrollment in a post-affirmative action
environment (Long, 2007). At the institutional level, universities in post-affirmative action states also
implemented varying degrees of class-based affirmative action. Laird (2005) notes that “in states where
affirmative action has been abruptly ended, the first alternative to the consideration of race and ethnicity
in university admissions has almost always been socioeconomic affirmative action” (142). The ability of
class-based affirmative action policies to proportionately increase minority admission rates however, is
dubious: Cancian (1998) uses data from the National Longitudinal Survey of Youth (NLSY) to simulate
class-based affirmative action and finds “class-based programs would not achieve the same results as
[affirmative action policies] targeting racial and ethnic minority youths” (104). Universities may take
other measures to boost the admissions prospects of minority applicants. Long and Tienda
(2008) present evidence that while UT-Austin and Texas A&M eliminated a direct preference for
minorities in their admissions decisions, they simultaneously changed the weights placed on
various applicant characteristics that advantaged minority applicants – i.e., that they found
proxies for applicant’s race. Our estimation method (discussed below) will focus on assessing
changes in the direct preferences given to minority applicants (holding constant other observable
applicant characteristics). However, in the conclusion, we discuss results that show that there is
little evidence that changes in other practices (including the top-x% plans and changes in weights
placed on applicant characteristics that are correlated with race) had substantial effects on
admissions prospects across the states affected by affirmative action bans.
In the same way that the Bakke ruling made the use of quotas illegal in college
admissions (Antietam, 2008), the Gratz ruling determined the practice of assigning “points” for a
minority student’s race was “not narrowly tailored to achieve the interest in educational diversity
that the defendants claim justifies their program” (Gratz v. Bollinger, p. 22). While it is
impossible to determine prior to the Gratz ruling how many colleges and universities assigned
“points” in the admissions process based on a minority student’s race, we assume that many of
the colleges and universities using a point system for race prior to the Gratz ruling shifted
admissions processes to a “holistic” admissions process permissible under the Grutter ruling.
Holistic admissions policies lack formal scoring of applicant characteristics, academic and
otherwise, which leave race as only one applicant factor considered alongside a host of other
applicant characteristics (Sternberg, 2010). Therefore, it is logical to infer the effect we measure

8
in this paper may be a reflection of this change in processes as a result of the Gratz and Grutter
rulings.
In terms of policy processes, Washington and California banned affirmative action by
popular vote; both are western states with strong traditions in the voter initiative process.
Affirmative action bans in Florida and Texas, conversely, were implemented through
administrative and judicial processes. Additionally, the political atmosphere of the post-
affirmative action states spans the political spectrum. Washington and California lean
Democratic, Texas is a Republican stronghold, and Florida trends Republican though often
swinging between parties for presidential elections (Federal Election Commission, 2000, 2004,
2008). In short, though Washington, California, Texas, and Florida share the distinction of being
post-affirmative action states, their characteristics make them as a group relatively
heterogeneous.
Private colleges in states where public colleges are bound may also reduce their
affirmative action for three reasons. First, they may fear that the local political environment may
be hostile to affirmative action and thus may fear a costly lawsuit. Second, administrators may
feel less need to overcome the legacy of discrimination or to achieve diversity given the local
political environment. Third, private colleges in these states may find it easier to compete for the
top minority applicants as those applicants may have fewer offers of admission. If so, these
private colleges could offer fewer admissions to minority applicants while yielding the same
level of diversity.
2.2 Prior literature on college affirmative action
This paper’s approach closely follows the methodology of Long’s (2010) analysis of
temporal and regional changes in affirmative action between 1972 and 1992. Long empirically
demonstrated that different regions of the United States have distinct historical patterns in their
use of affirmative action, and found higher levels of affirmative action in the Northeast and
Midwest in 1972 with affirmative action increasing in the South and West and declining in the
Northeast and Midwest by 1992. Diverging from Long’s 2010 format, however, we leverage the
United States’ evolving policy terrain by constructing two regions in our model based on states’
policy environment instead of geography. In essence, the changing landscape of affirmative
action policy in the United States since 1995 presents a natural experiment through which we can
investigate the effects of affirmative action bans on institutional admissions processes relative to

9
the colleges and universities in states which continue to allow affirmative action in college
admissions.
Our paper contributes three new perspectives to the existing body of research on the post-
affirmative action policy environment. First, while studies have examined the enrollment of
underrepresented minorities in post-affirmative action state using institution-level IPEDS4 data
(e.g. Hinrichs, 2010; Moses & Yun, 2009) or IEPDS data combined with survey data (Grodsky
& Kalogrides, 2008), no analysis to our knowledge has examined the applicant-level effects of
affirmative action bans in the way that we do. Second, as Long (2010) notes, “there is little
historical evidence” that allows researchers to examine how affirmative action policy has varied
across institutions, regions, and time (p. 1). We address this gap in the literature by contributing
research that compares the post-affirmative action policy environment of 1992 to 2004. The
third contribution we make relates to considering a set of U.S. colleges and universities with a
broad range of selectivity as measured by students’ median SAT scores. While a robust body of
literature has examined the effects of eliminating affirmative action at flagship universities and
elite institutions (e.g. Bowen & Bok, 1998; Espenshade, Chung, and Walling, 2005; Espenshade
& Chung, 2005; Espenshade, Hale, and Chung, 2005, Grodsky & Kurlaender, 2006) our analysis
of institutions which are at least moderately selective accounts for a much broader range of
institution types. Our analysis is thus closer in spirit to Kane (1998), Light and Strayer (2002),
Long (2004), Arcidiacono (2005), and Howell (2010), which each use data on a nationally
representative sample of youth. Long (2004) finds that affirmative action was significant in
1992 for institutions whose median freshman scored 967 or above on the SAT which constituted
the top “39% of 4-year colleges, which are attended by around 45% of college enrollees” (p.
1,026). Kane (1998) similarly found that significant preferences were used by colleges in the
top-two quintiles of the SAT distribution in the early 1980s, and that this advantage given to
minority students was only substantial in top-quintile colleges. As a result, we will focus on
colleges whose median freshman SAT score was at or above 1,000.
The topic of affirmative action in higher education has inspired a burgeoning body of
literature since the 1990s. Research has examined the effects of affirmative action bans and the
top-10 percent plan in Texas (e.g., Cullen, Long, and Reback, 2011; Dickson, 2006; Harris and
Tienda, 2010; Kain & O’Brien, 2003; Long, Saenz, & Tienda, 2010; Long & Tienda, 2008,
4 Integrated Postsecondary Education Data System collected by the U.S. Department of Education.

10
2010; Tienda & Nui, 2006a, 2006b; Tienda & Sullivan, 2009), California (Contreras, 2005;
Grodsky, & Kurlaender, 2010; Karabel, 1999), Texas and California (Caldwell, 2010; Card &
Krueger, 2005; Long, 2004), Texas and Florida (Perna, Li, Walsh, & Raible, 2010). Less
attention appears to be paid to Washington (e.g. Brown & Hirschman, 2006) and Florida (e.g.
Marin & Lee, 2003). Research has also examined patterns of admission and enrollment across
multiple post-affirmative action states (Long, 2007; Hinrichs, 2010).
Findings in recent years have illustrated the impact of the post-affirmative action policy
environment on the applications, admission, and enrollment of minority students. For example,
Hinrichs (forthcoming) examines the effects of affirmative action bans in the context of
institutional enrollment. Using IPEDS data, Hinrichs regresses minority enrollment percentages
on a dummy variable of whether a state banned affirmative action while controlling for a host of
other factors, and finds that on average affirmative action bans decrease African American and
Hispanic enrollment at public universities by roughly 1.7 percentage points and 2.0 percentage
points, respectively (p. 13). In an analysis of flagship universities in post-affirmative action
states, Long (2007) finds that “the effects of affirmative action were clearly demonstrated by the
declines in minority enrollment in flagship public universities in California, Texas, and
Washington after statewide bans on these preferences” (p. 326). In a broader context, Grodsky
and Kalogrides (2008) find that the “predicted probability of claiming to engage in affirmative
action increases for public and private institutions…through the 1990s and declines thereafter”
with a “particularly pronounced” decline at public institutions around 1998 (p. 17). What this
literature lacks is a specific estimation of the magnitude of the change in the direct preferences
given to minority application by institutions in their admissions decisions.
3. Methods
We construct three measure of affirmative action, at the applicant, college, and county
levels. First, using national data on college applicants (discussed in the next section), we
construct a measure of affirmative action using the change in the likelihood of admissions if the
applicant is an underrepresented minority. Second, we construct a measure of affirmative action
for each 4-year college in the continental U.S. using the results from the applicant data. Third,
for a hypothetical student living at the centroid of each county, we construct a measure of
affirmative action available at nearby institutions.

11
3.1 Computing the size of preferences given to minority applicants at the individual level
We start with a dataset of applications which contains rich observable student
characteristics, the name of the college that the student applied to (which is then linked to data on
the institution’s median freshman SAT and ACT scores (“MSATACT”, explained below)), and
the admissions decision of the college. We loop through this dataset selecting applicant i’s
record. We keep all other applications that were submitted to colleges of similar selectivity (and
in some specifications the same “region” of the country).5 Our goal is to identify the effect race
had on applicant i’s admissions decision. To identify this effect, ideally we would want to
estimate the counterfactual admissions decision by taking the average of the admissions
decisions of students of the opposite race who were otherwise identical to applicant i in every
way that is observable to the college. Since there are very few students who apply to a specific
college with identical observable characteristics (even if we had available to us information on
every college applicant), we take the next best approach which is to match students who have the
same baseline probability of being admitted based on institution and student characteristics aside
from race (which we loosely term “student quality”). We estimate the following probit equation
(1) and use the results to construct the following index of student quality (2):
(1) Prob(Admiti=1) = ,
where Admiti is an indicator that equals one if the applicant was admitted, is an indicator for
underrepresented minority, and is a vector of observable student characteristics aside from
race and characteristics of the institution at which the student applied.6
(2) StudentQualityi = ,
where , , and are the estimated parameters from Equation 1, and is the mean value of
for applicants included in the probit regression.
5 Ideally, we would prefer to only select applicants to the same college and estimate affirmative action for that specific college. There are no national datasets with a wide range of institutions that have sufficient numbers of applications to each institution allow for good estimates to be derived. For analysis that have focused on complete data from specific institutions, see Bowen & Bok, 1998; Espenshade, Chung, and Walling, 2005; Espsenshade & Chung, 2005; Espenshade, Hale, and Chung, 2005; and Long & Tienda. 2008). Rather, we focus on applications sent to colleges whose MSATACT was within +/- 50 points of applicant i’s college. To provide sufficient numbers of minority and non-minority applicants for the analysis where the data is thin, we widen the window width until we capture at least 100 applicants of which at least 10 are minorities and 10 are non-minorities. This widening of the window width occurs at the extremes of the selectively distribution. 6 We weight the applications in this regression to give equal weight to applications to institutions that are above and below the MSATACT of applicant i's college.

12
We then identify students with similar levels of student quality (in the nation or in the
same region) to applicant i, who applied to colleges of similar selectivity (in the nation or in the
same region), but who are in the opposite racial group. We then estimate the amount of
affirmative action present in applicant i’s admission decision as the following:
(3) AAi = Admiti – Admit≠i, if applicant i is a minority, or
(4) AAi = Admit≠i Admiti, if applicant i is a non-minority,
where Admit≠i is computed using only applicants similar to applicant i. An applicant is deemed
similar to applicant i if his/her StudentQuality is within ± 0.025 of applicant i's StudentQuality.
If there are no students within this range, we identify applicant i's nearest neighbor and use that
student’s admissions decision as applicant i’s counterfactual.7,8,9
3.2 Computing the size of preferences given to minority applicants at the college level
Our next goal is to compute levels of affirmative action at each 4-year college in the
nation. If we had sufficient numbers of applications at each college, we could take the estimates
from section 3.1 and compute an average based solely on applicants to college j. However, no
national datasets offer sufficient data to produce such estimates. Instead, we construct an
estimate for each 4-year college based on the level of affirmative action estimated for applicants
to colleges of similar selectivity (and within the same region) to college j. We loop through a
dataset of 4-year colleges, select those colleges whose MSATACT is within 50 points of college
j, and compute the average level of affirmative action given to applicants who applied to these
institutions (taken from our estimates in section 3.1).10 Thus, affirmative action at college j is
given by the following:
7 For the data we subsequently discuss, we use the nearest neighbors for 80, 130, and 140 of the 8,010 applications in 1992 when we produce estimates for the Continental U.S., CA-FL-TX-WA versus other states, and CA-FL-TX-WA-AL-GA-LA-MS versus other states, respectively. For 2004, we use nearest neighbors in 90, 200, and 160 of the 10,740 applications. Sample sizes of applications are rounded to the nearest 10 due to requirements of the U.S. Department of Education for using restricted-access data. 8 We do not find any evidence to support the hypothesis that within these narrow ranges of StudentQuality that minority applicants have significantly lower values of StudentQuality than their non-minority matched counterparts. 9 An alternative method to identify levels of affirmative action would be to evaluate the marginal effect of Mi on Prob(Admiti=1) using the estimated coefficients from Equation 1 (e.g., Kane (1998) and Long (2004)). We believe that the method used in this paper is better because it does not rely on comparisons of individuals with low- and high-probabilities of admission (which is called the “Common Support” problem in the propensity score matching literature – see Black and Smith (2004) for a nice discussion). The approach taken in this paper was first used by Long (2010). This method is flexible in identifying changing levels of affirmative action as we move up the selectivity continuum. 10 We produce a weighted mean such that we give equal weight to applications to institutions that are above and below the MSATACT of college j.

13
(5) AAj = AAi, for all applications to colleges similar to j.
To produce standard errors on the mean levels of affirmative action at the college level,
we produce estimates of affirmative action at the individual level for 100 bootstrapped samples
of student applications, compute AAj for each institution, compute the mean of AAj for relevant
groups of institutions, and take the standard error of the resulting 100 estimates. For standard
errors of the change in mean levels of affirmative action between 1992 and 2004, regional
differences in 1992 and 2004, and the regional differences in the change in mean levels of
affirmative action between 1992 and 2004 (i.e., the difference-in-difference estimate), we
compute the changes / regional differences / difference-in-differences based on the results from
each of our 100 bootstrapped samples, and take the standard errors of these changes / regional
differences / difference-in-differences across the 100 samples.
3.3 Computing the size of preferences given to minority applicants at nearby colleges
Third, we construct a measure of affirmative action at “nearby” colleges for student
living at the centroid of a county. We produce a weighted average of each college’s level of
affirmative action, with more weight given to colleges that are closer to the student and in the
same state as the student, and to colleges with greater enrollment. To construct the parameters
for this weighting, we estimate the following gravity equation using students’ enrollment
decisions11:
(6) Thj = κHhαEj
βexp(γ1Dhj+γ2Ihj),
where Thj is the number of students at high school h that enroll in college j, Hh is the number of
students at high school h who enroll in any four-year college included in our datasets, Ej is the
enrollment of college j, Dhj is the distance between high school h and college j, Ihj is an indicator
variable that equals one if the high school is in the same state as the college, and κ, α, β, γ1, and
γ2 are the parameters to be estimated. The parameter γ1 gives the resistance of the enrollment
decision to the distance of the students from the college, and γ2 gives the preference students
have for enrolling in in-state colleges.
11 This model is adapted from Raphael (1998), who applied it to study spatial mismatch of workers and jobs in the San Francisco Bay Area. Since students’ enrollment decisions may be affected by colleges’ affirmative action practices, it could be the case that the resulting parameters that are meant to show students’ preference for attending nearby colleges are misestimated due to the endogeneity. It is assumed that this bias is small and does not substantially affect the estimates of nearby affirmative action.

14
The parameter estimates for Equation 5 are shown in Appendix Table 1. We find a
modest decrease in resistance to distance between 1992 and 2004 and a modest increase in the
preference for enrolling in in-state colleges.
To compute the average affirmative action of nearby universities, the following weight is
assigned to college j for students from county c:
(7) Wcj = Ejexp( Dcj+ Icj)
To illustrate this weighting scheme, Figure 1 shows the weights for four fictional students
living in Reno, Davenport, Boston, and Austin, respectively. This figure shows the degree to
which college markets are localized. The figure for Austin shows the importance of UT-Austin,
which is the largest circle. The Reno figure shows the paucity of universities in the West, and
shows the importance of the University of Nevada at Reno, the University of Nevada at Las
Vegas, and the Pacific coast universities for such a student.
[INSERT FIGURE 1 HERE]
Using these weights, we compute the average degree of affirmative action of nearby
universities (AAc) given county c’s location and cohort using the following equation:
(8) AAc = ∑
∑
where J is the total number of four-year colleges for the relevant cohort.
4. Data and empirical counterparts
Our data on college applicants comes from the National Education Longitudinal Study of
1988 (NELS) and the Education Longitudinal Survey of 2002 (ELS). NELS followed 8th graders
from 1988 until 2000 while ELS has followed 10th graders from 2002 to the present. We use
data through the fourth follow-up of NELS (2000) and the second follow-up of ELS (2006).
When the NELS and ELS students were seniors, they were asked are asked to list two colleges
that they would prefer to attend and whether they had been accepted by that college. Since many
students did not know the status of the admissions decision at the time of the senior survey, they
were re-asked in the follow-up interview two years later.12 We restrict the analysis to
applications to colleges in the continental U.S. where our measure of “nearby” colleges (given
12 NELS students were asked “What is the name and location of the institution you applied to (that was your first[second] choice)?.” ELS students were asked “Print below the names and locations of the two schools to which you have applied that you are most likely to attend.”

15
below) is more sensible.
We include the following variables derived from NELS/ELS in vector X in Equation 1:
high school grade point average; average of student’s SAT and ACT score (in SAT equivalent
points)13; class rank percentile; indicators for whether the student participated in athletics and
student government and whether the student was female; parent’s socio-economic percentile14;
high school quality index15; indicator for private high school; indicator for living in a
Metropolitan Statistical Area; MSATACT of the college; indicator for a private college; and the
enrollment of the college.16 Missing values for any of the X characteristics are imputed linearly
by the available non-missing X variables so that no applicant is dropped who has some missing
values.
The dataset of 4-year colleges is taken from the 1999 and 2005 editions of Barron’s
Profile of American Colleges, and restricted to those in the continental U.S. Using these data,
we compute for each institution the average of its freshmen’s median SAT test score (on reading
and math) and ACT test scores (converted into SAT-equivalent points) to produce our
constructed variable MSATACT. If these variables were unavailable, we impute MSATACT
using the percentages of students who fell in various SAT ranges (<500, 500-600, 600-700,
>700) and various ACT ranges (<21, 21-23, 24-26, 27-28, >28). If this range data were
unavailable, we imputed using the mean value of MSATACT for the college’s Barron’s
selectivity index. Since MSATACT rose between 1992 and 2004 (from a mean of 955 to 1,073),
and since we want to be able to compare similarly selective institutions to one another across
these cohorts, we have forced the distribution of MSATACT across colleges in 2004 to be
equivalent to the distribution of MSATACT across colleges in 1992 by replacing the 2004 value
with the corresponding 1992 value at the same percentile. For example, colleges with a
MSATACT of 1,163 in 2004 (which placed such a college at the 75th percentile of the 2004
distribution) would have their MSATACT replaced by 1,046, which corresponded to the 75th
percentile in 1992.
13 When missing, this variable is imputed using NELS/ELS administered exams in 8th, 10th, and 12th grades. 14 Derived by the U.S. Department of Education. 15 Derived by the authors using a principal component analysis and based on the following factors: pupil-teacher ratio, percent of prior graduates in a 2- or 4-year college, percent of students in dropout prevention program, percent of students enrolled in college preparation courses, attendance rate (NELS only), and district’s instructional and support expenditures per pupil (from Common Core of Data). 16 We base our construct of vector X on the most common applicant characteristics used to make admission decisions. See, for example, Camara and Kimmel (2005) and Zwick (2000).

16
5. Results
5.1 Variation in levels of affirmative action by college selectivity and cohort
Columns (1) and (2) of Table 1 show the number of applications and number of colleges
by selectivity. The bulk of applications go to colleges with MSATACT between 900 and 1,100.
Nonetheless, for both cohorts we have 1,700 applications going to the 150 institutions whose
MSATACT is at or above 1,100.17
[INSERT TABLE 1 HERE]
Columns (3) and (4) of Table 1 show the estimated affirmative action given to applicants
and to colleges by selectivity. Consistent with Kane (1998) and Long (2004), we find that
minority applicants were more likely to be admitted than observably similar white and Asian
applicants for colleges with MSATACT ≥ 1,000 and these preferences increase with selectivity
and are large above 1,100. However, the magnitude of the estimated affirmative action appears
to be sizably smaller in 2004 for institutions with MSATACT between 1,100 and 1,300.
For both cohorts, we find negative “affirmative action” for colleges with MSATACT
between 800 and 1,000. This negative “affirmative action” could reflect either actual
discrimination on the part of such institutions or could reflect unobserved advantages for non-
minority applicants (e.g., better admissions essays) which are not sufficiently controlled for by
the included observed variables. Interestingly, for the 2004 cohort we find somewhat higher
rates of acceptance for minority applicants applying to institutions with MSATACT between 700
and 800 relative to observably similar non-minority applicants to these institutions. In 2004,
77% of the enrollment in the 31 institutions whose MSATACT was between 700 and 800 was at
Historically Black Colleges and Universities (HBCUs) or Hispanic-Serving Institutions (HSIs).18
It is possible that the higher chance of admission for minority students at these institutions
reflects a true preference for such students (and would thus rightly be called “affirmative
action”). Yet, there is not sufficient sample size of applications to feasibly test for differences in
17 Further note that in 2004, 66% of the applications to colleges above 1,000 went to colleges between 1,000 and 1,100, and 63% of the applications to colleges above 1,100 went to colleges between 1,100 and 1,200. Thus, affirmative action given in these ranges can impact far more students than affirmative action supplied by the most elite institutions. This fact is one strong reason for using NELS and ELS data that are nationally representative rather than data from the College and Beyond dataset that mostly comes from very elite institutions. The College and Beyond institutions also are limited in geographic distribution, and are mostly in the East. 18 These institutions are listed at www2.ed.gov/about/inits/list/whhbcu/hbcu-report-2007.pdf and www2.ed.gov/about/offices/list/ocr/edlite-minorityinst-list-hisp-tab.html, retrieved on October 5, 2011.

17
the advantages given to minority applicants at these HBCUs and HSIs relative to the other
institutions in this selectivity range. For the rest of this paper, we ignore institutions with
MSATACT less than 1,000 and focus on colleges where “affirmative action” appears to be
occurring.
5.2 Significance of changes in affirmative action over time and regional differences
As shown in column (3) of Table 2, colleges whose MSATACT was above 1,000 (above
1,100) were 5.6 (13.1) percentage points more likely to accept a minority applicant than an
observably similar non-minority applicant in 1992. As shown in column (6), these preferences
fell in 2004 to 3.5 and 7.8 percentage points respectively – although these changes were not
significant, as shown in columns (9)-(11).19
[INSERT TABLE 2 HERE]
Looking at row (C) in both the top and bottom panels of Table 2, we see modestly rising
levels of affirmative action practiced by colleges outside of the states that were affected by
affirmative action bans or the Hopwood or Johnson rulings, although these increases were not
statistically significant. Thus, there is no evidence that the Grutter ruling requiring holistic
review adversely affected levels of affirmative action practiced in the year after the ruling. In
contrast, as shown in row (E) in the top panel of Table 2, in both the top and bottom panels of
Table 2 we find substantial declines in levels of affirmative action in the post-affirmative action
states. At colleges with MSATACT above 1,000, the decline is large (4.9 percentage points) but
not statistically significant, while at colleges with MSATACT above 1,100, the decline in
affirmative action is dramatic. At such institutions in the post-affirmative action states, the
preference given to minority applicants fell from positive 8.6 percentage points (p-value = 0.110)
to negative 11.8 percentage points (p-value = 0.128). While the negative figure is not quite
significant, and thus there is no concrete evidence of discrimination against minority applicants
in the post affirmative action era, the change between the cohorts (8.6 - -11.8 = 20.4 percentage
points) is significant.
Rows (F), (G), and (H) in the bottom and top panels of Table 2 assess whether the post-
affirmative action states differed from the rest of the nation. In 1992, none of the differences are
significant. Yet, in 2004, the differences are quite large and significant. Columns (9)-(11) for
19 The change in preferences for colleges whose MSATACT was above 1,100 was close to statistically significant (p-value = 0.112).

18
Rows (F)-(H) show the difference-in-difference results. When we focus on colleges with
MSATACT above 1,100, we find a significant difference-in-difference estimate of 21.9
percentage points when comparing CA-FL-TX-WA-AL-GA-LA-MS versus other states in the
continental U.S.20
Note that 81% of the enrollment in the 22 institutions in the post-affirmative action states
with MSATACT ≥ 1,100 in 2004 come from the following seven institutions: University of
Florida, UCLA, UC-Berkeley, USC, Georgia Tech, Stanford, and UT-Dallas. Three public
institutions in these states (UF, UCLA, and UC-Berkeley) were still bound in 2004 to not grant
preferential admission to minorities, while USC and Stanford were not bound by Prop. 209.
While Georgia Tech and UT-Dallas were no longer bound by the Johnson and Hopwood rulings,
they nonetheless may have been unwilling to respond quickly to the change brought about by the
Grutter ruling.
5.3 Variation in levels of affirmative action at “nearby” colleges
We now turn to evaluate how this change in levels of affirmative action affected the
availability of affirmative action at nearby colleges. Table 3 presents the county-level estimates
of nearby affirmative action, weighted by the county’s population.
[INSERT TABLE 3 HERE]
Using data for the continental U.S., we find that the level of affirmative action in nearby
colleges fell from 4.6 to 3.8 percentage points at colleges with MSATACT ≥ 1,000, and from
11.0 to 5.5 percentage points at colleges with MSATACT ≥ 1,100. The variance in nearby
affirmative action across counties substantially increased.
In the second panel, we focus on the post-affirmative action states. Here we see stronger
changes in the availability of affirmative action in nearby colleges, falling from 5.2 to 0.7
percentage points at colleges with MSATACT ≥ 1,000, and from 9.5 to -6.1 percentage points at
colleges with MSATACT ≥ 1,100. There is substantial variation in nearby affirmative action in
counties in these states in 2004, with a range of -15.3 to +8.9 percentage points for the more
selective colleges. The positive values reflect the fact that Alabama and Mississippi lack
colleges with MSATACT ≥ 1,100 while some counties in the other post-affirmative action states
are relatively distant from the selective colleges in their states, and thus are more subject to the
20 For colleges with MSATACT above 1,000, the difference-in-difference estimate (-6.3%) is nearly significant (p-value = 0.133).

19
national marketplace, where affirmative action was unabated.
The third panel of Table 3 shows the changes in affirmative action in other states. Here
we find that the mean level of nearby affirmative action was nearly unchanged in these states,
but the variance increased. Moreover, the level of affirmative action at nearby colleges is
negative for some counties in 2004, as some counties are strongly affected by changes in nearby
post-affirmative action states.
Figure 2 shows the level of affirmative action available at nearby colleges for a
hypothetical student living at the centroid of each county. Columns 1 and 2 show the results for
colleges with MSATACT ≥1,000 and ≥1,100 respectively, while Rows 1 and 2 show the years
1992 and 2004, respectively. The color bands are divided equally by units of 3 percentage points
with blue reflecting negative “affirmative action”, yellow reflecting low positive levels of
affirmative action, and red reflecting the highest levels of affirmative action. For Row 1, since
there was less substantial regional variation in levels of affirmative action in 1992, variation
across counties is mostly generated by the geographical distribution of colleges’ MSATACT
levels (i.e., counties that are proximate to more selective colleges will have higher estimated
nearby affirmative action). In contrast, for Row 2 (2004), much of the variation is driven by the
elimination of affirmative action in CA-FL-TX-WA-AL-GA-LA-MS. Note that for many
counties the estimate of affirmative action is negative – and particularly large in California.
Since the negative levels of affirmative action were not found to be significant in Table 2, the
color bands here should be taken as illustrative of the changes in nearby affirmative action, but
not as revealing definitive evidence of discrimination.
[INSERT FIGURE 2 HERE]
States that are adjacent to those that eliminated affirmative action and who do not have
their own highly selective colleges are strongly affected by the bans in these neighboring states.
For example, from Row 2 and Column 2 of Figure 2, counties throughout Nevada and Arizona
are estimated to face negative levels of nearby affirmative action. This result occurs because
these states have no colleges with MSATACT ≥ 1,100, and thus students from these states who
are looking to attend such colleges are likely to seek out the highly selective colleges in
California were affirmative action is estimated to be negative. In contrast, Oregon counties show
positive levels of affirmative action throughout the state, despite being wedged between
Washington and California. As Oregon has several colleges with MSATACT ≥ 1,100 (Reed

20
College, Lewis and Clark College, U. of Portland, and Willamette U.), and since these colleges
are estimated to still give positive preference to minority applicants, and given the preference of
students to remain in the state of their high school residence, students living in Oregon counties
are estimated to face positive levels of affirmative action. Idaho is similar to Nevada and
Arizona in lacking a college with MSATACT ≥ 1,100, but is less “blue” than these states since
(1) it is influenced by the positive affirmative action in Oregon, (2) it is further from California,
and (3) the enrollment in selective colleges is smaller in the adjacent Washington (4,193 students
in Whitman College and U. of Puget Sound) than the enrollment in the selective colleges in
California (76,152 students). Thus, students in Idaho looking for a selective college are more
influenced by colleges throughout the nation than similar students in Nevada and Arizona who
are influenced more by selective colleges in California. Finally, counties in Mississippi and
Alabama are found to have positive levels of nearby affirmative action at colleges with
MSATACT ≥ 1,100 in 2004 despite the fact that colleges in these states were arguably subject to
the Hopwood and Johnson rulings, respectively. This result occurs because these states lack
colleges with MSATACT ≥ 1,100. Students in these states who seek to attend such selective
colleges will be more searching in a more national market.
6. Conclusions
We find that affirmative action declined significantly and substantially between 1992 and
2004 in states where affirmative action was prohibited during this period by referenda, judicial
rulings, or administrative decisions (i.e., California, Florida, Texas, Washington, Alabama,
Georgia, Louisiana, and Mississippi). In contrast, levels of affirmative action were unchanged
throughout the rest of the Continental U.S., suggesting that the requirements imposed by the
2003 Grutter ruling had little immediate effect on universities’ abilities to continue to provide
preferential admission to minority applicants. We illustrate that these declines in affirmative
action had effects on the availability of affirmative action in states that are nearby but that lack
highly selective colleges, notably Arizona, Idaho, and Nevada.
Note that our analysis specifically addresses the extent to which universities changed the
weight placed directly on the applicant being a minority, controlling for students’ other
observable characteristics. Chan and Eyster (2003) theoretically predicted that universities
would change the weights placed on other observable applicant characteristics (e.g., lowering the
21
weight placed on SAT and ACT test scores), and thus indirectly advantaged minority applicants.
Such a policy response was found to be empirically occurring at UT-Austin and Texas A&M by
Long and Tienda (2008). Long and Tienda found that the reweighting of applicant
characteristics by UT-Austin led to a 33% rebound in the number of minorities who were
admitted (relative to the loss brought on by the elimination of direct affirmative action), and that
the combination of the reweighting of applicant characteristics and the Top-10% plan led to a
61% rebound, while a smaller effect was found at Texas A&M. If such reweighting of
observable applicant characteristics is occurring broadly throughout these seven states, then the
adverse change in minority admissions as estimated in this paper may overstate the changes in
minority students admissions prospects. However, in results not shown (but available on
request), we test this conjecture by holding the admissions parameters in Equation 2 equal to
their 1992 values and re-computing affirmative action in 2004 at the applicant and college level.
From this exercise, we find no systematic evidence that suggests that colleges indirectly
advantaged minority applicants by changing the weights on applicant characteristics using our
national data.
Finally, this paper has not evaluated the effects of other efforts by colleges to boost
minority students’ rates of application to selective colleges and minority students’ enrollment
rates conditional on admission. The vast increase in outreach and scholarship programs (Long,
2007) holds the promise of increasing these responses. If they are effective, they could likewise
mitigate the negative effects of the decline in the direct weighting of students’ race. However, as
these recruitment efforts and scholarship programs mainly target in-state students, the adverse
effects on nearby students (e.g., in Arizona, Idaho, and Nevada) may be not be mitigated.

22
References
Arcidiacono, Peter. (2005). Affirmative action in higher education: How do admission and financial aid rules affect future earnings? Econometrica 73, no. 5:1477–1524.
Associated Press (2012). Federal court reconsidering Michigan's affirmative action ban. Detroit Free Press, March 7. Accessed online on 3/7/2012: http://www.freep.com/article/20120307/NEWS06/120307006/
Azevedo, Alisha & Betsy Vincent (2011). Brown vetoes affirmative actionlike SB 185, The Daily Californian, October 8.
Ancheta, A. (2008). Bakke, antidiscrimination jurisprudence, and the trajectory of affirmative action law. In P. Marin and C. L. Horn (Eds.), Realizing Bakke’s Legacy: Affirmative action, equal opportunity, and access to higher education (pp. 41-58). Sterling, VA: Stylus Publishing.
Barron’s. (2005). Barron’s Profiles of American Colleges 2005. New York: Baron’s Education Series.
Black, D. & Smith, J. (2004). How robust is the evidence on the effects of college quality? Evidence from matching. Journal of Econometrics. 121(1), 99-124.
Blume, G. (2010). Policy options to increase underrepresented minority student enrollments in a post-affirmative action environment: A case study of the University of Washington. Research paper presented at the Association for the Study of Higher Education annual meeting, Indianapolis, Indiana, November 19.
Bowen, W. & Bok, D. (1998). The shape of the river: Long-term consequences of considering race in college and university admissions. Princeton, NJ: Princeton University Press.
Bowen, W. & Rudenstine, N. (2003 Feb 7). Race-sensitive admissions: Back to basics. The Chronicle of Higher Education, p. 7.
Brown, S. K. & Hirschman, C. (2006). The end of affirmative action in Washington State and its impact on the transition from high school to college. Sociology of Education, 79, 106-130.
Bush, J. (1999 Nov 19). Executive Order 99-281. Florida Department of Management Services. Accessed online on 9/27/2011: http://www.dms.myflorida.com/media/general_counsel_files/one_florida_executive_order_pdf.
Caldwell, R. (2010). The effects of university affirmative action policies on the human capital development of minority children: Do expectations matter? University of Kansas Working paper available at http://www2.ku.edu/~kuwpaper/2008Papers/200812.pdf
Camara, W & Kimmel, E. (2005). Choosing students: Higher education admissions tools for the 21st century. Mahwah, NJ: L. Erlbaum Associates.
Cancian, M. (1998). Race-based versus class-based affirmative action in college admissions. Journal of Policy Analysis and Management, 17(1), 94-105
Card, D. & Krueger, A. (2005). Would the elimination of affirmative action affect highly qualified minority applicants? Evidence from California and Texas. Industrial and Labor Relations Review, 58(3), 416-434.
Chan, Jimmy and Erik Eyster. (2003). “Does Banning Affirmative Action Lower College Student Quality?” American Economic Review, 93(3), pp. 858-72, June.
CNN. (2001). Court rejects U. of Georgia affirmative action, August 28. Accessed online on 10/13/2011: http://articles.cnn.com/2001-08-

23
28/justice/affirmative.action.reax_1_michigan-cases-factor-in-university-admissions-affirmative-action?_s=PM:LAW
Contreras, F. (2005). The reconstruction of merit post-Proposition 209. Educational Policy, 19, 371-395.
Cullen, Julie Berry, Mark C. Long, and Randall Reback. (2011). “Jockeying for Position: High School Student Mobility and Texas' Top-Ten Percent Rule,” National Bureau of Economic Research, Working Paper 16663.
Dickson, L. (2006). Does ending affirmative action in college admissions lower the percent of minority students applying to college? Economic of Education Review, 25, 109-119.
Domina, T. (2007). Higher education policy as secondary school reform: Texas public high schools after Hopwood. Educational Evaluation and Policy Analysis, 29(3), 200-217.
Espenshade, T.J., L.E. Hale, and C.Y. Chung “The Frog Pond Revisted: High School Academic Context, Class Rank, and Elite College Admission”, Sociology of Education, October 2005, 78(4):269-293.
Espenshade, T.J., and C.Y. Chung “The Opportunity Cost of Admission Preferences at Elite Universities,” Social Science Quarterly, June 2005, 86(2):293-305.
Espenshade, T.J., C.Y. Chung, and J.L. Walling “Admission Preferences for Minority Students, Athletes, and Legacies at Elite Universities,” Social Science Quarterly, December 2004, 85(5):1422-1446.
Faulkner, Larry R. (2005). Address on the State of the University, September 14, 2005, accessed 10/13/2011 at http://theop.princeton.edu/publicity/general/UTFaulkerSpeech.pdf
Federal Election Commission (2000). Federal Elections, 2000. Accessed 9/29/2011 at http://www.fec.gov/pubrec/fe2000/tcontents.htm.
Federal Election Commission. (2004). Federal Elections, 2004. Accessed 9/29/2011 at http://www.fec.gov/pubrec/fe2004/federalelections2004.pdf.
Federal Election Commission. (2008). Federal Elections, 2008. Accessed 9/29/2011 at http://www.fec.gov/pubrec/fe2008/federalelections2008.pdf.
Garces, L. (2010). Considering race in graduate admissions: Have statewide affirmative action bans reduced the enrollment of students of color in graduate programs? Research paper presented at the annual meeting of the Association for the Study of Higher Education, November 19, Indianapolis, Indiana.
Gratz v. Bollinger, 539 U.S. 244 (2003). Grutter v. Bollinger. 539 U.S. 306 (2003). Grodsky, E. & Kurlaender, M. (2006). The demography of higher education in the wake of
affirmative action. Conference paper presented at Equal Opportunity in Higher Education: The Past and Future of Proposition 209, April 2006, at the University of California, Berkeley.
Grodsky, E. and Kurlaender, M. (2010). Equal Opportunity in Higher Education: The Past and Future of California’s Proposition 209. Harvard Education Press.
Harris, Angel L. and Marta Tienda. (2010). “Minority Higher Education Pipeline: Consequences of Changes in College Admissions Policy in Texas.” Annals of the American Academy of Political and Social Science 627: 60-81.
Hebel, S. (2000 Aug 4). Federal judge declares University of Georgia’s admissions policies unconstitutional. The Chronicle of Higher Education, p. A28.
Hebel, S. (2001 Nov 23). University of Georgia won’t appeal affirmative action case to Supreme Court. The Chronicle of Higher Education, p. 23.

24
Hinrichs, P. (forthcoming). The effects of affirmative action bans on college enrollment, educational attainment, and the demographic composition of universities. The Review of Economics and Statistics.
Holzer, H. & Neumark, D. (2006). Affirmative action: What do we know? Journal of Policy Analysis and Management, 25(2), 463-490.
Hopwood v. Texas, 78 F.3d 932 (5th Cir. 1996), cert. denied, 518 U.S. 1033 (1996). Horn, C. & Flores, S. (2003). Percent plans in college admissions: A comparative analysis of
three states’ experiences. Cambridge, MA: The Civil Rights Project at Harvard University.
Howell, Jessica S. 2010. “Assessing the Impact of Eliminating Affirmative Action in Higher Education.” Journal of Labor Economics, 28(1): 113-166.
Jaschik, Scott (2011). Court: Michigan voters can’t ban affirmative action, Inside Higher Ed, July 7. Accessed 10/13/2011 at http://www.usatoday.com/news/education/2011-07-05-michigan-affirmative-action_n.htm
Johnson v. Board of Regents of the University of Georgia, 263 F.3d 1234 (11th Cir. 2001) Kane, T. (1998). Racial and ethnic preferences in college admissions. In C. Jencks, M. Philips
(Eds.), The Black-White Test Score Gap (pp. 431-456). Washington, DC: Brookings Institution Press.
Kain, J. & O’Brien, D. (2003). Hopwood and the top 10 percent law: How they have effected college enrollment decisions of Texas high school graduates. Working Paper 26. Cecil and Ida Green Center for the Study of Science and Society, UT-Dallas. http://www.utdallas.edu/research/ tsp/pdfpapers/paper26.pdf .
Karabell, J. (1999). No alternative: The effects of color-blind admissions in California. In G. Orfield & E. Miller (Eds.), Chilling Admissions (pp. 33-50). Cambridge, MA: Harvard Education Publishing Group.
Laird, B. (2005). The case for affirmative action in university admissions. Berkeley, CA: Bay Tree Publishing.
Light, Audrey, and Wayne Strayer. (2002). From Bakke to Hopwood: Does race affect college attendance and completion? Review of Economics and Statistics 84, no. 1:34–44.
Long, M. (2004) College applications and the effect of affirmative action. Journal of Econometrics, 121(1-2), 319-342.
Long, M. C. (2007). Affirmative action and its alternatives in public universities: What do we know? Public Administration Review. 67(1), 311-325.
Long, M. C. (2010). Affirmative action at nearby colleges: Temporal and regional changes. The B.E. Journal of Economic Analysis & Policy, 10(1), article 65.
Long, M., Saenz, V., & Tienda, M. (2010). Policy transparency and college enrollment: Did the Texas Top Ten Percent law broaden access to the public flagships? The ANNALS of the American Academy of Political and Social Science, 627, 82-105.
Long, M., & Tienda, M. (2008). Winners and losers: Changes in Texas university admissions post-Hopwood. Educational Evaluation and Policy Analysis. 30(3), 255-280.
Long, M. & Tienda, M. (2010). Changes in Texas universities’ applicant pools after the Hopwood decision. Social Science Research, 39(1), 48-66.
Lyn, R. (2008). A critical analysis of the University of Georgia’s response to the United States Supreme Court decisions in Grutter v. Bollinger and Gratz v. Bollinger. (Unpublished doctoral dissertation). Georgia State University, Atlanta, Georgia.

25
Marin, P. & Lee, E. (2003). Appearance and reality in the Sunshine State: The talented 20 Program in Florida. Cambridge, MA: Civil Rights Project at Harvard University.
Moses, M. & Farley, A. (2011). Are ballot initiatives a good way to make education policy? The case of affirmative action. Educational Studies, 47(3), 260-279.
Moses, M., Yun, J., & Marin, P. (2009). Affirmative action’s fate: Are 20 more years enough? Education Policy Analysis Archives, 17(17). Retrieved 9/6/2011 from http://epaa.asu.edu/epaa/v17n17/.
Naff, K. (2004). From Bakke to Grutter and Gratz: The Supreme Court as a policymaking institution. Review of Policy Research, 21(3), 405-427.
National Center for Education Statistics. (2011a). Education Longitudinal Survey of 2002 (ELS:2002). Retrieved 10/1/2011 from http://nces.ed.gov/surveys/els2002/.
National Center for Education Statistics. (2011b). Common Core of Data. Retrieved 8/7/2011 from http://nces.ed.gov/ccd/.
Niu, S., Tienda, M., & Cortes, K. (2006). College selectivity and the Texas top 10% law. Economics of Education Review, 25, 259-272.
Perna, P., Li, C., Walsh, E., & Raible, S. (2010). The status of equity for Hispanics in public higher education in Florida and Texas. Journal of Hispanic Higher Education, 9, 145-166
Regents of the University of California v. Bakke, 438 U.S. 265 (1978). Schmidt, P. (2003 Apr 4). Behind the fight over race-conscious admissions. The Chronicle of
Higher Education, p. 22. Smith v. University of Washington Law School, CV-97-00335-TSZ (9th Cir. 2004). Tienda, M. & Nui, S. (2006a). Capitalizing on segregation, pretending neutrality: College
admissions and the Texas Top 10% Law. American Law and Economics Review, 8(2), 312-346.
Tienda, M. & Niu, S. (2006b). Flagships, feeders, and the Texas Top 10% Plan. Journal of Higher Education. 77(4), 712-739.
Tienda, M. & Sullivan, T. (2009). The promise and peril of the Texas uniform admission law. In M. Hall, M. Krislov, and D. Featherman (Eds.).The next twenty five years? Affirmative action and higher education in the United States and South Africa. Ann Arbor: University of Michigan Press.
U.S. Census Bureau. (n.d.). Decennial Census of Population and Housing for 2000, Summary File 3. Retrieved 8/7/2011 from http://dataferrett.census.gov/ .
United States Commission on Civil Rights. (2007). Becoming less separate? School desegregation, Justice Department enforcement, and the Pursuit of Unitary Status. Washington, DC: U.S. Commission on Civil Rights.
Winter, Greg (2004 Jan 13). Texas A&M Ban on ‘Legacies’ Fuels Debate on Admissions. New York Times.
Zamani-Gallaher, E. M., Green, S. O., Brown II, M. C. & Stovall, D. O. (2009). The case for affirmative action on campus: Concepts of equity, considerations for practice. Sterling, VA: Stylus Publishing.
Zwick, R. (2002). Picking the perfect freshman class: Balancing the academic and non-academic goals of admissions policy. National Cross Talk. The National Center for Public Policy and Higher Education.

26
(1) (2) (3) (4)
College's Median Freshman SAT/ACT
1992 (NELS)
2004 (ELS)
1992 (NELS)
2004 (ELS)
700 to 800 90 110 -4.7% 2.8%800 to 900 1,410 1,850 -3.6% -2.1%900 to 1000 2,710 3,790 -1.3% -1.4%1000 to 1100 2,100 3,290 1.4% 1.6%1100 to 1200 1,030 1,070 9.8% 4.3%1200 to 1300 610 570 24.7% 13.6%>=1300 70 70 24.1% 27.6%All 8,010 10,740 2.6% 1.0%
College's Median Freshman SAT/ACT
1992 (NELS)
2004 (ELS)
1992 (NELS)
2004 (ELS)
700 to 800 28 31 -7.5% 2.3%800 to 900 396 433 -3.9% -2.2%900 to 1000 466 516 -1.4% -1.3%1000 to 1100 235 283 2.3% 1.6%1100 to 1200 93 94 9.3% 4.5%1200 to 1300 46 49 23.2% 14.4%>=1300 7 8 22.6% 22.0%All 1,277 1,419 0.8% 0.5%
Note: means are weighted by the colleges' enrollments. Sample sizes of applications are rounded to the nearest 10 due to requirements of the U.S. Department of Education for using restricted-access data. Affirmative action for each application and for each university is computed using data from the entire U.S. (rather than within region).
Number of Applications
Estimated Affirmative Action
Table 1: Estimated Affirmative Action by College's Median Freshman SAT/ACT
Number of Colleges
Estimated Affirmative
Action*
Panel A: Affirmative Action for Each Application
Panel B: Affirmative Action for Each College

27
Table 2: Significance of Changes in Affirmative Action at the College Level
(1) (2) (3) (4) (5) (6) (7) (8) (9) (10) (11)
Mean S.E. of Mean
Sig. Mean S.E. of Mean
Sig. Mean S.E. of Mean
Sig.
Region and Differences(A) Continental U.S. 381 434 5.6% 1.3% *** 3.5% 1.3% *** -2.1% 1.9%(B) Continental U.S. excl. CA, FL, TX, WA 324 367 5.2% 1.5% *** 4.2% 1.3% *** -1.0% 2.0%(C) Continental U.S. excl. CA, FL, TX, WA, AL, GA, LA, MS 309 347 4.2% 1.6% *** 5.6% 1.4% *** 1.5% 2.1%(D) CA, FL, TX, WA 57 67 4.5% 2.5% * 3.6% 3.1% -0.9% 3.5%(E) CA, FL, TX, WA, AL, GA, LA, MS 72 87 5.3% 2.4% ** 0.4% 2.9% -4.9% 3.5%
(F) = (D) - (B) -0.7% 2.8% -0.6% 3.5% 0.1% 3.9%(G) = (D) - (C) 0.3% 2.7% -2.0% 3.6% -2.3% 4.6%(H) = (E) - (C) 1.1% 2.8% -5.2% 3.4% -6.3% 4.2% ⊕
(A) Continental U.S. 146 151 13.1% 1.9% *** 7.8% 2.8% *** -5.3% 3.3% ⊕(B) Continental U.S. excl. CA, FL, TX, WA 130 132 12.4% 2.1% *** 10.0% 3.1% *** -2.4% 3.9%(C) Continental U.S. excl. CA, FL, TX, WA, AL, GA, LA, MS 126 129 12.2% 2.0% *** 13.7% 3.0% *** 1.5% 3.8%(D) CA, FL, TX, WA 16 19 5.3% 5.5% -8.4% 7.3% -13.6% 8.4% ⊕(E) CA, FL, TX, WA, AL, GA, LA, MS 20 22 8.6% 5.4% ⊕ -11.8% 7.8% ⊕ -20.4% 8.9% **
(F) = (D) - (B) -7.1% 5.8% -18.3% 8.1% ** -11.2% 9.5%(G) = (D) - (C) -6.9% 5.7% -22.0% 8.6% ** -15.1% 9.8% ⊕(H) = (E) - (C) -3.6% 2.8% -25.5% 8.0% *** -21.9% 9.3% **
Notes: Means are weighted by the colleges' enrollments. Standard errors are computed via 100 bootstrapped samples. "***, "**, "*", and "⊕" indicate that the estimated level of affirmative action (or change, difference, or difference in difference) was significant at the 1%, 5%, 10%, or 15% levels using a two-tailed test, respectively. Affirmative action for each university is computed using data on similar universities within the U.S. for the "Full Nation" rows or within region for the "Post AA States" and "Remaining States" rows.
Colleges with MSATACT>=1,000
Colleges with MSATACT>=1,100
Number of Colleges Estimated Affirmative Action1992
(NELS)2004 (ELS)
1992 (NELS) 2004 (ELS) Pre / Post Change
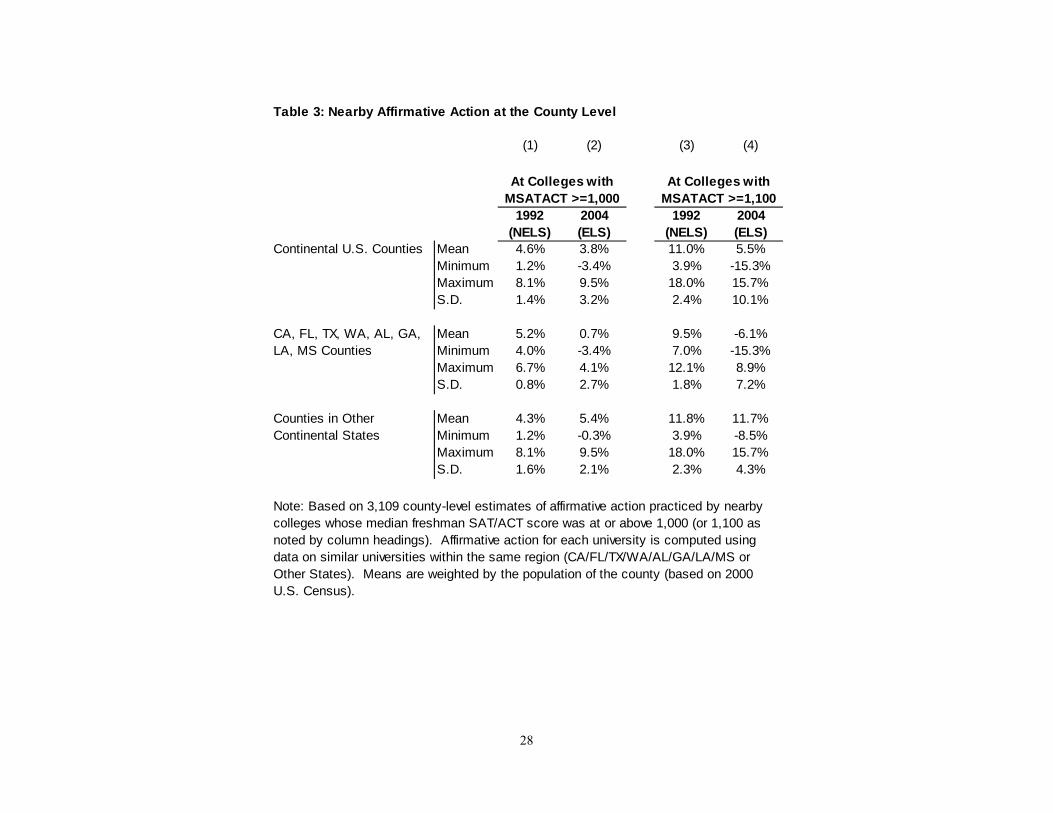
28
Table 3: Nearby Affirmative Action at the County Level
(1) (2) (3) (4)
1992 (NELS)
2004 (ELS)
1992 (NELS)
2004 (ELS)
Continental U.S. Counties Mean 4.6% 3.8% 11.0% 5.5%Minimum 1.2% -3.4% 3.9% -15.3%Maximum 8.1% 9.5% 18.0% 15.7%S.D. 1.4% 3.2% 2.4% 10.1%
Mean 5.2% 0.7% 9.5% -6.1%Minimum 4.0% -3.4% 7.0% -15.3%Maximum 6.7% 4.1% 12.1% 8.9%S.D. 0.8% 2.7% 1.8% 7.2%
Mean 4.3% 5.4% 11.8% 11.7%Minimum 1.2% -0.3% 3.9% -8.5%Maximum 8.1% 9.5% 18.0% 15.7%S.D. 1.6% 2.1% 2.3% 4.3%
At Colleges with MSATACT >=1,000
At Colleges with MSATACT >=1,100
Note: Based on 3,109 county-level estimates of affirmative action practiced by nearby colleges whose median freshman SAT/ACT score was at or above 1,000 (or 1,100 as noted by column headings). Affirmative action for each university is computed using data on similar universities within the same region (CA/FL/TX/WA/AL/GA/LA/MS or Other States). Means are weighted by the population of the county (based on 2000 U.S. Census).
CA, FL, TX, WA, AL, GA, LA, MS Counties
Counties in Other Continental States

29
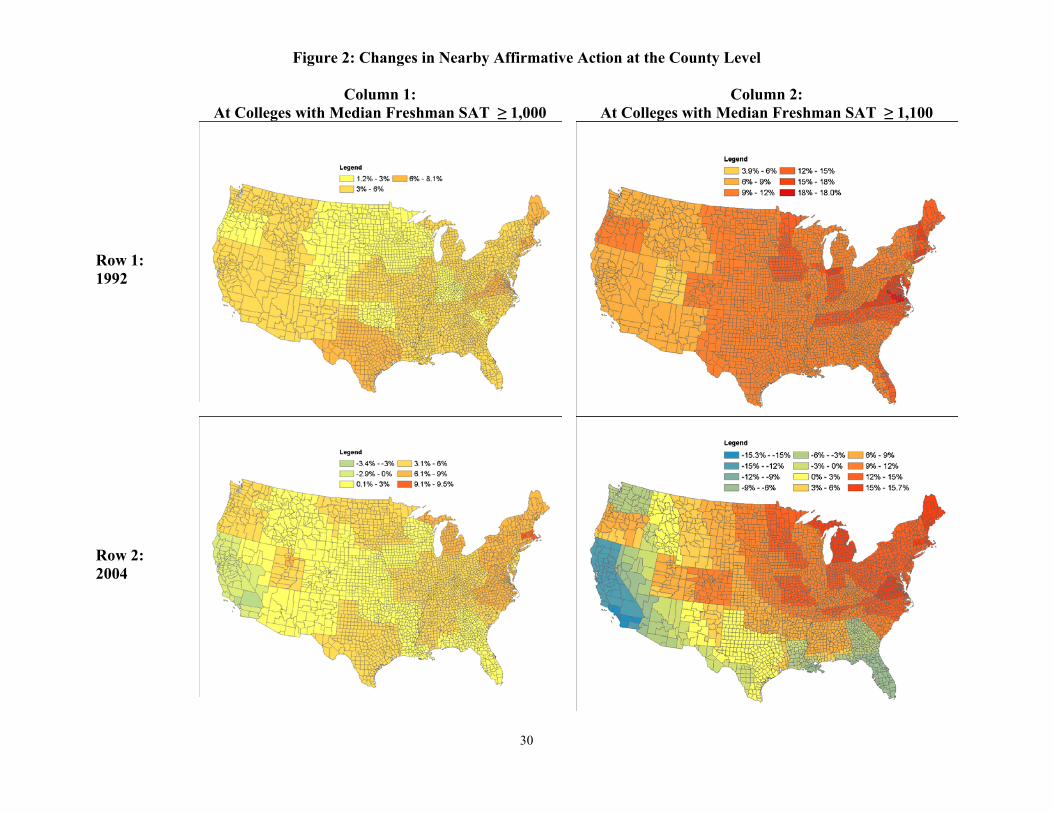
30
Figure 2: Changes in Nearby Affirmative Action at the County Level
Column 1: At Colleges with Median Freshman SAT ≥ 1,000
Column 2: At Colleges with Median Freshman SAT ≥ 1,100
Row 1: 1992
Row 2: 2004

Appendix p.1
Appendix Table 1Effect of Distance on the Number of Students from School h Enrolling in College j
NLS72 HSB NELS ELSMiles between h and j -0.00302 *** -0.00286 *** -0.00275 *** -0.00267 ***
(0.00011) (0.00010) (0.00009) (0.00008)h and j in Same State 3.08 *** 3.01 *** 2.78 *** 2.79 ***
(0.06) (0.05) (0.05) (0.04)Ln(College Enrolleesh ) 1.030 *** 0.943 *** 0.970 *** 0.950 ***
(0.036) (0.024) (0.022) (0.026)Ln(College Enrollmentj ) 0.853 *** 0.605 *** 0.743 *** 0.885 ***
(0.018) (0.015) (0.016) (0.015)Constant -13.8 *** -11.8 *** -12.7 *** -14.0 ***
(0.2) (0.2) (0.1) (0.2)
Number of Observations 1,154,030 1,298,510 1,662,810 1,021,680Psuedo-R2 0.354 0.331 0.320 0.332
Note: Negative binomial regression results. NLS72 and HSB results are taken from Long (2010) for graduating classes of 1972 and 1982 respectively. Sample sizes of applications are rounded to the nearest 10 due to requirements of the U.S. Department of Education for using restricted-access data.