horiba report 2019-2020 financial section
TRANSCRIPT

HORIBA Report 2019-2020
Financial Section
Consolidated Financial Review
Consolidated Financial Statements for
the Year Ended December 31, 2019, and
Independent Auditor’s Report
1 HORIBA, Ltd. (Consolidated)

Consolidated Balance SheetsHORIBA, Ltd and Consolidated Subsidiaries Thousands ofFor the years ended December 31, 2018 and December 31, 2019 U.S. dollars
Millions of yen (Note 1)ASSETS 12/2018 12/2019 12/2019
Current Assets:Cash and cash equivalents (Note 4 and 5) ¥62,837 ¥96,064 $876,816Trade notes and accounts receivable (Note 4)
Affiliated companies 24 - -Other 59,087 59,121 539,622
Allowance for doubtful receivables (682) (796) (7,265)Marketable securities (Note 4 and 5) 1,899 1,998 18,236Inventories (Note 6) 55,139 51,613 471,093Other current assets 9,586 8,551 78,048
Total Current Assets 187,891 216,553 1,976,569Property, Plant and Equipment (Note 17):
Land 13,692 15,177 138,526Buildings and structures 55,894 61,039 557,128Machinery, equipment and vehicles 24,784 27,517 251,159Construction in progress 3,018 3,604 32,895Other property, plant and equipment 17,729 19,394 177,017
Total 115,118 126,732 1,156,736Accumulated depreciation (46,379) (50,803) (463,700)
Net Property, Plant and Equipment 68,739 75,929 693,035Investments and Other Non-Current Assets:
Investment securities (Note 4 and 5) 8,314 10,571 96,485Investments in nonconsolidated subsidiaries and affiliates (Note 4) 44 40 365Deferred tax assets (Note 14) 4,636 3,605 32,904Net defined benefit asset (Note 8) - 13 118Allowance for doubtful accounts (76) (51) (465)Other investments and other assets 2,917 2,933 26,770
Total Investments and Other Non-Current Assets: 15,836 17,114 156,206Intangibles:
Goodwill (Note 17) 901 1,254 11,445Software 2,907 2,734 24,954Other intangibles 1,092 1,546 14,110
Total Intangibles 4,901 5,535 50,520Total Assets ¥277,368 ¥315,133 $2,876,350
2 HORIBA, Ltd. (Consolidated)

Thousands of U.S. dollars Millions of yen (Note 1)
LIABILITIES AND NET ASSETS 12/2018 12/2019 12/2019 Current Liabilities:
Short-term loans (Note 4 and 7) ¥10,458 ¥8,099 $73,922 Current portion of long-term debt (Note 4 and 7) 1,735 16,069 146,668 Trade notes and accounts payable (Note 4)
Affiliated companies 101 - - Other 21,832 19,861 181,279
Accounts payable - other (Note 4) 15,920 16,164 147,535 Accrued income taxes (Note 4) 3,514 2,004 18,291 Advances received 17,475 19,169 174,963 Accrued bonuses to employees 1,265 1,188 10,843 Reserve for product warranty 2,012 2,369 21,622 Other current liabilities 3,681 3,545 32,356
Total Current Liabilities 77,997 88,472 807,520 Long-Term Liabilities:
Long-term debt (Note 4 and 7) 32,322 49,720 453,815 Deferred tax liabilities (Note 14) 184 613 5,595 Net defined benefit liability (Note 8) 1,946 2,017 18,410 Provision for loss on dissolution of the employees’pension fund (Note 8) 640 - - Other non-current liabilities 2,258 2,692 24,571
Total Long-Term Liabilities 37,352 55,044 502,409 Total Liabilities 115,349 143,517 1,309,939 Contingent Liabilities (Note 12)
Net Assets (Note 9):
Shareholders' Equity:
Common stock 12,011 12,011 109,629 Authorized - 100,000,000 shares
Issued and outstanding - 42,170,448 shares (excluding treasury stock) at 12/2018
Issued and outstanding - 42,176,228 shares (excluding treasury stock) at 12/2019
Capital surplus 18,717 18,599 169,760 Retained earnings 132,329 141,689 1,293,254 Treasury stock - 362,304 shares at 12/2018 and 356,524 shares at 12/2019 (1,428) (1,405) (12,824)
Total Shareholders' Equity 161,630 170,894 1,559,821 Accumulated Other Comprehensive Income:
Net unrealized gains or losses on available-for-sale securities 2,788 4,344 39,649 Deferred gains or losses on hedges (2) 0 0 Foreign currency translation adjustments (2,829) (4,042) (36,893) Remeasurements of defined benefit plans (Note 8) (224) (244) (2,227)
Total Accumulated Other Comprehensive Income (267) 58 529 Subscription Rights to Shares (Note 10) 549 651 5,941 Non-Controlling Interests 106 10 91 Total Net Assets 162,018 171,615 1,566,401 Total Liabilities and Net Assets ¥277,368 ¥315,133 $2,876,350
See the notes to the consolidated financial statements.
3 HORIBA, Ltd. (Consolidated)

Consolidated Statements of IncomeHORIBA, Ltd and Consolidated Subsidiaries Thousands of For the years ended December 31, 2018 and December 31, 2019 U.S. dollars Millions of yen (Note 1) 12/2018 12/2019 12/2019 Net Sales (Note 17) ¥210,570 ¥200,241 $1,827,683 Operating Costs and Expenses (Note 17):
Cost of sales 120,630 117,624 1,073,603 Selling, general and administrative expenses 61,100 61,701 563,170
Total Operating Costs and Expenses 181,731 179,325 1,636,774 Operating Income (Note 17) 28,838 20,916 190,909 Other Income (Expenses):
Interest and dividend income 323 422 3,851 Interest expense (440) (496) (4,527) Foreign exchange gains (losses), net (473) (439) (4,006) Gain on sales of property, plant and equipment 537 113 1,031 Loss on sales of property, plant and equipment (22) - - Loss on disposal of property, plant and equipment (76) (44) (401) Subsidy income 11 43 392 Foreign tax refund - 148 1,350 Bond issuance cost - (154) (1,405) Gain on sales of investment securities (Note 5) 0 9 82 Gain on transfer of business 115 - - Gain on bargain purchase 48 - - Reversal of provision for loss on dissolution of the employees' pension fund - 137 1,250 Other, net 56 78 711
Total Other Income (Expenses), Net 79 (182) (1,661) Income before Income Taxes 28,917 20,734 189,247 Income Taxes (Note 14):
Current 6,375 4,956 45,235 Deferred 203 268 2,446
Total Income Taxes 6,579 5,225 47,690 Net Income 22,338 15,508 141,548 Profit Attributable to Non-Controlling Interests 24 26 237 Net Income Attributable to Owners of Parent ¥22,313 ¥15,481 $141,301
U.S. dollars Yen (Note 1) 12/2018 12/2019 12/2019 Per Share Information:
Net income - basic ¥529.24 ¥367.09 $3.35 Net income - diluted 526.98 365.44 3.33 Cash dividends 145.00 130.00 1.18
4 HORIBA, Ltd. (Consolidated)

Consolidated Statements of Comprehensive IncomeHORIBA, Ltd and Consolidated SubsidiariesFor the years ended December 31, 2018 and December 31, 2019 Thousands of
U.S. dollarsMillions of yen (Note 1)
12/2018 12/2019 12/2019Net Income ¥22,338 ¥15,508 $141,548Other Comprehensive Income (Note 16)
Net unrealized gains or losses on available-for-sale securities (1,848) 1,555 14,193Deferred gains or losses on hedges (2) 3 27Foreign currency translation adjustments (3,989) (1,220) (11,135)Remeasurements of defined benefit plans (133) (20) (182)
Total Other Comprehensive Income (5,973) 318 2,902Comprehensive Income ¥16,364 ¥15,827 $144,459(Breakdown of comprehensive income)
Comprehensive income attributable to owners of parent ¥16,348 ¥15,807 $144,277Comprehensive income attributable to non-controlling interests 16 19 173
See the notes to the consolidated financial statements.
5 HORIBA, Ltd. (Consolidated)

Consolidated Statements of Changes in Net AssetsHORIBA, Ltd. and Consolidated Subsidiaries For the years ended December 31, 2018 and December 31, 2019
Millions of yen
Shareholders' Equity Accumulated Other Comprehensive Income
Common
Stock Capital Surplus
Retained Earnings
Treasury Stock
Net Unrealized
Gains or
Losses on Available- for-sale
Securities
Deferred Gains
or Losses
on Hedges
Foreign Currency
Translation Adjustments
Remeasure- ments
of Defined Benefit Plans
Subscription Rights
to Shares
Non- controlling Interests
Net Assets, Total
Balance at the Beginning of Fiscal 2018... ¥12,011 ¥18,717 ¥115,345 (¥1,488) ¥4,636 - ¥1,151 (¥90) ¥492 ¥90 ¥150,866
Cash Dividends.................................... (5,311) (5,311)
Net Income Attributable to Owners of Parent............................. 22,313 22,313
Purchase of Treasury Stock................. (0) (0)
Disposal of Treasury Stock.................. (17) 61 43
Net Changes in Items Other than Shareholders’ Equity.................... (1,848) (2) (3,980) (133) 56 16 (5,892)
Balance at the End of Fiscal 2018............. ¥12,011 ¥18,717 ¥132,329 (¥1,428) ¥2,788 (¥2) (¥2,829) (¥224) ¥549 ¥106 ¥162,018
Balance at the Beginning of Fiscal 2019 ¥12,011 ¥18,717 ¥132,329 (¥1,428) ¥2,788 (¥2) (¥2,829) (¥224) ¥549 ¥106 ¥162,018
Cash dividends..................................... (6,115) (6,115)
Net Income Attributable to Owners of Parents........................... 15,481 15,481
Purchase of Treasury Stock................. (0) (0)
Disposal of Treasury Stock.................. 0 (6) 23 16
Purchase of Shares of Consolidated Subsidiaries................ (118) (118)
Net Changes in Items Other than Shareholders’ Equity.................... 1,555 3 (1,212) (20) 102 (95) 332
Balance at the End of Fiscal 2019.......... ¥12,011 ¥18,599 ¥141,689 (¥1,405) ¥4,344 ¥0 (¥4,042) (¥244) ¥651 ¥10 ¥171,615
Thousands of U.S. dollars (Note 1)
Shareholders' Equity Accumulated Other Comprehensive Income
Common
Stock Capital Surplus
Retained Earnings
Treasury Stock
Net Unrealized
Gains or
Losses on Available- for-sale
Securities
Deferred Gains
or Losses
on Hedges
Foreign Currency
Translation Adjustments
Remeasure- ments
of Defined Benefit Plans
Subscription Rights
to Shares
Non- controlling Interests
Net Assets, Total
Balance at the Beginning of Fiscal 2019 $109,629 $170,837 $1,207,822 ($13,033) $25,447 ($18) ($25,821) ($2,044) $5,010 $967 $1,478,806
Cash Dividends.................................... (55,814) (55,814)
Net income Attributable to Owners of Parent............................. 141,301 141,301
Purchase of Treasury Stock................. (0) (0)
Disposal of Treasury Stock.................. 0 (54) 209 146
Purchase of Shares of Consolidated Subsidiaries................ (1,077) (1,077)
Net Changes in Items Other than Shareholders’ Equity.................... 14,193 27 (11,062) (182) 930 (867) 3,030
Balance at the End of Fiscal 2019.......... $109,629 $169,760 $1,293,254 ($12,824) $39,649 $0 ($36,893) ($2,227) $5,941 $91 $1,566,401
See the notes to the consolidated financial statements.
6 HORIBA, Ltd. (Consolidated)

Consolidated Statements of Cash FlowsHORIBA, Ltd and Consolidated Subsidiaries Thousands ofFor the years ended December 31, 2018 and December 31, 2019 U.S. dollars
Millions of yen (Note 1)12/2018 12/2019 12/2019
Cash Flows from Operating Activities:Income before income taxes ¥28,917 ¥20,734 $189,247Depreciation and amortization 7,240 8,794 80,266Increase (decrease) in allowance for doubtful receivables (69) 105 958Increase (decrease) in net defined benefit liability (83) 1 9Interest and dividend income (323) (422) (3,851)Interest expense 440 496 4,527Foreign exchange losses (gains) 167 89 812Loss (gain) on sales of property, plant and equipment (514) (113) (1,031)Loss on disposal of property, plant and equipment 76 44 401Loss (gain) on sales of investment securities (0) (9) (82)Decrease (increase) in trade notes and accounts receivable (862) (935) (8,534)Decrease (increase) in inventories (10,368) 2,852 26,031Increase (decrease) in trade notes and accounts payable (596) (1,760) (16,064)Other, net 4,976 3,196 29,171
Subtotal 29,001 33,075 301,889Interest and dividends received 305 434 3,961Interest paid (439) (465) (4,244)Income taxes (paid) refund (9,331) (6,405) (58,461)
Net Cash Provided by (Used in) Operating Activities 19,536 26,638 243,136
Cash Flows from Investing Activities:Increase in time deposits (1,403) (2,418) (22,070)Decrease in time deposits 1,202 3,018 27,546Decrease in time deposits restricted for use 32 - -Payments for purchase of marketable securities (2,200) (2,000) (18,254)Proceeds from sales or redemption of marketable securities 1,701 1,900 17,342Payments for purchase of property, plant and equipment (9,667) (11,762) (107,356)Proceeds from sales of property, plant and equipment 1,420 262 2,391Payments for purchase of intangibles (611) (1,172) (10,697)Payments for purchase of investment securities (24) (24) (219)Proceeds from sales or redemption of investment securities 0 13 118Other, net (1,481) (182) (1,661)
Net Cash Provided by (Used in) Investing Activities (11,029) (12,367) (112,878)
7 HORIBA, Ltd. (Consolidated)

Thousands ofU.S. dollars
Millions of yen (Note 1)12/2018 12/2019 12/2019
Cash Flows from Financing Activities:Net increase (decrease) in short-term borrowings 2,792 (2,205) (20,125)Proceeds from long-term borrowings - 313 2,856Repayments of long-term debt (541) (1,561) (14,247)Repayments on finance lease obligations (181) (831) (7,584)Net decrease (increase) of treasury stock (0) (0) (0)Cash dividends paid (5,309) (6,110) (55,768)Proceeds from issuance of bonds - 29,845 272,407Dividends paid to non-controlling interests - (7) (63)Payments from changes in ownership interests in subsidiaries that do not result in change in scope of consolidation - (226) (2,062)
Net Cash Provided by (Used in) Financing Activities (3,240) 19,215 175,383
Effect of Exchange Rate Changes on Cash and Cash Equivalents (762) (259) (2,364)Net Increase (Decrease) in Cash and Cash Equivalents 4,503 33,227 303,276Cash and Cash Equivalents at Beginning of Year 58,333 62,837 573,539Cash and Cash Equivalents at End of Year ¥62,837 ¥96,064 $876,816
See the notes to the consolidated financial statements.
8 HORIBA, Ltd. (Consolidated)
1. Basis of presenting consolidated financial statementsThe accompanying consolidated financial statements of HORIBA, Ltd. (“the Company”) have been prepared in accordance with the provisions set forth in the Japanese Financial Instruments and Exchange Law and its related accounting regulations and in conformity with accounting principles generally accepted in Japan (“Japanese GAAP”), which are different in certain respects as to application and disclosure requirements from International Financial Reporting Standards(“IFRS”). The accounts of the consolidated overseas subsidiaries have been prepared in accordance with either IFRS or U.S. generally accepted accounting principles (“USGAAP”), with adjustments for the four specified items as applicable. The accompanying consolidated financial statements have been restructured and translated into English, with some expanded descriptions, from the consolidated financial statements of the Company prepared in accordance with Japanese GAAP and filed with the appropriate Local Finance Bureau of the Ministry of Finance as required by the Japanese Financial Instruments and Exchange Law. Some supplementary information included in the statutory Japanese language consolidated financial statements, but not required for fair presentation, is not presented in the accompanying consolidated financial statements.Yen amounts are rounded down to the nearest million. Therefore, total or subtotal amounts do not necessarily correspond with the aggregate of the account balances.The translation of the Japanese yen amounts into U.S. dollar amounts is included solely for the convenience of readers outside Japan, using the prevailing exchange rate at December 31, 2019, which was ¥109.56 to U.S. $1.00. The translations should not be construed as representations that the Japanese yen amounts have been, could have been or could in the future be converted into U.S. dollars at this or any other rate of exchange. The U.S. dollars amounts are then rounded down to the nearest thousand.Certain prior year amounts have been reclassified to conform to the current year's presentation.
2. Summary of significant accounting policies(a) Principles of consolidationThe consolidated financial statements include the accounts of the Company and 48 (48 in fiscal 2018)of its subsidiaries (“HORIBA” as a consolidated group). From fiscal 2019, stock purchased HORIBATocadero GmbH(Germany) and newly established HORIBA (China) Co., Ltd. (China) have beenincluded in the scope of consolidation. Besides, MIRA North America Inc. (America) and MIRA doBrasil Servicos de Engenharia Ltda. (Brazil) were liquidated.The accompanying consolidated financial statements include the accounts of the Company andsignificant companies over which the Company has control through majority voting rights or certainother conditions evidencing control by the Company. Significant intercompany transactions andaccounts have been eliminated in consolidation. In the elimination of investments in subsidiaries, theassets and liabilities of the subsidiaries, including the portions attributable to non-controllingshareholders, are evaluated using the fair value at the time the Company acquired control of therespective subsidiary. Acquisition costs that are in excess of the net assets of acquired subsidiariesand affiliates and cannot be assigned to specific individual accounts are amortized on a straight-linebasis over five years.December 31 is the year-end of the consolidated subsidiaries and that of the consolidated financialstatements for fiscal 2018 and fiscal 2019.One subsidiary is not included in the consolidated accounts as the effect of its inclusion on totalassets, sales, income and retained earnings would have been immaterial.The Company had no affiliated company in fiscal 2019 (one in fiscal 2018) due to sales of all ofshares.
9 HORIBA, Ltd. (Consolidated)

(b) Cash and cash equivalentsCash and cash equivalents include cash on hand, readily available bank deposits and short-termhighly liquid investments that are readily convertible into cash, have insignificant risk of change invalue and have original maturities of three months or less from date of purchase.
(c) SecuritiesAvailable-for-sale securities with available fair market values are stated at fair market value.Unrealized gains and losses on these securities are reported, net of applicable income taxes, as aseparate component of net assets. Realized gains and losses on the sale of such securities arecomputed using moving average cost. Available-for-sale securities with no available fair market valueare stated mainly at moving average cost.
(d) InventoriesInventories are stated at the lower of average cost or net realizable value. Cost is determinedprincipally by the weighted average method for merchandise, finished goods and work-in-process andby the moving average method for raw materials and supplies.
(e) Property, plant and equipment and depreciation (except for leases)Property, plant and equipment are stated at cost. Depreciation is computed by the straight-line methodover the estimated useful life of the asset. The estimated useful lives of buildings and structures rangefrom 3 to 60 years and those of machinery, equipment and vehicles from 2 to 20 years.
(f) GoodwillGoodwill, which represents the excess of the purchase price over the fair value of the net assetsacquired, is amortized on a straight-line basis over a period of five years.
(g) IntangiblesAmortization of intangibles is computed by the straight-line method.Computer software used by HORIBA is amortized over the estimated useful life of 3 to 10 years.
(h) LeasesWith regard to leased assets under finance leases other than those that are deemed to transferownership of the leased property to the lessee, the lease term is deemed to be the useful life, anddepreciation is computed by the straight-line method over the lease term with zero residual value.The Company applied IFRS 16, “Leases” and FASB Accounting Standards Update (ASU) 2016-02,“Leases” for foreign subsidiaries from the fiscal year ended December 31, 2019. The standards requirea lessee to recognize assets and liabilities generally for all leases on the consolidated balance sheets.The impact of this change on the consolidated balance sheets as of December 31, 2019 and theconsolidated statements of income and consolidated statements of comprehensive income for the yearended December 31, 2019 was immaterial.
(i) Allowance for doubtful receivablesThe Company and its domestic subsidiaries provide for doubtful accounts principally at an amountcomputed based on the actual ratio of bad debts in the past plus the estimated uncollectible amountsof certain individual receivables. The overseas subsidiaries provide for doubtful accounts based onestimates made by management.
10 HORIBA, Ltd. (Consolidated)

(j) Accrued bonuses to employeesAccrued bonuses to employees are provided for the expected payment of employee bonuses to those employees employed at the end of the fiscal year.
(k) Reserve for product warrantyThe reserve for product warranty is provided for accrued warranty expenses for products of the Company and certain subsidiaries. The provision is based on estimates made from actual past experience and product warranty records and takes into account individual cases.
(l) Accounting methods associated with retirement benefitsⅰ) Period-based method for estimated amount of retirement benefits
In calculating projected benefit obligations, the method used to attribute the estimated amount of retirement benefits to the period up to the end of the current fiscal year is the benefit formula method.
ⅱ) Recording of expenses for actuarial differences and prior service costs Actuarial differences are recognized in expenses from the subsequent fiscal year using the straight-line method over a fixed term of years (5 to 8 years), which is within the average of the estimated remaining service years of employees.
Prior service costs are recognized in expenses using the straight-line method over a fixed term of years (10 years), which is within the average of the estimated remaining service years of employees, commencing in the period they arise.
(m) Sales and costs of completed constructionSales and costs of completed construction are recorded using the percentage of completion method when the progress of the construction up to the end of the year is deemed to be certain (estimates of the ratio of completion of construction work are based on the cost-to-cost method). In the case of other construction, sales and costs are recorded using the completed contract method.
(n) Foreign currency translationShort-term and long-term receivables and payables in foreign currencies are translated into Japanese yen based on exchange rates at the balance sheet date. Balance sheet accounts of consolidated foreign subsidiaries are translated into Japanese yen at the balance sheet date, except for shareholders’ equity accounts, which are translated at historical rates. Revenue and expense accounts of consolidated foreign subsidiaries are translated into Japanese yen at average annual exchange rates. Differences arising from the application of this process are presented separately in the consolidated financial statements in “Foreign currency translation adjustments” and “Non-controlling interests” in net assets.
(o) DerivativesDerivative financial instruments are stated at fair value, and changes in the fair value are recognized as gains or losses, unless the derivative financial instruments are used for hedging purposes. HORIBA uses foreign currency exchange contracts to manage risk related to its importing and exporting activities. Regarding derivative transactions, in addition to conducting exchange agreement transactions within the limit of the balance of foreign currency-denominated receivables and payables, HORIBA conducts forward exchange agreement transactions for the expected foreign currency-denominated receivables and payables which would be generated with certainty by scheduled export
11 HORIBA, Ltd. (Consolidated)

or import trading. HORIBA uses derivative financial instruments, such as interest rate swap contracts and interest rate and currency swap contracts, to avoid risks of fluctuations in interest rates and foreign exchange rates. Contracts are entered into and controlled by the finance department, which reports results to the director. Transactions involving derivative contracts are limited to highly rated banking institutions, and HORIBA considers that there are no material credit risks associated with them.
(p) Hedge accountingⅰ) Hedge accounting method
Deferred hedge accounting is applied. However, exceptional accounting treatment is applied to certain interest rate and currency swap contracts which conform to the requirements of integral accounting rules.
ⅱ) Hedging instruments and hedged items Hedging instruments: Forward foreign exchange contracts, etc., and interest rate and currency swap contracts Hedged items: Foreign currency-denominated forecast transactions and foreign currency-denominated loans payable
ⅲ) Hedging policy Forward foreign exchange transactions are used to avoid foreign currency risks and interest rate and currency swaps are used to avoid the risk of rising interest rates and foreign currency risks based on the Company’s Administrative Rules.
ⅳ) Assessment of hedge effectiveness The effectiveness of hedges is assessed by comparing the cumulative changes in the fair values of both hedging instruments and corresponding hedged items. However, an assessment of effectiveness is not conducted when the significant conditions of both hedging instruments and corresponding hedged items are the same.
(q) Research and development expensesResearch and development expenses are charged to income when incurred. Research and development expenses charged to income for fiscal 2018 and fiscal 2019 were ¥15,183 million and ¥16,254 million ($148,357 thousand), respectively.
(r) Income taxesIncome taxes comprise corporate tax, enterprise tax and prefectural and municipal inhabitant taxes. HORIBA recognizes the tax effects of loss carryforwards and the temporary differences between the carrying amounts of assets and liabilities for tax and financial reporting. The provision for current income tax is computed based on the pretax income included in the consolidated statements of income. The asset-liability approach is used to recognize deferred tax assets and liabilities for the expected future tax consequences of temporary differences between the carrying amounts of assets and liabilities for financial reporting purposes and the amounts used for income tax purposes. As the Company appl ied “Part ia l Amendments to Account ing Standard for Tax Ef fect Accounting” (ASBJ Statement No. 28; February 16, 2018), etc., from the current fiscal year ended December 31, 2019, deferred tax assets are presented under investments and other assets and deferred tax liabilities are presented under non-current liabilities. As a result, deferred tax assets of current assets of ¥4,312 million were included in deferred tax assets of investments and other non-current assets of ¥4,636 million in the consolidated balance sheets for the previous consolidated fiscal year.
12 HORIBA, Ltd. (Consolidated)

Deferred tax liabilities of ¥1 million in current liabilities was included in the ¥184 million in deferred tax liabilities of long-term liabilities in the consolidated balance sheets for the previous consolidated fiscal year. The Company and its some consolidated subsidiaries have adopted a consolidated taxation system.
(s) Per share informationThe computations of net income per share are based on the weighted average number of shares of common stock outstanding during each period. The weighted average number of shares of common stock used in the computation for fiscal 2018 and fiscal 2019 was 42,162 thousand and 42,174 thousand, respectively. Diluted net income per share of common stock assumes full conversion of dilutive convertible bonds at the beginning of the year or at the later date of issuance, with an applicable adjustment for related interest expense net of tax and dilutive stock option plans. The weighted average number of shares used in the computation for fiscal 2018 and fiscal 2019 was 42,342 thousand and 42,364 thousand, respectively. Cash dividends per share shown in the consolidated statements of income represent actual amounts applicable to earnings in the respective fiscal year, including dividends to be paid after the end of the period.
3. Accounting standards issued but not yet effective- "Accounting Standard for Revenue Recognition" (Accounting Standards Board of Japan ("ASBJ") Statement No. 29, March 30, 2018 (hereinafter, "Statement No. 29")) - "Implementation Guidance on Accounting Standard for Revenue Recognition" (ASBJ Guidance No. 30, March 30, 2018 (hereinafter, "Guidance No. 30"))
(ⅰ) Overview
The International Accounting Standards Board (IASB) and the U.S. Financial Accounting Standards Board (FASB) collaborated on a project to develop a single, comprehensive revenue recognition model and jointly issued in May 2014 new revenue recognition standards, "Revenue from Contracts with Customers" (IFRS 15 published by IASB, Topic 606 published by FASB). IFRS15 is effective for annual reporting periods beginning on or after January 1, 2018, and Topic 606 is effective for annual reporting periods beginning after December 15, 2017. Considering the above circumstances, the Accounting Standard Board of Japan (ASBJ) also developed new revenue recognition standards and issued Statement No. 29 together with Guidance No. 30. ASBJ’s basic policy in developing the new revenue recognition standards was to first incorporate the core principles of IFRS 15 in the light of improving the international comparability of financial statements and then add additional alternative treatments to the extent that international comparability would not be significantly impaired when business practices in Japan needed to be considered.
(ⅱ) Scheduled date of applying the new guidance Effective from the beginning of the fiscal year ending December 31, 2022.
(ⅲ) The effects of application of the new guidance, etc. The effects of the application on the consolidated financial statements are currently under consideration.
13 HORIBA, Ltd. (Consolidated)

4. Financial instruments(1) Overview of financial instrumentsManagement policy HORIBA carries out fund management with an emphasis on security and procures funds mainly through bank borrowings and bond issuances. Derivatives are used to manage foreign exchange fluctuation risk and interest rate fluctuation risk, and it is HORIBA's policy not to engage in speculative transactions.
Financial instruments, risks and risk management Trade notes and accounts receivable, which are operating receivables, are exposed to the credit risk of customers. HORIBA endeavors to reduce this risk by conducting due date control and balance control and by attempting to promptly recognize collection concerns stemming from factors such as a deterioration in the financial condition of a customer. Most trade notes and accounts payable, which are operating payables, have payment due dates within one year. Some operating receivables and payables are denominated in foreign currencies and are exposed to foreign exchange fluctuation risk. However, HORIBA endeavors to reduce this risk by offsetting foreign currency denominated operating receivables and payables and by using forward exchange contracts, etc. Marketable securities are mainly short-term investments with high liquidity such as negotiable deposits. Investment securities are mainly shares of companies that have a business relationships with HORIBA and are exposed to market value fluctuation risk. However, when acquiring or selling shares of a certain value, the Board of Directors considers the details of the transactions, and HORIBA endeavors to reduce any risk by ensuring that the market value information regarding the shares is reported to the management team in a timely manner. Short-term loans are mainly for financing related to operating transactions, while long-term loans and corporate bonds are mainly for financing related to plant and equipment and working capital. Trade liabilities and loans are exposed to liquidity risk, but HORIBA endeavors to reduce this risk by using methods such as the preparation of cash flow plans. Regarding derivative transactions, in addition to conducting exchange agreement transactions within the limit of the balance of foreign currency-denominated receivables and payables, HORIBA conducts forward exchange agreement transactions for the expected foreign currency-denominated receivables and payables which would be generated with certainty by scheduled export or import trading. HORIBA uses derivative financial instruments, such as interest rate swap contracts and interest rate and currency swap contracts, to avoid risks of fluctuations in interest rates and foreign exchange rates within the outstanding amount of borrowings. HORIBA's policy is not to engage in speculative transactions.
Supplementary explanation of the estimated fair value of financial instruments The market value of financial instruments includes values based on market prices and amounts rationally calculated when there are no market prices available. As HORIBA incorporates variable factors when making these calculations, the amounts may change due to the adoption of different assumptions. With regard to contract amounts related to derivative transactions in the Notes to Consolidated Financial Statements item "Derivative transactions," the amounts do not indicate the market risk associated with derivative transactions themselves.
14 HORIBA, Ltd. (Consolidated)

(2) Fair value of financial instrumentsThe book value and fair value of financial instruments and any difference between the two as of December 31, 2018 and December 31, 2019 are set forth in the table below. Financial instruments whose fair value was extremely difficult to estimate are not included (See Note 2). Cash and cash equivalents of ¥500 million and ¥1,080 million ($9,857 thousand) for the fiscal years ended December 31, 2018 and December 31, 2019, respectively, are included in (3) Marketable securities and investment securities.
Millions of yen Millions of yen 12/2018 12/2019 Book Value Fair Value Difference Book value Fair Value Difference
Assets:
(1) Cash and Time Deposits......................................... ¥63,632 ¥63,632 - ¥95,646 ¥95,646 -
(2) Trade Notes and Accounts Receivable................... 59,111 59,111 - 59,121 59,121 -
(3) Marketable Securities and Investment Securities
Available-for-sale Securities.............................. 10,525 10,525 - 13,464 13,464 -
Total........................................................................ ¥133,269 ¥133,269 - ¥168,232 ¥168,232 -
Liabilities:
(1) Trade Notes and Accounts Payable....................... ¥21,933 ¥21,933 - ¥19,861 ¥19,861 -
(2) Short-term Loans.................................................... 10,458 10,458 - 8,099 8,099 - (3) Accounts Payable - Other....................................... 15,920 15,920 - 16,164 16,164 -
(4) Accrued Income Taxes............................................ 3,514 3,514 - 2,004 2,004 -
(5) Bonds, Including Current Portion............................ 15,000 15,122 ¥122 45,000 44,848 (¥151)
(6) Long-term Loans, Including Current Portion........... 18,614 18,736 121 17,275 17,416 141
Total........................................................................ ¥85,442 ¥85,687 ¥244 ¥108,405 ¥108,395 (¥9)
Derivative Transactions................................................
(1) Hedge Accounting Not Applied............................... ¥28 ¥28 - (¥76) (¥76) -
(2) Hedge Accounting Applied...................................... (3) (3) - 1 1 -
Totall........................................................................ ¥24 ¥24 - (¥75) (¥75) -
Thousands of U.S. dollars 12/2019
Book Value Fair Value Difference Assets:
(1) Cash and Time Deposits....................................................................... $873,001 $873,001 - (2) Trade Notes and Accounts Receivable.................................................. 539,622 539,622 - (3) Marketable Securities and Investment Securities..................................
Available-for-sale Securities............................................................. 122,891 122,891 - Total....................................................................................................... $1,535,523 $1,535,523 -
Liabilities:
(1) Trade Notes and Accounts Payable...................................................... $181,279 $181,279 - (2) Short-term Loans................................................................................... 73,922 73,922 - (3) Accounts Payable - Other...................................................................... 147,535 147,535 - (4) Accrued Income Taxes........................................................................... 18,291 18,291 - (5) Bonds, Including Current Portion........................................................... 410,733 409,346 ($1,378) (6) Long-term Loans, Including Current Portion.......................................... 157,676 158,963 1,286
Total....................................................................................................... $989,457 $989,366 ($82)
Derivative Transactions...............................................................................
(1) Hedge Accounting Not Applied............................................................... ($693) ($693) - (2) Hedge Accounting Applied..................................................................... 9 9 -
Total....................................................................................................... ($684) ($684) -
15 HORIBA, Ltd. (Consolidated)

Note 1. Method for calculating the fair value of financial instruments and notes regarding securities and derivative transactions. Assets (1) Cash and time deposits and (2) Trade notes and accounts receivable
As these are settled in the short term, market value approximates book value and is, therefore, based on the applicable book value.
(3) Marketable securities and investment securities Market value for these is based on prices on securities exchanges in the case of shares, etc. For bonds, market value is based on prices on securit ies exchanges or prices indicated by corresponding financial institutions. For marketable securities classified by the purpose for which they are held, see Note 5.
Liabilities (1) Trade notes and accounts payable, (2) Short-term loans, (3) Accounts payable - other and (4) Accrued income taxes
As these are settled in the short term, market value approximates book value and is, therefore, based on the applicable book value.
(5) Bonds, including current portion Market value for bonds issued by HORIBA is calculated based on market prices.
(6) Long-term loans, including current portion Borrowings based on variable interest rates reflect market interest rates, and as the creditworthiness of HORIBA has not changed significantly since execution, market value is considered to be approximate book value and is, therefore, based on applicable book value. The value of borrowings with fixed interest rates is based on the total amount of principal and interest discounted at an interest rate of a similar new loan.
Derivative transactions See Note 13 for derivative transactions. Net receivables (payables) derived from derivative transactions are displayed in the table above. Total net payables are shown in parenthesis.
Note 2. The following table summarizes financial instruments whose fair value was extremely difficult to estimate.
Millions of yen
Thousands of U.S. dollars
12/2018 12/2019 12/2019 Non-listed Equity Securities...................................................................... ¥188 ¥185 $1,688 Investments in Nonconsolidated Subsidiaries and Affiliates..................... 44 40 365
The above financial instruments were not included in "(3) Marketable securities and investment securities" because they did not have market values and the fair value was extremely difficult to estimate.
16 HORIBA, Ltd. (Consolidated)

Note 3. Repayment schedule of monetary claims, available-for-sale securities with maturities and bonds held to maturity.
Millions of yen 12/2018
Within One Year Over One Year
but within Five Years
Over Five Years
but within Ten years Over Ten Years
Cash and Time Deposits............................................... ¥63,632 - - - Trade Notes and Accounts Receivable......................... 59,111 - - - Marketable Securities and Investment Securities..........
Available-for-sale Securities with Maturities..............
(1) Governmental/Municipal Bonds........................... - - - - (2) Corporate Bonds.................................................. - - - - (3) Other Bonds......................................................... 1,600 - - - (4) Other.................................................................... 800 ¥19 - -
Total............................................................................... ¥125,144 ¥19 - -
Millions of yen 12/2019
Within One Year Over One Year
but within Five years
Over Five Years
but within Ten Years Over Ten Years
Cash and Time Deposits............................................... ¥95,646 - - - Trade Notes and Accounts Receivable......................... 59,121 - - - Marketable Securities and Investment Securities..........
Available-for-sale Securities with Maturities..............
(1) Governmental/Municipal Bonds........................... - - - - (2) Corporate Bonds.................................................. 100 - - - (3) Other Bonds......................................................... 1,900 - - - (4) Other.................................................................... 1,080 ¥17 - -
Total............................................................................... ¥157,848 ¥17 - -
Thousands of U.S. dollars 12/2019
Within One Year Over One Year
but within Five Years
Over Five Years
but within Ten Years Over Ten Years
Cash and Time Deposits............................................... $873,001 - - - Trade Notes and Accounts Receivable......................... 539,622 - - - Marketable Securities and Investment Securities..........
Available-for-sale Securities with Maturities..............
(1) Governmental/Municipal Bonds........................... - - - - (2) Corporate Bonds.................................................. 912 - - - (3) Other Bonds......................................................... 17,342 - - - (4) Other.................................................................... 9,857 $155 - -
Total............................................................................... $1,440,744 $155 - -
Note 4. Repayment schedule of short-term loans, bonds and long-term debt See Note 7 for short-term loans and long-term debt.
17 HORIBA, Ltd. (Consolidated)

5. SecuritiesThe following table summarizes acquisition costs and book values (fair values) of available-for-sale securities as of December 31, 2018 and December 31, 2019.
Millions of yen Millions of yen 12/2018 12/2019
Book value Acquisition
cost Difference Book value
Acquisition cost
Difference
Securities with Book Values Exceeding Acquisition Costs:
Equity Securities.................................... ¥8,076 ¥4,126 ¥3,949 ¥10,373 ¥4,188 ¥6,185 Governmental/Municipal Bonds............. - - - - - - Corporate Bonds.................................... - - - - - - Other Bonds........................................... - - - - - - Other...................................................... 500 500 0 1,000 1,000 0 Subtotal.................................................. 8,576 4,626 3,949 11,373 5,188 6,185
Securities with Book Values Not Exceeding Acquisition Costs:
Equity Securities.................................... 43 52 (9) 10 15 (5) Governmental/Municipal Bonds............. - - - - - - Corporate Bonds.................................... - - - 99 100 (0) Other Bonds........................................... 1,599 1,600 (0) 1,898 1,900 (1) Other...................................................... 306 307 (0) 81 82 (0) Subtotal.................................................. 1,949 1,959 (10) 2,090 2,098 (7)
Total............................................................ ¥10,525 ¥6,586 ¥3,938 ¥13,464 ¥7,286 ¥6,177
Thousands of U.S. dollars 12/2019
Book value Acquisition
cost Difference
Securities with Book Values Exceeding Acquisition Costs:
Equity Securities................................................................................................... $94,678 $38,225 $56,453 Governmental/Municipal Bonds............................................................................ - - - Corporate Bonds................................................................................................... - - - Other Bonds.......................................................................................................... - - - Other..................................................................................................................... 9,127 9,127 0 Subtotal................................................................................................................. 103,806 47,353 56,453
Securities with Book Values Not Exceeding Acquisition Costs:
Equity securities.................................................................................................... 91 136 (45) Governmental/Municipal Bonds............................................................................ - - - Corporate Bonds................................................................................................... 903 912 (0) Other Bonds.......................................................................................................... 17,323 17,342 (9) Other..................................................................................................................... 739 748 (0) Subtotal................................................................................................................. 19,076 19,149 (63)
Total........................................................................................................................... $122,891 $66,502 $56,380
18 HORIBA, Ltd. (Consolidated)

Note. Non-listed equity securities, etc., of ¥188 million and ¥185 million ($1,688 thousand) for the fiscal years ended December 31, 2018 and December 31, 2019, respectively, are not included in the above table because they did not have market values and the fair value was extremely difficult to estimate.
The following table summarizes available-for-sale securities sold for the fiscal year ended December 31, 2018 and December 31, 2019.
Millions of yen
Thousands of U.S.dollars
12/2018 12/2019 12/2019 Total Sales of Available-for-Sale Securities ¥1 ¥14 $127 Related Gains 0 9 82
Impairment loss on securities HORIBA recognized no impairment loss in fiscal 2018 and 2019 on non-listed equity securities categorized as available-for-sale securities. When applying impairment accounting, if the market value at the end of the term has fallen by more than 50% from the acquisition price, an impairment loss is applied to the entire amount. If the market value has fallen by approximately 30% to 50%, an impairment loss is applied to the amount recognized as necessary after considering the possibility of recovery, etc.
19 HORIBA, Ltd. (Consolidated)

6. InventoriesInventories at December 31, 2018 and December 31, 2019 consisted of the following:
Millions of yen
Thousands of U.S. dollars
12/2018 12/2019 12/2019 Merchandise and Finished Goods................................................................. ¥20,018 ¥19,995 $182,502 Work-in-process............................................................................................ 19,843 17,690 161,464 Raw Materials and Supplies.......................................................................... 15,276 13,927 127,117
Total......................................................................................................... ¥55,139 ¥51,613 $471,093
20 HORIBA, Ltd. (Consolidated)

7. Short-term loans and long-term debtShort-term loans are generally represented by bank notes with annual interest rates ranging from 0.20% to 8.75% and 0.20% to 7.35% at December 31, 2018 and December 31, 2019, respectively.
Long-term debt at December 31, 2018 and December 31, 2019 consisted of the following:
Millions of yen
Thousands of U.S. dollars
12/2018 12/2019 12/2019 0.609% Unsecured Bonds due in 2020................................................. ¥15,000 ¥15,000 $136,911 0.180% Unsecured Bonds due in 2026................................................. - 15,000 136,911 0.270% Unsecured Bonds due in 2029................................................. - 15,000 136,911 Loans from Banks due Serially from 2020 to 2026 at Rates from 0.09% to 9.40% Per Annum............................................ 18,614 17,275
157,676
Lease Obligations Maturing Serially through 2029 at Rates from 1.00% to 16.08% Per Annum..........................................
443 3,514 32,073
Total.................................................................................................. 34,058 65,790 600,492
Current Portion....................................................................................... (1,735) (16,069) (146,668) Long-term Debt, Less Current Portion................................................... ¥32,322 ¥49,720 $453,815
The aggregate annual maturities of long-term debt outstanding at December 31, 2019 were as follows:
Year ending December 31 Millions of yen
Thousands of U.S. dollars
2020............................................................................................................................ ¥16,069 $146,668 2021............................................................................................................................ 1,200 10,952 2022............................................................................................................................ 16,183 147,709 2023............................................................................................................................ 689 6,288 2024............................................................................................................................ 472 4,308 Thereafter................................................................................................................... 31,174 284,538
Total....................................................................................................................... ¥65,790 $600,492
21 HORIBA, Ltd. (Consolidated)

8. Employees' severance and pension benefits(1) Outline of adopted retirement pension fundThe Company and the domestic consolidated subsidiaries have adopted a funded defined benefit pension plan (cash balance plan) and a defined contribution pension plan. Certain overseas consolidated subsidiaries have adopted funded and unfunded defined benefit plans and a defined contribution plan. The Kyoto Machinery and Metal Employees' Pension Fund (a “general type") in which the Company and a domestic consolidated subsidiary are participants received approval for dissolution from the Minister of Health, Labour and Welfare as of September 20, 2017 and have carried out procedures for the completion of liquidation. In the current fiscal year ended December 31, 2019, the Fund was dissolved upon receipt of the notice of the settlement payment plan. In the previous fiscal year ended December 31, 2018, the Company posted a provision for loss on dissolution of the employees’ pension fund, of ¥640 million, that was estimated to arise from the dissolution. Following the determination of the payment amount on occasion of dissolution, ¥129 million ($1,177 thousand) out of the unpaid payment amount of ¥447 million ($4,079 thousand) was transferred to accounts payable - other, and ¥318 million ($2,902 thousand) to other noncurrent liabilities. The balance of ¥137 million ($1,250 thousand) between the determined amount and the amount of provision was posted as reversal of provision for loss on dissolution of the employees' pension fund.
(2) Defined benefits plan(a) The changes in projected benefit obligation for the years ended December 31, 2018 and December 31, 2019 were as follows:
Millions of yen
Thousands of U.S. dollars
12/2018 12/2019 12/2019 Balance at the Beginning of Year.......................................................... ¥10,314 ¥10,285 $93,875
Service Cost.................................................................................... 684 681 6,215 Interest Expense on Projected Benefit Obligation........................... 120 84 766 Actuarial Differences........................................................................ (397) 463 4,225 Benefits Paid.................................................................................... (228) (428) (3,906) Other................................................................................................ (208) (844) (7,703)
Balance at the End of Year................................................................... ¥10,285 ¥10,241 $93,473
(b) The changes in pension assets for the years ended December 31, 2018 and December 31, 2019 were as follows:
Millions of yen
Thousands of U.S. dollars
12/2018 12/2019 12/2019 Balance at the Beginning of Year......................................................... ¥8,169 ¥8,339 $76,113
Expected Return on Pension Assets............................................... 216 191 1,743 Actuarial Differences....................................................................... (585) 247 2,254 Contributions from the Employer..................................................... 788 645 5,887 Benefits Paid................................................................................... (182) (357) (3,258) Other............................................................................................... (67) (828) (7,557)
Balance at the End of Year................................................................... ¥8,339 ¥8,237 $75,182
22 HORIBA, Ltd. (Consolidated)

(c) Reconciliation between the net defined benefit liability and the net defined benefit asset posted in the consolidated balance sheets,and the balances of projected benefit obligation and pension assets for the years ended December 31, 2018 and December 31, 2019 were as follows:
Millions of yen
Thousands of
U.S. dollars
12/2018 12/2019 12/2019
Funded Projected Benefit Obligation.............................................................. ¥8,843 ¥8,637 $78,833
Pension Assets......................................................................................... (8,339) (8,237) (75,182)
503 400 3,650
Unfunded Projected Benefit Obligation........................................................... 1,442 1,604 14,640
Net Liability for Retirement Benefits in the Consolidated Balance Sheets................. 1,946 2,004 18,291
Net Defined Benefit Liability........................................................................................ 1,946 2,017 18,410
Net Defined Benefit Asset........................................................................................... - (13) (118)
Net Liability for Retirement Benefits in the Consolidated Balance Sheets.................. ¥1,946 ¥2,004 $18,291
(d) The components of retirement benefits expense for the years ended December 31, 2018 and December 31, 2019 were as follows:
Millions of yen
Thousands of U.S. dollars
12/2018 12/2019 12/2019 Service Cost.......................................................................................... ¥684 ¥681 $6,215 Interest Expense on Projected Benefit Obligation................................. 120 84 766 Expected Return on Pension Assets..................................................... (216) (191) (1,743) Amortization of Actuarial Differences.................................................... (13) 237 2,163 Retirement Benefits Expense................................................................ ¥574 ¥812 $7,411
(e) The components of remeasurements of defined benefit plans (before tax effect) in the consolidated statements of comprehensive income for the years ended December 31, 2018 and December 31, 2019 were as follows:
Millions of yen
Thousands of U.S. dollars
12/2018 12/2019 12/2019 Actuarial Differences............................................................................. (¥197) ¥22 $200 Total...................................................................................................... (¥197) ¥22 $200
(f) The components of remeasurements of defined benefit plans (before tax effect) in the consolidated balance sheets as of December 31,2018 and December 31, 2019 were as follows:
Millions of yen Thousands of
U.S. dollars 12/2018 12/2019 12/2019
Unrecognized Actuarial Differences....................................................... (¥357) (¥334) ($3,048) Total....................................................................................................... (¥357) (¥334) ($3,048)
23 HORIBA, Ltd. (Consolidated)

(g) Pension assets ⅰ) The pension assets by major category as a percentage of total pension assets as of December 31, 2018 and December 31, 2019 were as follows:
12/2018 12/2019 Debt Investments..................................................................................................................... 50.6% 45.3%
Equity Investments.................................................................................................................. 19.5 23.0 Mutual Funds (Note)................................................................................................................ 15.1 15.5 Other........................................................................................................................................ 14.8 16.2 Total.......................................................................................................................................... 100.0% 100.0%
Note. Mutual funds primarily invest in debt investments. ⅱ) Method of determining the expected rate of return on pension assets The expected rate of return on pension assets is determined considering the current and anticipated future portfolio of pension assets and, the long-term rates of return which are expected currently and in the future from the various components of the pension assets.
(h) Assumptions used for the years ended December 31, 2018 and December 31, 2019 were as follows:
12/2018 12/2019 Discount Rate (mainly)............................................................................................................ 0.6-0.7% 0.5%
Expected Rate of Return on Pension Assets (mainly)............................................................. 2.5% 2.5%
Expected Rate of Salary Raises (mainly)................................................................................ 3.6-4.1% 3.5-3.9%
Note. A point system is used as the basis for the calculation of expected rates of salary raises.
(3) Defined contribution planBenefits expense for the defined contribution plan for the years ended December 31, 2018 and December 31, 2019 was ¥1,252 million and ¥1,318 million ($12,029 thousand), respectively.
24 HORIBA, Ltd. (Consolidated)

9. Net assetsUnder Japanese laws and regulations, the entire amount paid for new shares is required to be designated as common stock. However, a company may, by a resolution of the Board of Directors, designate an amount not exceeding one half of the price of the new shares as additional paid-in capital, which is included in capital surplus. Under the Japanese Corporate Law ("the Law"), in cases in which dividend distribution of surplus is made, the smaller of an amount equal to 10% of the dividend or the excess, if any, of 25% of common stock over the total of additional paid-in capital and legal earnings reserve must be set aside as additional paid-in capital or legal earnings reserve. Legal earnings reserve is included in retained earnings in the accompanying consolidated balance sheets. Additional paid-in capital and legal earnings reserve may not be distributed as dividends. Under the Law, all additional paid-in capital and all legal earnings reserve may be transferred to other capital surplus and retained earnings, respectively, which are potentially available for dividends. Both of these appropriations generally require a resolution of the shareholder's meeting. The maximum amount that the Company can distribute as dividends is calculated based on the nonconsolidated financial statements of the Company in accordance with Japanese laws and regulations. At the Board of Directors' meeting held on February 14, 2020, the Board of Directors approved cash dividends in the amount of ¥3,374 million ($30,795 thousand). The appropriation had not been accrued in the consolidated financial statements as of December 31, 2019. Such appropriations are recognized in the period in which they are approved by the Board of Directors.
25 HORIBA, Ltd. (Consolidated)

10. Stock options(1) Expenses and items related to stock options
Millions of yen
Thousands of U.S. dollars
12/2018 12/2019 12/2019
Selling, General and Administrative Expenses...................................... ¥99 ¥118 $1,077
26 HORIBA, Ltd. (Consolidated)

(2) Scale and movement (fluctuation) of stock optionsInformation regarding stock options outstanding. The number of stock options is stated after conversion into an equal number of shares. (a) Details of stock options
Persons Granted Options
Number of Shares by Type of Stock
(Note 1) Date of Grant
Vesting
Conditions Service Period Exercise Period
No 1 Stock-based
Compensation Type
Stock Option
4 directors
and 13 corporate officers
of the Company
Common stock
54,200 shares April 16, 2009 (Note 2) (Note 3)
April 17, 2009
to
April 16, 2039
No 2 Stock-based
Compensation Type
Stock Option
4 directors
and 14 corporate officers
of the Company
Common stock
26,400 shares April 23, 2010 (Note 2) (Note 3)
April 24, 2010
to
April 23, 2040
No 3 Stock-based
Compensation Type
Stock Option
4 directors
and 16 corporate officers
of the Company
Common stock
31,000 shares April 21, 2011 (Note 2) (Note 3)
April 22, 2011
to
April 21, 2041
No 4 Stock-based
Compensation Type
Stock Option
4 directors
and 16 corporate officers
of the Company
Common stock
28,200 shares April 24, 2012 (Note 2) (Note 3)
April 25, 2012
to
April 24, 2042
No 5 Stock-based
Compensation Type
Stock Option
4 directors
and 14 corporate officers
of the Company, 2 directors
and 3 corporate officers
of subsidiaries
Common stock
33,200 shares May 8, 2013 (Note 2) (Note 3)
May 9, 2013
to
May 8, 2043
No 6 Stock-based
Compensation Type
Stock Option
5 directors
and 12 corporate officers
of the Company, 3 directors
and 6 corporate officers
of subsidiaries
Common stock
27,500 shares April 24, 2014 (Note 2) (Note 3)
April 24, 2014
to
April 23, 2044
No 7 Stock-based
Compensation Type
Stock Option
5 directors
and 13 corporate officers
of the Company, 3 directors
and 8 corporate officers
of subsidiaries
Common stock
22,100 shares May 8, 2015 (Note 2) (Note 3)
May 9, 2015
to
May 8, 2045
No 8 Stock-based
Compensation Type
Stock Option
5 directors
and 14 corporate officers
of the Company, 4 directors
and 9 corporate officers
of subsidiaries
Common stock
25,900 shares May 10, 2016 (Note 2) (Note 3)
May 11, 2016
to
May 10, 2046
No 9 Stock-based
Compensation Type
Stock Option
4 directors
and 16 corporate officers
of the Company, 4 directors
and 8 corporate officers
of subsidiaries
Common stock
15,300 shares May 9, 2017 (Note 2) (Note 3)
May 10, 2017
to
May 9, 2047
No 10 Stock-based
Compensation Type
Stock Option
5 directors
and 19 corporate officers
of the Company, 3 directors
and 8 corporate officers
of subsidiaries
Common stock
15,800 shares May 8, 2018 (Note 2) (Note 3)
May 9, 2018
to
May 8, 2048
No 11 Stock-based
Compensation Type
Stock Option
5 directors
and 18 corporate officers
of the Company, 3 directors
and 9 corporate officers
of subsidiaries
Common stock
24,100 shares April 19, 2019 (Note 2) (Note 3)
April 20, 2019
to
April 19, 2049
Note 1. Stock options are convertible into an equal number of shares. Note 2. Vesting conditions are not stipulated. Note 3. The service period is not stipulated.
27 HORIBA, Ltd. (Consolidated)

(b) Number, movement and price of stock options Stock options are convertible into an equal number of shares.
(ⅰ) Number of shares
Options before vesting
(number of shares)
Options after vesting
(number of shares)
Balance at
December 31,
2018
Granted Forfeited Vested
Balance at
December 31,
2019
Balance at
December 31,
2018
Vested Exercised Forfeited
Balance at
December 31,
2019
No. 1 Stock-based
Compensation Type - - - - - 27,100 - 1,300 - 25,800
Stock Option
No. 2 Stock-based
Compensation Type - - - - - 13,900 - 600 - 13,300
Stock Option
No. 3 Stock-based
Compensation Type - - - - - 17,200 - 600 - 16,600
Stock Option
No. 4 Stock-based
Compensation Type - - - - - 16,000 - 500 - 15,500
Stock Option
No. 5 Stock-based
Compensation Type - - - - - 20,500 - 600 - 19,900
Stock Option
No. 6 Stock-based
Compensation Type - - - - - 17,600 - 400 - 17,200
Stock Option
No. 7 Stock-based
Compensation Type - - - - - 14,500 - 500 - 14,000
Stock Option
No. 8 Stock-based
Compensation Type - - - - - 21,300 - 700 - 20,600
Stock Option
No. 9 Stock-based
Compensation Type - - - - - 14,100 - 300 - 13,800
Stock Option
No. 10 Stock-based
Compensation Type - - - - - 15,500 - 400 - 15,100
Stock Option
No. 11 Stock-based
Compensation Type - 24,100 - 24,100 - - 24,100 - - 24,100
Stock Option
28 HORIBA, Ltd. (Consolidated)

(ⅱ) Price per share
Option Price
(yen) Weighted Average Stock Price
(yen) Fair value at Grant date
(yen)
No 1 Stock-based Compensation Type
Stock Option 1 6,510 1,091
No 2 Stock-based Compensation Type
Stock Option 1 6,510 2,628
No 3 Stock-based Compensation Type
Stock Option 1 6,510 2,208
No 4 Stock-based Compensation Type
Stock Option 1 6,510 2,245
No 5 Stock-based Compensation Type
Stock Option 1 6,510 2,988
No 6 Stock-based Compensation Type
Stock Option 1 6,510 2,739
No 7 Stock-based Compensation Type
Stock Option 1 6,510 3,598
No 8 Stock-based Compensation Type
Stock Option 1 6,510 3,116
No 9 Stock-based Compensation Type
Stock Option 1 6,510 5,795
No 10 Stock-based Compensation Type
Stock Option 1 6,510 6,435
No 11 Stock-based Compensation Type
Stock Option 1 - 4,923
29 HORIBA, Ltd. (Consolidated)

(3) Method to estimate the fair unit value of stock optionsThe grant date fair value of No. 11 Stock-based Compensation Type Stock Option in the year ended December 31, 2019 was estimated using the Black-Scholes option pricing model as follows:
No. 11 Stock-based Compensation Type Stock Option
Stock Price Volatility (Note 1) 36.7%
Expected Remaining Period (Note 2) 15 Years
Expected Dividend (Note 3) ¥145/share Risk Free Interest Rate (Note 4) 0.210%
Note 1. Stock price volatility was calculated based on actual weekly stock prices over 15 years (from the week of April 19, 2004 to the week of April 15, 2019). Note 2. As it was difficult to estimate the expected remaining period without sufficient relevant data, it was determined to be exercised at the mid-point of the exercise period. Note 3. Expected dividend was calculated by using the actual dividend paid for the year ended December 31, 2018. Note 4. Risk free interest rate represents the comparable compound interest rate of strip government bonds whose remaining period corresponds to the expected remaining period of the stock options.
(4) Condition regarding the estimate of the fair unit value of stock optionsRetirement from the office of director is condition necessary to exercise stock options, but continuous employment is not. Accordingly, the initial number of stock options granted is used as an estimate of the number of vested shares.
11. LeasesFinance leases which do not transfer ownership of the lease assets at December 31, 2018 and December 31, 2019 consisted of leases for buildings, machinery, office equipment and software. The method of depreciation and amortization of lease assets is described in Note 2(h), "Summary of significant accounting policies - Leases.
12. Contingent liabilitiesNot applicable.
30 HORIBA, Ltd. (Consolidated)

13. Derivative transactionsDerivative transactions for which hedge accounting was not applied at December 31, 2018 and December 31, 2019 were as follows: Currency related: Millions of yen Millions of yen
12/2018 12/2019
Contract
Amount
Amount of
Principal due
over 1 Year
Fair
Value
Gain
(Loss)
Contract
Amount
Amount of
Principal due
over 1 Year
Fair
Value
Gain
(Loss)
Forwards
Selling
US dollar ¥3,030 - ¥33 ¥33 ¥2,408 - (¥6) (¥6)
Euro 1,403 - 5 5 1,480 - (32) (32)
British pound 565 - 3 3 791 ¥479 (35) (35)
Other 282 - (4) (4) 290 - (8) (8)
Buying
US dollar - - - - - - - -
Euro 59 - (0) (0) 6 - 0 0
British pound 319 - (7) (7) 125 - 6 6
Other 44 - (0) (0) 95 - 0 0
Total ¥5,705 - ¥28 ¥28 ¥5,197 ¥479 (¥76) (¥76)
Note. Fair value is determined by banking institutions.
Thousands of U.S. dollars
12/2019
Contract
Amount
Amount of
Principal due
over 1 Year
Fair
Value
Gain
(Loss)
Forwards
Selling
US dollar $21,978 - ($54) ($54)
Euro 13,508 - (292) (292)
British pound 7,219 $4,372 (319) (319)
Other 2,646 - (73) (73)
Buying
US dollar - - - -
Euro 54 - 0 0
British pound 1,140 - 54 54
Other 867 - 0 0
Total $47,435 $4,372 ($693) ($693)
31 HORIBA, Ltd. (Consolidated)

Derivative transactions for which hedge accounting was applied at December 31, 2018 and December 31, 2019 were as follows: Currency related: Millions of yen Millions of yen
12/2018 12/2019
Hedged
Items
Contract
Amount
Amount of
Principal due
over 1 Year
Fair
Value
Hedged
Items
Contract
Amount
Amount of
Principal due
over 1 Year
Fair
Value
Forwards
Buying
Euro Accounts
payable
¥492 - (¥2) Accounts
payable
- - -
British pound 33 - (0) ¥13 - ¥1
Total ¥525 - (¥3) ¥13 - ¥1
Note. Fair value is determined by banking institutions.
Thousands of U.S. dollars
12/2019
Hedged
Items
Contract
Amount
Amount of
Principal due
over 1 Year
Fair
Value
Forwards
Buying
Euro Accounts
payable
- - -
British pound $118 - $9
Total $118 - $9
Interest rate currency related: Millions of yen Millions of yen
12/2018 12/2019
Hedged
Items
Contract
Amount
Amount of
Principal due
over 1 Year
Fair
value
Hedged
Items
Contract
Amount
Amount of
Principal due
over 1 Year
Fair
Value
Exceptional Accounting for Interest Rate and Currency Swaps
Interest Rate and Currency
Swap Contracts
Long-term
loans
Fixed Rate Payments
and Variable Rate Receipts
Receiving in US dollar
and Paying in Japanese yen
Long-term
loans
¥15,120
¥15,120
Note
¥15,120
¥15,120
Note
Thousands of U.S. dollars
12/2019
Hedged
Items
Contract
Amount
Amount of
Principal due
over 1 Year
Fair
Value
Exceptional Accounting for Interest Rate and Currency Swaps
Interest Rate and Currency
Swap Contracts
Fixed Rate Payments
and Variable Rate Receipts
Receiving in US dollar
and Paying in Japanese yen
Long-term
loans
$138,006
$138,006
Note
Note. Interest rate and currency swap contracts subject to exceptional accounting treatment (special treatment and allocation treatment) are accounted for together with long-term loans as hedged items. Accordingly, their fair values are included in the fair values of long-term loans.
32 HORIBA, Ltd. (Consolidated)
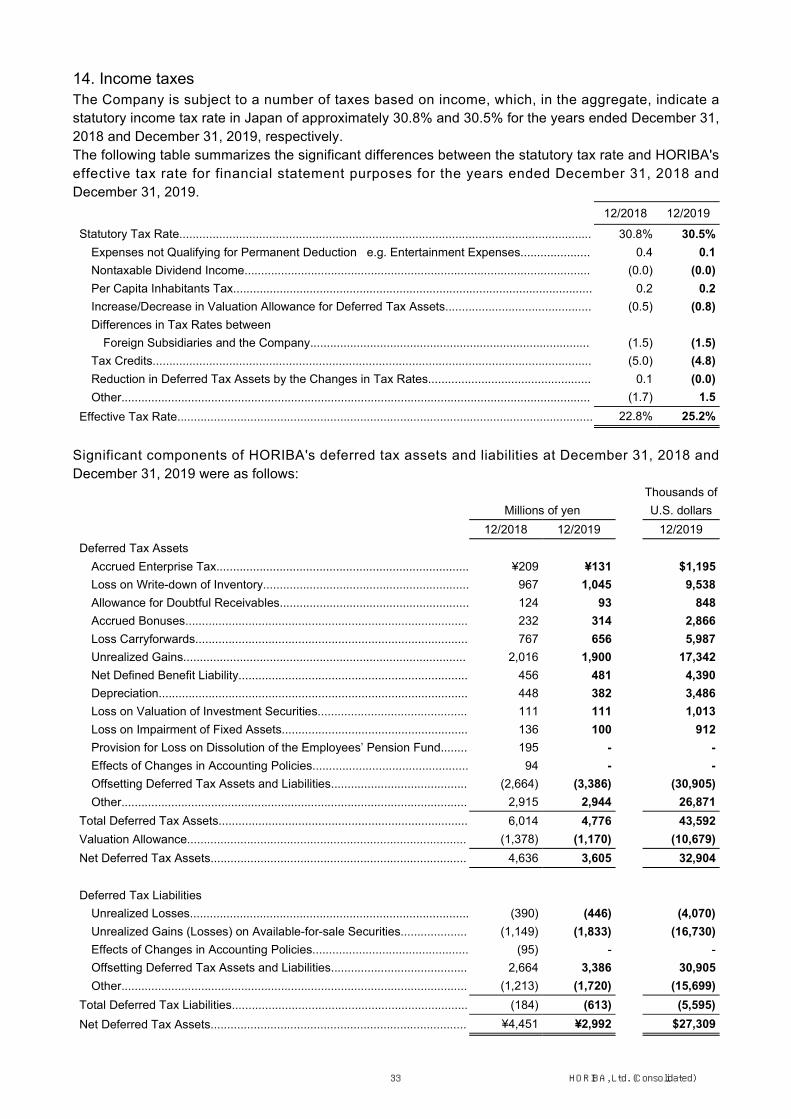
14. Income taxesThe Company is subject to a number of taxes based on income, which, in the aggregate, indicate a statutory income tax rate in Japan of approximately 30.8% and 30.5% for the years ended December 31, 2018 and December 31, 2019, respectively. The following table summarizes the significant differences between the statutory tax rate and HORIBA's effective tax rate for financial statement purposes for the years ended December 31, 2018 and December 31, 2019. 12/2018 12/2019
Statutory Tax Rate............................................................................................................................ 30.8% 30.5%
Expenses not Qualifying for Permanent Deduction e.g. Entertainment Expenses..................... 0.4 0.1 Nontaxable Dividend Income........................................................................................................ (0.0) (0.0) Per Capita Inhabitants Tax............................................................................................................ 0.2 0.2 Increase/Decrease in Valuation Allowance for Deferred Tax Assets............................................ (0.5) (0.8) Differences in Tax Rates between
Foreign Subsidiaries and the Company.................................................................................... (1.5) (1.5) Tax Credits.................................................................................................................................... (5.0) (4.8) Reduction in Deferred Tax Assets by the Changes in Tax Rates................................................. 0.1 (0.0) Other............................................................................................................................................. (1.7) 1.5
Effective Tax Rate............................................................................................................................. 22.8% 25.2%
Significant components of HORIBA's deferred tax assets and liabilities at December 31, 2018 and December 31, 2019 were as follows:
Millions of yen
Thousands of U.S. dollars
12/2018 12/2019 12/2019 Deferred Tax Assets
Accrued Enterprise Tax............................................................................ ¥209 ¥131 $1,195 Loss on Write-down of Inventory.............................................................. 967 1,045 9,538 Allowance for Doubtful Receivables......................................................... 124 93 848 Accrued Bonuses..................................................................................... 232 314 2,866 Loss Carryforwards.................................................................................. 767 656 5,987 Unrealized Gains..................................................................................... 2,016 1,900 17,342 Net Defined Benefit Liability..................................................................... 456 481 4,390 Depreciation............................................................................................. 448 382 3,486 Loss on Valuation of Investment Securities............................................. 111 111 1,013 Loss on Impairment of Fixed Assets........................................................ 136 100 912 Provision for Loss on Dissolution of the Employees’ Pension Fund........ 195 - - Effects of Changes in Accounting Policies............................................... 94 - - Offsetting Deferred Tax Assets and Liabilities......................................... (2,664) (3,386) (30,905) Other........................................................................................................ 2,915 2,944 26,871
Total Deferred Tax Assets........................................................................... 6,014 4,776 43,592 Valuation Allowance.................................................................................... (1,378) (1,170) (10,679) Net Deferred Tax Assets............................................................................. 4,636 3,605 32,904
Deferred Tax Liabilities
Unrealized Losses.................................................................................... (390) (446) (4,070) Unrealized Gains (Losses) on Available-for-sale Securities.................... (1,149) (1,833) (16,730) Effects of Changes in Accounting Policies............................................... (95) - - Offsetting Deferred Tax Assets and Liabilities......................................... 2,664 3,386 30,905 Other........................................................................................................ (1,213) (1,720) (15,699)
Total Deferred Tax Liabilities....................................................................... (184) (613) (5,595) Net Deferred Tax Assets............................................................................. ¥4,451 ¥2,992 $27,309
33 HORIBA, Ltd. (Consolidated)
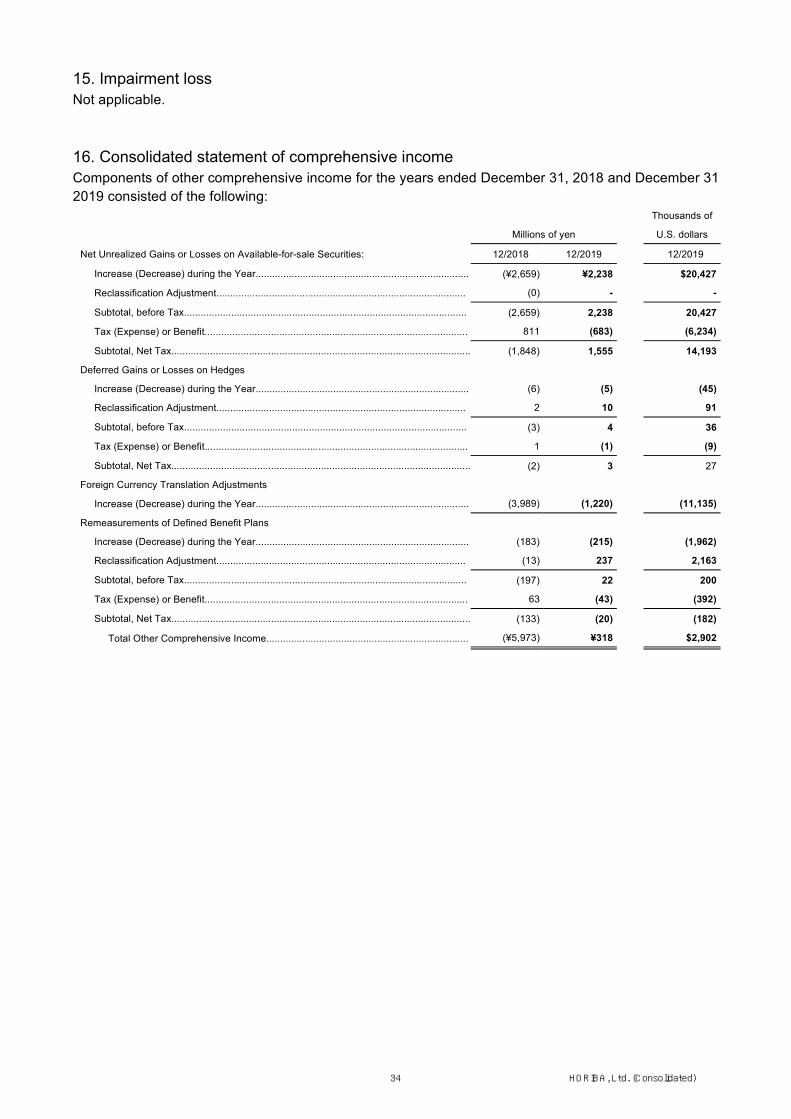
15. Impairment lossNot applicable.
16. Consolidated statement of comprehensive incomeComponents of other comprehensive income for the years ended December 31, 2018 and December 31 2019 consisted of the following:
Millions of yen
Thousands of
U.S. dollars
Net Unrealized Gains or Losses on Available-for-sale Securities: 12/2018 12/2019 12/2019
Increase (Decrease) during the Year............................................................................. (¥2,659) ¥2,238 $20,427
Reclassification Adjustment.......................................................................................... (0) - -
Subtotal, before Tax...................................................................................................... (2,659) 2,238 20,427
Tax (Expense) or Benefit............................................................................................... 811 (683) (6,234)
Subtotal, Net Tax............................................................................................................ (1,848) 1,555 14,193
Deferred Gains or Losses on Hedges
Increase (Decrease) during the Year............................................................................. (6) (5) (45)
Reclassification Adjustment.......................................................................................... 2 10 91
Subtotal, before Tax...................................................................................................... (3) 4 36
Tax (Expense) or Benefit............................................................................................... 1 (1) (9)
Subtotal, Net Tax............................................................................................................ (2) 3 27
Foreign Currency Translation Adjustments
Increase (Decrease) during the Year............................................................................. (3,989) (1,220) (11,135)
Remeasurements of Defined Benefit Plans
Increase (Decrease) during the Year............................................................................. (183) (215) (1,962)
Reclassification Adjustment.......................................................................................... (13) 237 2,163
Subtotal, before Tax...................................................................................................... (197) 22 200
Tax (Expense) or Benefit............................................................................................... 63 (43) (392)
Subtotal, Net Tax............................................................................................................ (133) (20) (182)
Total Other Comprehensive Income......................................................................... (¥5,973) ¥318 $2,902
34 HORIBA, Ltd. (Consolidated)

17. Segment informationGeneral information regarding reportable segments (1) Calculation method for reportable segments HORIBA's reportable segments are components of the Company about which separate financial information is available and that are evaluated regularly by the management in deciding how to allocate resources and in assessing performance. The Company has established the segment strategy office for each product and service at its headquarters. The office constructs a comprehensive plan for Japan and overseas markets for business development. The Company thus is composed of business segments by product and service that are determined at the head office. The Automotive Test Systems, Process & Environmental Instruments & Systems, Medical-Diagnostic Instruments & Systems, Semiconductor Instruments & Systems and Scientific Instruments & Systems comprise the Company’s five reportable segments.
Major products and services of each segment are described below. (a) Automotive Test Systems Emission Measurement Systems, Automotive Emission Analyzers, On-Board Emission Measurement Systems, Driveline Test Systems, Engine Test Systems, Brake Test Systems, Fuel Cell Test Systems, Battery Test Systems, Vehicle Development Engineering, Testing Engineering, Lease and Managment of R&D Facilities
(b) Process & Environmental Instruments & Systems Stack Gas Analyzers, Water Quality Analysis and Examination Systems, Air Pollution Analyzers, Environmental Radiation Meters, Process Measurement Equipment
(c) Medical-Diagnostic Instruments & Systems Hematology Analyzers, Immunology Analyzers, Clinical Chemistry Analyzers, Blood Glucose Analyzers
(d) Semiconductor Instruments & Systems Mass Flow Controllers, Chemical Concentration Monitors, Reticle/Mask Particle Detection Systems, Residual Gas Analyzers
(e) Scientific Instruments & Systems pH Meters, Particle-Size Distribution Analyzers, X-Ray Fluorescence Analyzers, Elemental Analyzers, Raman Spectrometers, Fluorescence Spectroscopy/ Fluoresence Lifetime Spectroscopy, Optical Components; Spectrometers and Detectors, Gratings
(2) Method of measurement regarding income (loss), assets and other material items by reportable segment The accounting methods applied for reportable segments are identical with those stated in Note 2, "Summary of significant accounting policies." Income for each reportable segment is the amount based on operating income. As of starting from the fiscal year 2019, HORIBA applied the Partial Amendments to Accounting Standards for Tax Effect Accounting (ASBJ Statement No. 28, February 16, 2018). These accounting standards have been applied retroactively for figures prior to the fiscal year 2018.
35 HORIBA, Ltd. (Consolidated)

(3) Information regarding income (loss), assets and other material items by reportable segment Millions of yen
12/2018
Automotive Process &
Environmental Medical-
Diagnostic Semiconductor Scientific Adjustment Consolidated
Sales
Sales to Outside Customers............ ¥79,656 ¥19,361 ¥26,012 ¥57,785 ¥27,754 - ¥210,570
Intersegment Sales and Transfers... - - - - - - -
Total................................................. 79,656 19,361 26,012 57,785 27,754 - 210,570
Segment Income (Loss)...................... ¥7,702 ¥2,027 ¥1,823 ¥17,063 ¥221 - ¥28,838
Segment Assets.................................. ¥83,218 ¥16,594 ¥22,990 ¥53,889 ¥22,742 ¥77,932 ¥277,368
Other Items:
Depreciation..................................... 3,059 484 1,166 1,659 750 - 7,120
Amortization of Goodwill.................. 51 - - - 68 - 120 Increase in Tangible and Intangible Fixed Assets............. 4,072 888 1,138 2,395 1,745 - 10,239
Millions of yen
12/2019
Automotive Process &
Environmental Medical-
Diagnostic Semiconductor Scientific Adjustment Consolidated
Sales
Sales to Outside Customers............ ¥81,042 ¥19,500 ¥25,335 ¥47,191 ¥27,170 - ¥200,241
Intersegment Sales and Transfers... - - - - - - -
Total................................................. 81,042 19,500 25,335 47,191 27,170 - 200,241
Segment Income (Loss)...................... ¥6,454 ¥1,697 ¥1,302 ¥10,727 ¥734 - ¥20,916
Segment Assets.................................. ¥87,981 ¥16,728 ¥25,549 ¥48,397 ¥23,392 ¥113,084 ¥315,133 Other Items:
Depreciation..................................... 3,829 574 1,332 1,896 851 - 8,485
Amortization of Goodwill.................. 199 16 - - 93 - 309 Increase in Tangible and Intangible Fixed Assets............. 6,290 1,009 2,478 1,825 1,231 - 12,834
Thousands of U.S. dollars
12/2019
Automotive Process &
Environmental Medical-
Diagnostic Semiconductor Scientific Adjustment Consolidated
Sales
Sales to Outside Customers............ $739,704 $177,984 $231,243 $430,732 $247,991 - $1,827,683
Intersegment Sales and Transfers... - - - - - - -
Total................................................. 739,704 177,984 231,243 430,732 247,991 - 1,827,683
Segment Income (Loss)...................... $58,908 $15,489 $11,883 $97,909 $6,699 - $190,909
Segment Assets.................................. $803,039 $152,683 $233,196 $441,739 $213,508 $1,032,165 $2,876,350 Other Items:
Depreciation..................................... 34,948 5,239 12,157 17,305 7,767 - 77,446
Amortization of Goodwill.................. 1,816 146 - - 848 - 2,820 Increase in Tangible and Intangible Fixed Assets............. 57,411 9,209 22,617 16,657 11,235 - 117,141
Note 1. Details of adjustment amounts are as follows: (1) Unallocated amounts to be included in the adjustment amount of segment income were not generated. (2) The adjustment amounts of ¥77,932 million and ¥113,084 million ($1,032,165 thousand) of segment assets for the years ended December 31, 2018 and December 31, 2019, respectively, represent corporate assets that are not allocated to any business segment. They include cash and cash equivalents, short-term investments, investment securities, idle land, etc.
Note 2. Depreciation and increase in tangible and intangible fixed assets include long-term prepaid expenses and the amount of amortization associated with the expenses.
36 HORIBA, Ltd. (Consolidated)

<Related Information> 1. Information regarding geographic areas (1) Net sales
Millions of yen
Thousands of
U.S. dollars
12/2018 12/2019 12/2019
Japan................................................................................................................................ ¥65,986 ¥62,169 $567,442
U.S.................................................................................................................................... 28,673 26,510 241,967
China................................................................................................................................. 27,832 27,552 251,478
Europe.............................................................................................................................. 45,006 44,532 406,462
Asia................................................................................................................................... 38,461 34,907 318,610
Others................................................................................................................................ 4,610 4,569 41,703
Total................................................................................................................................... ¥210,570 ¥200,241 $1,827,683
Note 1. Net sales are categorized by country or geographic area based on the location of the customer. Note 2. The "Asia" amount is that of the Asian region other than China.
(2) Property, plant and equipment
Millions of yen
Thousands of
U.S. dollars
12/2018 12/2019 12/2019
Japan................................................................................................................................. ¥31,329 ¥32,436 $296,056
U.S.................................................................................................................................... 8,103 8,097 73,904
U.K.................................................................................................................................... 12,575 14,948 136,436
Others................................................................................................................................ 16,730 20,447 186,628
Total................................................................................................................................... ¥68,739 ¥75,929 $693,035
2. Information regarding major customers There were no customers who represented more than 10% of the consolidated sales.
3. Information regarding impairment loss on fixed assets by reporting segment Not applicable.
4. Information regarding the amortized amount and unamortized balance of goodwill by reporting segment
Millions of yen Thousands of
U.S. dollars
12/2018 12/2019 12/2019
Automotive Test Systems................................................................................................. ¥807 ¥700 $6,389
Process & Environmental Instruments & Systems........................................................... - 226 2,062
Scientific Instruments & Systems..................................................................................... 93 327 2,984
Total.................................................................................................................................. ¥901 ¥1,254 $11,445
Note. Information regarding the "Amortized amount of goodwill" is omitted as similar information is disclosed in "Segment Information."
5. Information regarding gain on bargain purchase by reporting segment Information regarding the "gain on bargain purchase by reporting segment" is omitted because of its immateriality in fiscal 2018. In fiscal 2019, it was not recognized.
37 HORIBA, Ltd. (Consolidated)

18. Related party transactionsNot applicable.
19. Subsequent eventsNot applicable.
38 HORIBA, Ltd. (Consolidated)

39 HORIBA, Ltd. (Consolidated)