horizontal shear strength of composite concrete beams with ... · only if the horizontal shear...
TRANSCRIPT
Horizontal Shear Strength of Composite Concrete Beams With a Rough Interface
Robert E. Loov D. Phil., P. Eng. Professor of Civil Engineering The University of Calgary Calgary, Alberta Canada
Anil K. Patnaik, Ph. D. Structural Engineer Wholohan Grill and Partners Perth, Western Australia Australia
48
The latest version of the ACI Building Code requires five equations to prescribe the limiting horizontal shear stress for differing amounts of reinforcing steel. The test results from the 16 beams tested in this study indicate that a more consistent limit can be obtained by replacing four of the present equations with a parabolic equation modified from the one used in the PC/ Design Handbook. The proposed equation combines the effect of concrete strength and clamping stress. It is equally applicable for lightweight and semi-lightweight concrete. The test results indicate that an as-cast surface with the coarse aggregate left protruding from the surface, but without special efforts to produce a rough surface, can develop adequate shear resistance and simplify production of the precast concrete beams. Also, the tests show that stirrups are typically unstressed and ineffective until horizontal shear stresses exceed 1.5 to 2 MPa (220 to 290 psi).
C omposite construc tion is an economical way of combining precast and cast-in-place con
crete while retaining the continuity and efficiency of monolithic construction. A composite beam is smaller, shallower and lighter, thus leading to overall cost savings . A composite beam requires the flange or cast-inplace slab and the girder to act as a single unit.
This monolithic behavior is possible only if the horizontal shear resulting fro m bending of the beam is effectively transferred between the flange
and the girder at their interface. The roughness of the top of the precast concrete beam, the amount of steel crossing the joint and the concrete strength are the major factors affecting the shear strength of the interface.
Provisions for the design of the steel crossing the interface between cast-inplace slabs and precast beams first appeared in the ACI Code' in 1963. These provisions were based on the ACIASCE 333 report2 which summarized the research of Hanson3 and Kaar et al.4
Based on push-off tests by Birkeland and Birkeland,5 Mast,6 Kriz and Raths7
PCI JOURNAL

and Hotbeck et al.,8 a new concept called "shear-friction" was introduced into the ACI Code in 1970. Saemann and Washa9
and Nosseir and Murtha10 studied the interface shear strength of composite beams to some extent. However, no other significant or systematic evaluation of horizontal shear strength appears to have been made thereafter.
We believe that the study presented here will provide new insight into the behavior of "rough" joints in composite concrete beams and their capacity to develop interface shear for a wide range of steel ratios.
PREVIOUS RESEARCH In earlier studies, the shear strength of a joint was as
sumed to vary directly with the amount of reinforcing steel crossing it. However, parabolic equations for shear transfer strength were suggested as early as 1968 by Birkeland11 and later by Raths12 and Loov. 13 Based on a report by Shaikh,14
peps adopted a procedure which indirectly uses a parabolic equation. Walraven et al. 16 did an extensive statistical analysis on most of the data available from push-off tests and suggested an equation which provides a good fit but is not convenient for use in a design office. In their discussion of this paper, Mau and Hsu suggested a simpler design equation.16 A detailed literature review of the subject can be found in Patnaik's Ph.D. thesis. 17
Some equations applicable for reinforcement crossing perpendicular to the interface are given here. More than 30 shear-friction equations have been proposed by various researchers; therefore, symbols have been modified for consistency. The term Pv fy is referred to as the clamping stress.
Linear Shear-Friction Equation
This equation was first introduced in 1958 by Mast6 and was later developed further by Birkeland, Anderson 18 and their co-workers:
(1)
where f.1 is the coefficient of friction. The equation is simple but is very conservative for low
clamping stresses and unsafe for high clamping stresses.
Birkeland's Equation
.Birkeland11 was the first to introduce a parabolic function for the shear strength along a joint:
Shaikh's Equation
v n = 2. 78~ pJY (MPa)
vn = 33.5~pJY (psi) (2)
Shaikh, 14 in his proposed revisions to shear-friction provisions, suggested an equation which can be rearranged as:
(3a)
in which
January-February 1994
f.1 = 6· 9 ,1_2 (MPa) e Vu
f..le = 1000/l} (psi) Vu
where LOA has been substituted for f.1 and A is a constant used to account for the effect of concrete density.
A = 1.0 for normal weight concrete A= 0.85 for sand-lightweight concrete A= 0.75 for all-lightweight concrete The design requirements of the peps are based on this
equation. If these two equations are combined, a parabolic equation for vu with respect to the clamping force is obtained:
vu = A~6. 9</Jpvfy ~ 0.25f;A2 and 6. 9A2 (MPa)
vu = A{fOOO<(JpJY ~ 0.25f;A2 and 1000A2 (psi)
(3b)
where the capacity reduction factor, <P = 0.85 for shear. This equation is similar to Rath's equation12 and Eq. (2).
Eq. (3) represents the test data more closely than Eq. (1), but it does not include the effect of concrete strength variations.
Loov's Equation
Loov13 was apparently the first to incorporate the influence of concrete strength:
Vn = k~pvfYJ; (4)
where k is a constant. A k of 0.5 was suggested for initially uncracked shear in
terfaces. For fJ = 30.9 MPa (4480 psi), this equation is the same as Eq. (2). One advantage of this equation is that any consistent system of units can be used without changes.
Walraven's Equation
A statistical analysis was conducted by Walraven et al. 16
on the results of 88 push-off tests. The following equation was suggested for a precracked shear interface:
Vn = Ct(Pvfy)cz (MPa)
vn = C3(0.007 Pvfy)c4 (psi) (5)
if J; is assumed to be equal to 0.85 of the compressive strength of 150 mm (6 in.) cubes:
c1 = o.878 J; 0406
c3 = 16.8 J; 0406
and
and
C2 = 0.167 ~;o3o3
c 4 = o.o371 J; 0303
Based on this equation, for J; = 30 MPa or 4350 psi, the shear is roughly proportional to J; to the power 0.4 and the clamping stress to the power 0.47.
Mattock's Equation
In his discussion of the paper by Walraven et al., Mattock added the effect of concrete strength into his previous equation19 and reintroduced it as:
49

(6)
and vn ~ 0.3J;
Equations for the shear strength of lightweight concrete can be found in Mattock et al.2°
Mau and Hsu's Equation
In their discussion of Eq. (5), Mau and Hsu'6 suggested an equation similar to Eq. (4) with k = 0.66. They assumed that the factor 0.66 would be the same for both initially cracked and uncracked shear interfaces.
Push-Off Tests
Attempts were made by Hanson3 to correlate push-off tests and beam tests. By comparing shear-slip relations for the two types of specimens, he concluded that push-off tests are representative of beam tests for "rough bonded" connections.
Limiting Slips
Hanson 3 considered the maximum horizontal shear strength to have been reached when a slip of 0.13 mm (0.005 in.) occurred, and this limit was later adopted by Saemann and Washa9 in their study. However, the fixing of a limiting value was not without controversy (Grossfield and Birnstiel) .2
' Larger shear strengths would be recorded if larger slips were permitted. In their discussion of Ref. 9, Hall and Mast suggested that, as for composite steel beams, there should be no limit for slip.
ACI Code1
The test data corresponding to horizontal shear failure , found in previous studies, are shown in Fig. 1 along with the nominal shear specified by the ACI Code for a rough interface. The code provisions are a combination of special provisions for horizontal shear from Clause 17.5 ( 1 to 3 in the following list) along with shear-friction provisions from Clause 11.7 (listed as 4 and 5 here) . The lines shown in Fig. 1 are based on a coefficient of friction J1 of 1.0 and a concrete strength of at least 27.5 MPa (4000 psi).
Clamping Stress, P}y, psi
0 200 400 600 BOO 1000 B
1000 0
0 0
6 0~ 0 f'c ~ 27.5 MPo ( 4000 psi)
0 BOO c-;:; 0
0.. "' :2 * 0..
• v) Vl ll 600 t/) Vl 4 0 <!) <!) = '- oro Evans & Chung • (/)
(/) 0 Hanson '-
'- • C'O ("()
u 0 • H~u <!)
..c ..c (/) (/) • Kaar. Kriz & Raths 400
0 Mattock & Kaar
* Nosseir & Murtha 2 0 Saemann & Washa
200
0 0 0 2 4 6 8
Clamping Stress, PJy, MPa
Fig. 1. Shear stresses- ACI 318-M92 compared with previous test results.
50 PCI JOURNAL
Clamping Stress Range
1. 0 to 0.33 MPa (0 to 50 psi)
2. 0.33 to 2.83 MPa (50 to 400 psi)
3. 2.83 to 3.5 MPa (400 to 500 psi)
4. 3.5 to 5.5 MPa (500 to 800 psi)
5. Over 5.5 MPa (over 800 psi)
Shear Stress Lirrllt
0.6 MPa (80 psi)
1.8 + 0.6pvf y MPa (260 + 0.6pvfY psi)
3.5 MPa (500 psi)
5.5 MPa (800 psi)
The concrete strength does not affect the stress limits in any of these ranges except for Range 5. In this range, the shear stress is limited to 0.2J; when concrete strengths less than 27.5 MPa (4000 psi) are used. In Ranges 2 and 3 listed above, these code provisions are a considerable improvement over those used in previous editions of the ACI Code.
Although all of the plotted values have been described as horizontal shear failures , a certain amount of caution is advised so that failures due to other causes are not ascribed to horizontal shear. In particular, the result plotted for Beam III-0.6-1.66, tested by Kaar et al. ,' indicates that the beam reached a load equivalent to 98 percent of the theoretical flexural capacity before apparently failing in horizontal shear.
On the other hand, the photograph of this beam shows a complete web failure . Thus, failure may have been due to a combination of all three failure modes. Complete information on the tests by Hsu24 is not available. The plotted values from Hanson correspond to those near failure. The horizon-
Table 1. Properties of test beams.
I I Area of
Width of Length of longitudinal Effective Beam interface, b,, flange steel, A, depth,d
No. mm mm mm2 mm
tal shear stresses at 0.13 mm (0.005 in.) slip fall somewhat lower.
The maximum clamping stress which has been used in the previous beam tests is only 3 MPa (430 psi); therefore, for higher clamping stresses there appear to be no published beam data to support the code equations.
ANALYSIS METHODS
When a beam is uncracked and linearly elastic, horizontal shear stresses can be evaluated by the equation:
where
VQ v - h- Ib
v
(7)
V = transverse shear fo;-ce at location under consideration Q = first moment of area of portion above interface with
respect to neutral axis of section I = moment of inertia of entire cross section bv = width of interface
This equation can be used to evaluate the horizontal shear stress for cracked beams if Q and I are based on the cracked section. Because it provides a common basis for comparison, this equation was adopted in previous studies even though Hanson3 and Saemann and Washa9 recognized that it does not give an exact representation of the horizontal shear stress at failure. This expression was included in the ACI Code untill970.
Clause 17.5.3 of the ACI Code1 allows design based on equilibrium conditions by: "computing the actual change in compressive or tensile force in any segment, and provisions
-l Spacing of
#3 stirrups Yield
crossing strength, f y I Clamping interface, s MPa I stress, Pvfy
mm Longitudinal I Stirrups MPa -~- -
I I 75 3200 2000 292
I
190 497 438
I 4.36
2 75 3200 1600 295 500 454 438 1.66
3 75 3200 2000 288 300 4S4 432 J 2.73
4 7S 3200 2S6S 282 13S 334 430 6.03
s 7S 3200 1600 29S soo 4S4 430 1.63
6 7S 3200 1600 29S
I
soo 4S4 428 1.62
7
I 7S 3200 2400 28 1 13S 497 432 6.06
8 ISO 3200 1600 29S soo 4S4 407 0.77
9 7S 2400 2000 288 soo 431 I 428 1.62
10 ISO 2400 2000 288 soo 431
I
409 0.77
II 300 2400 2SOO 297 I
soo 497 420 0.40
12 7S 2400 2800 280 100 4SS 408 7.72
13 ISO 2400 2000 288 soo 431 I 431 0.82
14 ISO 2400 2000 288 soo 431 431 I 0.82
15 !50 2400 2000 288 500 431 420
I 0.80
16 I ISO 2400 I 2000 288 I soo 431 I 420 0.80
Note: 1 mm = 0.0394 in.; 1 MPa = 145 psi ; area of #3 bars= 71 mm' .
January-February 1994 51

made to transfer that force as horizontal shear to the supporting element." This relationship can be expressed as:
(8)
where Cis the total compression in the flange and £v is the length over which horizontal shear is to be transferred.
The ultimate condition for horizontal shear cannot be achieved unless slip occurs between the precast and cast-inplace parts of a beam. The validity of the analysis of a composite concrete section using the procedures for a normal concrete section is somewhat questionable after slip has occurred. In the closure of their paper, Saemann and Washa9
justify the use of Eq. (7) even after slip has occurred. They assert that the designs will be safe if shear stresses, evaluated by using the elastic formula with cracked section properties, are less than the corresponding test strengths determined using the same procedure.
In contrast to the common use of the entire length of the shear span for transferring the horizontal shear force, CT N' recommends that all the compressive force in the flange be transferred in a length equal to one quarter of the span of the beam.
By requiring that the horizontal shear strength be greater than the factored shear force at the section under consideration [see Eq. (17-1) and Section 17.5 where the horizontal shear is related to bvd], the code implies the following equation for horizontal shear stresses:
(9)
Eqs. (7), (8) and (9) appear to be quite different from one another and a designer could, understandably, be confused as to which should be used.
In f~ct, the three equations are closely related. The terms VQ/1 in Eq. (7) give the rate of change of force in the flange. In Eq. (8), C 1 Cv is the average rate of change of force in the flange between a section with a force C and a section a distance £ v away with zero force in the flange. This is the same as Eq. (7) for point loads because the shear is constant. It is unsafe for uniform loading because the shear varies.
Eq. (9) is similar to the others because V = oM/ox is the rate of change of moment. If the compression zone is entirely within the flange, and the small variation in depth of the stress block is ignored, then the compression force C will be equal to Ml(d - a/2) and the rate of change of force in the flange will be V/(d- a/2). Therefore, Vuld in Eq. (9) is simply a non-conservative simplification of Eq. (7).
TEST PROGRAM Sixteen composite concrete beams were tested in this
study.
Variables
Two major variables were investigated: 1. The clamping stress was varied while maintaining the
concrete strength at about 35 MPa (5000 psi).
52
2. The concrete strength was varied for a fixed clamping stress of about 0.8 MPa (120 psi).
For the first variable, beams were tested with clamping stresses of 0.40, 0.77, 1.64, 2.73, 4.36, 6.06 and 7.72 MPa (58, 112, 238, 396, 632, 879 and 1120 psi). The test values cover the practical range of clamping stresses. To study the effect of variations in concrete strength, two beams were tested with a cylinder strength of about 19.4 MPa (2800 psi) and with concrete strengths of 44 and 48.3 MPa (6400 and 7000 psi).
Materials
Three different concrete mixes were used. Fine aggregate was washed local river sand and coarse aggregate was well graded with a maximum size of 14 mm (0.55 in.). The concrete control cylinders and the corresponding test beam were cured under similar conditions. The concrete strength fd of the web and the flange concrete was evaluated using standard cylinders. The modulus of elasticity of concrete was assumed to be (CAN3-A23.3-M84):26
or Ec = 5000{1; (MPa)
Er = 60200-JJ: (psi)
The average observed modulus obtained from the concrete cylinders was 4100-J]: MPa, or 494001/77 psi, which is considerably less. 17
The average yield strength of longitudinal bars and stirrup steel in different beams is given in Table 1. Steel crossing the interface in all the beams consisted of #3 (9.5 mm diameter) bars. The modulus of elasticity for the reinforcing steel
. was taken as 200 GPa (29000 ksi).
Sizes of Test Beams
Elevation views of the test beams are shown in Fig. 2. Beams 1 to 8 had flanges for their full length, while Beams 9 to 16 had their flanges discontinued at 1.2 m (3 ft 11 in.) from the center of the beam. The two different shapes of cross sections used for the test beams are shown in Fig. 3. The amount of steel crossing the interface and the width of the precast concrete girder at the interface (bv) were adjusted to achieve the desired level of clamping stress. The dimensions for different beams are summarized in Table 1.
Two types of web reinforcement were used for beams with a 75 mm (3 in.) web width. Stirrups crossing the interface were L-shaped and were provided in pairs. Stirrups below the interface were U-shaped (see Fig. 3). Closed rectartgular stirrups were used for the precast concrete girder of uniform width. Longer stirrups crossed the interface while shorter stirrups were within the precast concrete girder. Stirrups were well anchored on both sides of the joint so they were able to reach yield at the interface (Mattock).27
Typical details of beam reinforcement are shown in Fig. 4. Complete details of all test beams are given by Patnaik. 17
Joint Preparation
The test specimens were constructed to simulate beams with a precast concrete girder and a cast-in-place flange.
PCI JOURNAL
Flange
Web
T (a) Test Beam with Full Length Flanges
400
Flange
Web
(b) Test Beam with Short Flanges
-rs~-----------------------------3-o_so ______________________________ ~ 4--
Fig. 2. Elevation of test beams.
I· 400 ·I
I· 150
(a) Beam Section with Thin Web
Fig. 3. Typical sections of test beams.
January-February 1994
~I 0 1/) ...,
All Dimensions ore in mm
(1mm = 0._()394")
I· 400 ·I llf ~ c: 1J
- 1-- by =15 0
(3 00 for Beom11)
~ ~
~ ~
I· 150 ·I All Dimensions ore in mm
(300 for Beom11) ( 1 mm = 0.0394")
(b) Beam Section with Uniform Web Width
53

The web portion was first fabricated with stirrups projecting from it. Flange concrete was placed three days later. To simplify construction, the interface was left as-cast with some of the coarse aggregate protruding, instead of made as a "rough" surface with an amplitude of 5 mm (0.25 in.) required by the ACI Code. 1
The typical surface achieved in this test program is shown in Fig. 5. A large percentage of the 14 mm (0.55 in.) coarse aggregate can be seen protruding from the surface. This surface can be described as: well compacted having a rough surface, clean and free of laitance, with coarse aggregate protruding but firmly fixed in the matrix.
An unintentional variation in surface roughness occurred in this testing program. Very little coarse aggregate protruded from the top surface of Beam 14. The roughness of this surface, therefore, did not match the other beams of this test series.
Instrumentation
Slip gauges were provided in pairs on either side of the web. This new
S}'n:!metric
'X I
I
!
_C_ 95 mm S rtBrs uppo 0
Long;tud;nol Steel: 4 125 0 2000 mm2
Stirrups: Crossing Interface - 9.5 mm 0 300 cjc
Below Interface - 9.5 mm 0 300 c/c
Details of Beam 3
(a) Typical for a Beam with Full Length Flanges
~ 8 s mm
1 ul
Longaud;nol Steel: 4 125 0 2000 mm2 Stkrups: Cross;nQ Interface - 9.5 mm 0 500 c/c
~
uppo rt 8 rs a
~ Spacer Bor Welded to Longitudinal
Steel
Below Interface - 8 mm 0 125 c/c (Central 2.0 m) 9.5 mm 0 75 c/c (End Portion)
Details of Beams 13 to 16 (1mm = 0.0,394" )
type of gauge was devised to record (b) Typical far a Beam with Short Flanges
slips to an accuracy of 0.01 mm (0.0004 in.). The principles of the Fig. 4. Typical reinforcement details of test beams. method are illustrated schematically in Fig. 6. When the flange slides relative to the web, the metal strip moves with the flange. The end of the strip is restrained by the pointed end of the screw, which deflects the strip as a short cantilever. These slip gauges are described in detail by Patnaik.17
Shear-friction equations assume yielding of the reinforcement crossing the interface. To investigate this assumption, strain gauges were glued on selected stirrups at the level of the interface and strains were recorded at regular load intervals.
Testing
Beams were simply supported and loaded with a point load at centerspan. These beams were intended to be very strong in diagonal shear and flexure so that they would fail in horizontal shear prior to failing in any other mode.
GENERAL BEHAVIOR OF TEST BEAMS
Beams With Full Length Flanges
Flexural cracks were observed at the bottom of the beams after applying a few increments of load. As the load was increased, more cracks formed and those which had formed earlier became deeper and wider. Some of the cracks pro-
54
Fig. 5. Typical roughness achieved for the test beams.
gressed toward the flange and terminated in a single crack along the interface.
With continued loading, this crack extended along the interface toward the loading point over almost the entire length of the beam and caused separation across the joint. At maximum load, both the separation and slips were clearly visible. Maximum slips were greater than 2 mm (0.08 in.) in most cases. One end of the beam always had a larger slip and failed.
Interface cracks did not develop in the portion of the joint underneath the load for a length bounded by a line sloping outward at 45 degrees from the edge of the loading plate. Cracking also did not occur in the beam ends for a length extending from the end a distance equal to the effective depth
PCI JOURNAL

FlANGE
Metal Insert TO DATA ACQUISITION
Aluminum Mount
Glued to Beom Web
Overall Arrangement of a Slip Goge
Fig. 6. Schematic details of slip gauges.
from the edge of the support. The end portions of the beam rotated about the support in a direction away from the midspan to accommodate the flange slip, thereby creating wide diagonal cracks extending from each support to the joint [see Fig. 7(a)]. Cracks were observed on the top surface of the flanges at this location. This behavior was observed in the beams with flanges extending to the end of the beam and also in beams tested by others which failed in horizontal shear.
Symmetrical
\Interface Crock
(o) Beom with Full Length Flanges
Symmetrical
\ Interface Crock
(b) Beom with Short Flanges
Fig. 7. Interface cracking modes.
January-February 1994
(a) Beam with full length flanges.
(b) Beam with short flanges.
Fig. 8. Typical failure modes.
Beams 1 to 3 and Beams 5 to 8 failed in the manner just described. Fig. 8(a) shows half of a beam which failed in horizontal shear. The support reaction is at the bottom righthand comer. The horizontal crack, the separation at the interface and the large deformations of the spring steel slip gauges are noticeable.
Beams With Short Flanges
Attempts to determine the contribution of the interface beyond the location where the horizontal crack meets the diagonal crack proved inconclusive because of the complex strain conditions at this point. As the interface within the end block appeared to be ineffective, it was decided to test beams without a flange for the end 400 mm (15.7 in.) length . Extra web reinforcement was provided in these beams to prevent diagonal shear failure of the web.
These modified beams behaved in the same manner as the beams with full length flanges that had failed in horizontal shear, except that there was no diagonal cracking nor rotation of the beam ends [see Fig. 7(b)]. The average shear stress based on equilibrium was higher than for the beams with flanges extending the full length of the beam. Slip initially developed as described earlier, but at failure , the entire flange on the weaker half sheared suddenly along the interface with a large slip. The maximum slip for every beam which failed in horizontal shear was greater than 2 mm (0.08 in.).
55

(a) Local crushing and the crack path through the web.
(b) Splitting at the end of the flange.
Fig. 9. Details of failure of Beam 12.
Beams 9 and 10, and Beams 12 to 14 failed in this manner. Fig. 8(b) shows half of a beam of this type which failed in horizontal shear. The support reaction is on the left but not in the photograph. The horizontal crack and the separation at the interface are clearly visible.
Behavior of Individual Beams
Additional information specific to particular beams follows:
Beam 2 failed in horizontal shear associated with large slip and separation at its interface. However, the bearing concrete suffered considerable damage. This damage appeared to have been caused by insufficient anchorage of the main reinforcement. This probably precipitated the general failure in horizontal shear.
Beams 4 and 15 failed in flexure because their capacities in bending were not sufficient to cause horizontal shear failure. This occurred because the horizontal shear strength was much larger than expected.
Beam 11 developed evenly spaced diagonal cracks and failed in diagonal shear, although some cracking and slip occurred at the interface. The flexural and shear capacities of this beam were not sufficient to achieve horizontal shear failure.
Beam 12 failed in horizontal shear. Extensive local crushing of the concrete adjacent to the interface crack occurred
56
Fig. 10. Roughness of the joint in Beam 14.
in the narrow portion of the web. Along half of the beam, the interface crack deviated through the narrow portion of the web rather than following along the joint [see Fig. 9(a)]. The end portion of the flange split is shown in Fig. 9(b). Such splitting has been observed by Johnson et aJ.28 in steelconcrete composite beams. They attributed such splitting to the tendency of the flanges, along the width of the beam, to remain straight as the girder portion bends due to transverse loading.
Beam 14 was intended to be identical to Beam 13, but the top surface was not as rough as the other beams (compare the roughness in Fig. 10 and Fig. 5). The lower strength of Beam 14 demonstrates the importance of the roughness of the top surface on the precast concrete girder. This contradicts the contention of Hanson3 that the horizontal shear strength of a composite concrete beam is insensitive to surface roughness.
Slip and Horizontal Shear Stress
The slips which developed in both types of beams were similar. The observation by other authors (e.g., Hanson3
)
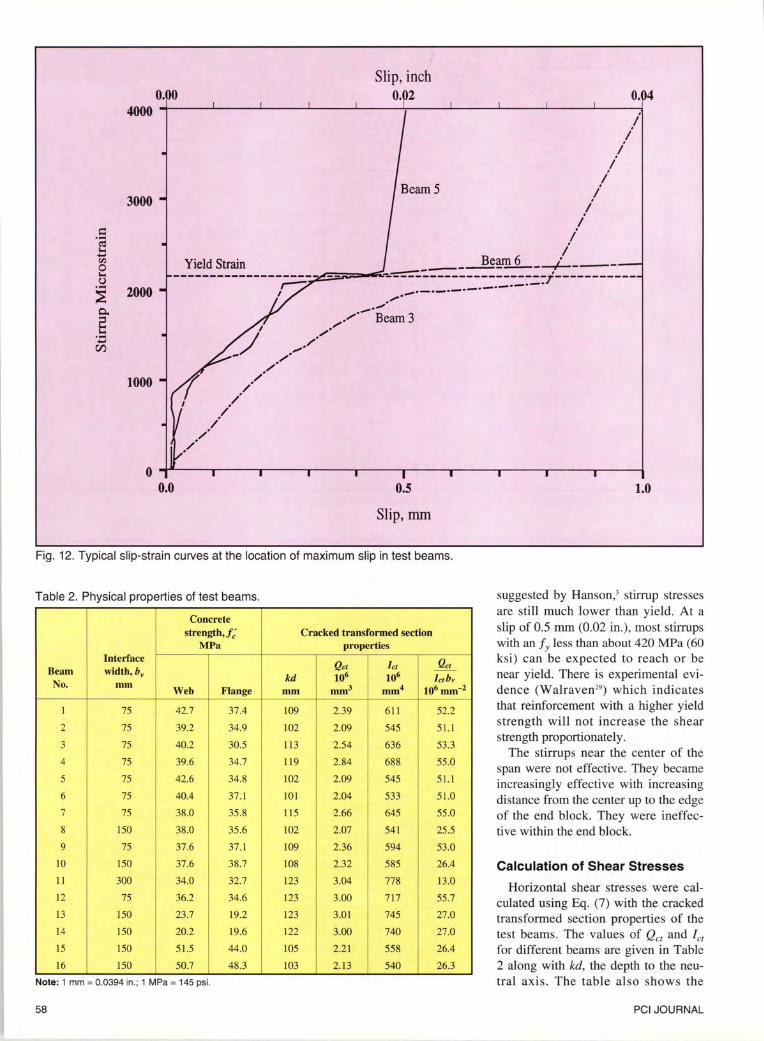
that the peak slips occur near the quarter span points was corroborated for loads below the failure load. At the failure loads, the peak slips for the beams with full length flanges occurred at a distance from the edge of the support approximately equal to the effective depth. For the beams with short flanges, the maximum slips at failure occurred at the end of the flanges. The typical slip at the point along each beam where the maximum slip occurred is shown in Fig. 11.
Slip was insignificant up to a horizontal shear stress of 1.5 to 2 MPa (220 to 290 psi). Thereafter, the horizontal shear stress increased with slip, up to a slip ranging from 0.3 to 0.8 mm (0.01 to 0.03 in.). The shear stress then decreased as the slip increased. All the beams except Beams 4 and 15, which failed in flexure, reached slips at failure which ranged from 2 to 7 mm (0.08 to 0.28 in.). There is little difference between the shear stress at a slip of 0.5 mm (0.2 in.) and the shear stress at peak load.
Stirrup Stresses
The slip curves in Fig. 11 show that the stirrups were not stressed until a horizontal shear stress of about 1.5 to 2 MPa (220 to 290 psi) was reached. This indicates the strength of an interface without stirrups. The stirrups become relatively effective when the shear stress reaches about 3 MPa (430 psi).
Fig. 12 shows the increase of stirrup strains with increasing slip. Each slip gauge was within 25 mm (1 in.) of the corresponding stirrup. At a slip of 0.13 mm (0.005 in.), a limit
PCI JOURNAL
8 -~
~ vl Cll d)
'"' .... Cf.l
'"' ~ d)
..c:: Cf.l -~ 4 -.... s::: 0 N ·c 0 :I:
2 -
Beam I Beam3
I I I I I I I
I I I I
------~-----~------~~----1 I I I ,'
: : : :1 I I I 11
I I 11 I 11
~
Beam 2 Beam 13 Beam 14
Slip (1 Division = 0.1 mm or 0.004")
Fig. 11 (a) . Typical slip curves for different test beams (Beams 1 through 6, 13 and 14).
~ ~
~ vl Cll
~ .... Cf.l
'"' ~ d)
..c:: Cf.l -~ .... s::: 0 N ·c 0 :I:
10 -~--~----~----~--~-----r----~----r---~-----r--~
2 -
I I I I I I I I I I I I
t----- r----- t -- - - -~------t-----~----- - t-----~------t----- -1 I I I I I I I
_ .j.__
I I I I I I I I I
-----t I I I I I I I
1 I I I I I I I I I I I I I I I I I I I I I I I I I I I I I I I I I I I I I I I I I I I I I I I I I I I I I I I I I I I I I I I
----1------.l-------1-------1--------1-------1--------1-------1--- - ---l I I I I I I I I I I I I I I I I I I I I I I I I I I I I I I I I I I I I I I I I I I I I I I I I I I I I ----+- --+-----+-----t-----;-~;,;:;.;_.,.~I ----4-,._..,_,_=~_.::.-;.-J-r~l::;t;::7;=--l I I I I I' 1
1 I
111
I I I I I I I I I : : I ,,..+! I I I, I I I I 1 I I I
I I I I I I I I : I I t-"' I 11 11 I
----- - - ---- ~ - ----1~-----}- ---:-----::-----r------1 11 I I I I
Beam7 earn 12 Beam9 Beam 10 earnS : Beam 16 IBeam 15 . I I I I
Slip (1 Division= 0.1 mm or 0.004")
Fig. 11 (b). Typical slip curves for different test beams (Beams 7 through 12, 15 and 16).
January-February 1994
1200
900
600
300
0
1200
900
600
300
0
57
0.00 4000
3000
= ..... ~
'"' ...... tl.l 0 '"' u .....
2000 :E c. E ..... ......
CZl
1000
0 ~---..----r----r----r----~--~----,----..----r----4 0.0 0.5
Slip, mm
Fig. 12. Typical sl ip-strain curves at the location of maximum slip in test beams.
Table 2. Physical properties of test beams.
Concrete strength,/; Cracked tra nsformed section
MPa properties Interface
Q ct l et Q ct Beam width, hv
kd 106 106 f ct b v No. mm
Web Flange mm3 mm4 106 mm-2 mm
I 75 42.7 37.4 109 2.39 611 52.2
2 75 39.2 34.9 102 2.09 545 51.1
3 75 40.2 30.5 113 2.54 636 53.3
4 75 39.6 34.7 119 2.84 688 55.0
5 75 42.6 34.8 102 2.09 545 51.1
6 75 40.4 37.1 101 2.04 533 51.0
7 75 38.0 35 .8 115 2.66 645 55.0
8 150 38.0 35.6 102 2.07 541 25.5
9 75 37.6 37 .1 109 2.36 594 53.0
10 150 37.6 38.7 108 2.32 585 26.4
11 300 34.0 32.7 123 3.04 778 13.0
12 75 36.2 34.6 123 3.00 717 55.7
13 150 23.7 19.2 123 3.01 745 27.0
14 150 20.2 19.6 122 3.00 740 27.0
15 150 51.5 44.0 105 2.2 1 558 26.4
16 150 50.7 48.3 103 2.13 540 26.3
Note: 1 mm = 0.0394 1n.; 1 MPa = 145 ps1.
58
1.0
suggested by Hanson/ stirrup stresses are still much lower than yield. At a slip of 0.5 rnm (0.02 in.), most stirrups with an f y less than about 420 MPa (60 ksi) can be expected to reach or be near yield. There is experimental evidence (Walraven29
) which indicates that reinforcement with a higher yield strength will not increase the shear strength proportionately.
The stirrups near the center of the span were not effective. They became increasingly effective with increasing distance from the center up to the edge of the end block. They were ineffective within the end block.
Calculation of Shear Stresses
Horizontal shear stresses were calculated using Eq. (7) with the cracked transformed section properties of the test beams. The values of Qc1 and let
for different beams are given in Table 2 along with kd, the depth to the neutral axis . The table also shows the
PCI JOURNAL

Table 3. Loads sustained by the test beams.
! Concrete Load, kN
Beam Pvfy I strength,!; At 0.13 At 0.5 At
No. MPa MPa mm slip mm slip failure
I 4.36 37.4 179 282 292
2 1.66 34.9 121 151 162
3 2.73
I
30.5 I 120 218 251
4 6.03 34.7 160 - * 289*
5 1.63 34.8 110 I 194 211
6 1.62 37. 1 110 192 201
7 6.06 35.8 160 307 331
8 0.77 35.6 178 220 238
9 1.62 37.1 131 167 171
10 0.77 37.6 181 256 256
II 0.40 32.7 306 384 386t
12 7.72 34.6 200 284 326
13 0.82 19.2 151 211 211
14:j: 0 .82 19.6 121 :j: 125:j: 137:j:
15 0.80 44.0
I 226 - * 294*
16 0.80 48.3 204 296 300*
All beams failed in horizontal shear except as noted. •Failed in flexure. tFailed in diagonal shear. :f:smoother joint surface. Note: 1 mm = 0.0394 in.; 1 MPa = 145 psi ; 1 kN = 0.225 kip.
2
Horizontal shear stress, vh
MPa
At 0.13 AtO.S I At
mm •lip ~ mm ''I £•"""_ 4 81 7 50 7 76
3.22 4.00 4 27
3.32 5.95 I 6.82
4.55 -* I
8.10*
2.95 5.08 5.54
2.95 5.04 5.25
4.55 8.57 9.25
2.35 2.89 3.12
3.59 4.54 I
4.64
2.46 3.46 3.46
2.04 2.55 2.57t
5.71 8.04 9.20
2.10 I 2.92 2.92
1.70:j: 1.76:j: 1.93:j:
3.04 -* 3.94*
2 .76 3.96 4.0 1*
quantity Qc/Ucrbv) used to convert the central point load into horizontal shear stresses. The test result for Beam 14 shows that, for a relatively smooth surface, the maximum shear stress is significantly lower than in the other beams.
Failure Capacities
Table 3 shows the loads sustained by each beam at a maximum slip of 0.13 mm (0.005 in.), 0.5 mm (0.02 in.) and at fai lure. Clamping stresses assuming that the stirrups had yielded and the fail ure modes are also shown. The concrete strength in the table is the concrete cylinder strength of the web or the flange, whichever is lower. The horizontal shear stresses include the self weight of the beams.
Fig. 13 summarizes the failure loads for Beams 1 to 12, which had a concrete strength of about 35 MPa (5000 psi) . Beam 4, which fai led in flex ure without any cracking at the interface, is
300 0 Present Test Results
0 4-----.-----~----r---~----~-----r-----r----~----.-----+, 0 0 2 4 6 8 10
Clamping Stress (Pv fy), MPa
Fig. 13. Comparison of present test results with different equations.
J a nuary-February 1994 59
0.1
0.0 0.0 0.1 0.2
0.1 + Pv fy stress in MPa f I
c
Fig. 14. Comparison of test results with suggested equation.
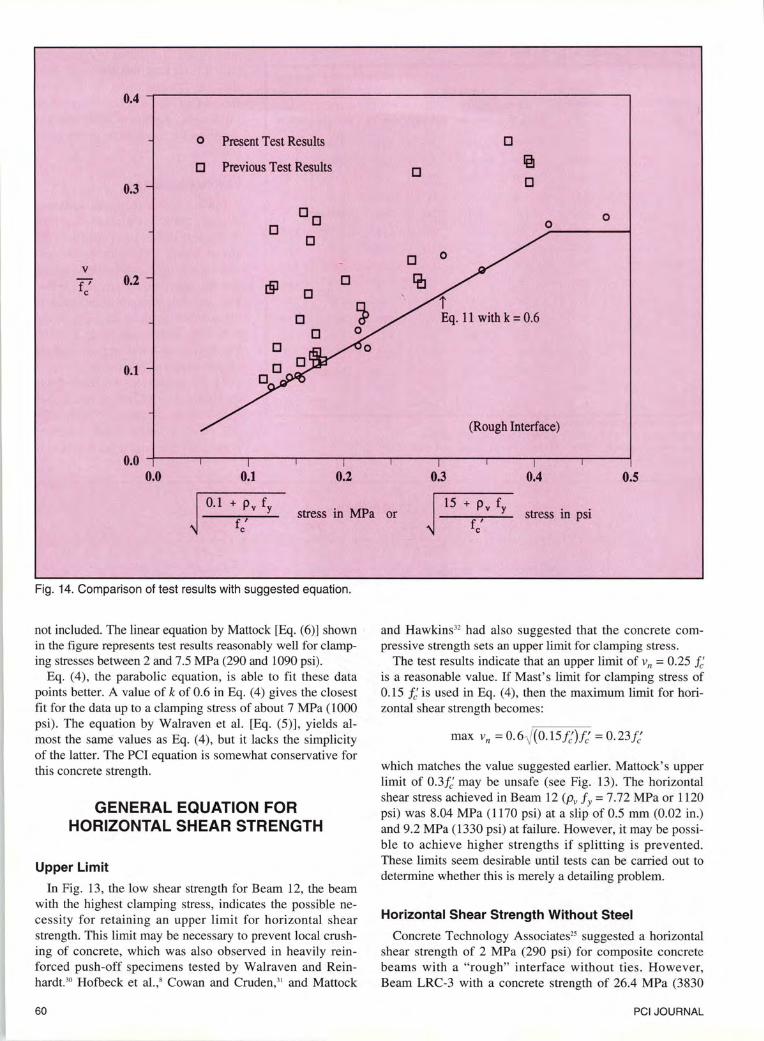
not included. The linear equation by Mattock [Eq. (6)] shown in the figure represents test results reasonably well for clamping stresses between 2 and 7.5 MPa (290 and 1090 psi).
Eq. (4), the parabolic equation, is able to fit these data points better. A value of k of 0.6 in Eq. (4) gives the closest fit for the data up to a clamping stress of about 7 MPa (1000 psi) . The equation by Walraven et al. [Eq. (5)], yields almost the same values as Eq. (4), but it lacks the simplicity of the latter. The PCI equation is somewhat conservative for this concrete strength.
GENERAL EQUATION FOR HORIZONTAL SHEAR STRENGTH
Upper Limit
In Fig. 13, the low shear strength for Beam 12, the beam with the highest clamping stress, indicates the possible necessity for retaining an upper limit for horizontal shear strength. This limit may be necessary to prevent local crushing of concrete, which was also observed in heavily reinforced push-off specimens tested by Walraven and Reinhardt.30 Hofbeck et al.," Cowan and Cruden,3' and Mattock
60
(Rough Interface)
0.3 0.4 0.5
15 + Pv fy or stress in psi f I
c
and Hawkins32 had also suggested that the concrete compressive strength sets an upper limit for clamping stress.
The test results indicate that an upper limit of vn = 0.25 fd is a reasonable value. If Mast's limit for clamping stress of 0.15 fd is used in Eq. (4), then the maximum limit for horizontal shear strength becomes:
max vn = 0.6~(0 . 15/;)J; = 0.23J;
which matches the value suggested earlier. Mattock's upper limit of 0.3fd may be unsafe (see Fig. 13). The horizontal shear stress achieved in Beam 12 (Pv f y = 7.72 MPa or 1120 psi) was 8.04 MPa (1170 psi) at a slip of 0.5 mm (0.02 in.) and 9.2 MPa (1330 psi) at failure. However, it may be possible to achieve higher strengths if splitting is prevented. These limits seem desirable until tests can be carried out to determine whether this is merely a detailing problem.
Horizontal Shear Strength Without Steel
Concrete Technology Associates25 suggested a horizontal shear strength of 2 MPa (290 psi) for composite concrete beams with a "rough" interface without ties. However, Beam LRC-3 with a concrete strength of 26.4 MPa (3830
PCI JOURNAL

0.5
c Mattock and Others
)( Paulay, et al.
0.4 ~
0.3 IJ
IJ IJ
v I' c 0.2
0.1
0.0 0.0 0.2 0.4
IJ
~ c IJ c
c IJ C
c
c
k =0.6
A= 1.0
0.6
c c
Eq. 12
0.8
stress in MPa or stress in psi
Fig. 15. Comparison of the suggested equation with results of uncracked push-off tests (normal density).
psi), included in the same bulletin, failed in horizontal shear at 1.08 MPa (157 psi). In the current study, Beams 8, 11, 13, 14 and 16 had slipped slightly before a stress of 2 MPa (290 psi) was reached.
The horizontal shear strength of composite beams without stirrups can be approximated as:
Vno = 0. 6.,)0.1// (MPa)
VItO = 0. 6-)15 1: (psi) (10)
For 35 MPa (5000 psi) concrete, vno becomes 1.12 MPa ( 160 psi) . This is less than the horizontal shear stress at commencement of slip. It is about the same as the value recommended in the CTA Bulletin25 for "rough" joints in unsupervised construction. A cautious approach is warranted because the surface roughness plays a major role in providing the necessary horizontal shear strength. This aspect was made particularly evident by the results from Beam 14, which indicated a much lower capacity because of inadequate roughness.
Suggested General Equation To provide a continuous curve, Eq. (4) and Eq. (10) can
be combined:
January-February 1994
vn = k~(O . l+pv fy )J; ~0. 25f/ (MPa)
vn =k~(15+pvfy )J; ~0 . 25f/ (psi)
(11)
Results with various concrete strengths can be compared more clearly by plotting them in a dimensionless form as in Fig. 14 because Eq. (11) is then a straight line. In this figure, the test results of this study (except for Beams 4 and 14) are plotted as circles and previous studies are plotted as squares. The test res ults correspond to failure load. Concrete strengths for these test beams ranged from 17.2 to 48.3 MPa (2500 to 7000 psi).
Eq. (11), with k = 0.6, is a good lower bound for this range of concrete strengths. The inclusion of the additive term (0.1 MPa or 15 psi) in the radical sign avoids the discontinuities in the present codes at low clamping stresses. For higher clamping stresses, the effect of the additive term is negligible.
Eq. (11) was based on the beam tests of this study. This equation can be further generalized as:
vn = kA~(0.1 + Pvfy )!/ ~ 0. 25 f / (MPa)
v" = kA- ~(15 + Pvfy )!; ~ 0. 25 J; (psi) (12)
61

0.5
0.4
0.3
0 Mattock and Others
x Paulay, et al.
o Walraven, et al.
• Hanson
+ Anderson
+
0 + +
c 0 0
0 0
+ 0 0
++ o 0o B o 0 o
0 0
0 9!~0 + X 0
0 0
0 ~9:1
0
0
v
T' + O'ffi!+O c 0.2 0
Eq. l2
0~ +
+ +
0.1 k = 0.5
A= 1.0
0.0 0.0 0.2 0.4 0.6 0.8
0.1 + Pv fy 15 + Pv fy stress in MPa or stress in psi f I f I
c c
Fig. 16. Comparison of the suggested equation with the results of cracked push-off tests (normal density).
For routine designs, it is desirable to use a slightly lower shear strength to allow for the possibility of smoother interfaces. Therefore, for composite construction, a factor of 0.5 for k is suggested. For monolithic construction, there is no joint at the shear interface. Therefore, the additional level of safety to account for the possible variation in roughness is not warranted and the value of k can be kept as 0.6. The factor A. varies for lightweight concrete as indicated in Eq. (3).
Comparison With Push-off Tests
Several sets of results of push-off tests available from other studies are compared with the suggested general equation. The results plotted in Figs. 15 to 17 are from the following publications:
62
(a) Anderson's (b) Hanson3
(c) Hoefbeck, Ibrahim and Mattocks (d) Mattock and Hawkins32
(e) Paulay, Park and Phillips33
(f) Mattock, Li and Wang20
(g) Walraven, Frenay and Pruijssers '6
The test results from Refs. 8, 20 and 32 are referred to as
Mattock and others in Figs. 15 and 16. Fig. 15 shows a comparison of Eq. (12) with push-off test
results for uncracked normal density concrete. Fig. 16 was similarly plotted for an initially cracked condition and for specimens fabricated with the two parts cast at different times. In both of these situations, Eq. (12) is a lower bound for almost all the test results.
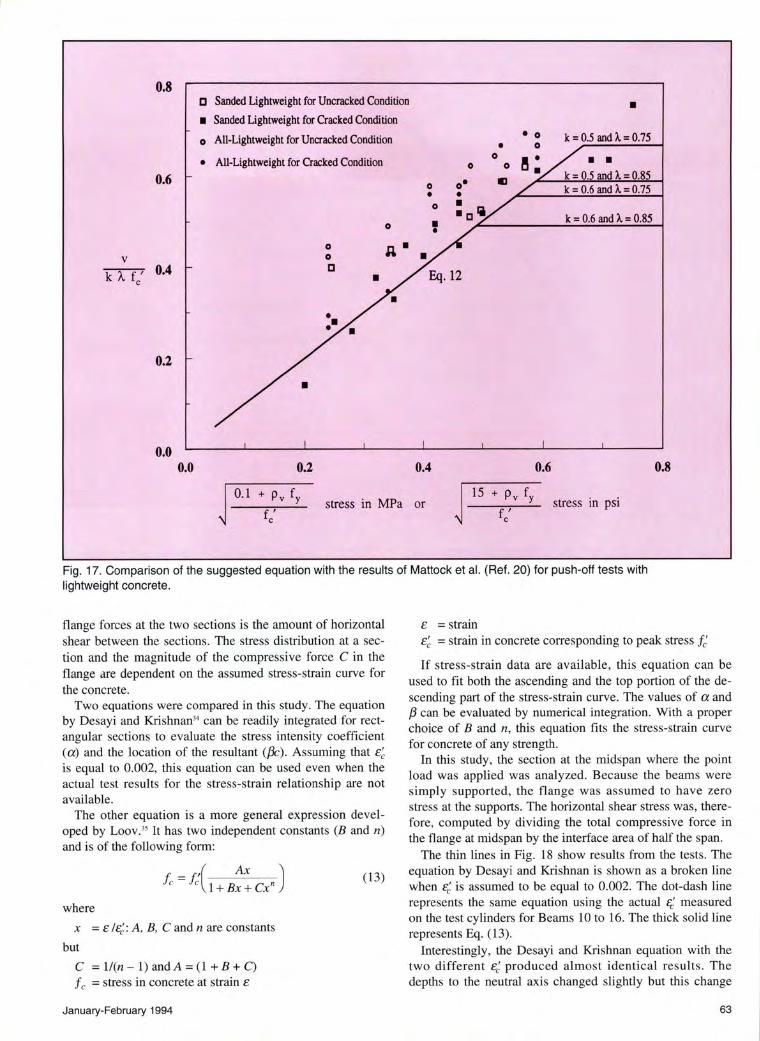
The test data dealing with the shear transfer strength of lightweight concrete are limited. The applicability of Eq. (12) to such cases was examined using the results of tests conducted by Mattock et al.20 Their test results are compared with Eq. (12) in Fig. 17. Even though Eq. (12) underestimates strength for the initially uncracked condition, it represents the test results reasonably well for a cracked condition.
COMPUTATION OF HORIZONTAL SHEAR STRESS
Horizontal Shear Stress by Equilibrium
The average horizontal shear stress can be evaluated using Eq. (8) if the stresses in the flange at two sections distant fv
from each other are known . The difference between the
PCI JOURNAL
0.8 c Sanded lightweight for Uncracked Condition
• Sanded lightweight for Cracked Condition
0 All-Lightweight for Uncracked Condition
• All-Lightweight for Cracked Condition
0.6
0
0 a• v 0
k A fc' 0.4 tl
0.2
•
0.0 0.0 0.2
0
• 0
• •
0.4
• 0 • 0
0 0 0
0.6
• k = 0.5 and A.= 0.75
• • k = 0.5 and A.= 0.85 k = 0.6 and A.= 0.75
k = 0.6 and A.= 0.85
0.8
stress in MPa or stress in psi
Fig. 17. Comparison of the suggested equation with the results of Mattock et al. (Ref. 20) for push-off tests with lightweight concrete.
flange forces at the two sections is the amount of horizontal shear between the sections. The stress distribution at a section and the magnitude of the compressive force C in the flange are dependent on the assumed stress-strain curve for the concrete.
Two equations were compared in this study. The equation by Desayi and Krishnan34 can be readily integrated for rectangular sections to evaluate the stress intensity coefficient (a) and the location of the resultant ({3c) . Assuming that £~ is equal to 0.002, this equation can be used even when the actual test results for the stress-strain relationship are not available.
The other equation is a more general expression developed by Loov.35 It has two independent constants (B and n) and is of the following form:
f c = J:(l + B:: Cxn )
where
x = t: IC::: A, B, C and n are constants
but
C = ll(n- 1) and A= (1 + B +C) f c =stress in concrete at strain t:
January-February 1994
(13)
t: =strain t:~ = strain in concrete corresponding to peak stress f; If stress-strain data are available, this equation can be
used to fit both the ascending and the top portion of the descending part of the stress-strain curve. The values of a and f3 can be evaluated by numerical integration. With a proper choice of B and n, this equation fits the stress-strain curve for concrete of any strength.
In this study, the section at the midspan where the point load was applied was analyzed. Because the beams were simply supported, the flange was ass umed to have zero stress at the supports. The horizontal shear stress was, therefore , computed by dividing the total compressive force in the flange at midspan by the interface area of half the span.
The thin lines in Fig. 18 show results from the tests. The equation by Desayi and Krishnan is shown as a broken line when C:: is assumed to be equal to 0.002. The dot-dash line represents the same equation using the actual ~ measured on the test cylinders for Beams 10 to 16. The thick solid line represents Eq. (13) .
Interestingly, the Desayi and Krishnan equation with the two different t:~ produced almost identical results. The depths to the neutral axis changed slightly but this change
63

40
Beam 10 ... "'
......
5000 ......... ,,' , ,
30 , , , , ,
4000 , , , , I .....
~ I <IJ
0.. I 0.. I
~ I v) I 3000 v) 20 <IJ ~
<IJ ..... ~ Curves from Tests
...... ..... --- Cl) ....
Cl)
-·-·- Eq. by Desayi and Krishnan with Ec' = 2000 liE 2000
------ Eq. by Desayi and Krishnan with Actual Ec' 10
Eq. 13 1000
0 ~------~------,--------~------,--------.------~r-------~1 0 0 500 1000 1500 2000 2500 3000 3500
Micro Strain
Fig. 18. Stress-strain curves from tests compared with theoretical curves (typical).
did not significantly alter the compressive force in the flanges . The two sets of results were within 2 percent of each other. These results, in tum, were found to be within 2 percent of the results computed using Eq. (7).
The stress-strain data from cylinder tests were fitted using Eq. (13). The horizontal shear stresses calculated using this equation were also found to be within 2 percent of the results obtained by Eq. (7).
Horizontal Shear Stresses by Approximate Method
The approximate method of Eq. (9) underestimated the ·shear stresses by 10 to 15 percent as compared to the other two methods. This is understandable since d in the denominator of this equation should actually be (d - f3c), which could be approximated as 0.9d for many circumstances.
Comparison of the Methods
The elastic method and the equilibrium method predicted the same horizontal shear stresses for the beams tested . Since a designer may not have the required time and computer programs to conduct a detailed section by section analysis, it will often be more convenient to use the elastic formula. If a detailed analysis is to be carried out, either the equation by Desayi and Krishnan or Eq. (13) may be used.
The horizontal shear stress determined using the approximate formula [Eq. (9)] should be multiplied by 1.15 for a quick estimate of the shear stresses.
64
The results obtained using the equilibrium equation for beams with uniform loads, which have a uniformly varying Vu, can be quite different depending on the care taken in the analysis. The computed shear stress is correct for the point midway between the two sections used. For short distances between sections, the equilibrium procedure shows the correct variation of stress along the span. Unfortunately, the equilibrium method is often used carelessly. If the entire distance from midspan to the end is used, the stress which is found is correct at the quarter point but is only half the peak value expected at the end.
CONCLUSIONS 1. Elastic analysis using cracked transformed section
properties appears to be the simplest and most practical method for estimating the horizontal shear stresses in composite concrete beams at failure.
2. The general equation suggested in this study [Eq. (12)] represents the test results far better than previous shear-friction equations. This equation is equally applicable to sanded lightweight concrete and all-lightweight concrete. For a concrete strength exceeding about 30 MPa (4350 psi), Eq. (12) will result in designs with less stirrup reinforcing than those obtained using the current ACI or PCI equations.
3. Because an as-cast concrete surface with coarse aggregate left protruding from the surface can develop sufficient horizontal shear resistance, more elaborate finishing is not required.
PCI JOURNAL

4. Slip and stirrup stresses in the test beams were insignificant until the beam attained a horizontal shear stress of about 1.5 to 2 MPa (220 to 290 psi).
5. Large slips and separation observed in the test beams at failure support the shear-friction theory, but the use of the shear-friction theory with steel stresses of fy along with a limiting slip of 0.13 mm (0.005 in.) is inconsistent because stirrups do not yield at such a small slip.
6. A slip of 0.5 mm (0.02 in.) can be expected at factored loads if stirrups are provided as determined using Eq. (12). Such a slip is likely to yield the stirrups if the yield strength is less than about 440 MPa (64 ksi).
7. The effectiveness of stirrups is improved when they are placed further from the center of the span, but stirrups in the region near the supports are not effective.
8. The flange splitting observed in Beam 12 probably resulted from the lack of horizontal reinforcing steel in the bottom of the flange. It is possible that this premature failure has falsely indicated a lower shear strength than the true limit which could be reached in a properly detailed beam.
RECOMMENDATIONS 1. Investigate horizontal shear stresses only between the
points at a distance equal to the effective depth d from the
edge of the supports. 2. Compute horizontal shear stresses at failure using:
Vuh = VuQc/(/ctbv)
3. Use Eq. (12) as a replacement for the four ACI equations being used for clamping stresses in the range from 0 to 5.5 MPa (0 to 800 psi).
4. Limit horizontal shear stresses to 0.25 J; unless further research can verify that top flanges detailed as in Recommendation 5 can support larger stresses.
5. Provide transverse bottom reinforcement in the top flange unless there is sufficient transverse bending to ensure a lateral compression sufficient to prevent vertical cracking.
6. For precast concrete girders, use an as-cast top surface and a concrete mix designed so that, after vibration, coarse aggregate is firmly imbedded but protrudes from the surface as illustrated in Fig. 5.
7. Revise ACI 318-92 and ACI 318M-92 in accordance with the suggestions in Appendix B.
ACKNOWLEDGMENT The financial support provided by the Natural Sciences
and Engineering Research Council of Canada is gratefully acknowledged.
REFERENCES
1. ACI Committee 318, "Building Code Requirements for Reinforced Concrete (ACI 318-M92)," American Concrete Institute, Detroit, Ml, 1992.
2. ACI-ASCE Committee 333, "Tentative Recommendations for Design of Composite Beams and Girders for Building," ACI Journal, V. 57, No. 12, December 1960, pp. 609-628.
3. Hanson, N. W., "Precast-Prestressed Concrete Bridges - 2. Horizontal Shear Connections," Journal PCA Research and Development Laboratories, V. 2, No.2, 1960, pp. 38-58; also PCA Development Department Bulletin D35, 1960, 21 pp.
4. Kaar, P. H., Kriz, L. B., and Hognestad, E., "Precast-Prestressed Concrete Bridges - 1. Pilot Tests of Continuous Girders," Journal PCA Research and Development Laboratories, V. 2, No. 2, May 1960, pp. 21-37; also PCA Development Department Bulletin D34, 1960, 17 pp.
5. Birkeland, P. W., and Birkeland, H. W., "Connections in Precast Concrete Construction," ACI Journal, V. 63, No. 3, March 1966, pp. 345-367.
6. Mast, R. F, "Auxiliary Reinforcement in Concrete Connections," ASCE Journal, V. 94, No. ST6, June 1968, pp. 1485-1504.
7. Kriz, L. B., and Raths, C. H., "Connections in Precast Concrete Structures - Strength of Corbels," PCI JOURNAL, V. 10, No. I, February 1965, pp. 16-61.
8. Hofbeck, J. A., Ibrahim, I. 0., and Mattock, A. H., "Shear Transfer in Reinforced Concrete," ACI Journal, V. 66, No. 2, February 1969, pp. 119-128.
9. Saemann, J. C., and Washa, G. W., "Horizontal Shear Con-
January-February 1994
nections Between Precast Beams and Cast-in-Place Slabs," ACI Journal, V. 61, No. 11, November 1964, pp. 1383-1408. Discussion, V. 62, No.6, June 1985, pp. 1807-1810.
10. Nosseir, S. B., and Murtha, R.N., "Ultimate Horizontal Shear Strength of Prestressed Split Beams," Technical Report NCEL-TR707, Naval Civil Engineering Laboratory, Port Hueneme, CA, January 1971,43 pp. Available as AD-717 352 from National Technical Information Service (NTIS), Springfield, VA.
II. Mattock, A. H., Johal, L., and Chow, H. C., "Shear Transfer in Reinforced Concrete With Moment or Tension Across the Shear Plane," PCI JOURNAL, V. 20, No. 4, July-August 1975, pp. 76-93.
12. Raths, C. H., Reader Comments on "Design Proposals for Reinforced Concrete Corbels" by Mattock, A. H., PCI JOURNAL, V. 22, No.2, March-April1977, pp. 93-98.
13. Loov, R. E., "Design of Precast Connections," Paper presented at a seminar organized by Compa International Pte, Ltd., September 25-27, 1978, Singapore, 8 pp.
14. Shaikh, A. F., "Proposed Revisions to Shear-Friction Provisions," PCI JOURNAL, V. 23, No. 2, March-April 1978, pp. 12-21.
15. PC/ Design Handbook- Precast and Prestressed Concrete, Fourth Edition, Precast/Prestressed Concrete Institute, Chicago, IL, 1992, 528 pp.
16. Walraven, J., Frenay, J., and Pruijssers, A., "Influence of Concrete Strength and Load History on the Shear Friction Capac-
65

ity of Concrete Members," PCI JOURNAL, V. 32, No. 1, January-February 1987, pp. 66-84. Reader Comments, V. 33, No. 1, January-February 1988, pp. 166-168.
17. Patnaik, A. K., "Horizontal Shear Strength of Composite Concrete Beams With a Rough Interface," Ph.D. Thesis, Department of Civil Engineering, The University of Calgary, Calgary, Alberta, Canada, December 1992.
18. Anderson, A. R., "Composite Designs in Precast and Cast-inPlace Concrete," Progressive Architecture, V. 41, No. 9, September 1960, pp. 172-179.
19. Mattock, A. H., "Shear Transfer in Concrete Having Reinforcement at an Angle to the Shear Plane," Shear in Reinforced Concrete, ACI Special Publication SP-42, V. 1, American Concrete Institute, Detroit, MI, 1974, pp. 17-42.
20. Mattock, A. H., Li, W. K., and Wang, T. C., "Shear Transfer in Lightweight Reinforced Concrete," PCI JOURNAL, V. 21, No. 1, January-February 1976, pp. 20-39.
21. Grossfield, B., and Birnstiel, C., "Tests ofT -Beams With Precast Webs and Cast-in-Place Flanges," ACI Journal, V. 59, No.6, June 1962, pp. 843-851.
22. Mattock, A. H., and Kaar, P. H., "Precast-Prestressed Concrete Bridges - 4. Shear Tests of Continuous Girders," Journal PCA Research and Development Laboratories, V. 3, No. 1, January 1961, pp. 19-46, also PCA Development Department Bulletin D45, 1961, 29 pp.
23. Evans, R. H, and Chung, H. W., "Horizontal Shear Failure of Prestressed Concrete T-Beams With Cast-in-Situ Lightweight Concrete Deck," Concrete, V. 3, No. 4, April 1969, pp. 124-126.
24. Hsu, T. T. C. "Horizontal Shear Tests of PSI Prestressed Composite Beams," Report to Prestressed Systems Inc., August 1976.
25. CTA 76-B4, "Composite Systems Without Ties," Technical Bulletin 76-B4, Concrete Technology Associates, Tacoma, WA, Aprill976.
26. CAN3-A23.3-M84, 1984, "Design of Concrete Structures for Buildings," Canadian Standards Association, Rexdale, Ontario, Canada.
27. Mattock, A. H., "Anchorage of Stirrups in a Thin Cast-inPlace Topping," PCI JOURNAL, V. 32, No.6, NovemberDecember 1987, pp. 70-85.
28. Johnson, R. P., Van Dalen, K., and Kemp, A. R., "Ultimate Strength of Continuous Composite Beams," Structural Steel Work: Research and Development, Conference of the British Constructional Steelwork Association, September 1966, 9 pp.
29. Walraven, J. C., "Combining Precast and Cast-in-Situ Concrete," Progress in Concrete Research Annual Report-1991, V. 2, Delft University of Technology, Faculty of Civil Engineering, Delft, The Netherlands, 1991, pp. 101-111.
30. Walraven, J. C., and Reinhardt, H. W., "Theory and Experiments on the Mechanical Behaviour of Cracks in Plain and Reinforced Concrete Subjected to Shear Loading," Heron, V. 26, No. lA, 1981.
31. Cowan, J., and Cruden, A. F., "Second Thoughts on Shear Friction," Concrete, V. 9, No.8, August 1975, pp. 31-32.
32. Mattock, A. H., and Hawkins, N. M., "Shear Transfer in Reinforced Concrete - Recent Research," PCI JOURNAL, V. 17, No.2, March-Aprill972, pp. 55-75.
33. Paulay, T., Park, R., and Phillips, M. H., "Horizontal Construction Joints in Cast-in-Place Reinforced Concrete," Shear in Reinforced Concrete, ACI Special Publication SP-42, V. 2, American Concrete Institute, Detroit, MI, 1974, pp. 599-616.
34. Desayi, P., and Krishnan, S., "Equation for the Stress-Strain Curve of Concrete," ACI Journal, V. 61, No.3, March 1964, pp. 345-350.
35. Loov, R. E., "A General Stress-Strain Curve for Concrete -Implications for High Strength Concrete Columns," Proceedings of the Annual Conference of the Canadian Society for Civil Engineering, Vancouver, British Columbia, Canada, V. II, May 1991, pp. 302-311.
Note: Discussion of this paper is invited. Comments must be confined to the scope of the article. The deadline for receipt of discussion comments is June 1, 1994.
66 PCI JOURNAL
APPENDIX A - NOTATION
a = depth of equivalent rectangular stress block
A =constant in Loov's concrete stress-strain equation =l+B+C
Avf = area of reinforcement crossing the interface within a distances
B =constant in Loov's concrete stress-strain equation
bv = width of cross section at contact surface
c = depth to neutral axis
C = total compressive force in flange of beam
C = constant in Loov's concrete stress-strain equation =1/(n-1)
C1,C2 = constants in equation by Walraven et al. in MPa
C3,C4 = constants in equation by Walraven et al. in psi
d = effective depth
Ec = modulus of elasticity of concrete
fc = stress in concrete at strain £
f: = compressive strength of weaker of flange or web concrete
f Y = specified yield strength of reinforcement
I = moment of inertia of entire cross section
Jet = moment of inertia of cracked transformed section
k = constant in parabolic equation
kd = depth to neutral axis in elastic analysis
£, =length of interface effective in transferring horizontal shear
M = bending moment at location under consideration
January-February 1994
n = constant in Loov's concrete stress-strain equation
Q = first moment of area of portion above level under consideration with respect to neutral axis of section
Qcr = Q for cracked transformed section
s = longitudinal spacing of stirrups
V = shear force at section
v = shear stress
vh = horizontal shear stress
vn =nominal shear strength
Vna = ultimate shear strength of an interface without stirrups
Vu = factored shear force at section
vuh = factored horizontal shear stress
x = ratio of t: and t;: a = stress intensity coefficient
{3 = location of the resultant coefficient
t: =strain
t;: = strain in concrete corresponding to peak stress f: A, = correction factor related to concrete density
J1 = coefficient of friction
Jle = equivalent coefficient of friction in PCI equation
Pv = steel ratio = Avf lbvS
Pvfy = reinforcement index or reinforcement parameter
an = externally applied normal stress
cf> = capacity reduction factor
67
APPENDIX 8 - SUGGESTED REVISIONS TO ACI CODE
Section 11.1 and Section 17.5 of ACI 318-M92 deal with design requirements for shear transfer and horizontal shear in composite concrete beams.
11.0- Added Notation: k = factor in shear-friction equations Pv = AvtfAc is ratio of area of reinforcing steel crossing
shear interface to area of shear interface
11.7- Shear-Friction
11.7.1 to 11.7.3 No changes
11.7.4- Shear-friction design method for rough surfaces Clauses 11. 7.4.1 to 11.7 .4.3 apply when concrete is
placed monolithically or when concrete is placed against a rough hardened concrete surface which is clean and free of laitance with the coarse aggregate protruding but firmly fixed in the matrix.
11.7.4.1 - When shear-friction reinforcement is perpendicular to the shear plane, shear strength vn shall be computed by:
(11-26a)
where
(a) k = 0.6 for concrete placed monolithically (b) k = 0.5 for concrete placed against hardened concrete
with a rough surface
fd is the specified compressive strength of the concrete with the lowest strength adjacent to the interface, psi, and A is 1.0 for normal density concrete, 0.85 for "sand-lowdensity" concrete and 0.75 for "all low-density concrete. Linear interpolation is permitted when partial sand replacement is used.
11.7.4.2 - When shear-friction reinforcement is inclined to the shear plane such that the shear force produces tension in shear-friction reinforcement, shear strength vn shall be computed by:
(11-26b)
11.7 .4.3 - Shear strength Vn shall not be taken greater than 0.25 fd Ac nor 1150 Ac in pounds, where Ac is area of concrete section resisting shear transfer in square inches.
11.7.5 - Shear-friction design for surfaces which are not rough
Clauses 11.7.5.1 to 11.7.5.3 apply when concrete is placed against steel or against concrete which does not conform to Clause 11.7 .4.
11.7.5.1 - When shear-friction reinforcement is perpendicular to the shear plane, shear strength vn shall be computed by:
(11-27a)
where
68
(a) 11 = 0.6A for concrete placed against hardened concrete, which is clean and free of laitance but not rough (see Clause 11.7.4)
(b) 11 = 0. 7 A for concrete anchored to as-rolled structural steel, which is clean and free of paint, by headed studs or by reinforcing bars
11.7.5.2 - When shear-friction reinforcement is inclined to the shear plane, such that the shear force produces tension in shear-friction reinforcement, shear strength vn shall be computed by:
(11-27b)
11.7.5.3 - Shear strength Vn shall not be taken greater than 0.2 fd Ac nor 800 Ac in pounds, where Ac is area of concrete section resisting shear transfer.
11.7.6 to 11.7.8 No changes
11.7.9 -11.7.10 Delete
CHAPTER 17- COMPOSITE CONCRETE FLEXURAL MEMBERS
Added Notation
a = depth of equivalent rectangular stress block fd = specified compressive strength of concrete let = moment of inertia of cracked transformed com
posite section neglecting the area of concrete in tension
Qct = statical moment of transformed area outside of contact surface about neutral axis of composite section
vnh = nominal horizontal shear strength at section vuh = horizontal shear stress at section due to factored
loads
17.5 - Horizontal Shear
17.5.1 No changes
17.5.2- Horizontal shear stress 17.5.2.1 -For prismatic members, except as provided in
Clause 17.5.2.2, the nominal horizontal shear stress along the interface due to factored loads shall be computed as:
V,Qct vh=--u [ctbv
(17-1)
17.5.2.2- Horizontal shear may be investigated by computing the actual change in compressive or tensile force in any segment, and provisions made to transfer that force as horizontal shear to the supporting element. For prismatic members, when the entire compression force is in the flange, the horizontal shear stress due to factored loads may be taken as:
(17-2)
Note: If shear stress is calculated based on change of force in any segment, care must be taken to use sufficiently short segments so that the variation of stress along the beam is determined.
PCI JOURNAL
17.5.2.3 -For bottom supported members, horizontal shear stresses need be investigated only between points at a distance equal to the effective depth d from the edge of the supports of the beam. Stirrups in the end zone shall be at the same spacing as that required at distance d.
17 .5.3 - Horizontal shear strength Members shall be designed so that l/J vnh ~ Vuh where Vuh is
factored horizontal shear stress at section considered and vnh
is nominal horizontal shear strength in accordance with the following provisions.
17.5.3.1- When no ties are provided but contact surfaces are clean, free of laitance and rough, the nominal horizontal shear strength vnh shall not be greater than 1. 8A. m.
J; is the specified compressive strength of the concrete with the lowest strength adjacent to the interface.
When the factored horizontal shear stress vuh at the section being considered exceeds 1.8¢A-{7!, design for horizontal shear shall be in accordance with Clause 11.7 .4.
17.5.3.2- When minimum ties are provided in accordance with Clause 17 .5.4 and contact surfaces are clean and free of laitance, but not rough (see Clause 11.7.4), horizon-
January-February 1994
tal shear strength vnh shall not be taken greater than 80 psi. When the factored horizontal shear stress vuh at the sec
tion being considered exceeds 80 psi, design for horizontal shear shall be in accordance with Clause 11.7.5.
17.5.3.3- Same as current Clause 17.5.4 (except revise 17.6 to 17.5.4)
17.5.4- Ties for horizontal shear
17.5.4.1 to 17.5.4.3- Same as current Clauses 17.6.1 to 17.6.3
CONVERSION TO Sl UNITS
Section 11.7.4.1 and 11.7.4.2 "15" becomes "0.1" in Eq. (11-26).
Section 11.7.4.3 "1150 Ac in pounds" becomes "8 Ac in newtons" where Ac is in mrn2
•
Section 11.7.5.3 "0.2 J;Ac nor 800 Ac in pounds" becomes "0.2 J;Ac nor 5.5 Ac in newtons."
Section 17.5.3.1 "1.8,1,{11" becomes "0.15kvf;."
Section 17.5.3.2 "80 psi" becomes "0.6 MPa."
69