hormetic shifting of redox environment by pro-oxidative ... · hormetic shifting of cellular...
TRANSCRIPT

Hormetic Shifting of Redox Environment
by Pro-Oxidative Resveratrol Protects Cells Against Stress
Annabell Plauth1, Anne Geikowski1, Susanne Cichon1, Silvia J. Wowro1, Linda
Liedgens1, Morten Rousseau1, Christopher Weidner1, Luise Fuhr1, Magdalena Kliem1,
Gail Jenkins2, Silvina Lotito2, Linda J. Wainwright2, Sascha Sauer1,3*
Affiliations 1 Otto Warburg Laboratory, Max Planck Institute for Molecular Genetics, 14195
Berlin, Germany. 2 Unilever R&D, Colworth Science Park, Sharnbrook, Bedfordshire, MK44 1LQ, UK. 3 University of Würzburg, CU Systems Medicine, Josef-Schneider-Straße 2, Building
D15, 97080 Würzburg, Germany
Contact:
Sascha Sauer Otto Warburg Laboratory Max Planck Institute for Molecular Genetics Ihnestrasse 63-73, 14195 Berlin, Germany
1
.CC-BY-ND 4.0 International licensenot peer-reviewed) is the author/funder. It is made available under aThe copyright holder for this preprint (which was. http://dx.doi.org/10.1101/045567doi: bioRxiv preprint first posted online Mar. 24, 2016;
.CC-BY-ND 4.0 International licensenot peer-reviewed) is the author/funder. It is made available under aThe copyright holder for this preprint (which was. http://dx.doi.org/10.1101/045567doi: bioRxiv preprint first posted online Mar. 24, 2016;
.CC-BY-ND 4.0 International licensenot peer-reviewed) is the author/funder. It is made available under aThe copyright holder for this preprint (which was. http://dx.doi.org/10.1101/045567doi: bioRxiv preprint first posted online Mar. 24, 2016;
.CC-BY-ND 4.0 International licensenot peer-reviewed) is the author/funder. It is made available under aThe copyright holder for this preprint (which was. http://dx.doi.org/10.1101/045567doi: bioRxiv preprint first posted online Mar. 24, 2016;

ABSTRACT
Resveratrol has gained tremendous interest owing to multiple reported health-
beneficial effects. However, the underlying key mechanism of action of resveratrol
remained largely controversial. Here, we demonstrate that under physiologically
relevant conditions major biological effects of resveratrol can be attributed to the
generation of oxidation products such as reactive oxygen species (ROS). At low
hormetic concentrations (< 50 µM), treatment with resveratrol increased cell viability
in a set of representative cell models, whereas application of quenchers of ROS
completely truncated these beneficial effects. Notably, application of resveratrol led
to mild, Nrf2-specific cellular gene expression reprogramming. For example, in
primary human epidermal keratinocytes this resulted in a 1.3-fold increase of
endogenous metabolites such as gluthathione (GSH) and subsequently in a
quantitative reduction of the cellular redox environment by 2.61 mV mmol GSH (g
protein)-1. In particular in resveratrol pre-treated cells, after external application of
oxidative stress by using 0.8 % ethanol, endogenous ROS generation was
consequently reduced by 24 %. In contrast to the common perception that resveratrol
acts mainly as a chemical antioxidant or as a target protein-specific ligand, we
propose that effects from resveratrol treatment are essentially based on oxidative
triggering of cells. In relevant physiological microenvironments this effect can lead to
hormetic shifting of cellular defence towards a more reductive state to improve
resilience to oxidative stress in a manner that can be exactly defined by the redox-
environment of the cell.
2
.CC-BY-ND 4.0 International licensenot peer-reviewed) is the author/funder. It is made available under aThe copyright holder for this preprint (which was. http://dx.doi.org/10.1101/045567doi: bioRxiv preprint first posted online Mar. 24, 2016;

Introduction
Polyphenols represent a large collection of natural products featuring health-
beneficial effects 1. Resveratrol (3,5,4'-trihydroxy-trans-stilbene, RSV), an
antimicrobial phytoalexin originally found in white hellebore (Veratrum grandiflorum
O Loes) and later in red grapes and other plants, is one of the most prominent
polyphenols. Early studies indicated cancer chemo-preventive properties of RSV 2.
Over the last 15 years, numerous studies claimed additional benefits including cardio-
protective and anti-aging effects 3. Consequently, a number of products based on RSV
have been developed for dietary and dermatological application 4,5. Nevertheless, the
efficiencies of RSV treatments and underlying mechanisms of action remained largely
controversial. For example, RSV had been suggested to modulate estrogen receptor
activity 6, or act as a caloric mimetic by directly increasing the enzymatic activity of
the histone deacetylase sirtuin 1 (SIRT1) 7. Recently, it was shown that inhibition of
phosphodiesterase 4 (PDE4) by RSV increased intracellular amounts of the hunger
signalling molecule cAMP 8. Notably, the reported interaction of RSV with these and
further target proteins were in many cases low and unspecific (mostly in the mid
micromolar range). In general, most of these studies assumed a proportional dose-
response relationship of compounds, i.e. a conventional pharmacological (linear)
threshold model 9.
However, in contrast to the standard pharmacological model, hundreds of studies
reported (unconsciously) beneficial effects of RSV at “low” but detrimental outcomes
at “high” doses. Nevertheless, this potentially counterintuitive bi-phasic property of
RSV was widely ignored 10. The large body of these data would hint to hormesis, a
dose-response relationship that is characterized by low-dose stimulation and high-
dose inhibition, consistent with the Arndt-Schulz law, Hueppe’s rule and other terms
describing a beneficial stimulation (of poisons) at low doses 11,12. General acceptance
of the hormesis concept for therapeutic application seems to remain low, due to the
generally low stimulatory effects and particularly due to an often lacking mechanistic
explanation of the underlying mode of action of so-called hormetic compounds.
Interestingly, polyphenols including RSV are considered as antioxidants. But
depending on the chemical context RSV and other polyphenols can also become pro-
oxidative 1, a fact that is nevertheless often ignored. Depending on the reaction
conditions resveratrol can be (auto-) oxidized to generate semiquinones and the
3
.CC-BY-ND 4.0 International licensenot peer-reviewed) is the author/funder. It is made available under aThe copyright holder for this preprint (which was. http://dx.doi.org/10.1101/045567doi: bioRxiv preprint first posted online Mar. 24, 2016;

relatively stable 4'-phenoxyl radical, which can produce reactive oxygen species
(ROS) 13,14. (Auto-) oxidative reactions of polyphenols are influenced by changing
pH, particularly the presence of hydroxyl anions or organic bases 15,16. Additionally,
metal ions (e.g. iron II ions) facilitate oxidative reactions and further radical
generation via Fenton reactions 17.
This study aimed to connect fragmented pieces of the chemical and resulting
biological properties of RSV to provide a conceptually comprehensive mechanistic
understanding of the varying purported health-beneficial effects of RSV.
Results and Discussion
RSV is unstable under physiologically relevant conditions
The vast majority of studies seem to assume specific RSV-target protein interactions,
which implies that RSV remains intact during treatments. However, after incubation
in various media containing physiological concentrations of sodium bicarbonate
(NaHCO3), a key component of water as well as buffer of blood and biological cells,
RSV reacts efficiently, as indicated by striking yellowish colour changes (Fig. S1a
and b). Light absorbance at characteristic RSV maximum (308 nm) decreased rapidly
in water and cell culture media, both containing sodium bicarbonate (Fig. S1c and d,
Table S1). After 16 hours incubation the absorption maximum of RSV was almost
completely diminished. Furthermore, using a commonly applied fluorescence-based
SIRT1 assay no enzymatic activation could be detected (Fig. S1e).
Oxidation of resveratrol at atmospheric oxygen level (21% O2, as usually applied in
cell culture) 16,18 could potentially be considered as non-physiological (in blood
vessels the oxygen amount is roughly 14% and in tissues or tumours even lower (~
1% O2)) 19. Here we show that the auto-oxidation of RSV is highly dependent on the
presence of sodium bicarbonate and pH of the solvent 14 (Fig. S2 and S3), whereas
decreasing oxygen partial pressure seems to have a comparably minor influence on
the oxidation efficiency of RSV (Fig. S3a and b). These data suggest that oxidation of
RSV can even take place in hypoxic microenvironments.
These results corroborate widely ignored findings that the stability and oxidation of
RSV in physiologically relevant media is strongly influenced by pH and in particular
the availability of hydroxyl anions 16,18,20. Interestingly, RSV reacted also efficiently
4
.CC-BY-ND 4.0 International licensenot peer-reviewed) is the author/funder. It is made available under aThe copyright holder for this preprint (which was. http://dx.doi.org/10.1101/045567doi: bioRxiv preprint first posted online Mar. 24, 2016;

in tap water (Fig. S4e left), which might explain further the often-reported perplexing
low bioavailability of RSV in vivo 21-23. Although RSV could potentially be protected
from protein carriers such as serum albumin 24, the entirety of these data makes it
difficult to understand how RSV could exert compound-protein specific effects. These
results further indicate that potential metabolisation of RSV, for example by oxidation
of the enzymes of the CYP1 family, might play a minor role in physiological context,
consistent with the usually extremely low amounts of detected metabolites of
resveratrol 21-23.
RSV produces ROS under physiologically relevant conditions
We next asked how the oxidising RSV could induce relevant biological effects.
Notably, treatment of cells with RSV resulted in time- and concentration-dependent
generation of intracellular ROS (Figure 1a and b and Fig. S4a).
Owing to the complexity of biological matrices it remains technically impossible to
detect exactly unstable intermediate ROS. However, using defined solvents or a cell-
free environment, we detected significantly increased amounts of ROS, including
superoxide anions (Figure 1c), hydroxyl radicals (Fig. S4b-d) and hydrogen peroxide
(Fig. S4e) 14,16. For example, between 5.0 and 12.5 µM hydrogen peroxide (Fig. S4e)
was generated depending on the concentration of RSV and sodium bicarbonate (Fig.
S4e left), whereas (metabolic) scavengers such as pyruvate strongly depleted ROS
(Fig. S4e right). As revealed by an antioxidant assay using trolox as control
compound, in presence of sodium bicarbonate the anti-oxidative feature of ROS-
producing RSV was strongly diminished (Fig. S4f left). In contrast, RSV showed
roughly 2-fold higher anti-oxidative capacity in solvents lacking sodium bicarbonate
(Fig. S4f right). These data suggest that RSV loses in part its anti-oxidative properties
and becomes more pro-oxidative in physiological media containing sodium
bicarbonate.
These data indicate that oxidation of RSV takes place under physiologically relevant
conditions that differ significantly from experimental setups applied to analyse RSV
by common bicarbonate-free enzymatic assays, or bicarbonate-free crystallization
procedures that are mostly used for x-ray analyses. Notably, low concentrations of
5
.CC-BY-ND 4.0 International licensenot peer-reviewed) is the author/funder. It is made available under aThe copyright holder for this preprint (which was. http://dx.doi.org/10.1101/045567doi: bioRxiv preprint first posted online Mar. 24, 2016;

oxidation products of RSV such as ROS can mildly affect cellular biomolecules such
as proteins and lipids (Figure 1d).
Effects on primary human keratinocytes
We next asked how oxidation of RSV might influence physiological effects. Given
the here observed oxidative effects in particular topological application of RSV seems
a medially relevant approach, as is evident from the number of available
dermatological products based on RSV. We thus focused in this study on potential
protection of the human epidermis. Notably, due to ethical considerations and law, for
physiological testing dermatological research applies ex vivo models such as the here
used primary human keratinocytes that form the outer layer of the skin. Keratinocytes
are known to build a tight layer of cells that can be used as epidermal grafts (Fig.
S4g) 25, and these cells represent a prime target for lotions and emollients based on
RSV 26,27.
Firstly, we investigated potential oxidation of cellular components owing to oxidation
products of RSV. Sixteen hours of treatment with 50 µM RSV slightly elevated lipid
peroxidation in human primary keratinocyte (NHEK) cells, indicating mildly
increased oxidation of cellular biomolecules (Figure 1d).
Moreover, to globally monitor cellular response to oxidation products of RSV,
genome-wide RNA expression analyses revealed a slight but significantly increased
expression of molecular pathways covering oxidative stress response and
inflammatory signalling, as well as fatty acid metabolism (Figure 1e and Table S2). In
contrast, processes linked to proliferation, DNA replication and cell cycle were down-
regulated. Importantly, quenching of oxidation by adding strong reducing molecules
such as 25 mM synthetic GSH significantly reversed expression of cell response
marker genes (Figure 1f). As shown in a control experiment, quenching by synthetic
GSH in reduced the levels of ROS derived from RSV in cell-free environment (Fig.
S4g) and even more importantly within cells (Fig. S4i), suggesting that ROS derived
from RSV mainly cause the observed gene expression effects. As tested with a small
panel of unrelated cell models, despite cell-specific defence mechanisms the here
observed gene expression events seem to some degree be independent from cellular
background (Fig S5a-d, Table S3).
6
.CC-BY-ND 4.0 International licensenot peer-reviewed) is the author/funder. It is made available under aThe copyright holder for this preprint (which was. http://dx.doi.org/10.1101/045567doi: bioRxiv preprint first posted online Mar. 24, 2016;

These data indicate to our knowledge for the first time that major gene expression
events induced by RSV can be explicitly attributed to the development of oxidation
products of RSV such as ROS, since depletion by molecular quenchers strongly
truncated cellular response. The effects of RSV analysed here in mammalian cells
might also underlie phytoalexin-based protection of plants against microbial
infection 28.
Oxidative products of RSV cause hormetic effects
In a next step, we asked how oxidation products derived from RSV could potentially
influence viability of cells. Using common cell viability assays, we observed
increased cellular fitness up to about 50 µM RSV in treated NHEKs, whereas higher
concentrations tend to produce toxic effects, leading to a typical bi-phasic, hormetic
dose-viability curve (Figure 2a and b). Notably, in additional cellular models for
fibroblasts and liver we observed similar bi-phasic dose-viability curves as for NHEK
cells but (depending on the cell model) varying susceptibility to oxidative products
derived from RSV treatment (Figure 2c-d). Slight but significantly increased
expression of molecular markers for oxidative stress response, such as catalase
(CAT), could be observed up to 100 µM RSV with a maximum at 50 µM RSV
(Figure 2b). On the other hand, too high concentrations of RSV (> 100 µM RSV) can
result in toxic effects (Figure 2b). In summary, these data are in line with a large body
of mostly unconsciously reported hormetic cellular effects of RSV 10.
Importantly, the hormetic dose-viability curve was strongly truncated by adding 25
mM synthetic GSH as a quencher, providing to our knowledge for the first time
strong evidence that increased viability of cells after RSV treatment mainly derived
from ROS and related products of RSV (Figure 2a-d). In other words, the mechanism
of action of RSV to slightly improve cellular fitness seems to rely significantly on
oxidative effects of RSV, resulting in a bi-phasic, concentration-dependent cellular
response.
Further concentration- and time-dependent treatments of NHEKs resulted in generally
slight up-regulation of a number of metabolic, aging, oxidative stress and
inflammation signalling genes (Figure 3a-d and Fig. S5e-h). Notably, in NHEKs these
cellular responses could be observed in a concentration range of approximately 5 to
7
.CC-BY-ND 4.0 International licensenot peer-reviewed) is the author/funder. It is made available under aThe copyright holder for this preprint (which was. http://dx.doi.org/10.1101/045567doi: bioRxiv preprint first posted online Mar. 24, 2016;

100 µM RSV. Strong changes in gene expression were observed after at least 12
hours, most efficiently after 16 hours of treatment.
The entirety of the above shown data suggests that under physiological relevant
conditions increased viability of cells after RSV treatment was triggered by ROS (and
potentially also other radicals of RSV), leading to up-regulation of major cell defence
genes. Instead of the conventional pharmacological (linear) threshold model we
observed a bi-phasic mode of action of RSV: at normally applied non-toxic
concentrations, RSV treatment results in increased cellular fitness based on related
molecular events, whereas at higher concentrations RSV treatment results in toxic
effects. The underlying reason for this cellular behaviour seems to depend largely on
the pro-oxidative properties of RSV.
In summary, the here proposed link introduces an explicit explanation of the so far
rather “nebulous” hormetic effects of RSV.
Hormetic effects of oxidative products derived from RSV are driven by
activation of Nrf2
We next asked how oxidising RSV could induce any specific molecular response in a
cellular context. Especially the nuclear factor (erythroid-derived 2) like 2 (Nrf2) is
considered responsible for accommodating oxidative stress 2,29-31. Consistent with the
above shown production of oxidation products of RSV, we observed translocation of
redox-sensitive Nrf2 into the nucleus of NHEKs (Figure 3e and Fig. S6a), leading to
regulation of known Nrf2 target genes (Figure 5a-d bold font). Remarkably,
knockdown of mRNA expression of Nrf2 gene by small interfering RNAs (siRNAs)
significantly decreased the observed effects of RSV on gene expression response
(Figure 3f and Fig. S6b). This experiment indicates that Nrf2 via its well-established
canonical signalling model mediates major response of NHEKs to the oxidation
products of RSV.
ROS and further radicals can produce numerous effects as a result of increased
oxidation of cellular biomolecules, leading for example to inhibition of protein
activity. Thus, we would expect multiple cellular defence mechanisms to counteract
ROS including for example autophagy and cell cycle arrest. Interestingly, RSV
treatment slightly increased autophagy, probably to degrade and recycle potentially
8
.CC-BY-ND 4.0 International licensenot peer-reviewed) is the author/funder. It is made available under aThe copyright holder for this preprint (which was. http://dx.doi.org/10.1101/045567doi: bioRxiv preprint first posted online Mar. 24, 2016;

damaged cellular components (Figure 4a and Fig. S6c), corroborating previous
observations 32. Simultaneously, primary NHEKs were arrested in G1 cycle phase
(Figure 4b and Fig. S6d). Interestingly, the cells did not show any signs of senescence
or apoptosis (Figure 4c and d, Fig. S6e and f) and revealed reduced necrosis (Figure
4d).
In the context of increasing autophagy and overall molecular stress, this mechanism
might allow cells to focus their limited resources on cellular repair, while decreasing
cellular proliferation and nucleotide synthesis (Figure 1e). Notably, similar effects
were observed for mild stress such as calorie restriction to improve cellular
fitness 33,34. Evidently, many of the effects described appear to be specifically
mediated via activation of the redox-sensitive transcription factor Nrf2. We next
asked if and how other reported factors such as the promiscuously reacting
deacetylase SIRT1 could potentially modulate the effects derived from RSV-based
activation of Nrf2, for example in the context of autophagy.
As shown above, under physiologically relevant conditions the almost completely
degraded RSV can merely directly or allosterically induce the enzymatic activity of
SIRT1 (Fig. S1e). However, the 4-fold up-regulation of SIRT1 expression (Figure
3b), the phosphorylated SIRT1 (Fig. S7a) and the simultaneously increased
NAD+/NADH ratio (Figure 5a and Fig. S8d) might contribute to modify the mild
effects derived from oxidized RSV. Knockdown of SIRT1 gene resulted in 20% lower
expression of NRF2, suggesting a potential modifying effect of the lysine deacetylase
SIRT1 on Nrf2 (Fig. S7b). However, at least in NHEKs – in contrast to knockdown of
NRF2 – knockdown of SIRT1 did not strongly influence overall gene or protein
expression (Fig. S7c and d), corroborating the major role of Nrf2 in the response to
oxidative products such as ROS derived from RSV.
Oxidative products of RSV induce a reduced cellular redox environment
We then asked how gene expression mediated by RSV/ROS-based activation of Nrf2
might influence cellular metabolism. In NHEKs treated for 16 hours with 50 µM
RSV, we observed phosphorylation signalling events such as increased
phosphorylation of pyruvate dehydrogenase E1 component subunit alpha (PDE1α) at
9
.CC-BY-ND 4.0 International licensenot peer-reviewed) is the author/funder. It is made available under aThe copyright holder for this preprint (which was. http://dx.doi.org/10.1101/045567doi: bioRxiv preprint first posted online Mar. 24, 2016;

serine 293 (Fig. S8a), an effect known to inhibit endogenous pyruvate breakdown and
oxidative phosphorylation 35. Consequently, this molecular effect led to increased
intracellular levels of the potential ROS-scavenger pyruvate while lactate remained at
constant levels (Figure 5a). Under constant mitochondrial biogenesis (Fig. S8b), we
further observed decreased mitochondrial oxygen consumption during 16 hours of
RSV treatment (Fig. S8c).
Moreover, the intracellular ratio of metabolite couples 2GSH/GSSG and ATP/ADP as
well as the amount of glucose significantly increased (Figure 5a and Fig. S8d). In
contrast the intracellular ratios of metabolite couples NADH/NAD+ and
NADPH/NADP+ were significantly decreased (Figure 5a and Fig. S8d). Consistent
with the ratio of the most relevant 2GSH/GSSG redox couple, the expression of genes
and proteins related to glutathione metabolism were highly increased, corresponding
to significantly elevated levels of the potent cellular antioxidant GSH (Figure 5a and
b, Fig. S8d and e).
In summary, these data indicate a metabolic switch that leads amongst others to an
increased pool of reduced glutathione. Clearly, the GSH concentration can vary a lot
between different cells, depending on stress exposure and function 36.
We next analysed the redox environment of NHEKs treated with RSV using
intracellular concentrations of above-mentioned key metabolites, using the formula
(Eq. 1) 36:
𝑅𝑅𝑅𝑅𝑅𝑅𝑅𝑅𝑅𝑅 𝑅𝑅𝑒𝑒𝑒𝑒𝑒𝑒𝑒𝑒𝑅𝑅𝑒𝑒𝑒𝑒𝑅𝑅𝑒𝑒𝑒𝑒 = � 𝐸𝐸𝑖𝑖 ∗ [𝑒𝑒𝑅𝑅𝑅𝑅𝑟𝑟𝑟𝑟𝑅𝑅𝑅𝑅 𝑠𝑠𝑠𝑠𝑅𝑅𝑟𝑟𝑒𝑒𝑅𝑅𝑠𝑠]𝑖𝑖
𝑛𝑛(𝑐𝑐𝑐𝑐𝑐𝑐𝑐𝑐𝑐𝑐𝑐𝑐}
𝑖𝑖=1
Eq. 1
Indeed, RSV treatment at hormetic concentrations shifted the cellular redox
environment to a more reduced state mediated by Nrf2 (Figure 5c and for calculation-
relevant parameters Table S4) 37. Based on the 2GSH/GSSG couple, which provides
the by far largest pool of reducing equivalents 36, we calculated a slight shift of redox
environment of -2.61 mV mmol GSH per gram protein. A similar trend was observed
by taking into account further redox couples (see also Fig. S8f and Table S4).
According to our results, RSV treatment can contribute to an overall reduction of
biological molecules containing for example thiol groups, as evident from the
increased cellular GSH concentration (Figure 5a).
10
.CC-BY-ND 4.0 International licensenot peer-reviewed) is the author/funder. It is made available under aThe copyright holder for this preprint (which was. http://dx.doi.org/10.1101/045567doi: bioRxiv preprint first posted online Mar. 24, 2016;
We then analysed if the observed reduced redox environment could potentially protect
the cell from (oxidative) stress. Therefore, we subjected NHEKs to 16 hours pre-
treatment with 50 µM RSV. After replacement of medium the NHEK cells were
devoid of any residual RSV. We then treated NHEKs with ~0.8% ethanol and
analysed the endogenous generation of intracellular ROS from cellular metabolisation
of ethanol, i.e. the level of oxidative stress (Figure 5d) 38. Notably, we observed that
overall reduced cellular environment (owing to the observed increased pool of
endogenous GSH) enabled RSV-pre-treated NHEKs to buffer the additional
production of ROS due to biotransformation of ethanol (Figure 5d). The protective
effects of pre-treatment with RSV were revised in a concentration-dependent manner
by addition of 4-hydroxy-2-nonenal (HNE), an α,β-unsaturated aldehyde, which
amongst others acts as a strong electrophile by depleting cellular sulfhydryl
compounds like GSH (Figure 5d) 39.
Summarizing, we propose a bi-phasic pharmacological model for RSV, which might
be extended to other pro-oxidative polyphenols. This model comprises i) generation
of oxidation products at non-toxic concentrations in physiologically relevant sodium
bicarbonate-containing media, ii) specific mediation of cellular response to oxidation
induced by RSV by the redox-sensitive transcription factor Nrf2 and iii) induction of
slight reductive shifting of cellular redox-environment to protect the cell from
additional (oxidative) stress (Figure 6a and b).
Clearly, the here proposed model largely depends on the pro- and anti-oxidative
properties of RSV in a given microenvironment. We argue that bicarbonate
containing media are essential for living systems, and thus it seems that our model
might be extendable to a large variety of biological phenomena. Our data indicate at
least that proper analysis of the potential pro- and anti-oxidative features of RSV in a
specific experimental set-up shall be thoroughly explored prior any biological
investigation to define a common basis and thereby avoid any potential
misinterpretation.
In particular the human epidermis being predominantly prone to external stress might
benefit from dermatological application of RSV. The here elaborated pro-oxidative
features of RSV and the redox-environment shifting concept can fully explain such
recent claims 31. Of note, whereas RSV might remain stable under low pH conditions
in the stomach (Fig. S2 and 3), physiologically well-known neutralization in the
11
.CC-BY-ND 4.0 International licensenot peer-reviewed) is the author/funder. It is made available under aThe copyright holder for this preprint (which was. http://dx.doi.org/10.1101/045567doi: bioRxiv preprint first posted online Mar. 24, 2016;

duodenum – by high concentrations of bicarbonate derived from the pancreas – might
induce so far largely unexplored pro-oxidative features of RSV in the intestine.
Considering reduction of the cellular redox environment as the main physico-
chemical mechanism, the often-reported weak and pleiotropic effects of RSV can be
quantitatively determined using molecular data of redox-relevant metabolites and the
above formula (Eq. 1; see also Figure 5c and Table S4). On the other hand, in
particular the effects derived from oxidation products with short lifetimes such as
ROS are difficult to trace in vitro and in particular in vivo. This drawback might
provoke scepticism how such “dirty” chemicals shall exert well-controllable cellular
and physiological effects.
Nevertheless, taking a systems view we suggest to apply the here explored paradigm
for mathematically analysing the emerging relevant biological effects of “dirty”
compounds. This approach allows amongst others calculating the oxidation-buffering
capacity of targeted cells under investigation. Using such a framework, development
of chemical derivatives of RSV and of molecular carriers might be helpful to
rationally exploit the beneficial bi-phasic effects of pro-oxidative compounds for
therapeutic and preventive application.
In general, hormetic induction of cellular fitness by physiologically pro-oxidative
polyphenols such as RSV might represent a powerful approach to protect cells against
physiological stress and to inhibit age-related diseases.
Methods Materials
Chemical compounds were purchased from the following sources: 3,5,4'-trihydroxy-
trans-stilbene (resveratrol, RSV) and 4-hydroxy-2-nonenal (HNE) from Cayman
Chemical (Biomol, Hamburg, Germany). Reduced glutathione (GSH) was purchased
from Sigma Aldrich (Taufkirchen, Germany). The composition of Berlin tap water
can be retrieved from: http://www.bwb.de
Cell culture
Neonatal normal human epidermal keratinocyte cells (NHEK, CC-2503, Lonza,
Basel, Swiss) were isolated from a black, newborn male. NHEK cells were
12
.CC-BY-ND 4.0 International licensenot peer-reviewed) is the author/funder. It is made available under aThe copyright holder for this preprint (which was. http://dx.doi.org/10.1101/045567doi: bioRxiv preprint first posted online Mar. 24, 2016;

maintained in keratinocyte growth medium (KGM) containing keratinocyte basal
medium (KGM, CC-3101, Lonza) and KGM SingleQuot Kit Suppl. & Growth
Factors (CC-4131, Lonza). Cells were treated with indicated compounds, vehicle
controls were as follows: DMSO for RSV and EtOH for HNE. GSH was dissolved in
cell culture medium. Notably, hydrogen peroxide applied in low micromolar
concentrations (comparable to HNE) did not produce any significant oxidative effects,
probably due to efficient scavenging in the cellular context. Neonatal normal human
dermal fibroblast cells (NHDF, CC-209, Lonza) were isolated from a Caucasian,
newborn male. NHDF cells were maintained in Dulbecco`s modified Eagle medium
(# 31966, Gibco, Life Technologies, Darmstadt, Germany) supplemented with 10%
fetal bovine serum (FBS) Medium was renewed every two to three days and cells
were split two times per week. Cells were treated at 60% confluence with 50 µM RSV
or vehicle control. Human HT-29 colon cells (ACC-299, DSMZ, Braunschweig,
Germany) were cultured in Dulbecco's Modified Eagle Medium/Nutrient Mixture F-
12 (DMEM/F-12, # 11330-057, Gibco, Life Technologies) supplemented with 5%
and 100 U/ml penicillin and 100 µg/ml streptomycin (all Biochrom, Berlin,
Germany). Human THP-1 monocyte cells (ATCC, LGC Standards GmbH, Wesel,
Germany) were cultivated in RPMI 1640 (Biochrom) supplemented with 10% FBS
and 100 U/ml penicillin and 100 µg/ml streptomycin. Human HepG2 liver cells
(ATCC, LGC Standards GmbH), human embryonic kidney (HEK293T) cells (ATCC,
LGC Standards GmbH) and human HeLa cells (ATCC, LGC Standards GmbH) were
cultured in DMEM (# 31966, Gibco, Life Technologies) supplemented with 10% FBS
and 100 U/ml penicillin and 100 µg/ml streptomycin. Cells were seeded into 12-well
plates (# 3513, Corning, Fisher Scientific, Schwerte, Germany) and treated with RSV
or vehicle control. Human adult low calcium high temperature keratinocyte cells
(HaCaT) and ARE clone 7 HaCaT cells were kindly provided by Unilever
(Sharnbrook, U.K.). ARE clone 7 HaCaT cells were revived in DMEM (# 31966,
Gibco, Life Technologies) supplemented with 10% FBS. The next day, culture
medium was changed to selective medium (DMEM with 10% FBS and 400 µg/ml
Hygromicin B (# 10687-010, Life Technologies)) for continued growth. HaCaT cells
were cultured in DMEM (# 21068-028, Life Technologies) supplemented with 1%
FBS, 2 mM L-glutamine (Biochrom), 1 mM sodium pyruvate (# 11360-039, Life
Technologies), 70 µM calcium chloride (Merck GmbH, Darmstadt, Germany), 100
U/ml penicillin and 100 µg/ml streptomycin.
13
.CC-BY-ND 4.0 International licensenot peer-reviewed) is the author/funder. It is made available under aThe copyright holder for this preprint (which was. http://dx.doi.org/10.1101/045567doi: bioRxiv preprint first posted online Mar. 24, 2016;
All cell lines were maintained at 37°C in a humidified 5% CO2 atmosphere and
treated at 60% confluence. The following passages were used: NHEK cells p 1,
NHDF cells p 2-5, ARE clone 7 HaCaT cells p 7, HaCaT cells p 47, HT-29 cells p 27,
HepG2 cells p 9, HEK293T p 23 and Hela were kindly provided by Dr. David
Meierhofer.
Analysis of resveratrol integrity
The Fluor-de-Lys SIRT1 Fluorometric Drug Discovery Assay (BML-AK555-0001,
Enzo Life Sciences, Lörrach, Germany) was used to analyse the integrity of RSV after
incubation in diverse solvents according to manufacturer’s instructions. Briefly,
compounds were added to a mixture of NAD+ and Fluor-de-Lys (FdL) peptide in
reaction buffer (RB). Reaction was started by addition of SIRT1 in RB followed by
30 min incubation at 37°C. Reaction was stopped by addition of NAM and
DeveloperII solution. After additional incubation for 45 min at 37°C, fluorescence
was measured (360/460 nm) using the POLARstar Omega (BMG LABTECH,
Ortenberg, Germany).
Time-dependent decay of resveratrol (cell-free)
The time-dependent decay of RSV in diverse solvents was analysed using the
POLARstar Omega (BMG LABTECH) at 37°C. Samples were transferred (100
µl/well) into a UV-Star 96-well plate (# 655801, Greiner Bio-one, Frickenhausen,
Germany) for kinetic and spectral measurement (between 220 and 720 nm, Δλ 2 nm).
Photos of RSV under various conditions (Fig. S1a and b) to document initial decay
overnight were taken after about 17.5 hours.
pH-dependent oxidation of resveratrol (cell-free)
The time-dependent oxidation of 50 µM RSV in ddH2O with or without 44 mM
sodium bicarbonate (NaHCO3) was analysed using the POLARstar Omega (BMG
LABTECH) at 37°C. Samples were transferred (150 µl/well) into a UV-Star 96-well
plate (# 655801, Greiner Bio-one) for kinetic and spectral measurement (between 230
and 550 nm, Δλ 2 nm). The pH of each solution was adjusted from 1 to 12 using HCl
and NaOH solutions. In accordance to Li, et al. 14 oxidation products of RSV, a short-
lived hydroxyl radical adduct of RSV (characteristic absorbance maximum: 420 nm)
and the relatively stable 4’-phenoxyoxyl radical (characteristic absorbance maximum:
14
.CC-BY-ND 4.0 International licensenot peer-reviewed) is the author/funder. It is made available under aThe copyright holder for this preprint (which was. http://dx.doi.org/10.1101/045567doi: bioRxiv preprint first posted online Mar. 24, 2016;

390 nm), were monitored. For data analyses in GraphPad Prism 5.0 signals were
background-subtracted and normalized to vehicle control. Data were fitted (dashed
line) using GraphPad Prism 5.0 with a Hill slope of -1 according to equation:
𝑌𝑌 = 𝐵𝐵𝑅𝑅𝑒𝑒𝑒𝑒𝑅𝑅𝑒𝑒 + (𝑇𝑇𝑅𝑅𝑠𝑠 − 𝐵𝐵𝑅𝑅𝑒𝑒𝑒𝑒𝑅𝑅𝑒𝑒)
(1 + 10(𝑋𝑋−𝑐𝑐𝑐𝑐𝑙𝑙 𝐼𝐼𝐼𝐼50))
Oxygen partial pressure-dependent oxidation of resveratrol (cell-free)
96-well plates prepared for the determination of the pH-dependent oxidation of
resveratrol (see pH-dependent oxidation of RSV) were incubated at 37°C at
atmospheric oxygen levels (~ 21% O2), slightly reduced oxygen partial pressure (10%
O2, mimicking conditions in the blood vessels), or highly reduced oxygen levels (1%
O2, resembling tissue or tumour microenvironment). For experiments with reduced
oxygen partial pressure, plates were incubated at corresponding oxygen levels using a
CO2 Incubator Model CB 60 (Binder, Tuttlingen, Germany). For spectral
measurements plates were quickly analysed (< 2 min) using the POLARstar Omega
(BMG LABTECH) at 37°C. Afterwards the plates were further incubated at indicated
conditions. In accordance to Li, et al. 14 the oxidation of RSV and subsequent reaction
products were monitored. For data analyses in GraphPad Prism 5.0 signals were
background-subtracted and normalized to vehicle control. Data were fitted (dashed
line) using GraphPad Prism 5.0 with Hill slope = -1 according to equation:
𝑌𝑌 = 𝐵𝐵𝑅𝑅𝑒𝑒𝑒𝑒𝑅𝑅𝑒𝑒 + (𝑇𝑇𝑅𝑅𝑠𝑠 − 𝐵𝐵𝑅𝑅𝑒𝑒𝑒𝑒𝑅𝑅𝑒𝑒)
(1 + 10(𝑋𝑋−𝑐𝑐𝑐𝑐𝑙𝑙 𝐼𝐼𝐼𝐼50))
Measurement of ROS (cell-free)
The CellROX Green dye (C10444, Life Technologies) was used to quantify the
formation of extracellular ROS. The dye exhibits a high fluorescence response in
particular to hydroxyl radicals (OH-). Upon oxidation by ROS and after binding to
nucleic acid the probe exhibits green photostable fluorescence. The CellROX Green
dye is compatible with cell culture medium and requires no cellular processing, hence
it is applicable for measurement of ROS generation in a cell-free environment. The
dye was diluted to 10 µM/well in presence of 1 µg/ml lambda DNA (Life
Technologies) prior to addition of the indicated compounds. Measurement was
performed in a final volume of 150 µl/well in black 96-well plates (# 655090, Greiner
15
.CC-BY-ND 4.0 International licensenot peer-reviewed) is the author/funder. It is made available under aThe copyright holder for this preprint (which was. http://dx.doi.org/10.1101/045567doi: bioRxiv preprint first posted online Mar. 24, 2016;
Bio-One). The dye was protected against atmospheric oxygen by adding a sealing
layer of 100 µl/well mineral oil (Luxcel Biosciences). Fluorescence intensity (Ex
485/30; Em 530/10) was recorded at 37°C for 16 hours using the POLARstar Omega
(BMG LABTECH). For data analyses in GraphPad Prism 5.0 fluorescence signals
were background-subtracted and normalized to vehicle control. Finally, signals were
plotted in GraphPad Prism 5.0 either using a second order neighbour smoothing (4
neighbours) for kinetic depiction or the area under the curve (AUC) was calculated
for summed depiction.
Quantification of intracellular ROS
Formation of ROS was quantified using dye 5-(and-6)-chloromethyl-2',7'-
dichlorodihydrofluorescein diacetate (CM-H2DCFDA, Life Technologies) according
to the manufacturer’s instruction. In detail, NHEK cells were seeded in a 96-well
plate (TPP, Biochrom) with a density of 10,000 cells/well. The following day,
adherent cells were washed once with pre-warmed PBS and loaded with 50 µM dye
diluted in PBS. For successful incorporation and activation of CM-H2DCFDA, cells
were incubated for 30 minutes at 37°C. Afterwards, free dye was removed by
washing with pre-warmed PBS. KGM (100 µl/well) was added and cells were once
more incubated at 37°C for 60 minutes. Compounds were added as indicated and
fluorescence (Ex 485/30; Em 530/10) was measured for 16 hours of treatment using
the POLARstar Omega (BMG LABTECH) at 37°C.
For the quantification of ROS generation in pre-conditioned NHEKs, cells were
seeded in a 96-well plate (TPP, Biochrom) with a density of 10,000 cells/well and
were pre-treated with 50 µM RSV or vehicle for 16 hours. The following day,
adherent cells were washed once with pre-warmed PBS and loaded with 50 µM dye
diluted in PBS. For successful incorporation and activation of CM-H2DCFDA, cells
were incubated for 30 min at 37°C. Afterwards, free dye was removed by washing
with pre-warmed PBS. KGM (100 µl/well) was added and cells were once more
incubated at 37°C for 60 min. Putative protection of NHEKs against oxidative stress
by RSV pre-treatment was tested by adding ethanol (0.781%) or potent thiol-
scavenger HNE 40 at indicated concentrations. Fluorescence (Ex 485/30; Em 530/10)
was measured for 21 hours of treatment using the POLARstar Omega (BMG
LABTECH) at 37°C. For data analyses in GraphPad Prism 5.0 fluorescence signals
were background-subtracted and normalized to vehicle control. Finally, signals were
16
.CC-BY-ND 4.0 International licensenot peer-reviewed) is the author/funder. It is made available under aThe copyright holder for this preprint (which was. http://dx.doi.org/10.1101/045567doi: bioRxiv preprint first posted online Mar. 24, 2016;
plotted in GraphPad Prism 5.0 either using a second order neighbour smoothing (4
neighbours) for kinetic for kinetic depiction or the area under the curve (AUC) was
calculated for summed depiction.
Analysis of H2O2 generation (cell-free)
To determine hydrogen peroxide (H2O2) generation the Amplex Red
Glucose/Glucose Oxidase Assay Kit (A22189, Life Technologies) and the Hydrogen
Peroxide Assay Kit (K265-200, BioVision, BioCat, Heidelberg, Germany) were used.
DMEM samples were filtered using Amicon Ultra-0.5 Centrifugal Filter Unit with
Ultracel-10 membrane (UFC501024) or MultiScreen Ultracel-10 Filter Plate 10 kD
(MAUF01010, both Merck Chemicals). For each experiment a H2O2 standard curve
was generated. Samples were mixed with provided dye, horseradish peroxidase
(HRP) and RB. Fluorescence was measured after 10 to 30 minutes incubation at RT
using the POLARstar Omega (BMG LABTECH).
Analysis of superoxide generation (cell-free)
The MitoSOX Red Mitochondrial Superoxide Indicator (M36008, Life Technologies)
was used to quantify the formation of superoxide. The dye is readily and specifically
oxidized by superoxide and exhibits red photostable fluorescence after binding to
nucleic acids. The probe is compatible with cell culture medium and in combination
with Lamda DNA (Life Technologies) applicable for measurement of superoxide
generation in a cell-free environment. The dye was diluted to 10 µM/well in presence
of 200 ng/well lambda DNA (Life Technologies) prior to addition of indicated
compounds. Measurement was performed in a final volume of 150 µl/well in black
96-well plates (# 655090, Greiner Bio-One). The dye was protected against
atmospheric oxygen by adding a sealing layer of 100 µl/well mineral oil (Luxcel
Biosciences). Fluorescence intensity (Ex 485/30; Em 530/10) was recorded at 37°C
for 16 hours using the POLARstar Omega (BMG LABTECH). For data analyses in
GraphPad Prism 5.0 fluorescence signals were background-subtracted and normalized
to vehicle control. Finally, signals were plotted in GraphPad Prism 5.0 either using a
second order neighbour smoothing (4 neighbours).
17
.CC-BY-ND 4.0 International licensenot peer-reviewed) is the author/funder. It is made available under aThe copyright holder for this preprint (which was. http://dx.doi.org/10.1101/045567doi: bioRxiv preprint first posted online Mar. 24, 2016;

Viability assay
For determination of cellular viability NHEK cells were seeded in a black 96-well
plate (# 353219, BD Biosciences, Heidelberg, Germany) with a density of 10,000
cells/well and a final volume of 200 µl/well. NHDF, HepG2 and THP-1 cells were
seeded in a black 384-well plate (# 3712, Corning, Fisher Scientific) with a density of
2,500 cells/well (NHDF) and 5,000 cells/well (HepG2, THP-1), respectively and a
final volume of 25 µl/well. The following day, medium was renewed and cells were
treated with the indicated compounds in a final volume of 100 µl/well (NHEK) and
35 µl/well (NHDF, HepG2, THP-1), respectively. After 16 hours of treatment, cell
viability was quantified using the CellTiter-Fluor Cell Viability Assay (G6081,
Promega, Mannheim, Germany). Fluorescence intensity was measured (410/520 nm)
using the POLARstar Omega (BMG LABTECH). Data were fitted (dashed line)
using GraphPad Prism 5.0 with variable Hill slope according to equation:
𝑌𝑌 = 𝐵𝐵𝑅𝑅𝑒𝑒𝑒𝑒𝑅𝑅𝑒𝑒 + (𝑇𝑇𝑅𝑅𝑠𝑠 − 𝐵𝐵𝑅𝑅𝑒𝑒𝑒𝑒𝑅𝑅𝑒𝑒)
�1 + 10�(𝑐𝑐𝑐𝑐𝑙𝑙 𝐼𝐼𝐼𝐼50−𝑋𝑋)∗𝐻𝐻𝑖𝑖𝑐𝑐𝑐𝑐 𝑆𝑆𝑐𝑐𝑐𝑐𝑐𝑐𝑐𝑐��
Fluorescence intensity values were transformed to the relative number of cells. IC50 is
the concentration required for a 50 % inhibition of viability
RNA isolation, reverse transcription and quantitative real-time PCR
RNeasy Mini Kit (QIAGEN, Hilden, Germany) was used to isolate total RNA
according to the manufacturer’s instruction. For cell lysis 10 µl/ml β-mercaptoethanol
was added to RLT buffer. Genomic DNA was digested on a column using the DNase-
Set (QIAGEN). The concentration of extracted RNA was measured using the
Nanodrop ND-2000 Spectrophotometer (Thermo Fisher Scientific). RNA was
reversely transcribed into cDNA applying the High Capacity cDNA Reverse
Transcription Kit (Life Technologies) with random primers. After an initial
denaturation at 95°C for 10 min, the cDNA was amplified by 40 cycles of PCR
(95°C, 15 sec; 60°C, 60 sec). Quantitative PCR was carried out on the ABI Prism
7900HT Sequence Detection System using the Power SYBR Green PCR Master Mix
(all Life Technologies). The relative gene expression levels were normalized using β-
actin gene and quantified by the 2-ΔΔCt method 41. Primer sequences are summarized
in Table S5. Data were analysed using GraphPad Prism 5.0.
18
.CC-BY-ND 4.0 International licensenot peer-reviewed) is the author/funder. It is made available under aThe copyright holder for this preprint (which was. http://dx.doi.org/10.1101/045567doi: bioRxiv preprint first posted online Mar. 24, 2016;

Knockdown of NRF2 or SIRT1 with small interfering RNA
NHEK cells were seeded into 6-well plates (Corning) and transfected with 30 nM
Silencer Pre-designed siRNA Nrf2 (# 16708), Silencer Pre-designed siRNA SIRT1 (#
136457) or Silencer Select negative control siRNA (# 4390844, all Ambion, Life
Technologies) using Lipofectamin 2000 transfection reagent (# 11668019, Life
Technologies). Transfection was carried out in 1 ml for 48 hours in KGM, whereby
0.5 ml KGM were added after 24 hours. Medium was then renewed and cells were
treated with 50 µM RSV or vehicle for 16 hours prior to RNA and protein collection.
Data were analysed using GraphPad Prism 5.0.
Genome-wide gene expression analyses
Genome-wide gene expression analyses were done by ATLAS Biolabs GmbH
(Berlin, Germany) on HumanHT-12 Expression BeadChips (Illumina, Eindhoven,
The Netherlands). All basic expression data analyses were carried out using
GenomeStudio V2011.1 (Illumina). Raw data were background-subtracted and
normalized using the cubic spline algorithm. Processed data were filtered for
significant detection (P value ≤ 0.01) and differential expression vs. vehicle treatment
according to the Illumina t-test error model and were corrected according to the
Benjamini-Hochberg procedure (P value ≤ 0.05) in the GenomeStudio software. Gene
expression data were submitted to the Gene Expression Omnibus database
(GSE72119).
Gene Set Enrichment Analysis (GSEA) 42 of the RSV gene expression profiles was
performed using the following parameters: 1000 gene set permutations, weighted
enrichment statistic, and signal-to-noise metric. Microarray data were analysed using
the curated C2 KEGG pathways gene sets (version 4.0, 186 gene sets) from the
Molecular Signature Database (MSigDB) (Table S2).
Cell cycle analyses
Analyses of cell cycle regulation were performed in NHEK cells treated with the
indicated compounds for 16 hours. Trypsinised cells were fixed in 70 % ethanol and
incubated on ice for 15 minutes. Fixed cells were then resuspendend in propidium
iodide (PI)/RNase staining solution (# 4087, Cell Signaling Technology, New
England Biolabs, Frankfurt, Germany), incubated for 15 minutes at RT and stored at -
20°C until use. Finally, cells were measured in the Accuri C6 flow cytometer (BD
19
.CC-BY-ND 4.0 International licensenot peer-reviewed) is the author/funder. It is made available under aThe copyright holder for this preprint (which was. http://dx.doi.org/10.1101/045567doi: bioRxiv preprint first posted online Mar. 24, 2016;

Biosciences). Data analyses were performed using the Watson pragmatic model in
FlowJo 7.6 (Tree Star).
Phosphatidylserine externalization (Annexin V) assay
To quantify apoptosis, the externalization of phosphatidylserine 5 was determined in
NHEK cells treated with the indicated compounds for 16 hours by staining with
annexin-V-FLUOS and propidium iodide using the Annexin-V-FLUOS Staining Kit
(Roche Diagnostics, Mannheim, Germany) and subsequent flow cytometry (Accuri
C6, BD Biosciences). Analyses were performed using FlowJo 7.6 (Tree Star).
Immunoblotting
NHEK were lysed in 50 mM Tris-HCl (pH 8.0), 10 mM EDTA, 1% SDS with
protease inhibitors (Roche Diagnostics) and phosphatase inhibitors (Sigma Aldrich),
and sonicated (Bandelin electronic, Berlin, Germany). After centrifugation for 10
minutes at 10,000 g, the supernatants were stored at -80°C until use. Samples were
denaturated and separated using a NuPAGE Novex 4-12% Bis-Tris gel (Life
Technologies) and blotted onto Hybond ECL nitrocellulose membranes (GE
Healthcare, Freiburg, Germany). Membranes were blocked for 1 hour at RT
according to the manufacturer's protocol and washed in TBS-T (0.1 %). Primary
antibodies against P-Nrf2 (ab76026, Abcam, Cambridge, UK), Nrf2 (sc-13032X,
Santa Cruz, Heidelberg, Germany), Sirt1 (MAb-063-050, Diagenode, Seraing
(Ougrée), Belgium), P-Sirt1 (# 2314), CDK 4 (# 2906), cyclin D1 (# 2926), CDK 2 (#
2546), cyclin E2 (# 4132), p21 (# 2947), cyclin A2 (# 4656), caspase 7 (# 9492),
cleaved caspase 7 (# 8438), caspase 9 (# 9502), cleaved caspase 9 (# 7237), PARP (#
9542), cleaved PARP (# 5625, all from Cell Signaling Technology) and b-Actin (sc-
47778, Santa Cruz) were diluted in TBS-T (0.1%) with milk powder and BSA,
respectively, according to the manufacturer's protocols. Membranes were shaken at
4°C overnight, washed 3 times with TBS-T (0.1 %) and subsequently incubated with
anti-rabbit IgG-HRP (sc-2004, Santa Cruz) and anti-mouse IgG-HRP (sc-2005, Santa
Cruz), respectively, according to the manufacturer's protocols. Detection was carried
out with Western Lightning ECL solution (Perkin Elmer, Rodgau, Germany).
Membranes were stripped with Restore Plus Western Blot Stripping Buffer (Thermo
Scientific, Life Technologies) for 5 to 7 minutes. A densitometric analysis was
performed with FUSION-SL Advance 4.2 MP System (Peqlab, Erlangen, Germany).
20
.CC-BY-ND 4.0 International licensenot peer-reviewed) is the author/funder. It is made available under aThe copyright holder for this preprint (which was. http://dx.doi.org/10.1101/045567doi: bioRxiv preprint first posted online Mar. 24, 2016;

Detection of lipid peroxidation
Click-iT Lipid Peroxidation Imaging Kit-Alexa Fluor 488 (C10446, Life
Technologies) was used to determine the development of cellular lipid peroxides.
Linoleamide alkyne (LAA, alkyne-modified linoleic acid) is incorporated into cellular
membranes and oxidized upon lipid peroxidation and finally, resulting in proteins
labelled with an azide-modified Alexa Fluor 488 dye. Increasing fluorescence
intensities corresponds to enhance lipid peroxidation upon treatment. NHEK cells
were seeded in 25 cm² cell culture flasks (Corning) and treated with 50 µM RSV or
vehicle for 16 hours in presence of 50 µM LAA. After trypsinisation, cells were
washed with PBS and fixed in 3.7 % formaldehyde for 15 minutes at RT. Cells were
washed in PBS, permeabilised by use of 0.5 % Triton X-100 in PBS for 10 minutes
and subsequently blocked by adding 1 % BSA for 30 minutes (all at RT). Remaining
BSA was removed by rigorously washing the cells with PBS. Pelleted cells were then
incubated with 500 µL Click-iT reaction cocktail for 30 minutes at RT according to
the manufacturer’s protocol. The Click reaction was stopped by adding 1 %
BSA/PBS. The cells were washed and resuspended with PBS. Flow cytometry was
performed on the Accuri C6 (BD Biosciences). Data were analysed using FlowJo 7.6
(Tree Star) and GraphPad Prism 5.0.
Antioxidant Assay
The Antioxidant Assay (# 709001, Cayman Chemical) was conducted according to
the manufacturer’s manual. The assay was miniaturized to a final volume of 60
µl/well. Samples including 6-hydroxy-2,5,7,8-tetramethylchroman-2-carboxylic acid
(Trolox) standards were mixed with metmyoglobin and chromogen. The reaction was
initiated by adding hydrogen peroxide solution and incubated 5 minutes at RT on a
shaker. Finally, the absorbance was read at 405 nm with the POLARstar Omega
(BMG LABTECH). Data were analysed using GraphPad Prism 5.0.
Quenching of resveratrol effects
NHEK cells were seeded in 150 cm² cell culture flasks (Corning) and treated with 50
µM RSV, vehicle alone or in combination with indicated concentrations of GSH,
respectively for 16 h. Trypsinised cells were subjected to quantitative real-time PCR
and 25 mM GSH measured in the Accuri C6 flow cytometer (BD Biosciences). Data
were analysed using GraphPad Prism 5.0 and FlowJo 7.6 (Tree Star).
21
.CC-BY-ND 4.0 International licensenot peer-reviewed) is the author/funder. It is made available under aThe copyright holder for this preprint (which was. http://dx.doi.org/10.1101/045567doi: bioRxiv preprint first posted online Mar. 24, 2016;

Intracellular glucose quantification
Intracellular glucose concentration was determined using the PicoProbe Glucose
Fluorometric Assay Kit (K688-100, Biovision, BioCat). NHEK cells were seeded into
25 cm² cell culture flasks (Corning, Fisher Scientific) and treated with 50 µM RSV or
vehicle for 16 h. Samples were processed according to the manufacturer’s instruction
and deproteinised using the Deproteinising Sample Preparation Kit (K808-200,
Biovision, BioCat). The assay was miniaturized to 10% of the initial volume and
conducted in a clear, small-volume 384-well plate (# 784101, Greiner Bio-one).
Fluorescence (535/585 nm) was measured after 45 min at using the POLARstar
Omega (BMG LABTECH). Samples were normalized to protein content. Data were
fitted (dashed line) using linear regression model in GraphPad Prism 5.0. Trolox
standard curve was used to convert RSV results into Trolox equivalents and data were
fitted (dashed line) using linear regression model.
Intracellular pyruvate quantification
Intracellular pyruvate concentration was determined using the Pyruvate Assay Kit (#
700470, Cayman Chemical). NHEK cells were seeded in 150 cm² cell culture flasks
(Corning) and treated with 50 µM RSV or vehicle for 16 hours. Sample preparation
was done according to the manufacturer’s instruction. Fluorescence (530/585 nm) was
measured after 20 minutes using the POLARstar Omega (BMG LABTECH) at 37°C.
Samples were normalized to protein content. Data were analysed using GraphPad
Prism 5.0.
Intracellular lactate quantification
Lactate content was quantified with the Lactate Assay Kit (# 700510, Cayman
Chemical). NHEK cells were seeded in a 150 cm² (Corning) and treated with 50 µM
RSV or vehicle for 16 hours. Sample preparation was done according to the
manufacturer’s instructions. Fluorescence (530/585 nm) was measured using the
POLARstar Omega (BMG LABTECH) at 37°C. Samples were normalized to protein
content. Data were analysed using GraphPad Prism 5.0.
Analyses of intracellular ADP and ATP
The ADP Colorimetric/Fluorometric Assay Kit (K355-100) and ATP
Colorimetric/Fluorometric Assay Kit (K354-100, both Biovision, BioCat) were used
22
.CC-BY-ND 4.0 International licensenot peer-reviewed) is the author/funder. It is made available under aThe copyright holder for this preprint (which was. http://dx.doi.org/10.1101/045567doi: bioRxiv preprint first posted online Mar. 24, 2016;

to quantify intracellular ADP and ATP content. Briefly, NHEK cells were seeded into
150 cm2 cell culture flasks (Corning) and treated with 50 µM RSV or vehicle for 16
hours. Flasks were washed once with ice cold PBS prior to harvest using a dispenser
(TPP). Cell suspensions were centrifuged at 1,000 g for 5 minutes at 4°C and
resuspended in ice-cold extraction buffer, aliquoted and stored at -20°C until usage.
The assay was miniaturized to 10% of the initial volume and conducted in a clear,
small-volume 384-well plate (# 784101, Greiner Bio-one) according to the
manufacturer’s protocol. Optical density was measured after 45 minutes at 570 nm
using the POLARstar Omega (BMG LABTECH). Samples were normalized to
protein content. Data were analysed using GraphPad Prism 5.0.
Intracellular NAD+ and NADH quantification
Intracellular NAD+ and NADH content was analysed using the colorimetric
NAD/NADH Quantitation Kit (Biovision, BioCat) according to the manufacturer’s
instruction. Briefly, NHEK cells were seeded into 150 cm2 cell culture flasks
(Corning) and treated with 50 µM RSV or vehicle for 16 hours. Flasks were washed
once with ice cold PBS prior to harvest using a dispenser (TPP). Cell suspensions
were centrifuged at 1,000 g for 5 minutes at 4°C and resuspended in ice-cold
extraction buffer. Afterwards, cells were lysed by two freeze-thaw-cycles, followed
by intensive vortexing and centrifugation at 20,800 g for 15 minutes at 4°C. Part of
the cell lysate was incubated at 60°C for 30 minutes to generate NAD+. Cycling
buffer, enzyme mix and developer were added according to the manufacturer’s
protocol. Optical density was measured after 30 minutes at 660 nm using the
POLARstar Omega (BMG LABTECH). Samples were normalized to protein content.
Data were analysed using GraphPad Prism 5.0.
Analyses of intracellular NADP+ and NADPH
The NADP/NADPH-Glo Assay Kit (G9081, Promega) was used to quantify the
intracellular NADP+ and NADPH content. NHEK cells were seeded into a 12-well
plate and treated with 50 µM RSV or vehicle for 16 hours. The following day, cells
were washed once in PBS, 60 µl PBS/well were added and cells were lysed in 60 µl
base solution with 1 % dodecyl(trimethyl)azanium bromide (DTAB, D8638, Sigma
Aldrich). Afterwards, 50 µl lysate were transferred into a clear 96-well plate to
measure NADP+ and NADPH individually according to the manufacturer’s protocol.
23
.CC-BY-ND 4.0 International licensenot peer-reviewed) is the author/funder. It is made available under aThe copyright holder for this preprint (which was. http://dx.doi.org/10.1101/045567doi: bioRxiv preprint first posted online Mar. 24, 2016;

Finally, 30 µl sample were transferred to a white-walled clear-bottom 384-well plate
(# 781098, Greiner Bio-one) and 30 µl of NADP/NADPH-Glo Detection Reagent
were added. Luminescence was measured after 30 minutes using the POLARstar
Omega (BMG LABTECH). Samples were normalized to protein content. Data were
analysed using GraphPad Prism 5.0.
Analyses of intracellular reduced and oxidized glutathione
Intracellular reduced (GSH) and oxidized (GSSG) glutathione were quantified using
the GSH/GSSG-Glo Assay Kit (V6611, Promega). NHEK cells were seeded in a 96-
well plate (TPP) with a density of 30,000 cells/well. The following day, cells were
treated with 50 µM RSV or vehicle for 16 hours. The assay was miniaturized to 25 %
of the initial volume and conducted according to the manufacturer’s protocol. In brief,
cell culture medium was removed, 12.5 µl/well Total Glutathione Lysis Reagent or
Oxidized Glutathione Lysis Reagent were added and incubated for 5 min at RT while
shaking. Afterwards, 12.5 µl/well Luciferin Generation Reagent were added and
incubated at RT for 30 minutes. Samples and standards were transferred to a white
96-well plate (# 655083, Greiner Bio-one) and 25 µl Luciferin Detection Reagent
were added. Luminescence was measured after 15 minutes using the POLARstar
Omega (BMG LABTECH). Samples were normalized to protein content. Data were
analysed using GraphPad Prism 5.0.
Oxygen consumption assay
Analyses of oxygen consumption was conducted by using the cell impermeable,
oxygen-sensing fluorophore MitoXpress Xtra (Luxcel Biosciences). NHEK cells were
seeded in a 96-well plate (TPP, Biochrom) with a density of 25,000 cells/well. The
day after, cells were treated with 50 µM RSV or vehicle for 16 hours and afterwards
equilibrated for 20 minutes under CO2-free conditions at 37°C. After aspirating cell
culture medium, 62.5 nM/well MitoXpress Xtra diluted in KGM (LONZA) was
added. The plate was incubated for 10 minutes under CO2-free conditions at 37°C.
Compounds were added as indicated and each well was sealed with 100 µl HS
Mineral Oil (Luxcel Biosciences). Dual-read time-resolved fluorescence (TR-F) was
measured (380/650 nm) with the POLARstar Omega (BMG LABTECH) at 37°C.
Lifetime, dual-delay and gate times were calculated and set according to the
manufacturer’s instructions. Data were analysed using GraphPad Prism 5.0.
24
.CC-BY-ND 4.0 International licensenot peer-reviewed) is the author/funder. It is made available under aThe copyright holder for this preprint (which was. http://dx.doi.org/10.1101/045567doi: bioRxiv preprint first posted online Mar. 24, 2016;
Fluorescence microscopy
NHEK cells were seeded in X-well tissue culture chambers (Sarstedt, Nürnbrecht,
Germany) at a density of 20,000 cells/well. One day later, adherent cells were treated
for 16 hours with the indicated compounds. Visualization of MAP1LC3A, Actin,
Nrf2, Keap1, GCLC and GSR was done as recently described in Weidner, et al. 43. In
brief, cells were washed with PBS (Sigma Aldrich) and fixed in 4 %
formaldehyde/PBS (Sigma Aldrich) for 15 minutes at RT. Cells were washed with
PBS (Sigma Aldrich), permeabilised in 0.3 % Triton X-100/PBS (PBS-Tx) for 10
minutes at RT, washed with PBS and afterwards blocked in 5 % goat serum (Sigma
Aldrich) in PBS-Tx for 60 minutes at RT. Afterwards, cells were incubated with
primary antibodies at 4°C overnight. Primary antibodies and dilutions were as
follows: MAP1LC3A (1:100; AP1801d-ev-AB, Biovision, BioCat), Nrf2 (1:100; sc-
13032X, Santa Cruz; 1:100), Keap1 (1:100, sc-365626, Santa Cruz), GCLC (1:100,
ab41463, Abcam) and GSR (1:100, sc-133159, Santa Cruz). Subsequently, cells were
washed with PBS-Tx and stained with anti-mouse IgG (H+L) F(ab')2 fragment Alexa
Fluor 555 Conjugate (# 4409, Cell Signaling Technology) and anti-rabbit IgG (H+L),
F(ab')2 fragment Alexa Fluor 488 Conjugate (# 4412, Cell Signaling Technology)
diluted (1:1,000) in 1 % BSA/PBS-Tx for 1 h at RT in the dark. Subsequently, cells
were washed with PBS for 5 minutes, and the MAP1LC3A stained cells were
counterstained with F-actin probe Texas Red-X Phalloidin (1:100, T7471, Life
Technologies) for 20 minutes at RT in the dark. Cells were washed with PBS, the
chamber was removed from the slide, samples were counterstained with ProLong
Gold Antifade Mountant (with DAPI) solution (Life technologies), a cover slip
applied (# 235503704, Duran Group, Wertheim/Main, Germany) and incubated at RT
for 24 hours. Fluorescence microscope imaging was performed on the LSM700
(Zeiss, Jena, Germany).
Redox potential, redox state and redox environment
To calculate the half-cell reduction potential of a selected redox couple the Nernst
equation (Eq. 2) was used and transformed to match the experimental conditions (T =
310K = 37°C, pH 7) (Eq. 3).
∆𝐸𝐸 = ∆𝐸𝐸0 −𝑅𝑅𝑇𝑇𝑒𝑒𝑛𝑛 ∗ 𝑙𝑙𝑒𝑒 𝑄𝑄
Eq. 2
25
.CC-BY-ND 4.0 International licensenot peer-reviewed) is the author/funder. It is made available under aThe copyright holder for this preprint (which was. http://dx.doi.org/10.1101/045567doi: bioRxiv preprint first posted online Mar. 24, 2016;

𝐸𝐸ℎ𝑐𝑐 = 𝐸𝐸0′ −61.5𝑒𝑒𝑚𝑚
𝑒𝑒 ∗ 𝑙𝑙𝑅𝑅𝑙𝑙𝑄𝑄
Eq. 3
R is the gas constant (8.314 J K-1 mol-1), T the temperature in Kelvin, n the number of
electrons exchanged, F the Faraday constant (9.6485*104 C mol-1) and Q the mass
action expression. As the standard reduction potential (E0, E0’) is pH dependent, an
adjustment is necessary:
𝐸𝐸𝑐𝑐𝐻𝐻 = 𝐸𝐸0′ + �(𝑠𝑠𝑝𝑝 − 7.0) ∗∆𝐸𝐸∆𝑠𝑠𝑝𝑝�
Eq. 4
EpH represents the half-cell reduction potential at a given pH, while ΔE/ΔpH is
dependent on the number of electrons and protons involved. Finally, the half-cell
reduction potential of a selected redox couple can be calculated according to (Eq. 5).
𝐸𝐸ℎ𝑐𝑐 = 𝐸𝐸𝑐𝑐𝐻𝐻 −61.5𝑒𝑒𝑚𝑚
𝑒𝑒 ∗ 𝑙𝑙𝑅𝑅𝑙𝑙[𝑒𝑒𝑅𝑅𝑅𝑅𝑟𝑟𝑟𝑟𝑅𝑅𝑅𝑅 𝑠𝑠𝑠𝑠𝑅𝑅𝑟𝑟𝑒𝑒𝑅𝑅𝑠𝑠][𝑅𝑅𝑅𝑅𝑒𝑒𝑅𝑅𝑒𝑒𝑜𝑜𝑅𝑅𝑅𝑅 𝑠𝑠𝑠𝑠𝑅𝑅𝑟𝑟𝑒𝑒𝑅𝑅𝑠𝑠]
Eq. 5
𝐸𝐸ℎ𝑐𝑐,𝑐𝑐𝐻𝐻 = 𝐸𝐸0′ + �(𝑠𝑠𝑝𝑝 − 7.0) ∗∆𝐸𝐸∆𝑠𝑠𝑝𝑝� −
61.5𝑒𝑒𝑚𝑚𝑒𝑒
∗ 𝑙𝑙𝑅𝑅𝑙𝑙[𝑒𝑒𝑅𝑅𝑅𝑅𝑟𝑟𝑟𝑟𝑅𝑅𝑅𝑅 𝑠𝑠𝑠𝑠𝑅𝑅𝑟𝑟𝑒𝑒𝑅𝑅𝑠𝑠][𝑅𝑅𝑅𝑅𝑒𝑒𝑅𝑅𝑒𝑒𝑜𝑜𝑅𝑅𝑅𝑅 𝑠𝑠𝑠𝑠𝑅𝑅𝑟𝑟𝑒𝑒𝑅𝑅𝑠𝑠]
Eq. 6
The half-cell reduction potential can be calculated for the following metabolites
(redox couples):
𝑃𝑃𝑃𝑃𝑒𝑒𝑟𝑟𝑒𝑒𝑃𝑃𝑒𝑒𝑅𝑅 + 2𝑝𝑝+ + 2𝑅𝑅− ⟶ 𝐿𝐿𝑃𝑃𝑟𝑟𝑒𝑒𝑃𝑃𝑒𝑒𝑅𝑅 𝐸𝐸0′ = −190𝑒𝑒𝑚𝑚
𝐸𝐸ℎ𝑐𝑐,𝑐𝑐𝐻𝐻 = −190𝑒𝑒𝑚𝑚 + [(𝑠𝑠𝑝𝑝 − 7.0) ∗ −61.5𝑒𝑒𝑚𝑚] −61.5𝑒𝑒𝑚𝑚
2 ∗ 𝑙𝑙𝑅𝑅𝑙𝑙[𝑙𝑙𝑃𝑃𝑟𝑟𝑒𝑒𝑃𝑃𝑒𝑒𝑅𝑅]
[𝑠𝑠𝑃𝑃𝑒𝑒𝑟𝑟𝑒𝑒𝑃𝑃𝑒𝑒𝑅𝑅]
Eq. 7
𝑁𝑁𝑁𝑁𝑁𝑁+ + 𝑝𝑝+ + 2𝑅𝑅− ⟶ 𝑁𝑁𝑁𝑁𝑁𝑁𝑝𝑝 𝐸𝐸0′ = −320𝑒𝑒𝑚𝑚
𝐸𝐸ℎ𝑐𝑐,𝑐𝑐𝐻𝐻 = −320𝑒𝑒𝑚𝑚 + [(𝑠𝑠𝑝𝑝 − 7.0) ∗ −30.75𝑒𝑒𝑚𝑚] −61.5𝑒𝑒𝑚𝑚
2 ∗ 𝑙𝑙𝑅𝑅𝑙𝑙[𝑁𝑁𝑁𝑁𝑁𝑁𝑝𝑝][𝑁𝑁𝑁𝑁𝑁𝑁+]
Eq. 8
𝑁𝑁𝑁𝑁𝑁𝑁𝑃𝑃+ + 𝑝𝑝+ + 2𝑅𝑅− ⟶ 𝑁𝑁𝑁𝑁𝑁𝑁𝑃𝑃𝑝𝑝 𝐸𝐸0′ = −320𝑒𝑒𝑚𝑚
𝐸𝐸ℎ𝑐𝑐,𝑐𝑐𝐻𝐻 = −320𝑒𝑒𝑚𝑚 + [(𝑠𝑠𝑝𝑝 − 7.0) ∗ −30.75𝑒𝑒𝑚𝑚] −61.5𝑒𝑒𝑚𝑚
2 ∗ 𝑙𝑙𝑅𝑅𝑙𝑙[𝑁𝑁𝑁𝑁𝑁𝑁𝑃𝑃𝑝𝑝][𝑁𝑁𝑁𝑁𝑁𝑁𝑃𝑃+]
Eq. 9
𝐺𝐺𝐺𝐺𝐺𝐺𝐺𝐺 + 2𝑝𝑝+ + 2𝑅𝑅− ⟶ 2𝐺𝐺𝐺𝐺𝑝𝑝 𝐸𝐸0′ = −240𝑒𝑒𝑚𝑚
26
.CC-BY-ND 4.0 International licensenot peer-reviewed) is the author/funder. It is made available under aThe copyright holder for this preprint (which was. http://dx.doi.org/10.1101/045567doi: bioRxiv preprint first posted online Mar. 24, 2016;

𝐸𝐸ℎ𝑐𝑐,𝑐𝑐𝐻𝐻 = −240𝑒𝑒𝑚𝑚 + [(𝑠𝑠𝑝𝑝 − 7.0) ∗ −61.5𝑒𝑒𝑚𝑚] −61.5𝑒𝑒𝑚𝑚
2 ∗ 𝑙𝑙𝑅𝑅𝑙𝑙[𝐺𝐺𝐺𝐺𝑝𝑝]2
[𝐺𝐺𝐺𝐺𝐺𝐺𝐺𝐺]
Eq. 10
Finally the redox environment is calculated using the redox couple 2GSH/GSSG
alone (Figure 5a and Table S4) or redox couples lactate/pyruvate, NADH/NAD+ and
2GSH/GSSG (Fig. S8f and Table S4), respectively.
To relate the reduced redox environment to a future oxidative challenge, we did a
thought experiment focusing on oxidation of ethanol to acetaldehyde and
simultaneous ROS generation 7-9:
𝑁𝑁𝑟𝑟𝑅𝑅𝑒𝑒𝑃𝑃𝑙𝑙𝑅𝑅𝑅𝑅ℎ𝑃𝑃𝑅𝑅𝑅𝑅 + 2𝑝𝑝+ + 2𝑅𝑅− ⟶ 𝐸𝐸𝑒𝑒ℎ𝑃𝑃𝑒𝑒𝑅𝑅𝑙𝑙 𝐸𝐸0′ = −195𝑒𝑒𝑚𝑚
𝐸𝐸ℎ𝑐𝑐 = −195𝑒𝑒𝑚𝑚 −61.5𝑒𝑒𝑚𝑚
2 ∗ 𝑙𝑙𝑅𝑅𝑙𝑙[𝐸𝐸𝑒𝑒ℎ𝑃𝑃𝑒𝑒𝑅𝑅𝑙𝑙]
[𝑁𝑁𝑟𝑟𝑅𝑅𝑒𝑒𝑃𝑃𝑙𝑙𝑅𝑅𝑅𝑅ℎ𝑃𝑃𝑅𝑅𝑅𝑅]
𝐸𝐸𝑐𝑐𝑒𝑒ℎ𝑎𝑎𝑛𝑛𝑐𝑐𝑐𝑐 = −195𝑒𝑒𝑚𝑚 − 30.75𝑒𝑒𝑚𝑚 ∗ 𝑙𝑙𝑅𝑅𝑙𝑙[𝐸𝐸𝑒𝑒ℎ𝑃𝑃𝑒𝑒𝑅𝑅𝑙𝑙]
[𝑁𝑁𝑟𝑟𝑅𝑅𝑒𝑒𝑃𝑃𝑙𝑙𝑅𝑅𝑅𝑅ℎ𝑃𝑃𝑅𝑅𝑅𝑅]
Eq. 11
In order to estimate the amount of ethanol caused ROS generation, which can be
quenched by RSV pre-treatment, we made the following assumptions:
• pH 7,
• T = 37°C,
• 2GSH/GSSG redox couple is the driving force of the redox environment and
• Concentrations of GSH and GSSG as measured at pH 7.0026 (vehicle) and
7.0632 (RSV), respectively.
At equilibrium, change of the half-cell reduction potentials of both couples equal 0
and can be transformed appropriately:
∆𝐸𝐸𝐺𝐺𝑆𝑆𝐻𝐻 = ∆𝐸𝐸𝐸𝐸𝑒𝑒ℎ𝑎𝑎𝑛𝑛𝑐𝑐𝑐𝑐 = 0 Eq. 12
∆𝐸𝐸𝐺𝐺𝑆𝑆𝐻𝐻 = −195𝑒𝑒𝑚𝑚 − 30.75𝑒𝑒𝑚𝑚 ∗ 𝑙𝑙𝑅𝑅𝑙𝑙 𝑄𝑄𝑅𝑅𝑆𝑆𝑅𝑅 − (−195𝑒𝑒𝑚𝑚 − 30.75𝑒𝑒𝑚𝑚 ∗ 𝑙𝑙𝑅𝑅𝑙𝑙 𝑄𝑄𝑅𝑅𝑐𝑐ℎ𝑖𝑖𝑐𝑐𝑐𝑐𝑐𝑐)
∆𝐸𝐸𝐺𝐺𝑆𝑆𝐻𝐻 = −195𝑒𝑒𝑚𝑚 − 30.75𝑒𝑒𝑚𝑚 ∗ 𝑙𝑙𝑅𝑅𝑙𝑙 𝑄𝑄𝑅𝑅𝑆𝑆𝑅𝑅 + 195𝑒𝑒𝑚𝑚 + 30.75𝑒𝑒𝑚𝑚 ∗ 𝑙𝑙𝑅𝑅𝑙𝑙𝑄𝑄𝑅𝑅𝑐𝑐ℎ𝑖𝑖𝑐𝑐𝑐𝑐𝑐𝑐
∆𝐸𝐸𝐺𝐺𝑆𝑆𝐻𝐻 = −30.75𝑒𝑒𝑚𝑚 ∗ 𝑙𝑙𝑅𝑅𝑙𝑙 𝑄𝑄𝑅𝑅𝑆𝑆𝑅𝑅 + 30.75𝑒𝑒𝑚𝑚 ∗ 𝑙𝑙𝑅𝑅𝑙𝑙𝑄𝑄𝑅𝑅𝑐𝑐ℎ𝑖𝑖𝑐𝑐𝑐𝑐𝑐𝑐 Eq. 13
According to Sarkola, et al. 44 the formation of acetaldehyde in humans is dependent
on the amount of ethanol. The mean slope was determined as follows:
27
.CC-BY-ND 4.0 International licensenot peer-reviewed) is the author/funder. It is made available under aThe copyright holder for this preprint (which was. http://dx.doi.org/10.1101/045567doi: bioRxiv preprint first posted online Mar. 24, 2016;
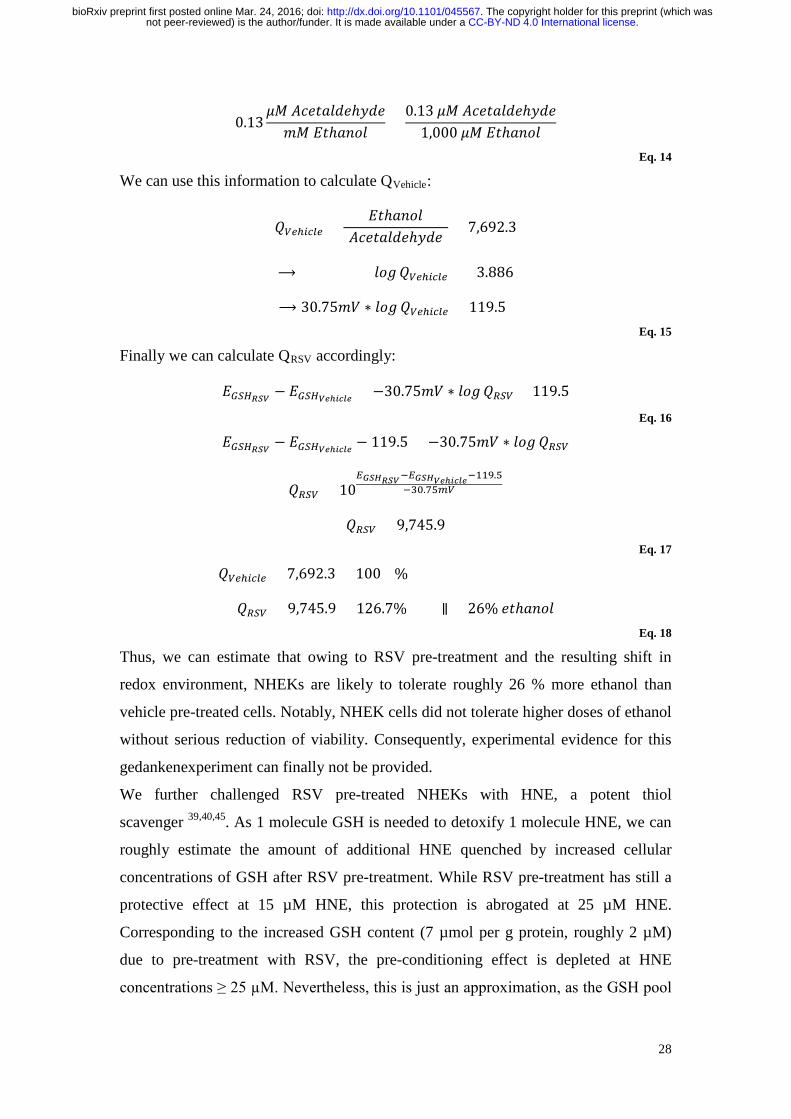
0.13𝜇𝜇𝜇𝜇 𝑁𝑁𝑟𝑟𝑅𝑅𝑒𝑒𝑃𝑃𝑙𝑙𝑅𝑅𝑅𝑅ℎ𝑃𝑃𝑅𝑅𝑅𝑅𝑒𝑒𝜇𝜇 𝐸𝐸𝑒𝑒ℎ𝑃𝑃𝑒𝑒𝑅𝑅𝑙𝑙 =
0.13 𝜇𝜇𝜇𝜇 𝑁𝑁𝑟𝑟𝑅𝑅𝑒𝑒𝑃𝑃𝑙𝑙𝑅𝑅𝑅𝑅ℎ𝑃𝑃𝑅𝑅𝑅𝑅1,000 𝜇𝜇𝜇𝜇 𝐸𝐸𝑒𝑒ℎ𝑃𝑃𝑒𝑒𝑅𝑅𝑙𝑙
Eq. 14
We can use this information to calculate QVehicle:
𝑄𝑄𝑅𝑅𝑐𝑐ℎ𝑖𝑖𝑐𝑐𝑐𝑐𝑐𝑐 =[𝐸𝐸𝑒𝑒ℎ𝑃𝑃𝑒𝑒𝑅𝑅𝑙𝑙]
[𝑁𝑁𝑟𝑟𝑅𝑅𝑒𝑒𝑃𝑃𝑙𝑙𝑅𝑅𝑅𝑅ℎ𝑃𝑃𝑅𝑅𝑅𝑅] = 7,692.3
⟶ 30.75𝑒𝑒𝑚𝑚 ∗ 𝑙𝑙𝑅𝑅𝑙𝑙𝑄𝑄𝑅𝑅𝑐𝑐ℎ𝑖𝑖𝑐𝑐𝑐𝑐𝑐𝑐 = 13.886
⟶ 30.75𝑒𝑒𝑚𝑚 ∗ 𝑙𝑙𝑅𝑅𝑙𝑙 𝑄𝑄𝑅𝑅𝑐𝑐ℎ𝑖𝑖𝑐𝑐𝑐𝑐𝑐𝑐 = 119.5 Eq. 15
Finally we can calculate QRSV accordingly:
𝐸𝐸𝐺𝐺𝑆𝑆𝐻𝐻𝑅𝑅𝑅𝑅𝑅𝑅 − 𝐸𝐸𝐺𝐺𝑆𝑆𝐻𝐻𝑅𝑅𝑉𝑉ℎ𝑖𝑖𝑖𝑖𝑖𝑖𝑉𝑉 = −30.75𝑒𝑒𝑚𝑚 ∗ 𝑙𝑙𝑅𝑅𝑙𝑙𝑄𝑄𝑅𝑅𝑆𝑆𝑅𝑅 + 119.5 Eq. 16
𝐸𝐸𝐺𝐺𝑆𝑆𝐻𝐻𝑅𝑅𝑅𝑅𝑅𝑅 − 𝐸𝐸𝐺𝐺𝑆𝑆𝐻𝐻𝑅𝑅𝑉𝑉ℎ𝑖𝑖𝑖𝑖𝑖𝑖𝑉𝑉 − 119.5 = −30.75𝑒𝑒𝑚𝑚 ∗ 𝑙𝑙𝑅𝑅𝑙𝑙 𝑄𝑄𝑅𝑅𝑆𝑆𝑅𝑅
𝑄𝑄𝑅𝑅𝑆𝑆𝑅𝑅 = 10𝐸𝐸𝐺𝐺𝑅𝑅𝐺𝐺𝑅𝑅𝑅𝑅𝑅𝑅−𝐸𝐸𝐺𝐺𝑅𝑅𝐺𝐺𝑅𝑅𝑉𝑉ℎ𝑖𝑖𝑖𝑖𝑖𝑖𝑉𝑉−119.5
−30.75𝑚𝑚𝑅𝑅
𝑄𝑄𝑅𝑅𝑆𝑆𝑅𝑅 = 9,745.9 Eq. 17
𝑄𝑄𝑅𝑅𝑐𝑐ℎ𝑖𝑖𝑐𝑐𝑐𝑐𝑐𝑐 = 7,692.3 = 100 %
𝑄𝑄𝑅𝑅𝑆𝑆𝑅𝑅 = 9,745.9 = 126.7% ∥ +26% 𝑅𝑅𝑒𝑒ℎ𝑃𝑃𝑒𝑒𝑅𝑅𝑙𝑙 Eq. 18
Thus, we can estimate that owing to RSV pre-treatment and the resulting shift in
redox environment, NHEKs are likely to tolerate roughly 26 % more ethanol than
vehicle pre-treated cells. Notably, NHEK cells did not tolerate higher doses of ethanol
without serious reduction of viability. Consequently, experimental evidence for this
gedankenexperiment can finally not be provided.
We further challenged RSV pre-treated NHEKs with HNE, a potent thiol
scavenger 39,40,45. As 1 molecule GSH is needed to detoxify 1 molecule HNE, we can
roughly estimate the amount of additional HNE quenched by increased cellular
concentrations of GSH after RSV pre-treatment. While RSV pre-treatment has still a
protective effect at 15 µM HNE, this protection is abrogated at 25 µM HNE.
Corresponding to the increased GSH content (7 µmol per g protein, roughly 2 µM)
due to pre-treatment with RSV, the pre-conditioning effect is depleted at HNE
concentrations ≥ 25 µM. Nevertheless, this is just an approximation, as the GSH pool
28
.CC-BY-ND 4.0 International licensenot peer-reviewed) is the author/funder. It is made available under aThe copyright holder for this preprint (which was. http://dx.doi.org/10.1101/045567doi: bioRxiv preprint first posted online Mar. 24, 2016;

regulates the reduction state of many biological molecules and because HNE can
efficiently react with many intracellular thiol groups, lipids and proteins present in the
biological system.
Statistical analyses
Data are expressed as mean ± standard error (s.e.m.), if not otherwise denoted.
Statistical tests were performed in GraphPad Prism 5.0. For comparison of two groups
statistical significance was examined by unpaired two-tailed Student’s t-test. One-way
ANOVA with subsequent Dunnett’s post-test was used for multiple comparisons. A P
value ≤ 0.05 was defined as statistically significant.
References
1 Quideau, S., Deffieux, D., Douat-Casassus, C. & Pouysegu, L. Plant
polyphenols: chemical properties, biological activities, and synthesis. Angew.
Chem. Int. Ed. Engl. 50, 586-621, doi:10.1002/anie.201000044 (2011).
2 Jang, M. et al. Cancer chemopreventive activity of resveratrol, a natural
product derived from grapes. Science 275, 218-220,
doi:10.1126/science.275.5297.218 (1997).
3 Smoliga, J. M., Baur, J. A. & Hausenblas, H. A. Resveratrol and health--a
comprehensive review of human clinical trials. Mol. Nutr. Food Res. 55,
1129-1141, doi:10.1002/mnfr.201100143 (2011).
4 Baxter, R. A. Anti-aging properties of resveratrol: review and report of a
potent new antioxidant skin care formulation. J. Cosmet. Dermatol. 7, 2-7,
doi:10.1111/j.1473-2165.2008.00354.x (2008).
5 Ndiaye, M., Philippe, C., Mukhtar, H. & Ahmad, N. The grape antioxidant
resveratrol for skin disorders: promise, prospects, and challenges. Arch.
Biochem. Biophys. 508, 164-170, doi:10.1016/j.abb.2010.12.030 (2011).
6 Gehm, B. D., McAndrews, J. M., Chien, P. Y. & Jameson, J. L. Resveratrol, a
polyphenolic compound found in grapes and wine, is an agonist for the
estrogen receptor. Proc. Natl. Acad. Sci. USA 94, 14138-14143,
doi:10.1073/pnas.94.25.14138 (1997).
7 Howitz, K. T. et al. Small molecule activators of sirtuins extend
Saccharomyces cerevisiae lifespan. Nature 425, 191-196,
doi:10.1038/nature01960 (2003).
29
.CC-BY-ND 4.0 International licensenot peer-reviewed) is the author/funder. It is made available under aThe copyright holder for this preprint (which was. http://dx.doi.org/10.1101/045567doi: bioRxiv preprint first posted online Mar. 24, 2016;

8 Park, S. J. et al. Resveratrol ameliorates aging-related metabolic phenotypes
by inhibiting cAMP phosphodiesterases. Cell 148, 421-433,
doi:10.1016/j.cell.2012.01.017 (2012).
9 Calabrese, E. J. & Baldwin, L. A. Hormesis: the dose-response revolution.
Annu. Rev. Pharmacol. Toxicol. 43, 175-197,
doi:10.1146/annurev.pharmtox.43.100901.140223 (2003).
10 Calabrese, E. J., Mattson, M. P. & Calabrese, V. Resveratrol commonly
displays hormesis: occurrence and biomedical significance. Hum. Exp.
Toxicol. 29, 980-1015, doi:10.1177/0960327110383625 (2010).
11 Gems, D. & Partridge, L. Stress-response hormesis and aging: "that which
does not kill us makes us stronger". Cell Metab. 7, 200-203,
doi:10.1016/j.cmet.2008.01.001 (2008).
12 Calabrese, E. J. Hormesis: from mainstream to therapy. J. Cell Commun.
Signal. 8, 289-291, doi:10.1007/s12079-014-0255-5 (2014).
13 Erlank, H., Elmann, A., Kohen, R. & Kanner, J. Polyphenols activate Nrf2 in
astrocytes via H2O2, semiquinones, and quinones. Free Radic Biol Med 51,
2319-2327, doi:10.1016/j.freeradbiomed.2011.09.033 (2011).
14 Li, D. D. et al. Hydroxyl radical reaction with trans-resveratrol: initial carbon
radical adduct formation followed by rearrangement to phenoxyl radical. J.
Phys. Chem. B 116, 7154-7161, doi:10.1021/jp3033337 (2012).
15 Stojanovic, S. & Brede, O. Elementary reactions of the antioxidant action of
trans-stilbene derivatives: resveratrol, pinosylvin and 4-hydroxystilbene. Phys.
Chem. Chem. Phys. 4, 757-764, doi:10.1039/b109063c (2002).
16 Yang, N. C., Lee, C. H. & Song, T. Y. Evaluation of resveratrol oxidation in
vitro and the crucial role of bicarbonate ions. Biosci. Biotechnol. Biochem. 74,
63-68, doi:10.1271/bbb.90549 (2010).
17 Winterbourn, C. C. Toxicity of iron and hydrogen peroxide: the Fenton
reaction. Toxicol. Lett. 82-83, 969-974, doi:10.1016/0378-4274(95)03532-X
(1995).
18 Long, L. H., Clement, M. V. & Halliwell, B. Artifacts in cell culture: rapid
generation of hydrogen peroxide on addition of (-)-epigallocatechin, (-)-
epigallocatechin gallate, (+)-catechin, and quercetin to commonly used cell
culture media. Biochem. Biophys. Res. Commun. 273, 50-53,
doi:10.1006/bbrc.2000.2895 (2000).
30
.CC-BY-ND 4.0 International licensenot peer-reviewed) is the author/funder. It is made available under aThe copyright holder for this preprint (which was. http://dx.doi.org/10.1101/045567doi: bioRxiv preprint first posted online Mar. 24, 2016;

19 Brahimi-Horn, M. C. & Pouyssegur, J. Oxygen, a source of life and stress.
FEBS Lett. 581, 3582-3591, doi:10.1016/j.febslet.2007.06.018 (2007).
20 Zupancic, S., Lavric, Z. & Kristl, J. Stability and solubility of trans-resveratrol
are strongly influenced by pH and temperature. Eur. J. Pharm. Biopharm. 93,
196-204, doi:10.1016/j.ejpb.2015.04.002 (2015).
21 Vang, O. et al. What is new for an old molecule? Systematic review and
recommendations on the use of resveratrol. PLoS One 6, e19881,
doi:10.1371/journal.pone.0019881 (2011).
22 Wenzel, E. & Somoza, V. Metabolism and bioavailability of trans-resveratrol.
Mol. Nutr. Food Res. 49, 472-481, doi:10.1002/mnfr.200500010 (2005).
23 Murakami, I. et al. Metabolism of skin-absorbed resveratrol into its
glucuronized form in mouse skin. PLoS One 9, e115359,
doi:10.1371/journal.pone.0115359 (2014).
24 Nair, M. S. Spectroscopic study on the interaction of resveratrol and
pterostilbene with human serum albumin. J. Photochem. Photobiol. B 149, 58-
67, doi:10.1016/j.jphotobiol.2015.05.001 (2015).
25 Sun, B. K., Siprashvili, Z. & Khavari, P. A. Advances in skin grafting and
treatment of cutaneous wounds. Science 346, 941-945,
doi:10.1126/science.1253836 (2014).
26 Abla, M. J. & Banga, A. K. Quantification of skin penetration of antioxidants
of varying lipophilicity. Int. J. Cosmet. Sci. 35, 19-26, doi:10.1111/j.1468-
2494.2012.00728.x (2013).
27 Zillich, O. V., Schweiggert-Weisz, U., Hasenkopf, K., Eisner, P. & Kerscher,
M. Release and in vitro skin permeation of polyphenols from cosmetic
emulsions. Int. J. Cosmet. Sci. 35, 491-501, doi:10.1111/ics.12072 (2013).
28 Kohanski, M. A., Dwyer, D. J. & Collins, J. J. How antibiotics kill bacteria:
from targets to networks. Nat. Rev. Microbiol. 8, 423-435,
doi:10.1038/nrmicro2333 (2010).
29 Huang, H. C., Nguyen, T. & Pickett, C. B. Regulation of the antioxidant
response element by protein kinase C-mediated phosphorylation of NF-E2-
related factor 2. Proc. Natl. Acad. Sci. USA 97, 12475-12480,
doi:10.1073/pnas.220418997 (2000).
31
.CC-BY-ND 4.0 International licensenot peer-reviewed) is the author/funder. It is made available under aThe copyright holder for this preprint (which was. http://dx.doi.org/10.1101/045567doi: bioRxiv preprint first posted online Mar. 24, 2016;

30 Ungvari, Z. et al. Resveratrol confers endothelial protection via activation of
the antioxidant transcription factor Nrf2. Am. J. Physiol. Heart Circ. Physiol.
299, H18-24, doi:10.1152/ajpheart.00260.2010 (2010).
31 Soeur, J., Eilstein, J., Lereaux, G., Jones, C. & Marrot, L. Skin resistance to
oxidative stress induced by resveratrol: from Nrf2 activation to GSH
biosynthesis. Free Radic. Biol. Med. 78, 213-223,
doi:10.1016/j.freeradbiomed.2014.10.510 (2015).
32 Morselli, E. et al. Caloric restriction and resveratrol promote longevity
through the Sirtuin-1-dependent induction of autophagy. Cell Death Dis. 1,
e10, doi:10.1038/cddis.2009.8 (2010).
33 Timmers, S. et al. Calorie restriction-like effects of 30 days of resveratrol
supplementation on energy metabolism and metabolic profile in obese
humans. Cell Metab. 14, 612-622, doi:10.1016/j.cmet.2011.10.002 (2011).
34 Pallauf, K., Giller, K., Huebbe, P. & Rimbach, G. Nutrition and healthy
ageing: calorie restriction or polyphenol-rich "MediterrAsian" diet? Oxid.
Med. Cell. Longev. 2013, 707421, doi:10.1155/2013/707421 (2013).
35 Chung, J. H. Metabolic benefits of inhibiting cAMP-PDEs with resveratrol.
Adipocyte 1, 256-258, doi:10.4161/adip.21158 (2012).
36 Schafer, F. Q. & Buettner, G. R. Redox environment of the cell as viewed
through the redox state of the glutathione disulfide/glutathione couple. Free
Radic. Biol. Med. 30, 1191-1212, doi:10.1016/S0891-5849(01)00480-4
(2001).
37 Schafer, M. & Werner, S. Nrf2-A regulator of keratinocyte redox signaling.
Free Radic. Biol. Med., doi:10.1016/j.freeradbiomed.2015.04.018 (2015).
38 Bailey, S. M., Pietsch, E. C. & Cunningham, C. C. Ethanol stimulates the
production of reactive oxygen species at mitochondrial complexes I and III.
Free Radic. Biol. Med. 27, 891-900, doi:10.1016/S0891-5849(99)00138-0
(1999).
39 Esterbauer, H., Zollner, H. & Scholz, N. Reaction of glutathione with
conjugated carbonyls. Z. Naturforsch. C 30, 466-473, doi:10.1515/znc-1975-
7-808 (1975).
40 Esterbauer, H., Schaur, R. J. & Zollner, H. Chemistry and biochemistry of 4-
hydroxynonenal, malonaldehyde and related aldehydes. Free Radic. Biol.
Med. 11, 81-128, doi:10.1016/0891-5849(91)90192-6 (1991).
32
.CC-BY-ND 4.0 International licensenot peer-reviewed) is the author/funder. It is made available under aThe copyright holder for this preprint (which was. http://dx.doi.org/10.1101/045567doi: bioRxiv preprint first posted online Mar. 24, 2016;

41 Livak, K. J. & Schmittgen, T. D. Analysis of relative gene expression data
using real-time quantitative PCR and the 2(-Delta Delta C(T)) Method.
Methods 25, 402-408, doi:10.1006/meth.2001.1262 (2001).
42 Subramanian, A. et al. Gene set enrichment analysis: a knowledge-based
approach for interpreting genome-wide expression profiles. Proc. Natl. Acad.
Sci. USA 102, 15545-15550, doi:10.1073/pnas.0506580102 (2005).
43 Weidner, C. et al. Melissa officinalis extract induces apoptosis and inhibits
proliferation in colon cancer cells through formation of reactive oxygen
species. Phytomedicine 22, 262-270, doi:10.1016/j.phymed.2014.12.008
(2015).
44 Sarkola, T., Iles, M. R., Kohlenberg-Mueller, K. & Eriksson, C. J. Ethanol,
acetaldehyde, acetate, and lactate levels after alcohol intake in white men and
women: effect of 4-methylpyrazole. Alcohol. Clin. Exp. Res. 26, 239-245
(2002).
45 Schreier, S. et al. Hydrogen Sulfide Scavenges the Cytotoxic Lipid Oxidation
Product 4-HNE. Neurotox. Res. 17, 249-256, doi:10.1007/s12640-009-9099-9
(2010).
Acknowledgements
We thank Gerald Rimbach, Sophia Bauch, Stefanie Becker and Chung-Ting Han for
valuable discussion and for support.
Author contributions statement
S.S. conceived, designed and supervised the study. A.P., A.G., S.C., S.J.W., L.L.,
C.W., M.K. G.J., S.L., L.J.W. and S.S. designed the experiments. A.P., A.G., S.C.,
S.J.W., L.L., M.R., and L.F. performed the experiments. A.P., A.G., S.C., S.J.W.,
L.L., L.F. and S.S. analysed the data. G.J., S.L., L.J.W. and S.S. provided tools. A.P.
and S.S. wrote the paper with input from M.K. and all other authors.
33
.CC-BY-ND 4.0 International licensenot peer-reviewed) is the author/funder. It is made available under aThe copyright holder for this preprint (which was. http://dx.doi.org/10.1101/045567doi: bioRxiv preprint first posted online Mar. 24, 2016;

Additional Information
Accession codes
The accession number for all genome-wide gene expression data used in this study is
GEO: GSE72119.
Competing financial interests
This work was supported by the German Ministry for Education and Research
(BMBF, grant number 0315082, 01EA1303) the National Genome Research Net
(NGFN, grant number 01 GS 0828), the European Union [FP7, under grant agreement
n° 262055 (ESGI)], and Unilever R&D. None of the funders has a financial interest.
Drs. Jenkins, Lotito and Wainwright are employees of Unilever, a company that
amongst other develops and sells dermatological and nutritional products.
34
.CC-BY-ND 4.0 International licensenot peer-reviewed) is the author/funder. It is made available under aThe copyright holder for this preprint (which was. http://dx.doi.org/10.1101/045567doi: bioRxiv preprint first posted online Mar. 24, 2016;

Kinetic intracellular ROS generation
0 2 4 6 8 10 12 14 160.0
0.5
1.0
1.5
2.0
Time (h)
Fold
cha
nge
vs.
vehi
cle
Superoxide generation inH2O + 44 mM NaHCO3
0 2 4 6 8 10 12 14 160.5
1.0
1.5
2.0
2.5
Time (h)
Fold
cha
nge
vs.
vehi
cle
Superoxide generation in KGM
0 2 4 6 8 10 12 14 160.5
1.0
1.5
2.0
2.5
Time (h)
Fold
cha
nge
vs.
vehi
cle
Intracellular ROS generation
0.0
1.0
2.0
3.0
4.0
5.0**
Vehicle
RSV
AUC
(105 R
FU h
)
b
c
Quenching of RSV
CAT NQO1 GCLC GSR DAPK10.125
0.25
0.5
1
2
4
8
16
+ 25 mM GSH
RSVVehicleRSV
*** ** *** ***
***
Rel.
expr
essi
on v
s.ve
hicl
e
-3 -2 -1 0 1 2 3
SpliceosomeDNA ReplicationCell Cycle
Natural Killer Cell Mediated CytotoxicityCytokine Cytokine Receptor Interaction
Steroid BiosynthesisSteroid Hormone BiosynthesisOther Glycan DegradationAdipocytokine Signaling PathwayFatty Acid MetabolismPPAR Signaling Pathway
Pentose and Glucuronate InterconversionsPyruvate Metabolism
LysosomePeroxisomeGlutathione Metabolism
Oxidative stress
Energy metabolism
PPAR signalingLipid metabolism
Inflammatory signaling
Proliferation
*************
**
***
******
NES (GSEA)
e
f
Lipid peroxidation
Vehicl
eRSV
0.0
2.0
4.0
6.0
8.0
Fluo
resc
ence
(105
RFU
) *
d
a
Figure 1. RSV produces ROS and triggers cellular defence. (a and b) Kinetic (a) and summed (b) intracellular
intracellular ROS generation in primary NHEK cells after administration of 50 µM RSV. Values are mean ± s.e.m. (n =
6); AUC, area under the curve; RFU, relative fluorescence units. (c) Generation of superoxide in H2O and
keratinocyte growth medium (KGM) after addition of 50 µM RSV for indicated time periods. Values are mean ± s.e.m.
(n = 4). (d) RSV (50 µM) induced lipid peroxidation in NHEKs. Values are mean ± s.e.m. (n = 4); *P < 0.05 versus
vehicle. (e) Selection of enriched KEGG pathways in NHEKs treated with 50 µM RSV using gene set enrichment
analysis (GSEA). Values are normalized enrichment scores (NES, n = 4 for vehicle, n = 3 for RSV); *P < 0.05, **P <
0.01, *** P ≤ 0.001 versus vehicle. See also Table S2. (f) GSH considerably quenched RSV effects on gene
expression. Values are mean ± s.e.m. (n = 4); ** P < 0.01; *** P ≤ 0.001 one-way ANOVA versus RSV.
.CC-BY-ND 4.0 International licensenot peer-reviewed) is the author/funder. It is made available under aThe copyright holder for this preprint (which was. http://dx.doi.org/10.1101/045567doi: bioRxiv preprint first posted online Mar. 24, 2016;

NHDF viability
1 10 100 10000
25
50
75
100
125
150
RSVRSV + 25 mM GSH
RSV concentration (µM)
Viab
ility
(%)
HepG2 viability
1 10 100 10000
25
50
75
100
125
150
RSVRSV + 25 mM GSH
RSV concentration (µM)
Viab
ility
(%)
NHEK viability
1 10 100 10000
25
50
75
100
125
150
RSVRSV + 25 mM GSH
RSV concentration (µM)
Viab
ility
(%)
d
0 1 10 100 1,0000
25
50
75
100
125
150
RSV concentration (µM)
Via
bility
(%)
Hormetic effects of RSV
0
2
4
6
CA
T ex
pres
sion
Hormetic zone
RSVRSV + 25 mM GSH
Equilibrium stateMaximum molecular effects without reduction of viability
a b
c
Figure 2. Hormetic effects are induced by generation of ROS derived from RSV. (a) RSV decreased viability of
NHEKs after 16 hours treatment at concentrations ≥ 50 µM (IC50: 223.8 µM). RSV effects on viability are considerably
quenched by GSH (IC50: 247,747.0 µM). Values are mean ± s.e.m. (n = 3). (b) Dose-response curve of RSV in
treated NHEKs (blue). Hormetic zone emerges from 1 to 60 µM RSV and highest molecular effects (gene expression
peaks of oxidative stress response gene catalase (CAT)) were generally observed at 50 µM RSV. (c) RSV decreased
viability of NHDF cells at concentrations ≥ 300 µM (IC50: 342.5 µM), which was quenched by GSH (IC50: 1,163.0 µM).
Values are mean ± s.e.m. (n = 6). (d) RSV decreased viability of human HepG2 liver cells at concentrations ≥ 150 µM
(IC50: 445.3 µM), GSH quenched RSV induced effects. Values are mean ± s.e.m. (n = 6).
.CC-BY-ND 4.0 International licensenot peer-reviewed) is the author/funder. It is made available under aThe copyright holder for this preprint (which was. http://dx.doi.org/10.1101/045567doi: bioRxiv preprint first posted online Mar. 24, 2016;

Metabolic marker
0.0625
0.125
0.25
0.5
1
2
4
8
5µM25µM50µM100µM150µM
RSV
G6PD PPAT FOXO3 SIRT1
# ###
# # #
##
#
#
## #
##
PPAT FOXO3 SIRT1
Rel.
expr
essi
on v
s.ve
hicl
e
Marker of aging
0.0625
0.125
0.25
0.5
1
2
4
8#
## #
#
# ##
#
MAPLC3BDAPK1
Rel.
expr
essi
on v
s.ve
hicl
eInflammatory marker
CXCL8 NFKBIA0.250.5
1248
163232
128
512
#
#
#
#
#
# ##
#
Rel.
expr
essi
on v
s.ve
hicl
e
b c
d
Metabolic marker
0.0625
0.125
0.25
0.5
1
2
4
8
5µM25µM50µM100µM150µM
RSV
G6PD PPAT FOXO3 SIRT1
# ###
# # #
##
#
#
## #
##
PPAT FOXO3 SIRT1
Rel.
expr
essi
on v
s.ve
hicl
e
VCytosolic
VR RP-Nrf2 (Ser40)Nrf2
Actin
NuclearNrf2 protein content
Nrf2/Actin
P-Nrf2/Actin
P-Nrf2/Nrf2
50
75
100
125
150
**CytosolicNuclear
* *
*
Veh
icle
(%)
e
Gene expression after Nrf2 knockdown
NQO1 GCLC G6PD PPAT MAP1LC3B NFKBIA0.5
1.0
2.0
4.0
8.0 Negative siRNANrf2 siRNA
*
*
***
**
Rel
. exp
ress
ion
vs.
neg.
siR
NA
veh
icle
f
Oxidative stress marker
0.06250.1250.250.512481632
CAT Nrf2 NQO1 GCLC GSRKEAP1
##
# #
# ###
#
##
#
# ##
#
##
# #
#
# # ##
Rel
. exp
ress
ion
vs.
vehi
cle
a
Figure 3. Cellular response to RSV-derived oxidation products including ROS is mediated by the redox-
sensitive transcription factor Nrf2. (a, b, c and d) Concentration-dependent effects of RSV in NHEK cells after 16
hours. Values are mean ± s.e.m. (n = 4); # P < 0.05 versus vehicle. Nrf2 and its target genes are marked in bold font.
See also Fig. S5a-d. (e) Translocation of Nrf2 and increased amount of nuclear phosphorylated Nrf2 as well as
nuclear Nrf2 protein. Densitometric analysis of immunoblots relative to vehicle, with all gels run under the same
experimental conditions and cropped blots depicted (copping: dashed line). Values are mean ± s.e.m. (n = 4), ** P <
0.01. V, vehicle; R, RSV. (f) Quantification of gene expression after knockdown of Nrf2 in RSV treated (16 hours)
NHEKs. Values are mean ± s.e.m. (n = 4); * P < 0.05, ** P < 0.01, *** P ≤ 0.001 one-way ANOVA versus negative
siRNA vehicle. See also Fig. S6b.

Cell cycle FACS
Sub G1 G0/G1 S G2/M0
20
40
60
80
VehicleRSV
n.s.
**
n.s.
*Cel
ls (%
)
DAPI MAP1LC3A Merge Ve
hicl
e R
SV
Actin b
c
Cleave
d cas
pase
7/ca
spas
e 7
Cleave
d cas
pase
9/ca
spas
e 9
Cleave
d PARP/PARP
50
100
150
200
250****
***Vehi
cle
(%)
Actin
Cleaved PARP PARP
Cleaved caspase 9
Caspase 9
Cleaved caspase 7
Caspase 7
Vehicle RSV
a
Apoptosis FACS
Necrotic Apoptotic0
5
10
15
20Vehicle50 µM RSV150 µM RSV
Cel
ls (%
)
d
Figure 4. RSV induced autophagy and G1 phase cell cycle arrest but did not cause apoptosis in NHEK cells.
(a) Fluorescence staining marking DAPI (blue), microtubule-associated protein 1 light chain 3A (MAP1LC3A, green)
and Actin (magenta) in RSV treated NHEKs. See also Fig. S5c. (b) G1 phase cell cycle arrest in NHEKs after 16
hours of treatment with 50 µM RSV . Values are mean ± s.e.m. (n = 4); * P < 0.05; ** P < 0.01, *** P ≤ 0.001 versus
vehicle. See also Fig. S6d. (c) RSV substantially increased the ratio of caspase 7 and PARP suggesting slight
apoptosis. All gels were run under the same experimental conditions and cropped blots depicted (copping: dashed
line). Values are mean ± s.e.m. (n = 4); * P < 0.05, ** P < 0.01, *** P ≤ 0.001 versus vehicle. (d) None of the tested
RSV concentrations did induce apoptosis after 16 hours of treatment of NHEKs, but 150 µM RSV tend to increase
necrotic cell proportion. Values are mean ± s.e.m. (n = 2). See also Fig. S6f.

Metabolites
Glucose
Pyruvate
Lactate
ADP
ATPNADH
NAD+
NADPH
NADP+
GSHGSSG
0.125
0.25
0.5
1
2
* *****
*** ***
** **
Fold
cha
nge
vs.
vehi
cle
Glutathione metabolism marker
GCLCGPX1
GPX3GSR
GSTA4
GSTZ11
2
4
8
16
32
***
*** ***
*** ***
***
Rel
. exp
ress
ion
vs.
vehi
cle
a b
-10
-8
-6
-4
-2
0
Vehicle
RSV -2.61Red
ox e
nviro
nmen
t(m
V m
mol
per
g p
rote
in)
c
0.0
0.5
1.0
1.5
2.0
HNE
Vehicle pre-treatment
RSV pre-treatment
25 µM20 µM15 µM
++-
-
*** **n.s.
++-
-+
+-
-
AUC
(106 R
FU h)
0.0
0.5
1.0
1.5
2.0
AUC
(106 R
FU h
)
***
0.8% EtOH
++-
-
d
Figure 5. RSV influenced the concentration of key metabolites to shift the cellular redox environment to a
reduced state, thereby increasing robustness versus oxidative stress. (a) Shift in intracellular metabolite
concentrations after treatment with 50 µM RSV for 16 hours in NHEKs. Values are mean ± s.e.m. (NADH, NAD+ n =
3; glucose, ATP, ADP, GSH, GSSG n = 4; lactate, pyruvate, NADPH, NADP+ n = 5); * P < 0.05, ** P < 0.01; *** P ≤
0.001 versus vehicle. See also Fig. S8d. (b) RSV substantially induced gene expression of glutathione metabolism
marker genes. Values are mean ± s.e.m. (n = 4); *** P ≤ 0.001 versus vehicle. (c) 2GSH/GSSG ratio was used to
calculate the redox environment. See also Table S4 and for calculation with various metabolites Fig. S8f. (d) Pre-
treatment of NHEKs with 50 µM RSV for 16 hours decreased intracellular ROS generation after subsequent treatment
with ethanol (0.78 %), while increasing concentrations of thiol/GSH-scavenger HNE revised ROS-protective potential.
Values are mean ± s.e.m. (n = 7); ** P < 0.01, *** P ≤ 0.001 versus vehicle. AUC, area under the curve; RFU, relative
fluorescence units.

& 2'A0&
Mild oxidative stress Energy metabolism shift/Redox environment shift
Transcription of target genes:GCLC, NQO1, G6PD
PNrf2
UV
HNE
ROS
Glucose
G6P PPP
Glycolysis
Pyruvate
Lactate
R5P
NAD+
+ NAM NADP+ NADPH
GSSG GSH
TCA
Relative oxygen consumption
Biological effect
GENERAL ASSUMPTION
Glucose uptake Antioxidant
Inflammation Aging …
Resveratrol Target molecule
Estrogen R SIRT1 PDE4 (Nrf2) …
Resveratrol Effector
Reactive oxygen species
Mediator
Nrf2 activation & translocation
Signaling
Genomic & metabolic
shift
Mild effect
Reduced redox
environment
PARADIGM SHIFT
HORMESIS
Concentration
Via
bilit
y
Mediator
? Nrf2 ? …
Biological effect
Glucose uptake Antioxidant
Inflammation Aging …
a
b
Figure 6. Molecular networks involved in RSV-induced cytoprotection against oxidative stress. (a) A dose-
dependent compound-target protein model is generally assumed to explain biological effects of RSV. Our proposed
model integrates mechanism of action of RSV via production of ROS in physiologically relevant media, Nrf2-mediated
cellular response and mild beneficial (hormetic) biological effects at normally applied concentrations. Estrogen R =
estrogen receptor, SIRT1 = silent mating type information regulation 2 homolog 1, PDE4 = phosphodiesterase 4. (b)
At low concentrations oxidising RSV induces mild stress, resulting in a metabolic and redox environment shift to
increase the level of endogenous quenchers to eventually protect the cell from environmental stress.