hospital-acquired infections, new york state 2013 ... · hospital-acquired infections new york...
TRANSCRIPT

HOSPITAL-ACQUIRED
INFECTIONS
New York State
2013
New York State
New York State Department of Health, Albany, NY September 2014
Table of Contents ExecutiveSummary ................................................................................................................................................... 3
Background ............................................................................................................................................................... 23
Hospital‐AcquiredSurgicalSiteInfections(SSIs) .............................................................................................. 25
ColonSurgicalSiteInfections ............................................................................................................................... 28
CoronaryArteryBypassGraft(CABG)SurgicalSiteInfections .......................................................................... 37
HipReplacement/RevisionSurgicalSiteInfections............................................................................................ 47
AbdominalHysterectomySurgicalSiteInfections .............................................................................................. 56
CentralLine‐AssociatedBloodstreamInfections(CLABSIs) ........................................................................... 70
Catheter‐AssociatedUrinaryTractInfections(CAUTIs) .................................................................................. 82
ClostridiumdifficileInfectionsandMulti‐drugResistantOrganisms ........................................................... 84
ClostridiumdifficileInfections(CDI) ................................................................................................................... 84
Multi‐drugresistantOrganisms(MDROs) ......................................................................................................... 102 Carbapenem‐resistantEnterobacteriaceaeInfections(CRE) ...................................................................... 103 Methicillin‐resistantStaphylococcusAureus(MRSA)Infections ................................................................ 110 OtherMDROs ................................................................................................................................................... 112
MortalityrelatedtoCDIandMDROs .................................................................................................................. 113
AntimicrobialStewardship ................................................................................................................................. 114
ComparisonofNYSHAIRateswithNationalHAIRates.................................................................................. 117
HAIPreventionProjects ....................................................................................................................................... 118
HospitalSuccessStories ....................................................................................................................................... 121
RecommendationsandNextSteps ..................................................................................................................... 125
Appendix1:ListofAbbreviations ...................................................................................................................... 127
Appendix2:GlossaryofTerms ........................................................................................................................... 129
Appendix3:Methods ............................................................................................................................................ 135
DataValidation ................................................................................................................................................ 135 ThresholdsforReportingHospital‐SpecificInfectionRates ........................................................................ 138 RiskAdjustment .............................................................................................................................................. 138 ComparisonofNYSandCMSHAIReporting ................................................................................................. 141
Appendix4:ListofHospitalsbyCounty ............................................................................................................ 143
Acknowledgements ............................................................................................................................................... 148
3
ExecutiveSummary
Hospital-acquired infections (HAIs) result in prolonged hospital stays, unnecessary deaths, increased antimicrobial resistance, greater healthcare costs, and added emotional and personal costs to patients and their families. This report summarizes HAI rates in New York State (NYS) hospitals in 2013. It is the seventh annual report to be issued since reporting began in 2007 following the implementation of Public Health Law 2819. All NYS HAI reports are available at http://www.health.ny.gov/statistics/facilities/hospital/hospital_acquired_infections/. These data are available for download at https://health.data.ny.gov/.
In 2013, 170 NYS acute care hospitals reported HAI data to meet NYS requirements. Table 1 summarizes the number of infections and infection rates by type of infection in 2013 and identifies whether the data were required by NYSDOH, the Centers for Medicare and Medicaid Services (CMS), or both. Community-onset infections (i.e. infections identified on the first three days of a hospital admission and therefore likely acquired before admission) are not the primary focus of the HAI Reporting Program, but they impact the development of HAIs in the hospital setting. The most common type of HAI reported was Clostridium difficile infections (CDIs), followed by surgical site infections (SSIs), catheter-associated urinary tract infections (CAUTIs), methicillin-resistant Staphylococcus aureus (MRSA) bloodstream infections (BSI), central line-associated bloodstream infections (CLABSIs), and carbapenem-resistant Enterobacteriaceae (CRE) bloodstream infections.
4
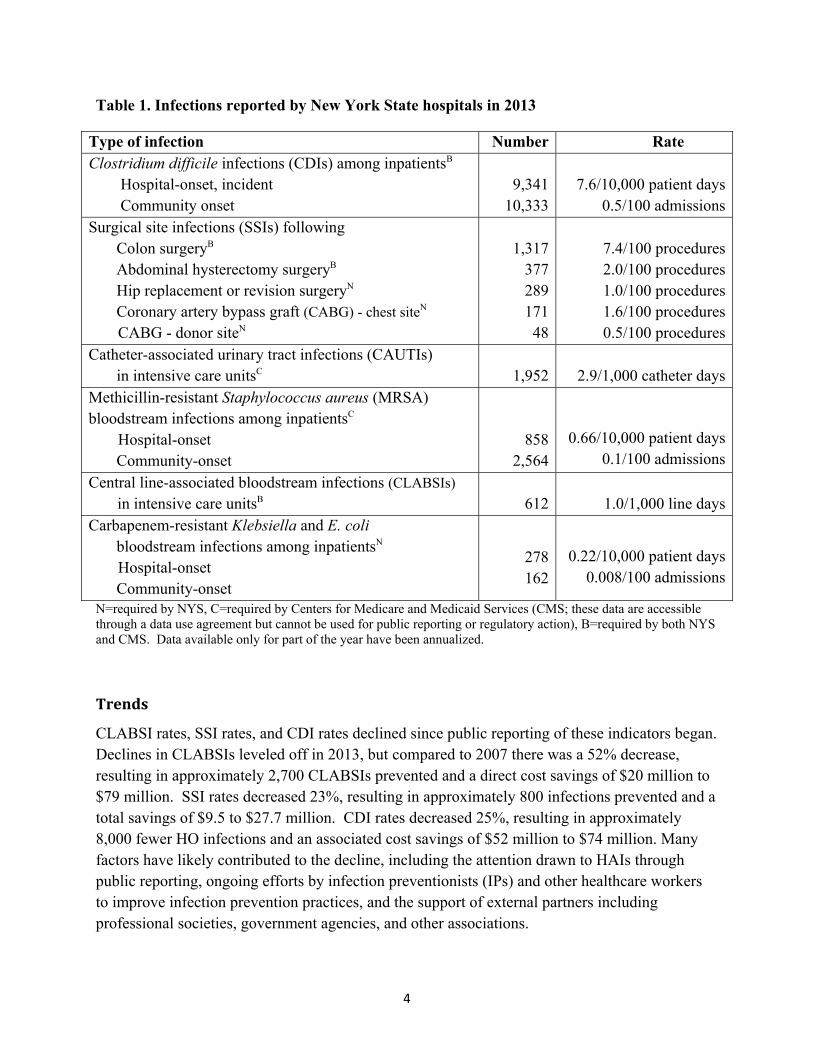
Table 1. Infections reported by New York State hospitals in 2013
Type of infection Number Rate Clostridium difficile infections (CDIs) among inpatientsB Hospital-onset, incident Community onset
9,34110,333
7.6/10,000 patient days0.5/100 admissions
Surgical site infections (SSIs) following Colon surgeryB Abdominal hysterectomy surgeryB Hip replacement or revision surgeryN Coronary artery bypass graft (CABG) - chest siteN
CABG - donor siteN
1,31737728917148
7.4/100 procedures2.0/100 procedures1.0/100 procedures1.6/100 procedures0.5/100 procedures
Catheter-associated urinary tract infections (CAUTIs) in intensive care unitsC 1,952 2.9/1,000 catheter daysMethicillin-resistant Staphylococcus aureus (MRSA) bloodstream infections among inpatientsC Hospital-onset Community-onset
8582,564
0.66/10,000 patient days0.1/100 admissions
Central line-associated bloodstream infections (CLABSIs) in intensive care unitsB 612 1.0/1,000 line days
Carbapenem-resistant Klebsiella and E. coli bloodstream infections among inpatientsN
Hospital-onset Community-onset
278162
0.22/10,000 patient days0.008/100 admissions
N=required by NYS, C=required by Centers for Medicare and Medicaid Services (CMS; these data are accessible through a data use agreement but cannot be used for public reporting or regulatory action), B=required by both NYS and CMS. Data available only for part of the year have been annualized.
Trends
CLABSI rates, SSI rates, and CDI rates declined since public reporting of these indicators began. Declines in CLABSIs leveled off in 2013, but compared to 2007 there was a 52% decrease, resulting in approximately 2,700 CLABSIs prevented and a direct cost savings of $20 million to $79 million. SSI rates decreased 23%, resulting in approximately 800 infections prevented and a total savings of $9.5 to $27.7 million. CDI rates decreased 25%, resulting in approximately 8,000 fewer HO infections and an associated cost savings of $52 million to $74 million. Many factors have likely contributed to the decline, including the attention drawn to HAIs through public reporting, ongoing efforts by infection preventionists (IPs) and other healthcare workers to improve infection prevention practices, and the support of external partners including professional societies, government agencies, and other associations.
5
DataValidation
Since HAI reporting began in 2007, NYSDOH has validated the accuracy of the data by reviewing medical records during audits. In 2013, 50% of hospitals were audited. The intensity of the auditing performed by NYSDOH exceeds the intensity of auditing performed by most other states and CMS in terms of the number of hospitals audited, the number of records audited in each hospital, and the methods used to efficiently target the records most likely to have errors. NYSDOH continues to take advantage of technological developments in healthcare information by performing off-site audits through remote access to electronic medical records (EMRs) and through the use of regional health information systems (RHIOs), saving travel time and money. In 2012, NYSDOH staff agreed with the hospital-reported infection status 94% of the time. Discordant results were discussed and corrected in the National Healthcare Safety Network (NHSN). Some inaccuracies continue to occur because of misunderstanding of NHSN definitions, incomplete surveillance, and data entry errors. Recommendations for improving SSI surveillance accuracy were reviewed with all hospitals in January 2013 during regional conference calls.
HospitalRateSummary
Table 2 summarizes HAI rates by hospital in 2012 and 2013. The 2012 data are included again this year in order to visualize patterns of repeated high and low performance and because there have been some modifications as a result of further auditing of the data. The table highlights hospitals that performed significantly better (shaded blue) or worse (shaded red) than the NYS average, after adjusting for differences in patients’ risk for infection. Table 2 provides a summary of all hospital rates at a glance. More detailed figures in the body of this report plot each hospital rate and confidence interval (the range around the measurement that shows how precise the measurement is). Those graphs can make it easier to understand why similar rates may or may not be flagged as significantly different because they graphically show the rate and width of the confidence interval compared to the state average. No hospital was flagged high for all indicators. NYSDOH works with hospitals that are flagged in the same category for multiple years to investigate reasons for continued high rates. RecommendationsandNextSteps
NYSDOH will continue to monitor and report hospital HAI rates to encourage continued reduction in HAIs. Following the NYSDOH HAI Reporting Program’s policy on hospitals that have significantly high rates (available at http://www.health.ny.gov/statistics/facilities/hospital/hospital_acquired_infections/), HAI staff will continue to work with hospitals that are underperforming to ensure that they implement effective improvement plans and show progress in decreasing rates. HAI staff will also continue
6
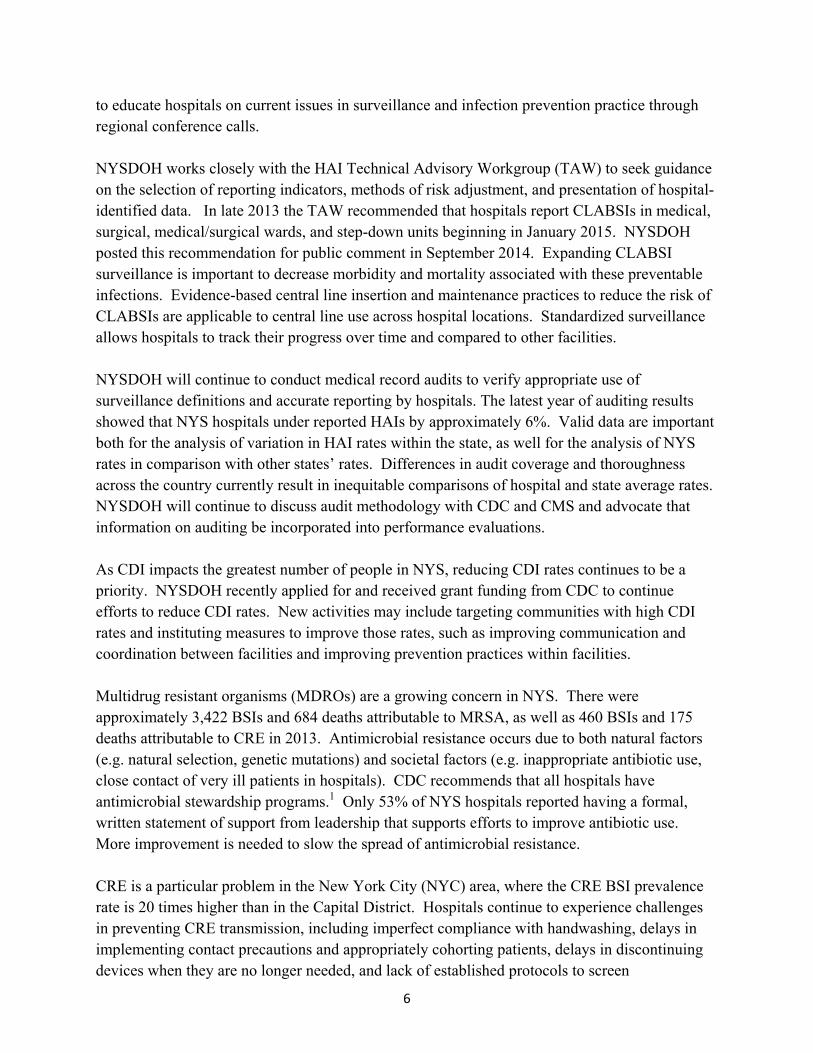
to educate hospitals on current issues in surveillance and infection prevention practice through regional conference calls. NYSDOH works closely with the HAI Technical Advisory Workgroup (TAW) to seek guidance on the selection of reporting indicators, methods of risk adjustment, and presentation of hospital-identified data. In late 2013 the TAW recommended that hospitals report CLABSIs in medical, surgical, medical/surgical wards, and step-down units beginning in January 2015. NYSDOH posted this recommendation for public comment in September 2014. Expanding CLABSI surveillance is important to decrease morbidity and mortality associated with these preventable infections. Evidence-based central line insertion and maintenance practices to reduce the risk of CLABSIs are applicable to central line use across hospital locations. Standardized surveillance allows hospitals to track their progress over time and compared to other facilities. NYSDOH will continue to conduct medical record audits to verify appropriate use of surveillance definitions and accurate reporting by hospitals. The latest year of auditing results showed that NYS hospitals under reported HAIs by approximately 6%. Valid data are important both for the analysis of variation in HAI rates within the state, as well for the analysis of NYS rates in comparison with other states’ rates. Differences in audit coverage and thoroughness across the country currently result in inequitable comparisons of hospital and state average rates. NYSDOH will continue to discuss audit methodology with CDC and CMS and advocate that information on auditing be incorporated into performance evaluations. As CDI impacts the greatest number of people in NYS, reducing CDI rates continues to be a priority. NYSDOH recently applied for and received grant funding from CDC to continue efforts to reduce CDI rates. New activities may include targeting communities with high CDI rates and instituting measures to improve those rates, such as improving communication and coordination between facilities and improving prevention practices within facilities. Multidrug resistant organisms (MDROs) are a growing concern in NYS. There were approximately 3,422 BSIs and 684 deaths attributable to MRSA, as well as 460 BSIs and 175 deaths attributable to CRE in 2013. Antimicrobial resistance occurs due to both natural factors (e.g. natural selection, genetic mutations) and societal factors (e.g. inappropriate antibiotic use, close contact of very ill patients in hospitals). CDC recommends that all hospitals have antimicrobial stewardship programs.1 Only 53% of NYS hospitals reported having a formal, written statement of support from leadership that supports efforts to improve antibiotic use. More improvement is needed to slow the spread of antimicrobial resistance. CRE is a particular problem in the New York City (NYC) area, where the CRE BSI prevalence rate is 20 times higher than in the Capital District. Hospitals continue to experience challenges in preventing CRE transmission, including imperfect compliance with handwashing, delays in implementing contact precautions and appropriately cohorting patients, delays in discontinuing devices when they are no longer needed, and lack of established protocols to screen
7
epidemiologically linked contacts and perform active surveillance testing in high-risk areas. NYSDOH recently applied for and received grant funding from CDC to focus additional attention on CRE in the NYC area. Grant related efforts will include working with hospitals and nursing homes to improve recognition of clusters, visiting facilities with high rates to assess compliance with recommended prevention and control practices, and facilitating communication between facilities. NYSDOH will continue to disseminate data on hospital-specific HAI rates in multiple formats, including annual reports and downloadable spreadsheets. Decisions regarding healthcare quality should not be based on these data alone. Consumers should consult with doctors, healthcare facilities, health insurance carriers, and reputable healthcare websites before deciding where to receive care.

8
This page was intentionally left blank.
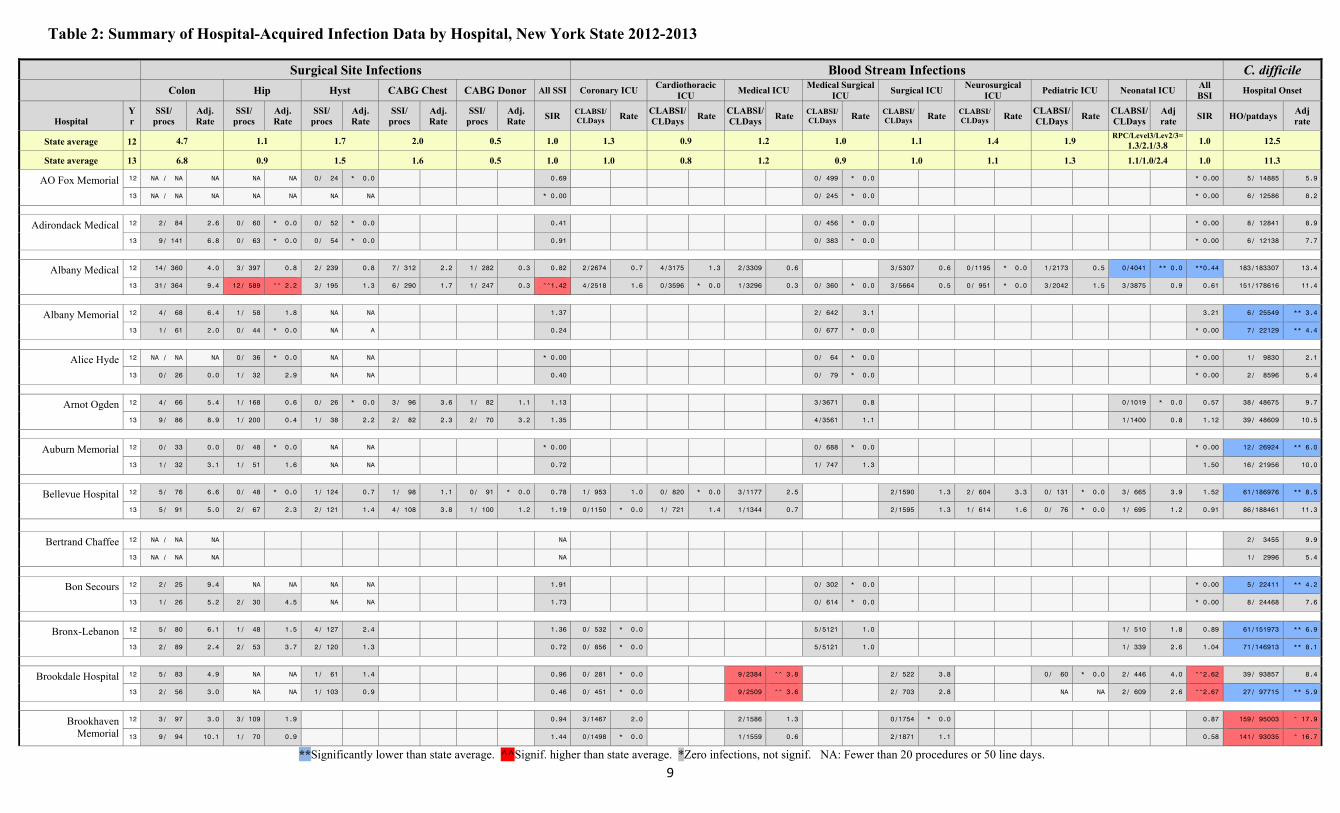
Table 2: Summary of Hospital-Acquired Infection Data by Hospital, New York State 2012-2013
**Significantly lower than state average. ^^Signif. higher than state average. *Zero infections, not signif. NA: Fewer than 20 procedures or 50 line days.
9
Surgical Site Infections Blood Stream Infections C. difficile Colon Hip Hyst CABG Chest CABG Donor All SSI Coronary ICU
Cardiothoracic ICU
Medical ICU Medical Surgical
ICU Surgical ICU
Neurosurgical ICU
Pediatric ICU Neonatal ICU All BSI
Hospital Onset
Hospital Yr
SSI/ procs
Adj. Rate
SSI/ procs
Adj. Rate
SSI/ procs
Adj. Rate
SSI/ procs
Adj. Rate
SSI/ procs
Adj. Rate
SIR CLABSI/CLDays Rate
CLABSI/CLDays
Rate CLABSI/CLDays
Rate CLABSI/CLDays Rate CLABSI/
CLDays Rate CLABSI/CLDays Rate
CLABSI/ CLDays
Rate CLABSI/ CLDays
Adj rate
SIR HO/patdays Adj rate
State average 12 4.7 1.1 1.7 2.0 0.5 1.0 1.3 0.9 1.2 1.0 1.1 1.4 1.9 RPC/Level3/Lev2/3=
1.3/2.1/3.8 1.0 12.5
State average 13 6.8 0.9 1.5 1.6 0.5 1.0 1.0 0.8 1.2 0.9 1.0 1.1 1.3 1.1/1.0/2.4 1.0 11.3
AO Fox Memorial 12 NA / NA NA NA NA 0/ 24 * 0.0 0.69 0/ 499 * 0.0 * 0.00 5/ 14885 5.9
13 NA / NA NA NA NA NA NA * 0.00 0/ 245 * 0.0 * 0.00 6/ 12586 8.2
Adirondack Medical 12 2/ 84 2.6 0/ 60 * 0.0 0/ 52 * 0.0 0.41 0/ 456 * 0.0 * 0.00 8/ 12841 8.9
13 9/ 141 6.8 0/ 63 * 0.0 0/ 54 * 0.0 0.91 0/ 383 * 0.0 * 0.00 6/ 12138 7.7
Albany Medical 12 14/ 360 4.0 3/ 397 0.8 2/ 239 0.8 7/ 312 2.2 1/ 282 0.3 0.82 2/2674 0.7 4/3175 1.3 2/3309 0.6 3/5307 0.6 0/1195 * 0.0 1/2173 0.5 0/4041 ** 0.0 **0.44 183/183307 13.4
13 31/ 364 9.4 12/ 589 ^^ 2.2 3/ 195 1.3 6/ 290 1.7 1/ 247 0.3 ^^1.42 4/2518 1.6 0/3596 * 0.0 1/3296 0.3 0/ 360 * 0.0 3/5664 0.5 0/ 951 * 0.0 3/2042 1.5 3/3875 0.9 0.61 151/178616 11.4
Albany Memorial 12 4/ 68 6.4 1/ 58 1.8 NA NA 1.37 2/ 642 3.1 3.21 6/ 25549 ** 3.4
13 1/ 61 2.0 0/ 44 * 0.0 NA A 0.24 0/ 677 * 0.0 * 0.00 7/ 22129 ** 4.4
Alice Hyde 12 NA / NA NA 0/ 36 * 0.0 NA NA * 0.00 0/ 64 * 0.0 * 0.00 1/ 9830 2.1
13 0/ 26 0.0 1/ 32 2.9 NA NA 0.40 0/ 79 * 0.0 * 0.00 2/ 8596 5.4
Arnot Ogden 12 4/ 66 5.4 1/ 168 0.6 0/ 26 * 0.0 3/ 96 3.6 1/ 82 1.1 1.13 3/3671 0.8 0/1019 * 0.0 0.57 38/ 48675 9.7
13 9/ 86 8.9 1/ 200 0.4 1/ 38 2.2 2/ 82 2.3 2/ 70 3.2 1.35 4/3561 1.1 1/1400 0.8 1.12 39/ 48609 10.5
Auburn Memorial 12 0/ 33 0.0 0/ 48 * 0.0 NA NA * 0.00 0/ 688 * 0.0 * 0.00 12/ 26924 ** 6.0
13 1/ 32 3.1 1/ 51 1.6 NA NA 0.72 1/ 747 1.3 1.50 16/ 21956 10.0
Bellevue Hospital 12 5/ 76 6.6 0/ 48 * 0.0 1/ 124 0.7 1/ 98 1.1 0/ 91 * 0.0 0.78 1/ 953 1.0 0/ 820 * 0.0 3/1177 2.5 2/1590 1.3 2/ 604 3.3 0/ 131 * 0.0 3/ 665 3.9 1.52 61/186976 ** 8.5
13 5/ 91 5.0 2/ 67 2.3 2/ 121 1.4 4/ 108 3.8 1/ 100 1.2 1.19 0/1150 * 0.0 1/ 721 1.4 1/1344 0.7 2/1595 1.3 1/ 614 1.6 0/ 76 * 0.0 1/ 695 1.2 0.91 86/188461 11.3
Bertrand Chaffee 12 NA / NA NA NA 2/ 3455 9.9
13 NA / NA NA NA 1/ 2996 5.4
Bon Secours 12 2/ 25 9.4 NA NA NA NA 1.91 0/ 302 * 0.0 * 0.00 5/ 22411 ** 4.2
13 1/ 26 5.2 2/ 30 4.5 NA NA 1.73 0/ 614 * 0.0 * 0.00 8/ 24468 7.6
Bronx-Lebanon 12 5/ 80 6.1 1/ 48 1.5 4/ 127 2.4 1.36 0/ 532 * 0.0 5/5121 1.0 1/ 510 1.8 0.89 61/151973 ** 6.9
13 2/ 89 2.4 2/ 53 3.7 2/ 120 1.3 0.72 0/ 856 * 0.0 5/5121 1.0 1/ 339 2.6 1.04 71/146913 ** 8.1
Brookdale Hospital 12 5/ 83 4.9 NA NA 1/ 61 1.4 0.96 0/ 281 * 0.0 9/2384 ^^ 3.8 2/ 522 3.8 0/ 60 * 0.0 2/ 446 4.0 ^^2.62 39/ 93857 8.4
13 2/ 56 3.0 NA NA 1/ 103 0.9 0.46 0/ 451 * 0.0 9/2509 ^^ 3.6 2/ 703 2.8 NA NA 2/ 609 2.6 ^^2.67 27/ 97715 ** 5.9
Brookhaven Memorial
12 3/ 97 3.0 3/ 109 1.9 0.94 3/1467 2.0 2/1586 1.3 0/1754 * 0.0 0.87 159/ 95003 ^ 17.9
13 9/ 94 10.1 1/ 70 0.9 1.44 0/1498 * 0.0 1/1559 0.6 2/1871 1.1 0.58 141/ 93035 ^ 16.7
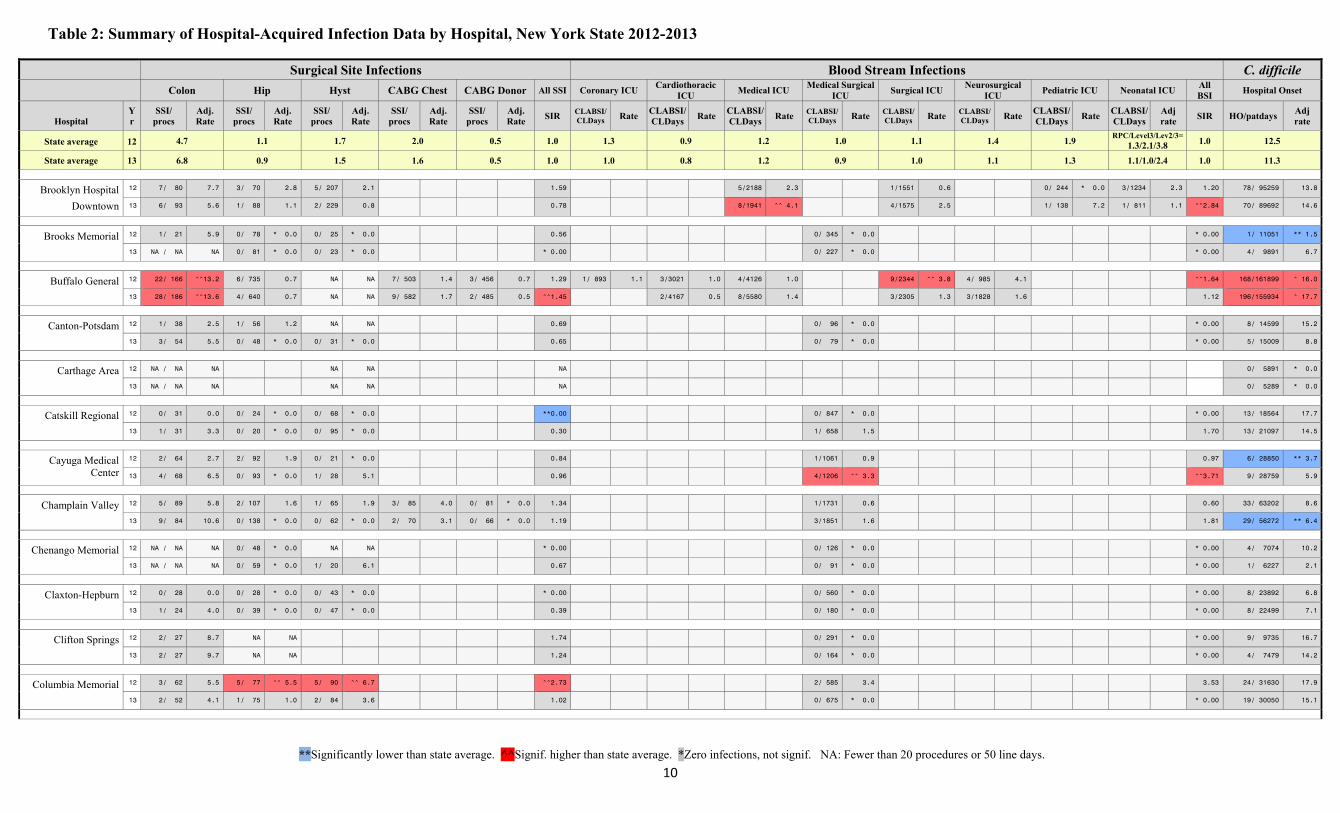
Table 2: Summary of Hospital-Acquired Infection Data by Hospital, New York State 2012-2013
**Significantly lower than state average. ^^Signif. higher than state average. *Zero infections, not signif. NA: Fewer than 20 procedures or 50 line days.
10
Surgical Site Infections Blood Stream Infections C. difficile Colon Hip Hyst CABG Chest CABG Donor All SSI Coronary ICU
Cardiothoracic ICU
Medical ICU Medical Surgical
ICU Surgical ICU
Neurosurgical ICU
Pediatric ICU Neonatal ICU All BSI
Hospital Onset
Hospital Yr
SSI/ procs
Adj. Rate
SSI/ procs
Adj. Rate
SSI/ procs
Adj. Rate
SSI/ procs
Adj. Rate
SSI/ procs
Adj. Rate
SIR CLABSI/CLDays Rate
CLABSI/CLDays
Rate CLABSI/CLDays
Rate CLABSI/CLDays Rate CLABSI/
CLDays Rate CLABSI/CLDays Rate
CLABSI/ CLDays
Rate CLABSI/ CLDays
Adj rate
SIR HO/patdays Adj rate
State average 12 4.7 1.1 1.7 2.0 0.5 1.0 1.3 0.9 1.2 1.0 1.1 1.4 1.9 RPC/Level3/Lev2/3=
1.3/2.1/3.8 1.0 12.5
State average 13 6.8 0.9 1.5 1.6 0.5 1.0 1.0 0.8 1.2 0.9 1.0 1.1 1.3 1.1/1.0/2.4 1.0 11.3
Brooklyn Hospital
Downtown
12 7/ 80 7.7 3/ 70 2.8 5/ 207 2.1 1.59 5/2188 2.3 1/1551 0.6 0/ 244 * 0.0 3/1234 2.3 1.20 78/ 95259 13.8
13 6/ 93 5.6 1/ 88 1.1 2/ 229 0.8 0.78 8/1941 ^^ 4.1 4/1575 2.5 1/ 138 7.2 1/ 811 1.1 ^^2.84 70/ 89692 14.6
Brooks Memorial 12 1/ 21 5.9 0/ 78 * 0.0 0/ 25 * 0.0 0.56 0/ 345 * 0.0 * 0.00 1/ 11051 ** 1.5
13 NA / NA NA 0/ 81 * 0.0 0/ 23 * 0.0 * 0.00 0/ 227 * 0.0 * 0.00 4/ 9891 6.7
Buffalo General 12 22/ 166 ^^13.2 6/ 735 0.7 NA NA 7/ 503 1.4 3/ 456 0.7 1.29 1/ 893 1.1 3/3021 1.0 4/4126 1.0 9/2344 ^^ 3.8 4/ 985 4.1 ^^1.64 168/161899 ^ 16.0
13 28/ 186 ^^13.6 4/ 640 0.7 NA NA 9/ 582 1.7 2/ 485 0.5 ^^1.45 2/4167 0.5 8/5580 1.4 3/2305 1.3 3/1828 1.6 1.12 196/155934 ^ 17.7
Canton-Potsdam 12 1/ 38 2.5 1/ 56 1.2 NA NA 0.69 0/ 96 * 0.0 * 0.00 8/ 14599 15.2
13 3/ 54 5.5 0/ 48 * 0.0 0/ 31 * 0.0 0.65 0/ 79 * 0.0 * 0.00 5/ 15009 8.8
Carthage Area 12 NA / NA NA NA NA NA 0/ 5891 * 0.0
13 NA / NA NA NA NA NA 0/ 5289 * 0.0
Catskill Regional 12 0/ 31 0.0 0/ 24 * 0.0 0/ 68 * 0.0 **0.00 0/ 847 * 0.0 * 0.00 13/ 18564 17.7
13 1/ 31 3.3 0/ 20 * 0.0 0/ 95 * 0.0 0.30 1/ 658 1.5 1.70 13/ 21097 14.5
Cayuga Medical Center
12 2/ 64 2.7 2/ 92 1.9 0/ 21 * 0.0 0.84 1/1061 0.9 0.97 6/ 28850 ** 3.7
13 4/ 68 6.5 0/ 93 * 0.0 1/ 28 5.1 0.96 4/1206 ^^ 3.3 ^^3.71 9/ 28759 5.9
Champlain Valley 12 5/ 89 5.8 2/ 107 1.6 1/ 65 1.9 3/ 85 4.0 0/ 81 * 0.0 1.34 1/1731 0.6 0.60 33/ 63202 8.6
13 9/ 84 10.6 0/ 138 * 0.0 0/ 62 * 0.0 2/ 70 3.1 0/ 66 * 0.0 1.19 3/1851 1.6 1.81 29/ 56272 ** 6.4
Chenango Memorial 12 NA / NA NA 0/ 48 * 0.0 NA NA * 0.00 0/ 126 * 0.0 * 0.00 4/ 7074 10.2
13 NA / NA NA 0/ 59 * 0.0 1/ 20 6.1 0.67 0/ 91 * 0.0 * 0.00 1/ 6227 2.1
Claxton-Hepburn 12 0/ 28 0.0 0/ 28 * 0.0 0/ 43 * 0.0 * 0.00 0/ 560 * 0.0 * 0.00 8/ 23892 6.8
13 1/ 24 4.0 0/ 39 * 0.0 0/ 47 * 0.0 0.39 0/ 180 * 0.0 * 0.00 8/ 22499 7.1
Clifton Springs 12 2/ 27 8.7 NA NA 1.74 0/ 291 * 0.0 * 0.00 9/ 9735 16.7
13 2/ 27 9.7 NA NA 1.24 0/ 164 * 0.0 * 0.00 4/ 7479 14.2
Columbia Memorial 12 3/ 62 5.5 5/ 77 ^^ 5.5 5/ 90 ^^ 6.7 ^^2.73 2/ 585 3.4 3.53 24/ 31630 17.9
13 2/ 52 4.1 1/ 75 1.0 2/ 84 3.6 1.02 0/ 675 * 0.0 * 0.00 19/ 30050 15.1
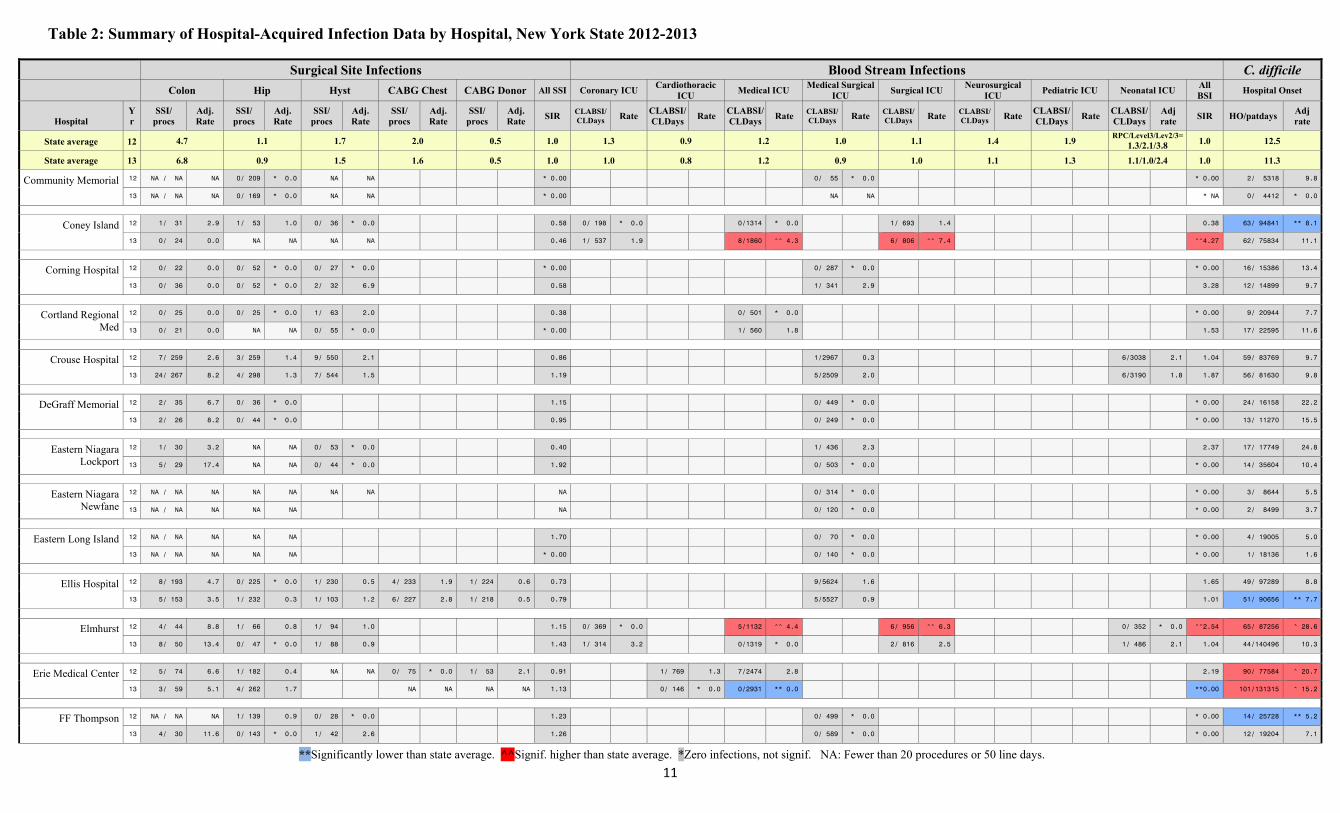
Table 2: Summary of Hospital-Acquired Infection Data by Hospital, New York State 2012-2013
**Significantly lower than state average. ^^Signif. higher than state average. *Zero infections, not signif. NA: Fewer than 20 procedures or 50 line days.
11
Surgical Site Infections Blood Stream Infections C. difficile Colon Hip Hyst CABG Chest CABG Donor All SSI Coronary ICU
Cardiothoracic ICU
Medical ICU Medical Surgical
ICU Surgical ICU
Neurosurgical ICU
Pediatric ICU Neonatal ICU All BSI
Hospital Onset
Hospital Yr
SSI/ procs
Adj. Rate
SSI/ procs
Adj. Rate
SSI/ procs
Adj. Rate
SSI/ procs
Adj. Rate
SSI/ procs
Adj. Rate
SIR CLABSI/CLDays Rate
CLABSI/CLDays
Rate CLABSI/CLDays
Rate CLABSI/CLDays Rate CLABSI/
CLDays Rate CLABSI/CLDays Rate
CLABSI/ CLDays
Rate CLABSI/ CLDays
Adj rate
SIR HO/patdays Adj rate
State average 12 4.7 1.1 1.7 2.0 0.5 1.0 1.3 0.9 1.2 1.0 1.1 1.4 1.9 RPC/Level3/Lev2/3=
1.3/2.1/3.8 1.0 12.5
State average 13 6.8 0.9 1.5 1.6 0.5 1.0 1.0 0.8 1.2 0.9 1.0 1.1 1.3 1.1/1.0/2.4 1.0 11.3
Community Memorial 12 NA / NA NA 0/ 209 * 0.0 NA NA * 0.00 0/ 55 * 0.0 * 0.00 2/ 5318 9.8
13 NA / NA NA 0/ 169 * 0.0 NA NA * 0.00 NA NA * NA 0/ 4412 * 0.0
Coney Island 12 1/ 31 2.9 1/ 53 1.0 0/ 36 * 0.0 0.58 0/ 198 * 0.0 0/1314 * 0.0 1/ 693 1.4 0.38 63/ 94841 ** 8.1
13 0/ 24 0.0 NA NA NA NA 0.46 1/ 537 1.9 8/1860 ^^ 4.3 6/ 806 ^^ 7.4 ^^4.27 62/ 75834 11.1
Corning Hospital 12 0/ 22 0.0 0/ 52 * 0.0 0/ 27 * 0.0 * 0.00 0/ 287 * 0.0 * 0.00 16/ 15386 13.4
13 0/ 36 0.0 0/ 52 * 0.0 2/ 32 6.9 0.58 1/ 341 2.9 3.28 12/ 14899 9.7
Cortland Regional Med
12 0/ 25 0.0 0/ 25 * 0.0 1/ 63 2.0 0.38 0/ 501 * 0.0 * 0.00 9/ 20944 7.7
13 0/ 21 0.0 NA NA 0/ 55 * 0.0 * 0.00 1/ 560 1.8 1.53 17/ 22595 11.6
Crouse Hospital 12 7/ 259 2.6 3/ 259 1.4 9/ 550 2.1 0.86 1/2967 0.3 6/3038 2.1 1.04 59/ 83769 9.7
13 24/ 267 8.2 4/ 298 1.3 7/ 544 1.5 1.19 5/2509 2.0 6/3190 1.8 1.87 56/ 81630 9.8
DeGraff Memorial 12 2/ 35 6.7 0/ 36 * 0.0 1.15 0/ 449 * 0.0 * 0.00 24/ 16158 22.2
13 2/ 26 8.2 0/ 44 * 0.0 0.95 0/ 249 * 0.0 * 0.00 13/ 11270 15.5
Eastern Niagara Lockport
12 1/ 30 3.2 NA NA 0/ 53 * 0.0 0.40 1/ 436 2.3 2.37 17/ 17749 24.8
13 5/ 29 17.4 NA NA 0/ 44 * 0.0 1.92 0/ 503 * 0.0 * 0.00 14/ 35604 10.4
Eastern Niagara Newfane
12 NA / NA NA NA NA NA NA NA 0/ 314 * 0.0 * 0.00 3/ 8644 5.5
13 NA / NA NA NA NA NA 0/ 120 * 0.0 * 0.00 2/ 8499 3.7
Eastern Long Island 12 NA / NA NA NA NA 1.70 0/ 70 * 0.0 * 0.00 4/ 19005 5.0
13 NA / NA NA NA NA * 0.00 0/ 140 * 0.0 * 0.00 1/ 18136 1.6
Ellis Hospital 12 8/ 193 4.7 0/ 225 * 0.0 1/ 230 0.5 4/ 233 1.9 1/ 224 0.6 0.73 9/5624 1.6 1.65 49/ 97289 8.8
13 5/ 153 3.5 1/ 232 0.3 1/ 103 1.2 6/ 227 2.8 1/ 218 0.5 0.79 5/5527 0.9 1.01 51/ 90656 ** 7.7
Elmhurst 12 4/ 44 8.8 1/ 66 0.8 1/ 94 1.0 1.15 0/ 369 * 0.0 5/1132 ^^ 4.4 6/ 956 ^^ 6.3 0/ 352 * 0.0 ^^2.54 65/ 87256 ^ 28.6
13 8/ 50 13.4 0/ 47 * 0.0 1/ 88 0.9 1.43 1/ 314 3.2 0/1319 * 0.0 2/ 816 2.5 1/ 486 2.1 1.04 44/140496 10.3
Erie Medical Center 12 5/ 74 6.6 1/ 182 0.4 NA NA 0/ 75 * 0.0 1/ 53 2.1 0.91 1/ 769 1.3 7/2474 2.8 2.19 90/ 77584 ^ 20.7
13 3/ 59 5.1 4/ 262 1.7 NA NA NA NA 1.13 0/ 146 * 0.0 0/2931 ** 0.0 **0.00 101/131315 ^ 15.2
FF Thompson 12 NA / NA NA 1/ 139 0.9 0/ 28 * 0.0 1.23 0/ 499 * 0.0 * 0.00 14/ 25728 ** 5.2
13 4/ 30 11.6 0/ 143 * 0.0 1/ 42 2.6 1.26 0/ 589 * 0.0 * 0.00 12/ 19204 7.1
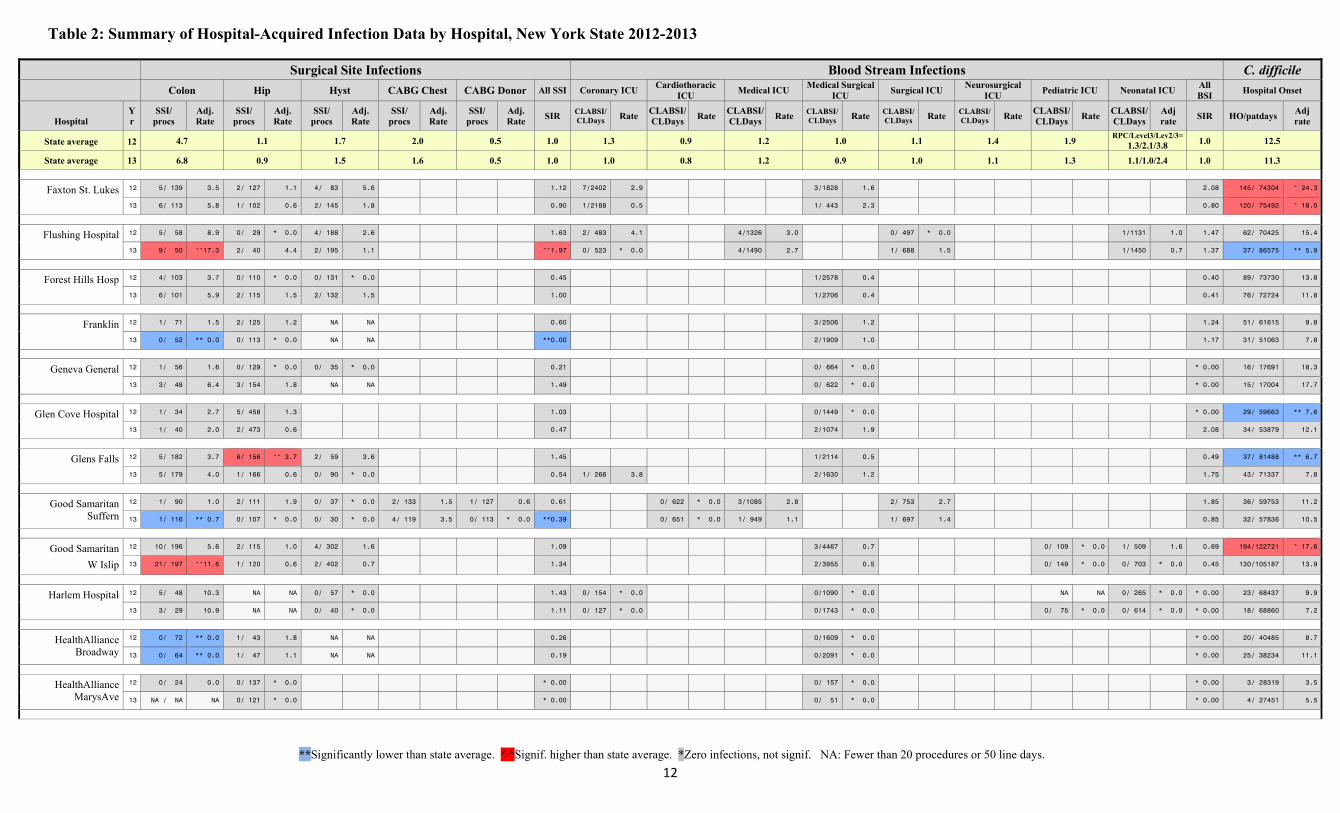
Table 2: Summary of Hospital-Acquired Infection Data by Hospital, New York State 2012-2013
**Significantly lower than state average. ^^Signif. higher than state average. *Zero infections, not signif. NA: Fewer than 20 procedures or 50 line days.
12
Surgical Site Infections Blood Stream Infections C. difficile Colon Hip Hyst CABG Chest CABG Donor All SSI Coronary ICU
Cardiothoracic ICU
Medical ICU Medical Surgical
ICU Surgical ICU
Neurosurgical ICU
Pediatric ICU Neonatal ICU All BSI
Hospital Onset
Hospital Yr
SSI/ procs
Adj. Rate
SSI/ procs
Adj. Rate
SSI/ procs
Adj. Rate
SSI/ procs
Adj. Rate
SSI/ procs
Adj. Rate
SIR CLABSI/CLDays Rate
CLABSI/CLDays
Rate CLABSI/CLDays
Rate CLABSI/CLDays Rate CLABSI/
CLDays Rate CLABSI/CLDays Rate
CLABSI/ CLDays
Rate CLABSI/ CLDays
Adj rate
SIR HO/patdays Adj rate
State average 12 4.7 1.1 1.7 2.0 0.5 1.0 1.3 0.9 1.2 1.0 1.1 1.4 1.9 RPC/Level3/Lev2/3=
1.3/2.1/3.8 1.0 12.5
State average 13 6.8 0.9 1.5 1.6 0.5 1.0 1.0 0.8 1.2 0.9 1.0 1.1 1.3 1.1/1.0/2.4 1.0 11.3
Faxton St. Lukes 12 5/ 139 3.5 2/ 127 1.1 4/ 83 5.6 1.12 7/2402 2.9 3/1828 1.6 2.08 145/ 74304 ^ 24.3
13 6/ 113 5.8 1/ 102 0.6 2/ 145 1.8 0.90 1/2188 0.5 1/ 443 2.3 0.80 120/ 75492 ^ 18.0
Flushing Hospital 12 5/ 58 8.9 0/ 29 * 0.0 4/ 188 2.6 1.63 2/ 483 4.1 4/1326 3.0 0/ 497 * 0.0 1/1131 1.0 1.47 62/ 70425 15.4
13 9/ 50 ^^17.3 2/ 40 4.4 2/ 195 1.1 ^^1.97 0/ 523 * 0.0 4/1490 2.7 1/ 688 1.5 1/1450 0.7 1.37 37/ 86575 ** 5.9
Forest Hills Hosp 12 4/ 103 3.7 0/ 110 * 0.0 0/ 131 * 0.0 0.45 1/2578 0.4 0.40 89/ 73730 13.8
13 6/ 101 5.9 2/ 115 1.5 2/ 132 1.5 1.00 1/2706 0.4 0.41 76/ 72724 11.8
Franklin 12 1/ 71 1.5 2/ 125 1.2 NA NA 0.60 3/2506 1.2 1.24 51/ 61615 9.8
13 0/ 52 ** 0.0 0/ 113 * 0.0 NA NA **0.00 2/1909 1.0 1.17 31/ 51063 7.8
Geneva General 12 1/ 56 1.6 0/ 129 * 0.0 0/ 35 * 0.0 0.21 0/ 664 * 0.0 * 0.00 16/ 17691 18.3
13 3/ 48 6.4 3/ 154 1.8 NA NA 1.49 0/ 622 * 0.0 * 0.00 15/ 17004 17.7
Glen Cove Hospital 12 1/ 34 2.7 5/ 458 1.3 1.03 0/1449 * 0.0 * 0.00 29/ 59663 ** 7.6
13 1/ 40 2.0 2/ 473 0.6 0.47 2/1074 1.9 2.08 34/ 53879 12.1
Glens Falls 12 5/ 182 3.7 6/ 156 ^^ 3.7 2/ 59 3.6 1.45 1/2114 0.5 0.49 37/ 81488 ** 6.7
13 5/ 179 4.0 1/ 166 0.6 0/ 90 * 0.0 0.54 1/ 266 3.8 2/1630 1.2 1.75 43/ 71337 7.8
Good Samaritan Suffern
12 1/ 90 1.0 2/ 111 1.9 0/ 37 * 0.0 2/ 133 1.5 1/ 127 0.6 0.61 0/ 622 * 0.0 3/1085 2.8 2/ 753 2.7 1.85 36/ 59753 11.2
13 1/ 116 ** 0.7 0/ 107 * 0.0 0/ 30 * 0.0 4/ 119 3.5 0/ 113 * 0.0 **0.39 0/ 651 * 0.0 1/ 949 1.1 1/ 697 1.4 0.85 32/ 57836 10.5
Good Samaritan
W Islip
12 10/ 196 5.6 2/ 115 1.0 4/ 302 1.6 1.09 3/4467 0.7 0/ 109 * 0.0 1/ 509 1.6 0.69 194/122721 ^ 17.6
13 21/ 197 ^^11.6 1/ 120 0.6 2/ 402 0.7 1.34 2/3955 0.5 0/ 149 * 0.0 0/ 703 * 0.0 0.45 130/105187 13.9
Harlem Hospital 12 5/ 48 10.3 NA NA 0/ 57 * 0.0 1.43 0/ 154 * 0.0 0/1090 * 0.0 NA NA 0/ 265 * 0.0 * 0.00 23/ 68437 9.9
13 3/ 29 10.9 NA NA 0/ 40 * 0.0 1.11 0/ 127 * 0.0 0/1743 * 0.0 0/ 75 * 0.0 0/ 614 * 0.0 * 0.00 18/ 68860 7.2
HealthAlliance Broadway
12 0/ 72 ** 0.0 1/ 43 1.8 NA NA 0.26 0/1609 * 0.0 * 0.00 20/ 40485 8.7
13 0/ 64 ** 0.0 1/ 47 1.1 NA NA 0.19 0/2091 * 0.0 * 0.00 25/ 38234 11.1
HealthAlliance MarysAve
12 0/ 24 0.0 0/ 137 * 0.0 * 0.00 0/ 157 * 0.0 * 0.00 3/ 28319 3.5
13 NA / NA NA 0/ 121 * 0.0 * 0.00 0/ 51 * 0.0 * 0.00 4/ 27451 5.5
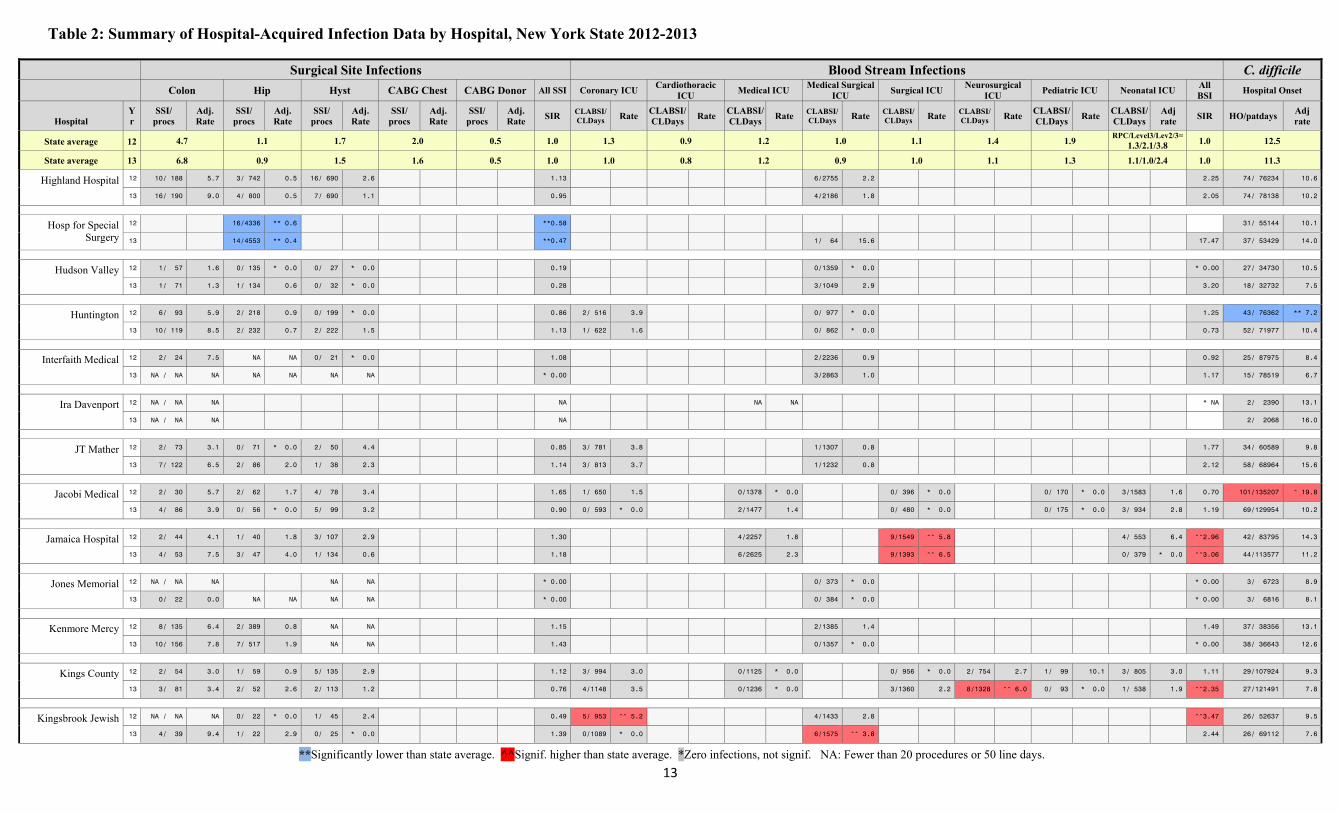
Table 2: Summary of Hospital-Acquired Infection Data by Hospital, New York State 2012-2013
**Significantly lower than state average. ^^Signif. higher than state average. *Zero infections, not signif. NA: Fewer than 20 procedures or 50 line days.
13
Surgical Site Infections Blood Stream Infections C. difficile Colon Hip Hyst CABG Chest CABG Donor All SSI Coronary ICU
Cardiothoracic ICU
Medical ICU Medical Surgical
ICU Surgical ICU
Neurosurgical ICU
Pediatric ICU Neonatal ICU All BSI
Hospital Onset
Hospital Yr
SSI/ procs
Adj. Rate
SSI/ procs
Adj. Rate
SSI/ procs
Adj. Rate
SSI/ procs
Adj. Rate
SSI/ procs
Adj. Rate
SIR CLABSI/CLDays Rate
CLABSI/CLDays
Rate CLABSI/CLDays
Rate CLABSI/CLDays Rate CLABSI/
CLDays Rate CLABSI/CLDays Rate
CLABSI/ CLDays
Rate CLABSI/ CLDays
Adj rate
SIR HO/patdays Adj rate
State average 12 4.7 1.1 1.7 2.0 0.5 1.0 1.3 0.9 1.2 1.0 1.1 1.4 1.9 RPC/Level3/Lev2/3=
1.3/2.1/3.8 1.0 12.5
State average 13 6.8 0.9 1.5 1.6 0.5 1.0 1.0 0.8 1.2 0.9 1.0 1.1 1.3 1.1/1.0/2.4 1.0 11.3
Highland Hospital 12 10/ 188 5.7 3/ 742 0.5 16/ 690 2.6 1.13 6/2755 2.2 2.25 74/ 76234 10.6
13 16/ 190 9.0 4/ 800 0.5 7/ 690 1.1 0.95 4/2186 1.8 2.05 74/ 78138 10.2
Hosp for Special Surgery
12 16/4336 ** 0.6 **0.58 31/ 55144 10.1
13 14/4553 ** 0.4 **0.47 1/ 64 15.6 17.47 37/ 53429 14.0
Hudson Valley 12 1/ 57 1.6 0/ 135 * 0.0 0/ 27 * 0.0 0.19 0/1359 * 0.0 * 0.00 27/ 34730 10.5
13 1/ 71 1.3 1/ 134 0.6 0/ 32 * 0.0 0.28 3/1049 2.9 3.20 18/ 32732 7.5
Huntington 12 6/ 93 5.9 2/ 218 0.9 0/ 199 * 0.0 0.86 2/ 516 3.9 0/ 977 * 0.0 1.25 43/ 76362 ** 7.2
13 10/ 119 8.5 2/ 232 0.7 2/ 222 1.5 1.13 1/ 622 1.6 0/ 862 * 0.0 0.73 52/ 71977 10.4
Interfaith Medical 12 2/ 24 7.5 NA NA 0/ 21 * 0.0 1.08 2/2236 0.9 0.92 25/ 87975 8.4
13 NA / NA NA NA NA NA NA * 0.00 3/2863 1.0 1.17 15/ 78519 6.7
Ira Davenport 12 NA / NA NA NA NA NA * NA 2/ 2390 13.1
13 NA / NA NA NA 2/ 2068 16.0
JT Mather 12 2/ 73 3.1 0/ 71 * 0.0 2/ 50 4.4 0.85 3/ 781 3.8 1/1307 0.8 1.77 34/ 60589 9.8
13 7/ 122 6.5 2/ 86 2.0 1/ 38 2.3 1.14 3/ 813 3.7 1/1232 0.8 2.12 58/ 68964 15.6
Jacobi Medical 12 2/ 30 5.7 2/ 62 1.7 4/ 78 3.4 1.65 1/ 650 1.5 0/1378 * 0.0 0/ 396 * 0.0 0/ 170 * 0.0 3/1583 1.6 0.70 101/135207 ^ 19.8
13 4/ 86 3.9 0/ 56 * 0.0 5/ 99 3.2 0.90 0/ 593 * 0.0 2/1477 1.4 0/ 480 * 0.0 0/ 175 * 0.0 3/ 934 2.8 1.19 69/129954 10.2
Jamaica Hospital 12 2/ 44 4.1 1/ 40 1.8 3/ 107 2.9 1.30 4/2257 1.8 9/1549 ^^ 5.8 4/ 553 6.4 ^^2.96 42/ 83795 14.3
13 4/ 53 7.5 3/ 47 4.0 1/ 134 0.6 1.18 6/2625 2.3 9/1393 ^^ 6.5 0/ 379 * 0.0 ^^3.06 44/113577 11.2
Jones Memorial 12 NA / NA NA NA NA * 0.00 0/ 373 * 0.0 * 0.00 3/ 6723 8.9
13 0/ 22 0.0 NA NA NA NA * 0.00 0/ 384 * 0.0 * 0.00 3/ 6816 8.1
Kenmore Mercy 12 8/ 135 6.4 2/ 389 0.8 NA NA 1.15 2/1385 1.4 1.49 37/ 38356 13.1
13 10/ 156 7.8 7/ 517 1.9 NA NA 1.43 0/1357 * 0.0 * 0.00 38/ 36643 12.6
Kings County 12 2/ 54 3.0 1/ 59 0.9 5/ 135 2.9 1.12 3/ 994 3.0 0/1125 * 0.0 0/ 956 * 0.0 2/ 754 2.7 1/ 99 10.1 3/ 805 3.0 1.11 29/107924 9.3
13 3/ 81 3.4 2/ 52 2.6 2/ 113 1.2 0.76 4/1148 3.5 0/1236 * 0.0 3/1360 2.2 8/1328 ^^ 6.0 0/ 93 * 0.0 1/ 538 1.9 ^^2.35 27/121491 7.8
Kingsbrook Jewish 12 NA / NA NA 0/ 22 * 0.0 1/ 45 2.4 0.49 5/ 953 ^^ 5.2 4/1433 2.8 ^^3.47 26/ 52637 9.5
13 4/ 39 9.4 1/ 22 2.9 0/ 25 * 0.0 1.39 0/1089 * 0.0 6/1575 ^^ 3.8 2.44 26/ 69112 7.6
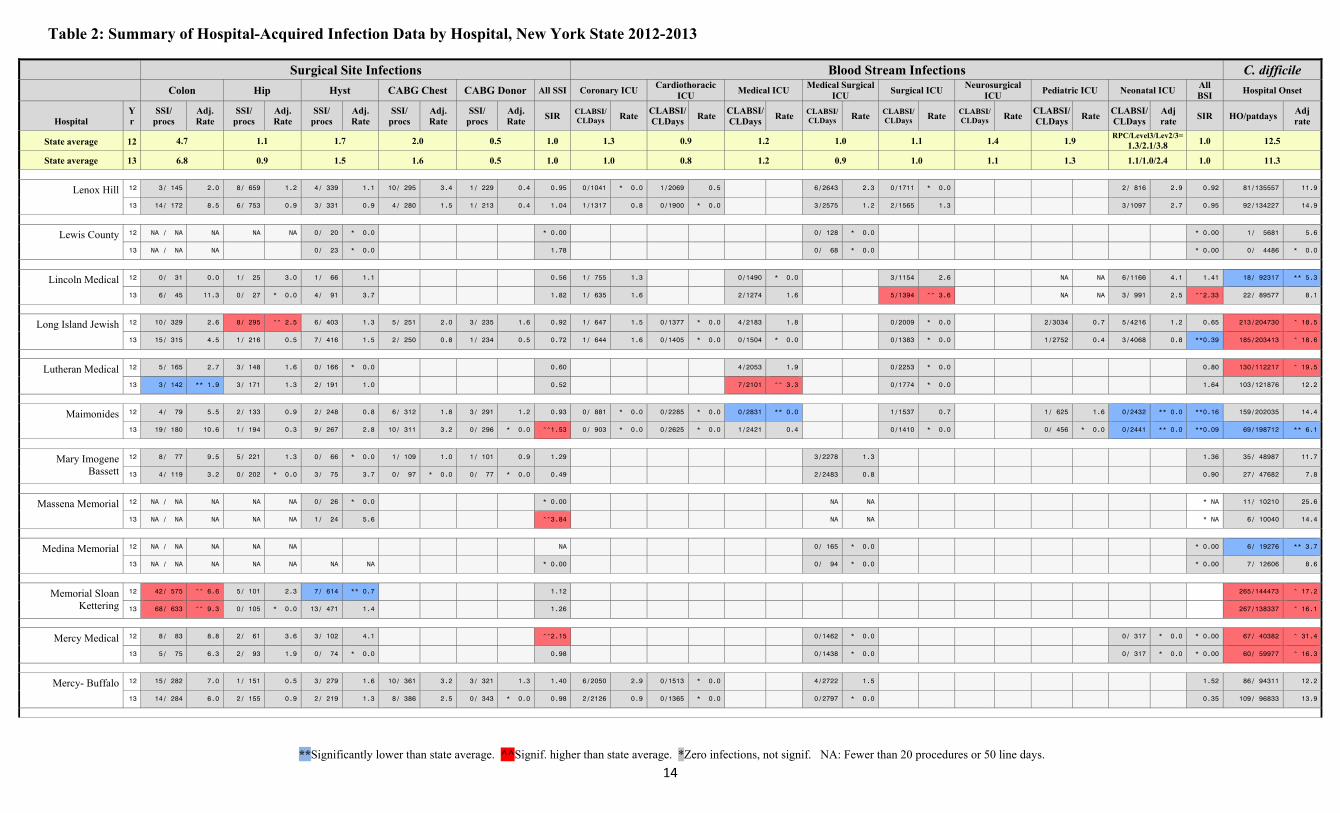
Table 2: Summary of Hospital-Acquired Infection Data by Hospital, New York State 2012-2013
**Significantly lower than state average. ^^Signif. higher than state average. *Zero infections, not signif. NA: Fewer than 20 procedures or 50 line days.
14
Surgical Site Infections Blood Stream Infections C. difficile Colon Hip Hyst CABG Chest CABG Donor All SSI Coronary ICU
Cardiothoracic ICU
Medical ICU Medical Surgical
ICU Surgical ICU
Neurosurgical ICU
Pediatric ICU Neonatal ICU All BSI
Hospital Onset
Hospital Yr
SSI/ procs
Adj. Rate
SSI/ procs
Adj. Rate
SSI/ procs
Adj. Rate
SSI/ procs
Adj. Rate
SSI/ procs
Adj. Rate
SIR CLABSI/CLDays Rate
CLABSI/CLDays
Rate CLABSI/CLDays
Rate CLABSI/CLDays Rate CLABSI/
CLDays Rate CLABSI/CLDays Rate
CLABSI/ CLDays
Rate CLABSI/ CLDays
Adj rate
SIR HO/patdays Adj rate
State average 12 4.7 1.1 1.7 2.0 0.5 1.0 1.3 0.9 1.2 1.0 1.1 1.4 1.9 RPC/Level3/Lev2/3=
1.3/2.1/3.8 1.0 12.5
State average 13 6.8 0.9 1.5 1.6 0.5 1.0 1.0 0.8 1.2 0.9 1.0 1.1 1.3 1.1/1.0/2.4 1.0 11.3
Lenox Hill 12 3/ 145 2.0 8/ 659 1.2 4/ 339 1.1 10/ 295 3.4 1/ 229 0.4 0.95 0/1041 * 0.0 1/2069 0.5 6/2643 2.3 0/1711 * 0.0 2/ 816 2.9 0.92 81/135557 11.9
13 14/ 172 8.5 6/ 753 0.9 3/ 331 0.9 4/ 280 1.5 1/ 213 0.4 1.04 1/1317 0.8 0/1900 * 0.0 3/2575 1.2 2/1565 1.3 3/1097 2.7 0.95 92/134227 14.9
Lewis County 12 NA / NA NA NA NA 0/ 20 * 0.0 * 0.00 0/ 128 * 0.0 * 0.00 1/ 5681 5.6
13 NA / NA NA 0/ 23 * 0.0 1.78 0/ 68 * 0.0 * 0.00 0/ 4486 * 0.0
Lincoln Medical 12 0/ 31 0.0 1/ 25 3.0 1/ 66 1.1 0.56 1/ 755 1.3 0/1490 * 0.0 3/1154 2.6 NA NA 6/1166 4.1 1.41 18/ 92317 ** 5.3
13 6/ 45 11.3 0/ 27 * 0.0 4/ 91 3.7 1.82 1/ 635 1.6 2/1274 1.6 5/1394 ^^ 3.6 NA NA 3/ 991 2.5 ^^2.33 22/ 89577 8.1
Long Island Jewish 12 10/ 329 2.6 8/ 295 ^^ 2.5 6/ 403 1.3 5/ 251 2.0 3/ 235 1.6 0.92 1/ 647 1.5 0/1377 * 0.0 4/2183 1.8 0/2009 * 0.0 2/3034 0.7 5/4216 1.2 0.65 213/204730 ^ 18.5
13 15/ 315 4.5 1/ 216 0.5 7/ 416 1.5 2/ 250 0.8 1/ 234 0.5 0.72 1/ 644 1.6 0/1405 * 0.0 0/1504 * 0.0 0/1383 * 0.0 1/2752 0.4 3/4068 0.8 **0.39 185/203413 ^ 18.6
Lutheran Medical 12 5/ 165 2.7 3/ 148 1.6 0/ 166 * 0.0 0.60 4/2053 1.9 0/2253 * 0.0 0.80 130/112217 ^ 19.5
13 3/ 142 ** 1.9 3/ 171 1.3 2/ 191 1.0 0.52 7/2101 ^^ 3.3 0/1774 * 0.0 1.64 103/121876 12.2
Maimonides 12 4/ 79 5.5 2/ 133 0.9 2/ 248 0.8 6/ 312 1.8 3/ 291 1.2 0.93 0/ 881 * 0.0 0/2285 * 0.0 0/2831 ** 0.0 1/1537 0.7 1/ 625 1.6 0/2432 ** 0.0 **0.16 159/202035 14.4
13 19/ 180 10.6 1/ 194 0.3 9/ 267 2.8 10/ 311 3.2 0/ 296 * 0.0 ^^1.53 0/ 903 * 0.0 0/2625 * 0.0 1/2421 0.4 0/1410 * 0.0 0/ 456 * 0.0 0/2441 ** 0.0 **0.09 69/198712 ** 6.1
Mary Imogene Bassett
12 8/ 77 9.5 5/ 221 1.3 0/ 66 * 0.0 1/ 109 1.0 1/ 101 0.9 1.29 3/2278 1.3 1.36 35/ 48987 11.7
13 4/ 119 3.2 0/ 202 * 0.0 3/ 75 3.7 0/ 97 * 0.0 0/ 77 * 0.0 0.49 2/2483 0.8 0.90 27/ 47682 7.8
Massena Memorial 12 NA / NA NA NA NA 0/ 26 * 0.0 * 0.00 NA NA * NA 11/ 10210 25.6
13 NA / NA NA NA NA 1/ 24 5.6 ^^3.84 NA NA * NA 6/ 10040 14.4
Medina Memorial 12 NA / NA NA NA NA NA 0/ 165 * 0.0 * 0.00 6/ 19276 ** 3.7
13 NA / NA NA NA NA NA NA * 0.00 0/ 94 * 0.0 * 0.00 7/ 12606 8.6
Memorial Sloan Kettering
12 42/ 575 ^^ 6.6 5/ 101 2.3 7/ 614 ** 0.7 1.12 265/144473 ^ 17.2
13 68/ 633 ^^ 9.3 0/ 105 * 0.0 13/ 471 1.4 1.26 267/138337 ^ 16.1
Mercy Medical 12 8/ 83 8.8 2/ 61 3.6 3/ 102 4.1 ^^2.15 0/1462 * 0.0 0/ 317 * 0.0 * 0.00 67/ 40382 ^ 31.4
13 5/ 75 6.3 2/ 93 1.9 0/ 74 * 0.0 0.98 0/1438 * 0.0 0/ 317 * 0.0 * 0.00 60/ 59977 ^ 16.3
Mercy- Buffalo 12 15/ 282 7.0 1/ 151 0.5 3/ 279 1.6 10/ 361 3.2 3/ 321 1.3 1.40 6/2050 2.9 0/1513 * 0.0 4/2722 1.5 1.52 86/ 94311 12.2
13 14/ 284 6.0 2/ 155 0.9 2/ 219 1.3 8/ 386 2.5 0/ 343 * 0.0 0.98 2/2126 0.9 0/1365 * 0.0 0/2797 * 0.0 0.35 109/ 96833 13.9
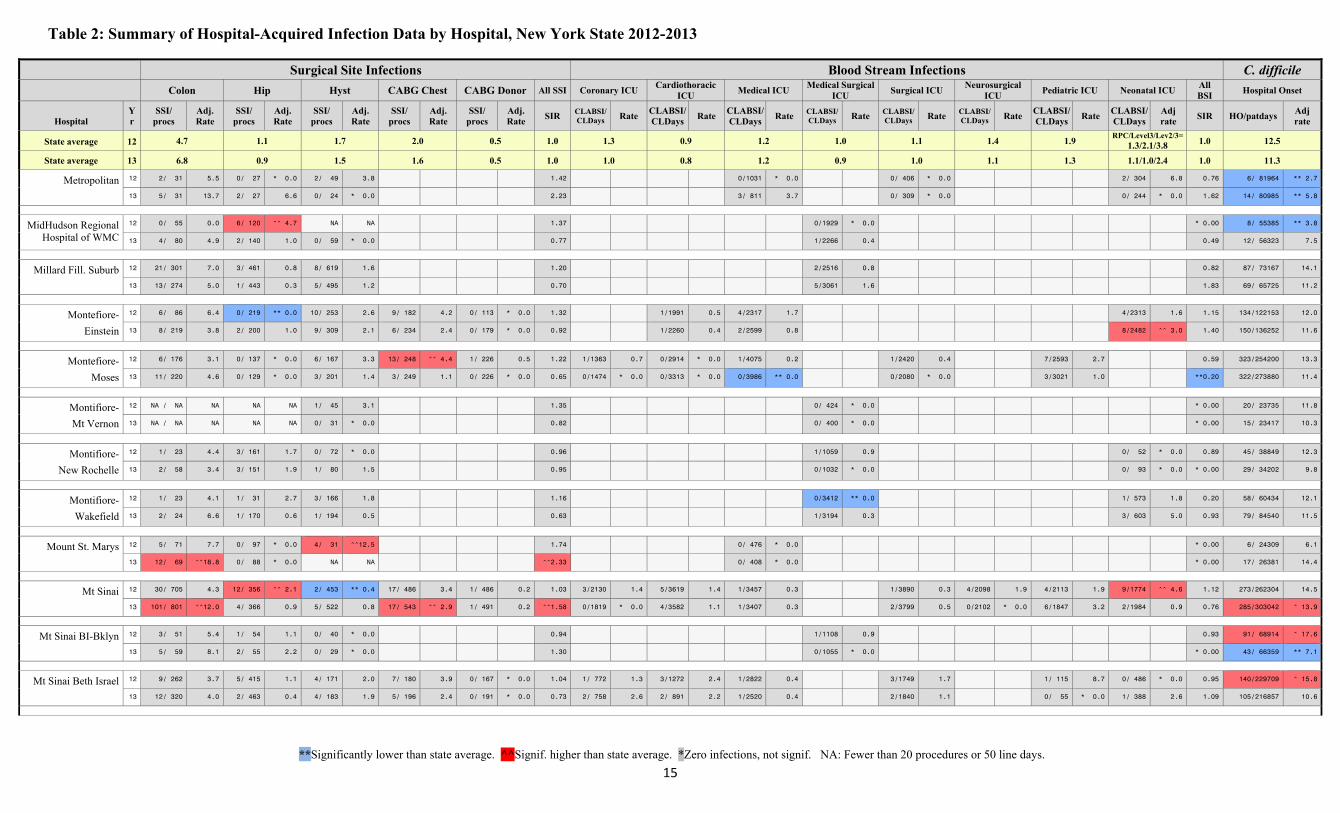
Table 2: Summary of Hospital-Acquired Infection Data by Hospital, New York State 2012-2013
**Significantly lower than state average. ^^Signif. higher than state average. *Zero infections, not signif. NA: Fewer than 20 procedures or 50 line days.
15
Surgical Site Infections Blood Stream Infections C. difficile Colon Hip Hyst CABG Chest CABG Donor All SSI Coronary ICU
Cardiothoracic ICU
Medical ICU Medical Surgical
ICU Surgical ICU
Neurosurgical ICU
Pediatric ICU Neonatal ICU All BSI
Hospital Onset
Hospital Yr
SSI/ procs
Adj. Rate
SSI/ procs
Adj. Rate
SSI/ procs
Adj. Rate
SSI/ procs
Adj. Rate
SSI/ procs
Adj. Rate
SIR CLABSI/CLDays Rate
CLABSI/CLDays
Rate CLABSI/CLDays
Rate CLABSI/CLDays Rate CLABSI/
CLDays Rate CLABSI/CLDays Rate
CLABSI/ CLDays
Rate CLABSI/ CLDays
Adj rate
SIR HO/patdays Adj rate
State average 12 4.7 1.1 1.7 2.0 0.5 1.0 1.3 0.9 1.2 1.0 1.1 1.4 1.9 RPC/Level3/Lev2/3=
1.3/2.1/3.8 1.0 12.5
State average 13 6.8 0.9 1.5 1.6 0.5 1.0 1.0 0.8 1.2 0.9 1.0 1.1 1.3 1.1/1.0/2.4 1.0 11.3
Metropolitan 12 2/ 31 5.5 0/ 27 * 0.0 2/ 49 3.8 1.42 0/1031 * 0.0 0/ 406 * 0.0 2/ 304 6.8 0.76 6/ 81964 ** 2.7
13 5/ 31 13.7 2/ 27 6.6 0/ 24 * 0.0 2.23 3/ 811 3.7 0/ 309 * 0.0 0/ 244 * 0.0 1.62 14/ 80985 ** 5.8
MidHudson Regional Hospital of WMC
12 0/ 55 0.0 6/ 120 ^^ 4.7 NA NA 1.37 0/1929 * 0.0 * 0.00 8/ 55385 ** 3.8
13 4/ 80 4.9 2/ 140 1.0 0/ 59 * 0.0 0.77 1/2266 0.4 0.49 12/ 56323 7.5
Millard Fill. Suburb 12 21/ 301 7.0 3/ 461 0.8 8/ 619 1.6 1.20 2/2516 0.8 0.82 87/ 73167 14.1
13 13/ 274 5.0 1/ 443 0.3 5/ 495 1.2 0.70 5/3061 1.6 1.83 69/ 65725 11.2
Montefiore-
Einstein
12 6/ 86 6.4 0/ 219 ** 0.0 10/ 253 2.6 9/ 182 4.2 0/ 113 * 0.0 1.32 1/1991 0.5 4/2317 1.7 4/2313 1.6 1.15 134/122153 12.0
13 8/ 219 3.8 2/ 200 1.0 9/ 309 2.1 6/ 234 2.4 0/ 179 * 0.0 0.92 1/2260 0.4 2/2599 0.8 8/2482 ^^ 3.0 1.40 150/136252 11.6
Montefiore-
Moses
12 6/ 176 3.1 0/ 137 * 0.0 6/ 167 3.3 13/ 248 ^^ 4.4 1/ 226 0.5 1.22 1/1363 0.7 0/2914 * 0.0 1/4075 0.2 1/2420 0.4 7/2593 2.7 0.59 323/254200 13.3
13 11/ 220 4.6 0/ 129 * 0.0 3/ 201 1.4 3/ 249 1.1 0/ 226 * 0.0 0.65 0/1474 * 0.0 0/3313 * 0.0 0/3986 ** 0.0 0/2080 * 0.0 3/3021 1.0 **0.20 322/273880 11.4
Montifiore-
Mt Vernon
12 NA / NA NA NA NA 1/ 45 3.1 1.35 0/ 424 * 0.0 * 0.00 20/ 23735 11.8
13 NA / NA NA NA NA 0/ 31 * 0.0 0.82 0/ 400 * 0.0 * 0.00 15/ 23417 10.3
Montifiore-
New Rochelle
12 1/ 23 4.4 3/ 161 1.7 0/ 72 * 0.0 0.96 1/1059 0.9 0/ 52 * 0.0 0.89 45/ 38849 12.3
13 2/ 58 3.4 3/ 151 1.9 1/ 80 1.5 0.95 0/1032 * 0.0 0/ 93 * 0.0 * 0.00 29/ 34202 9.8
Montifiore-
Wakefield
12 1/ 23 4.1 1/ 31 2.7 3/ 166 1.8 1.16 0/3412 ** 0.0 1/ 573 1.8 0.20 58/ 60434 12.1
13 2/ 24 6.6 1/ 170 0.6 1/ 194 0.5 0.63 1/3194 0.3 3/ 603 5.0 0.93 79/ 84540 11.5
Mount St. Marys 12 5/ 71 7.7 0/ 97 * 0.0 4/ 31 ^^12.5 1.74 0/ 476 * 0.0 * 0.00 6/ 24309 6.1
13 12/ 69 ^^18.8 0/ 88 * 0.0 NA NA ^^2.33 0/ 408 * 0.0 * 0.00 17/ 26381 14.4
Mt Sinai 12 30/ 705 4.3 12/ 356 ^^ 2.1 2/ 453 ** 0.4 17/ 486 3.4 1/ 486 0.2 1.03 3/2130 1.4 5/3619 1.4 1/3457 0.3 1/3890 0.3 4/2098 1.9 4/2113 1.9 9/1774 ^^ 4.6 1.12 273/262304 14.5
13 101/ 801 ^^12.0 4/ 366 0.9 5/ 522 0.8 17/ 543 ^^ 2.9 1/ 491 0.2 ^^1.58 0/1819 * 0.0 4/3582 1.1 1/3407 0.3 2/3799 0.5 0/2102 * 0.0 6/1847 3.2 2/1984 0.9 0.76 285/303042 ^ 13.9
Mt Sinai BI-Bklyn 12 3/ 51 5.4 1/ 54 1.1 0/ 40 * 0.0 0.94 1/1108 0.9 0.93 91/ 68914 ^ 17.6
13 5/ 59 8.1 2/ 55 2.2 0/ 29 * 0.0 1.30 0/1055 * 0.0 * 0.00 43/ 66359 ** 7.1
Mt Sinai Beth Israel 12 9/ 262 3.7 5/ 415 1.1 4/ 171 2.0 7/ 180 3.9 0/ 167 * 0.0 1.04 1/ 772 1.3 3/1272 2.4 1/2822 0.4 3/1749 1.7 1/ 115 8.7 0/ 486 * 0.0 0.95 140/229709 ^ 15.8
13 12/ 320 4.0 2/ 463 0.4 4/ 183 1.9 5/ 196 2.4 0/ 191 * 0.0 0.73 2/ 758 2.6 2/ 891 2.2 1/2520 0.4 2/1840 1.1 0/ 55 * 0.0 1/ 388 2.6 1.09 105/216857 10.6

Table 2: Summary of Hospital-Acquired Infection Data by Hospital, New York State 2012-2013
**Significantly lower than state average. ^^Signif. higher than state average. *Zero infections, not signif. NA: Fewer than 20 procedures or 50 line days.
16
Surgical Site Infections Blood Stream Infections C. difficile Colon Hip Hyst CABG Chest CABG Donor All SSI Coronary ICU
Cardiothoracic ICU
Medical ICU Medical Surgical
ICU Surgical ICU
Neurosurgical ICU
Pediatric ICU Neonatal ICU All BSI
Hospital Onset
Hospital Yr
SSI/ procs
Adj. Rate
SSI/ procs
Adj. Rate
SSI/ procs
Adj. Rate
SSI/ procs
Adj. Rate
SSI/ procs
Adj. Rate
SIR CLABSI/CLDays Rate
CLABSI/CLDays
Rate CLABSI/CLDays
Rate CLABSI/CLDays Rate CLABSI/
CLDays Rate CLABSI/CLDays Rate
CLABSI/ CLDays
Rate CLABSI/ CLDays
Adj rate
SIR HO/patdays Adj rate
State average 12 4.7 1.1 1.7 2.0 0.5 1.0 1.3 0.9 1.2 1.0 1.1 1.4 1.9 RPC/Level3/Lev2/3=
1.3/2.1/3.8 1.0 12.5
State average 13 6.8 0.9 1.5 1.6 0.5 1.0 1.0 0.8 1.2 0.9 1.0 1.1 1.3 1.1/1.0/2.4 1.0 11.3
Mt Sinai Queens 12 3/ 68 3.9 3/ 67 2.8 1/ 48 2.5 1.29 2/1634 1.2 1.26 68/ 54458 12.2
13 3/ 66 4.5 0/ 51 * 0.0 0/ 64 * 0.0 0.50 0/1324 * 0.0 * 0.00 49/ 55240 8.7
Mt Sinai Roosevelt 12 8/ 187 4.2 3/ 108 2.3 3/ 230 1.3 0.99 0/1422 * 0.0 2/ 602 3.3 1/ 63 15.9 2/2013 1.1 0.81 42/110899 11.7
13 7/ 164 3.9 0/ 83 * 0.0 4/ 225 1.6 0.66 0/1830 * 0.0 0/ 553 * 0.0 0/ 145 * 0.0 2/1869 1.1 0.47 35/116715 8.4
Mt Sinai St Lukes 12 4/ 69 5.2 2/ 195 0.8 1/ 109 1.0 2/ 151 1.2 0/ 136 * 0.0 0.76 8/1974 ^^ 4.1 2/1938 1.0 1/ 978 1.0 ^^2.05 57/115823 11.1
13 3/ 51 5.2 2/ 144 1.4 2/ 69 3.2 1/ 145 0.6 1/ 129 0.7 0.96 1/2390 0.4 3/2042 1.5 0/ 921 * 0.0 0.72 40/109511 ** 7.0
NY Community Brooklyn
12 0/ 34 0.0 0/ 74 * 0.0 NA NA **0.00 1/ 603 1.7 1.71 34/ 45906 10.0
13 3/ 33 8.6 0/ 33 * 0.0 NA NA 1.01 3/ 701 4.3 4.78 47/ 45585 14.1
NY Hosp Queens 12 24/ 256 ^^ 9.2 5/ 241 1.5 3/ 167 1.4 1/ 118 1.0 0/ 115 * 0.0 ^^1.50 1/ 884 1.1 0/1027 * 0.0 0/2298 * 0.0 1/1807 0.6 0/ 92 * 0.0 1/ 235 3.7 0.40 322/174421 ^ 18.5
13 27/ 250 ^^10.9 1/ 252 0.3 5/ 189 1.9 1/ 98 0.9 0/ 74 * 0.0 1.33 0/ 993 * 0.0 0/ 850 * 0.0 2/2355 0.8 2/1692 1.2 NA NA 1/ 287 3.7 0.77 258/159316 ^ 15.5
NY Methodist 12 6/ 148 4.3 4/ 171 1.6 4/ 420 0.9 3/ 101 2.9 0/ 97 * 0.0 0.90 0/ 594 * 0.0 2/1486 1.3 4/4581 0.9 0/ 82 * 0.0 4/1477 2.5 1.00 150/174797 10.7
13 5/ 164 2.9 7/ 192 ^^ 3.3 7/ 440 1.7 0/ 119 * 0.0 0/ 113 * 0.0 0.86 1/ 574 1.7 0/1271 * 0.0 4/4591 0.9 0/ 88 * 0.0 1/1503 0.6 0.81 143/194817 9.4
NYP-Allen 12 1/ 23 4.0 1/ 30 2.7 NA NA 1.14 1/ 883 1.1 1.17 25/ 49984 8.1
13 2/ 23 9.2 0/ 23 * 0.0 NA NA 1.03 1/ 776 1.3 1.44 25/ 54985 7.3
NYP-Columbia/
Morgan Stanley
12 16/ 211 7.5 4/ 329 1.1 3/ 236 0.9 13/ 671 1.9 0/ 555 * 0.0 1.00 5/4837 1.0 13/7631 ^^ 1.7 5/4399 1.1 0/3329 ** 0.0 2/2843 0.7 14/5331 2.6 6/6254 1.0 0.93 271/257328 12.5
13 16/ 259 5.7 5/ 343 1.4 4/ 275 1.2 13/ 607 2.0 0/ 499 * 0.0 0.95 4/4831 0.8 12/7025 ^^ 1.7 4/5074 0.8 2/3340 0.6 2/3442 0.6 10/6690 1.5 7/7592 1.0 1.04 285/267066 12.4
NYP-Lawrence 12 5/ 82 6.4 1/ 126 0.8 1/ 40 3.5 1.29 3/1824 1.6 1.37 55/ 36305 ^ 22.6
13 5/ 85 6.8 5/ 131 ^^ 3.1 0/ 47 * 0.0 1.48 2/1713 1.2 1.00 50/ 36186 ^ 21.8
NYP-Lower Manhattan
12 3/ 32 7.1 2/ 44 2.8 2/ 126 1.3 1.33 4/2039 2.0 2.02 21/ 40054 11.0
13 4/ 63 5.8 4/ 61 ^^ 5.4 1/ 61 1.6 1.44 3/1657 1.8 2.02 18/ 39253 9.4
NYP-Weill Cornell 12 17/ 578 3.2 4/ 119 2.1 6/ 247 1.9 6/ 318 2.2 2/ 294 0.9 0.90 2/3210 0.6 6/4309 1.4 3/3402 0.9 8/3078 2.6 6/1775 3.4 1/2776 0.4 0/3740 ** 0.0 0.95 274/246630 12.6
13 46/ 605 8.0 0/ 133 * 0.0 3/ 274 0.9 4/ 301 1.3 2/ 285 0.8 1.07 4/3346 1.2 8/4297 1.9 12/3773 ^^ 3.2 6/2635 2.3 1/2024 0.5 3/3198 0.9 0/3449 ** 0.0 1.43 275/252761 11.6
NYU Joint Disease 12 11/1118 1.3 1.22 5/ 30019 ** 3.3
13 10/1358 1.0 1.16 12/ 31649 7.8
NYU Medical Center 12 13/ 252 4.9 2/ 108 1.0 3/ 226 1.1 4/ 183 2.5 1/ 143 0.7 1.00 0/1082 * 0.0 5/3027 1.7 7/2895 2.4 0/ 497 * 0.0 4/1773 2.3 2/1706 1.3 1.29 137/130711 ^ 16.3
13 38/ 349 ^^10.6 1/ 71 0.9 1/ 284 0.3 5/ 217 2.9 0/ 173 * 0.0 1.35 1/ 742 1.3 2/3021 0.7 1/2576 0.4 0/ 639 * 0.0 1/2149 0.5 1/1168 0.9 0.52 127/108745 ^ 22.1
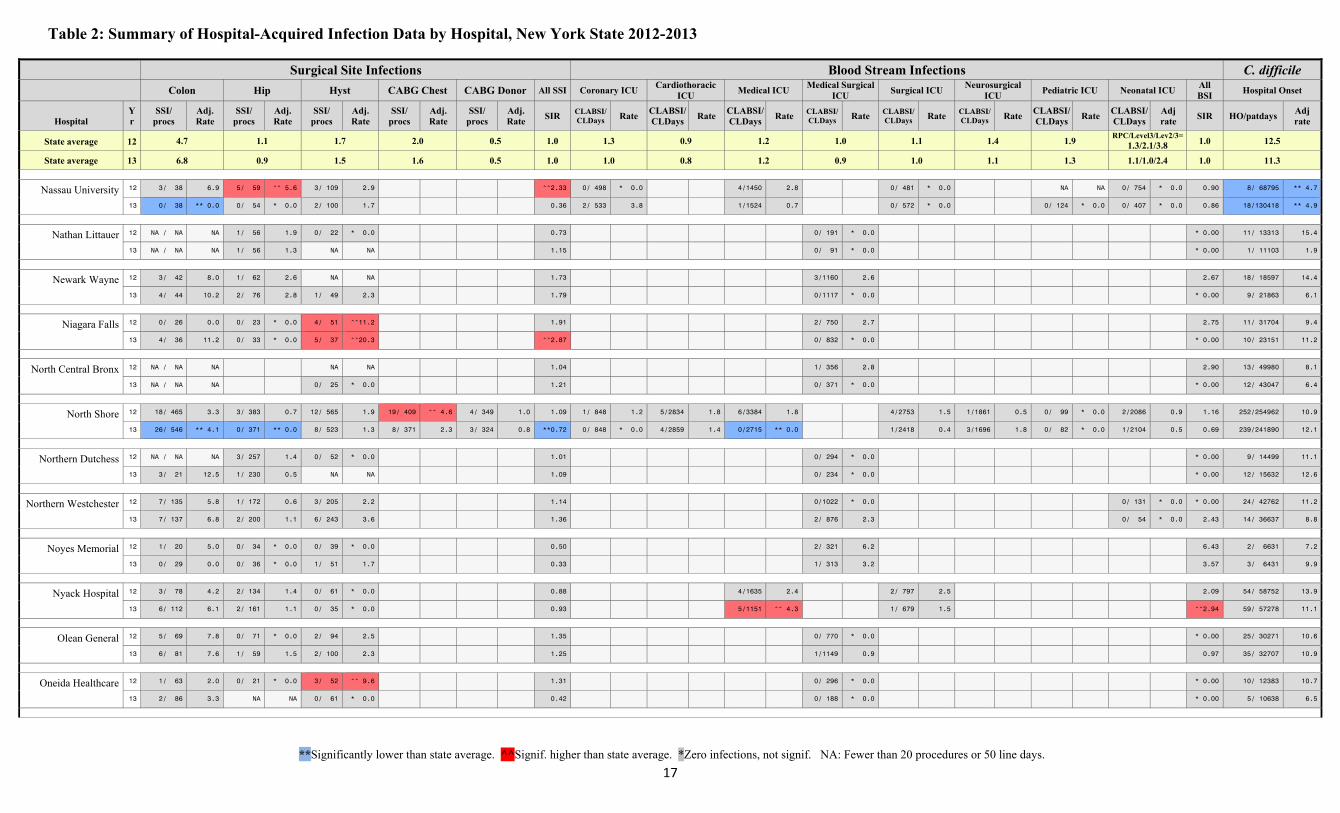
Table 2: Summary of Hospital-Acquired Infection Data by Hospital, New York State 2012-2013
**Significantly lower than state average. ^^Signif. higher than state average. *Zero infections, not signif. NA: Fewer than 20 procedures or 50 line days.
17
Surgical Site Infections Blood Stream Infections C. difficile Colon Hip Hyst CABG Chest CABG Donor All SSI Coronary ICU
Cardiothoracic ICU
Medical ICU Medical Surgical
ICU Surgical ICU
Neurosurgical ICU
Pediatric ICU Neonatal ICU All BSI
Hospital Onset
Hospital Yr
SSI/ procs
Adj. Rate
SSI/ procs
Adj. Rate
SSI/ procs
Adj. Rate
SSI/ procs
Adj. Rate
SSI/ procs
Adj. Rate
SIR CLABSI/CLDays Rate
CLABSI/CLDays
Rate CLABSI/CLDays
Rate CLABSI/CLDays Rate CLABSI/
CLDays Rate CLABSI/CLDays Rate
CLABSI/ CLDays
Rate CLABSI/ CLDays
Adj rate
SIR HO/patdays Adj rate
State average 12 4.7 1.1 1.7 2.0 0.5 1.0 1.3 0.9 1.2 1.0 1.1 1.4 1.9 RPC/Level3/Lev2/3=
1.3/2.1/3.8 1.0 12.5
State average 13 6.8 0.9 1.5 1.6 0.5 1.0 1.0 0.8 1.2 0.9 1.0 1.1 1.3 1.1/1.0/2.4 1.0 11.3
Nassau University 12 3/ 38 6.9 5/ 59 ^^ 5.6 3/ 109 2.9 ^^2.33 0/ 498 * 0.0 4/1450 2.8 0/ 481 * 0.0 NA NA 0/ 754 * 0.0 0.90 8/ 68795 ** 4.7
13 0/ 38 ** 0.0 0/ 54 * 0.0 2/ 100 1.7 0.36 2/ 533 3.8 1/1524 0.7 0/ 572 * 0.0 0/ 124 * 0.0 0/ 407 * 0.0 0.86 18/130418 ** 4.9
Nathan Littauer 12 NA / NA NA 1/ 56 1.9 0/ 22 * 0.0 0.73 0/ 191 * 0.0 * 0.00 11/ 13313 15.4
13 NA / NA NA 1/ 56 1.3 NA NA 1.15 0/ 91 * 0.0 * 0.00 1/ 11103 1.9
Newark Wayne 12 3/ 42 8.0 1/ 62 2.6 NA NA 1.73 3/1160 2.6 2.67 18/ 18597 14.4
13 4/ 44 10.2 2/ 76 2.8 1/ 49 2.3 1.79 0/1117 * 0.0 * 0.00 9/ 21863 6.1
Niagara Falls 12 0/ 26 0.0 0/ 23 * 0.0 4/ 51 ^^11.2 1.91 2/ 750 2.7 2.75 11/ 31704 9.4
13 4/ 36 11.2 0/ 33 * 0.0 5/ 37 ^^20.3 ^^2.87 0/ 832 * 0.0 * 0.00 10/ 23151 11.2
North Central Bronx 12 NA / NA NA NA NA 1.04 1/ 356 2.8 2.90 13/ 49980 8.1
13 NA / NA NA 0/ 25 * 0.0 1.21 0/ 371 * 0.0 * 0.00 12/ 43047 6.4
North Shore 12 18/ 465 3.3 3/ 383 0.7 12/ 565 1.9 19/ 409 ^^ 4.6 4/ 349 1.0 1.09 1/ 848 1.2 5/2834 1.8 6/3384 1.8 4/2753 1.5 1/1861 0.5 0/ 99 * 0.0 2/2086 0.9 1.16 252/254962 10.9
13 26/ 546 ** 4.1 0/ 371 ** 0.0 8/ 523 1.3 8/ 371 2.3 3/ 324 0.8 **0.72 0/ 848 * 0.0 4/2859 1.4 0/2715 ** 0.0 1/2418 0.4 3/1696 1.8 0/ 82 * 0.0 1/2104 0.5 0.69 239/241890 12.1
Northern Dutchess 12 NA / NA NA 3/ 257 1.4 0/ 52 * 0.0 1.01 0/ 294 * 0.0 * 0.00 9/ 14499 11.1
13 3/ 21 12.5 1/ 230 0.5 NA NA 1.09 0/ 234 * 0.0 * 0.00 12/ 15632 12.6
Northern Westchester 12 7/ 135 5.8 1/ 172 0.6 3/ 205 2.2 1.14 0/1022 * 0.0 0/ 131 * 0.0 * 0.00 24/ 42762 11.2
13 7/ 137 6.8 2/ 200 1.1 6/ 243 3.6 1.36 2/ 876 2.3 0/ 54 * 0.0 2.43 14/ 36637 8.8
Noyes Memorial 12 1/ 20 5.0 0/ 34 * 0.0 0/ 39 * 0.0 0.50 2/ 321 6.2 6.43 2/ 6631 7.2
13 0/ 29 0.0 0/ 36 * 0.0 1/ 51 1.7 0.33 1/ 313 3.2 3.57 3/ 6431 9.9
Nyack Hospital 12 3/ 78 4.2 2/ 134 1.4 0/ 61 * 0.0 0.88 4/1635 2.4 2/ 797 2.5 2.09 54/ 58752 13.9
13 6/ 112 6.1 2/ 161 1.1 0/ 35 * 0.0 0.93 5/1151 ^^ 4.3 1/ 679 1.5 ^^2.94 59/ 57278 11.1
Olean General 12 5/ 69 7.8 0/ 71 * 0.0 2/ 94 2.5 1.35 0/ 770 * 0.0 * 0.00 25/ 30271 10.6
13 6/ 81 7.6 1/ 59 1.5 2/ 100 2.3 1.25 1/1149 0.9 0.97 35/ 32707 10.9
Oneida Healthcare 12 1/ 63 2.0 0/ 21 * 0.0 3/ 52 ^^ 9.6 1.31 0/ 296 * 0.0 * 0.00 10/ 12383 10.7
13 2/ 86 3.3 NA NA 0/ 61 * 0.0 0.42 0/ 188 * 0.0 * 0.00 5/ 10638 6.5
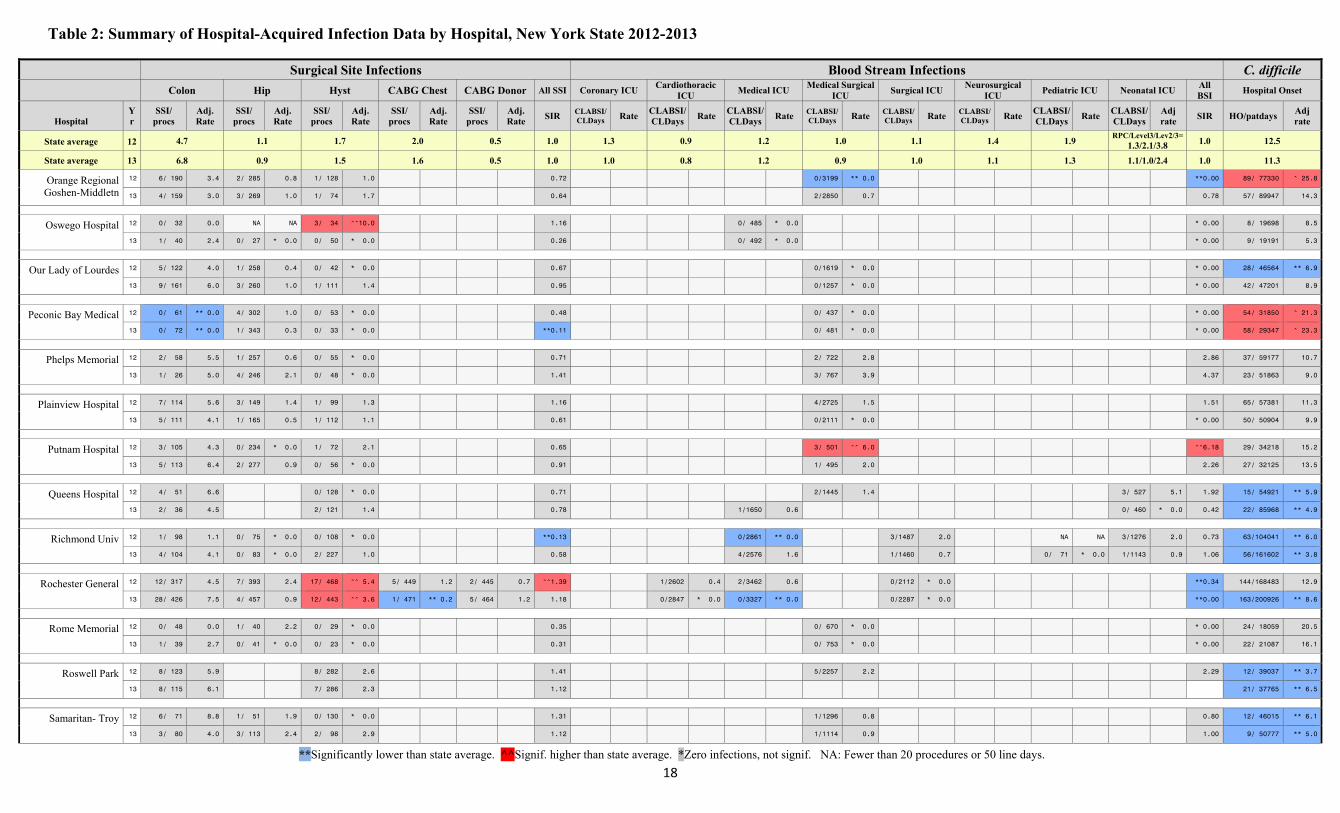
Table 2: Summary of Hospital-Acquired Infection Data by Hospital, New York State 2012-2013
**Significantly lower than state average. ^^Signif. higher than state average. *Zero infections, not signif. NA: Fewer than 20 procedures or 50 line days.
18
Surgical Site Infections Blood Stream Infections C. difficile Colon Hip Hyst CABG Chest CABG Donor All SSI Coronary ICU
Cardiothoracic ICU
Medical ICU Medical Surgical
ICU Surgical ICU
Neurosurgical ICU
Pediatric ICU Neonatal ICU All BSI
Hospital Onset
Hospital Yr
SSI/ procs
Adj. Rate
SSI/ procs
Adj. Rate
SSI/ procs
Adj. Rate
SSI/ procs
Adj. Rate
SSI/ procs
Adj. Rate
SIR CLABSI/CLDays Rate
CLABSI/CLDays
Rate CLABSI/CLDays
Rate CLABSI/CLDays Rate CLABSI/
CLDays Rate CLABSI/CLDays Rate
CLABSI/ CLDays
Rate CLABSI/ CLDays
Adj rate
SIR HO/patdays Adj rate
State average 12 4.7 1.1 1.7 2.0 0.5 1.0 1.3 0.9 1.2 1.0 1.1 1.4 1.9 RPC/Level3/Lev2/3=
1.3/2.1/3.8 1.0 12.5
State average 13 6.8 0.9 1.5 1.6 0.5 1.0 1.0 0.8 1.2 0.9 1.0 1.1 1.3 1.1/1.0/2.4 1.0 11.3
Orange Regional Goshen-Middletn
12 6/ 190 3.4 2/ 285 0.8 1/ 128 1.0 0.72 0/3199 ** 0.0 **0.00 89/ 77330 ^ 25.8
13 4/ 159 3.0 3/ 269 1.0 1/ 74 1.7 0.64 2/2850 0.7 0.78 57/ 89947 14.3
Oswego Hospital 12 0/ 32 0.0 NA NA 3/ 34 ^^10.0 1.16 0/ 485 * 0.0 * 0.00 8/ 19698 8.5
13 1/ 40 2.4 0/ 27 * 0.0 0/ 50 * 0.0 0.26 0/ 492 * 0.0 * 0.00 9/ 19191 5.3
Our Lady of Lourdes 12 5/ 122 4.0 1/ 258 0.4 0/ 42 * 0.0 0.67 0/1619 * 0.0 * 0.00 28/ 46564 ** 6.9
13 9/ 161 6.0 3/ 260 1.0 1/ 111 1.4 0.95 0/1257 * 0.0 * 0.00 42/ 47201 8.9
Peconic Bay Medical 12 0/ 61 ** 0.0 4/ 302 1.0 0/ 53 * 0.0 0.48 0/ 437 * 0.0 * 0.00 54/ 31850 ^ 21.3
13 0/ 72 ** 0.0 1/ 343 0.3 0/ 33 * 0.0 **0.11 0/ 481 * 0.0 * 0.00 58/ 29347 ^ 23.3
Phelps Memorial 12 2/ 58 5.5 1/ 257 0.6 0/ 55 * 0.0 0.71 2/ 722 2.8 2.86 37/ 59177 10.7
13 1/ 26 5.0 4/ 246 2.1 0/ 48 * 0.0 1.41 3/ 767 3.9 4.37 23/ 51863 9.0
Plainview Hospital 12 7/ 114 5.6 3/ 149 1.4 1/ 99 1.3 1.16 4/2725 1.5 1.51 65/ 57381 11.3
13 5/ 111 4.1 1/ 165 0.5 1/ 112 1.1 0.61 0/2111 * 0.0 * 0.00 50/ 50904 9.9
Putnam Hospital 12 3/ 105 4.3 0/ 234 * 0.0 1/ 72 2.1 0.65 3/ 501 ^^ 6.0 ^^6.18 29/ 34218 15.2
13 5/ 113 6.4 2/ 277 0.9 0/ 56 * 0.0 0.91 1/ 495 2.0 2.26 27/ 32125 13.5
Queens Hospital 12 4/ 51 6.6 0/ 128 * 0.0 0.71 2/1445 1.4 3/ 527 5.1 1.92 15/ 54921 ** 5.9
13 2/ 36 4.5 2/ 121 1.4 0.78 1/1650 0.6 0/ 460 * 0.0 0.42 22/ 85968 ** 4.9
Richmond Univ 12 1/ 98 1.1 0/ 75 * 0.0 0/ 108 * 0.0 **0.13 0/2861 ** 0.0 3/1487 2.0 NA NA 3/1276 2.0 0.73 63/104041 ** 6.0
13 4/ 104 4.1 0/ 83 * 0.0 2/ 227 1.0 0.58 4/2576 1.6 1/1460 0.7 0/ 71 * 0.0 1/1143 0.9 1.06 56/161602 ** 3.8
Rochester General 12 12/ 317 4.5 7/ 393 2.4 17/ 468 ^^ 5.4 5/ 449 1.2 2/ 445 0.7 ^^1.39 1/2602 0.4 2/3462 0.6 0/2112 * 0.0 **0.34 144/168483 12.9
13 28/ 426 7.5 4/ 457 0.9 12/ 443 ^^ 3.6 1/ 471 ** 0.2 5/ 464 1.2 1.18 0/2847 * 0.0 0/3327 ** 0.0 0/2287 * 0.0 **0.00 163/200926 ** 8.6
Rome Memorial 12 0/ 48 0.0 1/ 40 2.2 0/ 29 * 0.0 0.35 0/ 670 * 0.0 * 0.00 24/ 18059 20.5
13 1/ 39 2.7 0/ 41 * 0.0 0/ 23 * 0.0 0.31 0/ 753 * 0.0 * 0.00 22/ 21087 16.1
Roswell Park 12 8/ 123 5.9 8/ 282 2.6 1.41 5/2257 2.2 2.29 12/ 39037 ** 3.7
13 8/ 115 6.1 7/ 286 2.3 1.12 21/ 37765 ** 6.5
Samaritan- Troy 12 6/ 71 8.8 1/ 51 1.9 0/ 130 * 0.0 1.31 1/1296 0.8 0.80 12/ 46015 ** 6.1
13 3/ 80 4.0 3/ 113 2.4 2/ 98 2.9 1.12 1/1114 0.9 1.00 9/ 50777 ** 5.0
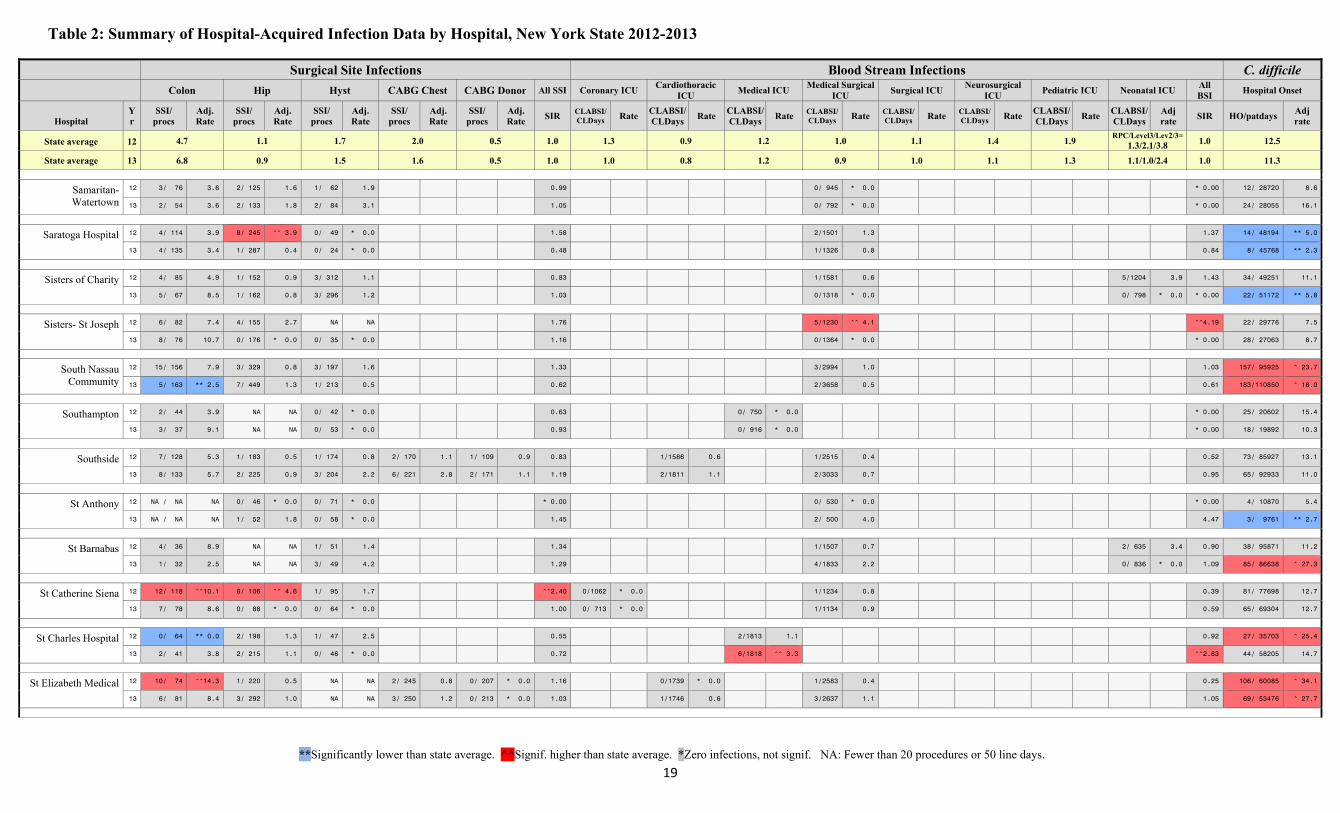
Table 2: Summary of Hospital-Acquired Infection Data by Hospital, New York State 2012-2013
**Significantly lower than state average. ^^Signif. higher than state average. *Zero infections, not signif. NA: Fewer than 20 procedures or 50 line days.
19
Surgical Site Infections Blood Stream Infections C. difficile Colon Hip Hyst CABG Chest CABG Donor All SSI Coronary ICU
Cardiothoracic ICU
Medical ICU Medical Surgical
ICU Surgical ICU
Neurosurgical ICU
Pediatric ICU Neonatal ICU All BSI
Hospital Onset
Hospital Yr
SSI/ procs
Adj. Rate
SSI/ procs
Adj. Rate
SSI/ procs
Adj. Rate
SSI/ procs
Adj. Rate
SSI/ procs
Adj. Rate
SIR CLABSI/CLDays Rate
CLABSI/CLDays
Rate CLABSI/CLDays
Rate CLABSI/CLDays Rate CLABSI/
CLDays Rate CLABSI/CLDays Rate
CLABSI/ CLDays
Rate CLABSI/ CLDays
Adj rate
SIR HO/patdays Adj rate
State average 12 4.7 1.1 1.7 2.0 0.5 1.0 1.3 0.9 1.2 1.0 1.1 1.4 1.9 RPC/Level3/Lev2/3=
1.3/2.1/3.8 1.0 12.5
State average 13 6.8 0.9 1.5 1.6 0.5 1.0 1.0 0.8 1.2 0.9 1.0 1.1 1.3 1.1/1.0/2.4 1.0 11.3
Samaritan- Watertown
12 3/ 76 3.6 2/ 125 1.6 1/ 62 1.9 0.99 0/ 945 * 0.0 * 0.00 12/ 28720 8.6
13 2/ 54 3.6 2/ 133 1.8 2/ 84 3.1 1.05 0/ 792 * 0.0 * 0.00 24/ 28055 16.1
Saratoga Hospital 12 4/ 114 3.9 8/ 245 ^^ 3.9 0/ 49 * 0.0 1.58 2/1501 1.3 1.37 14/ 48194 ** 5.0
13 4/ 135 3.4 1/ 287 0.4 0/ 24 * 0.0 0.48 1/1326 0.8 0.84 8/ 45768 ** 2.3
Sisters of Charity 12 4/ 85 4.9 1/ 152 0.9 3/ 312 1.1 0.83 1/1581 0.6 5/1204 3.9 1.43 34/ 49251 11.1
13 5/ 67 8.5 1/ 162 0.8 3/ 296 1.2 1.03 0/1318 * 0.0 0/ 798 * 0.0 * 0.00 22/ 51172 ** 5.8
Sisters- St Joseph 12 6/ 82 7.4 4/ 155 2.7 NA NA 1.76 5/1230 ^^ 4.1 ^^4.19 22/ 29776 7.5
13 8/ 76 10.7 0/ 176 * 0.0 0/ 35 * 0.0 1.16 0/1364 * 0.0 * 0.00 28/ 27063 8.7
South Nassau Community
12 15/ 156 7.9 3/ 329 0.8 3/ 197 1.6 1.33 3/2994 1.0 1.03 157/ 95925 ^ 23.7
13 5/ 163 ** 2.5 7/ 449 1.3 1/ 213 0.5 0.62 2/3658 0.5 0.61 183/110850 ^ 18.0
Southampton 12 2/ 44 3.9 NA NA 0/ 42 * 0.0 0.63 0/ 750 * 0.0 * 0.00 25/ 20602 15.4
13 3/ 37 9.1 NA NA 0/ 53 * 0.0 0.93 0/ 916 * 0.0 * 0.00 18/ 19892 10.3
Southside 12 7/ 128 5.3 1/ 183 0.5 1/ 174 0.8 2/ 170 1.1 1/ 109 0.9 0.83 1/1586 0.6 1/2515 0.4 0.52 73/ 85927 13.1
13 8/ 133 5.7 2/ 225 0.9 3/ 204 2.2 6/ 221 2.8 2/ 171 1.1 1.19 2/1811 1.1 2/3033 0.7 0.95 65/ 92933 11.0
St Anthony 12 NA / NA NA 0/ 46 * 0.0 0/ 71 * 0.0 * 0.00 0/ 530 * 0.0 * 0.00 4/ 10870 5.4
13 NA / NA NA 1/ 52 1.8 0/ 58 * 0.0 1.45 2/ 500 4.0 4.47 3/ 9761 ** 2.7
St Barnabas 12 4/ 36 8.9 NA NA 1/ 51 1.4 1.34 1/1507 0.7 2/ 635 3.4 0.90 38/ 95871 11.2
13 1/ 32 2.5 NA NA 3/ 49 4.2 1.29 4/1833 2.2 0/ 836 * 0.0 1.09 85/ 86638 ^ 27.3
St Catherine Siena 12 12/ 118 ^^10.1 6/ 106 ^^ 4.6 1/ 95 1.7 ^^2.40 0/1062 * 0.0 1/1234 0.8 0.39 81/ 77698 12.7
13 7/ 78 8.6 0/ 88 * 0.0 0/ 64 * 0.0 1.00 0/ 713 * 0.0 1/1134 0.9 0.59 65/ 69304 12.7
St Charles Hospital 12 0/ 64 ** 0.0 2/ 198 1.3 1/ 47 2.5 0.55 2/1813 1.1 0.92 27/ 35703 ^ 25.4
13 2/ 41 3.8 2/ 215 1.1 0/ 46 * 0.0 0.72 6/1818 ^^ 3.3 ^^2.83 44/ 58205 14.7
St Elizabeth Medical 12 10/ 74 ^^14.3 1/ 220 0.5 NA NA 2/ 245 0.8 0/ 207 * 0.0 1.16 0/1739 * 0.0 1/2583 0.4 0.25 106/ 60085 ^ 34.1
13 6/ 81 8.4 3/ 292 1.0 NA NA 3/ 250 1.2 0/ 213 * 0.0 1.03 1/1746 0.6 3/2637 1.1 1.05 69/ 53476 ^ 27.7
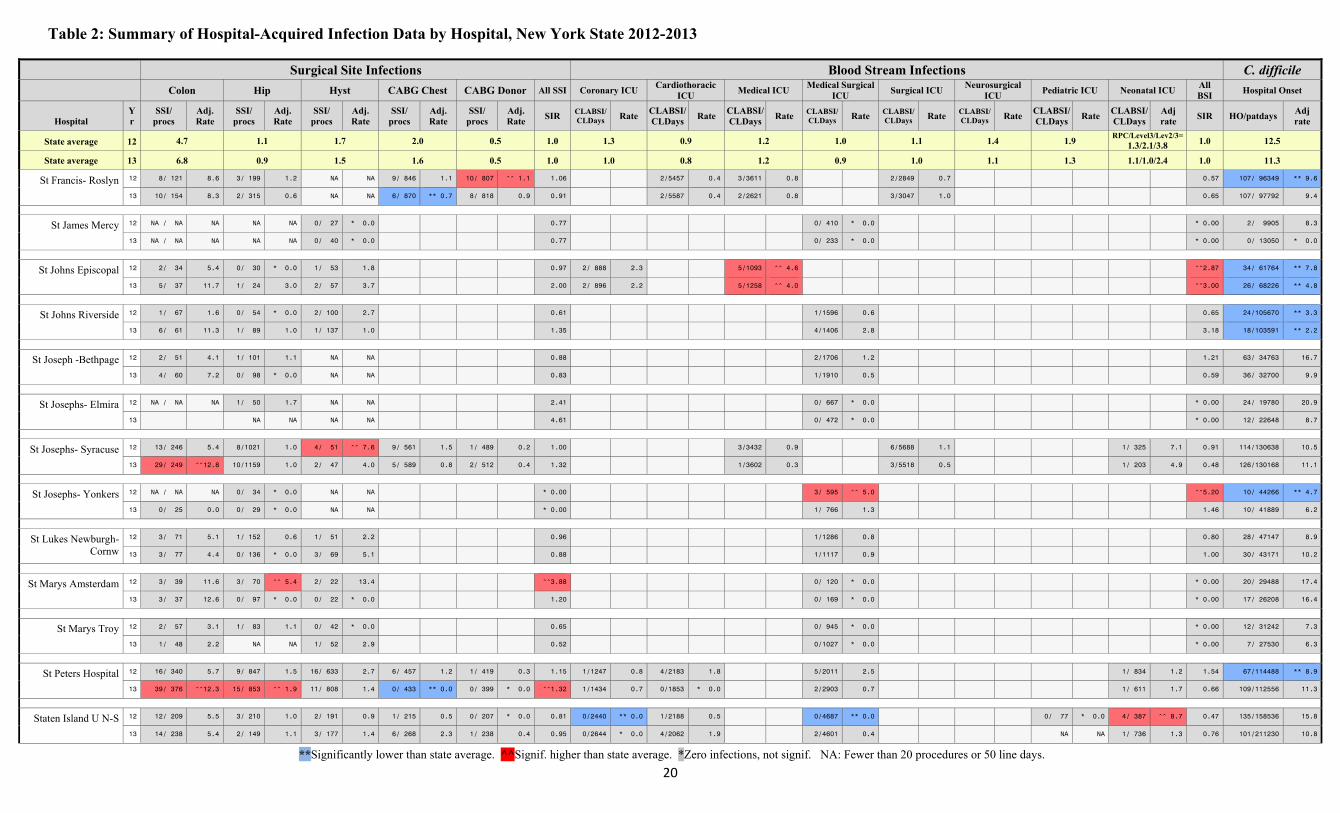
Table 2: Summary of Hospital-Acquired Infection Data by Hospital, New York State 2012-2013
**Significantly lower than state average. ^^Signif. higher than state average. *Zero infections, not signif. NA: Fewer than 20 procedures or 50 line days.
20
Surgical Site Infections Blood Stream Infections C. difficile Colon Hip Hyst CABG Chest CABG Donor All SSI Coronary ICU
Cardiothoracic ICU
Medical ICU Medical Surgical
ICU Surgical ICU
Neurosurgical ICU
Pediatric ICU Neonatal ICU All BSI
Hospital Onset
Hospital Yr
SSI/ procs
Adj. Rate
SSI/ procs
Adj. Rate
SSI/ procs
Adj. Rate
SSI/ procs
Adj. Rate
SSI/ procs
Adj. Rate
SIR CLABSI/CLDays Rate
CLABSI/CLDays
Rate CLABSI/CLDays
Rate CLABSI/CLDays Rate CLABSI/
CLDays Rate CLABSI/CLDays Rate
CLABSI/ CLDays
Rate CLABSI/ CLDays
Adj rate
SIR HO/patdays Adj rate
State average 12 4.7 1.1 1.7 2.0 0.5 1.0 1.3 0.9 1.2 1.0 1.1 1.4 1.9 RPC/Level3/Lev2/3=
1.3/2.1/3.8 1.0 12.5
State average 13 6.8 0.9 1.5 1.6 0.5 1.0 1.0 0.8 1.2 0.9 1.0 1.1 1.3 1.1/1.0/2.4 1.0 11.3
St Francis- Roslyn 12 8/ 121 8.6 3/ 199 1.2 NA NA 9/ 846 1.1 10/ 807 ^^ 1.1 1.06 2/5457 0.4 3/3611 0.8 2/2849 0.7 0.57 107/ 96349 ** 9.6
13 10/ 154 8.3 2/ 315 0.6 NA NA 6/ 870 ** 0.7 8/ 818 0.9 0.91 2/5587 0.4 2/2621 0.8 3/3047 1.0 0.65 107/ 97792 9.4
St James Mercy 12 NA / NA NA NA NA 0/ 27 * 0.0 0.77 0/ 410 * 0.0 * 0.00 2/ 9905 8.3
13 NA / NA NA NA NA 0/ 40 * 0.0 0.77 0/ 233 * 0.0 * 0.00 0/ 13050 * 0.0
St Johns Episcopal 12 2/ 34 5.4 0/ 30 * 0.0 1/ 53 1.8 0.97 2/ 888 2.3 5/1093 ^^ 4.6 ^^2.87 34/ 61764 ** 7.8
13 5/ 37 11.7 1/ 24 3.0 2/ 57 3.7 2.00 2/ 896 2.2 5/1258 ^^ 4.0 ^^3.00 26/ 68226 ** 4.8
St Johns Riverside 12 1/ 67 1.6 0/ 54 * 0.0 2/ 100 2.7 0.61 1/1596 0.6 0.65 24/105670 ** 3.3
13 6/ 61 11.3 1/ 89 1.0 1/ 137 1.0 1.35 4/1406 2.8 3.18 18/103591 ** 2.2
St Joseph -Bethpage 12 2/ 51 4.1 1/ 101 1.1 NA NA 0.88 2/1706 1.2 1.21 63/ 34763 16.7
13 4/ 60 7.2 0/ 98 * 0.0 NA NA 0.83 1/1910 0.5 0.59 36/ 32700 9.9
St Josephs- Elmira 12 NA / NA NA 1/ 50 1.7 NA NA 2.41 0/ 667 * 0.0 * 0.00 24/ 19780 20.9
13 NA NA NA NA 4.61 0/ 472 * 0.0 * 0.00 12/ 22648 8.7
St Josephs- Syracuse 12 13/ 246 5.4 8/1021 1.0 4/ 51 ^^ 7.6 9/ 561 1.5 1/ 489 0.2 1.00 3/3432 0.9 6/5688 1.1 1/ 325 7.1 0.91 114/130638 10.5
13 29/ 249 ^^12.8 10/1159 1.0 2/ 47 4.0 5/ 589 0.8 2/ 512 0.4 1.32 1/3602 0.3 3/5518 0.5 1/ 203 4.9 0.48 126/130168 11.1
St Josephs- Yonkers 12 NA / NA NA 0/ 34 * 0.0 NA NA * 0.00 3/ 595 ^^ 5.0 ^^5.20 10/ 44266 ** 4.7
13 0/ 25 0.0 0/ 29 * 0.0 NA NA * 0.00 1/ 766 1.3 1.46 10/ 41889 6.2
St Lukes Newburgh-Cornw
12 3/ 71 5.1 1/ 152 0.6 1/ 51 2.2 0.96 1/1286 0.8 0.80 28/ 47147 8.9
13 3/ 77 4.4 0/ 136 * 0.0 3/ 69 5.1 0.88 1/1117 0.9 1.00 30/ 43171 10.2
St Marys Amsterdam 12 3/ 39 11.6 3/ 70 ^^ 5.4 2/ 22 13.4 ^^3.88 0/ 120 * 0.0 * 0.00 20/ 29488 17.4
13 3/ 37 12.6 0/ 97 * 0.0 0/ 22 * 0.0 1.20 0/ 169 * 0.0 * 0.00 17/ 26208 16.4
St Marys Troy 12 2/ 57 3.1 1/ 83 1.1 0/ 42 * 0.0 0.65 0/ 945 * 0.0 * 0.00 12/ 31242 7.3
13 1/ 48 2.2 NA NA 1/ 52 2.9 0.52 0/1027 * 0.0 * 0.00 7/ 27530 6.3
St Peters Hospital 12 16/ 340 5.7 9/ 847 1.5 16/ 633 2.7 6/ 457 1.2 1/ 419 0.3 1.15 1/1247 0.8 4/2183 1.8 5/2011 2.5 1/ 834 1.2 1.54 67/114488 ** 8.9
13 39/ 376 ^^12.3 15/ 853 ^^ 1.9 11/ 808 1.4 0/ 433 ** 0.0 0/ 399 * 0.0 ^^1.32 1/1434 0.7 0/1853 * 0.0 2/2903 0.7 1/ 611 1.7 0.66 109/112556 11.3
Staten Island U N-S 12 12/ 209 5.5 3/ 210 1.0 2/ 191 0.9 1/ 215 0.5 0/ 207 * 0.0 0.81 0/2440 ** 0.0 1/2188 0.5 0/4687 ** 0.0 0/ 77 * 0.0 4/ 387 ^^ 8.7 0.47 135/158536 15.8
13 14/ 238 5.4 2/ 149 1.1 3/ 177 1.4 6/ 268 2.3 1/ 238 0.4 0.95 0/2644 * 0.0 4/2062 1.9 2/4601 0.4 NA NA 1/ 736 1.3 0.76 101/211230 10.8
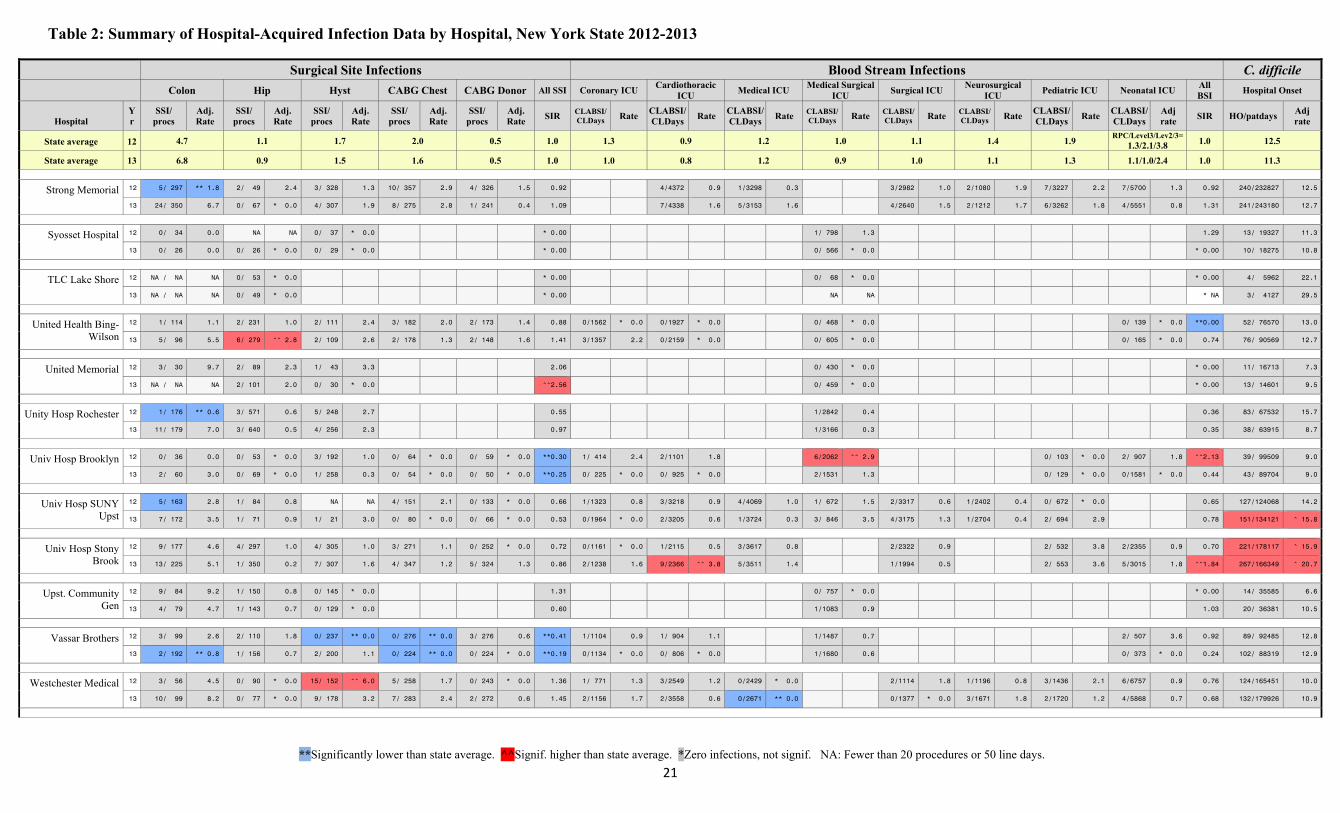
Table 2: Summary of Hospital-Acquired Infection Data by Hospital, New York State 2012-2013
**Significantly lower than state average. ^^Signif. higher than state average. *Zero infections, not signif. NA: Fewer than 20 procedures or 50 line days.
21
Surgical Site Infections Blood Stream Infections C. difficile Colon Hip Hyst CABG Chest CABG Donor All SSI Coronary ICU
Cardiothoracic ICU
Medical ICU Medical Surgical
ICU Surgical ICU
Neurosurgical ICU
Pediatric ICU Neonatal ICU All BSI
Hospital Onset
Hospital Yr
SSI/ procs
Adj. Rate
SSI/ procs
Adj. Rate
SSI/ procs
Adj. Rate
SSI/ procs
Adj. Rate
SSI/ procs
Adj. Rate
SIR CLABSI/CLDays Rate
CLABSI/CLDays
Rate CLABSI/CLDays
Rate CLABSI/CLDays Rate CLABSI/
CLDays Rate CLABSI/CLDays Rate
CLABSI/ CLDays
Rate CLABSI/ CLDays
Adj rate
SIR HO/patdays Adj rate
State average 12 4.7 1.1 1.7 2.0 0.5 1.0 1.3 0.9 1.2 1.0 1.1 1.4 1.9 RPC/Level3/Lev2/3=
1.3/2.1/3.8 1.0 12.5
State average 13 6.8 0.9 1.5 1.6 0.5 1.0 1.0 0.8 1.2 0.9 1.0 1.1 1.3 1.1/1.0/2.4 1.0 11.3
Strong Memorial 12 5/ 297 ** 1.8 2/ 49 2.4 3/ 328 1.3 10/ 357 2.9 4/ 326 1.5 0.92 4/4372 0.9 1/3298 0.3 3/2982 1.0 2/1080 1.9 7/3227 2.2 7/5700 1.3 0.92 240/232827 12.5
13 24/ 350 6.7 0/ 67 * 0.0 4/ 307 1.9 8/ 275 2.8 1/ 241 0.4 1.09 7/4338 1.6 5/3153 1.6 4/2640 1.5 2/1212 1.7 6/3262 1.8 4/5551 0.8 1.31 241/243180 12.7
Syosset Hospital 12 0/ 34 0.0 NA NA 0/ 37 * 0.0 * 0.00 1/ 798 1.3 1.29 13/ 19327 11.3
13 0/ 26 0.0 0/ 26 * 0.0 0/ 29 * 0.0 * 0.00 0/ 566 * 0.0 * 0.00 10/ 18275 10.8
TLC Lake Shore 12 NA / NA NA 0/ 53 * 0.0 * 0.00 0/ 68 * 0.0 * 0.00 4/ 5962 22.1
13 NA / NA NA 0/ 49 * 0.0 * 0.00 NA NA * NA 3/ 4127 29.5
United Health Bing-Wilson
12 1/ 114 1.1 2/ 231 1.0 2/ 111 2.4 3/ 182 2.0 2/ 173 1.4 0.88 0/1562 * 0.0 0/1927 * 0.0 0/ 468 * 0.0 0/ 139 * 0.0 **0.00 52/ 76570 13.0
13 5/ 96 5.5 6/ 279 ^^ 2.8 2/ 109 2.6 2/ 178 1.3 2/ 148 1.6 1.41 3/1357 2.2 0/2159 * 0.0 0/ 605 * 0.0 0/ 165 * 0.0 0.74 76/ 90569 12.7
United Memorial 12 3/ 30 9.7 2/ 89 2.3 1/ 43 3.3 2.06 0/ 430 * 0.0 * 0.00 11/ 16713 7.3
13 NA / NA NA 2/ 101 2.0 0/ 30 * 0.0 ^^2.56 0/ 459 * 0.0 * 0.00 13/ 14601 9.5
Unity Hosp Rochester 12 1/ 176 ** 0.6 3/ 571 0.6 5/ 248 2.7 0.55 1/2842 0.4 0.36 83/ 67532 15.7
13 11/ 179 7.0 3/ 640 0.5 4/ 256 2.3 0.97 1/3166 0.3 0.35 38/ 63915 8.7
Univ Hosp Brooklyn 12 0/ 36 0.0 0/ 53 * 0.0 3/ 192 1.0 0/ 64 * 0.0 0/ 59 * 0.0 **0.30 1/ 414 2.4 2/1101 1.8 6/2062 ^^ 2.9 0/ 103 * 0.0 2/ 907 1.8 ^^2.13 39/ 99509 9.0
13 2/ 60 3.0 0/ 69 * 0.0 1/ 258 0.3 0/ 54 * 0.0 0/ 50 * 0.0 **0.25 0/ 225 * 0.0 0/ 925 * 0.0 2/1531 1.3 0/ 129 * 0.0 0/1581 * 0.0 0.44 43/ 89704 9.0
Univ Hosp SUNY Upst
12 5/ 163 2.8 1/ 84 0.8 NA NA 4/ 151 2.1 0/ 133 * 0.0 0.66 1/1323 0.8 3/3218 0.9 4/4069 1.0 1/ 672 1.5 2/3317 0.6 1/2402 0.4 0/ 672 * 0.0 0.65 127/124068 14.2
13 7/ 172 3.5 1/ 71 0.9 1/ 21 3.0 0/ 80 * 0.0 0/ 66 * 0.0 0.53 0/1964 * 0.0 2/3205 0.6 1/3724 0.3 3/ 846 3.5 4/3175 1.3 1/2704 0.4 2/ 694 2.9 0.78 151/134121 ^ 15.8
Univ Hosp Stony Brook
12 9/ 177 4.6 4/ 297 1.0 4/ 305 1.0 3/ 271 1.1 0/ 252 * 0.0 0.72 0/1161 * 0.0 1/2115 0.5 3/3617 0.8 2/2322 0.9 2/ 532 3.8 2/2355 0.9 0.70 221/178117 ^ 15.9
13 13/ 225 5.1 1/ 350 0.2 7/ 307 1.6 4/ 347 1.2 5/ 324 1.3 0.86 2/1238 1.6 9/2366 ^^ 3.8 5/3511 1.4 1/1994 0.5 2/ 553 3.6 5/3015 1.8 ^^1.84 267/166349 ^ 20.7
Upst. Community Gen
12 9/ 84 9.2 1/ 150 0.8 0/ 145 * 0.0 1.31 0/ 757 * 0.0 * 0.00 14/ 35585 6.6
13 4/ 79 4.7 1/ 143 0.7 0/ 129 * 0.0 0.60 1/1083 0.9 1.03 20/ 36381 10.5
Vassar Brothers 12 3/ 99 2.6 2/ 110 1.8 0/ 237 ** 0.0 0/ 276 ** 0.0 3/ 276 0.6 **0.41 1/1104 0.9 1/ 904 1.1 1/1487 0.7 2/ 507 3.6 0.92 89/ 92485 12.8
13 2/ 192 ** 0.8 1/ 156 0.7 2/ 200 1.1 0/ 224 ** 0.0 0/ 224 * 0.0 **0.19 0/1134 * 0.0 0/ 806 * 0.0 1/1680 0.6 0/ 373 * 0.0 0.24 102/ 88319 12.9
Westchester Medical 12 3/ 56 4.5 0/ 90 * 0.0 15/ 152 ^^ 6.0 5/ 258 1.7 0/ 243 * 0.0 1.36 1/ 771 1.3 3/2549 1.2 0/2429 * 0.0 2/1114 1.8 1/1196 0.8 3/1436 2.1 6/6757 0.9 0.76 124/165451 10.0
13 10/ 99 8.2 0/ 77 * 0.0 9/ 178 3.2 7/ 283 2.4 2/ 272 0.6 1.45 2/1156 1.7 2/3558 0.6 0/2671 ** 0.0 0/1377 * 0.0 3/1671 1.8 2/1720 1.2 4/5868 0.7 0.68 132/179926 10.9
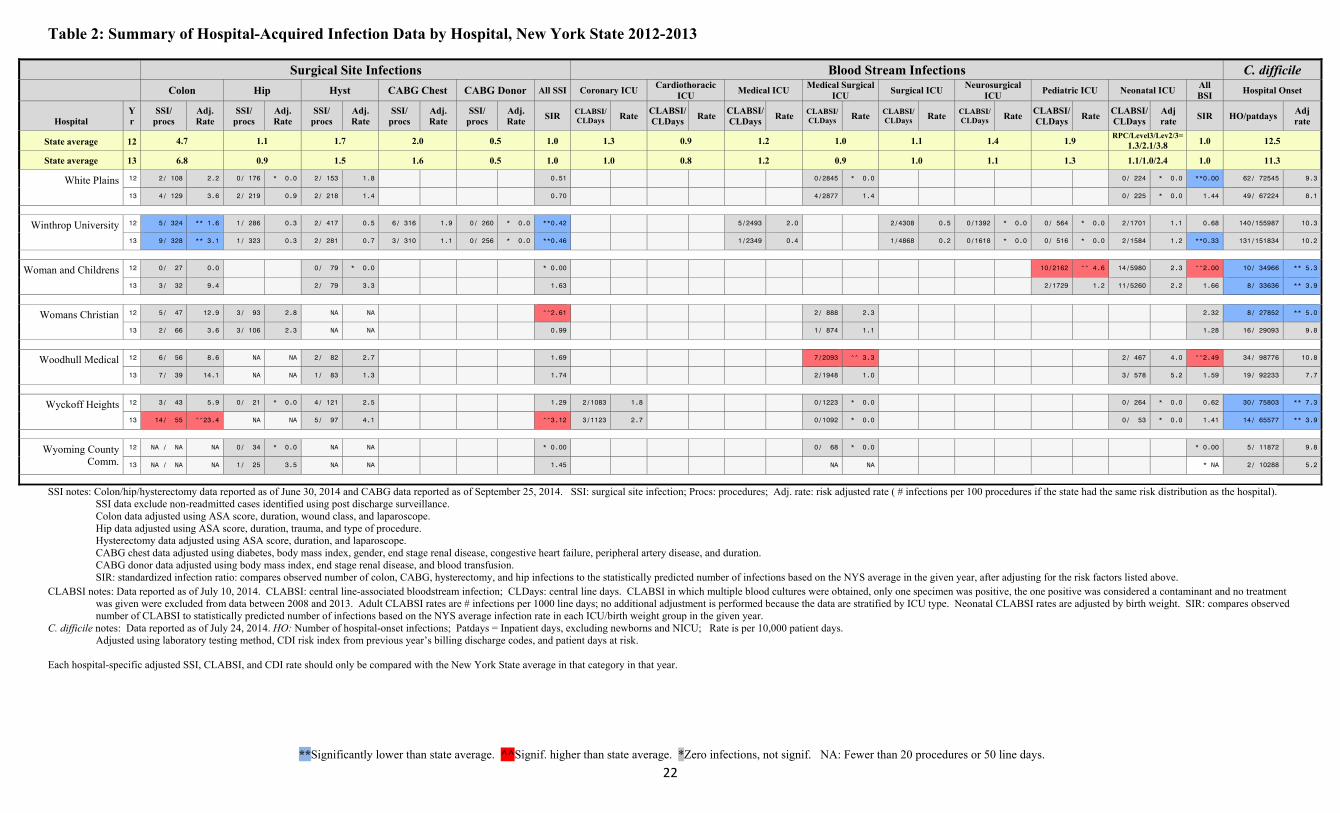
Table 2: Summary of Hospital-Acquired Infection Data by Hospital, New York State 2012-2013
**Significantly lower than state average. ^^Signif. higher than state average. *Zero infections, not signif. NA: Fewer than 20 procedures or 50 line days.
22
Surgical Site Infections Blood Stream Infections C. difficile Colon Hip Hyst CABG Chest CABG Donor All SSI Coronary ICU
Cardiothoracic ICU
Medical ICU Medical Surgical
ICU Surgical ICU
Neurosurgical ICU
Pediatric ICU Neonatal ICU All BSI
Hospital Onset
Hospital Yr
SSI/ procs
Adj. Rate
SSI/ procs
Adj. Rate
SSI/ procs
Adj. Rate
SSI/ procs
Adj. Rate
SSI/ procs
Adj. Rate
SIR CLABSI/CLDays Rate
CLABSI/CLDays
Rate CLABSI/CLDays
Rate CLABSI/CLDays Rate CLABSI/
CLDays Rate CLABSI/CLDays Rate
CLABSI/ CLDays
Rate CLABSI/ CLDays
Adj rate
SIR HO/patdays Adj rate
State average 12 4.7 1.1 1.7 2.0 0.5 1.0 1.3 0.9 1.2 1.0 1.1 1.4 1.9 RPC/Level3/Lev2/3=
1.3/2.1/3.8 1.0 12.5
State average 13 6.8 0.9 1.5 1.6 0.5 1.0 1.0 0.8 1.2 0.9 1.0 1.1 1.3 1.1/1.0/2.4 1.0 11.3
White Plains 12 2/ 108 2.2 0/ 176 * 0.0 2/ 153 1.8 0.51 0/2845 * 0.0 0/ 224 * 0.0 **0.00 62/ 72545 9.3
13 4/ 129 3.6 2/ 219 0.9 2/ 218 1.4 0.70 4/2877 1.4 0/ 225 * 0.0 1.44 49/ 67224 8.1
Winthrop University 12 5/ 324 ** 1.6 1/ 286 0.3 2/ 417 0.5 6/ 316 1.9 0/ 260 * 0.0 **0.42 5/2493 2.0 2/4308 0.5 0/1392 * 0.0 0/ 564 * 0.0 2/1701 1.1 0.68 140/155987 10.3
13 9/ 328 ** 3.1 1/ 323 0.3 2/ 281 0.7 3/ 310 1.1 0/ 256 * 0.0 **0.46 1/2349 0.4 1/4868 0.2 0/1618 * 0.0 0/ 516 * 0.0 2/1584 1.2 **0.33 131/151834 10.2
Woman and Childrens 12 0/ 27 0.0 0/ 79 * 0.0 * 0.00 10/2162 ^^ 4.6 14/5980 2.3 ^^2.00 10/ 34966 ** 5.3
13 3/ 32 9.4 2/ 79 3.3 1.63 2/1729 1.2 11/5260 2.2 1.66 8/ 33636 ** 3.9
Womans Christian 12 5/ 47 12.9 3/ 93 2.8 NA NA ^^2.61 2/ 888 2.3 2.32 8/ 27852 ** 5.0
13 2/ 66 3.6 3/ 106 2.3 NA NA 0.99 1/ 874 1.1 1.28 16/ 29093 9.8
Woodhull Medical 12 6/ 56 8.6 NA NA 2/ 82 2.7 1.69 7/2093 ^^ 3.3 2/ 467 4.0 ^^2.49 34/ 98776 10.8
13 7/ 39 14.1 NA NA 1/ 83 1.3 1.74 2/1948 1.0 3/ 578 5.2 1.59 19/ 92233 7.7
Wyckoff Heights 12 3/ 43 5.9 0/ 21 * 0.0 4/ 121 2.5 1.29 2/1083 1.8 0/1223 * 0.0 0/ 264 * 0.0 0.62 30/ 75803 ** 7.3
13 14/ 55 ^^23.4 NA NA 5/ 97 4.1 ^^3.12 3/1123 2.7 0/1092 * 0.0 0/ 53 * 0.0 1.41 14/ 65577 ** 3.9
Wyoming County Comm.
12 NA / NA NA 0/ 34 * 0.0 NA NA * 0.00 0/ 68 * 0.0 * 0.00 5/ 11872 9.8
13 NA / NA NA 1/ 25 3.5 NA NA 1.45 NA NA * NA 2/ 10288 5.2
SSI notes: Colon/hip/hysterectomy data reported as of June 30, 2014 and CABG data reported as of September 25, 2014. SSI: surgical site infection; Procs: procedures; Adj. rate: risk adjusted rate ( # infections per 100 procedures if the state had the same risk distribution as the hospital). SSI data exclude non-readmitted cases identified using post discharge surveillance. Colon data adjusted using ASA score, duration, wound class, and laparoscope.
Hip data adjusted using ASA score, duration, trauma, and type of procedure. Hysterectomy data adjusted using ASA score, duration, and laparoscope. CABG chest data adjusted using diabetes, body mass index, gender, end stage renal disease, congestive heart failure, peripheral artery disease, and duration.
CABG donor data adjusted using body mass index, end stage renal disease, and blood transfusion. SIR: standardized infection ratio: compares observed number of colon, CABG, hysterectomy, and hip infections to the statistically predicted number of infections based on the NYS average in the given year, after adjusting for the risk factors listed above. CLABSI notes: Data reported as of July 10, 2014. CLABSI: central line-associated bloodstream infection; CLDays: central line days. CLABSI in which multiple blood cultures were obtained, only one specimen was positive, the one positive was considered a contaminant and no treatment
was given were excluded from data between 2008 and 2013. Adult CLABSI rates are # infections per 1000 line days; no additional adjustment is performed because the data are stratified by ICU type. Neonatal CLABSI rates are adjusted by birth weight. SIR: compares observed number of CLABSI to statistically predicted number of infections based on the NYS average infection rate in each ICU/birth weight group in the given year.
C. difficile notes: Data reported as of July 24, 2014. HO: Number of hospital-onset infections; Patdays = Inpatient days, excluding newborns and NICU; Rate is per 10,000 patient days. Adjusted using laboratory testing method, CDI risk index from previous year’s billing discharge codes, and patient days at risk. Each hospital-specific adjusted SSI, CLABSI, and CDI rate should only be compared with the New York State average in that category in that year.
23
Background Hospital-acquired infections (HAIs) are an important cause of morbidity and mortality, affecting approximately four percent of inpatients.2 In accordance with Public Health Law 2819, New York State (NYS) has been tracking HAIs since 2007. This law was created to provide the public with fair, accurate, and reliable HAI data to compare hospital infection rates and to support quality improvement and infection prevention activities in hospitals. Hospitals report to NYS using the Centers for Disease Control and Prevention’s (CDC’s) National Healthcare Safety Network (NHSN). This online system allows hospitals, NYS, and CDC to concurrently monitor the same data. All states follow the same surveillance methods. Additional information about the NHSN can be found at http://www.cdc.gov/nhsn/. NYSDOH evaluates which HAI indicators should be reported annually with the help of a Technical Advisory Workgroup (TAW), a panel of experts in the prevention and reporting of HAIs. In 2007, hospitals were required to report central line-associated bloodstream infections (CLABSIs) in intensive care units (ICUs) and surgical site infections (SSIs) following colon and coronary artery bypass graft (CABG) surgeries. In 2008, hip replacement SSIs were added; in 2010, Clostridium difficile (CDI) infections were added; and in 2012, abdominal hysterectomy SSIs were added. Between July and December 2013, carbapenem-resistant Enterobacteriaceae (CRE) infections were added as a pilot. The pilot provided time for NYSDOH to train facilities, validate the completeness and accuracy of reporting, evaluate the impact of differences in laboratory testing and patient risk factors on rates, and determine the feasibility of a transition to full reporting. Full reporting began in January 2014. Aggregate CRE data are summarized in this report; hospital-specific data will be provided for infections occurring in 2014. In addition to reporting the HAI data mandated by NYS, hospitals enter data into NHSN for federal programs, regional collaboratives, and local surveillance. The Centers for Medicare and Medicaid Services (CMS) Hospital Inpatient Quality Reporting (IQR) Program provides higher reimbursement to hospitals that report certain types of HAI data, including catheter-associated urinary tract infections (CAUTIs) in ICUs and methicillin-resistant Staphylococcus aureus (MRSA) bacteremia. All NYS hospitals that are eligible to participate in this incentive program do so. NYS entered into a data use agreement (DUA) with CDC that allows NYS HAI staff to see all NHSN data for surveillance or prevention purposes. The DUA implemented in May 2013 prohibits the use of the data for public reporting of facility-specific data or for regulatory action. More information about the DUA is available on the CDC website http://www.cdc.gov/hai/pdfs/stateplans/New-York_DUA.pdf.
24
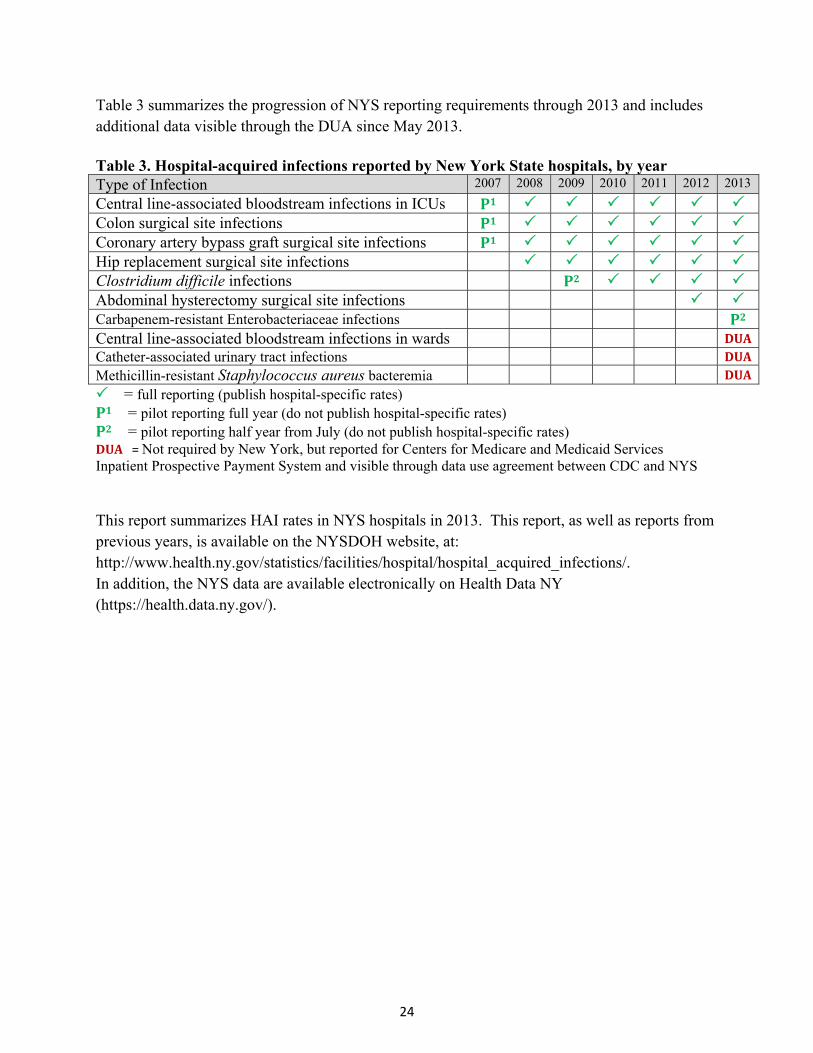
Table 3 summarizes the progression of NYS reporting requirements through 2013 and includes additional data visible through the DUA since May 2013. Table 3. Hospital-acquired infections reported by New York State hospitals, by year Type of Infection 2007 2008 2009 2010 2011 2012 2013
Central line-associated bloodstream infections in ICUs P1 Colon surgical site infections P1 Coronary artery bypass graft surgical site infections P1 Hip replacement surgical site infections Clostridium difficile infections P2 Abdominal hysterectomy surgical site infections Carbapenem-resistant Enterobacteriaceae infections P2Central line-associated bloodstream infections in wards DUACatheter-associated urinary tract infections DUAMethicillin-resistant Staphylococcus aureus bacteremia DUA
= full reporting (publish hospital-specific rates)P1= pilot reporting full year (do not publish hospital-specific rates) P2= pilot reporting half year from July (do not publish hospital-specific rates) DUA=Not required by New York, but reported for Centers for Medicare and Medicaid Services Inpatient Prospective Payment System and visible through data use agreement between CDC and NYS This report summarizes HAI rates in NYS hospitals in 2013. This report, as well as reports from previous years, is available on the NYSDOH website, at: http://www.health.ny.gov/statistics/facilities/hospital/hospital_acquired_infections/. In addition, the NYS data are available electronically on Health Data NY (https://health.data.ny.gov/).
25
Hospital‐AcquiredSurgicalSiteInfections(SSIs)
SSIs are infections that occur after an operation in the part of the body where the surgery took place. NYS requires hospitals to report SSIs associated with four types of surgery:
Colon: Colon surgery is a procedure performed on the lower part of the digestive tract, called the large intestine or colon.
Coronary artery bypass graft (CABG): CABG surgery is a procedure performed for heart disease in which a vein or artery from the chest or another part of the body (termed the “donor site”) is used to create an alternate path for blood to flow to the heart, bypassing a blocked artery.
Hip: Hip replacement or revision surgery involves removing damaged cartilage and bone from the hip joint and replacing or resurfacing them with new, man-made parts.
Abdominal hysterectomy: Abdominal hysterectomy is the surgical removal of a woman’s uterus through an incision in the abdominal wall.
These procedures were selected because of the frequency of infections, severity of infection-related complications, ability to perform risk adjustment, and potential for quality improvement. SSIs are categorized into three groups depending on the severity of the infection:
Superficial Incisional SSI - This infection occurs in the area of the skin where the surgical incision was made. The patient may have pus draining from the incision or laboratory-identified pathogens from the incision.
Deep Incisional SSI - This infection occurs beneath the incision area in muscle tissue. Pus may drain from the deep incision, and patients may experience fever and pain. The incision may reopen on its own, or a surgeon may reopen the wound.
Organ or Space SSI - This type of infection occurs in body organs or the space between organs. Pus may collect in an abscess below the muscles, resulting in inflammation and pain.
According to the October 2013 NYSDOH survey, hospital infection preventionists (IPs) implemented a wide variety of SSI surveillance methods. For example, 40% of IPs routinely reviewed all procedures for SSIs, while others reviewed a subset of procedures that were flagged based on data mining systems, wound culture reports, readmission, return to surgery, and discharge coding. IPs identified SSIs using the following sources: lab reports (99%), operative
26
report (95%), physician dictated operative notes (92%), progress notes (92%), discharge notes (90%), history and physical examination documentation (89%), return to surgery (88%), radiology reports (88%), infectious disease consultations (86%), intraoperative report (82%), outpatient/emergency room visits (82%), documentation of vital signs (75%), antibiotic prescriptions (64%), coding summary sheet (54%).
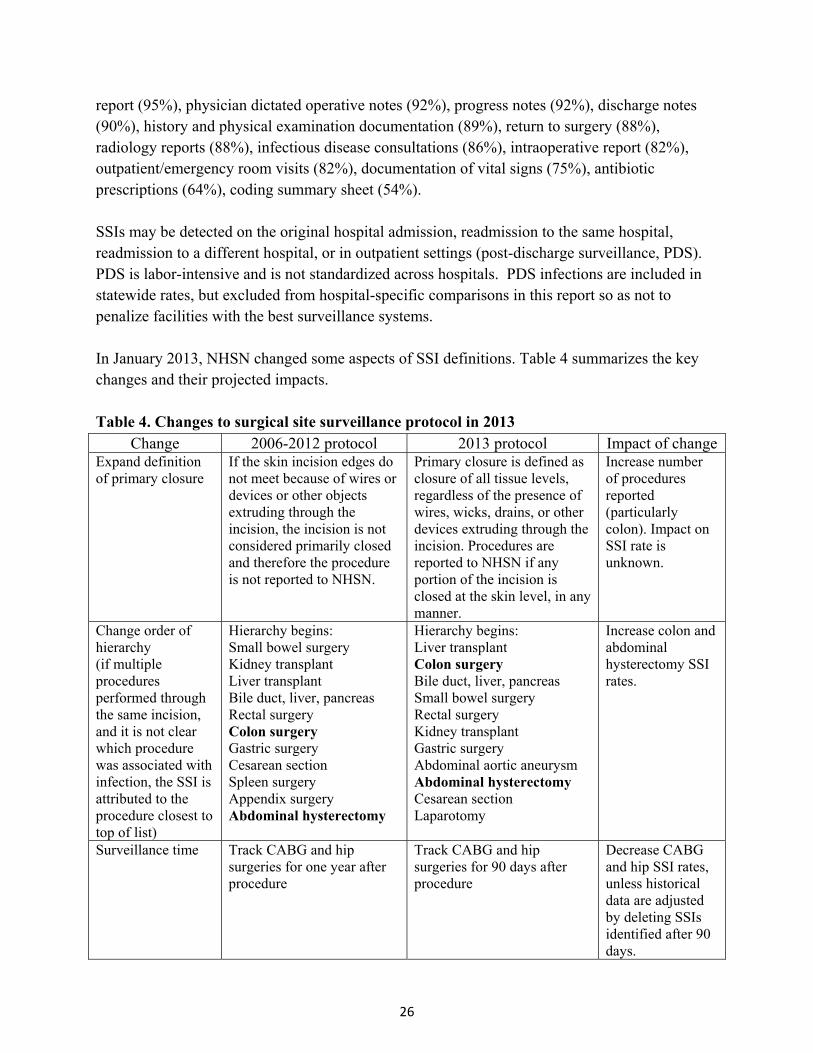
SSIs may be detected on the original hospital admission, readmission to the same hospital, readmission to a different hospital, or in outpatient settings (post-discharge surveillance, PDS). PDS is labor-intensive and is not standardized across hospitals. PDS infections are included in statewide rates, but excluded from hospital-specific comparisons in this report so as not to penalize facilities with the best surveillance systems. In January 2013, NHSN changed some aspects of SSI definitions. Table 4 summarizes the key changes and their projected impacts. Table 4. Changes to surgical site surveillance protocol in 2013
Change 2006-2012 protocol 2013 protocol Impact of changeExpand definition of primary closure
If the skin incision edges do not meet because of wires or devices or other objects extruding through the incision, the incision is not considered primarily closed and therefore the procedure is not reported to NHSN.
Primary closure is defined as closure of all tissue levels, regardless of the presence of wires, wicks, drains, or other devices extruding through the incision. Procedures are reported to NHSN if any portion of the incision is closed at the skin level, in any manner.
Increase number of procedures reported (particularly colon). Impact on SSI rate is unknown.
Change order of hierarchy (if multiple procedures performed through the same incision, and it is not clear which procedure was associated with infection, the SSI is attributed to the procedure closest to top of list)
Hierarchy begins: Small bowel surgery Kidney transplant Liver transplant Bile duct, liver, pancreas Rectal surgery Colon surgery Gastric surgery Cesarean section Spleen surgery Appendix surgery Abdominal hysterectomy
Hierarchy begins: Liver transplant Colon surgery Bile duct, liver, pancreas Small bowel surgery Rectal surgery Kidney transplant Gastric surgery Abdominal aortic aneurysm Abdominal hysterectomy Cesarean section Laparotomy
Increase colon and abdominal hysterectomy SSI rates.
Surveillance time Track CABG and hip surgeries for one year after procedure
Track CABG and hip surgeries for 90 days after procedure
Decrease CABG and hip SSI rates, unless historical data are adjusted by deleting SSIs identified after 90 days.

27
For additional information on the surveillance definitions, see http://www.cdc.gov/nhsn/PDFs/pscManual/9pscSSIcurrent.pdf. For each type of SSI, the following pages describe trends in infections, the severity (depth) of infections, microorganisms involved, and individual hospitals’ risk-adjusted infection rates compared to the state average. At the end of this section, overall trends in SSIs are summarized.

28
ColonSurgicalSiteInfections Among 17,775 colon procedures performed in 2013, 1,317 (7.4%) developed SSIs. Of these infections, 42% were superficial, 17% were deep, and 42% were organ/space (Table 5). The majority of the SSIs (60%) were detected during the initial hospitalization; 29% were identified upon readmission to the same hospital; 2% involved readmission to another hospital; and 9% were detected using post-discharge surveillance (PDS) and not readmitted. The majority of the PDS infections were superficial. Detection of SSIs in outpatient locations is labor intensive and is not standardized across hospitals; therefore, the NYSDOH did not include these 116 infections for hospital-specific comparisons.
Table 5. Method of detection of colon surgical site infection by depth of infection, New York State 2013
When Detected
Extent (Row%)
(Column%) Initial
Hospitalization
Readmitted to the SameHospital
Readmitted to Another
Hospital
Post-Discharge
Surveillance Not
Readmitted TotalSuperficial Incisional 337
(61.1%) (42.5%)
110 (19.9%) (28.9%)
7 (1.3%) (25.0%)
98 (17.8%) (84.5%)
552
(41.9%)
Deep Incisional 131 (60.1%) (16.5%)
69 (31.7%) (18.2%)
4 (1.8%) (14.3%)
14 (6.4%) (12.1%)
218
(16.6%)
Organ/Space 325 (59.4%) (41.0%)
201 (36.7%) (52.9%)
17 (3.1%) (60.7%)
4 (0.7%) (3.4%)
547
(41.5%)
Total 793
(60.2%)
380
(28.9%)
28
(2.1%)
116
(8.8%)
1,317
New York State data reported as of June 30, 2014.
The most common microorganisms associated with colon SSIs were Enterococci and Escherichia coli (Table 6). The distribution of microorganisms associated with colon SSIs is consistent with previously published NYS HAI public reports.
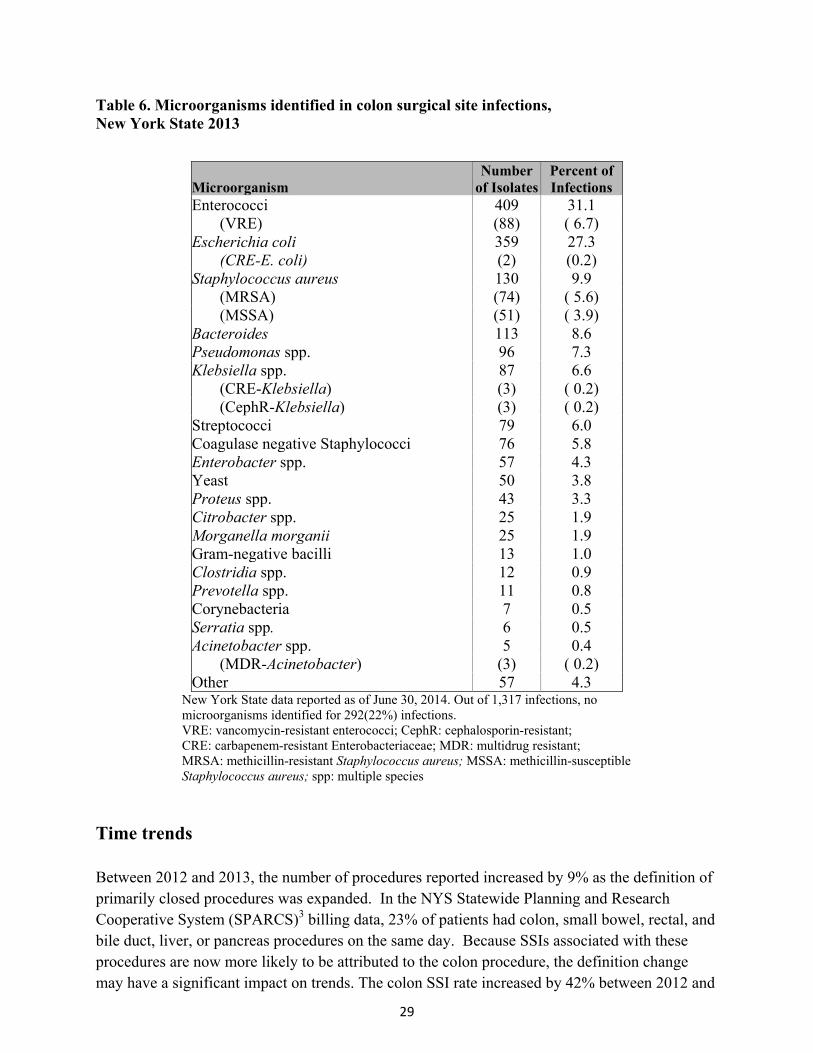
29
Table 6. Microorganisms identified in colon surgical site infections, New York State 2013
Microorganism Number
of IsolatesPercent of Infections
Enterococci 409 31.1 (VRE) (88) ( 6.7) Escherichia coli (CRE-E. coli)
359 (2)
27.3 (0.2)
Staphylococcus aureus 130 9.9 (MRSA) (74) ( 5.6) (MSSA) (51) ( 3.9) Bacteroides Pseudomonas spp.
113 96
8.6 7.3
Klebsiella spp. 87 6.6 (CRE-Klebsiella) (3) ( 0.2) (CephR-Klebsiella) (3) ( 0.2) Streptococci 79 6.0 Coagulase negative Staphylococci 76 5.8 Enterobacter spp. 57 4.3 Yeast 50 3.8 Proteus spp. 43 3.3 Citrobacter spp. 25 1.9 Morganella morganii 25 1.9 Gram-negative bacilli 13 1.0 Clostridia spp. 12 0.9 Prevotella spp. 11 0.8 Corynebacteria 7 0.5 Serratia spp. 6 0.5 Acinetobacter spp. 5 0.4 (MDR-Acinetobacter) (3) ( 0.2) Other 57 4.3
New York State data reported as of June 30, 2014. Out of 1,317 infections, no microorganisms identified for 292(22%) infections. VRE: vancomycin-resistant enterococci; CephR: cephalosporin-resistant; CRE: carbapenem-resistant Enterobacteriaceae; MDR: multidrug resistant; MRSA: methicillin-resistant Staphylococcus aureus; MSSA: methicillin-susceptible Staphylococcus aureus; spp: multiple species
Time trends Between 2012 and 2013, the number of procedures reported increased by 9% as the definition of primarily closed procedures was expanded. In the NYS Statewide Planning and Research Cooperative System (SPARCS)3 billing data, 23% of patients had colon, small bowel, rectal, and bile duct, liver, or pancreas procedures on the same day. Because SSIs associated with these procedures are now more likely to be attributed to the colon procedure, the definition change may have a significant impact on trends. The colon SSI rate increased by 42% between 2012 and
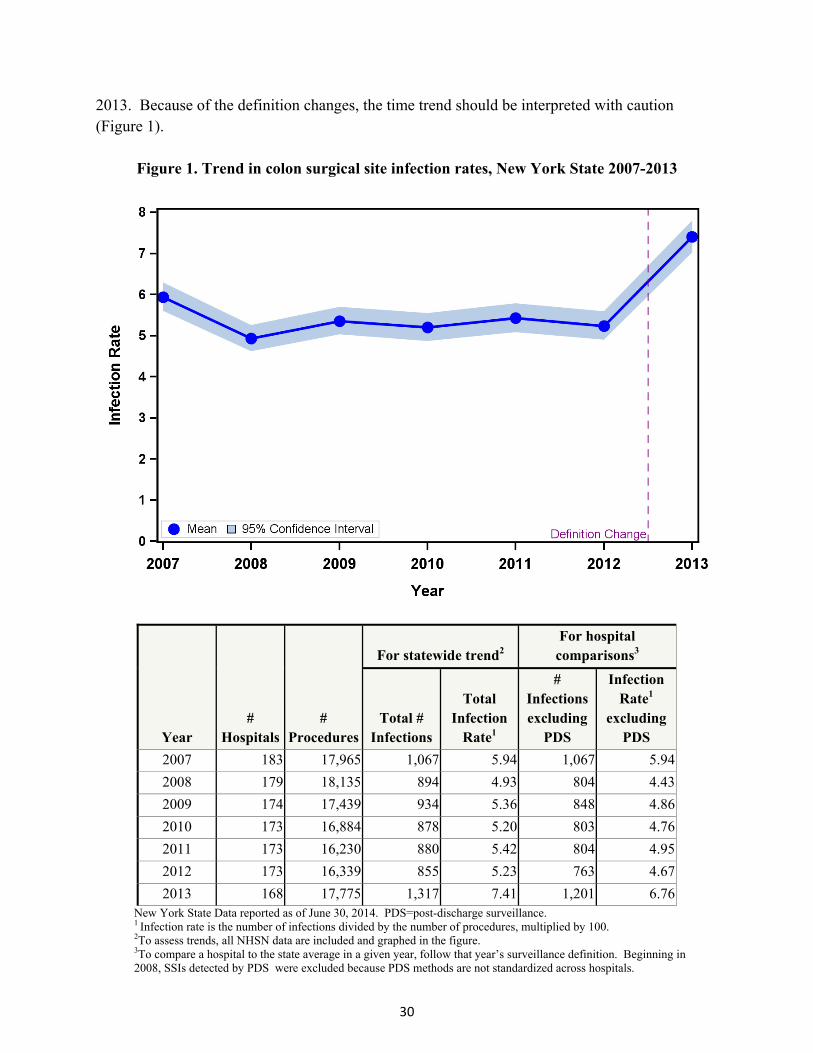
30
2013. Because of the definition changes, the time trend should be interpreted with caution (Figure 1).
Figure 1. Trend in colon surgical site infection rates, New York State 2007-2013
Year #
Hospitals #
Procedures
For statewide trend2 For hospital
comparisons3
Total # Infections
Total Infection
Rate1
# Infections excluding
PDS
Infection Rate1
excluding PDS
2007 183 17,965 1,067 5.94 1,067 5.94
2008 179 18,135 894 4.93 804 4.43
2009 174 17,439 934 5.36 848 4.86
2010 173 16,884 878 5.20 803 4.76
2011 173 16,230 880 5.42 804 4.95
2012 173 16,339 855 5.23 763 4.67
2013 168 17,775 1,317 7.41 1,201 6.76New York State Data reported as of June 30, 2014. PDS=post-discharge surveillance. 1 Infection rate is the number of infections divided by the number of procedures, multiplied by 100. 2To assess trends, all NHSN data are included and graphed in the figure. 3To compare a hospital to the state average in a given year, follow that year’s surveillance definition. Beginning in 2008, SSIs detected by PDS were excluded because PDS methods are not standardized across hospitals.
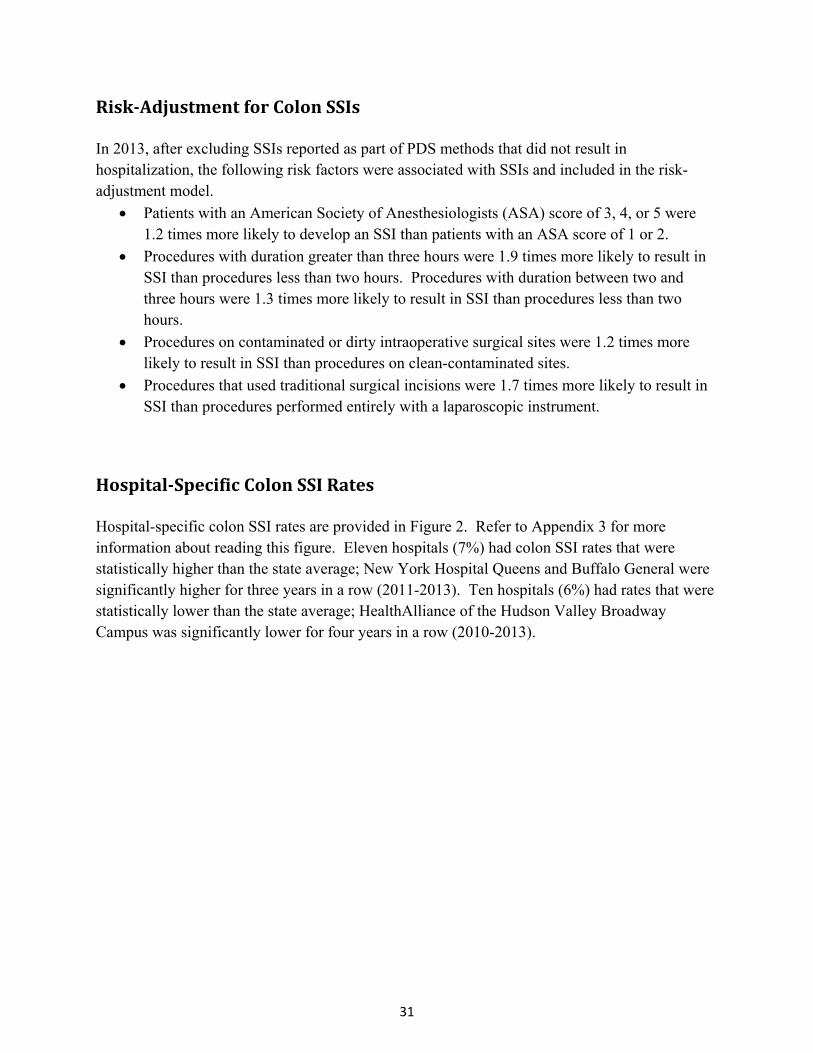
31
Risk‐AdjustmentforColonSSIs In 2013, after excluding SSIs reported as part of PDS methods that did not result in hospitalization, the following risk factors were associated with SSIs and included in the risk-adjustment model.
Patients with an American Society of Anesthesiologists (ASA) score of 3, 4, or 5 were 1.2 times more likely to develop an SSI than patients with an ASA score of 1 or 2.
Procedures with duration greater than three hours were 1.9 times more likely to result in SSI than procedures less than two hours. Procedures with duration between two and three hours were 1.3 times more likely to result in SSI than procedures less than two hours.
Procedures on contaminated or dirty intraoperative surgical sites were 1.2 times more likely to result in SSI than procedures on clean-contaminated sites.
Procedures that used traditional surgical incisions were 1.7 times more likely to result in SSI than procedures performed entirely with a laparoscopic instrument.
Hospital‐SpecificColonSSIRates Hospital-specific colon SSI rates are provided in Figure 2. Refer to Appendix 3 for more information about reading this figure. Eleven hospitals (7%) had colon SSI rates that were statistically higher than the state average; New York Hospital Queens and Buffalo General were significantly higher for three years in a row (2011-2013). Ten hospitals (6%) had rates that were statistically lower than the state average; HealthAlliance of the Hudson Valley Broadway Campus was significantly lower for four years in a row (2010-2013).
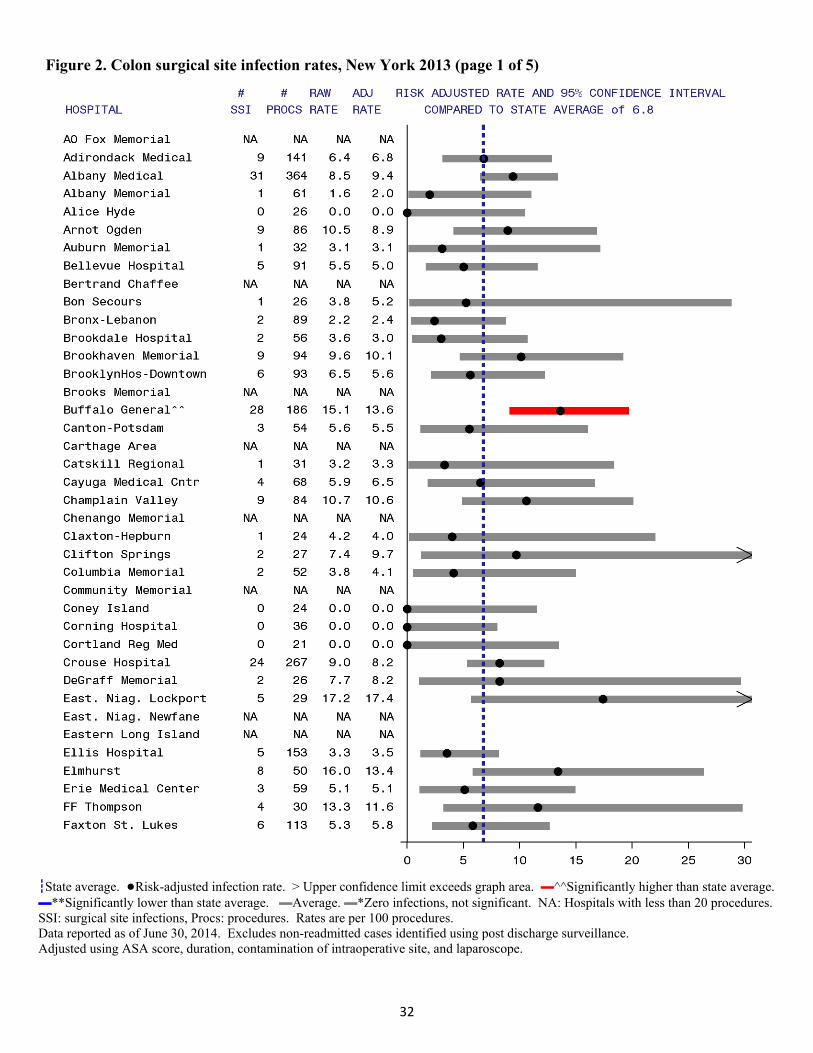
32
Figure 2. Colon surgical site infection rates, New York 2013 (page 1 of 5)
┇State average. ●Risk-adjusted infection rate. > Upper confidence limit exceeds graph area. ▬^^Significantly higher than state average.▬**Significantly lower than state average. ▬Average. ▬*Zero infections, not significant. NA: Hospitals with less than 20 procedures.SSI: surgical site infections, Procs: procedures. Rates are per 100 procedures. Data reported as of June 30, 2014. Excludes non-readmitted cases identified using post discharge surveillance. Adjusted using ASA score, duration, contamination of intraoperative site, and laparoscope.
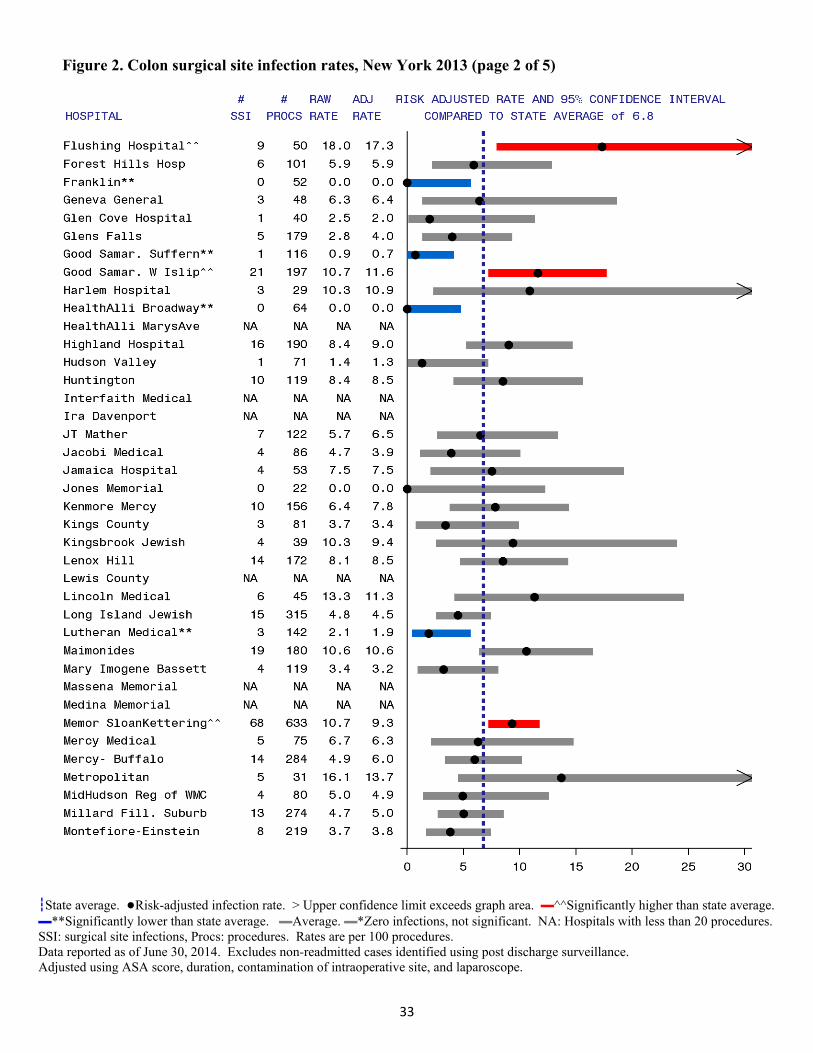
33
Figure 2. Colon surgical site infection rates, New York 2013 (page 2 of 5)
┇State average. ●Risk-adjusted infection rate. > Upper confidence limit exceeds graph area. ▬^^Significantly higher than state average.▬**Significantly lower than state average. ▬Average. ▬*Zero infections, not significant. NA: Hospitals with less than 20 procedures.SSI: surgical site infections, Procs: procedures. Rates are per 100 procedures. Data reported as of June 30, 2014. Excludes non-readmitted cases identified using post discharge surveillance. Adjusted using ASA score, duration, contamination of intraoperative site, and laparoscope.
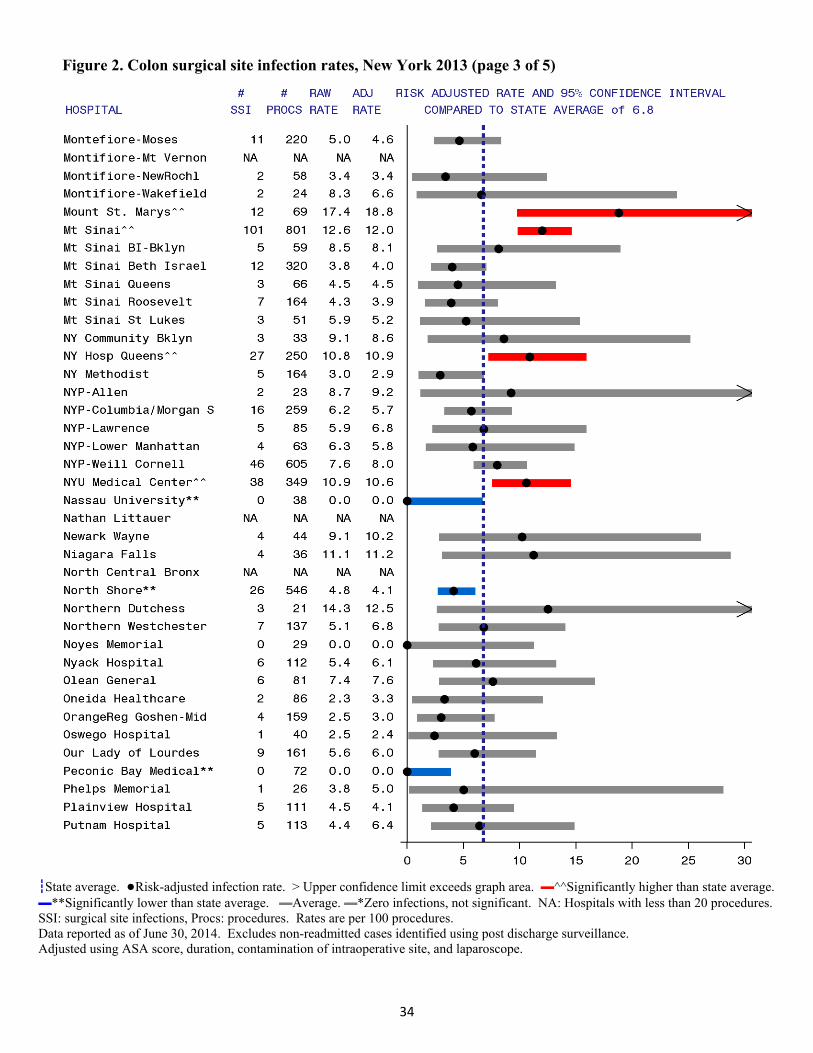
34
Figure 2. Colon surgical site infection rates, New York 2013 (page 3 of 5)
┇State average. ●Risk-adjusted infection rate. > Upper confidence limit exceeds graph area. ▬^^Significantly higher than state average.▬**Significantly lower than state average. ▬Average. ▬*Zero infections, not significant. NA: Hospitals with less than 20 procedures.SSI: surgical site infections, Procs: procedures. Rates are per 100 procedures. Data reported as of June 30, 2014. Excludes non-readmitted cases identified using post discharge surveillance. Adjusted using ASA score, duration, contamination of intraoperative site, and laparoscope.
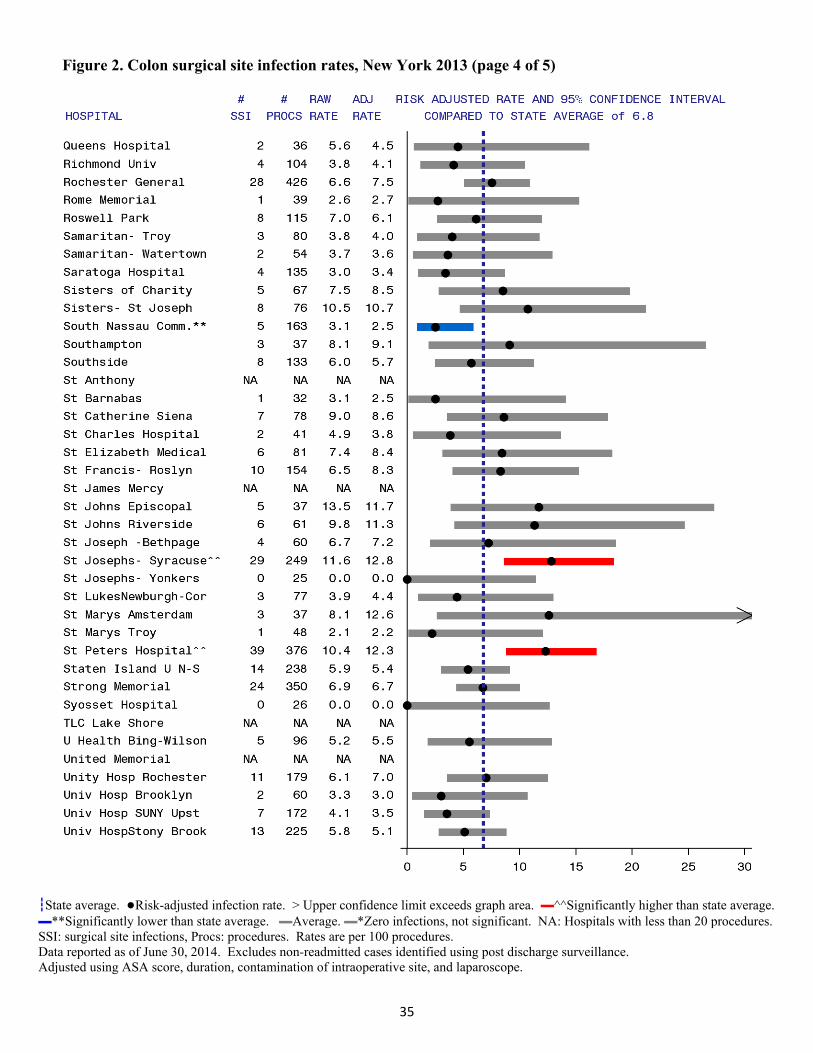
35
Figure 2. Colon surgical site infection rates, New York 2013 (page 4 of 5)
┇State average. ●Risk-adjusted infection rate. > Upper confidence limit exceeds graph area. ▬^^Significantly higher than state average.▬**Significantly lower than state average. ▬Average. ▬*Zero infections, not significant. NA: Hospitals with less than 20 procedures.SSI: surgical site infections, Procs: procedures. Rates are per 100 procedures. Data reported as of June 30, 2014. Excludes non-readmitted cases identified using post discharge surveillance. Adjusted using ASA score, duration, contamination of intraoperative site, and laparoscope.

36
Figure 2. Colon surgical site infection rates, New York 2013 (page 5 of 5)
┇State average. ●Risk-adjusted infection rate. > Upper confidence limit exceeds graph area. ▬^^Significantly higher than state average.▬**Significantly lower than state average. ▬Average. ▬*Zero infections, not significant. NA: Hospitals with less than 20 procedures.SSI: surgical site infections, Procs: procedures. Rates are per 100 procedures. Data reported as of June 30, 2014. Excludes non-readmitted cases identified using post discharge surveillance. Adjusted using ASA score, duration, contamination of intraoperative site, and laparoscope.
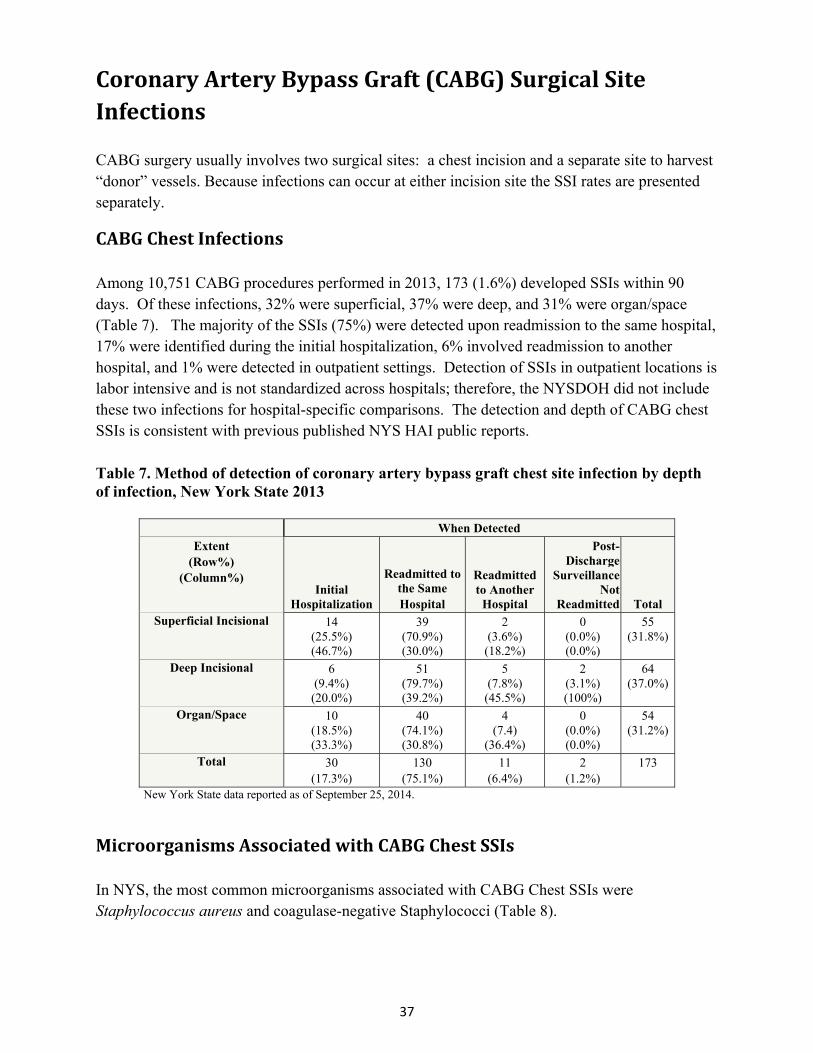
37
CoronaryArteryBypassGraft(CABG)SurgicalSiteInfections CABG surgery usually involves two surgical sites: a chest incision and a separate site to harvest “donor” vessels. Because infections can occur at either incision site the SSI rates are presented separately.
CABGChestInfections Among 10,751 CABG procedures performed in 2013, 173 (1.6%) developed SSIs within 90 days. Of these infections, 32% were superficial, 37% were deep, and 31% were organ/space (Table 7). The majority of the SSIs (75%) were detected upon readmission to the same hospital, 17% were identified during the initial hospitalization, 6% involved readmission to another hospital, and 1% were detected in outpatient settings. Detection of SSIs in outpatient locations is labor intensive and is not standardized across hospitals; therefore, the NYSDOH did not include these two infections for hospital-specific comparisons. The detection and depth of CABG chest SSIs is consistent with previous published NYS HAI public reports.
Table 7. Method of detection of coronary artery bypass graft chest site infection by depth of infection, New York State 2013
When Detected
Extent (Row%)
(Column%) Initial
Hospitalization
Readmitted to the Same Hospital
Readmitted to Another
Hospital
Post-Discharge
Surveillance Not
Readmitted Total Superficial Incisional 14
(25.5%) (46.7%)
39 (70.9%) (30.0%)
2 (3.6%) (18.2%)
0 (0.0%) (0.0%)
55 (31.8%)
Deep Incisional 6
(9.4%) (20.0%)
51 (79.7%) (39.2%)
5 (7.8%) (45.5%)
2 (3.1%) (100%)
64 (37.0%)
Organ/Space 10
(18.5%) (33.3%)
40 (74.1%) (30.8%)
4 (7.4)
(36.4%)
0 (0.0%) (0.0%)
54 (31.2%)
Total 30
(17.3%) 130
(75.1%) 11
(6.4%) 2
(1.2%) 173
New York State data reported as of September 25, 2014.
MicroorganismsAssociatedwithCABGChestSSIs In NYS, the most common microorganisms associated with CABG Chest SSIs were Staphylococcus aureus and coagulase-negative Staphylococci (Table 8).

38
Table 8. Microorganisms identified in coronary artery bypass chest site infections, New York State 2013
Microorganism Number
of IsolatesPercent of Infections
Staphylococcus aureus 48 27.7 (MRSA) (19) (11.0) (MSSA) (29) (16.8) Coagulase negative Staphylococci 20 11.6 Pseudomonas spp. 19 11.0 Klebsiella spp. (CephR Klebsiella)
16 (1)
9.2 (0.6)
Serratia spp. 13 7.5 Escherichia coli 11 6.4 Proteus spp. 11 6.4 Enterobacter spp. 9 5.2 Enterococci 8 4.6 (VRE) (1) (0.6) Streptococci 5 2.9 Other 10 5.8
New York State data reported as of September 25, 2014. Out of 173 infections (includes post-discharge surveillance). No microorganisms identified for 32 (18.5%) infections. VRE: vancomycin-resistant enterococci; MRSA: methicillin-resistant Staphylococcus aureus; MSSA: methicillin-susceptible Staphylococcus aureus; CephR: cephalosporin-resistant; spp: multiple species
TimeTrendsinCABGChestSSIs To account for the decrease in follow-up from one year to 90 days following CABG procedures as of January 2013, infections that occurred after 90 days were excluded from the 2007-2012 data, shifting the historical mean down by 6%. Between 2007 and 2013, the CABG chest SSI rate decreased 40%, from 2.6 to 1.6 infections per 100 procedures (Figure 3). This resulted in 465 prevented SSIs and a direct cost savings estimated to be between $5.5 million and $16.1 million since 2007.4
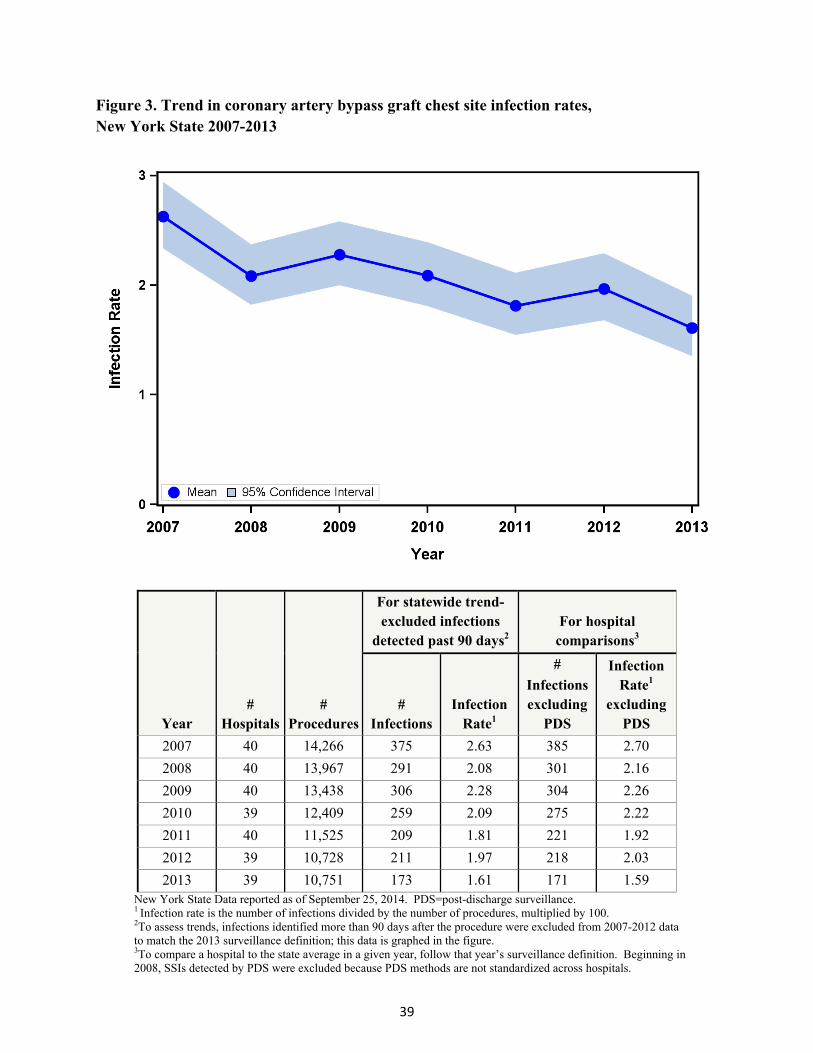
39
Figure 3. Trend in coronary artery bypass graft chest site infection rates, New York State 2007-2013
Year #
Hospitals #
Procedures
For statewide trend- excluded infections
detected past 90 days2 For hospital
comparisons3
# Infections
Infection Rate1
#
Infections excluding
PDS
Infection Rate1
excluding PDS
2007 40 14,266 375 2.63 385 2.70
2008 40 13,967 291 2.08 301 2.16
2009 40 13,438 306 2.28 304 2.26
2010 39 12,409 259 2.09 275 2.22
2011 40 11,525 209 1.81 221 1.92
2012 39 10,728 211 1.97 218 2.03
2013 39 10,751 173 1.61 171 1.59 New York State Data reported as of September 25, 2014. PDS=post-discharge surveillance. 1 Infection rate is the number of infections divided by the number of procedures, multiplied by 100. 2To assess trends, infections identified more than 90 days after the procedure were excluded from 2007-2012 data to match the 2013 surveillance definition; this data is graphed in the figure. 3To compare a hospital to the state average in a given year, follow that year’s surveillance definition. Beginning in 2008, SSIs detected by PDS were excluded because PDS methods are not standardized across hospitals.
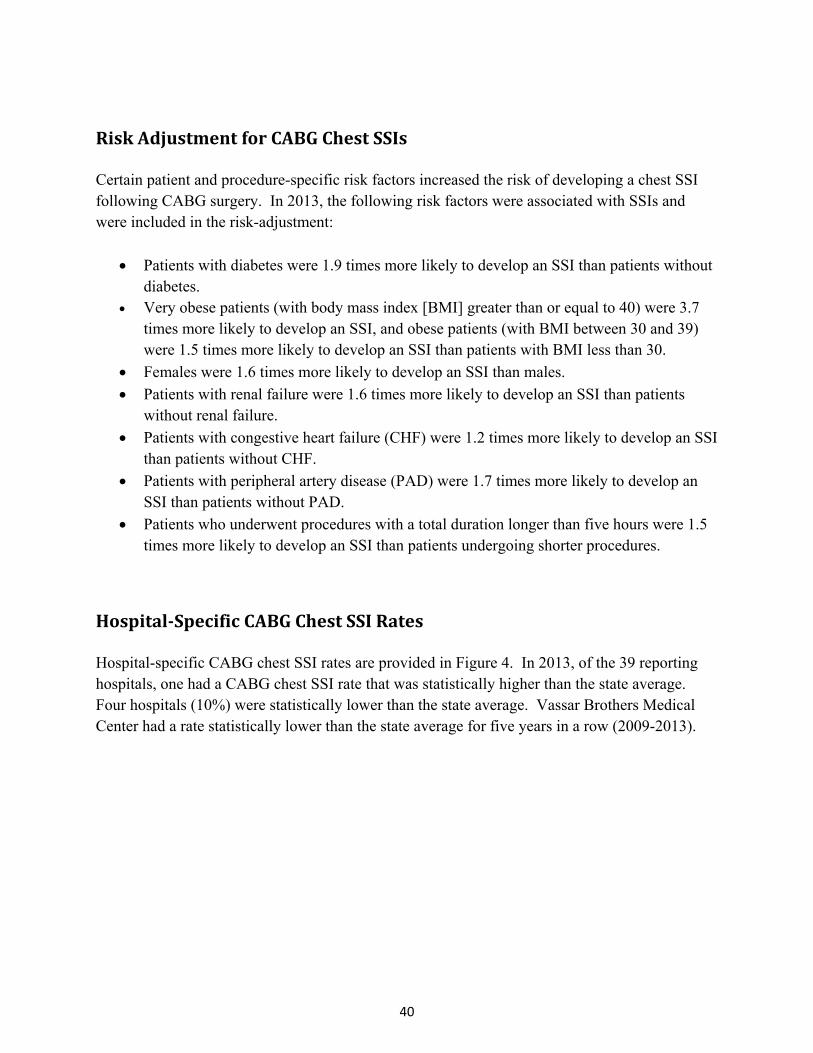
40
RiskAdjustmentforCABGChestSSIs Certain patient and procedure-specific risk factors increased the risk of developing a chest SSI following CABG surgery. In 2013, the following risk factors were associated with SSIs and were included in the risk-adjustment:
Patients with diabetes were 1.9 times more likely to develop an SSI than patients without diabetes.
Very obese patients (with body mass index [BMI] greater than or equal to 40) were 3.7 times more likely to develop an SSI, and obese patients (with BMI between 30 and 39) were 1.5 times more likely to develop an SSI than patients with BMI less than 30.
Females were 1.6 times more likely to develop an SSI than males.
Patients with renal failure were 1.6 times more likely to develop an SSI than patients without renal failure.
Patients with congestive heart failure (CHF) were 1.2 times more likely to develop an SSI than patients without CHF.
Patients with peripheral artery disease (PAD) were 1.7 times more likely to develop an SSI than patients without PAD.
Patients who underwent procedures with a total duration longer than five hours were 1.5 times more likely to develop an SSI than patients undergoing shorter procedures.
Hospital‐SpecificCABGChestSSIRates Hospital-specific CABG chest SSI rates are provided in Figure 4. In 2013, of the 39 reporting hospitals, one had a CABG chest SSI rate that was statistically higher than the state average. Four hospitals (10%) were statistically lower than the state average. Vassar Brothers Medical Center had a rate statistically lower than the state average for five years in a row (2009-2013).
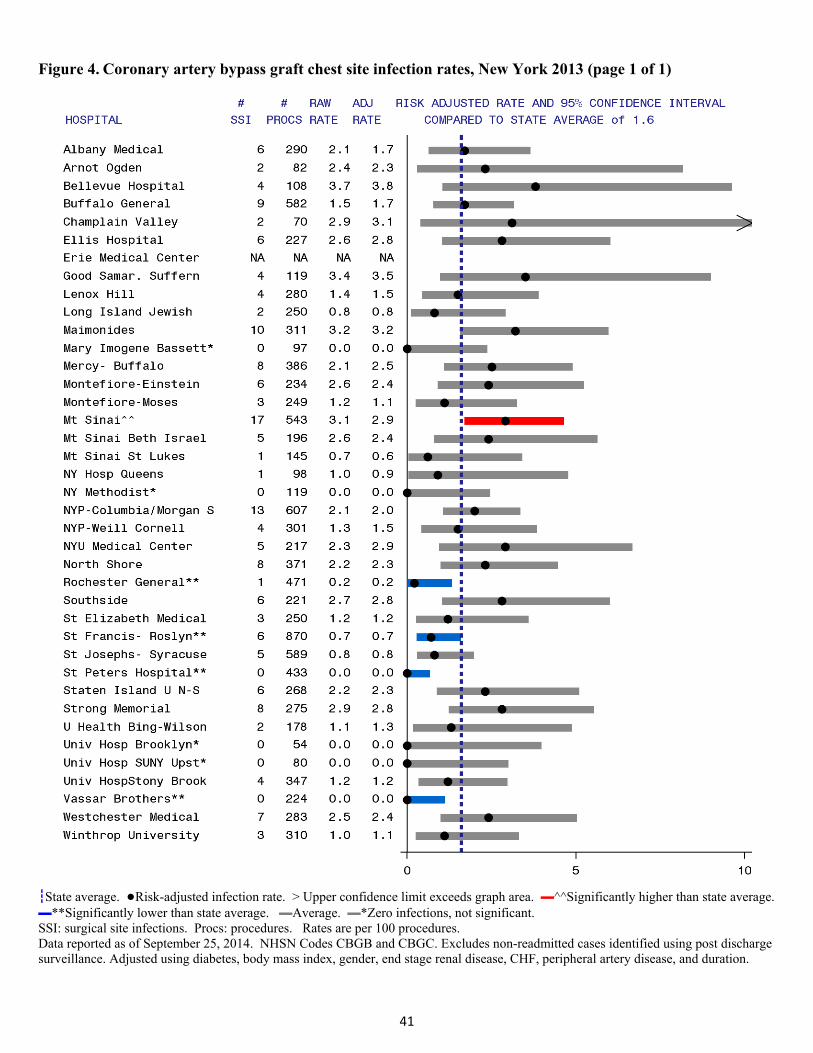
41
Figure 4. Coronary artery bypass graft chest site infection rates, New York 2013 (page 1 of 1)
┇State average. ●Risk-adjusted infection rate. > Upper confidence limit exceeds graph area. ▬^^Significantly higher than state average.▬**Significantly lower than state average. ▬Average. ▬*Zero infections, not significant. SSI: surgical site infections. Procs: procedures. Rates are per 100 procedures. Data reported as of September 25, 2014. NHSN Codes CBGB and CBGC. Excludes non-readmitted cases identified using post discharge surveillance. Adjusted using diabetes, body mass index, gender, end stage renal disease, CHF, peripheral artery disease, and duration.
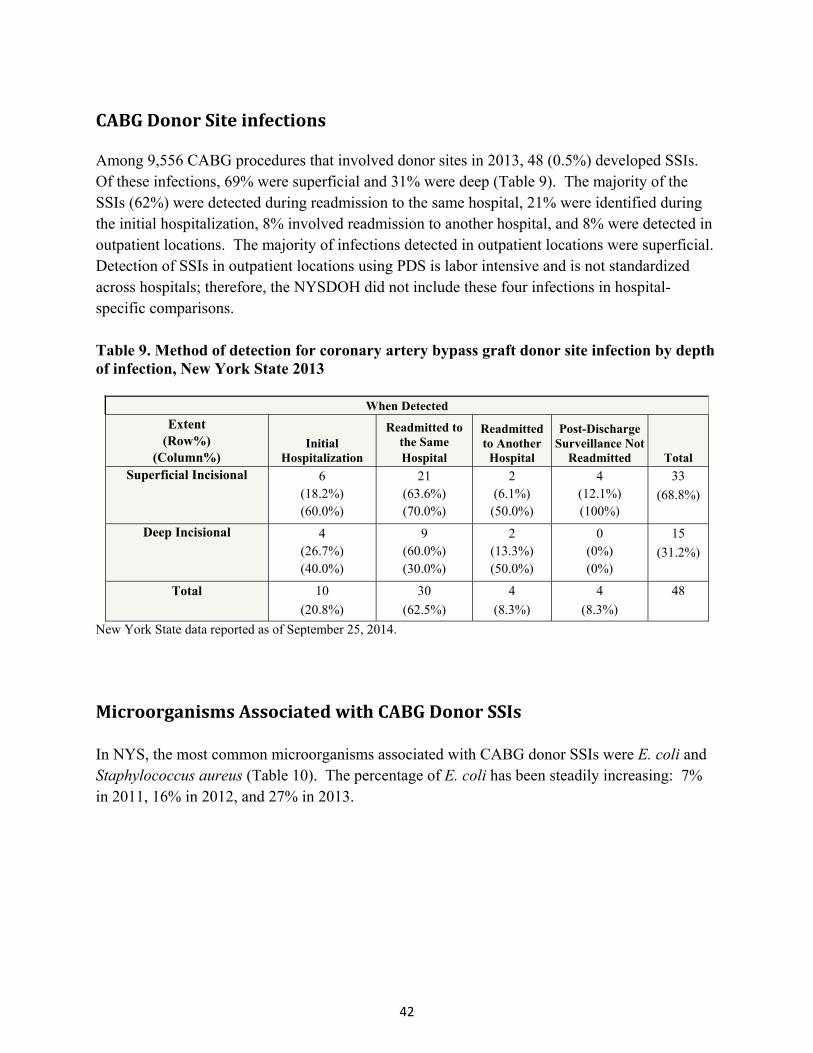
42
CABGDonorSiteinfections Among 9,556 CABG procedures that involved donor sites in 2013, 48 (0.5%) developed SSIs. Of these infections, 69% were superficial and 31% were deep (Table 9). The majority of the SSIs (62%) were detected during readmission to the same hospital, 21% were identified during the initial hospitalization, 8% involved readmission to another hospital, and 8% were detected in outpatient locations. The majority of infections detected in outpatient locations were superficial. Detection of SSIs in outpatient locations using PDS is labor intensive and is not standardized across hospitals; therefore, the NYSDOH did not include these four infections in hospital-specific comparisons. Table 9. Method of detection for coronary artery bypass graft donor site infection by depth of infection, New York State 2013
When Detected
Extent (Row%)
(Column%) Initial
Hospitalization
Readmitted to the Same Hospital
Readmitted to Another
Hospital
Post-Discharge Surveillance Not
Readmitted Total Superficial Incisional 6
(18.2%) (60.0%)
21 (63.6%) (70.0%)
2 (6.1%)
(50.0%)
4 (12.1%) (100%)
33
(68.8%)
Deep Incisional 4 (26.7%) (40.0%)
9 (60.0%) (30.0%)
2 (13.3%) (50.0%)
0 (0%) (0%)
15
(31.2%)
Total 10
(20.8%)
30
(62.5%)
4
(8.3%)
4
(8.3%)
48
New York State data reported as of September 25, 2014.
MicroorganismsAssociatedwithCABGDonorSSIs
In NYS, the most common microorganisms associated with CABG donor SSIs were E. coli and Staphylococcus aureus (Table 10). The percentage of E. coli has been steadily increasing: 7% in 2011, 16% in 2012, and 27% in 2013.
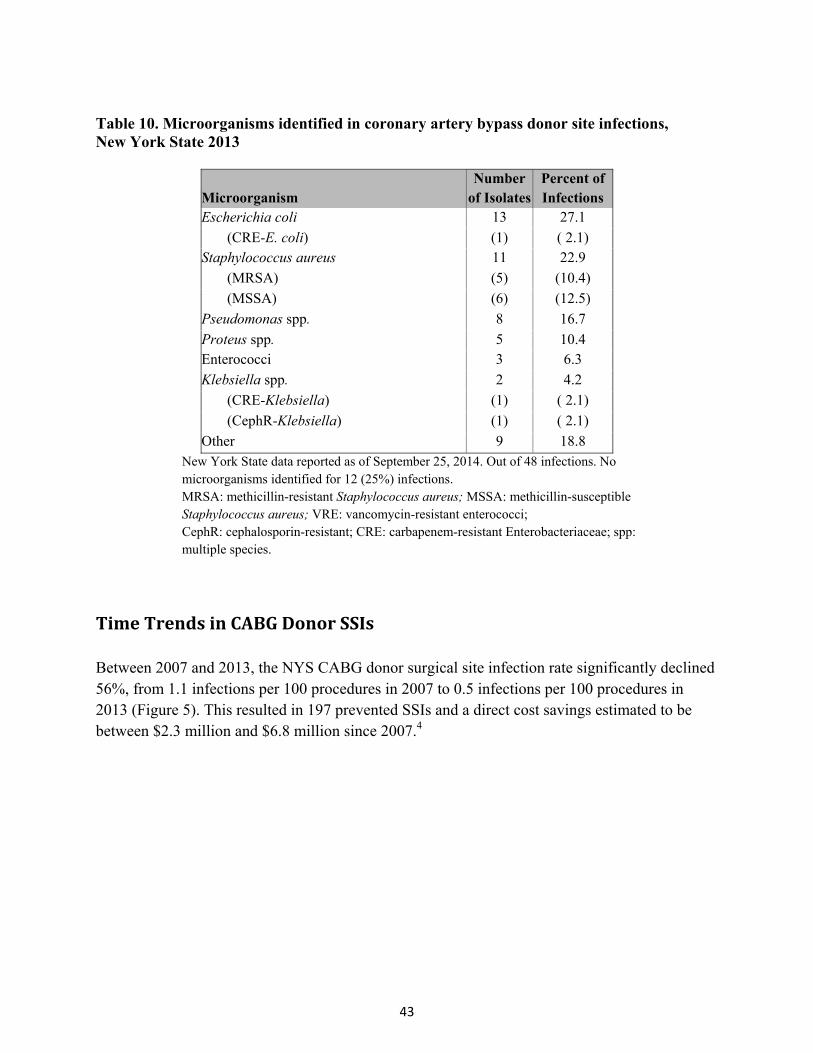
43
Table 10. Microorganisms identified in coronary artery bypass donor site infections, New York State 2013
Microorganism Number
of IsolatesPercent of Infections
Escherichia coli 13 27.1
(CRE-E. coli) (1) ( 2.1) Staphylococcus aureus 11 22.9
(MRSA) (5) (10.4)
(MSSA) (6) (12.5)
Pseudomonas spp. 8 16.7
Proteus spp. 5 10.4 Enterococci 3 6.3
Klebsiella spp. 2 4.2
(CRE-Klebsiella) (1) ( 2.1)
(CephR-Klebsiella) (1) ( 2.1)
Other 9 18.8 New York State data reported as of September 25, 2014. Out of 48 infections. No microorganisms identified for 12 (25%) infections. MRSA: methicillin-resistant Staphylococcus aureus; MSSA: methicillin-susceptible Staphylococcus aureus; VRE: vancomycin-resistant enterococci; CephR: cephalosporin-resistant; CRE: carbapenem-resistant Enterobacteriaceae; spp: multiple species.
TimeTrendsinCABGDonorSSIs Between 2007 and 2013, the NYS CABG donor surgical site infection rate significantly declined 56%, from 1.1 infections per 100 procedures in 2007 to 0.5 infections per 100 procedures in 2013 (Figure 5). This resulted in 197 prevented SSIs and a direct cost savings estimated to be between $2.3 million and $6.8 million since 2007.4
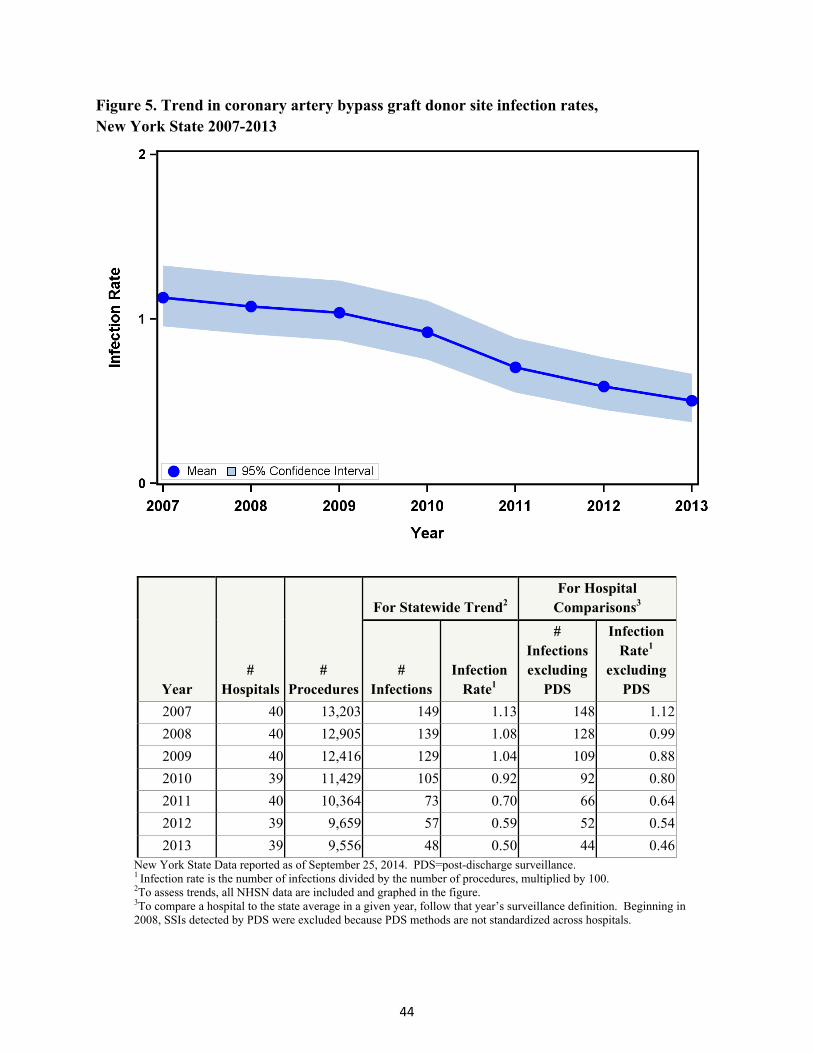
44
Figure 5. Trend in coronary artery bypass graft donor site infection rates, New York State 2007-2013
Year #
Hospitals #
Procedures
For Statewide Trend2 For Hospital
Comparisons3
# Infections
Infection Rate1
# Infections excluding
PDS
Infection Rate1
excluding PDS
2007 40 13,203 149 1.13 148 1.12
2008 40 12,905 139 1.08 128 0.99
2009 40 12,416 129 1.04 109 0.88
2010 39 11,429 105 0.92 92 0.80
2011 40 10,364 73 0.70 66 0.64
2012 39 9,659 57 0.59 52 0.54
2013 39 9,556 48 0.50 44 0.46New York State Data reported as of September 25, 2014. PDS=post-discharge surveillance. 1 Infection rate is the number of infections divided by the number of procedures, multiplied by 100. 2To assess trends, all NHSN data are included and graphed in the figure. 3To compare a hospital to the state average in a given year, follow that year’s surveillance definition. Beginning in 2008, SSIs detected by PDS were excluded because PDS methods are not standardized across hospitals.
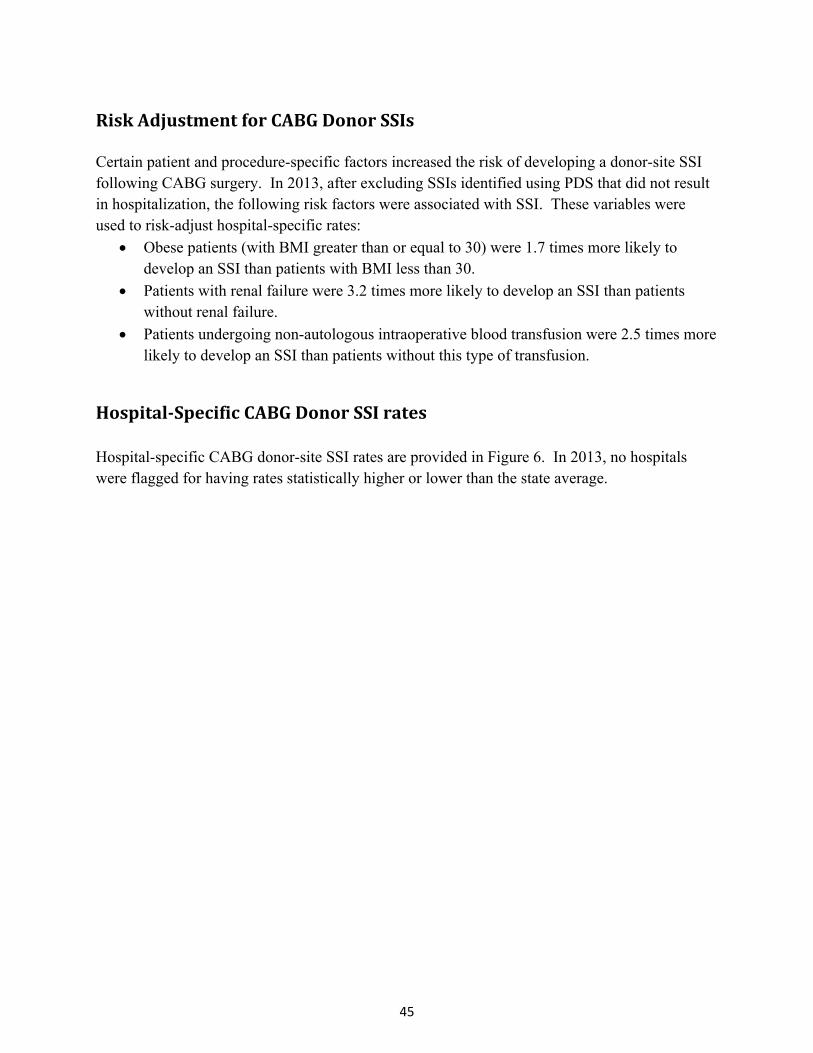
45
RiskAdjustmentforCABGDonorSSIs Certain patient and procedure-specific factors increased the risk of developing a donor-site SSI following CABG surgery. In 2013, after excluding SSIs identified using PDS that did not result in hospitalization, the following risk factors were associated with SSI. These variables were used to risk-adjust hospital-specific rates:
Obese patients (with BMI greater than or equal to 30) were 1.7 times more likely to develop an SSI than patients with BMI less than 30.
Patients with renal failure were 3.2 times more likely to develop an SSI than patients without renal failure.
Patients undergoing non-autologous intraoperative blood transfusion were 2.5 times more likely to develop an SSI than patients without this type of transfusion.
Hospital‐SpecificCABGDonorSSIrates Hospital-specific CABG donor-site SSI rates are provided in Figure 6. In 2013, no hospitals were flagged for having rates statistically higher or lower than the state average.
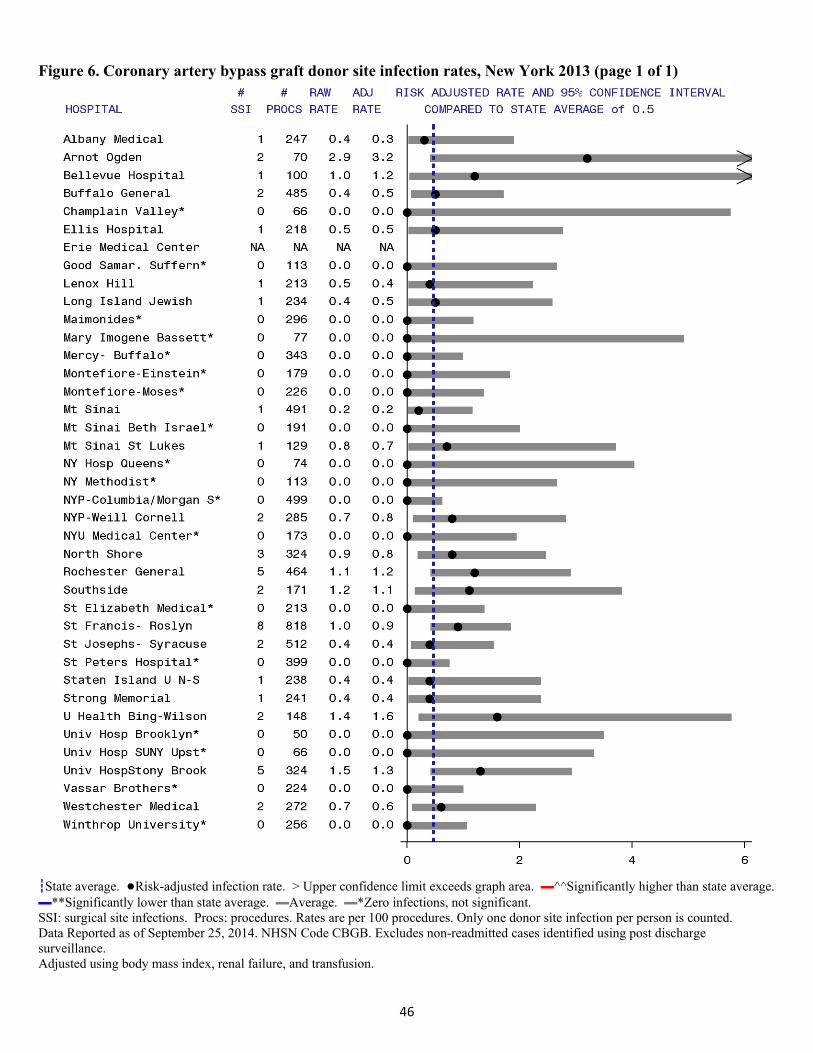
46
Figure 6. Coronary artery bypass graft donor site infection rates, New York 2013 (page 1 of 1)
┇State average. ●Risk-adjusted infection rate. > Upper confidence limit exceeds graph area. ▬^^Significantly higher than state average.▬**Significantly lower than state average. ▬Average. ▬*Zero infections, not significant. SSI: surgical site infections. Procs: procedures. Rates are per 100 procedures. Only one donor site infection per person is counted. Data Reported as of September 25, 2014. NHSN Code CBGB. Excludes non-readmitted cases identified using post discharge surveillance. Adjusted using body mass index, renal failure, and transfusion.

47
HipReplacement/RevisionSurgicalSiteInfections Among 30,415 hip procedures performed in 2013, 289 (0.95%) developed SSIs within 90 days. Of these infections, 30% were superficial, 38% were deep, and 32% were organ/space (Table 11). The majority of the SSIs (77%) were detected upon readmission to the same hospital, 5% were identified during the initial hospitalization, 8% involved readmission to another hospital, and 9% were detected in outpatient settings. Detection of SSIs in outpatient locations is labor intensive and is not standardized across hospitals; therefore, the NYSDOH did not include these 27 infections for hospital-specific comparisons. The detection and depth of hip SSIs is consistent with previous published NYS HAI public reports. In an analysis of 2008-2012 hip procedures by depth of infection, the following characteristics were similar among superficial, deep, and organ/space infections, demonstrating the importance of including superficial infections in SSI rates: post-operative length of stay, reason for readmission, and infectious etiologies.5
Table 11. Method of detection of hip surgical site infection by depth of infection, New York State 2013
When Detected
Extent (Row%)
(Column%) Initial
Hospitalization
Readmitted to the SameHospital
Readmitted to Another
Hospital
Post-Discharge
Surveillance Not
Readmitted TotalSuperficial Incisional 7
(8.0%) (46.7%)
62 (70.5%) (27.8%)
6 (6.8%) (25.0%)
13 (14.8%) (48.1%)
88 (30.4%)
Deep Incisional 5
(4.6%) (33.3%)
84 (77.1%) (37.7%)
8 (7.3%) (33.3%)
12 (11.0%) (44.4%)
109 (37.7%)
Organ/Space 3
(3.3%) (20.0%)
77 (83.7%) (34.5%)
10 (10.9%) (41.7%)
2 (2.2%) (7.4%)
92 (31.8%)
Total 15
(5.2%) 223
(77.2%) 24
(8.3%) 27
(9.3%) 289
New York State data reported as of June 30, 2014.
The most common microorganisms associated with hip SSIs were Staphylococcus aureus, coagulase-negative Staphylococci, Enterococci, and Escherichia coli (Table 12). The distribution of microorganisms associated with hip replacement SSIs is consistent with previous NYS HAI public reports.

48
Table 12. Microorganisms identified in hip replacement surgical site infections, New York State 2013
Microorganism Number
of IsolatesPercent of Infections
Staphylococcus aureus 127 43.9 (MRSA) (51) (17.6) (MSSA) (72) (24.9) Coagulase negative Staphylococci 42 14.5 Enterococci 35 12.1 (VRE) (6) ( 2.1) Escherichia coli (CRE-E. coli)
32 (1)
11.1 (0.3)
Proteus spp. 19 6.6 Pseudomonas spp. 16 5.5 Streptococci 15 5.2 Klebsiella spp. 14 4.8 (CRE-Klebsiella) (2) (0.7) (CephR-Klebsiella) (1) ( 0.3) Enterobacter spp. 8 2.8 Acinetobacter spp. 2 0.7 (MDR-Acinetobacter) (2) ( 0.7) Other 20 6.9
New York State data reported as of June 30, 2014. Out of 289 infections. No microorganisms identified for 38 (13%) infections. VRE: vancomycin-resistant enterococci; CephR: cephalosporin-resistant; CRE: carbapenem-resistant; MDR: multidrug resistant; MRSA: methicillin-resistant Staphylococcus aureus; MSSA: methicillin-susceptible Staphylococcus aureus; spp: multiple species
Timetrends To account for the decrease in follow-up from one year to 90 days following hip procedures as of January 2013, infections that occurred after 90 days were excluded from the 2008-2012 data, shifting the historical mean down by 10%. Between 2008 and 2013, the hip SSI rate decreased 14%, from 1.11 to 0.95 infections per 100 procedures (Figure 7). This resulted in approximately 90 prevented SSIs and a direct cost savings estimated to be between $1 million and $3 million since 2008.4
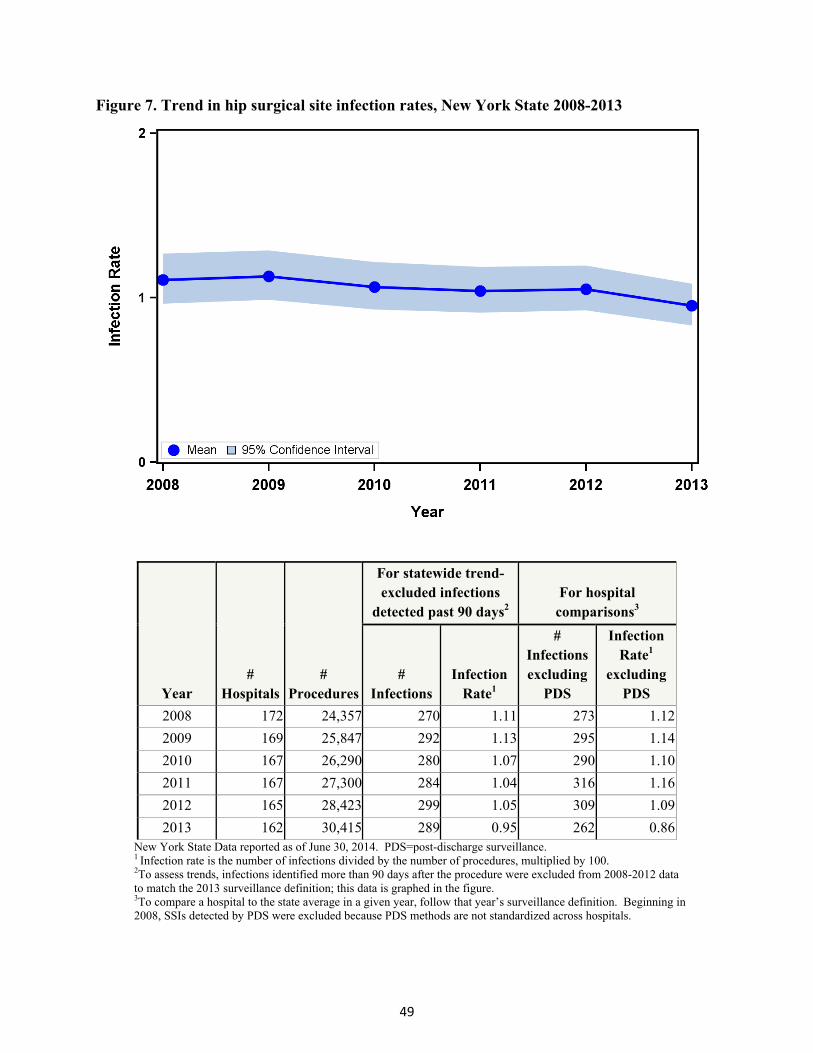
49
Figure 7. Trend in hip surgical site infection rates, New York State 2008-2013
Year #
Hospitals #
Procedures
For statewide trend- excluded infections
detected past 90 days2 For hospital
comparisons3
# Infections
Infection Rate1
# Infections excluding
PDS
Infection Rate1
excluding PDS
2008 172 24,357 270 1.11 273 1.12
2009 169 25,847 292 1.13 295 1.14
2010 167 26,290 280 1.07 290 1.10
2011 167 27,300 284 1.04 316 1.16
2012 165 28,423 299 1.05 309 1.09
2013 162 30,415 289 0.95 262 0.86New York State Data reported as of June 30, 2014. PDS=post-discharge surveillance. 1 Infection rate is the number of infections divided by the number of procedures, multiplied by 100. 2To assess trends, infections identified more than 90 days after the procedure were excluded from 2008-2012 data to match the 2013 surveillance definition; this data is graphed in the figure. 3To compare a hospital to the state average in a given year, follow that year’s surveillance definition. Beginning in 2008, SSIs detected by PDS were excluded because PDS methods are not standardized across hospitals.
50
RiskAdjustmentforHipSurgicalSiteInfections Certain patient and procedure-specific factors increased the risk of developing an SSI following hip surgery. In 2013, after excluding SSIs identified using PDS that did not result in hospitalization, the following risk factors were associated with SSIs. These variables were used to risk-adjust hospital-specific rates.
Patients with an ASA score of 3, 4, or 5 were 2.1 times more likely to develop an SSI than patients with an ASA score of 1 or 2.
The risk of SSI varied by type of hip procedure. Compared to total primary hip replacement procedures, partial revisions were 2.8 times more likely to result in an SSI, and total revisions were 2.4 times more likely to result in an SSI.
Procedures with duration longer than the 75th percentile (by type of hip procedure) were 1.2 times more likely to result in an SSI than procedures of shorter duration.
Procedures that were the result of a broken hip bone/joint or other traumatic injury to the patient were 1.9 times more likely to result in an SSI than elective surgeries.
Hospital‐SpecificHipSSIRates Hospital-specific hip SSI rates are provided in Figure 8. In 2013, six hospitals (4%) had hip SSI rates that were statistically higher than the state average. Two hospitals (1%) had SSI rates that were significantly lower than the state average; Hospital for Special Surgery was significantly lower in all of the past six years (2008-2013).
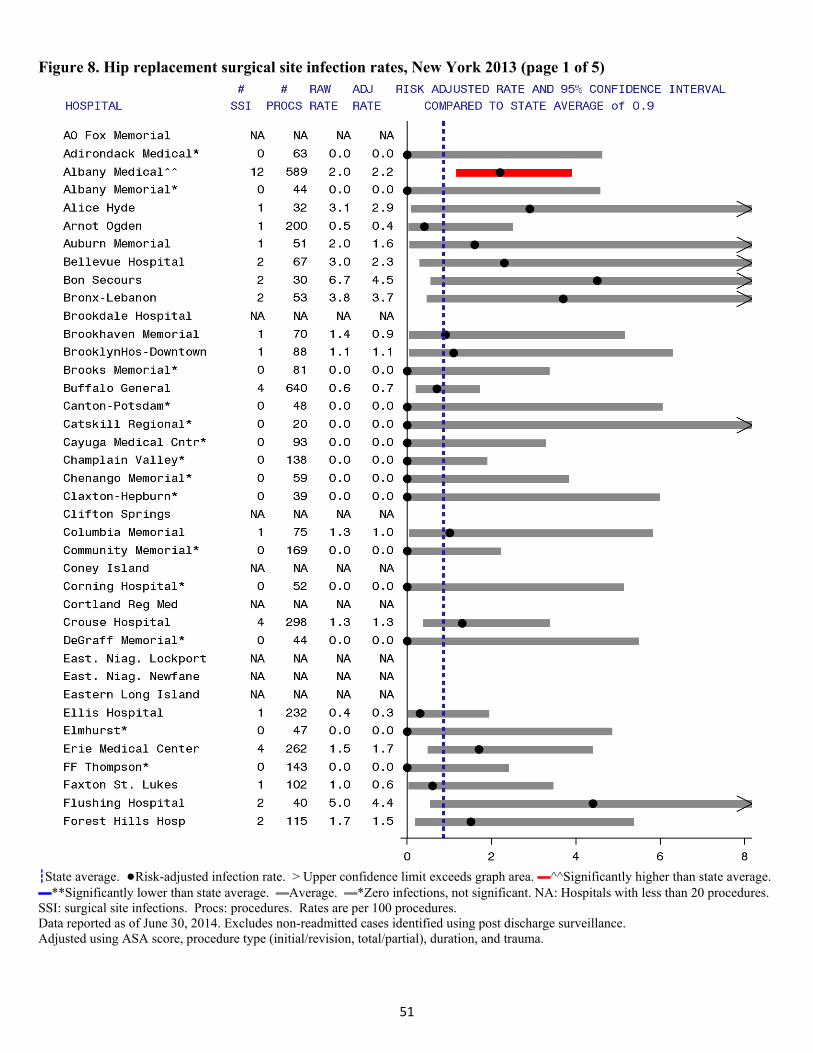
51
Figure 8. Hip replacement surgical site infection rates, New York 2013 (page 1 of 5)
┇State average. ●Risk-adjusted infection rate. > Upper confidence limit exceeds graph area. ▬^^Significantly higher than state average.▬**Significantly lower than state average. ▬Average. ▬*Zero infections, not significant. NA: Hospitals with less than 20 procedures. SSI: surgical site infections. Procs: procedures. Rates are per 100 procedures. Data reported as of June 30, 2014. Excludes non-readmitted cases identified using post discharge surveillance. Adjusted using ASA score, procedure type (initial/revision, total/partial), duration, and trauma.
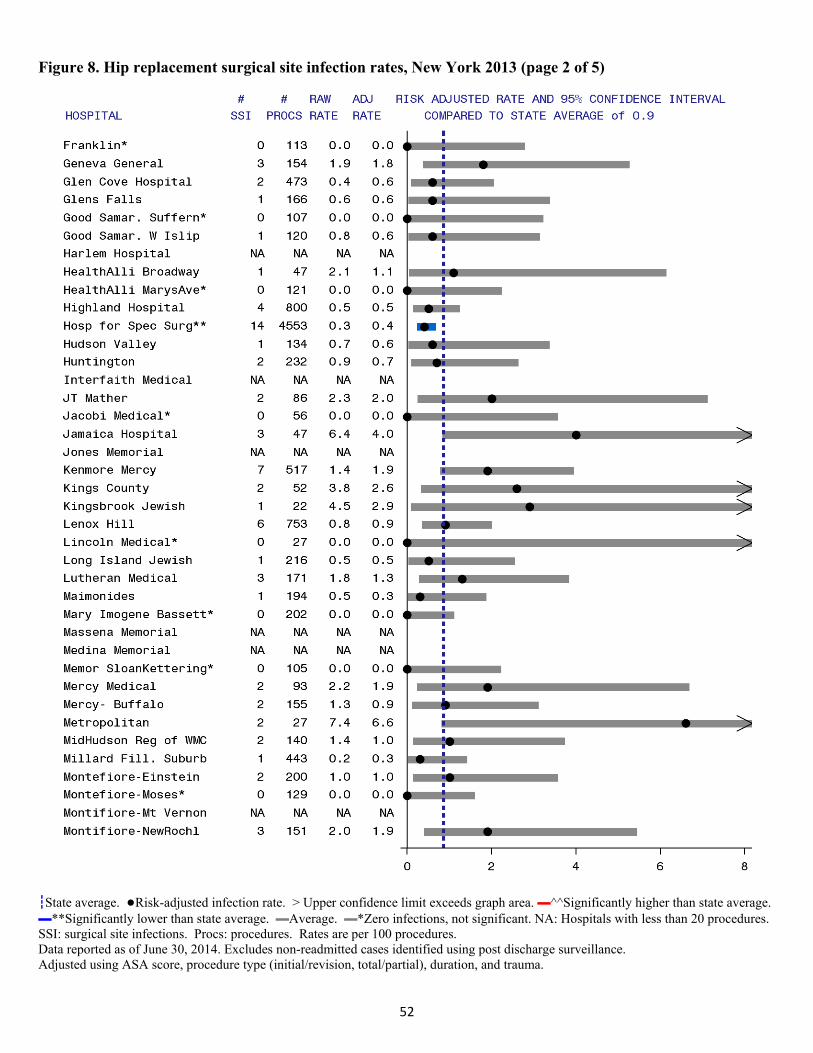
52
Figure 8. Hip replacement surgical site infection rates, New York 2013 (page 2 of 5)
┇State average. ●Risk-adjusted infection rate. > Upper confidence limit exceeds graph area. ▬^^Significantly higher than state average.▬**Significantly lower than state average. ▬Average. ▬*Zero infections, not significant. NA: Hospitals with less than 20 procedures. SSI: surgical site infections. Procs: procedures. Rates are per 100 procedures. Data reported as of June 30, 2014. Excludes non-readmitted cases identified using post discharge surveillance. Adjusted using ASA score, procedure type (initial/revision, total/partial), duration, and trauma.
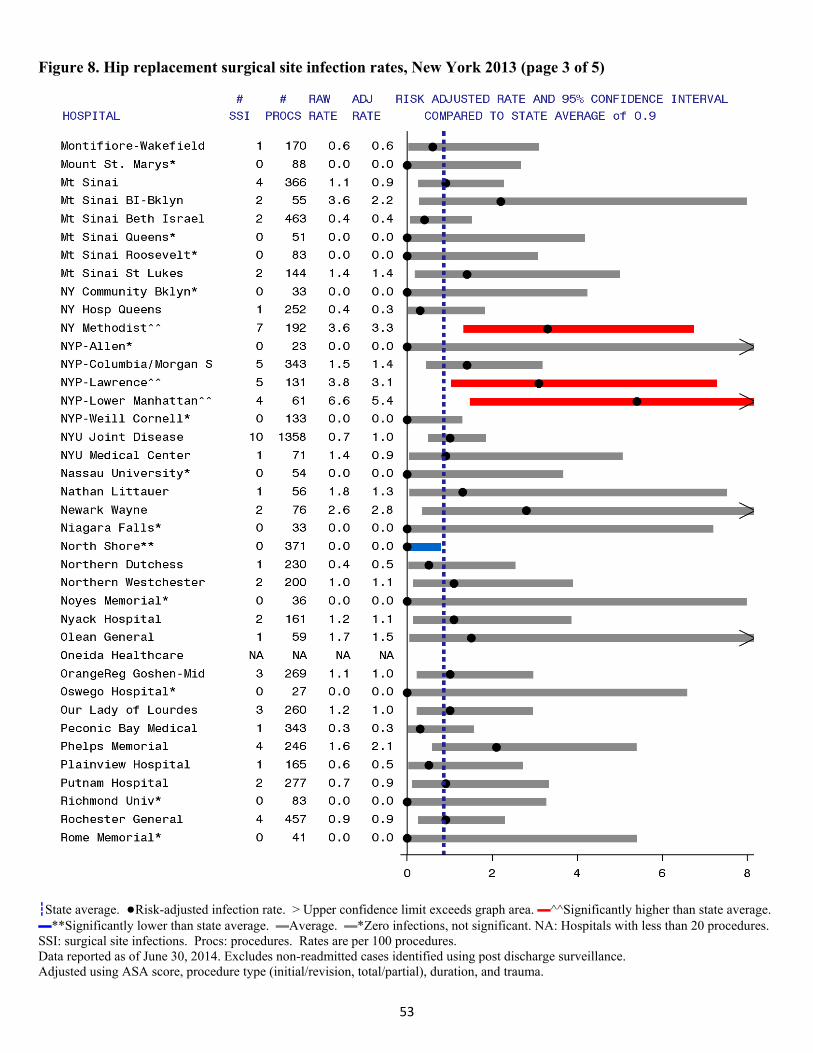
53
Figure 8. Hip replacement surgical site infection rates, New York 2013 (page 3 of 5)
┇State average. ●Risk-adjusted infection rate. > Upper confidence limit exceeds graph area. ▬^^Significantly higher than state average.▬**Significantly lower than state average. ▬Average. ▬*Zero infections, not significant. NA: Hospitals with less than 20 procedures. SSI: surgical site infections. Procs: procedures. Rates are per 100 procedures. Data reported as of June 30, 2014. Excludes non-readmitted cases identified using post discharge surveillance. Adjusted using ASA score, procedure type (initial/revision, total/partial), duration, and trauma.
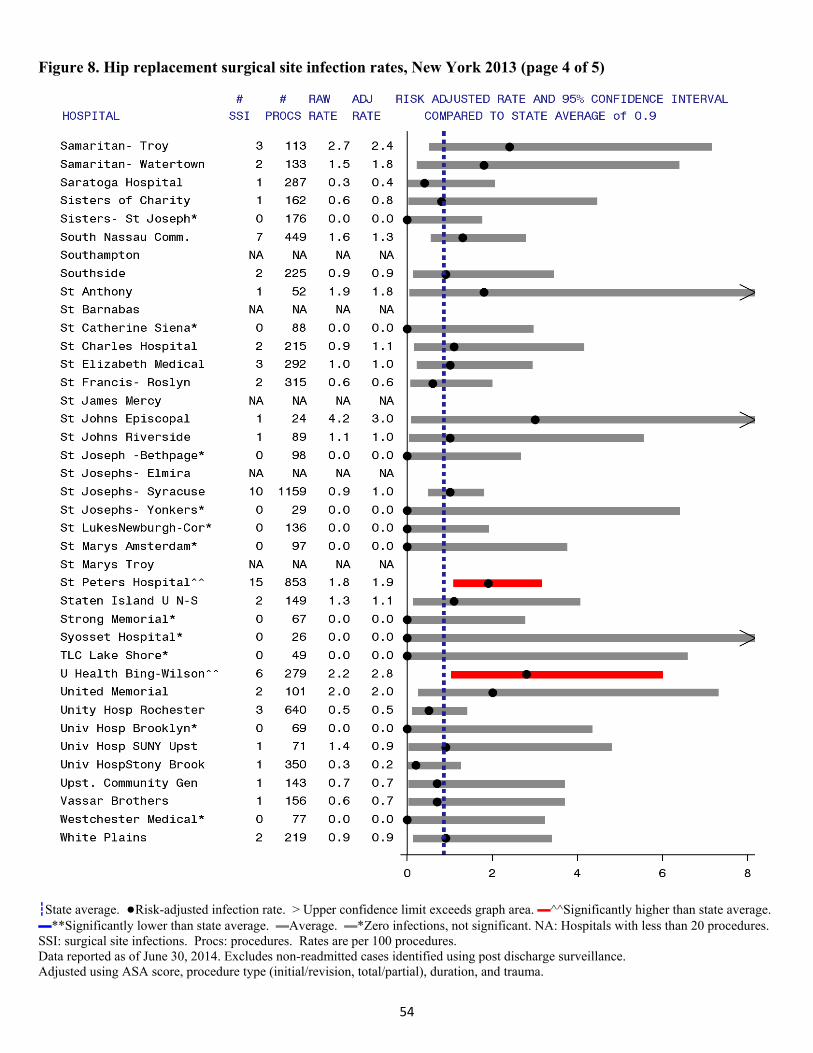
54
Figure 8. Hip replacement surgical site infection rates, New York 2013 (page 4 of 5)
┇State average. ●Risk-adjusted infection rate. > Upper confidence limit exceeds graph area. ▬^^Significantly higher than state average.▬**Significantly lower than state average. ▬Average. ▬*Zero infections, not significant. NA: Hospitals with less than 20 procedures. SSI: surgical site infections. Procs: procedures. Rates are per 100 procedures. Data reported as of June 30, 2014. Excludes non-readmitted cases identified using post discharge surveillance. Adjusted using ASA score, procedure type (initial/revision, total/partial), duration, and trauma.
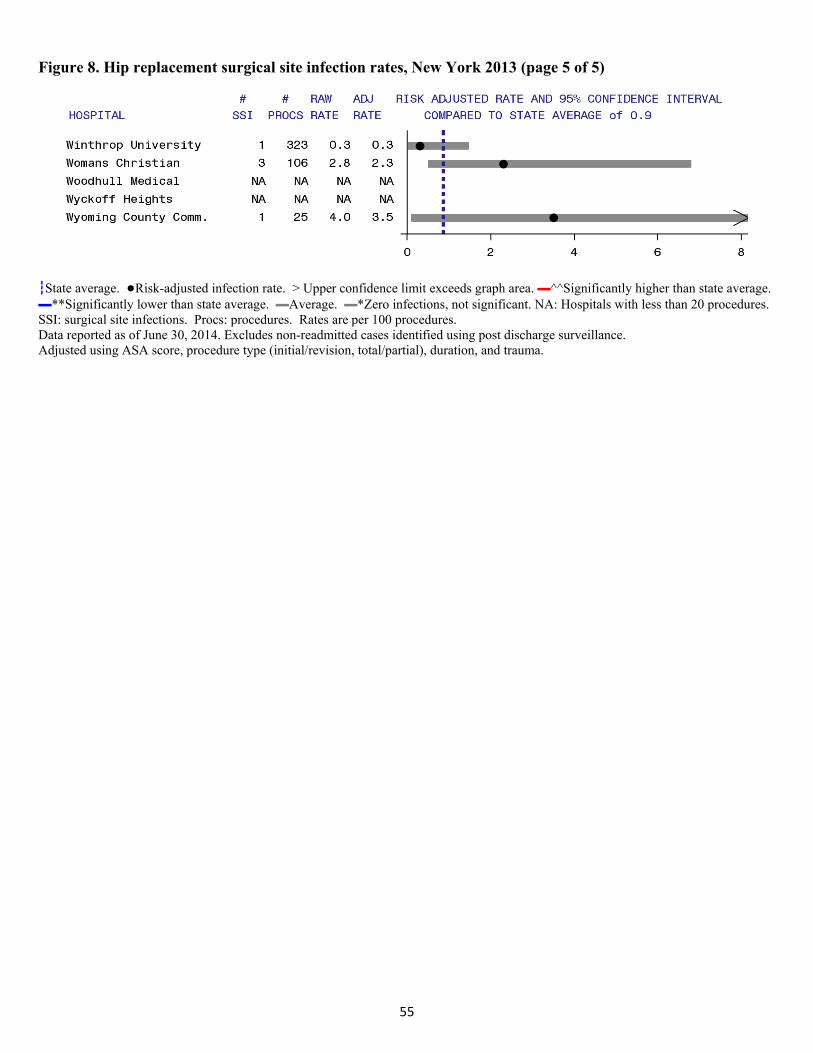
55
Figure 8. Hip replacement surgical site infection rates, New York 2013 (page 5 of 5)
┇State average. ●Risk-adjusted infection rate. > Upper confidence limit exceeds graph area. ▬^^Significantly higher than state average.▬**Significantly lower than state average. ▬Average. ▬*Zero infections, not significant. NA: Hospitals with less than 20 procedures. SSI: surgical site infections. Procs: procedures. Rates are per 100 procedures. Data reported as of June 30, 2014. Excludes non-readmitted cases identified using post discharge surveillance. Adjusted using ASA score, procedure type (initial/revision, total/partial), duration, and trauma.

56
AbdominalHysterectomySurgicalSiteInfections
Among 19,164 abdominal hysterectomy procedures performed in 2013, 377 (2.0%) developed SSIs. Of these infections, 38% were superficial, 19% were deep, and 43% were organ/space (Table 13). Half of the SSIs (55%) were detected upon readmission to the same hospital, 24% were detected in outpatient settings, 14% were identified during the initial hospitalization, and 7% involved readmission to another hospital. The majority of the infections detected in outpatient locations were superficial. Detection of SSIs in outpatient locations is labor intensive and is not standardized across hospitals; therefore, the NYSDOH did not include these 92 infections for hospital-specific comparisons. The detection and depth of hysterectomy SSIs is consistent with the previous NYS HAI public report.
Table 13. Method of detection of hysterectomy surgical site infection by depth of infection, New York State 2013
When Detected
Extent (Row%)
(Column%) Initial
Hospitalization
Readmitted to the Same Hospital
Readmitted to Another
Hospital
Post-Discharge
Surveillance Not
Readmitted Total Superficial Incisional 17
(11.9%) (33.3%)
54 (37.8%) (25.8%)
10 (7.0%) (40.0%)
62 (43.4%) (67.4%)
143
(37.9%)
Deep Incisional 8 (11.0%) (15.7%)
45 (61.6%) (21.5%)
5 (6.8%) (20.0%)
15 (20.5%) (16.3%)
73
(19.4%)
Organ/Space 26 (16.1%) (51.0%)
110 (68.3%) (52.6%)
10 (6.2%) (40.0%)
15 (9.3%)
(16.3%)
161
(42.7%)
Total 51
(13.5%)
209
(55.4%)
25
(6.6%)
92
(24.4%)
377
New York State data reported as of June 30, 2014.
The most common microorganisms associated with hysterectomy SSIs were Staphylococcus aureus, Enterococci, and E. coli (Table 14).

57
Table 14. Microorganisms identified in hysterectomy surgical site infections, New York State 2013
Microorganism Number
of IsolatesPercent of Infections
Staphylococcus aureus 58 15.4 (MRSA) (25) ( 6.6) (MSSA) (30) ( 8.0) Enterococci 52 13.8 (VRE) (4) ( 1.1) Escherichia coli 52 13.8 Streptococci 38 10.1 Bacteroides 24 6.4 Coagulase negative Staphylococci 18 4.8 Pseudomonas spp. 15 4.0 Proteus spp. 13 3.4 Enterobacter spp. 12 3.2 Klebsiella spp. 11 2.9 (CephR Klebsiella) (2) (0.5) Corynebacteria 8 2.1 Citrobacter spp. 7 1.9 Prevotella spp. 6 1.6 Yeast 11 2.7 Other 30 10.4
New York State data reported as of June 30, 2014. Out of 377 infections. No microorganisms identified for 129 (34%) infections. VRE: vancomycin-resistant enterococci; MDRO: multidrug resistant; MRSA: methicillin-resistant Staphylococcus aureus; MSSA: methicillin-susceptible Staphylococcus aureus; CephR: cephalosporin-resistant; spp: multiple species
Timetrends Between 2012 and 2013, the hysterectomy SSI rate decreased by 11% (Figure 9). This decrease far exceeds the small increase expected due to the 2013 hierarchy definition change. In the SPARCS billing data, only 1% of patients had hysterectomy and cesarean section procedures on the same day. Because this proportion is small, and the SSI rate is low, the definition change likely has a very small impact on the hysterectomy rates. Assuming no definitional change, the 11% decrease resulted in 45 prevented SSIs and a direct cost savings estimated to be between $0.5 million and $1.5 million since 2012.4
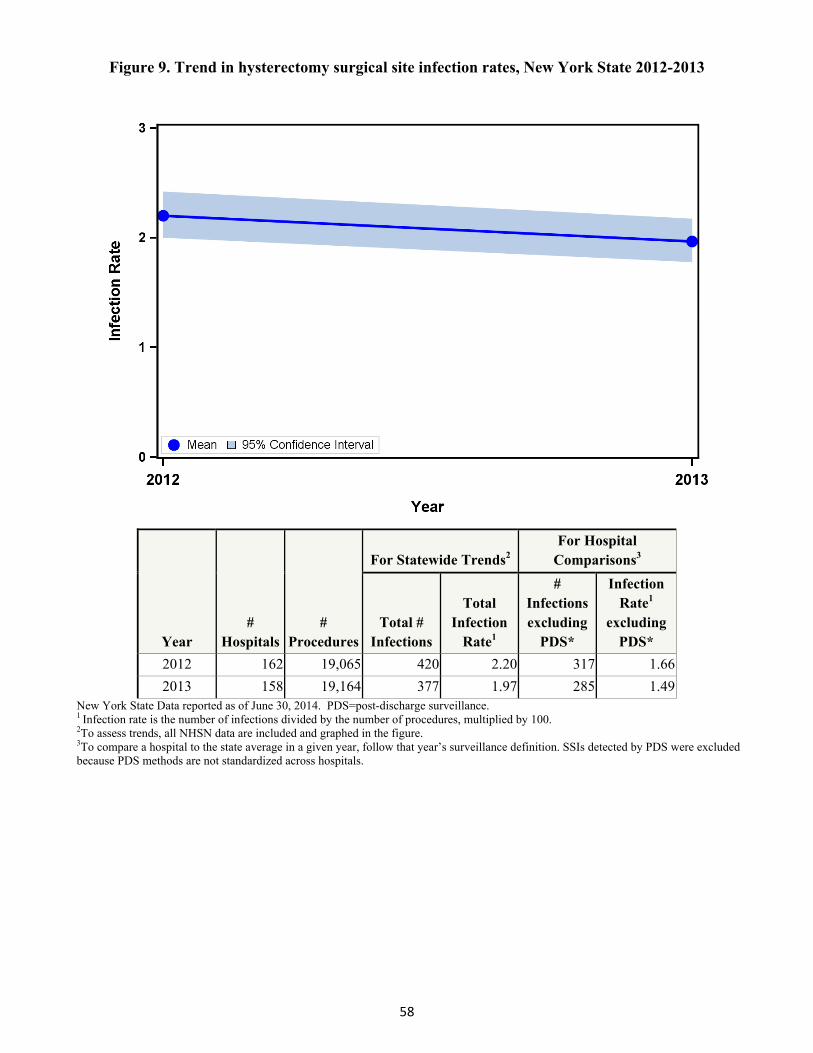
58
Figure 9. Trend in hysterectomy surgical site infection rates, New York State 2012-2013
Year #
Hospitals #
Procedures
For Statewide Trends2 For Hospital
Comparisons3
Total # Infections
Total Infection
Rate1
# Infections excluding
PDS*
Infection Rate1
excluding PDS*
2012 162 19,065 420 2.20 317 1.66
2013 158 19,164 377 1.97 285 1.49New York State Data reported as of June 30, 2014. PDS=post-discharge surveillance. 1 Infection rate is the number of infections divided by the number of procedures, multiplied by 100. 2To assess trends, all NHSN data are included and graphed in the figure. 3To compare a hospital to the state average in a given year, follow that year’s surveillance definition. SSIs detected by PDS were excluded because PDS methods are not standardized across hospitals.
59
RiskAdjustmentforHysterectomySurgicalSiteInfections Certain patient and procedure-specific factors increased the risk of developing an SSI following abdominal hysterectomy. In 2013, after excluding SSIs identified using PDS that did not result in hospitalization, the following risk factors were associated with SSIs. These variables were used to risk-adjust hospital-specific rates.
Patients with an ASA score of 3, 4, or 5 were 2.5 times more likely to develop an SSI than patients with an ASA score of 1 or 2.
Procedures with duration greater than three hours were 2.2 times more likely to result in SSI than procedures less than two hours. Procedures with duration between two and three hours were 1.5 times more like to result in SSI than procedures less than two hours.
Procedures that involved traditional surgical incisions were 1.6 times more likely to result in SSI than procedures performed entirely with a laparoscopic instrument.
Hospital‐SpecificHysterectomySSIRates Hospital-specific hysterectomy SSI rates are provided in Figure 10. In 2013, two hospitals (1%) had hysterectomy SSI rates that were statistically higher than the state average. No hospitals had SSI rates that were significantly lower than the state average.

60
Figure 10. Abdominal hysterectomy surgical site infection rates, New York 2013 (page 1 of 4)
┇State average. ●Risk-adjusted infection rate. > Upper confidence limit exceeds graph area. ▬^^Significantly higher than state average.▬**Significantly lower than state average. ▬Average. ▬*Zero infections, not significant. NA: Hospitals with less than 20 procedures. SSI: surgical site infections. Procs: procedures. Rates are per 100 procedures. Data reported as of June 30, 2014. Excludes non-readmitted cases identified using post discharge surveillance. Adjusted using ASA score, duration, and endoscope.
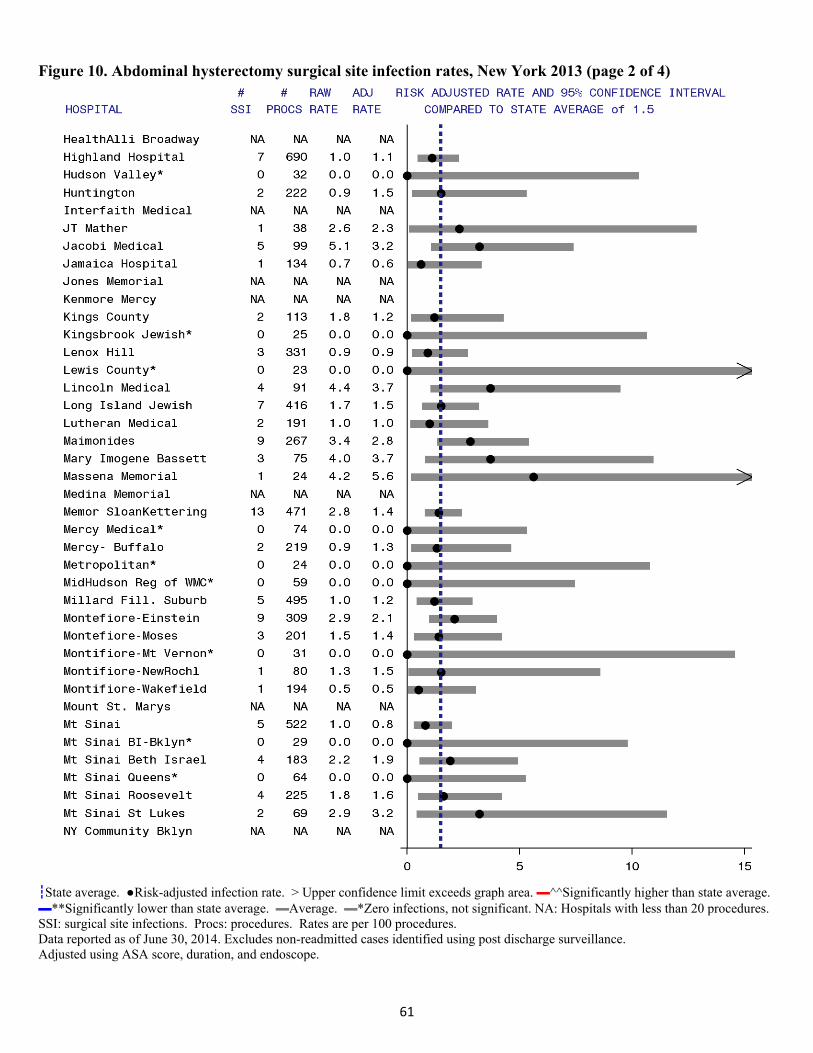
61
Figure 10. Abdominal hysterectomy surgical site infection rates, New York 2013 (page 2 of 4)
┇State average. ●Risk-adjusted infection rate. > Upper confidence limit exceeds graph area. ▬^^Significantly higher than state average.▬**Significantly lower than state average. ▬Average. ▬*Zero infections, not significant. NA: Hospitals with less than 20 procedures. SSI: surgical site infections. Procs: procedures. Rates are per 100 procedures. Data reported as of June 30, 2014. Excludes non-readmitted cases identified using post discharge surveillance. Adjusted using ASA score, duration, and endoscope.
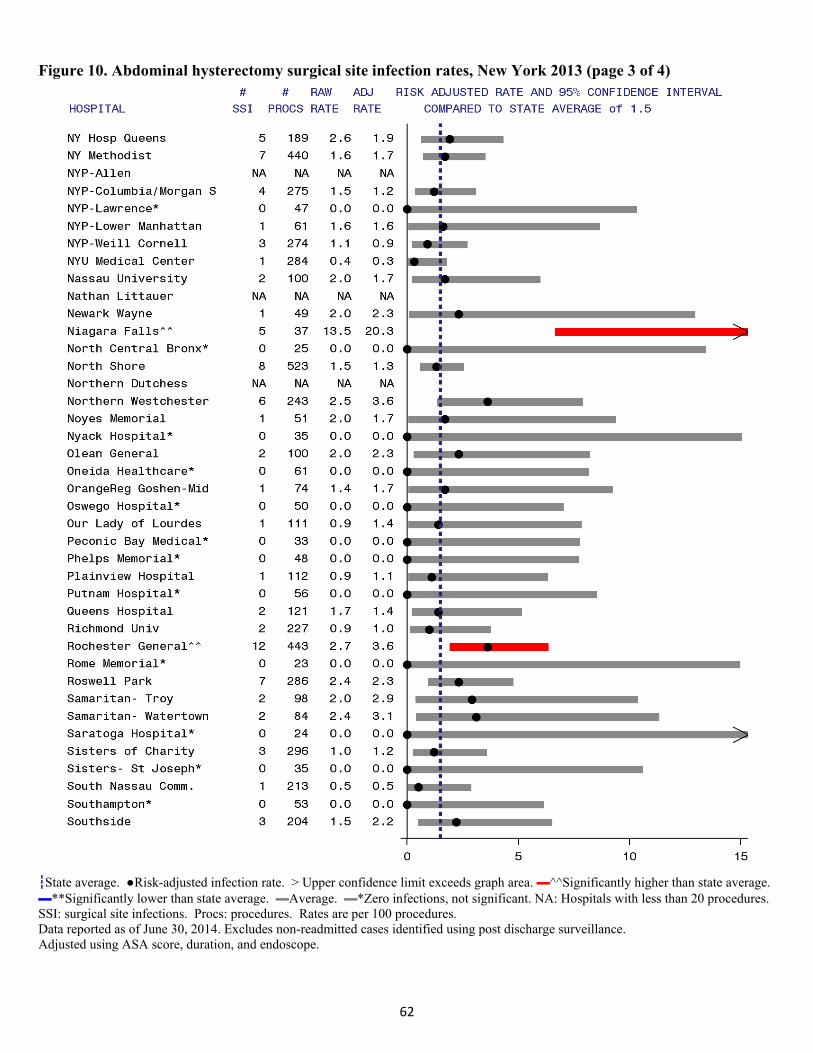
62
Figure 10. Abdominal hysterectomy surgical site infection rates, New York 2013 (page 3 of 4)
┇State average. ●Risk-adjusted infection rate. > Upper confidence limit exceeds graph area. ▬^^Significantly higher than state average.▬**Significantly lower than state average. ▬Average. ▬*Zero infections, not significant. NA: Hospitals with less than 20 procedures. SSI: surgical site infections. Procs: procedures. Rates are per 100 procedures. Data reported as of June 30, 2014. Excludes non-readmitted cases identified using post discharge surveillance. Adjusted using ASA score, duration, and endoscope.
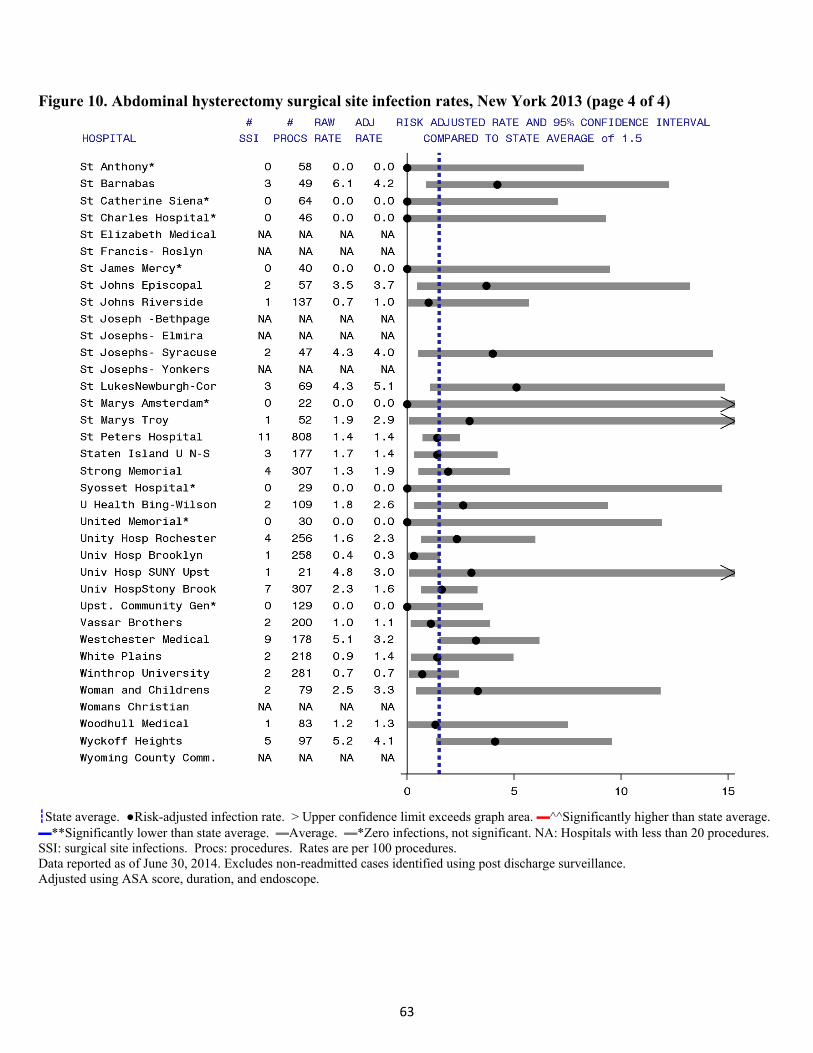
63
Figure 10. Abdominal hysterectomy surgical site infection rates, New York 2013 (page 4 of 4)
┇State average. ●Risk-adjusted infection rate. > Upper confidence limit exceeds graph area. ▬^^Significantly higher than state average.▬**Significantly lower than state average. ▬Average. ▬*Zero infections, not significant. NA: Hospitals with less than 20 procedures. SSI: surgical site infections. Procs: procedures. Rates are per 100 procedures. Data reported as of June 30, 2014. Excludes non-readmitted cases identified using post discharge surveillance. Adjusted using ASA score, duration, and endoscope.
64
SummaryacrossSSIs
The standardized infection ratio (SIR) is a summary measure used to compare infection data from one population to data from a “standard” population. When calculating hospital-specific SIRs in NYS reports, the standard population is all NYS hospitals reporting data to NHSN in the current year. The SSI SIR is calculated by dividing the observed number of infections in the hospital by the statistically predicted number of infections, which is calculated using the risk adjustment models described for each type of SSI.
A SIR of 1.0 means the observed number of infections is equal to the number of predicted infections.
A SIR above 1.0 means that the infection rate is higher than that found in the standard population. The difference above 1.0 is the percentage by which the infection rate exceeds that of the standard population.
A SIR below 1.0 means that the infection rate is lower than that of the standard population. The difference below 1.0 is the percentage by which the infection rate is lower than that experienced by the standard population.
Figure 11 provides hospital-specific SSI SIRs for each hospital. The SSI SIRs combine results across the five different types of SSIs, showing the average performance of each hospital. In two cases, hospitals that received no individual area performance flag were significantly higher or lower than the state average overall; combining data results in narrower confidence intervals, so hospitals that perform slightly better in many areas may look significantly better than the state average overall. On the other hand, fifteen hospitals (9%) that received a performance flag for one type of procedure had average SIRs; combining data can smooth away unusual performance in one area. Between 2013 and the NYS baseline years, there has been a 23% decrease in hip, hysterectomy, and CABG SSIs, resulting in approximately 800 prevented infections with a total savings of between $9.5 and $27.7 million. Colon SSIs were excluded from this total because of the definition change.
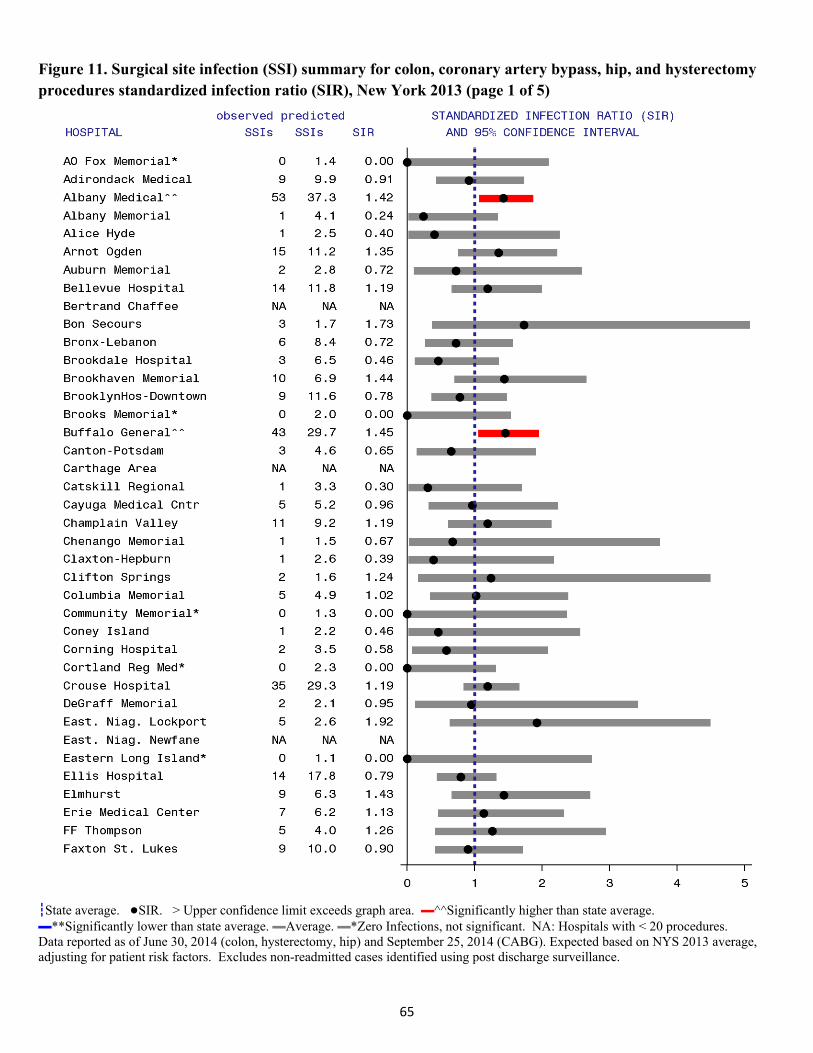
65
Figure 11. Surgical site infection (SSI) summary for colon, coronary artery bypass, hip, and hysterectomy procedures standardized infection ratio (SIR), New York 2013 (page 1 of 5)
┇State average. ●SIR. > Upper confidence limit exceeds graph area. ▬^^Significantly higher than state average. ▬**Significantly lower than state average. ▬Average. ▬*Zero Infections, not significant. NA: Hospitals with < 20 procedures. Data reported as of June 30, 2014 (colon, hysterectomy, hip) and September 25, 2014 (CABG). Expected based on NYS 2013 average, adjusting for patient risk factors. Excludes non-readmitted cases identified using post discharge surveillance.
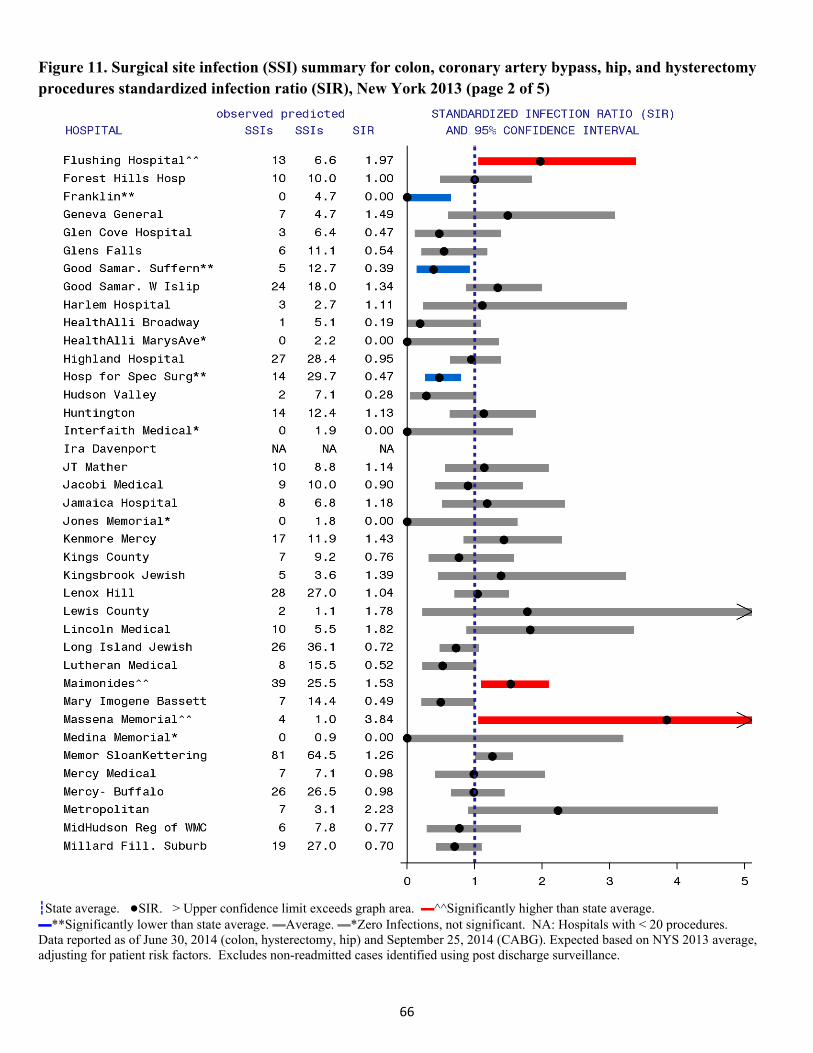
66
Figure 11. Surgical site infection (SSI) summary for colon, coronary artery bypass, hip, and hysterectomy procedures standardized infection ratio (SIR), New York 2013 (page 2 of 5)
┇State average. ●SIR. > Upper confidence limit exceeds graph area. ▬^^Significantly higher than state average. ▬**Significantly lower than state average. ▬Average. ▬*Zero Infections, not significant. NA: Hospitals with < 20 procedures. Data reported as of June 30, 2014 (colon, hysterectomy, hip) and September 25, 2014 (CABG). Expected based on NYS 2013 average, adjusting for patient risk factors. Excludes non-readmitted cases identified using post discharge surveillance.
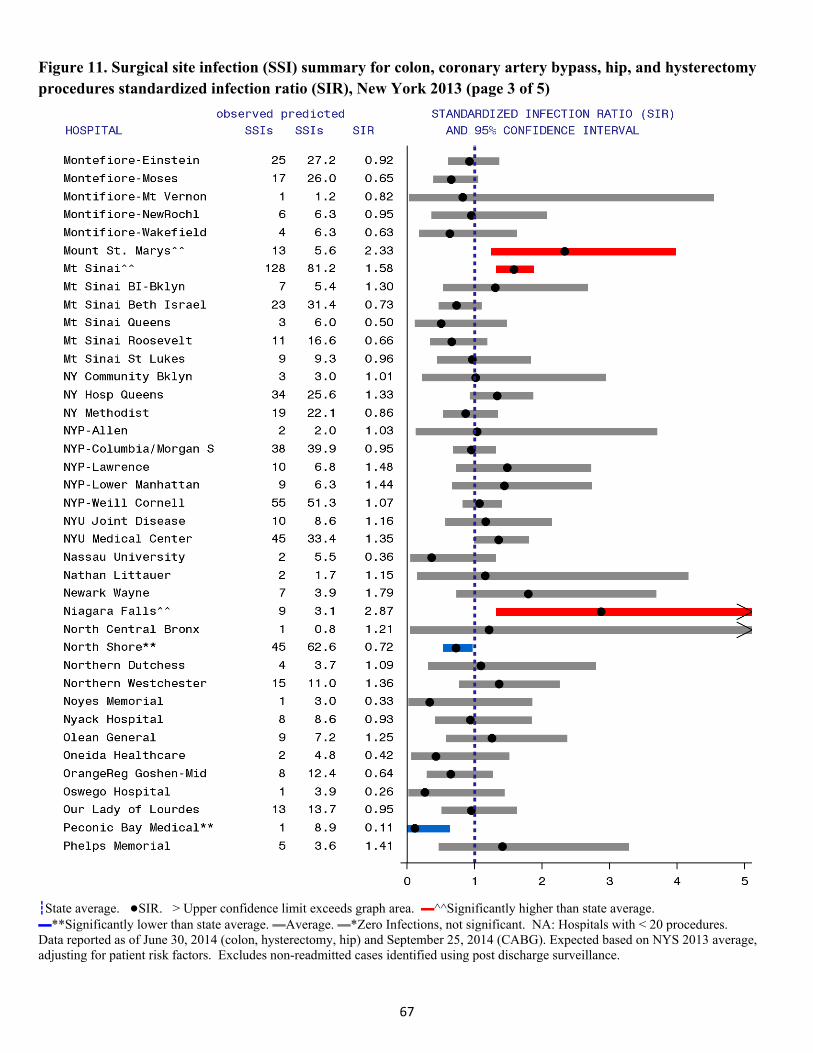
67
Figure 11. Surgical site infection (SSI) summary for colon, coronary artery bypass, hip, and hysterectomy procedures standardized infection ratio (SIR), New York 2013 (page 3 of 5)
┇State average. ●SIR. > Upper confidence limit exceeds graph area. ▬^^Significantly higher than state average. ▬**Significantly lower than state average. ▬Average. ▬*Zero Infections, not significant. NA: Hospitals with < 20 procedures. Data reported as of June 30, 2014 (colon, hysterectomy, hip) and September 25, 2014 (CABG). Expected based on NYS 2013 average, adjusting for patient risk factors. Excludes non-readmitted cases identified using post discharge surveillance.
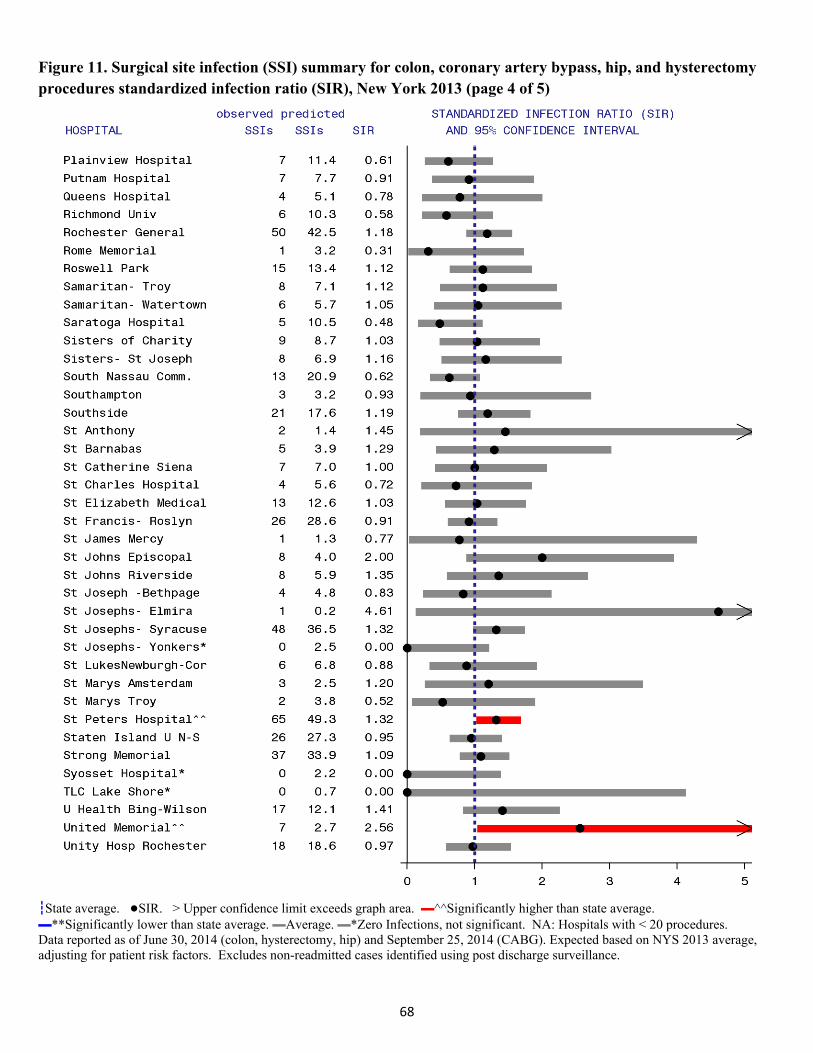
68
Figure 11. Surgical site infection (SSI) summary for colon, coronary artery bypass, hip, and hysterectomy procedures standardized infection ratio (SIR), New York 2013 (page 4 of 5)
┇State average. ●SIR. > Upper confidence limit exceeds graph area. ▬^^Significantly higher than state average. ▬**Significantly lower than state average. ▬Average. ▬*Zero Infections, not significant. NA: Hospitals with < 20 procedures. Data reported as of June 30, 2014 (colon, hysterectomy, hip) and September 25, 2014 (CABG). Expected based on NYS 2013 average, adjusting for patient risk factors. Excludes non-readmitted cases identified using post discharge surveillance.

69
Figure 11. Surgical site infection (SSI) summary for colon, coronary artery bypass, hip, and hysterectomy procedures standardized infection ratio (SIR), New York 2013 (page 5 of 5)
┇State average. ●SIR. > Upper confidence limit exceeds graph area. ▬^^Significantly higher than state average. ▬**Significantly lower than state average. ▬Average. ▬*Zero Infections, not significant. NA: Hospitals with < 20 procedures. Data reported as of June 30, 2014 (colon, hysterectomy, hip) and September 25, 2014 (CABG). Expected based on NYS 2013 average, adjusting for patient risk factors. Excludes non-readmitted cases identified using post discharge surveillance.
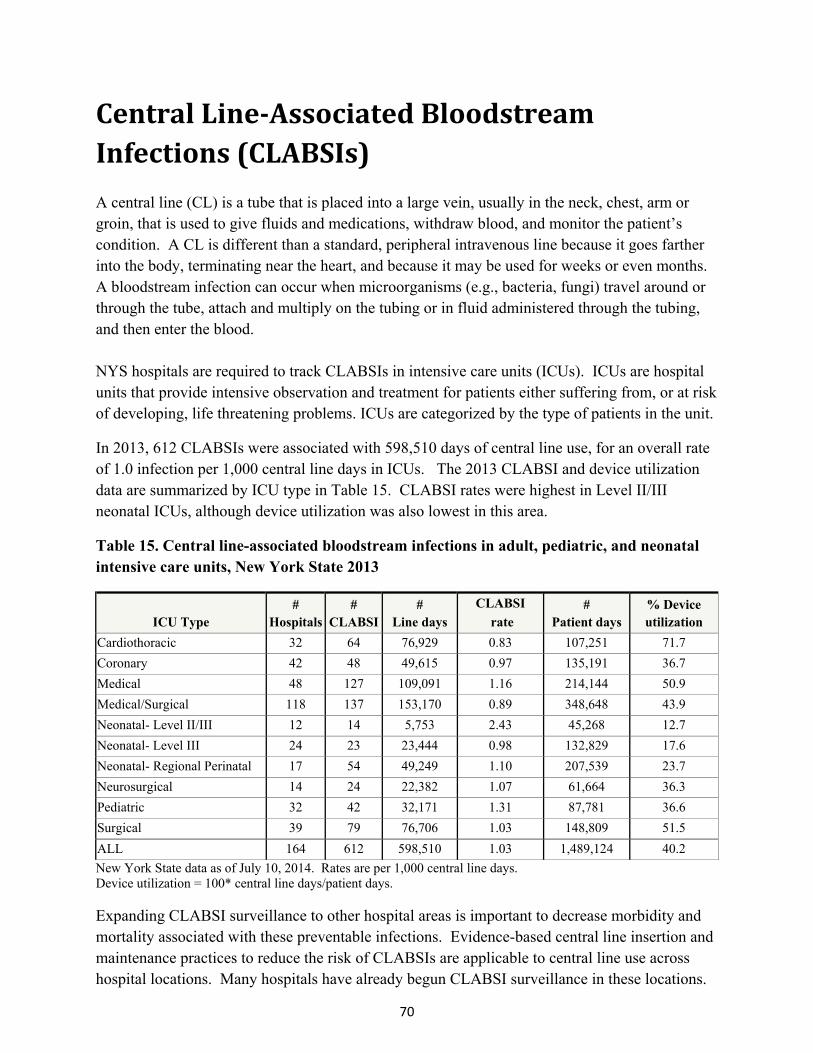
70
CentralLine‐AssociatedBloodstreamInfections(CLABSIs) A central line (CL) is a tube that is placed into a large vein, usually in the neck, chest, arm or groin, that is used to give fluids and medications, withdraw blood, and monitor the patient’s condition. A CL is different than a standard, peripheral intravenous line because it goes farther into the body, terminating near the heart, and because it may be used for weeks or even months. A bloodstream infection can occur when microorganisms (e.g., bacteria, fungi) travel around or through the tube, attach and multiply on the tubing or in fluid administered through the tubing, and then enter the blood. NYS hospitals are required to track CLABSIs in intensive care units (ICUs). ICUs are hospital units that provide intensive observation and treatment for patients either suffering from, or at risk of developing, life threatening problems. ICUs are categorized by the type of patients in the unit.
In 2013, 612 CLABSIs were associated with 598,510 days of central line use, for an overall rate of 1.0 infection per 1,000 central line days in ICUs. The 2013 CLABSI and device utilization data are summarized by ICU type in Table 15. CLABSI rates were highest in Level II/III neonatal ICUs, although device utilization was also lowest in this area.
Table 15. Central line-associated bloodstream infections in adult, pediatric, and neonatal intensive care units, New York State 2013
ICU Type #
Hospitals #
CLABSI#
Line days
CLABSI
rate #
Patient days % Device utilization
Cardiothoracic 32 64 76,929 0.83 107,251 71.7
Coronary 42 48 49,615 0.97 135,191 36.7
Medical 48 127 109,091 1.16 214,144 50.9
Medical/Surgical 118 137 153,170 0.89 348,648 43.9
Neonatal- Level II/III 12 14 5,753 2.43 45,268 12.7
Neonatal- Level III 24 23 23,444 0.98 132,829 17.6
Neonatal- Regional Perinatal 17 54 49,249 1.10 207,539 23.7
Neurosurgical 14 24 22,382 1.07 61,664 36.3
Pediatric 32 42 32,171 1.31 87,781 36.6
Surgical 39 79 76,706 1.03 148,809 51.5
ALL 164 612 598,510 1.03 1,489,124 40.2
New York State data as of July 10, 2014. Rates are per 1,000 central line days. Device utilization = 100* central line days/patient days. Expanding CLABSI surveillance to other hospital areas is important to decrease morbidity and mortality associated with these preventable infections. Evidence-based central line insertion and maintenance practices to reduce the risk of CLABSIs are applicable to central line use across hospital locations. Many hospitals have already begun CLABSI surveillance in these locations.
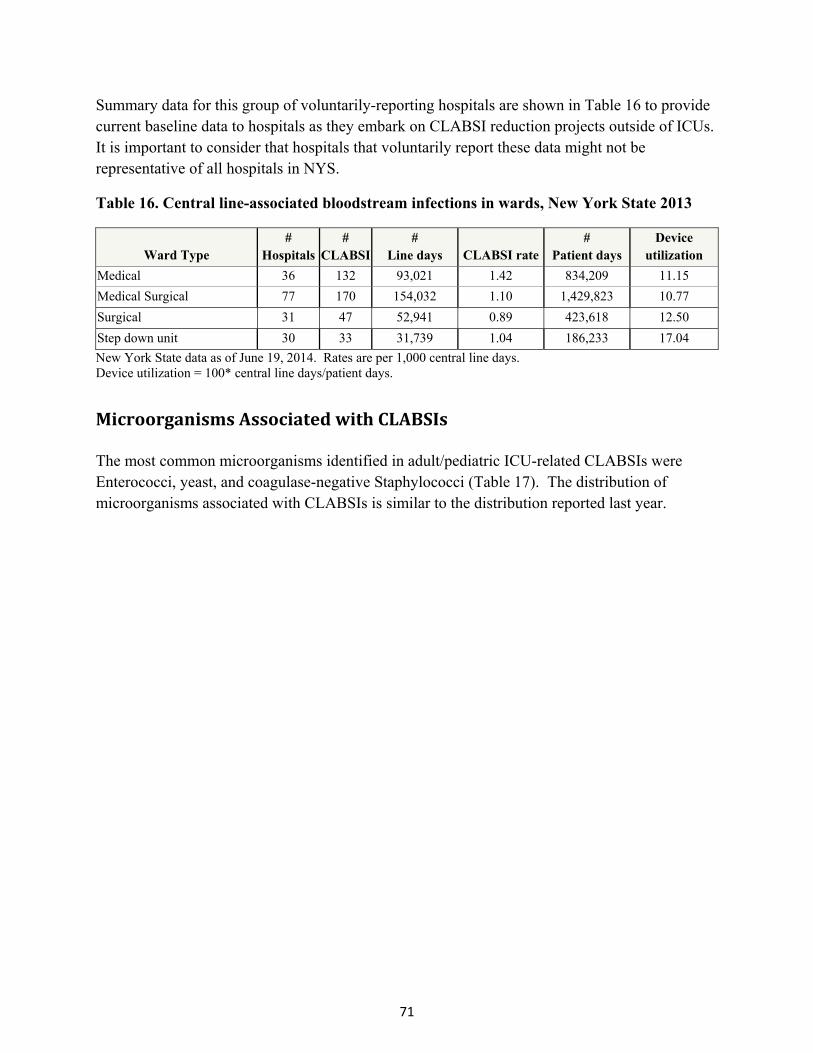
71
Summary data for this group of voluntarily-reporting hospitals are shown in Table 16 to provide current baseline data to hospitals as they embark on CLABSI reduction projects outside of ICUs. It is important to consider that hospitals that voluntarily report these data might not be representative of all hospitals in NYS.
Table 16. Central line-associated bloodstream infections in wards, New York State 2013
Ward Type #
Hospitals #
CLABSI#
Line days CLABSI rate#
Patient days Device
utilization
Medical 36 132 93,021 1.42 834,209 11.15
Medical Surgical 77 170 154,032 1.10 1,429,823 10.77
Surgical 31 47 52,941 0.89 423,618 12.50
Step down unit 30 33 31,739 1.04 186,233 17.04
New York State data as of June 19, 2014. Rates are per 1,000 central line days. Device utilization = 100* central line days/patient days.
MicroorganismsAssociatedwithCLABSIs The most common microorganisms identified in adult/pediatric ICU-related CLABSIs were Enterococci, yeast, and coagulase-negative Staphylococci (Table 17). The distribution of microorganisms associated with CLABSIs is similar to the distribution reported last year.
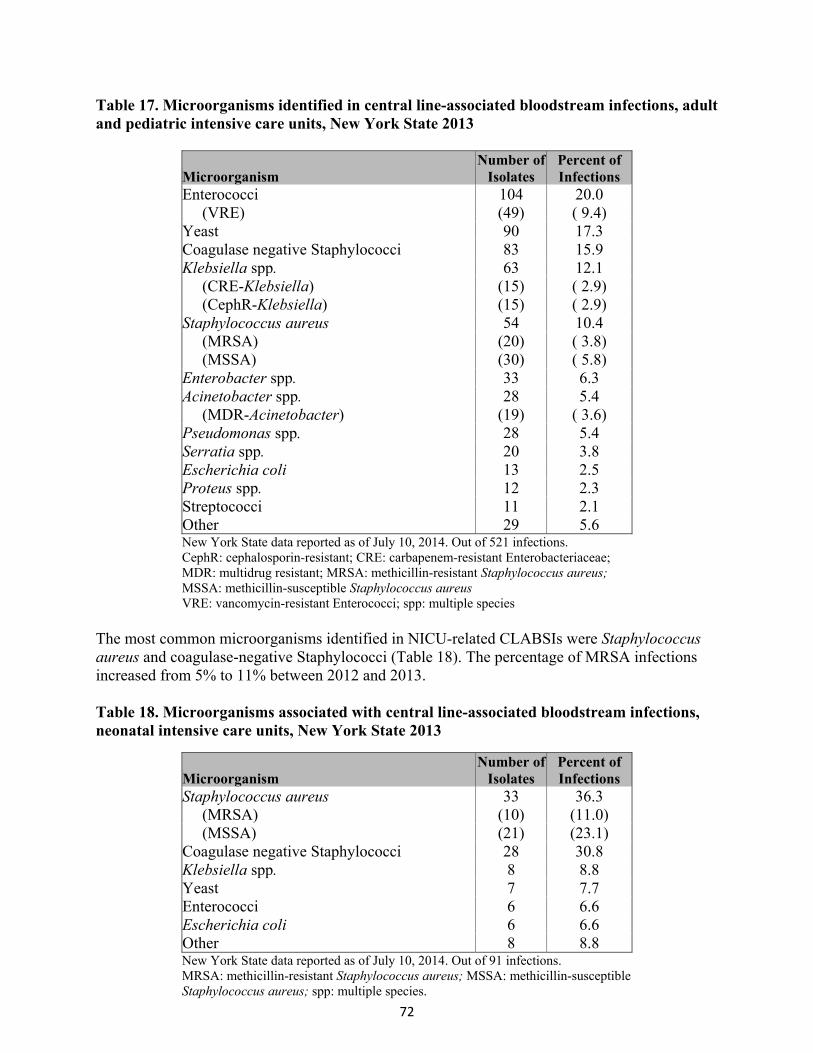
72
Table 17. Microorganisms identified in central line-associated bloodstream infections, adult and pediatric intensive care units, New York State 2013
Microorganism Number of
Isolates Percent of Infections
Enterococci 104 20.0 (VRE) (49) ( 9.4) Yeast 90 17.3 Coagulase negative Staphylococci 83 15.9 Klebsiella spp. 63 12.1 (CRE-Klebsiella) (15) ( 2.9) (CephR-Klebsiella) (15) ( 2.9) Staphylococcus aureus 54 10.4 (MRSA) (20) ( 3.8) (MSSA) (30) ( 5.8) Enterobacter spp. 33 6.3 Acinetobacter spp. 28 5.4 (MDR-Acinetobacter) (19) ( 3.6) Pseudomonas spp. 28 5.4 Serratia spp. 20 3.8 Escherichia coli 13 2.5 Proteus spp. 12 2.3 Streptococci 11 2.1 Other 29 5.6 New York State data reported as of July 10, 2014. Out of 521 infections. CephR: cephalosporin-resistant; CRE: carbapenem-resistant Enterobacteriaceae; MDR: multidrug resistant; MRSA: methicillin-resistant Staphylococcus aureus; MSSA: methicillin-susceptible Staphylococcus aureus VRE: vancomycin-resistant Enterococci; spp: multiple species
The most common microorganisms identified in NICU-related CLABSIs were Staphylococcus aureus and coagulase-negative Staphylococci (Table 18). The percentage of MRSA infections increased from 5% to 11% between 2012 and 2013. Table 18. Microorganisms associated with central line-associated bloodstream infections, neonatal intensive care units, New York State 2013
Microorganism Number of
Isolates Percent of Infections
Staphylococcus aureus 33 36.3 (MRSA) (10) (11.0) (MSSA) (21) (23.1) Coagulase negative Staphylococci 28 30.8 Klebsiella spp. 8 8.8 Yeast 7 7.7 Enterococci 6 6.6 Escherichia coli 6 6.6 Other 8 8.8 New York State data reported as of July 10, 2014. Out of 91 infections. MRSA: methicillin-resistant Staphylococcus aureus; MSSA: methicillin-susceptible Staphylococcus aureus; spp: multiple species.
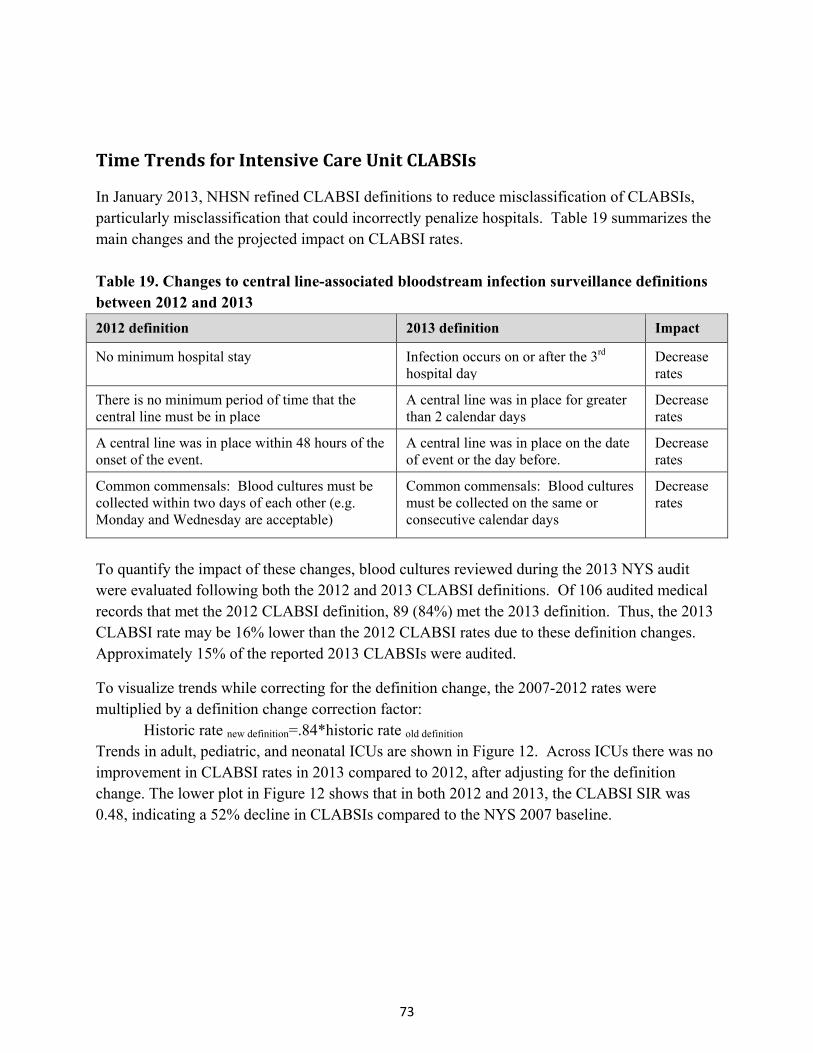
73
TimeTrendsforIntensiveCareUnitCLABSIs
In January 2013, NHSN refined CLABSI definitions to reduce misclassification of CLABSIs, particularly misclassification that could incorrectly penalize hospitals. Table 19 summarizes the main changes and the projected impact on CLABSI rates. Table 19. Changes to central line-associated bloodstream infection surveillance definitions between 2012 and 2013
2012 definition 2013 definition Impact
No minimum hospital stay Infection occurs on or after the 3rd hospital day
Decrease rates
There is no minimum period of time that the central line must be in place
A central line was in place for greater than 2 calendar days
Decrease rates
A central line was in place within 48 hours of the onset of the event.
A central line was in place on the date of event or the day before.
Decrease rates
Common commensals: Blood cultures must be collected within two days of each other (e.g. Monday and Wednesday are acceptable)
Common commensals: Blood cultures must be collected on the same or consecutive calendar days
Decrease rates
To quantify the impact of these changes, blood cultures reviewed during the 2013 NYS audit were evaluated following both the 2012 and 2013 CLABSI definitions. Of 106 audited medical records that met the 2012 CLABSI definition, 89 (84%) met the 2013 definition. Thus, the 2013 CLABSI rate may be 16% lower than the 2012 CLABSI rates due to these definition changes. Approximately 15% of the reported 2013 CLABSIs were audited.
To visualize trends while correcting for the definition change, the 2007-2012 rates were multiplied by a definition change correction factor:
Historic rate new definition=.84*historic rate old definition Trends in adult, pediatric, and neonatal ICUs are shown in Figure 12. Across ICUs there was no improvement in CLABSI rates in 2013 compared to 2012, after adjusting for the definition change. The lower plot in Figure 12 shows that in both 2012 and 2013, the CLABSI SIR was 0.48, indicating a 52% decline in CLABSIs compared to the NYS 2007 baseline.
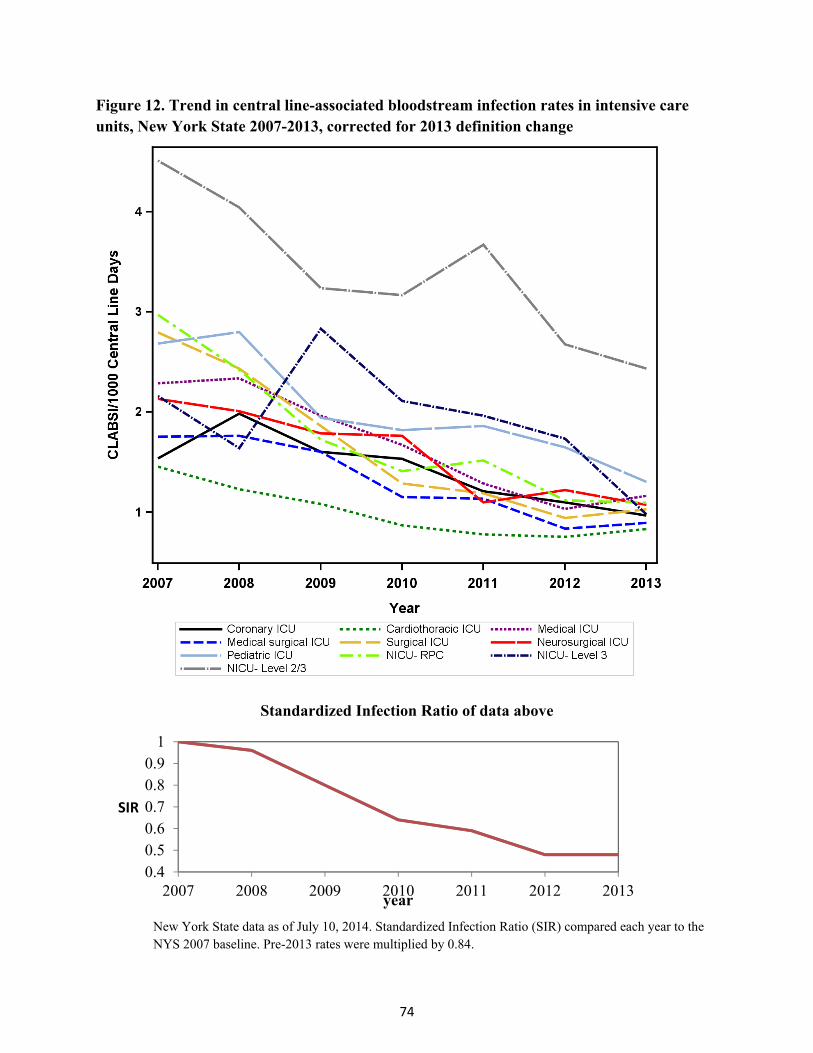
74
Figure 12. Trend in central line-associated bloodstream infection rates in intensive care units, New York State 2007-2013, corrected for 2013 definition change
Standardized Infection Ratio of data above
0.40.50.60.70.80.9
1
2007 2008 2009 2010 2011 2012 2013
SIR
year
New York State data as of July 10, 2014. Standardized Infection Ratio (SIR) compared each year to the NYS 2007 baseline. Pre-2013 rates were multiplied by 0.84.

75
CLABSISurveillanceandPreventionPractices
According to the most recent NYSDOH CLABSI survey (October 2013), 85% of hospitals continue to manually collect CL denominator data in ICUs. More attention to quality control of the reported data may be necessary, as 49% of hospitals reported that they have no mechanism in place to periodically verify the manually or electronically collected denominator data, and 12% of hospitals reported no periodic verification that all CLABSIs have been reviewed and entered into NHSN. A total of 75% of hospitals reported that they have already implemented hospital-wide surveillance of CLABSIs. Moving from manual to electronic capture of denominator data will increase efficiency in this process as reporting requirements expand.
IPs use multiple sources to identify CLABSIs, including microbiology reports (98%), hospital tracking systems (15%), and data mining systems (15%). Use of root-cause analysis (i.e. a systematic review to identify the underlying reason the infection occurred) for all CLABSIs increased from 45% to 62% between 2012 and 2013; and root-cause analysis on selected CLABSIs increased from 15% to 18%. With respect to prevention practices, 64% of hospitals reported routinely bathing adult ICU patients with chlorhexidine, and 84% use antiseptic-impregnated central lines. Almost all adult ICUs (99%) reported using a standardized insertion bundle checklist, and 79% reported tracking compliance of insertion bundle documentation. Similarly, 96% of NICUs use an insertion checklist, and 89% track compliance. In both adult and neonatal ICUs, approximately 91% review line necessity every day, and of these facilities, 70% document this in the medical record. Approximately 79% of adult and neonatal ICUs use a maintenance bundle, and of these, 62% document compliance in the medical record.
RiskFactorsforCLABSIs Hospitals do not collect patient-specific risk factors for CLABSIs in adult and pediatric ICUs; NHSN requires reporting of only the total number of patient days and total number of central line days per month within each type of ICU. CLABSI rates are stratified by type of ICU. For BSIs in NICUs, the data are collected by birth weight group, because lower birth weight babies are more susceptible to CLABSIs than higher birth weight babies. As CLABSI rates decline, risk adjustment NICU rates becomes more difficult. In 2013, no risk adjustment could be performed by birthweight group in Level II/III facilities because there were only 14 CLABSIs. Level III data were risk-adjusted using two birthweight groups divided at 1000 grams. RPC data were risk-adjusted by three birthweight groups, partitioned at 750 grams and 1000 grams.

76
Hospital‐Specific,ICU‐SpecificCLABSIRates Within NYS, hospital-specific CLABSI rates were compared to the state average for the specific type of ICU. Figure 13 provides hospital-specific CLABSI SIRs for each hospital. Between 2008 and 2012, NYS hospital-specific comparisons excluded bloodstream events in which multiple blood cultures were obtained, only one blood specimen was positive for a single pathogen, and no treatment was given. In 2013, NYSDOH no longer deleted these contaminants to be more consistent with national reports. CLABSI SIRs combine results across the eight different types of ICUs to show the average performance of each hospital for CLABSIs. Eleven hospitals had high SIR flags in 2013; of these, Jamaica Hospital had a significantly high CLABSI SIR for the past three years, and Brookdale Hospital had a significantly high CLABSI SIR for the past four years. Six hospitals had low SIR flags in 2013; no hospitals had low flags for more than two consecutive years.
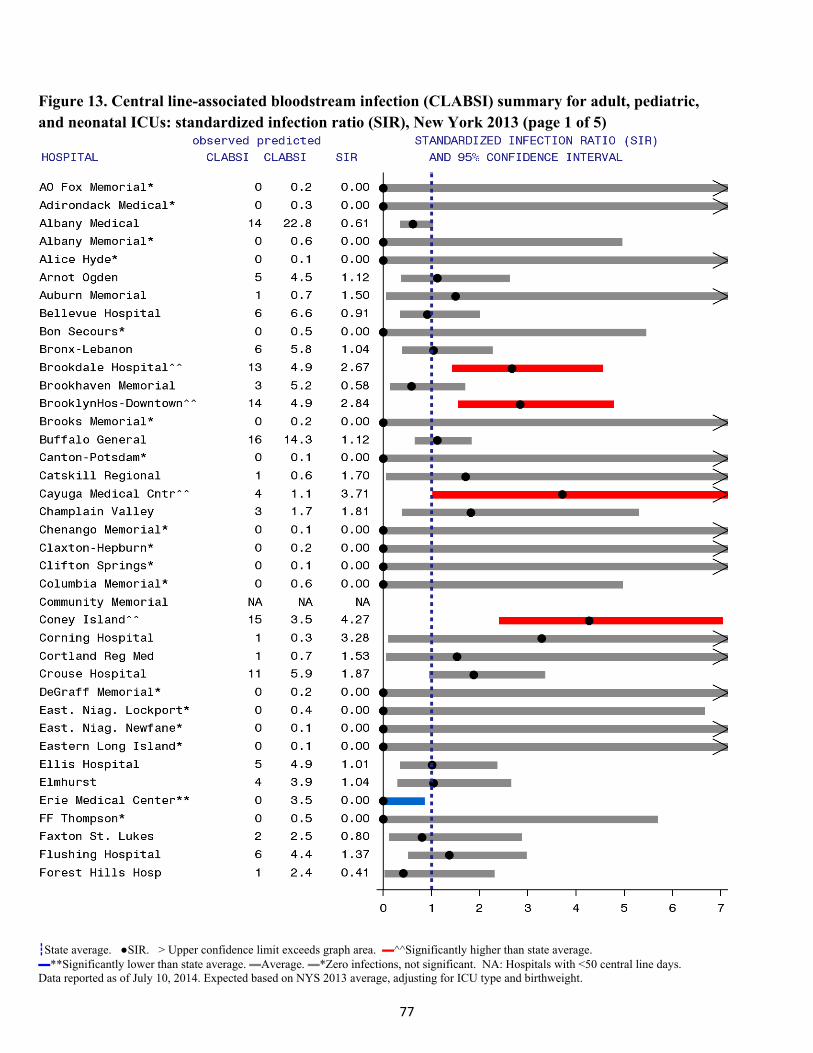
77
Figure 13. Central line-associated bloodstream infection (CLABSI) summary for adult, pediatric, and neonatal ICUs: standardized infection ratio (SIR), New York 2013 (page 1 of 5)
┇State average. ●SIR. > Upper confidence limit exceeds graph area. ▬^^Significantly higher than state average. ▬**Significantly lower than state average. ▬Average. ▬*Zero infections, not significant. NA: Hospitals with <50 central line days. Data reported as of July 10, 2014. Expected based on NYS 2013 average, adjusting for ICU type and birthweight.
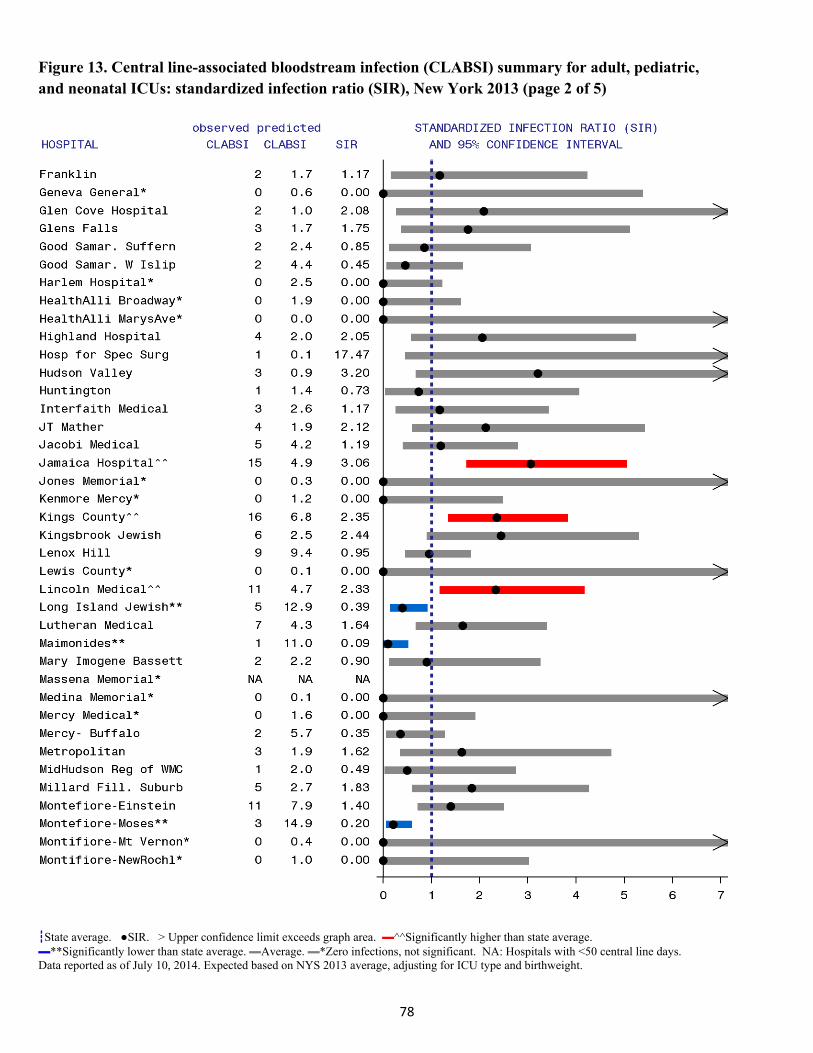
78
Figure 13. Central line-associated bloodstream infection (CLABSI) summary for adult, pediatric, and neonatal ICUs: standardized infection ratio (SIR), New York 2013 (page 2 of 5)
┇State average. ●SIR. > Upper confidence limit exceeds graph area. ▬^^Significantly higher than state average. ▬**Significantly lower than state average. ▬Average. ▬*Zero infections, not significant. NA: Hospitals with <50 central line days. Data reported as of July 10, 2014. Expected based on NYS 2013 average, adjusting for ICU type and birthweight.
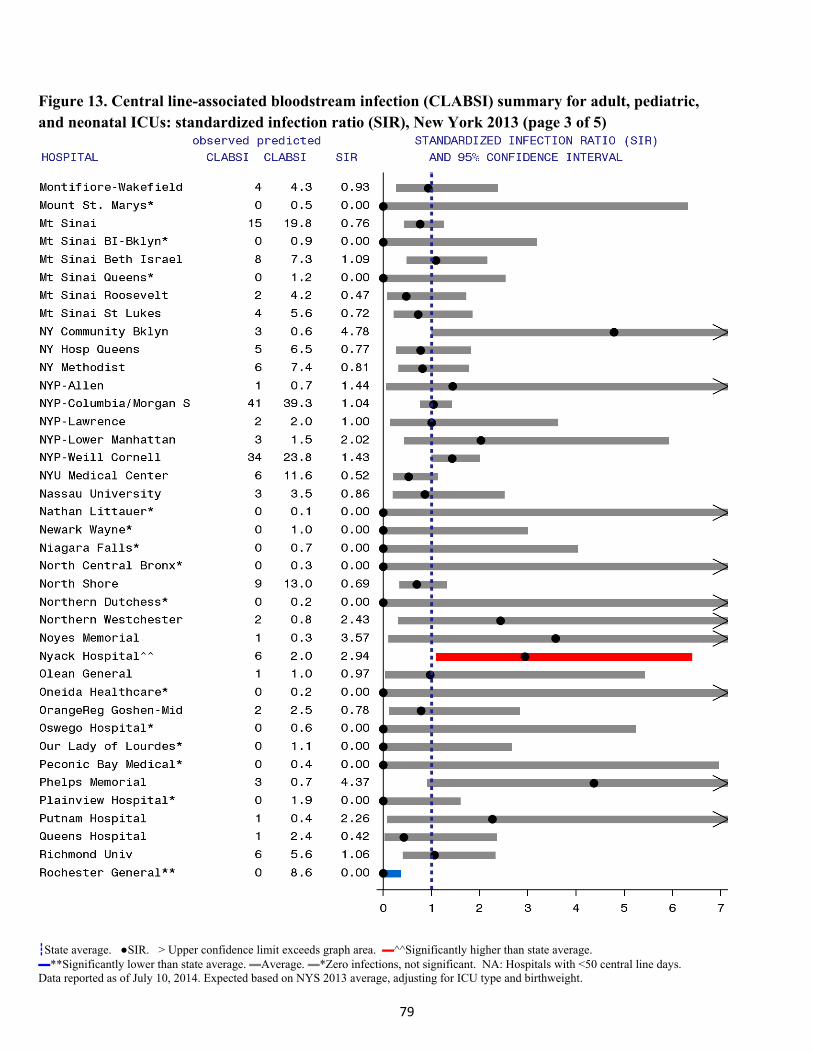
79
Figure 13. Central line-associated bloodstream infection (CLABSI) summary for adult, pediatric, and neonatal ICUs: standardized infection ratio (SIR), New York 2013 (page 3 of 5)
┇State average. ●SIR. > Upper confidence limit exceeds graph area. ▬^^Significantly higher than state average. ▬**Significantly lower than state average. ▬Average. ▬*Zero infections, not significant. NA: Hospitals with <50 central line days. Data reported as of July 10, 2014. Expected based on NYS 2013 average, adjusting for ICU type and birthweight.

80
Figure 13. Central line-associated bloodstream infection (CLABSI) summary for adult, pediatric, and neonatal ICUs: standardized infection ratio (SIR), New York 2013 (page 4 of 5)
┇State average. ●SIR. > Upper confidence limit exceeds graph area. ▬^^Significantly higher than state average. ▬**Significantly lower than state average. ▬Average. ▬*Zero infections, not significant. NA: Hospitals with <50 central line days. Data reported as of July 10, 2014. Expected based on NYS 2013 average, adjusting for ICU type and birthweight.
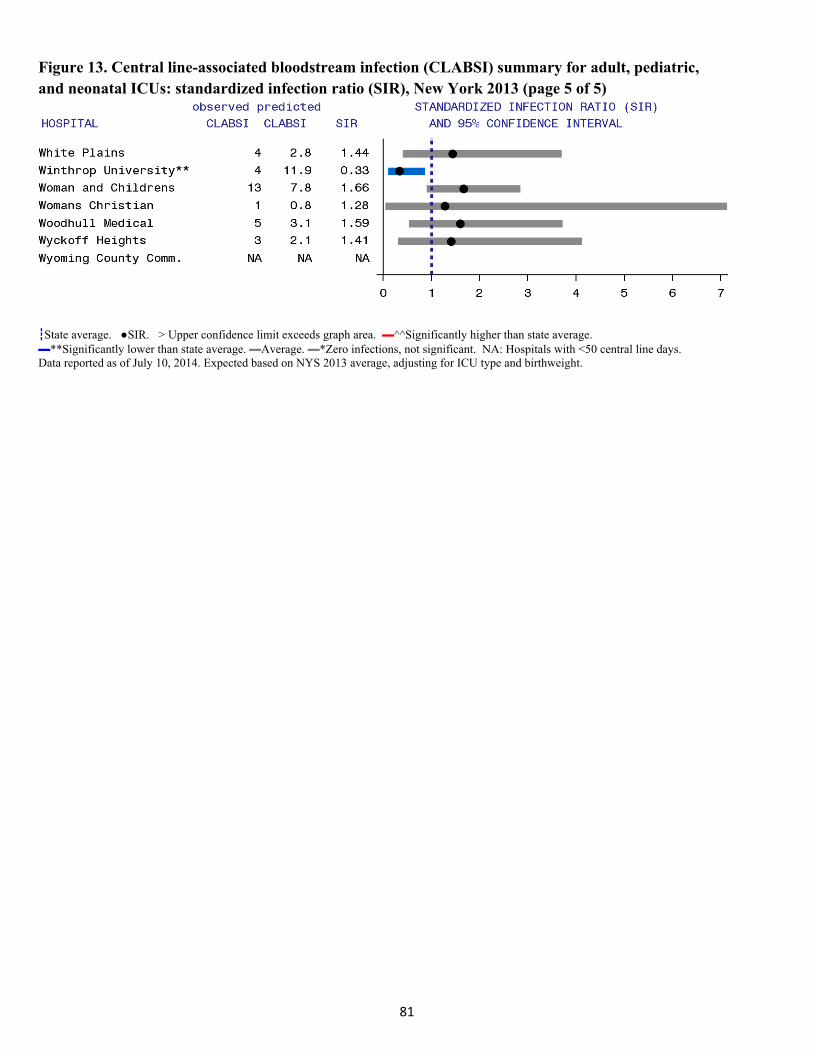
81
Figure 13. Central line-associated bloodstream infection (CLABSI) summary for adult, pediatric, and neonatal ICUs: standardized infection ratio (SIR), New York 2013 (page 5 of 5)
┇State average. ●SIR. > Upper confidence limit exceeds graph area. ▬^^Significantly higher than state average. ▬**Significantly lower than state average. ▬Average. ▬*Zero infections, not significant. NA: Hospitals with <50 central line days. Data reported as of July 10, 2014. Expected based on NYS 2013 average, adjusting for ICU type and birthweight.

82
Catheter‐AssociatedUrinaryTractInfections(CAUTIs) A urinary tract infection (UTI) is an infection of the bladder or kidneys. Hospitalized patients may have a thin tube called a urinary catheter inserted into the bladder through the urethra to drain urine when they cannot urinate on their own. The catheter provides a pathway for bacteria to enter the bladder, increasing the risk of a UTI.
Catheter-associated urinary tract infections (CAUTIs) can be treated with antibiotics or removal/change of the catheter. The risk of a CAUTI can be decreased by using a catheter only when necessary, proper insertion technique and catheter care, hand washing by healthcare providers handling the catheter, and using a closed system of a catheter and attached urine collection bag.
In order to determine if a patient has a healthcare-associated CAUTI, the CDC developed surveillance definitions based on catheter usage, symptoms, and laboratory results. These definitions are used by all facilities entering data into NHSN (http://www.cdc.gov/nhsn/PDFs/pscManual/7pscCAUTIcurrent.pdf). Hospitals track the number of CAUTIs, the number of urinary catheter days, and the number of patient days per month.
The CMS IQR Program required CAUTI reporting in adult and pediatric ICUs starting in January 2012. All NY hospitals with ICUs are participating in this program. In 2015, CMS will be expanding the IQR program to include medical, surgical, and medical-surgical wards; about half of hospitals have already begun entering the ward data. While CAUTI reporting is not required by NYSDOH, data submitted as of May 2013 were included as a result of the CDC-NYS DUA. This DUA prohibits NYSDOH from publishing hospital-specific rates. NYSDOH does not audit this data.
CAUTI data reported between May and December 2013 were annualized by multiplying the observed data by 12 months/8 months. With the entire year of data, 2,593 infections would be expected. Catheters were used 56% of the time in ICU patients, and 13% of the time in the medical and surgical wards. CAUTI rates were higher in ICU patients, occurring at a rate of 2.9 infections per 1,000 catheter days (Table 20).
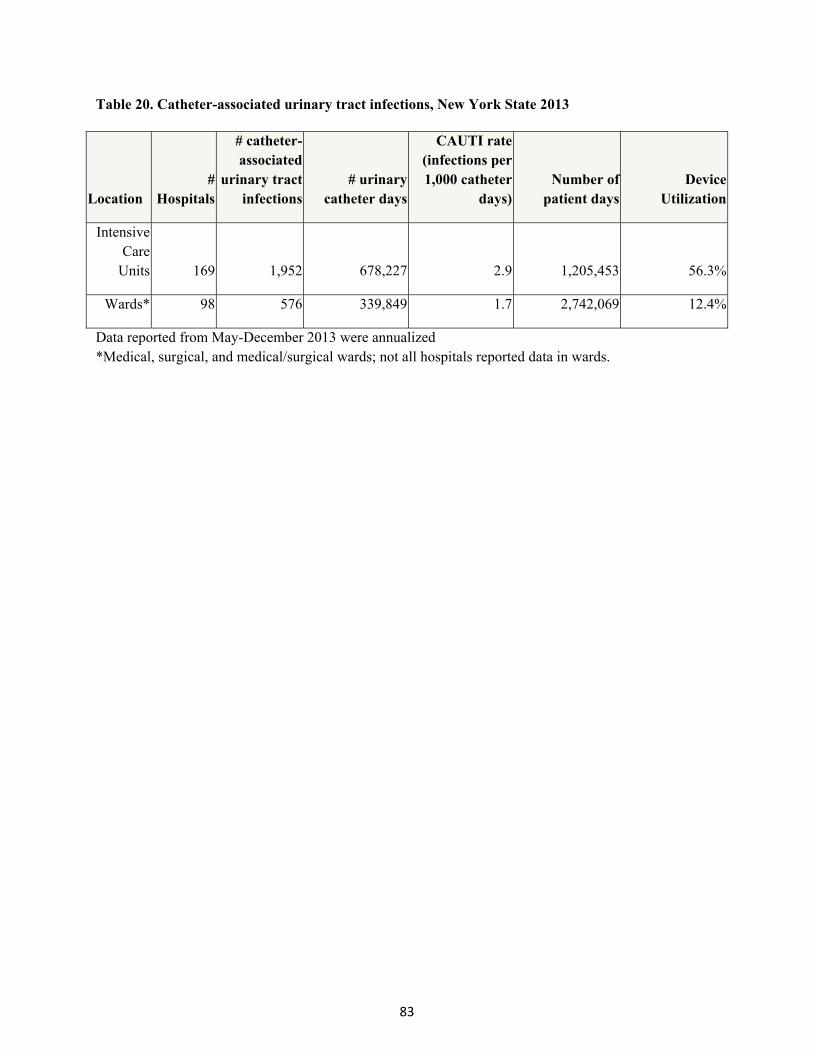
83
Table 20. Catheter-associated urinary tract infections, New York State 2013
Location #
Hospitals
# catheter-associated
urinary tract infections
# urinary catheter days
CAUTI rate (infections per 1,000 catheter
days)Number of
patient days Device
Utilization
Intensive Care
Units 169 1,952 678,227 2.9 1,205,453 56.3%
Wards* 98 576 339,849 1.7 2,742,069 12.4%
Data reported from May-December 2013 were annualized *Medical, surgical, and medical/surgical wards; not all hospitals reported data in wards.
84
ClostridiumdifficileInfectionsandMultidrugResistantOrganisms
ClostridiumdifficileInfections(CDI) Clostridium difficile (C. difficile) is a type of bacteria that is a common cause of diarrhea in healthcare settings. In a small percentage of people, C. difficile lives along with other types of bacteria normally found in the intestinal tract and does not cause any symptoms or problems. However, when the C. difficile bacteria crowd out the other naturally occurring bacteria, they excrete a toxin into the intestines that may result in symptoms ranging from abdominal cramping and mild diarrhea to severe diarrhea and intestinal damage, which in some instances can result in death. The elderly and those who have recently taken antibiotics are at the greatest risk for developing CDI. When people take antibiotics, good germs that protect against infection may be destroyed along with the bad germs. The types of germs in the intestines might be altered for several months. During this time, patients can get sick from C. difficile acquired from contaminated surfaces or health care providers’ hands. Hospitals count CDI cases in all inpatient areas of the hospital except newborn nurseries, because babies may naturally carry the bacteria without symptoms. The diagnosis of CDI is made by performing a laboratory test on a stool sample. Patients are not tested for C. difficile unless they have symptoms of infection. Each month, hospitals enter the number of CDI cases, the number of admissions, and the number of patient days into NHSN. CategoriesofCDI Laboratory identified CDI cases are separated into reporting categories depending upon whether the onset of illness occurred in the community or in a hospital. Cases termed “community-onset not my hospital” (CO-NMH) are cases in which the positive stool sample was obtained during the first three days of the patient’s hospital admission and more than four weeks after any previous discharge from that same hospital. These cases are presumed to be unrelated to the patient’s stay in that hospital. Cases termed “community-onset possibly related to my hospital” (CO-PMH) are cases in which a patient who was discharged from the same hospital within the previous four weeks is readmitted to that hospital and has a positive C. difficile test during the first three days of the re-admission. In CO-PMH cases, it is not certain whether the CDI occurred as a result of the recent hospitalization or whether it is related to other exposures outside of the hospital. Hospital-onset (HO) cases are cases in which the positive stool sample was obtained on day four or later during the hospital stay.
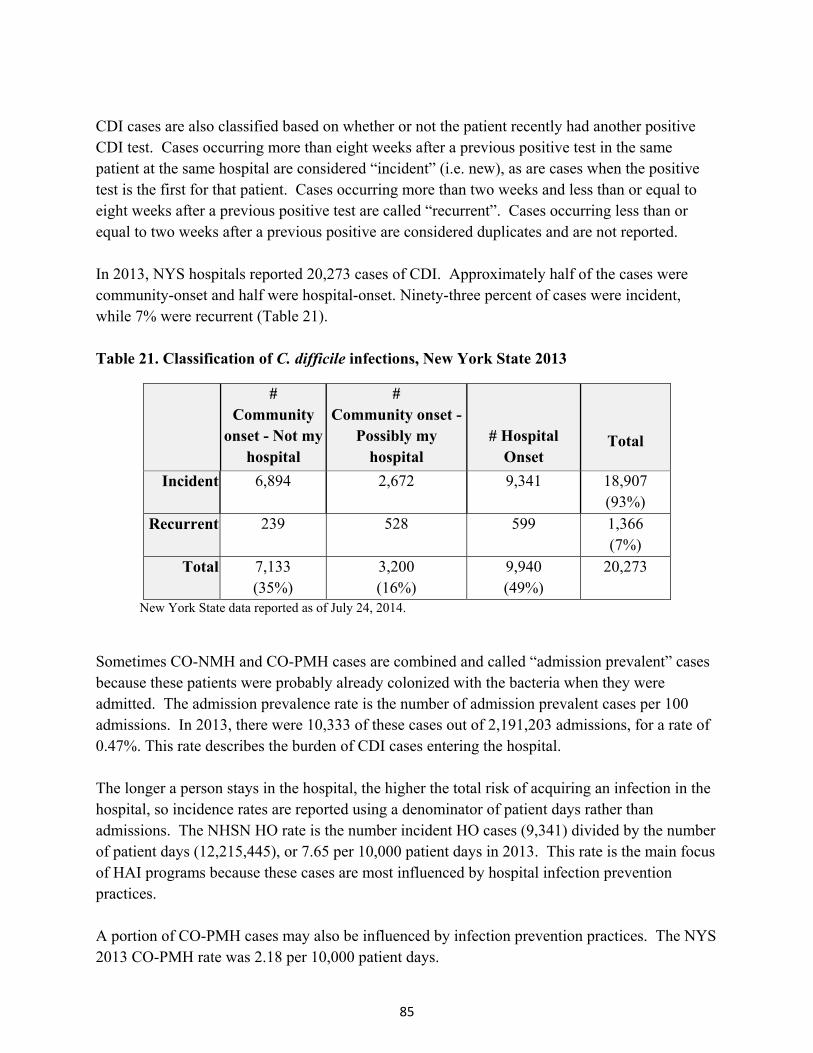
85
CDI cases are also classified based on whether or not the patient recently had another positive CDI test. Cases occurring more than eight weeks after a previous positive test in the same patient at the same hospital are considered “incident” (i.e. new), as are cases when the positive test is the first for that patient. Cases occurring more than two weeks and less than or equal to eight weeks after a previous positive test are called “recurrent”. Cases occurring less than or equal to two weeks after a previous positive are considered duplicates and are not reported. In 2013, NYS hospitals reported 20,273 cases of CDI. Approximately half of the cases were community-onset and half were hospital-onset. Ninety-three percent of cases were incident, while 7% were recurrent (Table 21). Table 21. Classification of C. difficile infections, New York State 2013
# Community
onset - Not my hospital
# Community onset -
Possibly my hospital
# Hospital Onset
Total
Incident 6,894 2,672 9,341 18,907 (93%)
Recurrent 239 528 599 1,366 (7%)
Total 7,133 (35%)
3,200 (16%)
9,940 (49%)
20,273
New York State data reported as of July 24, 2014.
Sometimes CO-NMH and CO-PMH cases are combined and called “admission prevalent” cases because these patients were probably already colonized with the bacteria when they were admitted. The admission prevalence rate is the number of admission prevalent cases per 100 admissions. In 2013, there were 10,333 of these cases out of 2,191,203 admissions, for a rate of 0.47%. This rate describes the burden of CDI cases entering the hospital. The longer a person stays in the hospital, the higher the total risk of acquiring an infection in the hospital, so incidence rates are reported using a denominator of patient days rather than admissions. The NHSN HO rate is the number incident HO cases (9,341) divided by the number of patient days (12,215,445), or 7.65 per 10,000 patient days in 2013. This rate is the main focus of HAI programs because these cases are most influenced by hospital infection prevention practices. A portion of CO-PMH cases may also be influenced by infection prevention practices. The NYS 2013 CO-PMH rate was 2.18 per 10,000 patient days.
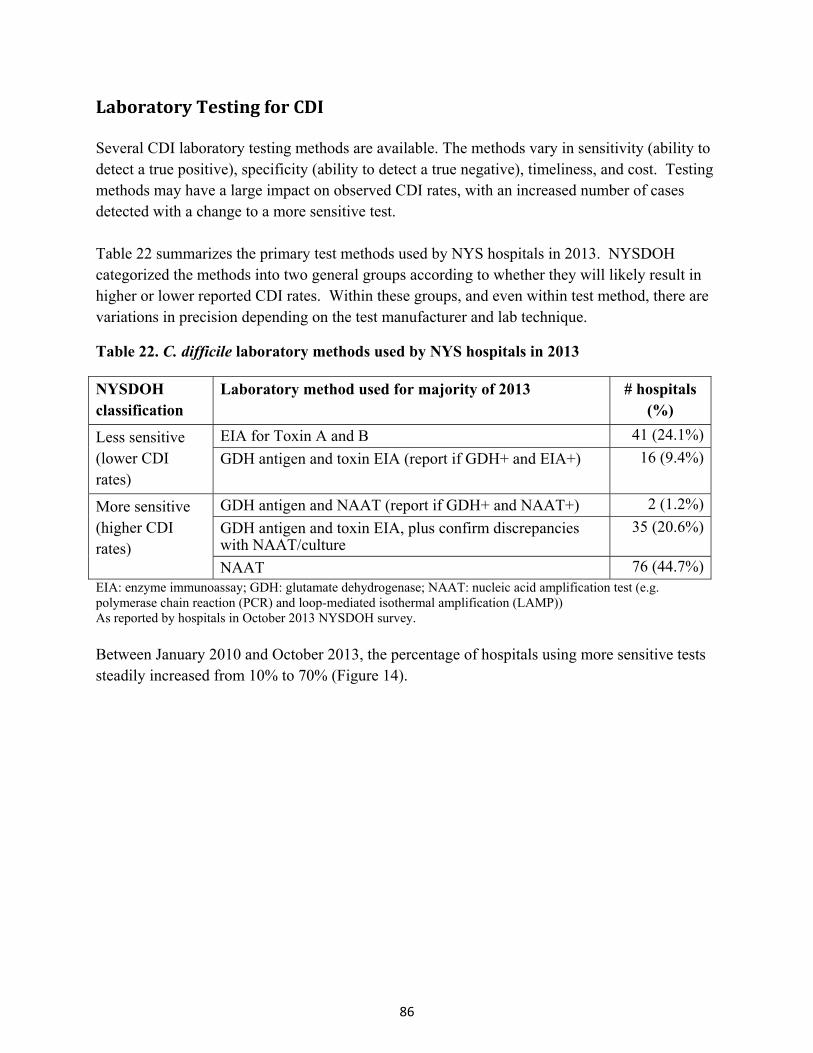
86
LaboratoryTestingforCDI Several CDI laboratory testing methods are available. The methods vary in sensitivity (ability to detect a true positive), specificity (ability to detect a true negative), timeliness, and cost. Testing methods may have a large impact on observed CDI rates, with an increased number of cases detected with a change to a more sensitive test. Table 22 summarizes the primary test methods used by NYS hospitals in 2013. NYSDOH categorized the methods into two general groups according to whether they will likely result in higher or lower reported CDI rates. Within these groups, and even within test method, there are variations in precision depending on the test manufacturer and lab technique.
Table 22. C. difficile laboratory methods used by NYS hospitals in 2013
NYSDOH classification
Laboratory method used for majority of 2013 # hospitals (%)
Less sensitive (lower CDI rates)
EIA for Toxin A and B 41 (24.1%)
GDH antigen and toxin EIA (report if GDH+ and EIA+) 16 (9.4%)
More sensitive (higher CDI rates)
GDH antigen and NAAT (report if GDH+ and NAAT+) 2 (1.2%)
GDH antigen and toxin EIA, plus confirm discrepancies with NAAT/culture
35 (20.6%)
NAAT 76 (44.7%)EIA: enzyme immunoassay; GDH: glutamate dehydrogenase; NAAT: nucleic acid amplification test (e.g. polymerase chain reaction (PCR) and loop-mediated isothermal amplification (LAMP)) As reported by hospitals in October 2013 NYSDOH survey.
Between January 2010 and October 2013, the percentage of hospitals using more sensitive tests steadily increased from 10% to 70% (Figure 14).
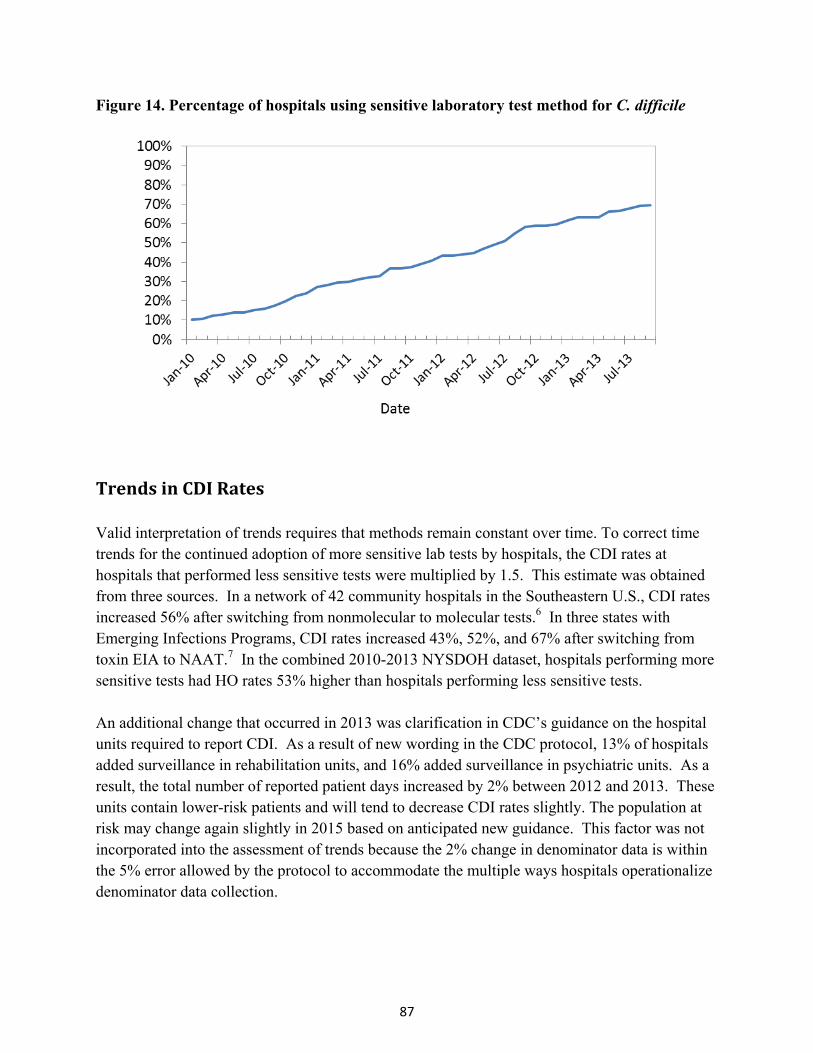
87
Figure 14. Percentage of hospitals using sensitive laboratory test method for C. difficile
TrendsinCDIRates Valid interpretation of trends requires that methods remain constant over time. To correct time trends for the continued adoption of more sensitive lab tests by hospitals, the CDI rates at hospitals that performed less sensitive tests were multiplied by 1.5. This estimate was obtained from three sources. In a network of 42 community hospitals in the Southeastern U.S., CDI rates increased 56% after switching from nonmolecular to molecular tests.6 In three states with Emerging Infections Programs, CDI rates increased 43%, 52%, and 67% after switching from toxin EIA to NAAT.7 In the combined 2010-2013 NYSDOH dataset, hospitals performing more sensitive tests had HO rates 53% higher than hospitals performing less sensitive tests. An additional change that occurred in 2013 was clarification in CDC’s guidance on the hospital units required to report CDI. As a result of new wording in the CDC protocol, 13% of hospitals added surveillance in rehabilitation units, and 16% added surveillance in psychiatric units. As a result, the total number of reported patient days increased by 2% between 2012 and 2013. These units contain lower-risk patients and will tend to decrease CDI rates slightly. The population at risk may change again slightly in 2015 based on anticipated new guidance. This factor was not incorporated into the assessment of trends because the 2% change in denominator data is within the 5% error allowed by the protocol to accommodate the multiple ways hospitals operationalize denominator data collection.
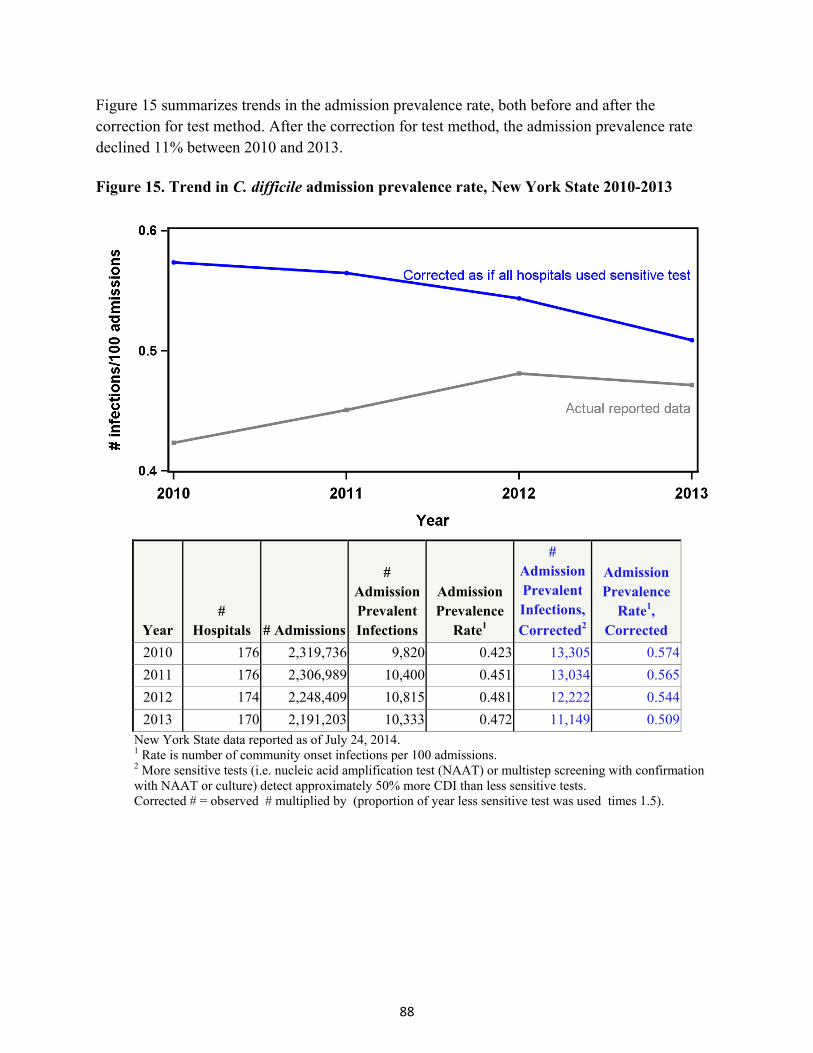
88
Figure 15 summarizes trends in the admission prevalence rate, both before and after the correction for test method. After the correction for test method, the admission prevalence rate declined 11% between 2010 and 2013. Figure 15. Trend in C. difficile admission prevalence rate, New York State 2010-2013
Year #
Hospitals # Admissions
# Admission Prevalent Infections
Admission Prevalence
Rate1
# Admission Prevalent Infections,
Corrected2
Admission Prevalence
Rate1, Corrected
2010 176 2,319,736 9,820 0.423 13,305 0.574
2011 176 2,306,989 10,400 0.451 13,034 0.565
2012 174 2,248,409 10,815 0.481 12,222 0.544
2013 170 2,191,203 10,333 0.472 11,149 0.509New York State data reported as of July 24, 2014. 1 Rate is number of community onset infections per 100 admissions. 2 More sensitive tests (i.e. nucleic acid amplification test (NAAT) or multistep screening with confirmation with NAAT or culture) detect approximately 50% more CDI than less sensitive tests. Corrected # = observed # multiplied by (proportion of year less sensitive test was used times 1.5).

89
Correcting for changes in test method, HO rates declined 25% between 2010 and 2013 (Figure 16). This corresponds to approximately 8,000 fewer HO infections than would have occurred if the incidence of HO did not decrease between 2010 and 2013, with an associated cost savings of $52 million to $74 million, assuming that costs were accrued for HO cases that were not reported because of use of a less sensitive test method.
Figure 16. Trend in incidence of hospital onset C. difficile, New York State 2010-2013
Year #
Hosp # Patient
Days
# HospitalOnset
Infections
Hospital Onset Rate1
# Hospital Onset
Infections Corrected2
Hospital Onset Rate1
Corrected
Hospital Onset Rate3 for
Hospital Comparisons
2010 176 12,290,750 10,186 8.29 13,671 11.12 12.54
2011 176 12,243,421 10,388 8.48 13,022 10.64 12.83
2012 174 11,962,739 9,902 8.28 11,309 9.45 12.51
2013 170 12,215,445 9,341 7.65 10,157 8.31 11.30New York State data reported as of July 24, 2014. 1 Rate is number of hospital onset infections per 10,000 patient days. 2 More sensitive tests (i.e. nucleic acid amplification test (NAAT) or multistep screening with confirmation with NAAT or culture) detect approximately 50% more CDI than less sensitive tests. Corrected # = observed # multiplied by (proportion of year less sensitive test was used times 1.5). 3 Rate calculated using estimated days at risk (i.e. deleting first three days of all admissions)

90
CDIRiskAdjustment In previous reports, hospital CDI rates were not risk-adjusted because facility-wide individual risk factor data are not reported to NHSN. Instead, each hospital’s rate in the current year was compared to the rate in the previous year. There were a few limitations to that method: 1) It was not possible to compare rates when test methods or denominator reporting methods changed; 2) The method did not highlight hospitals with progress over many years; and 3) Hospitals with unusually high or low rates could not be identified. For this report, a new method was developed to assess hospital performance in a given year, similar to the method of displaying other indicators in this report. Hospital CDI rates were adjusted based on the length of stay obtained from NHSN, laboratory test method obtained from a survey of hospitals, and a hospital CDI risk index calculated from the previous year’s billing database (SPARCS).
By NHSN definition, patients cannot have a hospital-onset infection on the first three days of admission. Therefore, infection rates should be based only on the days at risk for CDI.8,9 Figure 17 shows the relationship between length of stay and the proportion of days at risk (i.e. number of patient days after deleting the first three days from each admission, divided by total patient days) in billing data (including long term acute care hospitals, which started reporting to NYS in 2014). An equation was developed to fit the data using a curve fitting program.
Figure 17. Proportion of days at risk for hospital onset infection versus length of stay
NHSN CDI events were matched onto SPARCS 2010-2012 discharges, and Poisson regression was used to predict which patients would develop NHSN defined HO CDI each year based on diagnosis codes assigned at discharge. All diagnosis codes have an indicator of whether or not
91
the onset of the diagnosis was present prior to admission. Only diagnoses that were “present on admission” were included. A risk index was calculated for each hospital in each year as the total predicted number of cases divided by the days at risk; the risk index is the predicted HO rate. The 2012 model is summarized in Table 23. The model shows that patients who were admitted for mental health issues were the least likely group to develop CDI. Hospitals with a large proportion of mental health patients will have a lower risk index because these patients have a very low risk for CDI. Similarly, patients admitted for substance abuse issues, rehabilitation, and childbirth were very unlikely to develop CDI, so hospitals with a large proportion of these types of patients will tend to have lower risk indices. Hospitals with a large proportion of elderly patients, cancer patients, and patients with infections will tend to have higher risk indices. SPARCS data are not equivalent to NHSN data in timeliness because NHSN events are entered within 60 days after the end of the month that the event occurred, while SPARCS data are entered after patient discharge and are not considered complete until August for the previous discharge year. NYS developed a risk index for each hospital each year. The risk index was found to be highly consistent between years (r-squared=0.94). The 2012 index was used to risk adjust 2013 data, the 2011 index was used for the 2012 data, and the 2010 index was used for 2011 and 2010 data. (A 2009 risk index was not available because NHSN data collection did not begin until July 2009).
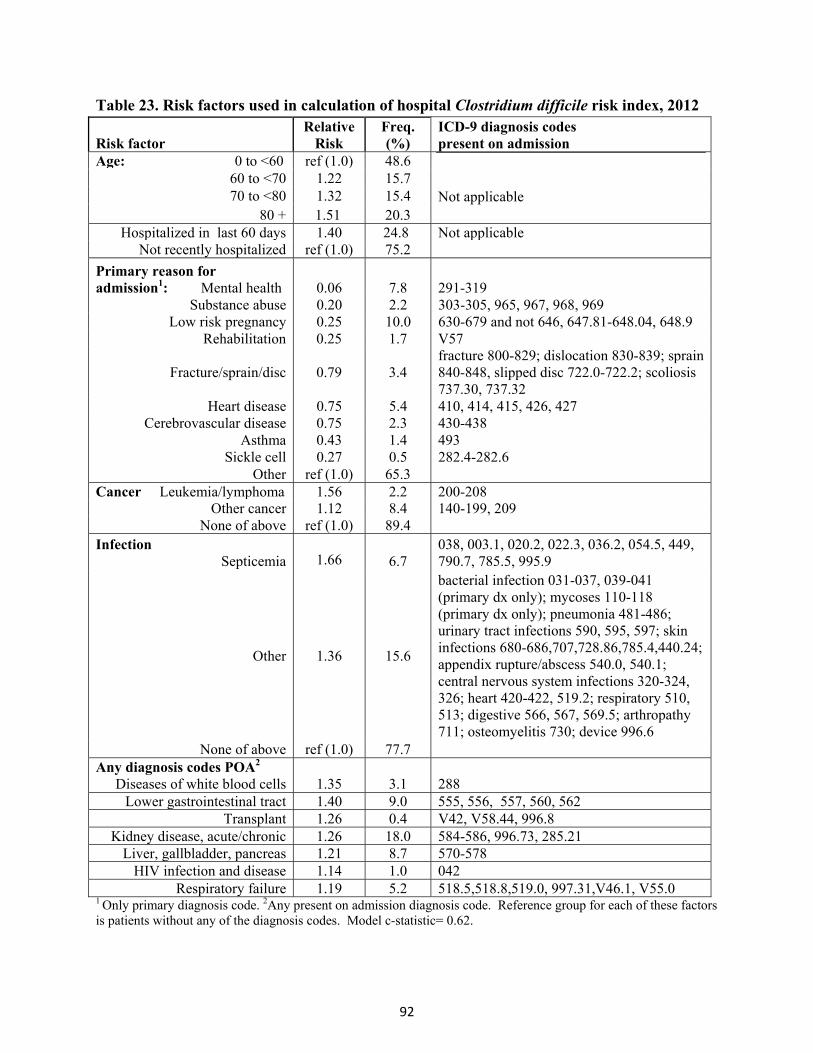
92
Table 23. Risk factors used in calculation of hospital Clostridium difficile risk index, 2012
Risk factor Relative
Risk Freq. (%)
ICD-9 diagnosis codes present on admission
Age: 0 to <60 ref (1.0) 48.6 Not applicable
60 to <70 1.22 15.7 70 to <80 1.32 15.4
80 + 1.51 20.3 Hospitalized in last 60 days 1.40 24.8 Not applicable
Not recently hospitalized ref (1.0) 75.2
Primary reason for admission1: Mental health 0.06 7.8 291-319
Substance abuse 0.20 2.2 303-305, 965, 967, 968, 969 Low risk pregnancy 0.25 10.0 630-679 and not 646, 647.81-648.04, 648.9
Rehabilitation 0.25 1.7 V57
Fracture/sprain/disc 0.79 3.4 fracture 800-829; dislocation 830-839; sprain 840-848, slipped disc 722.0-722.2; scoliosis 737.30, 737.32
Heart disease 0.75 5.4 410, 414, 415, 426, 427 Cerebrovascular disease 0.75 2.3 430-438
Asthma 0.43 1.4 493 Sickle cell 0.27 0.5 282.4-282.6
Other ref (1.0) 65.3 Cancer Leukemia/lymphoma 1.56 2.2 200-208
Other cancer 1.12 8.4 140-199, 209 None of above ref (1.0) 89.4
Infection
Septicemia
1.66
6.7 038, 003.1, 020.2, 022.3, 036.2, 054.5, 449, 790.7, 785.5, 995.9
Other 1.36 15.6
bacterial infection 031-037, 039-041 (primary dx only); mycoses 110-118 (primary dx only); pneumonia 481-486; urinary tract infections 590, 595, 597; skin infections 680-686,707,728.86,785.4,440.24; appendix rupture/abscess 540.0, 540.1; central nervous system infections 320-324, 326; heart 420-422, 519.2; respiratory 510, 513; digestive 566, 567, 569.5; arthropathy 711; osteomyelitis 730; device 996.6
None of above ref (1.0) 77.7 Any diagnosis codes POA2
Diseases of white blood cells 1.35 3.1 288 Lower gastrointestinal tract 1.40 9.0 555, 556, 557, 560, 562
Transplant 1.26 0.4 V42, V58.44, 996.8 Kidney disease, acute/chronic 1.26 18.0 584-586, 996.73, 285.21
Liver, gallbladder, pancreas 1.21 8.7 570-578HIV infection and disease 1.14 1.0 042
Respiratory failure 1.19 5.2 518.5,518.8,519.0, 997.31,V46.1, V55.0 1 Only primary diagnosis code. 2Any present on admission diagnosis code. Reference group for each of these factors is patients without any of the diagnosis codes. Model c-statistic= 0.62.

93
The next step of the adjustment process was based on the number of HO cases, admissions, and patient days reported to NHSN by each hospital each year. The proportion of days at risk was estimated by substituting average length of stay (NHSN patient days divided by admissions) into ‘LOS’ in the equation in Figure 17. Days at risk were then calculated by multiplying this proportion by the number of patient days reported to NHSN. A Poisson regression model was developed to predict the number of HO cases in each hospital in each year based on laboratory testing method (a continuous variable representing the percent of days in the year using a sensitive test), hospital CDI risk index for the previous year, and days at risk for CDI.
In 2013, hospitals that used more sensitive laboratory tests had HO rates 1.5 times higher than hospitals that used less sensitive tests; and
Each five unit increase in risk index increased the predicted HO rate 1.7 times. Each hospital’s risk adjusted rate was calculated as the number of observed infections divided by the number of predicted infections, multiplied by the state average (last column of Figure 16). There are some limitations to this risk adjustment method. First, diagnosis codes are recorded in SPARCS for billing rather than surveillance purposes, and there may be variations in how these codes, as well as the associated present on admission indicators, are recorded across hospitals. Second, the model only predicts CDI from the SPARCS data marginally well. The model does not account for some factors that may be related to a person’s risk for developing CDI, such as recent antibiotic use. Hospitals were flagged as having adjusted rates significantly higher or lower than the state average if the 99% confidence interval excluded the state average HO rate. The more conservative 99% confidence interval was selected for this indicator due to the previously mentioned model limitations. In 2013, 18 hospitals (11%) were flagged with adjusted rates significantly higher than the state average, and 23 hospitals (14%) were flagged significantly lower than average (Figure 18).
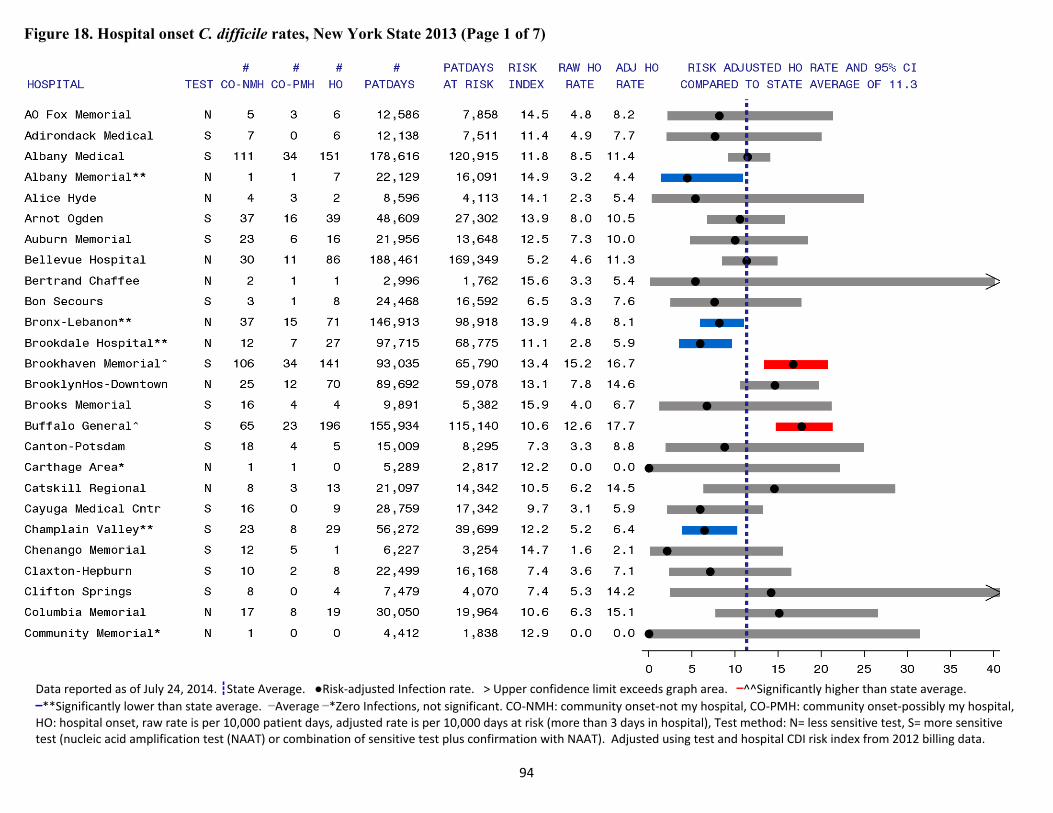
94
Figure 18. Hospital onset C. difficile rates, New York State 2013 (Page 1 of 7)
Data reported as of July 24, 2014. ┇State Average. ●Risk‐adjusted Infection rate. > Upper confidence limit exceeds graph area. ▬^^Significantly higher than state average.
▬**Significantly lower than state average. ▬Average ▬*Zero Infections, not significant. CO‐NMH: community onset‐not my hospital, CO‐PMH: community onset‐possibly my hospital, HO: hospital onset, raw rate is per 10,000 patient days, adjusted rate is per 10,000 days at risk (more than 3 days in hospital), Test method: N= less sensitive test, S= more sensitive test (nucleic acid amplification test (NAAT) or combination of sensitive test plus confirmation with NAAT). Adjusted using test and hospital CDI risk index from 2012 billing data.
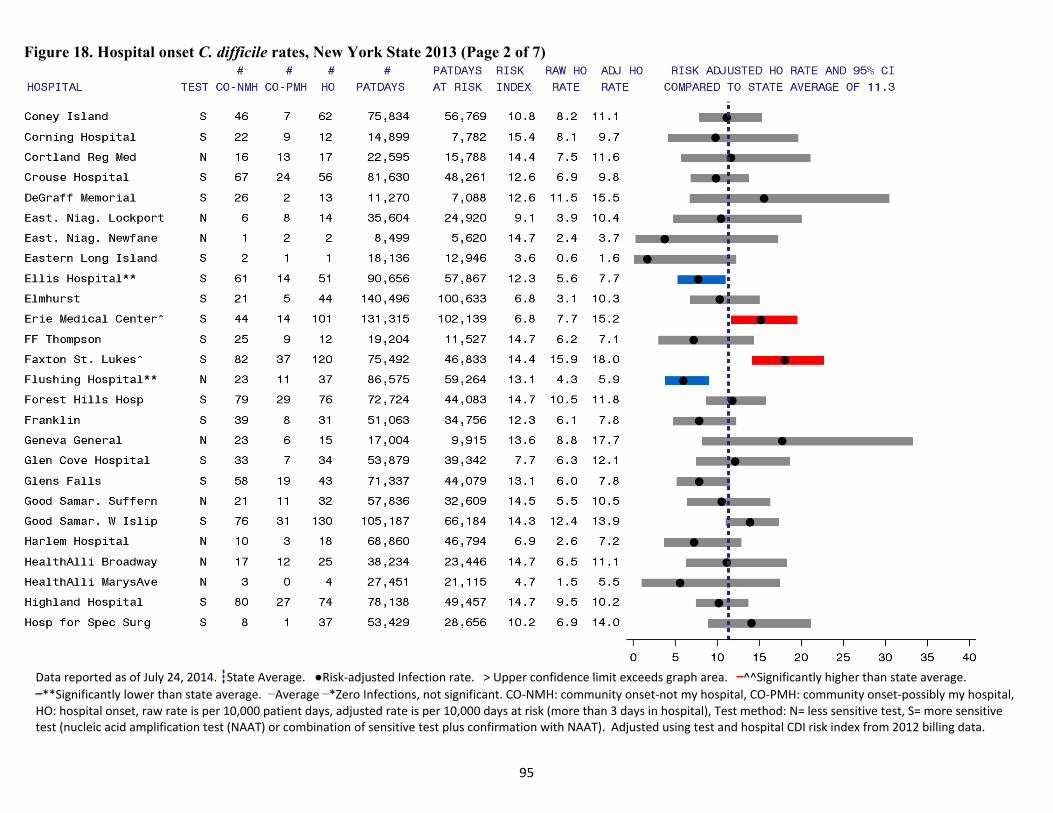
95
Figure 18. Hospital onset C. difficile rates, New York State 2013 (Page 2 of 7)
Data reported as of July 24, 2014. ┇State Average. ●Risk‐adjusted Infection rate. > Upper confidence limit exceeds graph area. ▬^^Significantly higher than state average.
▬**Significantly lower than state average. ▬Average ▬*Zero Infections, not significant. CO‐NMH: community onset‐not my hospital, CO‐PMH: community onset‐possibly my hospital, HO: hospital onset, raw rate is per 10,000 patient days, adjusted rate is per 10,000 days at risk (more than 3 days in hospital), Test method: N= less sensitive test, S= more sensitive test (nucleic acid amplification test (NAAT) or combination of sensitive test plus confirmation with NAAT). Adjusted using test and hospital CDI risk index from 2012 billing data.
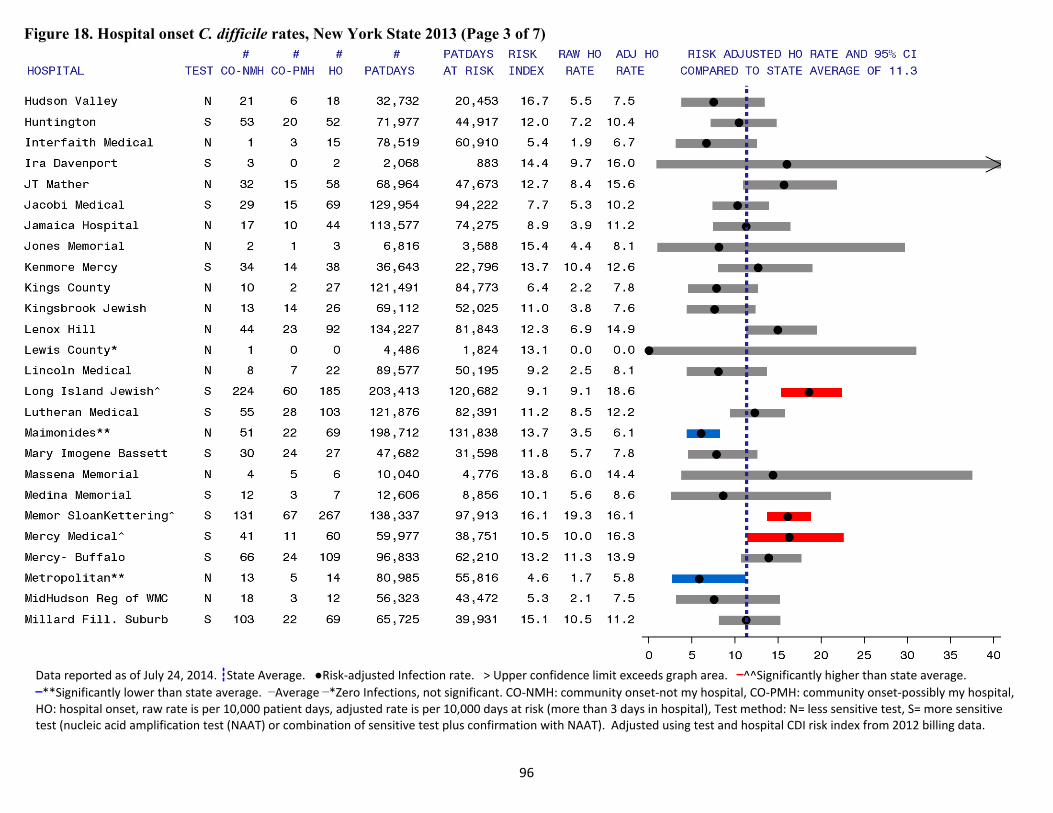
96
Figure 18. Hospital onset C. difficile rates, New York State 2013 (Page 3 of 7)
Data reported as of July 24, 2014. ┇State Average. ●Risk‐adjusted Infection rate. > Upper confidence limit exceeds graph area. ▬^^Significantly higher than state average.
▬**Significantly lower than state average. ▬Average ▬*Zero Infections, not significant. CO‐NMH: community onset‐not my hospital, CO‐PMH: community onset‐possibly my hospital, HO: hospital onset, raw rate is per 10,000 patient days, adjusted rate is per 10,000 days at risk (more than 3 days in hospital), Test method: N= less sensitive test, S= more sensitive test (nucleic acid amplification test (NAAT) or combination of sensitive test plus confirmation with NAAT). Adjusted using test and hospital CDI risk index from 2012 billing data.
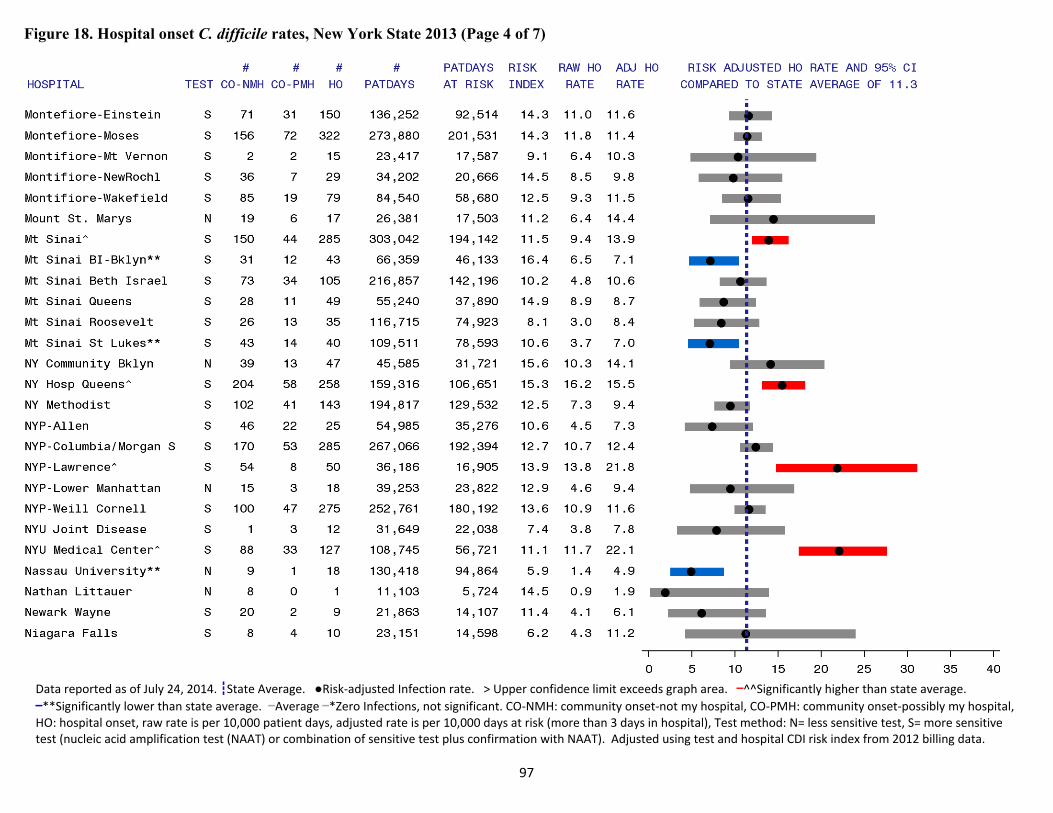
97
Figure 18. Hospital onset C. difficile rates, New York State 2013 (Page 4 of 7)
Data reported as of July 24, 2014. ┇State Average. ●Risk‐adjusted Infection rate. > Upper confidence limit exceeds graph area. ▬^^Significantly higher than state average.
▬**Significantly lower than state average. ▬Average ▬*Zero Infections, not significant. CO‐NMH: community onset‐not my hospital, CO‐PMH: community onset‐possibly my hospital, HO: hospital onset, raw rate is per 10,000 patient days, adjusted rate is per 10,000 days at risk (more than 3 days in hospital), Test method: N= less sensitive test, S= more sensitive test (nucleic acid amplification test (NAAT) or combination of sensitive test plus confirmation with NAAT). Adjusted using test and hospital CDI risk index from 2012 billing data.
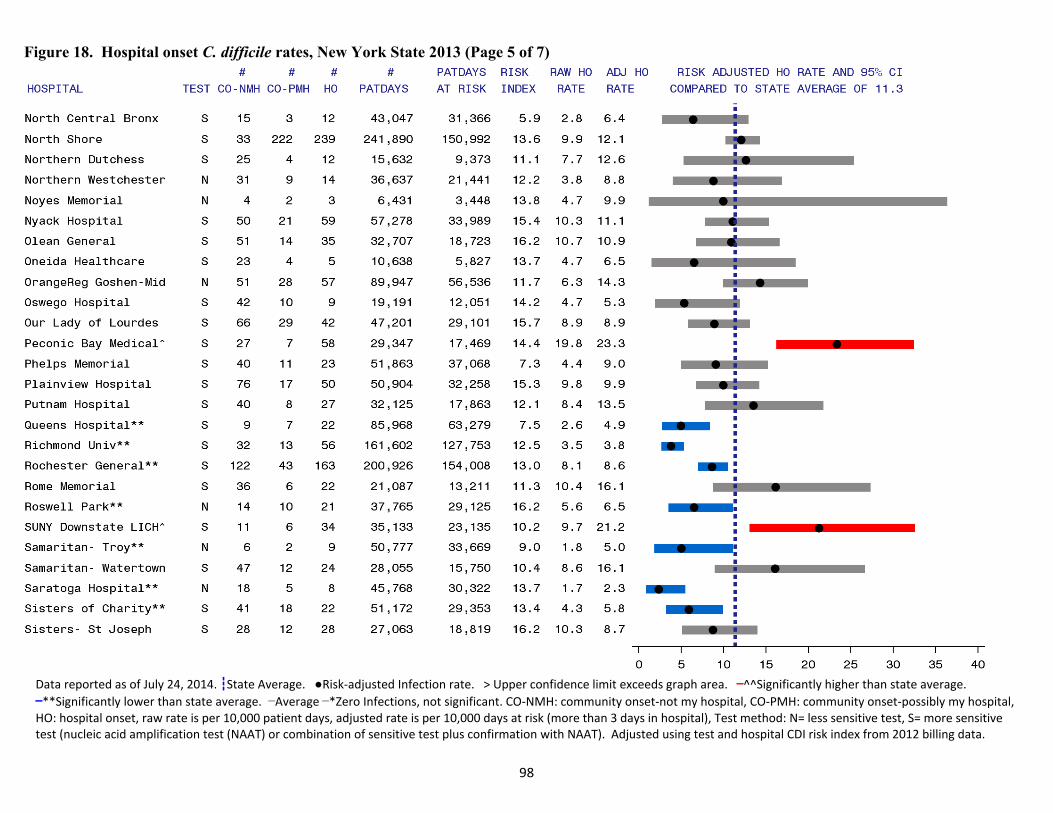
98
Figure 18. Hospital onset C. difficile rates, New York State 2013 (Page 5 of 7)
Data reported as of July 24, 2014. ┇State Average. ●Risk‐adjusted Infection rate. > Upper confidence limit exceeds graph area. ▬^^Significantly higher than state average.
▬**Significantly lower than state average. ▬Average ▬*Zero Infections, not significant. CO‐NMH: community onset‐not my hospital, CO‐PMH: community onset‐possibly my hospital, HO: hospital onset, raw rate is per 10,000 patient days, adjusted rate is per 10,000 days at risk (more than 3 days in hospital), Test method: N= less sensitive test, S= more sensitive test (nucleic acid amplification test (NAAT) or combination of sensitive test plus confirmation with NAAT). Adjusted using test and hospital CDI risk index from 2012 billing data.
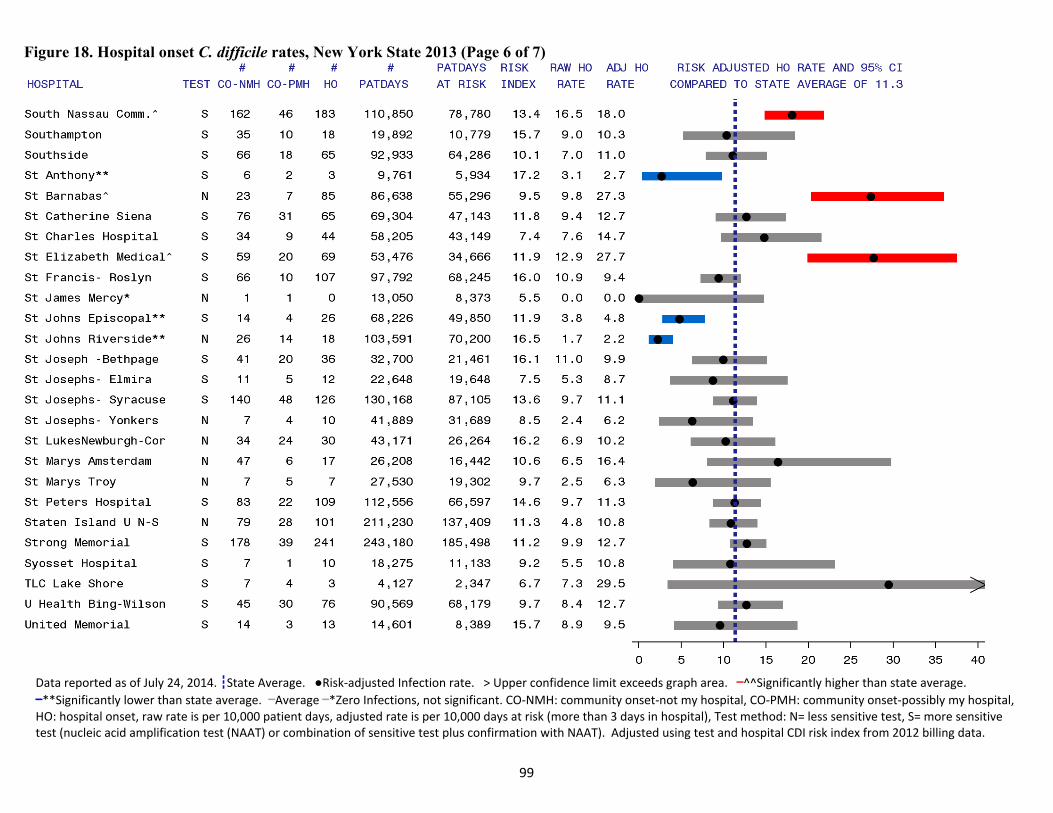
99
Figure 18. Hospital onset C. difficile rates, New York State 2013 (Page 6 of 7)
Data reported as of July 24, 2014. ┇State Average. ●Risk‐adjusted Infection rate. > Upper confidence limit exceeds graph area. ▬^^Significantly higher than state average.
▬**Significantly lower than state average. ▬Average ▬*Zero Infections, not significant. CO‐NMH: community onset‐not my hospital, CO‐PMH: community onset‐possibly my hospital, HO: hospital onset, raw rate is per 10,000 patient days, adjusted rate is per 10,000 days at risk (more than 3 days in hospital), Test method: N= less sensitive test, S= more sensitive test (nucleic acid amplification test (NAAT) or combination of sensitive test plus confirmation with NAAT). Adjusted using test and hospital CDI risk index from 2012 billing data.
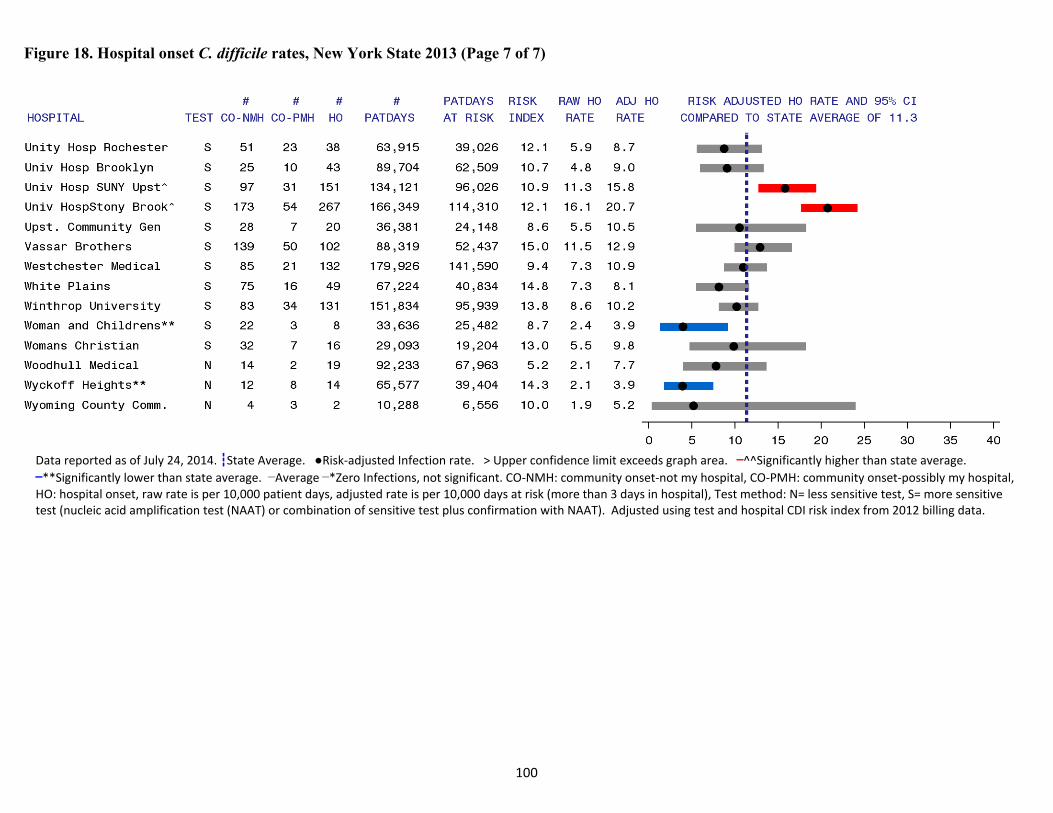
100
Figure 18. Hospital onset C. difficile rates, New York State 2013 (Page 7 of 7)
Data reported as of July 24, 2014. ┇State Average. ●Risk‐adjusted Infection rate. > Upper confidence limit exceeds graph area. ▬^^Significantly higher than state average.
▬**Significantly lower than state average. ▬Average ▬*Zero Infections, not significant. CO‐NMH: community onset‐not my hospital, CO‐PMH: community onset‐possibly my hospital, HO: hospital onset, raw rate is per 10,000 patient days, adjusted rate is per 10,000 days at risk (more than 3 days in hospital), Test method: N= less sensitive test, S= more sensitive test (nucleic acid amplification test (NAAT) or combination of sensitive test plus confirmation with NAAT). Adjusted using test and hospital CDI risk index from 2012 billing data.
101
C.difficilePreventionSurvey
In April 2014, 182 of 183 NY hospitals completed a survey measuring CDI prevention practices. The following are the results.
92% of hospitals place patients with unexplained diarrhea on contact precautions prior to laboratory confirmation of CDI. Contact precautions, such as wearing gown and gloves, decrease the risk that germs are spread.
63% of hospitals always place CDI patients in private rooms because all patient rooms in the facility are private (7%) or they are always able to make or find private rooms (56%). An additional 34% place the patients in private rooms if they are available. If private rooms are not available, hospitals group CDI patients together.
77% of hospitals use unique CDI contact precautions signs. Signs can help alert visitors, healthcare workers, and cleaning staff to hospital policy.
94% of hospitals have an education, orientation, or training program for staff on reducing transmission of CDI. All staff must know how to correctly and consistently apply CDI prevention measures.
92% of hospitals provided infection control training to environmental services staff within the last year. It is vital that cleaning staff know and use an appropriate method to clean rooms contaminated with C. difficile.
22% of hospitals use bleach-based surface disinfectant, and 68% of hospitals use quaternary ammonium-based surface disinfectant for daily room cleaning in non-isolation areas. Bleach kills C. difficile spores; quaternary ammonium does not.
91% of hospitals use bleach-based surface disinfectant or hydrogen peroxide-based surface disinfectant to clean isolation rooms, either daily or on discharge. The remainder use quaternary ammonium or phenolic-based surface disinfection, which are not effective in killing C. difficile spores.
18% of hospitals use ultraviolet light, aerosolized hydrogen peroxide, or hydrogen peroxide vapor room treatment during outbreaks. These new cleaning methods may be able to kill C. difficile spores in difficult to clean places.
Hospitals monitor the effectiveness of environmental disinfection using several methods. o 87% directly observe room cleaning using a checklist o 38% use adenosine triphosphate o 27% use fluorescing product
Monitoring cleaning can identify processes that need improvement and result in improved cleaning practices.

102
MultidrugResistantOrganisms(MDROs)
Multidrug resistant organisms (MDROs) are bacteria that cannot be treated with commonly used antibiotics. Examples of MDROs that may affect hospitalized patients include:
carbapenem-resistant Enterobacteriaceae (CRE)
methicillin-resistant Staphylococcus aureus (MRSA)
vancomycin-resistant Enterococci (VRE)
multidrug resistant Acinetobacter spp. (MDR-Acinetobacter).
MDROs are important to monitor because they can spread among patients in hospital settings, and there are fewer treatment options, which results in increased morbidity and mortality. These MDROs can be tracked using the NHSN inpatient Laboratory-Identified event (LabID) protocol. LabID cases are separated into reporting categories depending upon whether the onset of illness is presumed to have occurred in the community or in a hospital. Cases termed “community-onset (CO)” are cases in which the positive specimen was obtained during the first three days of the patient’s hospital admission. Hospital-onset (HO) cases are cases in which the positive specimen was obtained on day four or later during the hospital stay (Figure 19). Figure 19. Definition of community and hospital onset
Community onset Hospital onset
Day 1 (Admission)
Day 2 Day 3 Day 4 Day 5 Day 6 Day 7+
103
Carbapenem‐resistantEnterobacteriaceaeInfections(CRE) The Enterobacteriaceae are a large family of bacteria. Some of these organisms are normally found in the human gastrointestinal tract; others live mainly in soil and water. When these organisms are living in the gastrointestinal tract they do not cause harm and can help with necessary digestive functions. They are able to cause infections if they are spread to other locations in the body (e.g. through surgery or trauma) or are introduced into other body sites by contact with an infected person or contaminated surface. CRE cannot be effectively treated with antibiotics called carbapenems, which are a type of antibiotic of last resort. Healthy people do not typically get infections with CRE. These organisms are most commonly identified in hospitalized patients. Risk factors for developing CRE infections include diagnosis with multiple medical conditions, treatment with a long course of antibiotics, use of indwelling medical devices, and repeated inpatient medical care. CRE are increasingly causing HAIs in many parts of the world. As of 2013, cases have been identified in forty US states and twenty-five countries on five continents.10 The specific types of CRE that are tracked by NYSDOH are E. coli and Klebsiella spp. CRE is monitored because it is a relatively new pathogen, it has been increasing ever since it was first identified, and it can be responsible for high mortality rates. In addition, CRE can pass their antibiotic resistance mechanisms to other types of bacteria, making new species resistant to carbapenem treatment as well. It is important for medical and public health professionals to know how common CRE is in the state so efforts can be taken to prevent its continued spread. Carbapenems are considered last resort antibiotics by medical professionals. These antibiotics are only used when other antibiotics cannot be used. As antimicrobial resistance becomes a larger problem, last resort antibiotics like carbapenems have to be used more often. When carbapenems cannot be used to treat an infection, the alternative therapies can be dangerous for the patient. In some cases no alternative treatment is available. Bloodstream infections with CRE have been reported to have attributable mortality rates of 27% to 50%.11,12 CRE has emerged as a serious public health threat in New York State. While some hospitals have never reported a case, downstate hospitals, especially in New York City, carry a very high burden of CRE. Although the problem of CRE in New York is very serious, it is important to note that these infections can be prevented, and their spread in health care facilities can be stopped. Successful campaigns to stop the spread of CRE have been undertaken both in the US and internationally. Israel offers an excellent example of a CRE prevention success story. In 2006, Israel faced an ongoing CRE outbreak in its hospitals. Control measures at individual hospitals did little to reduce the rates of CRE. In order to stop the spread of the pathogen, a government sponsored task force was created to oversee the containment of CRE. This task force evaluated infection
104
control and laboratory policies for individual hospitals and performed site visits to observe prevention practices and staff behaviors. Feedback on these evaluations and visits was offered to the administration of each hospital, and necessary changes or improvements were initiated. A direct connection was observed between compliance with isolation guidelines and reducing the spread of CRE.13 The main lesson from the experiences in Israel is the need for a coordinated effort to reduce CRE. Studies from the US have also shown how application of the CDC recommendations in the 2012 CRE Toolkit - Guidance for Control of Carbapenem-resistant Enterobacteriaceae (CRE) are successful in reducing the burden of CRE and other MDROs in hospitals.14 The first step to stopping CRE in NYS is to understand the true scope of the problem. In order to obtain baseline rates, NYS required that all hospitals report LabID CRE-E. coli and CRE-Klebsiella spp. beginning in July 2013. July 2013 through December 2013 was considered a pilot reporting period. This time period provided NYSDOH the opportunity to ensure the accuracy and completeness of reporting, assess variation in CRE rates, and explore the relationship between differences in laboratory testing methods and CRE rates. Preliminary regional rates and infection surveillance and prevention recommendations were shared with all hospitals via regional conference calls in January and February 2014. CRE became a fully-reportable required indicator in January 2014, and NYSDOH plans to provide individual hospital rates in the next annual report. The goals of the reporting requirement and surveillance efforts are to stop the spread of CRE in affected areas and to prevent the spread of CRE to areas that have not yet seen any cases. Table 24 summarizes the statewide prevalence and incidence rates for CRE, annualized to represent all of 2013. The majority of reported CRE cases in NYS are CRE-Klebsiella spp. (92%). This finding is consistent with previously reported data; emergence of carbapenemase-producing strains is especially likely among Klebsiella spp.15 The most common CRE infection sites were the urinary tract (49%), respiratory system (20%), bloodstream (13%), and skin/soft tissue (12%). Bloodstream infections have the highest mortality rate. The overall incidence of HO BSIs was 0.22 per 10,000 patient days. .
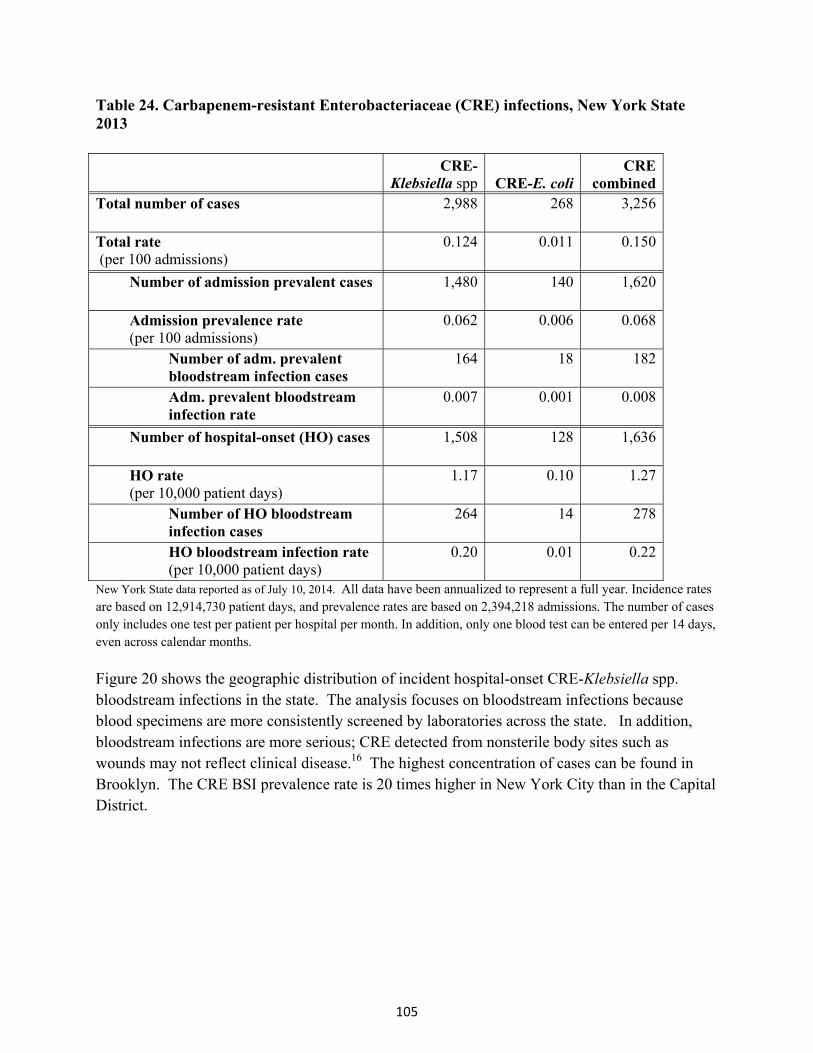
105
Table 24. Carbapenem-resistant Enterobacteriaceae (CRE) infections, New York State 2013 CRE-
Klebsiella spp CRE-E. coli CRE
combinedTotal number of cases 2,988 268 3,256
Total rate (per 100 admissions)
0.124 0.011 0.150
Number of admission prevalent cases 1,480 140 1,620
Admission prevalence rate (per 100 admissions)
0.062 0.006 0.068
Number of adm. prevalent bloodstream infection cases
164 18 182
Adm. prevalent bloodstream infection rate
0.007 0.001 0.008
Number of hospital-onset (HO) cases 1,508 128 1,636
HO rate (per 10,000 patient days)
1.17 0.10 1.27
Number of HO bloodstream infection cases
264 14 278
HO bloodstream infection rate (per 10,000 patient days)
0.20 0.01 0.22
New York State data reported as of July 10, 2014. All data have been annualized to represent a full year. Incidence rates are based on 12,914,730 patient days, and prevalence rates are based on 2,394,218 admissions. The number of cases only includes one test per patient per hospital per month. In addition, only one blood test can be entered per 14 days, even across calendar months.
Figure 20 shows the geographic distribution of incident hospital-onset CRE-Klebsiella spp. bloodstream infections in the state. The analysis focuses on bloodstream infections because blood specimens are more consistently screened by laboratories across the state. In addition, bloodstream infections are more serious; CRE detected from nonsterile body sites such as wounds may not reflect clinical disease.16 The highest concentration of cases can be found in Brooklyn. The CRE BSI prevalence rate is 20 times higher in New York City than in the Capital District.

106
Figure 20. Carbapenem-resistant Klebsiella spp. bloodstream infection incidence, New York State 2013
Laboratory Survey Along with collecting the surveillance data presented above, DOH also surveyed hospitals to determine how each facility identifies CRE cases. The purpose of the survey was to verify that surveillance data is as accurate as possible. When conducting surveillance it is important for all reporting facilities to follow the same guidelines to be sure that the data are comparable across various locations. The laboratory survey identified a few areas for potential improvement in the surveillance of CRE. Questions were asked on the laboratory survey to identify whether or not it is likely that cases of CRE could be missed by routine laboratory practice. Many hospital laboratories (52%) screen all potential enteric organisms to identify E. coli or Klebsiella spp. Most laboratories (64%) also screen all identified enteric organisms for resistance to carbapenems. It is possible for cases of CRE to be missed by those facilities that do not screen all cultures either for identification as an
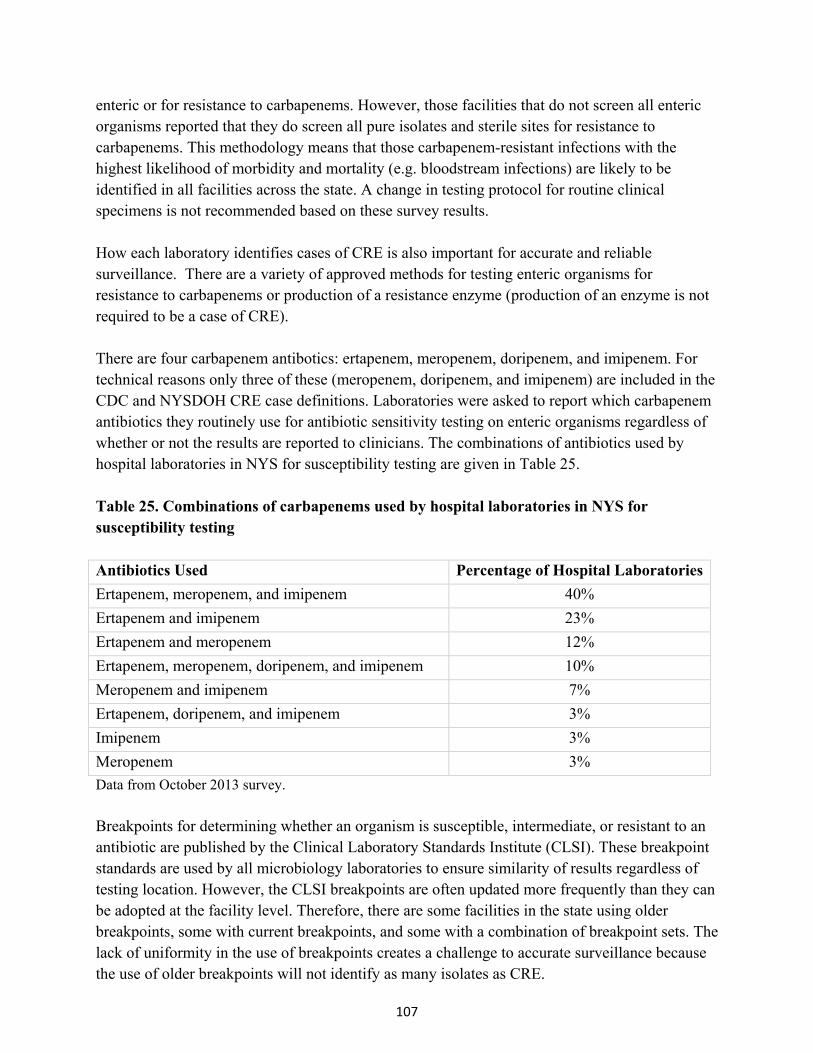
107
enteric or for resistance to carbapenems. However, those facilities that do not screen all enteric organisms reported that they do screen all pure isolates and sterile sites for resistance to carbapenems. This methodology means that those carbapenem-resistant infections with the highest likelihood of morbidity and mortality (e.g. bloodstream infections) are likely to be identified in all facilities across the state. A change in testing protocol for routine clinical specimens is not recommended based on these survey results. How each laboratory identifies cases of CRE is also important for accurate and reliable surveillance. There are a variety of approved methods for testing enteric organisms for resistance to carbapenems or production of a resistance enzyme (production of an enzyme is not required to be a case of CRE). There are four carbapenem antibotics: ertapenem, meropenem, doripenem, and imipenem. For technical reasons only three of these (meropenem, doripenem, and imipenem) are included in the CDC and NYSDOH CRE case definitions. Laboratories were asked to report which carbapenem antibiotics they routinely use for antibiotic sensitivity testing on enteric organisms regardless of whether or not the results are reported to clinicians. The combinations of antibiotics used by hospital laboratories in NYS for susceptibility testing are given in Table 25. Table 25. Combinations of carbapenems used by hospital laboratories in NYS for susceptibility testing Antibiotics Used Percentage of Hospital Laboratories
Ertapenem, meropenem, and imipenem 40%
Ertapenem and imipenem 23%
Ertapenem and meropenem 12%
Ertapenem, meropenem, doripenem, and imipenem 10%
Meropenem and imipenem 7%
Ertapenem, doripenem, and imipenem 3%
Imipenem 3%
Meropenem 3%
Data from October 2013 survey.
Breakpoints for determining whether an organism is susceptible, intermediate, or resistant to an antibiotic are published by the Clinical Laboratory Standards Institute (CLSI). These breakpoint standards are used by all microbiology laboratories to ensure similarity of results regardless of testing location. However, the CLSI breakpoints are often updated more frequently than they can be adopted at the facility level. Therefore, there are some facilities in the state using older breakpoints, some with current breakpoints, and some with a combination of breakpoint sets. The lack of uniformity in the use of breakpoints creates a challenge to accurate surveillance because the use of older breakpoints will not identify as many isolates as CRE.
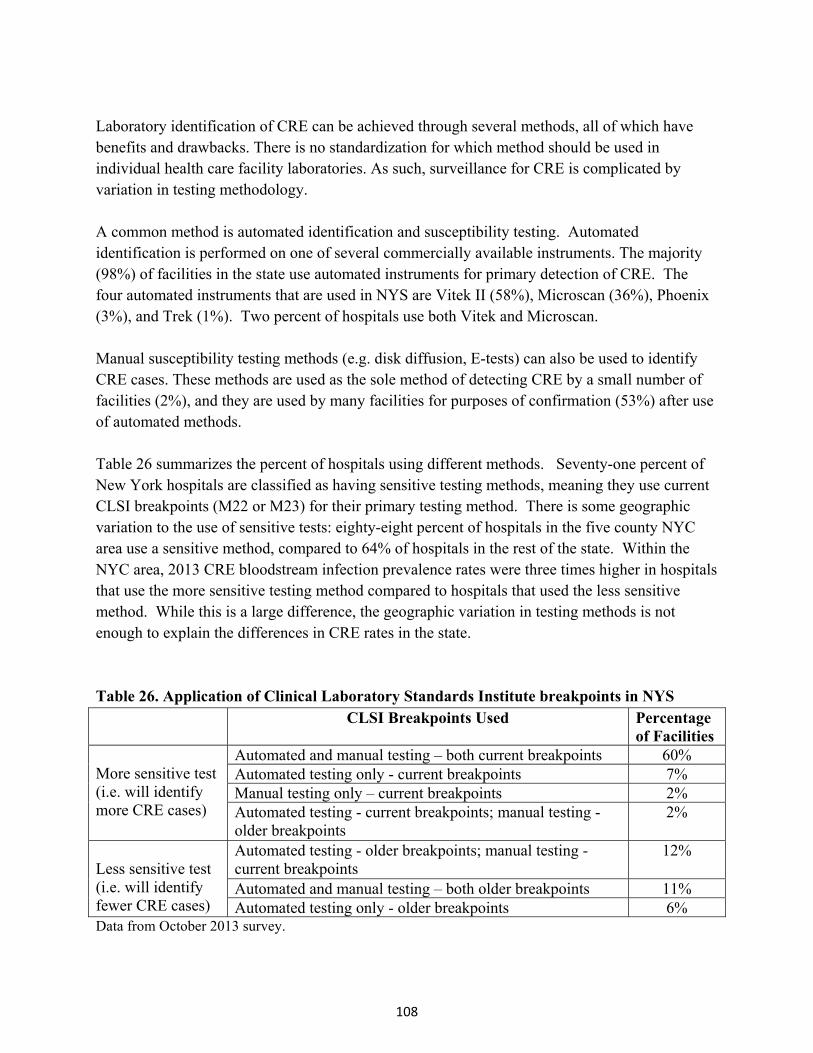
108
Laboratory identification of CRE can be achieved through several methods, all of which have benefits and drawbacks. There is no standardization for which method should be used in individual health care facility laboratories. As such, surveillance for CRE is complicated by variation in testing methodology. A common method is automated identification and susceptibility testing. Automated identification is performed on one of several commercially available instruments. The majority (98%) of facilities in the state use automated instruments for primary detection of CRE. The four automated instruments that are used in NYS are Vitek II (58%), Microscan (36%), Phoenix (3%), and Trek (1%). Two percent of hospitals use both Vitek and Microscan. Manual susceptibility testing methods (e.g. disk diffusion, E-tests) can also be used to identify CRE cases. These methods are used as the sole method of detecting CRE by a small number of facilities (2%), and they are used by many facilities for purposes of confirmation (53%) after use of automated methods. Table 26 summarizes the percent of hospitals using different methods. Seventy-one percent of New York hospitals are classified as having sensitive testing methods, meaning they use current CLSI breakpoints (M22 or M23) for their primary testing method. There is some geographic variation to the use of sensitive tests: eighty-eight percent of hospitals in the five county NYC area use a sensitive method, compared to 64% of hospitals in the rest of the state. Within the NYC area, 2013 CRE bloodstream infection prevalence rates were three times higher in hospitals that use the more sensitive testing method compared to hospitals that used the less sensitive method. While this is a large difference, the geographic variation in testing methods is not enough to explain the differences in CRE rates in the state. Table 26. Application of Clinical Laboratory Standards Institute breakpoints in NYS CLSI Breakpoints Used Percentage
of Facilities More sensitive test (i.e. will identify more CRE cases)
Automated and manual testing – both current breakpoints 60% Automated testing only - current breakpoints 7% Manual testing only – current breakpoints 2% Automated testing - current breakpoints; manual testing - older breakpoints
2%
Less sensitive test (i.e. will identify fewer CRE cases)
Automated testing - older breakpoints; manual testing - current breakpoints
12%
Automated and manual testing – both older breakpoints 11% Automated testing only - older breakpoints 6%
Data from October 2013 survey.
109
Identification of enzymes that bacteria produce that destroy carbapenems, called carbapenemases, can also be used to meet the LabID definition for CRE. Forty-six percent of New York hospitals identify CRE cases by detecting the presence of a carbapenemase. Of the hospitals that test for a carbapenemase, 83% use the culture-based Modified Hodge Test (MHT), 14% use a molecular method called polymerase chain reaction (PCR), and 3% send isolates for confirmation by a reference laboratory. An enzyme must be identified in order to call an organism a carbapenemase producer; however, an organism may show resistance to the carbapenems, and therefore be considered CRE, without producing an enzyme. The methods described above are used by laboratories to differentiate between enzyme-producing CRE and non-enzyme producing CRE.
Challenges Beginning in 2004, several New York City hospitals reported outbreaks of CRE-Klebsiella to NYSDOH. Laboratory analysis showed high similarity of the specimens. In 2005, NYSDOH released an advisory to hospitals and local health departments about the outbreak and CRE-Klebsiella in general, including recommendations about identification, treatment, reporting, and infection control measures. While hospitals have been concerned about CRE for ten years and knowledgeable about infection control practices for longer than that, CRE has continued to spread. Challenges include imperfect compliance with handwashing, delays in implementing contact precautions and appropriately cohorting patients, delays in discontinuing devices when they are no longer needed, and lack of established protocols to screen epidemiologically linked contacts and perform active surveillance testing in high-risk areas.
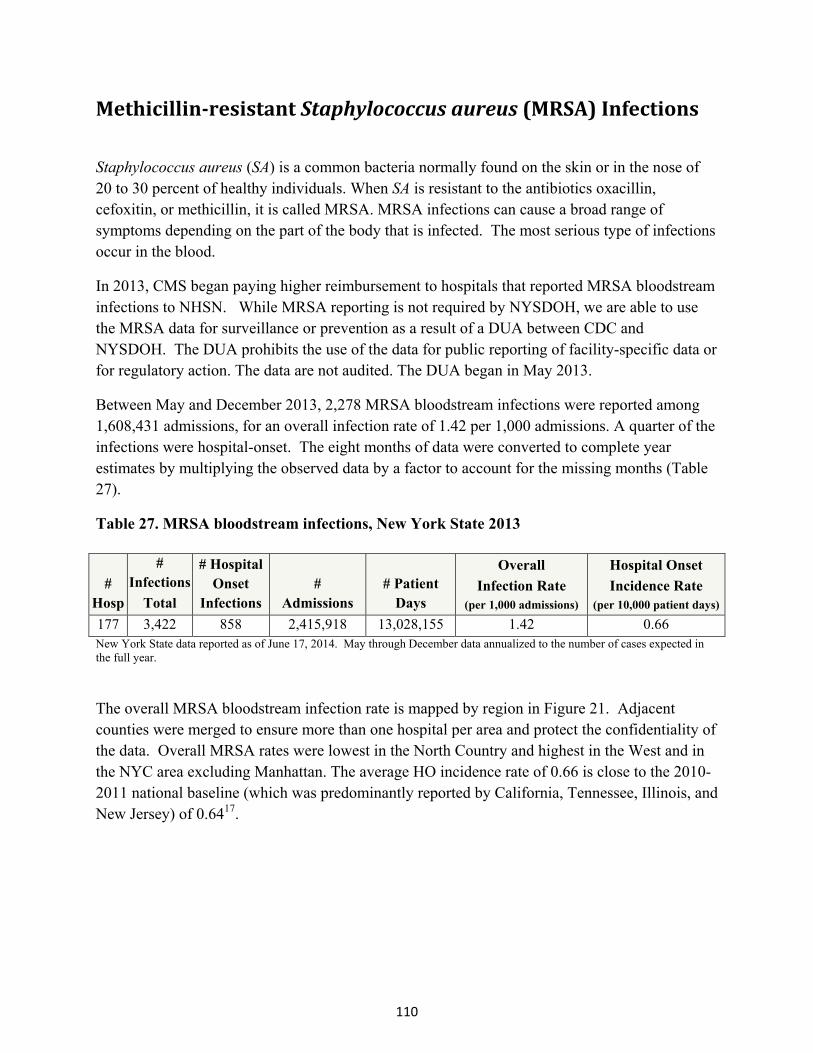
110
Methicillin‐resistantStaphylococcusaureus(MRSA)Infections
Staphylococcus aureus (SA) is a common bacteria normally found on the skin or in the nose of 20 to 30 percent of healthy individuals. When SA is resistant to the antibiotics oxacillin, cefoxitin, or methicillin, it is called MRSA. MRSA infections can cause a broad range of symptoms depending on the part of the body that is infected. The most serious type of infections occur in the blood.
In 2013, CMS began paying higher reimbursement to hospitals that reported MRSA bloodstream infections to NHSN. While MRSA reporting is not required by NYSDOH, we are able to use the MRSA data for surveillance or prevention as a result of a DUA between CDC and NYSDOH. The DUA prohibits the use of the data for public reporting of facility-specific data or for regulatory action. The data are not audited. The DUA began in May 2013.
Between May and December 2013, 2,278 MRSA bloodstream infections were reported among 1,608,431 admissions, for an overall infection rate of 1.42 per 1,000 admissions. A quarter of the infections were hospital-onset. The eight months of data were converted to complete year estimates by multiplying the observed data by a factor to account for the missing months (Table 27).
Table 27. MRSA bloodstream infections, New York State 2013
# Hosp
# Infections
Total
# Hospital Onset
Infections #
Admissions # Patient
Days
Overall
Infection Rate (per 1,000 admissions)
Hospital Onset
Incidence Rate (per 10,000 patient days)
177 3,422 858 2,415,918 13,028,155 1.42 0.66 New York State data reported as of June 17, 2014. May through December data annualized to the number of cases expected in the full year.
The overall MRSA bloodstream infection rate is mapped by region in Figure 21. Adjacent counties were merged to ensure more than one hospital per area and protect the confidentiality of the data. Overall MRSA rates were lowest in the North Country and highest in the West and in the NYC area excluding Manhattan. The average HO incidence rate of 0.66 is close to the 2010-2011 national baseline (which was predominantly reported by California, Tennessee, Illinois, and New Jersey) of 0.6417.

111
Figure 21. MRSA bloodstream infection prevalence, NYS 2013

112
OtherMDROs
Vancomycin‐resistantEnterococci(VRE)
Enterococci are bacteria normally found in the human intestines and female genital tract. These bacteria sometimes cause infections in people who take antibiotics for a long time, have weakened immune systems, are hospitalized, or use catheters. When enterococci are resistant to the antibiotic vancomycin, they are called VRE. If a person has an infection caused by VRE it may be more difficult to treat.
A group of 22 hospitals in NYS (14 in NYC, 8 Upstate) voluntarily performed VRE surveillance using NHSN in 2013. A total of 359 cases were reported among 159,231 admissions. The majority (62%) were urinary tract infections, while 20% were skin/soft tissue infections, and 9% were bloodstream infections. Cases were hospital-onset 56% of the time. The HO BSI incidence rate was 0.22 per 10,000 patient days. Extrapolating this small sample (only 13% of hospitals), we would have expected a total of approximately 510 VRE BSIs if all hospitals had reported for the entire year. However, the hospitals that voluntarily report may not be representative of all NYS hospitals.
Multi‐drugresistantAcinetobacter(MDR‐Acinetobacter)
Acinetobacter is a type of bacteria commonly found in soil and water, and sometimes on the skin. These bacteria sometimes cause infections such as pneumonia, and patients on ventilators are particularly at risk. When Acinetobacter are non-susceptible to at least one agent in at least three of the following antimicrobial classes (beta‐lactams, aminoglycosides, carbapenems, fluoroquinolones, cephalosporins, sulbactam), they are called MDR-Acinetobacter. If a person has an infection caused by MDR-Acinetobacter it may be more difficult to treat.
A group of 38 hospitals in NYS (21 in NYC, 17 Upstate) voluntarily performed MDR-Acinetobacter surveillance using NHSN in 2013. A total of 173 cases were reported among 222,974 admissions. The majority (62%) were respiratory tract infections, while 18% were skin/soft tissue infections, 10% were urinary tract infections, and 8% were bloodstream infections. Cases were hospital-onset 58% of the time. The HO BSI incidence rate was 0.07 per 10,000 patient days. Extrapolating this small sample (only 22% of hospitals), we would have expected a total of approximately 140 MDR-AB BSIs if all hospitals had reported for the entire year. Again, it is not possible to know if these hospitals are representative of all NYS hospitals.
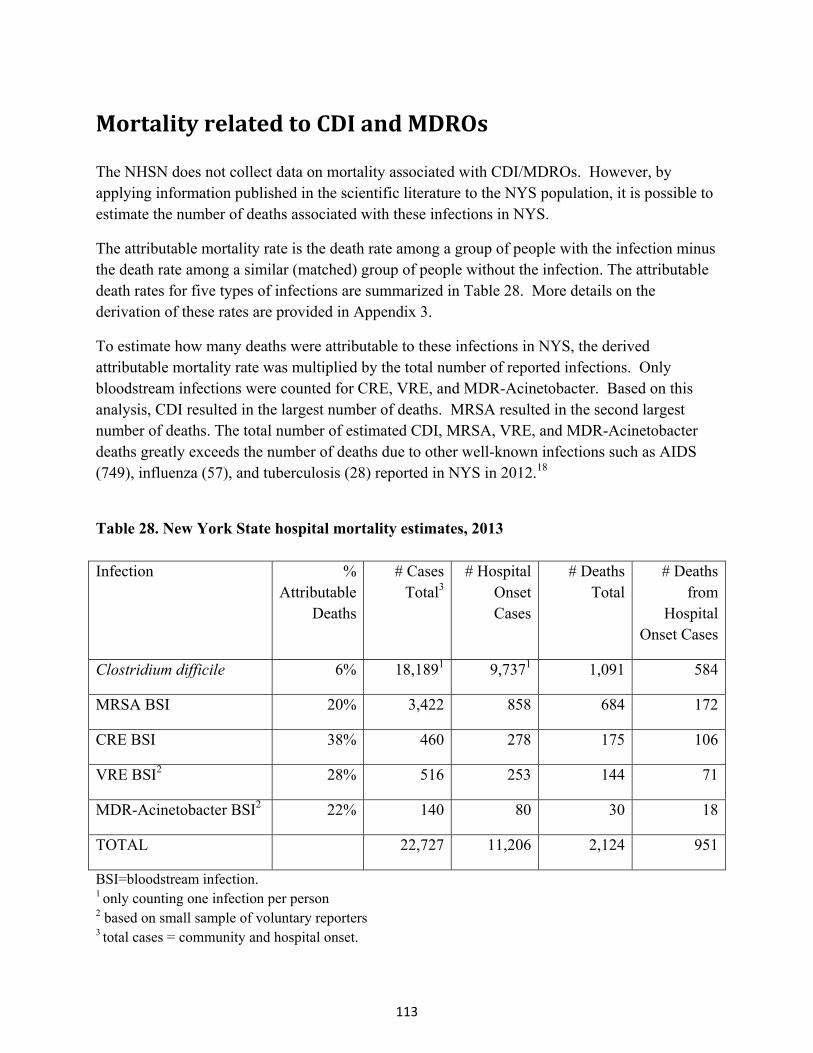
113
MortalityrelatedtoCDIandMDROs The NHSN does not collect data on mortality associated with CDI/MDROs. However, by applying information published in the scientific literature to the NYS population, it is possible to estimate the number of deaths associated with these infections in NYS.
The attributable mortality rate is the death rate among a group of people with the infection minus the death rate among a similar (matched) group of people without the infection. The attributable death rates for five types of infections are summarized in Table 28. More details on the derivation of these rates are provided in Appendix 3.
To estimate how many deaths were attributable to these infections in NYS, the derived attributable mortality rate was multiplied by the total number of reported infections. Only bloodstream infections were counted for CRE, VRE, and MDR-Acinetobacter. Based on this analysis, CDI resulted in the largest number of deaths. MRSA resulted in the second largest number of deaths. The total number of estimated CDI, MRSA, VRE, and MDR-Acinetobacter deaths greatly exceeds the number of deaths due to other well-known infections such as AIDS (749), influenza (57), and tuberculosis (28) reported in NYS in 2012.18
Table 28. New York State hospital mortality estimates, 2013 Infection %
Attributable Deaths
# Cases Total3
# Hospital Onset Cases
# Deaths Total
# Deaths from
Hospital Onset Cases
Clostridium difficile 6% 18,1891 9,7371 1,091 584
MRSA BSI 20% 3,422 858 684 172
CRE BSI 38% 460 278 175 106
VRE BSI2 28% 516 253 144 71
MDR-Acinetobacter BSI2 22% 140 80 30 18
TOTAL 22,727 11,206 2,124 951
BSI=bloodstream infection. 1 only counting one infection per person 2 based on small sample of voluntary reporters 3 total cases = community and hospital onset.
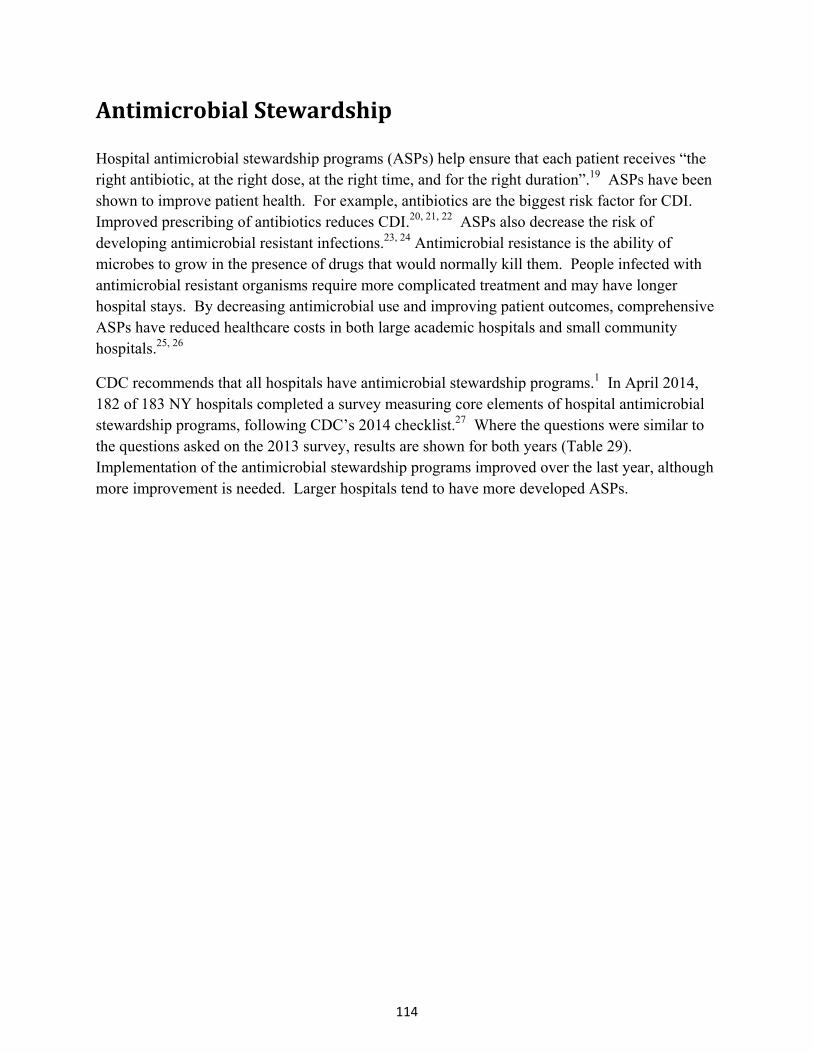
114
AntimicrobialStewardship Hospital antimicrobial stewardship programs (ASPs) help ensure that each patient receives “the right antibiotic, at the right dose, at the right time, and for the right duration”.19 ASPs have been shown to improve patient health. For example, antibiotics are the biggest risk factor for CDI. Improved prescribing of antibiotics reduces CDI.20, 21, 22 ASPs also decrease the risk of developing antimicrobial resistant infections.23, 24 Antimicrobial resistance is the ability of microbes to grow in the presence of drugs that would normally kill them. People infected with antimicrobial resistant organisms require more complicated treatment and may have longer hospital stays. By decreasing antimicrobial use and improving patient outcomes, comprehensive ASPs have reduced healthcare costs in both large academic hospitals and small community hospitals.25, 26
CDC recommends that all hospitals have antimicrobial stewardship programs.1 In April 2014, 182 of 183 NY hospitals completed a survey measuring core elements of hospital antimicrobial stewardship programs, following CDC’s 2014 checklist.27 Where the questions were similar to the questions asked on the 2013 survey, results are shown for both years (Table 29). Implementation of the antimicrobial stewardship programs improved over the last year, although more improvement is needed. Larger hospitals tend to have more developed ASPs.
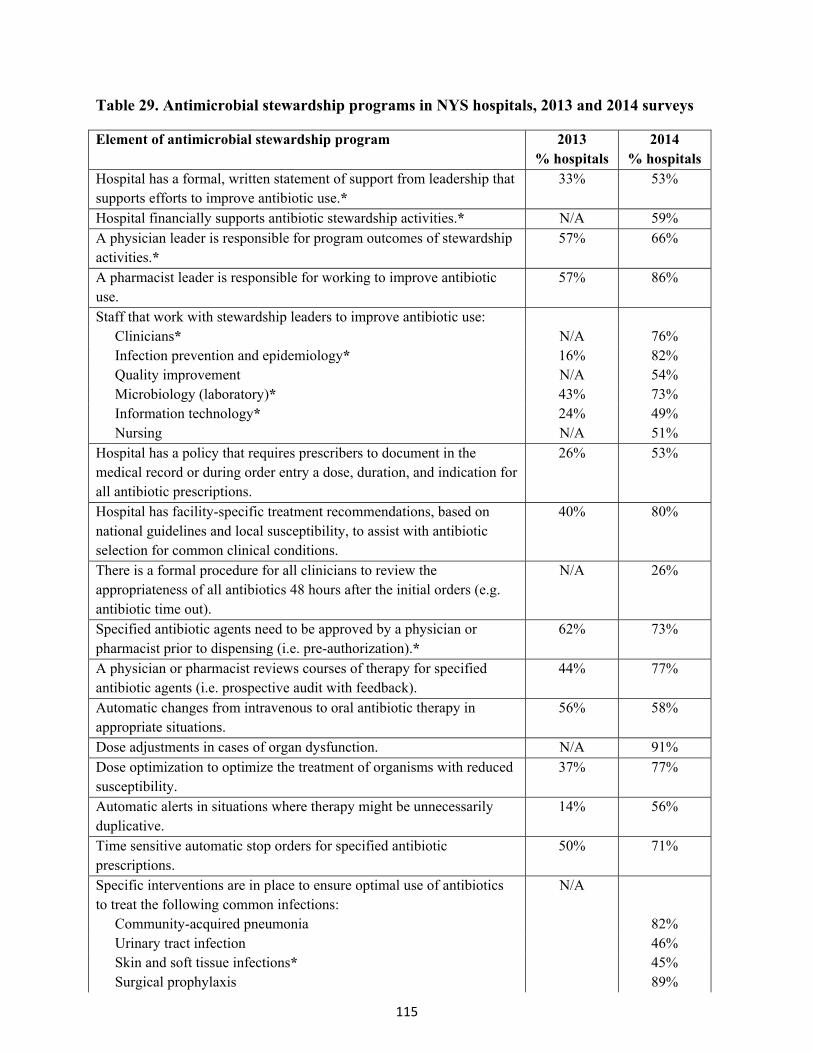
115
Table 29. Antimicrobial stewardship programs in NYS hospitals, 2013 and 2014 surveys
Element of antimicrobial stewardship program 2013 % hospitals
2014 % hospitals
Hospital has a formal, written statement of support from leadership that supports efforts to improve antibiotic use.*
33% 53%
Hospital financially supports antibiotic stewardship activities.* N/A 59% A physician leader is responsible for program outcomes of stewardship activities.*
57% 66%
A pharmacist leader is responsible for working to improve antibiotic use.
57% 86%
Staff that work with stewardship leaders to improve antibiotic use: Clinicians* N/A 76% Infection prevention and epidemiology* 16% 82% Quality improvement N/A 54% Microbiology (laboratory)* 43% 73% Information technology* 24% 49% Nursing N/A 51%
Hospital has a policy that requires prescribers to document in the medical record or during order entry a dose, duration, and indication for all antibiotic prescriptions.
26% 53%
Hospital has facility-specific treatment recommendations, based on national guidelines and local susceptibility, to assist with antibiotic selection for common clinical conditions.
40% 80%
There is a formal procedure for all clinicians to review the appropriateness of all antibiotics 48 hours after the initial orders (e.g. antibiotic time out).
N/A 26%
Specified antibiotic agents need to be approved by a physician or pharmacist prior to dispensing (i.e. pre-authorization).*
62% 73%
A physician or pharmacist reviews courses of therapy for specified antibiotic agents (i.e. prospective audit with feedback).
44% 77%
Automatic changes from intravenous to oral antibiotic therapy in appropriate situations.
56% 58%
Dose adjustments in cases of organ dysfunction. N/A 91% Dose optimization to optimize the treatment of organisms with reduced susceptibility.
37% 77%
Automatic alerts in situations where therapy might be unnecessarily duplicative.
14% 56%
Time sensitive automatic stop orders for specified antibiotic prescriptions.
50% 71%
Specific interventions are in place to ensure optimal use of antibiotics to treat the following common infections:
N/A
Community-acquired pneumonia 82% Urinary tract infection 46% Skin and soft tissue infections* 45% Surgical prophylaxis 89%
116
Empiric treatment of methicillin-resistant Staph. aureus (MRSA) 53% Non-C. difficile infection (CDI) antibiotics in new cases of CDI* 41% Culture-proven invasive (e.g. bloodstream) infections 48%
Stewardship program monitors adherence to a documentation policy (dose, duration, and indication).*
N/A 46%
Stewardship program monitors adherence to facility-specific treatment recommendations.*
N/A 51%
Stewardship program monitors compliance with one of more of the specific interventions in place.*
N/A 52%
Hospital produces an antibiogram. 64% 93% Hospital monitors antibiotic use at the unit and/or facility wide level by one of the following metrics:
Counts of antibiotic(s) administered to patients per day (Days of Therapy; DOT)
N/A 40%
Number of grams of antibiotics used (Defined Daily Dose, DDD) 33% Direct expenditure for antibiotics (purchasing costs)* 69%
Stewardship program shares facility-specific reports on antibiotic use with prescribers.
N/A 48%
Current antibiogram has been distributed to prescribers.* N/A 80% Prescribers receive direct, personalized communication about how they can improve their antibiotic prescribing.
N/A 72%
Stewardship program provides education to clinicians and other relevant staff on improving antibiotic prescribing.*
36% 71%
* Hospitals with larger bed size significantly more likely to have implemented this element (Cochran-Armitage test for trend p-value < 0.05, 2014 data)
NYSDOH recommends that hospitals review their concordance with the above checklist and implement additional program elements based on resources and local infection and resistance patterns. Smaller hospitals may consider establishing an ASP through a cooperative relationship with neighboring hospitals. Resources for hospitals are available at:
http://www.cdc.gov/getsmart/healthcare/
http://www.jointcommission.org/topics/hai_antimicrobial_stewardship.aspx. For patients, the following recommendations can help ensure appropriate antibiotic use:
Take antibiotics exactly as your doctor prescribes. Only take antibiotics prescribed for you – do not share or use leftover antibiotics. Do not ask your doctor for antibiotics when your doctor thinks you do not need them. Ask your doctor what the side effects of the antibiotic are. Ask your doctor if the choice of antibiotic and dose was optimized to your infection and
local resistance patterns. Ask your doctor to reassess the prescription when culture results become available.
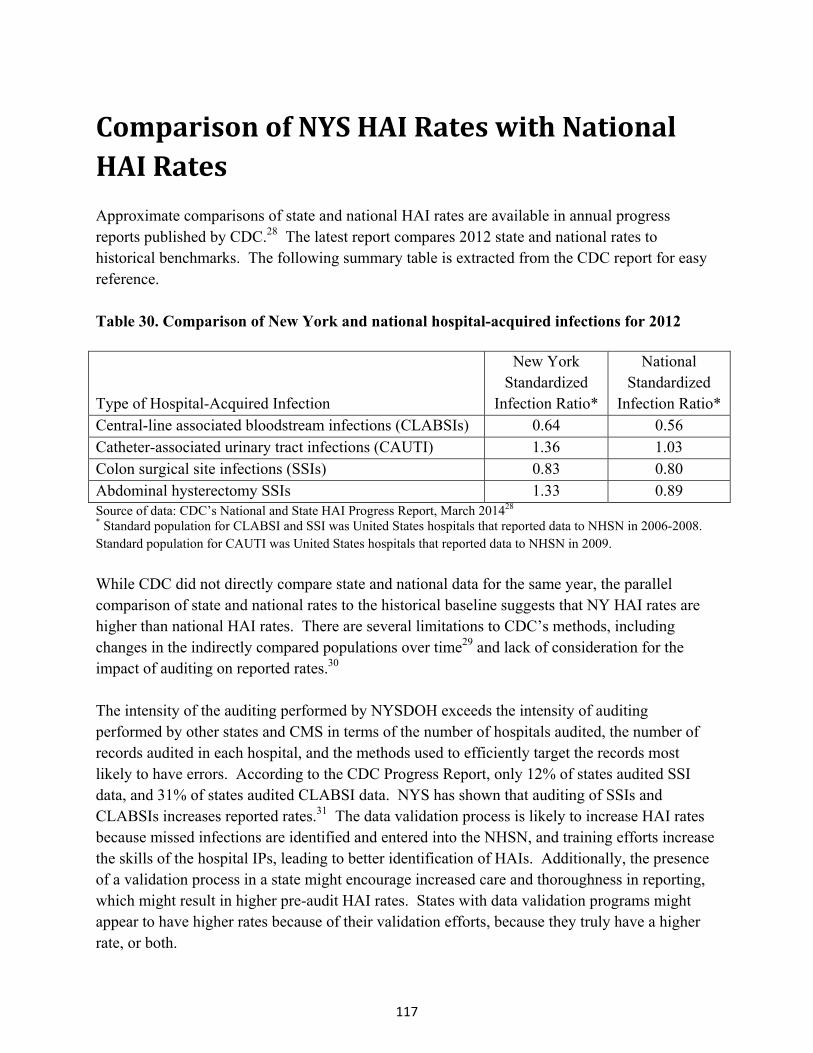
117
ComparisonofNYSHAIRateswithNationalHAIRates Approximate comparisons of state and national HAI rates are available in annual progress reports published by CDC.28 The latest report compares 2012 state and national rates to historical benchmarks. The following summary table is extracted from the CDC report for easy reference. Table 30. Comparison of New York and national hospital-acquired infections for 2012
Type of Hospital-Acquired Infection
New York Standardized
Infection Ratio*
National Standardized
Infection Ratio* Central-line associated bloodstream infections (CLABSIs) 0.64 0.56 Catheter-associated urinary tract infections (CAUTI) 1.36 1.03 Colon surgical site infections (SSIs) 0.83 0.80 Abdominal hysterectomy SSIs 1.33 0.89 Source of data: CDC’s National and State HAI Progress Report, March 201428 * Standard population for CLABSI and SSI was United States hospitals that reported data to NHSN in 2006-2008. Standard population for CAUTI was United States hospitals that reported data to NHSN in 2009.
While CDC did not directly compare state and national data for the same year, the parallel comparison of state and national rates to the historical baseline suggests that NY HAI rates are higher than national HAI rates. There are several limitations to CDC’s methods, including changes in the indirectly compared populations over time29 and lack of consideration for the impact of auditing on reported rates.30 The intensity of the auditing performed by NYSDOH exceeds the intensity of auditing performed by other states and CMS in terms of the number of hospitals audited, the number of records audited in each hospital, and the methods used to efficiently target the records most likely to have errors. According to the CDC Progress Report, only 12% of states audited SSI data, and 31% of states audited CLABSI data. NYS has shown that auditing of SSIs and CLABSIs increases reported rates.31 The data validation process is likely to increase HAI rates because missed infections are identified and entered into the NHSN, and training efforts increase the skills of the hospital IPs, leading to better identification of HAIs. Additionally, the presence of a validation process in a state might encourage increased care and thoroughness in reporting, which might result in higher pre-audit HAI rates. States with data validation programs might appear to have higher rates because of their validation efforts, because they truly have a higher rate, or both.

118
HAIPreventionProjects NYSDOHFundedPreventionProjects NYSDOH funds HAI Prevention Projects with non-profit health care organizations to develop, implement, and evaluate strategies to reduce or eliminate targeted HAIs. The HAI Reporting Program is responsible for the evaluation, selection, and oversight of the projects. A Request for Applications (RFA) for 2013-2018 was issued on October 17th, 2012. The following three projects were funded for five years. University of Rochester Medical Center, Year 1: April 2013-March 2014, $190,000 The goal of this project is to prevent CDI in long term care facilities (LTCFs) through an antimicrobial stewardship program focusing on transition of care. The University of Rochester recruited seven large nursing homes affiliated with four Monroe County hospitals for the collaborative. The LTCFs are in the process of establishing multidisciplinary teams, enrolling in NHSN for CDI reporting, and responding to an antimicrobial stewardship survey that will be used to guide interventions. Evidence-based guidelines for antimicrobial treatment of urinary and respiratory tract infections will be developed. Interventions will include education on the developed guidelines and feedback on compliance, a communication transfer form for antibiotics at time of hospital discharge and feedback on compliance with form use, and feedback to providers regarding specific CDI cases incurred in their own patients following antibiotic treatment. Westchester County Healthcare Corporation, Year 1: April 2013-March 2014, $194,622: The purpose of this project is to define the clinical features and molecular epidemiology of hospital-onset CDI in six diverse healthcare facilities, and use data to guide a stringent enhanced environmental disinfection initiative. Project staff will continuously study the epidemiology of CDI during this initiative and will work to quantify the reduction in hospital-onset CDI that can be achieved through optimizing environmental disinfection. The primary outcome measured will be incidence rates of hospital-onset CDI; secondary outcomes will include the cost and benefit of the intervention. Specimens and medical charts will be analyzed in order to describe the clinical features and molecular epidemiology of hospital-onset CDI pre-intervention, during the intervention, and post-intervention, and staff will work to determine how well the molecular typing results correlate with current clinical definitions of hospital-onset CDI and the definitions of relapsing infection vs. re-infection. During the first year of this project, inter-hospital collaborations were strengthened through meetings and conference calls, trainings were conducted, and specimens were collected and stored for future analysis.
119
Weill Medical College, Year 1: April 2013-March 2014, $233,578: This project aims to design and implement sustainable interventions related to multidisciplinary healthcare worker education, environmental cleaning, and antimicrobial stewardship. The project interventions will be developed to include best practices and will also focus on implementation strategies and overcoming barriers to implementation. The project is being conducted in five diverse acute care hospitals in New York City. The desired outcomes are increased healthcare worker knowledge related to MDROs and CDI, enhanced environmental cleaning and disinfection, improved antimicrobial prescribing practices, and reduced incidence of CDI and MDRO. This project has received IRB approval, many planning meetings have been held, and preliminary work has been conducted to develop educational content for antimicrobial prescribers and environmental service workers.
CDCFundedHAIPreventionProjects
New York State Long Term Care C. difficile Collaborative In 2013, the NYSDOH Bureau of Healthcare Associated Infections continued its efforts to reduce CDI rates in LTCFs by facilitating improved implementation of well-established and routinely recommended infection control practices in nursing homes. A prevention project based on lessons learned from the previous year’s work was implemented, and all New York State LTCFs were invited to voluntarily participate. Through use of monthly webinar presentations, NYSDOH staff continued to educate participants on the latest evidence-based infection prevention and control practices. Throughout the project year, emphasis was placed on ensuring adherence to environmental cleaning as a prevention strategy in nursing homes. Project activities also included collection of information about infection control practices at each participating facility through issuance of a survey at the start and end of the project year. Participants were provided with information about the Long Term Care Facility Component of NHSN and voluntary reporting of CDI events using the NHSN protocol for CDI reporting was promoted. Data collection of CDI events ended as of May 31, 2014 and analysis of project data is ongoing.
The New York State Perinatal Quality Collaborative
The NYS Perinatal Quality Collaborative (NYSPQC) aims to improve maternal and newborn outcomes and improve capability within NYS for ongoing quality improvement and transformation of healthcare by applying evidence-based healthcare system change interventions in Obstetrical and Neonatal Intensive Care Units (NICUs). One of the NYSPQC's goals is to expand on the prior collaborative work of the NYSDOH HAI Program and NYS's Regional Perinatal Centers (RPCs), which demonstrated the effectiveness of central line care bundle and checklist use in preventing CLABSIs in NICUs. The NYSPQC CLABSI-reduction intervention, begun in September 2013, is focusing similar efforts on the Level III and II/III NICU hospitals, whose CLABSI rates are higher than those of the RPCs. The process uses the Institute for
120
Healthcare Improvement's learning model to promote team work, increase communication, enhance knowledge of the value of CL care bundle insertion and maintenance checklists, and track progress toward reducing CLABSIs using data submitted to the NHSN. Starting with baseline data for October 2013, the 36 facilities (11 RPCs and 25 Level III and II/III) participating in the project have been reporting birth weight-specific checklist usage data via the NHSN denominator summary screen. Checklist usage has increased from 81% among RPCs and 78% among lower level facilities to 93% percent among all hospitals of all levels, with rates slightly higher among infants born weighing under 1000 grams. There is not yet sufficient data to determine the effect of checklist usage on CLABSI rates.
121
HospitalSuccessStories
NYSDOH would like to recognize the achievements of three hospitals for their outstanding work in preventing HAIs in 2013.
SSIPreventionSuccess
St Francis Hospital-the Heart Center in Roslyn, New York, had a significantly low sternal wound SSI rate in CABG surgery patients when compared to other hospitals in New York State in 2013. At St Francis all members of the interdisciplinary health care team including experienced surgeons; operating room (OR), anesthesia, and post-anesthesia care unit staff; intensivists; midlevel practitioners (MLP); nursing staff; performance improvement staff; pharmacy staff; microbiology laboratory staff; and infection prevention and control staff are committed to consistently identifying and implementing processes that will improve patient outcomes.
Preventing SSIs begins with pre-admission testing (PAT), where patients receive a packet of six chlorhexidine wash cloths for their pre-op bath the night before surgery along with written instructions and mupirocin intranasal ointment for decolonization of MRSA/Staphylococcus aureus. The nurse practitioners educate the patients on appropriate use of the wash cloths and mupirocin as well as the rationale for use. All CABG patients have a HgbA1c (a test that might indicate diabetes) performed in PAT, and if it is elevated an automatic endocrine consult is requested.
When the patient is admitted the MLP will check to be sure the patient has had 5 days of mupirocin, and if not will order to continue its use.
In the holding room, hair is removed using clippers no more than an hour prior to surgery. This is followed by a second bath with chlorhexidine wash cloths. Chlorhexidine and alcohol are used as skin preps in the OR. Antibiotic prophylactic guidelines were developed by infectious disease and pharmacy staff and are monitored by both pharmacy and performance improvement personnel. Guidelines recommend timely and weight based administration of antibiotics.
Glucose control is managed in the cardiothoracic (CT) ICU by intensivists, MLPs and nursing. Glucose is monitored hourly with a target range of 120 to 160, adjusting insulin dosage with a continuous insulin infusion.
Wound care is performed on the sternal incision beginning 48 hours post-operatively with one chlorhexidine wash cloth and is continued for five days.
If an SSI is identified the cardiac surgeon is notified. Risk factors are assessed based on a case control study of five years of data conducted by performance improvement personnel. The three most common risk factors at St Francis for sternal wound infections are obesity, smoking, and diabetes. Infection prevention and control staff also assess lack of compliance with preventive
122
measures such as uncontrolled glucose, appropriate antibiotic use, pre-op bathing and hair removal, OR skin prep, and use of mupirocin twice a day for five days, with feedback to members of the team on areas of noncompliance.
If wound cultures grow S. aureus (which includes MRSA) the microbiology laboratory checks for mupirocin resistance. In addition, mupirocin resistance is monitored every six months in a sample of S. aureus isolates.
If uncontrolled glucose levels are noted, a referral is made to the CTICU Performance Improvement Team.
It is the consistent use of preventive measures and follow-up when infections do occur that have led to a significantly low SSI rate. St Francis Hospital plans to continue this process and is consistently exploring new and innovative ways to prevent SSIs.
CLABSIPreventionSuccess
Erie County Medical Center (ECMC) in Buffalo, NY has been successful in CLABSI reduction in their 12-bed medical intensive care unit (MICU). ECMC is a 602-bed tertiary care facility, and serves as the regional trauma center for the eight counties of Western NY. Currently, critical care is provided in a 12 bed MICU, a six bed Burn Treatment Center and a 24-bed Trauma Intensive Care Unit. In addition to Medical Surgical Services, ECMC is the Regional Center for Renal Transplant and Behavioral Health Services. The Patient Safety Department includes five certified infection Preventionists (IPs) who report directly to the Chief Safety Officer, who has an infection prevention background and is certified in infection control (CIC). This offers the infection prevention program tremendous administrative support. The ECMC MICU reported zero CLABSI’s for 2013, and continues to be CLABSI free for the first half of 2014. The unit follows the standard central line insertion bundle as recommended by the Institute for Healthcare Improvement. A line cart is used to keep all line insertion supplies in one location for efficiency. An electronic procedure form was developed by the MICU providers to consistently confirm compliance with all elements of the insertion bundle. This remains part of the MICU patient electronic medical record. In addition, when accessing any line, the hubs are scrubbed with alcohol and covered with a sterile cap after every use. ECMC also has a dedicated IV team for peripherally inserted central catheter (PICC) line insertion, which provides consistent proficiency.
123
The MICU staff is comprised of a dedicated group of intensivists and hospitalists. The continuity of providers has resulted in a team dynamic which facilitates communication and prioritizes prevention of infections. Multidisciplinary rounds are conducted daily and are comprised of the medical attending physician, intensivist, nurse practitioner/physician assistant, unit manager, charge nurse, clinical pharmacist, and nutritionist. Line necessity is reviewed daily, resulting in earlier line discontinuation and immediate replacement of emergent femoral lines. The IPs provide CLABSI data to the critical care units for immediate case review. Results are discussed with the staff by the nurse managers and presented monthly by the IPs to the Critical Care Quality Improvement Committee. Consistent adherence to established evidence-based practice guidelines and participation in New York State Partnership for Patients initiatives have also been important to their success.
CDIPreventionSuccess
Two hospitals in the Mount Sinai Health System: Mount Sinai Beth Israel Brooklyn, and Mount Sinai St. Luke’s Hospital were successful in reducing CDI rates.
Between 2010 and 2013, hospital onset CDI rates significantly decreased by an average of 50% across the two hospitals. The hospitals were able to significantly reduce hospital onset CDI rates by: linking infection prevention goals with organizational strategies and resources related to patient safety and process improvement; engaging and facilitating teamwork; creating and linking a culture of safety to outcomes; and setting achievable goals and measuring and assessing effectiveness of interventions with feedback in a timely manner. This was accomplished with the support of senior administration leadership, identification of physician, nursing, environmental services, and transport champions, and support from front line staff.
A tiered approach was used to implement their CDI prevention bundle. Interventions first focused on: hand hygiene with soap and water, adherence to contact precautions and availability of gowns and gloves, elimination of routine use of rectal thermometers, and patient placement in a private room or cohorting with similar patients. Patient placement started in the Emergency Departments and required strong coordination and communication between the Admitting Departments and clinical staff. The second set of interventions involved partnering with environmental services, transporters, and patient care services staff to ensure adequate cleaning of equipment, patient rooms, and bathrooms with a bleach-based disinfectant. Particular attention was given to shared equipment and high touch areas.
Compliance with their infection prevention bundle and environmental protocols was validated through the use of direct observation, checklists, fluorescent markers, and handheld luminometers. Results were reported back in a timely manner to Senior Leadership, including
124
the Board of Trustees, and to front line staff at each of the hospitals. Control charts were utilized to determine trends and variations over time.
The two most recent interventions involved daily chlorhexidine gluconate bathing of patients, which has been shown to reduce hospital onset CDI, and alignment of their antimicrobial stewardship programs to evaluate antimicrobial use in relation to CDI. Protocols for the treatment of community acquired pneumonia were modified. Esomeprazole use was also monitored.
The Mount Sinai Health System team attributes their success to adherence to evidence-based practices, careful tracking and trending of performance, and, most importantly, to exceptional teamwork and infection prevention leadership.

125
RecommendationsandNextSteps
NYSDOH will continue to monitor and report hospital HAI rates to encourage continued reduction in HAIs. Following the NYSDOH HAI Program’s policy on hospitals that have significantly high rates (available at http://www.health.ny.gov/statistics/facilities/hospital/hospital_acquired_infections/), HAI staff will continue to work with hospitals that are underperforming to ensure that they implement effective improvement plans and show progress in decreasing rates. HAI staff will also continue to notify hospitals of current issues in surveillance and infection prevention practice through email communications and regional conference calls. NYSDOH will continue to work with the HAI Technical Advisory Workgroup (TAW) to seek guidance on the selection of reporting indicators, methods of risk adjustment, and presentation of hospital-identified data. In late 2013 the TAW recommended that hospitals report CLABSIs in medical, surgical, medical/surgical wards, and step-down units beginning in January 2015. NYSDOH posted this recommendation for public comment in September 2014. Expanding CLABSI surveillance is important to decrease morbidity and mortality associated with these preventable infections. Evidence-based central line insertion and maintenance practices to reduce the risk of CLABSIs are applicable to central line use across hospital locations. Standardized surveillance allows hospitals to track their progress over time and compared to other facilities.
NYSDOH will continue to conduct medical record audits to verify appropriate use of surveillance definitions and accurate reporting by hospitals. The latest year of auditing results showed that NYS hospitals under reported HAIs by approximately 6%. Valid data are important both for the analysis of variation in HAI rates within the state, as well for the analysis of NYS rates in comparison with other states’ rates. Differences in audit coverage and thoroughness across the country currently results in inequitable comparisons of hospital and state average rates. NYSDOH will continue to discuss audit methodology with CDC and CMS and advocate that information on auditing be incorporated into performance evaluations. As CDI impacts the greatest number of people in NYS, reducing CDI rates continues to be a priority. NYSDOH recently applied for and received a grant from CDC to continue efforts to reduce CDI rates. New activities may include targeting communities with high CDI rates and instituting measures to improve those rates, such as improving communication and coordination between facilities and improving prevention practices within facilities.
Multidrug resistant organisms (MDROs) are a growing concern in NYS. There were approximately 3,422 BSIs and 684 deaths attributable to MRSA, as well as 460 BSIs and 175 deaths attributable to CRE in 2013. Antimicrobial resistance occurs due to both natural factors (e.g. natural selection, genetic mutations) and societal factors (e.g. inappropriate antibiotic use, close contact of very ill patients in hospitals). CDC recommends that all hospitals have
126
antimicrobial stewardship programs. Only 53% of NYS hospitals reported having a formal, written statement of support from leadership that supports efforts to improve antibiotic use. More improvement is needed to slow the spread of antimicrobial resistance.
CRE is a particular problem in the New York City (NYC) area, where the CRE BSI prevalence rate is 20 times higher than in the Capital District. Hospitals continue to experience challenges in preventing CRE transmission, including imperfect compliance with handwashing, delays in implementing contact precautions and appropriately cohorting patients, delays in discontinuing devices when they are no longer needed, and lack of established protocols to screen epidemiologically linked contacts and perform active surveillance testing in high-risk areas. NYSDOH recently applied for and received funding from CDC to focus additional attention on CRE in the NYC area. Grant related efforts will include working with hospitals and nursing homes to improve recognition of clusters, visiting facilities with high rates to assess compliance with recommended prevention and control practices, and facilitating communication between hospitals and admitting facilities.
NYSDOH will continue to monitor the impact of changes in NHSN definitions on HAI rates. In the next year, decisions must be made concerning whether and how to report open colon procedures.
NYSDOH will continue to monitor HAI prevention projects for compliance with program objectives, fiscal responsibility, and potential applicability to other hospitals or healthcare settings.
NYSDOH will continue to disseminate data on hospital-specific HAI rates in multiple formats, including annual reports and downloadable spreadsheets. Decisions regarding healthcare quality should not be based on these data alone. Consumers should consult with doctors, healthcare facilities, health insurance carriers, and reputable healthcare websites before deciding where to receive care.
127
Appendix1:ListofAbbreviations ASA – American Society of Anesthesiologists’ classification of physical status ASP – Antimicrobial stewardship program BMI – Body mass index BSI – Bloodstream infection CABG – Coronary artery bypass graft surgery CAUTI – Catheter-associated urinary tract infection CDC – Centers for Disease Control and Prevention CDI – Clostridium difficile infection C. difficile – Clostridium difficile Ceph – Cephalosporin CHF – Congestive heart failure CHG –Chlorhexidine gluconate CI – Confidence interval CIC – Certified in infection control CL – Central line CLABSI – Central line-associated bloodstream infection CLSI - Clinical Laboratory Standards Institute CMS – Centers for Medicare and Medicaid Services CNS – Coagulase negative staphylococcus CO – Community onset CO-NMH – Community onset-not my hospital CO-PMH – Community onset-possibly my hospital CRE – Carbapenem-resistant Enterobacteriaceae CSRS – Cardiac Surgery Reporting System
DOH –Department of Health DU– Device utilization DUA– Data use agreement EIA – Enzyme immunoassay EMR – Electronic medical record GDH – Glutamate dehydrogenase HAI – Hospital-acquired infection HO – Hospital onset ICD-9 – International Classification of Diseases, Ninth Revision ICU – Intensive care unit IP – Infection preventionist IQR – Inpatient quality reporting LabID – Laboratory identified LAMP – Loop-mediated isothermal amplification LOS – Length of stay LTCF – Long term care facility MD – Medical doctor MDRO – Multidrug resistant organism MHT – Modified Hodge Test MLP – Mid level practitioner MRSA – Methicillin-resistant Staphylococcus aureus MSSA – Methicillin sensitive Staphylococcus aureus
128
NAAT – Nucleic acid amplification test NICU – Neonatal intensive care unit NHSN – National Healthcare Safety Network NYS – New York State NYSDOH – New York State Department of Health NYSPQC – New York State Perinatal Quality Collaborative OR – Operating room OS – Organ/space Infection PAD – Peripheral artery disease PCR – Polymerase chain reaction PDS – Post-discharge surveillance PHL – Public health law PICC – Peripherally inserted central catheter RHIO – Regional health information system RFA – Request for applications RPC – Regional Perinatal Center SIR – Standardized infection ratio SPARCS - Statewide Planning and Research Cooperative System spp – species (pleural)
SSI – Surgical site infection TAW – Technical Advisory Workgroup UTI – Urinary tract infection VRE – Vancomycin-resistant Enterococci
129
Appendix2:GlossaryofTerms ASA score: This is a scale used by the anesthesiologist to classify the patient’s physical condition prior to surgery. It uses the American Society of Anesthesiologist (ASA) Classification of Physical Status. It is one of the factors that help determine a patient’s risk of possibly developing a SSI. Here is the ASA scale:
1 - Normally healthy patient 2 - Patient with mild systemic disease 3 - Patient with severe systemic disease 4 - Patient with an incapacitating systemic disease that is a constant threat to life 5 -A patient who is not expected to survive with or without the operation.
Admission prevalence rate: The percent of patients that are admitted to the hospital already carrying an infection. This is calculated as the number of community onset cases divided by the number of admissions. Birth weight categories: Birth weight refers to the weight of the infant at the time of birth. Infants remain in their birth weight category even if they gain weight. Birth weight category is important because the lower the birth weight, the higher the risk of developing an infection. Body mass index (BMI): BMI is a measure of the relationship between a person’s weight and their height. It is calculated with the following formula: kg/m2.
Catheter-associated urinary tract infection (CAUTI): A CAUTI is an infection of the bladder or kidneys associated with the use of a urinary catheter. Hospitalized patients may have a urinary catheter, a thin tube inserted into the bladder through the urethra, to drain urine when they cannot urinate on their own.
Carbapenem: There are four carbapemen antibotics: ertapenem, meropenem, doripenem, and imipenem. For technical reasons only three of these (meropenem, doripenem, and imipenem) are used to identify carbapenem-resistant infections. Carbapenems are considered an antibiotic of last resort by medical professionals.
Carbapenem-resistant Enterobacteriaceae infection (CRE): Bacteria in the Enterobacteriaceae family that are resistant to carbapenems are called CRE. NHSN currently only includes Klebsiella and E. coli spp.
Central line: A central line is a long thin tube that is placed into a large vein, usually in the neck, chest, arm, groin or umbilical cord. The tube is threaded through this vein until it reaches a large vein near the heart. A central line is used to give fluids or medication, withdraw blood, and monitor the patient’s condition.
Central line-associated bloodstream infection (CLABSI): A bloodstream infection can occur when microorganisms travel around and through a central line or umbilical catheter and then enter the blood.
Central line-associated bloodstream infection (CLABSI) rate: To get this rate, divide the total number of central line-associated bloodstream infections by the number of central line days. That result is then multiplied by 1,000. Lower rates are better.
130
Central line days (device days): This is the total number of days a central line is used. A daily count of patients with a central line in place is performed at the same time each day. Each patient with one or more central lines at the time the daily count is performed is counted as one central line day.
Central line device utilization ratio: This ratio is obtained by dividing the number of central line-days by the number of patient-days. It is also referred to as the device utilization (DU) ratio. Clostridium difficile: A bacterium that naturally resides in the bowels of some people without symptoms of infection. Overgrowth of C. difficile in the bowel, sometimes resulting from a patient’s taking antibiotics, or touching their mouth after coming in contact with contaminated environmental surfaces or patient care items, allows this bacterium to produce a toxin in the bowel causing infection symptoms, which range from mild to severe diarrhea and in some instances death. Colon surgery: Colon surgery is a procedure performed on the lower part of the digestive tract also known as the large intestine or colon. Community onset (CO): Documented infection occurring within 3 days of hospital admission. Community onset - not my hospital (CO-NMH): Documented infection occurring within 3 days of hospital admission and more than 4 weeks after discharge from the same hospital. Community onset – possibly my hospital (CO-PMH): Documented infection occurring within three days of readmission to the same hospital when a discharge from the same hospital occurred within the last four weeks. Confidence interval (CI): The confidence interval is the range around a measurement that conveys how precise the measurement is. A 95% CI means that we can be 95% confident that the true measurement falls within the interval. If hospital A reports 1 infection out of 20 procedures (i.e. 5%, with 95% CI: 0% to 25%), and hospital B reports 10 infections out of 200 procedures (i.e. 5% with 95% CI: 2% to 9%), we can see that both hospitals have the same rate, but we are less confident that the rate is truly 5% at hospital A because it was based on only 1 infection. Coronary artery bypass graft (CABG) surgery: A treatment for heart disease in which a vein or artery from another part of the body is used to create an alternate path for blood to flow to the heart, bypassing a blocked artery. Deep incisional SSI: A surgical site infection that involves the deep soft tissues (e.g., fascial and muscle layers) of the incision and meets the NHSN criteria as described in the NHSN Patient Safety Manual. Diabetes: A disease in which the body does not produce or properly use insulin. Insulin is needed to control the amount of sugar normally released into the blood. Donor incision site for coronary artery bypass graft (CABG): CABG surgery with a chest incision and donor site incisions (donor sites include the patient’s leg or arm) from which a blood vessel is removed to create a new path for blood to flow to the heart. CABG surgical incision site
131
infections involving the donor incision site are reported separately from CABG surgical chest incision site infections. Duration: The duration of an operation is the time between skin incision and stitching or stapling the skin closed. In the NHSN protocol, if a person has another operation through the same incision within 24 hours of the end of the original procedure, only one procedure is entered into NHSN and the total duration of the procedure is assigned as the sum of the two durations. Infection risk tends to increase with duration of surgery. Higher than state average: The risk adjusted rate for each hospital is compared to the state average to determine if it is significantly higher or lower than the state average. A rate is significantly higher than the state average if the confidence interval around the risk adjusted rate falls entirely above the state average. Hip replacement surgery: Hip replacement surgery involves removing damaged cartilage and bone from the hip joint and replacing them with new, man-made parts. Hospital-acquired infection (HAI): A hospital acquired infection is an infection that occurs in a patient as a result of being in a hospital setting after having medical or surgical treatments. Hospital Onset (HO): Documented infection occurring after the third day of hospital admission. Hysterectomy: The surgical removal of a woman’s uterus. Infection control / prevention processes: These are routine measures to prevent infections that can be used in all healthcare settings. These steps or principles can be expanded to meet the needs of specialized types of hospitals. Some hospitals make the processes mandatory. Examples include:
Complete and thorough hand washing. Use of personal protective equipment such as gloves, gowns, and/or masks when
caring for patients in selected situations to prevent the spread of infections. Use of an infection prevention checklist when putting central lines in patients. The list
reminds healthcare workers to clean their hands thoroughly; clean the patient’s skin before insertion with the right type of skin cleanser; wear the recommended sterile gown, gloves and mask; and place sterile barriers around the insertion site, etc.
Monitoring to ensure that employees, doctors and visitors are following the proper infection prevention procedures.
Infection preventionist (IP): Health professional that has special training in infection prevention and monitoring. Inpatient: A patient whose date of admission to the healthcare facility and the date of discharge are different calendar days. Intensive care unit (ICU): Intensive care units are hospital units that provide intensive observation and treatment for patients (adult, pediatric or newborn) either suffering from, or at risk of developing life threatening problems. ICUs are described by the types of patients cared for. Many hospitals typically care for patients with both medical and surgical conditions in a
132
combined medical/surgical ICU, while others have separate ICUs for medical, surgical and other specialty ICUs based on the patient care services provided by the hospital. Lower than state average: The risk adjusted rate for each hospital is compared to the state average to determine if it is significantly higher or lower than the state average. A rate is significantly lower than the state average if the confidence interval around the risk adjusted rate falls entirely below the state average. Methicillin-resistant Staphylococcus aureus (MRSA): Staphylococcus aureus (SA) is a common bacteria normally found on the skin or in the nose of 20 to 30 percent of healthy individuals. When SA is resistant to the antibiotics oxacillin, cefoxitin, or methicillin, it is called MRSA.
National Healthcare Safety Network (NHSN): This is a secure, internet-based national data reporting system that NYS hospitals must use to report HAIs. The NHSN is managed by the CDC’s Division of Healthcare Quality Promotion. Neonatal intensive care units: Patient care units that provide care to newborns.
Level II/III Units: provide care to newborns at Level II (moderate risk) and Level III (requiring increasingly complex care).
Level III Units: provide highly specialized care to newborns with serious illness, including premature birth and low birth weight and newborns under the supervision of a neonatologist.
Regional Perinatal Centers (RPC): Level IV units, providing all the services and expertise required by the most acutely sick or at-risk pregnant women and newborns. RPCs provide or coordinate maternal-fetal and newborn transfers of high-risk patients from their affiliate hospitals to the RPC, and are responsible for support, education, consultation and improvements in the quality of care in the affiliate hospitals within their region.
Obesity: Obesity is a condition in which a person has too much body fat that can lower the likelihood of good health. It is commonly defined as a body mass index (BMI) of 30 kg/m2 or higher. Organ/space SSI: A surgical site infection that involves a part of the body, excluding the skin incision, fascia, or muscle layers, that is opened or manipulated during the operative procedure. Patient day: Patient days are the number of hospitalizations multiplied by the length of stay of each hospitalization. One patient hospitalized for 6 days will contribute 6 patient days to the hospital total, as will two patients each hospitalized for 3 days. Post discharge surveillance: This is the process IPs use to seek out infections after patients have been discharged from the hospital. It includes screening a variety of data sources, including re-admissions, emergency department visits and/or contacting the patient’s doctor. Raw rate: Raw rates are not adjusted to account for differences in the patient populations.

133
Bloodstream infections: Raw rate is the number of infections (the numerator) divided by the number of line days (the denominator) then multiplied by 1000 to give the number of infections per 1000 line days.
Surgical site infections: Raw rate is the number of infections (the numerator) divided by the number of procedures (the denominator) then multiplied by 100 to give the number of infections per 100 operative procedures.
Community onset infection: Raw rate is the number of infections (the numerator) divided by the number of admissions (the denominator) then multiplied by 100 to give the number of infections per 100 admissions.
Hospital onset infection: Raw rate is the number of infections (the numerator) divided by the number of patient days (the denominator) then multiplied by 10,000 to give the number of infections per 10,000 patient days.
Risk adjustment: Risk adjustment accounts for differences in patient populations and allows hospitals to be compared. A hospital that performs a large number of complex procedures on very sick patients would be expected to have a higher infection rate than a hospital that performs more routine procedures on healthier patients. Risk-adjusted rate:
For surgical site infections, the risk-adjusted rate is based on a comparison of the actual (observed) rate and the rate that would be predicted if, statewide, the patients had the same distribution of risk factors as the hospital.
For NICU CLABSIs, the adjusted rate is a comparison of the actual rate and the predicted rate based on statewide rates within birth weight categories for neonates.
SPARCS: The Statewide Planning and Research Cooperative System (SPARCS) is a comprehensive data reporting system established in 1979 as a result of cooperation between the health care industry and government. Initially created to collect information on discharges from hospitals, SPARCS currently collects patient level detail on patient characteristics, diagnoses and treatments, services, and charges for every hospital discharge, ambulatory surgery procedure and emergency department admission in NYS. Standardized infection ratio (SIR): The SIR compares infection rate in a smaller population with infection rates in a larger standard population, after adjusting for risk factors that might affect the chance of developing an infection. In this report, the SIR is most often used to compare each hospital’s rate to the NYS standard. Sometimes the SIR is also used to compare NYS to the National standard. In both cases, the SIR is calculated by dividing the actual number of infections in the smaller group by the number of infections that would be statistically predicted if the standard population had the same risk distribution as the observed population.
A SIR of 1.0 means the observed number of infections is equal to the number of predicted infections.
A SIR above 1.0 means that the infection rate is higher than that found in the standard population. The difference above 1.0 is the percentage by which the infection rate exceeds that of the standard population.
A SIR below 1.0 means that the infection rate is lower than that of the standard population. The difference below 1.0 is the percentage by which the infection rate is lower than that experienced by the standard population.

134
Superficial incisional SSI: A surgical site infection that involves only skin and soft tissue layers of the incision and meets NHSN criteria as described in the NHSN Patient Safety Protocol. Surgical site infection (SSI): An infection that occurs after the operation in the part of the body where the surgery took place (incision). Validation: A way of making sure the HAI data reported to NYS are complete and accurate. Complete reporting of HAIs, total numbers of surgical procedures performed, central line days, and patient information to assign risk scores must all be validated. The accuracy of reporting is evaluated by visiting hospitals and reviewing patient records. The purpose of the validation visits are to:
Assess the accuracy and quality of the data submitted to NYS. Provide hospitals with information to help them use the data to improve and decrease
HAIs. Provide education to the IPs and other hospital employees and doctors, to improve
reporting accuracy and quality. Look for unreported HAIs. Make recommendations for improving data accuracy and/or patient care quality issues.
Wound class: An assessment of how clean or dirty the operation body site is at the time of the operation. Wounds are divided into four classes:
Clean: An uninfected operation body site is encountered and the respiratory, digestive, genital, or uninfected urinary tracts are not entered.
Clean-contaminated: Operation body sites in which the respiratory, digestive, genital or urinary tracts are entered under controlled conditions and without unusual contamination.
Contaminated: Operation body sites that have recently undergone trauma, operations with major breaks in sterile technique (e.g., open cardiac massage) or gross spillage from the gastrointestinal tract.
Dirty or infected: Includes old traumatic wounds with retained dead tissue and those that involve existing infection or perforated intestines.

135
Appendix3:Methods For more details on the HAI surveillance protocols used to collect this data, please see the NHSN website at http://www.cdc.gov/nhsn/. This section of the report focuses on NYS-specific methods and provides additional information helpful for interpreting the results.
DataValidation
Data reported to the NHSN are validated by the NYSDOH using a number of methods.
1) Point of entry checks - The NHSN is a web-based data reporting and analysis program that includes validation routines for many data elements, reducing common data entry errors. Hospitals can view, edit, and analyze their data at any time.
2) Monthly checks for internal consistency – Every other month, NYS HAI staff download the data from the NHSN and run it through a computerized data validation code. Data that are missing, unusual, inconsistent, or duplicate are identified and investigated through email or telephone communication with hospital staff. Hospitals are given the opportunity to verify and/or correct the data.
3) Audits – Audits of a sample of medical records are conducted by the NYSDOH to assess compliance with reporting requirements. In addition, the purposes of the audit are to:
a. Enhance the reliability and consistency of applying the surveillance definitions; b. Evaluate the adequacy of surveillance methods to detect infections; and c. Evaluate intervention strategies designed to reduce or eliminate specific
infections. Audits have been an important component of the NYSDOH program since its inception in 2007. Between 2007 and 2013, 97%, 89%, 89%, 74%, 68%, 31%, and 50% of hospitals were audited by HAI Reporting staff, respectively. A hospital was more likely to be audited in a given year if it had significantly high or low rates in the previous year, was not audited the previous year, performed poorly during the previous audit, hired new hospital staff, and was located in a region covered by an HAI staff member or offered electronic medical record (EMR) access.
NYSDOH continues to take advantage of technological developments in healthcare information. NYSDOH developed a process to conduct these audits via off-site access to EMRs. Of the hospitals that were audited in 2013, 18% were audited off-site. EMR development and access vary across the state, and may be available as part of a Regional Health Information Organization (RHIO) (i.e. HealtheLink in Western NY) or within an individual hospital. Regional health information systems are more valuable than independent hospital systems because they allow for complete follow-up of patients post-
136
discharge through various facilities in the region. When complete EMRs are not available, the missing documents (i.e. coding summaries, intra-operative reports and vital signs) can also be effectively obtained by fax or secure file transfer, allowing the use of partial EMRs. Off-site audits can be accomplished as effectively as on-site audits and are an efficient use of time and resources. Communication of audit results, review of compliance issues, and education are successfully provided through phone conference. IPs that participated in this audit process approved and endorsed this method of auditing. Availability of EMRs continues to grow, and NYSDOH will continue to leverage this resource to increase audit efficiency in the future. For CLABSI audits, staff reviewed the medical records of patients identified as having a positive blood culture during a specified time period in an ICU. For CDI and CRE audits, staff reviewed a laboratory list of positive laboratory reports during a specified time period. For SSI audits, staff reviewed a targeted selection of medical records in an attempt to efficiently identify under reporting. Specifically, the SPARCS database was used to preferentially select patients with an infection reported to the SPARCS billing database but not NHSN. The 2013 audit results will be summarized in the next annual report. In 2012, NYSDOH staff reviewed almost 2,000 records and agreed with the hospital-reported infection status 94% of the time. Disagreements were discussed with the IPs and corrected in NHSN. Table 31 summarizes the number of inconsistencies in reporting infections out of the total number of records reviewed in 2012. The agreement rate for SSIs declined from 2011 to 2012. This may be due in part to a change in the chart selection criteria; in 2012 a larger proportion of suspicious (as opposed to random) charts were selected for review, i.e., the test got harder. However, we would also expect improvement in the ability of hospitals to accurately identify HAIs since the program began in 2007. Recommendations for improving SSI surveillance accuracy were reviewed with all hospitals in January 2013 during regional conference calls.
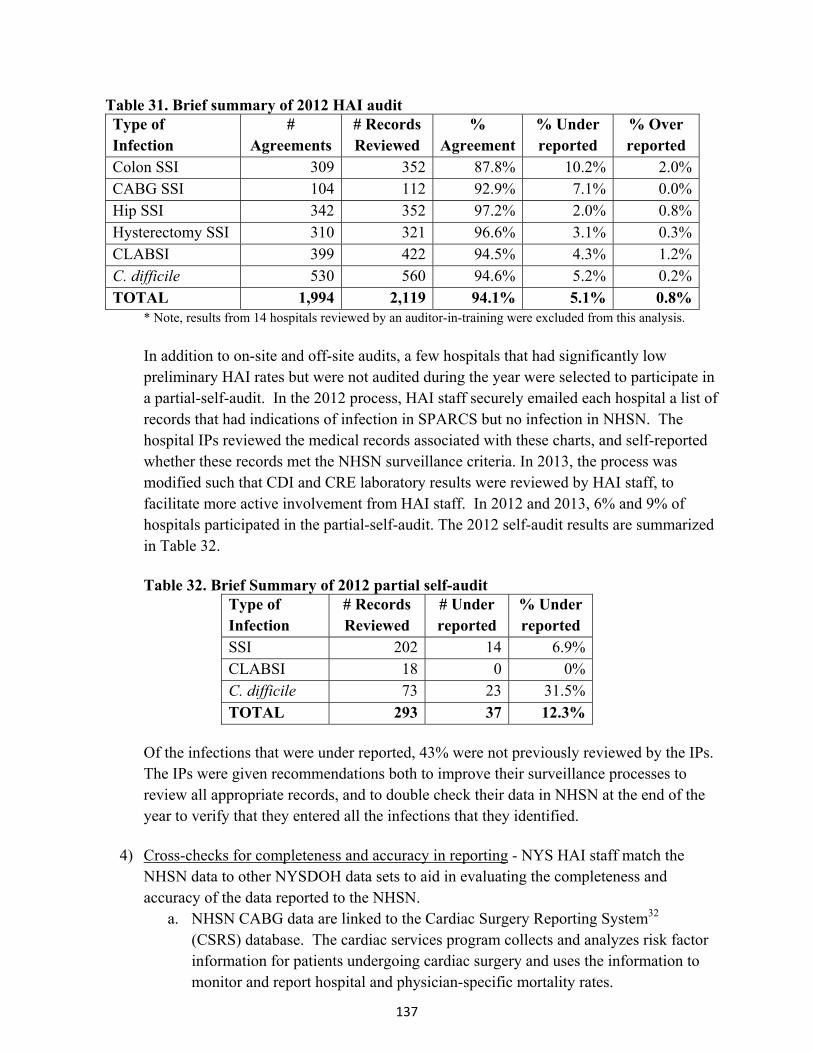
137
Table 31. Brief summary of 2012 HAI audit Type of Infection
# Agreements
# Records Reviewed
% Agreement
% Under reported
% Over reported
Colon SSI 309 352 87.8% 10.2% 2.0%CABG SSI 104 112 92.9% 7.1% 0.0%Hip SSI 342 352 97.2% 2.0% 0.8%Hysterectomy SSI 310 321 96.6% 3.1% 0.3%CLABSI 399 422 94.5% 4.3% 1.2%C. difficile 530 560 94.6% 5.2% 0.2%TOTAL 1,994 2,119 94.1% 5.1% 0.8%
* Note, results from 14 hospitals reviewed by an auditor-in-training were excluded from this analysis. In addition to on-site and off-site audits, a few hospitals that had significantly low preliminary HAI rates but were not audited during the year were selected to participate in a partial-self-audit. In the 2012 process, HAI staff securely emailed each hospital a list of records that had indications of infection in SPARCS but no infection in NHSN. The hospital IPs reviewed the medical records associated with these charts, and self-reported whether these records met the NHSN surveillance criteria. In 2013, the process was modified such that CDI and CRE laboratory results were reviewed by HAI staff, to facilitate more active involvement from HAI staff. In 2012 and 2013, 6% and 9% of hospitals participated in the partial-self-audit. The 2012 self-audit results are summarized in Table 32. Table 32. Brief Summary of 2012 partial self-audit
Type of Infection
# Records Reviewed
# Under reported
% Under reported
SSI 202 14 6.9% CLABSI 18 0 0% C. difficile 73 23 31.5% TOTAL 293 37 12.3%
Of the infections that were under reported, 43% were not previously reviewed by the IPs. The IPs were given recommendations both to improve their surveillance processes to review all appropriate records, and to double check their data in NHSN at the end of the year to verify that they entered all the infections that they identified.
4) Cross-checks for completeness and accuracy in reporting - NYS HAI staff match the NHSN data to other NYSDOH data sets to aid in evaluating the completeness and accuracy of the data reported to the NHSN.
a. NHSN CABG data are linked to the Cardiac Surgery Reporting System32 (CSRS) database. The cardiac services program collects and analyzes risk factor information for patients undergoing cardiac surgery and uses the information to monitor and report hospital and physician-specific mortality rates.
138
b. NHSN colon, hip, hysterectomy, and CDI data are linked to the Statewide Planning and Research Cooperative System (SPARCS) database. SPARCS is an administrative billing database that contains details on patient diagnoses and treatments, services, and charges for every hospital discharge in NYS.
ThresholdsforReportingHospital‐SpecificInfectionRates This report contains data from 170 hospitals reporting complete data for 2013. Five of these hospitals, which recently closed, are not shown in hospital-specific tables. Hospitals that perform very few procedures or have ICUs with very few patients with central lines have infection rates that fluctuate greatly over time. This is because even a few cases of infection will yield a numerically high rate in the rate calculation when the denominator is small. To assure a fair and representative set of data, the NYSDOH adopted minimum thresholds.
For surgical site infections, there must be a minimum of 20 patients undergoing a surgical procedure.
For CLABSIs there must be a minimum of 50 central line days. Central line days are the total number of days central lines are used for each patient in an ICU over a given period of time.
RiskAdjustment Risk adjustment is a statistical technique that allows hospitals to be more fairly compared. The adjustment takes into account the differences in patient populations related to severity of illness and other factors that may affect the risk of developing an HAI. A hospital that performs a large number of complex procedures on very sick patients would be expected to have a higher infection rate than a hospital that performs more routine procedures on healthier patients. Therefore, before comparing the infection rates of hospitals, it is important to adjust for the proportion of high and low risk patients. Risk-adjusted infection rates for SSIs in each hospital were calculated using a two-step method. First, all the data for the state were pooled to develop a logistic regression model predicting the risk of infection based on patient-specific risk factors. Second, that model was used to calculate the expected number of infections for each hospital. The observed infection rate was then divided by the hospital’s expected infection rate. If the resulting ratio is larger than one, the provider has a higher infection rate than expected on the basis of its patient mix. If it is smaller than one, the provider has a lower infection rate than expected from its patient mix. For each hospital, the ratio is then multiplied by the overall statewide infection rate to obtain the hospital’s risk-adjusted rate. This method of risk adjustment is called “indirect adjustment.” Hospitals with risk-adjusted rates significantly higher or lower than the state average were identified using exact two-sided 95% Poisson confidence intervals. The Poisson distribution is used for rates based on rare events. All data analyses were performed using SAS version 9.3 (SAS Institute, Cary NC).
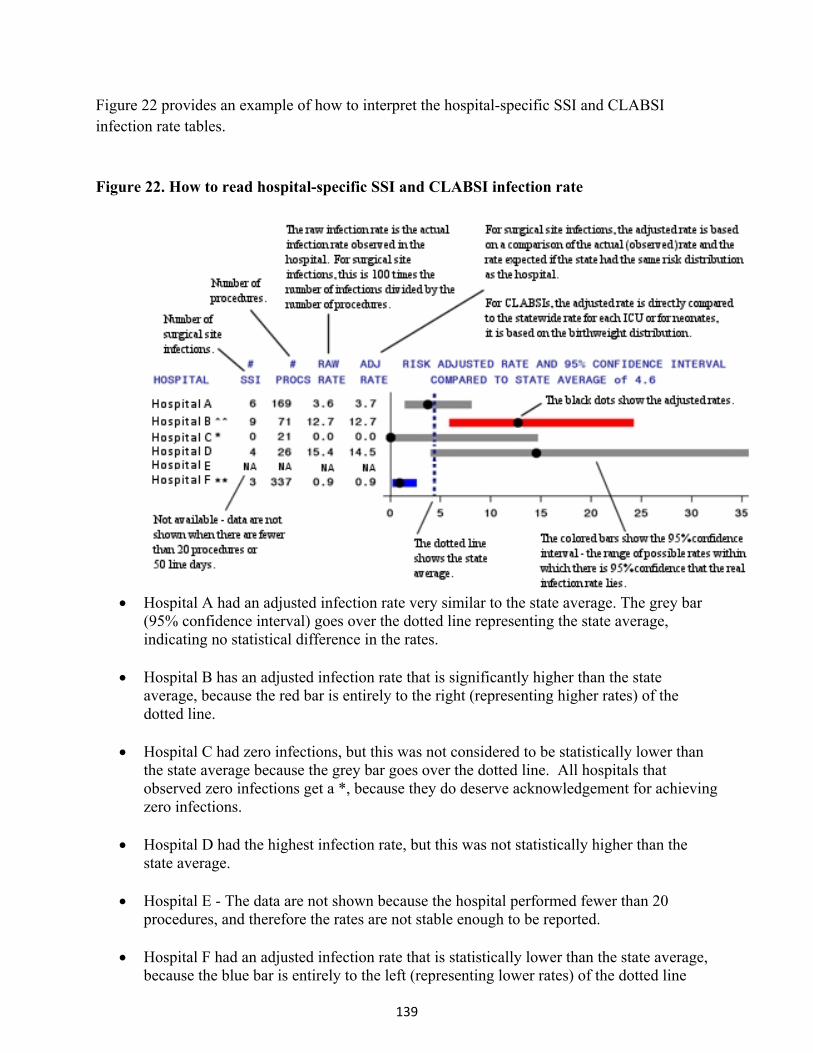
139
Figure 22 provides an example of how to interpret the hospital-specific SSI and CLABSI infection rate tables. Figure 22. How to read hospital-specific SSI and CLABSI infection rate
Hospital A had an adjusted infection rate very similar to the state average. The grey bar
(95% confidence interval) goes over the dotted line representing the state average, indicating no statistical difference in the rates.
Hospital B has an adjusted infection rate that is significantly higher than the state average, because the red bar is entirely to the right (representing higher rates) of the dotted line.
Hospital C had zero infections, but this was not considered to be statistically lower than the state average because the grey bar goes over the dotted line. All hospitals that observed zero infections get a *, because they do deserve acknowledgement for achieving zero infections.
Hospital D had the highest infection rate, but this was not statistically higher than the state average.
Hospital E - The data are not shown because the hospital performed fewer than 20
procedures, and therefore the rates are not stable enough to be reported.
Hospital F had an adjusted infection rate that is statistically lower than the state average, because the blue bar is entirely to the left (representing lower rates) of the dotted line
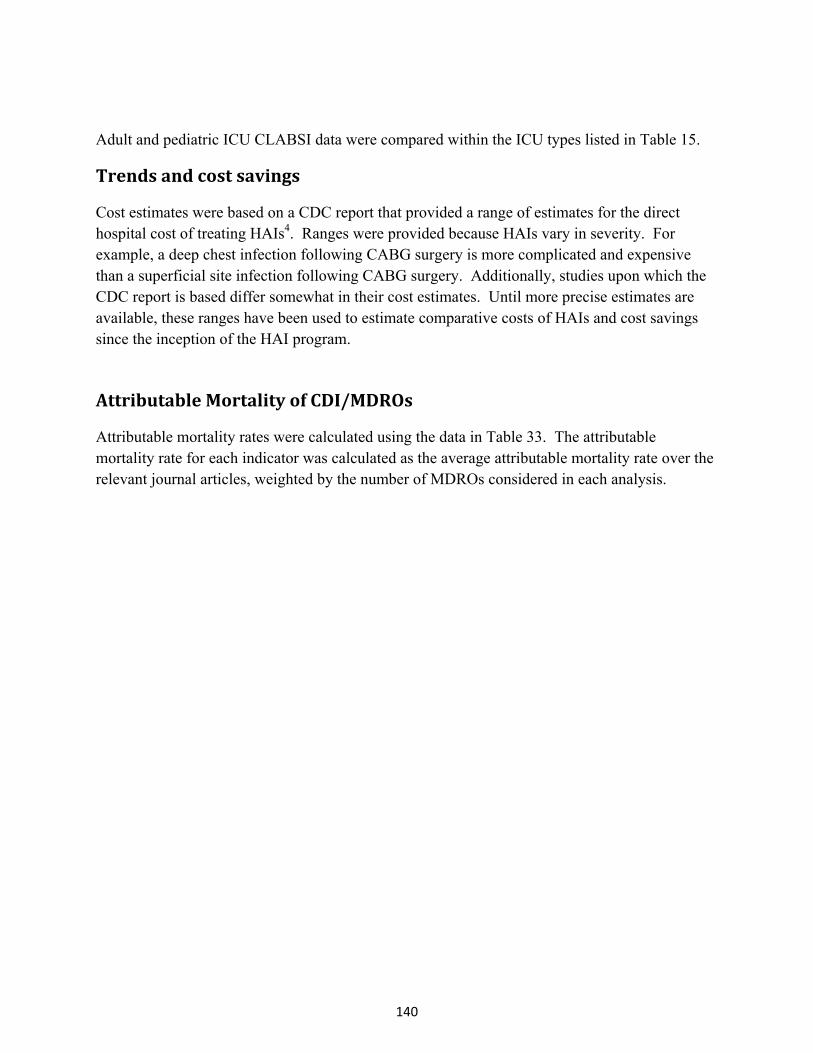
140
Adult and pediatric ICU CLABSI data were compared within the ICU types listed in Table 15.
Trendsandcostsavings
Cost estimates were based on a CDC report that provided a range of estimates for the direct hospital cost of treating HAIs4. Ranges were provided because HAIs vary in severity. For example, a deep chest infection following CABG surgery is more complicated and expensive than a superficial site infection following CABG surgery. Additionally, studies upon which the CDC report is based differ somewhat in their cost estimates. Until more precise estimates are available, these ranges have been used to estimate comparative costs of HAIs and cost savings since the inception of the HAI program.
AttributableMortalityofCDI/MDROs
Attributable mortality rates were calculated using the data in Table 33. The attributable mortality rate for each indicator was calculated as the average attributable mortality rate over the relevant journal articles, weighted by the number of MDROs considered in each analysis.
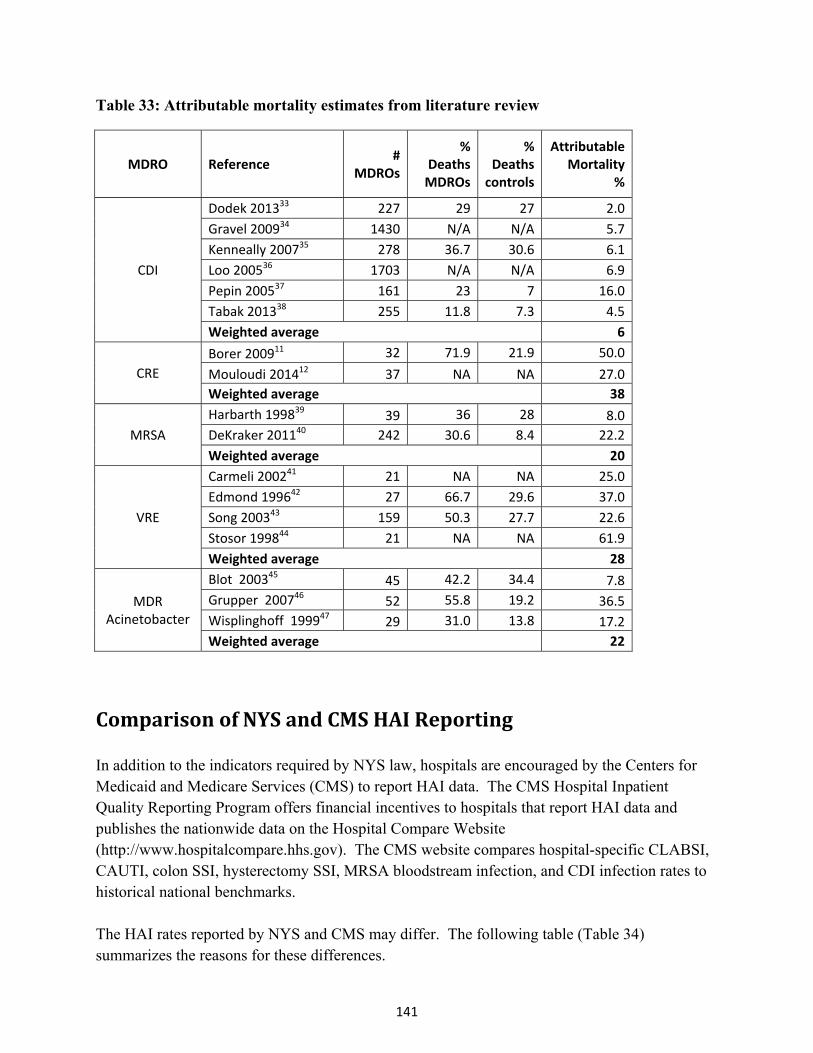
141
Table 33: Attributable mortality estimates from literature review
MDRO Reference #
MDROs
%Deaths MDROs
% Deaths controls
Attributable Mortality
%
CDI
Dodek 201333 227 29 27 2.0
Gravel 200934 1430 N/A N/A 5.7
Kenneally 200735 278 36.7 30.6 6.1
Loo 200536 1703 N/A N/A 6.9
Pepin 200537 161 23 7 16.0
Tabak 201338 255 11.8 7.3 4.5
Weighted average 6
CRE
Borer 200911 32 71.9 21.9 50.0
Mouloudi 201412 37 NA NA 27.0
Weighted average 38
MRSA
Harbarth 199839 39 36 28 8.0
DeKraker 201140 242 30.6 8.4 22.2
Weighted average 20
VRE
Carmeli 200241 21 NA NA 25.0
Edmond 199642 27 66.7 29.6 37.0
Song 200343 159 50.3 27.7 22.6
Stosor 199844 21 NA NA 61.9
Weighted average 28
MDR Acinetobacter
Blot 200345 45 42.2 34.4 7.8
Grupper 200746 52 55.8 19.2 36.5
Wisplinghoff 199947 29 31.0 13.8 17.2
Weighted average 22
ComparisonofNYSandCMSHAIReporting In addition to the indicators required by NYS law, hospitals are encouraged by the Centers for Medicaid and Medicare Services (CMS) to report HAI data. The CMS Hospital Inpatient Quality Reporting Program offers financial incentives to hospitals that report HAI data and publishes the nationwide data on the Hospital Compare Website (http://www.hospitalcompare.hhs.gov). The CMS website compares hospital-specific CLABSI, CAUTI, colon SSI, hysterectomy SSI, MRSA bloodstream infection, and CDI infection rates to historical national benchmarks. The HAI rates reported by NYS and CMS may differ. The following table (Table 34) summarizes the reasons for these differences.
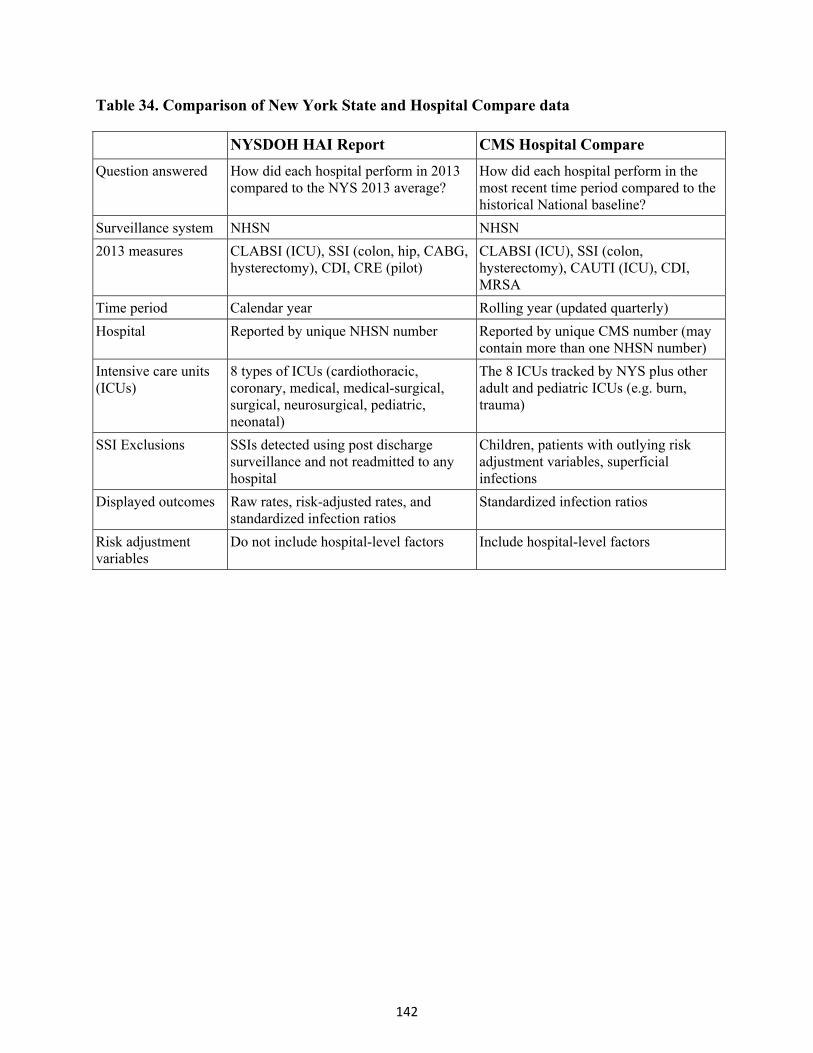
142
Table 34. Comparison of New York State and Hospital Compare data
NYSDOH HAI Report CMS Hospital Compare
Question answered How did each hospital perform in 2013 compared to the NYS 2013 average?
How did each hospital perform in the most recent time period compared to the historical National baseline?
Surveillance system NHSN NHSN
2013 measures CLABSI (ICU), SSI (colon, hip, CABG, hysterectomy), CDI, CRE (pilot)
CLABSI (ICU), SSI (colon, hysterectomy), CAUTI (ICU), CDI, MRSA
Time period Calendar year Rolling year (updated quarterly)
Hospital Reported by unique NHSN number Reported by unique CMS number (may contain more than one NHSN number)
Intensive care units (ICUs)
8 types of ICUs (cardiothoracic, coronary, medical, medical-surgical, surgical, neurosurgical, pediatric, neonatal)
The 8 ICUs tracked by NYS plus other adult and pediatric ICUs (e.g. burn, trauma)
SSI Exclusions SSIs detected using post discharge surveillance and not readmitted to any hospital
Children, patients with outlying risk adjustment variables, superficial infections
Displayed outcomes Raw rates, risk-adjusted rates, and standardized infection ratios
Standardized infection ratios
Risk adjustment variables
Do not include hospital-level factors Include hospital-level factors
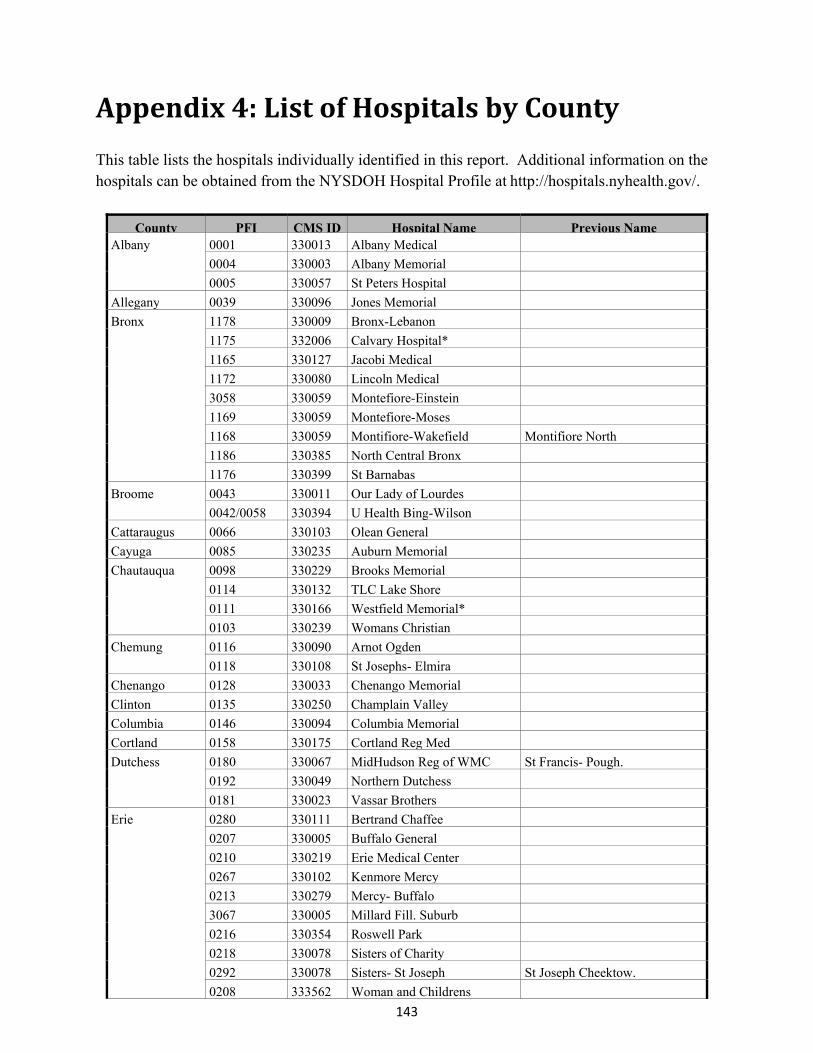
143
Appendix4:ListofHospitalsbyCounty This table lists the hospitals individually identified in this report. Additional information on the hospitals can be obtained from the NYSDOH Hospital Profile at http://hospitals.nyhealth.gov/.
County PFI CMS ID Hospital Name Previous NameAlbany 0001 330013 Albany Medical
0004 330003 Albany Memorial
0005 330057 St Peters Hospital
Allegany 0039 330096 Jones Memorial
Bronx 1178 330009 Bronx-Lebanon
1175 332006 Calvary Hospital*
1165 330127 Jacobi Medical
1172 330080 Lincoln Medical
3058 330059 Montefiore-Einstein
1169 330059 Montefiore-Moses
1168 330059 Montifiore-Wakefield Montifiore North
1186 330385 North Central Bronx
1176 330399 St Barnabas
Broome 0043 330011 Our Lady of Lourdes
0042/0058 330394 U Health Bing-Wilson
Cattaraugus 0066 330103 Olean General
Cayuga 0085 330235 Auburn Memorial
Chautauqua 0098 330229 Brooks Memorial
0114 330132 TLC Lake Shore
0111 330166 Westfield Memorial*
0103 330239 Womans Christian
Chemung 0116 330090 Arnot Ogden
0118 330108 St Josephs- Elmira
Chenango 0128 330033 Chenango Memorial
Clinton 0135 330250 Champlain Valley
Columbia 0146 330094 Columbia Memorial
Cortland 0158 330175 Cortland Reg Med
Dutchess 0180 330067 MidHudson Reg of WMC St Francis- Pough.
0192 330049 Northern Dutchess
0181 330023 Vassar Brothers
Erie 0280 330111 Bertrand Chaffee
0207 330005 Buffalo General
0210 330219 Erie Medical Center
0267 330102 Kenmore Mercy
0213 330279 Mercy- Buffalo
3067 330005 Millard Fill. Suburb
0216 330354 Roswell Park
0218 330078 Sisters of Charity
0292 330078 Sisters- St Joseph St Joseph Cheektow.
0208 333562 Woman and Childrens

144
County PFI CMS ID Hospital Name Previous NameFranklin 0324 330079 Adirondack Medical
0325 330084 Alice Hyde
Fulton 0330 330276 Nathan Littauer
Genesee 0339 330073 United Memorial
Jefferson 0379 330263 Carthage Area
0367 330157 Samaritan- Watertown
Kings 1286 330233 Brookdale Hospital
1288 330056 BrooklynHos-Downtown
1294 330196 Coney Island
1309 330397 Interfaith Medical
1301 330202 Kings County
1315 330201 Kingsbrook Jewish
1304 330306 Lutheran Medical
1305 330194 Maimonides
1324 330169 Mt Sinai BI-Bklyn Beth Israel- Kings
1293 330019 NY Community Bklyn
1306 330236 NY Methodist
1302 330152 SUNY Downstate LICH
1320 330350 Univ Hosp Brooklyn
1692 330396 Woodhull Medical
1318 330221 Wyckoff Heights
Lewis 0383 331317 Lewis County
Livingston 0393 330238 Noyes Memorial
Madison 0401 330249 Community Memorial
0397 330115 Oneida Healthcare
Monroe 0409 330164 Highland Hospital
0461 330037 Lakeside Memorial
0414 330403 Monroe Community*
0411 330125 Rochester General
0413 330285 Strong Memorial
0471 330226 Unity Hosp Rochester
Montgomery 0484 330047 St Marys Amsterdam
Nassau 0518 330372 Franklin
0490 330181 Glen Cove Hospital
0513 330259 Mercy Medical
0528 330027 Nassau University
0541 330106 North Shore
0552 330331 Plainview Hospital
0527 330198 South Nassau Comm.
0563 330182 St Francis- Roslyn
0551 330332 St Joseph -Bethpage
0550 330106 Syosset Hospital
0511 330167 Winthrop University
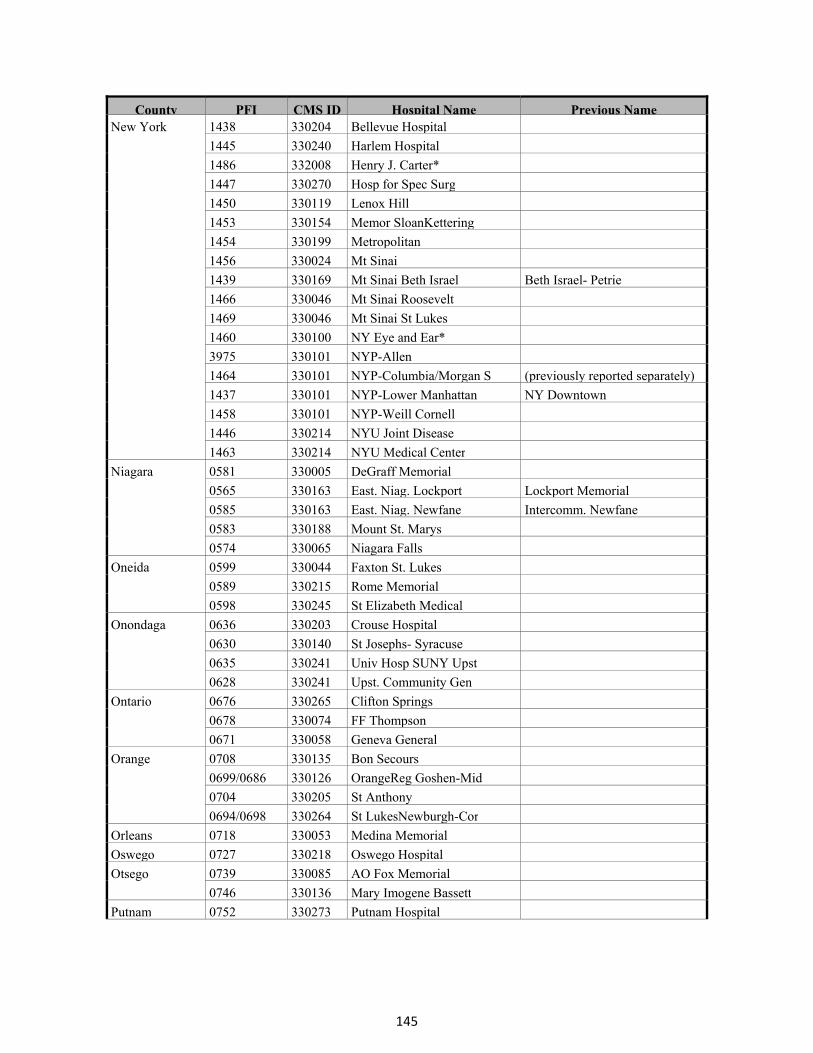
145
County PFI CMS ID Hospital Name Previous NameNew York 1438 330204 Bellevue Hospital
1445 330240 Harlem Hospital
1486 332008 Henry J. Carter*
1447 330270 Hosp for Spec Surg
1450 330119 Lenox Hill
1453 330154 Memor SloanKettering
1454 330199 Metropolitan
1456 330024 Mt Sinai
1439 330169 Mt Sinai Beth Israel Beth Israel- Petrie
1466 330046 Mt Sinai Roosevelt
1469 330046 Mt Sinai St Lukes
1460 330100 NY Eye and Ear*
3975 330101 NYP-Allen
1464 330101 NYP-Columbia/Morgan S (previously reported separately)
1437 330101 NYP-Lower Manhattan NY Downtown
1458 330101 NYP-Weill Cornell
1446 330214 NYU Joint Disease
1463 330214 NYU Medical Center
Niagara 0581 330005 DeGraff Memorial
0565 330163 East. Niag. Lockport Lockport Memorial
0585 330163 East. Niag. Newfane Intercomm. Newfane
0583 330188 Mount St. Marys
0574 330065 Niagara Falls
Oneida 0599 330044 Faxton St. Lukes
0589 330215 Rome Memorial
0598 330245 St Elizabeth Medical
Onondaga 0636 330203 Crouse Hospital
0630 330140 St Josephs- Syracuse
0635 330241 Univ Hosp SUNY Upst
0628 330241 Upst. Community Gen
Ontario 0676 330265 Clifton Springs
0678 330074 FF Thompson
0671 330058 Geneva General
Orange 0708 330135 Bon Secours
0699/0686 330126 OrangeReg Goshen-Mid
0704 330205 St Anthony
0694/0698 330264 St LukesNewburgh-Cor
Orleans 0718 330053 Medina Memorial
Oswego 0727 330218 Oswego Hospital
Otsego 0739 330085 AO Fox Memorial
0746 330136 Mary Imogene Bassett
Putnam 0752 330273 Putnam Hospital
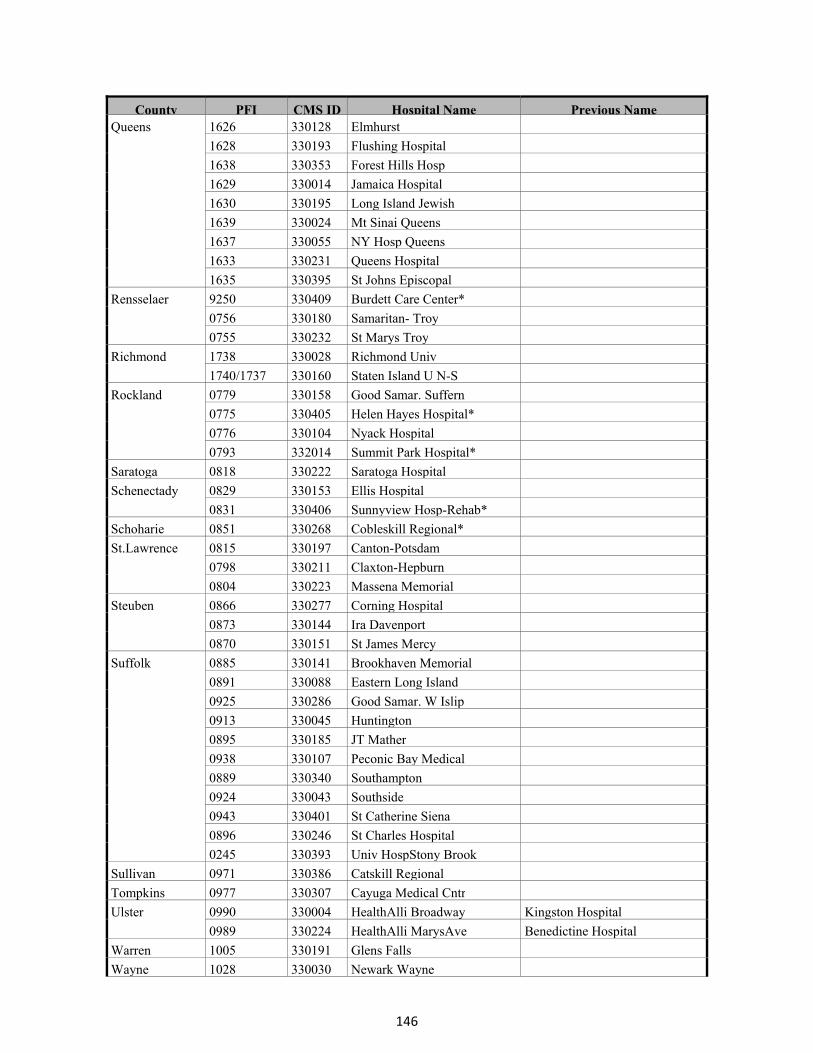
146
County PFI CMS ID Hospital Name Previous NameQueens 1626 330128 Elmhurst
1628 330193 Flushing Hospital
1638 330353 Forest Hills Hosp
1629 330014 Jamaica Hospital
1630 330195 Long Island Jewish
1639 330024 Mt Sinai Queens
1637 330055 NY Hosp Queens
1633 330231 Queens Hospital
1635 330395 St Johns Episcopal
Rensselaer 9250 330409 Burdett Care Center*
0756 330180 Samaritan- Troy
0755 330232 St Marys Troy
Richmond 1738 330028 Richmond Univ
1740/1737 330160 Staten Island U N-S
Rockland 0779 330158 Good Samar. Suffern
0775 330405 Helen Hayes Hospital*
0776 330104 Nyack Hospital
0793 332014 Summit Park Hospital*
Saratoga 0818 330222 Saratoga Hospital
Schenectady 0829 330153 Ellis Hospital
0831 330406 Sunnyview Hosp-Rehab*
Schoharie 0851 330268 Cobleskill Regional*
St.Lawrence 0815 330197 Canton-Potsdam
0798 330211 Claxton-Hepburn
0804 330223 Massena Memorial
Steuben 0866 330277 Corning Hospital
0873 330144 Ira Davenport
0870 330151 St James Mercy
Suffolk 0885 330141 Brookhaven Memorial
0891 330088 Eastern Long Island
0925 330286 Good Samar. W Islip
0913 330045 Huntington
0895 330185 JT Mather
0938 330107 Peconic Bay Medical
0889 330340 Southampton
0924 330043 Southside
0943 330401 St Catherine Siena
0896 330246 St Charles Hospital
0245 330393 Univ HospStony Brook
Sullivan 0971 330386 Catskill Regional
Tompkins 0977 330307 Cayuga Medical Cntr
Ulster 0990 330004 HealthAlli Broadway Kingston Hospital
0989 330224 HealthAlli MarysAve Benedictine Hospital
Warren 1005 330191 Glens Falls
Wayne 1028 330030 Newark Wayne
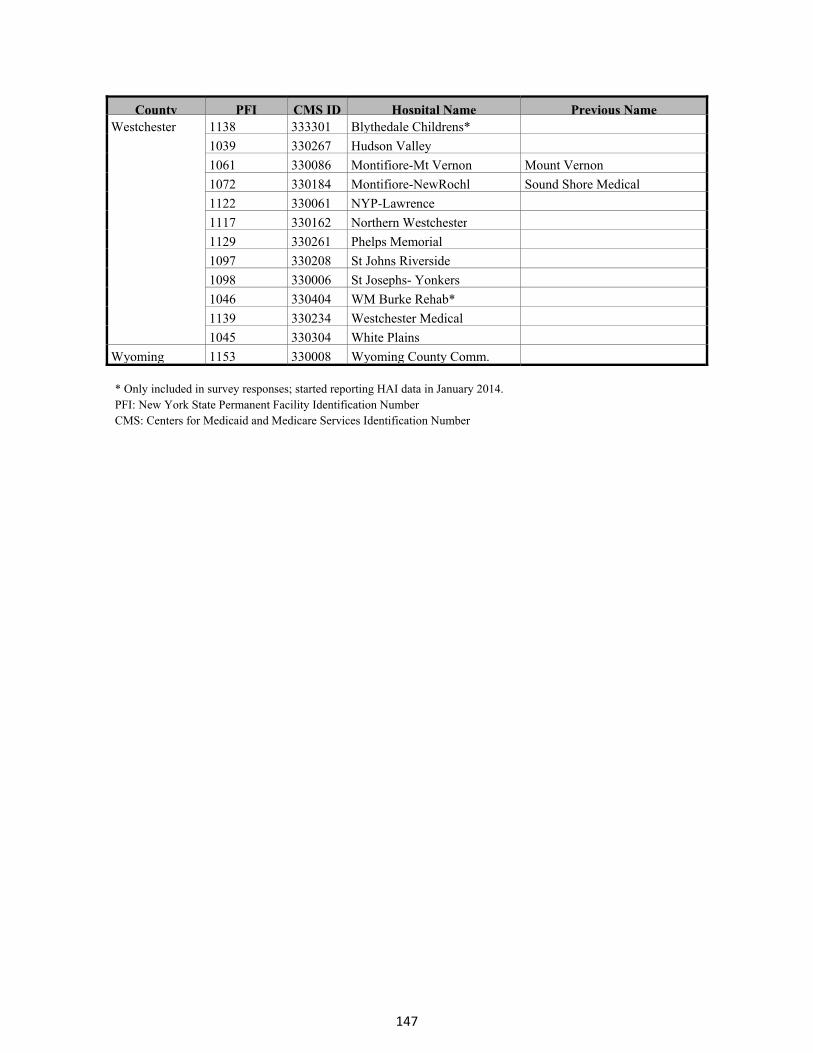
147
County PFI CMS ID Hospital Name Previous NameWestchester 1138 333301 Blythedale Childrens*
1039 330267 Hudson Valley
1061 330086 Montifiore-Mt Vernon Mount Vernon
1072 330184 Montifiore-NewRochl Sound Shore Medical
1122 330061 NYP-Lawrence
1117 330162 Northern Westchester
1129 330261 Phelps Memorial
1097 330208 St Johns Riverside
1098 330006 St Josephs- Yonkers
1046 330404 WM Burke Rehab*
1139 330234 Westchester Medical
1045 330304 White Plains
Wyoming 1153 330008 Wyoming County Comm. * Only included in survey responses; started reporting HAI data in January 2014. PFI: New York State Permanent Facility Identification Number CMS: Centers for Medicaid and Medicare Services Identification Number
148
Acknowledgements Howard Zucker, MD, JD, Acting Commissioner, New York State Department of Health Guthrie Birkhead, MD, MPH, Director, Office of Public Health Bradley Hutton, MPH, Director, Center for Community Health Debra Blog, MD, MPH, Director, Division of Epidemiology NYS HAI Reporting Program Personnel Director, Bureau of Healthcare-Associated Infections – Emily Lutterloh, MD, MPH HAI Reporting Program Director/Data Manager/Capital Area Representative – Valerie Haley, PhD Western Region Program Representative – Peggy Hazamy, RN, BSN, CIC Metropolitan Area (LI, Queens, Manhattan) Program Representative – Marie Tsivitis, MPH, CIC Metropolitan Area (SI, Brooklyn, Bronx to mid-Hudson Valley) Program Rep – Rosalie Giardina, MT(ASCP), CIC Central Region Program Representative – Robin Knab, CLT, MT(ASCP), CIC Data Analyst – Boldtsetseg Tserenpuntsag, DrPH State HAI Plan Coordinator (Feb 2014-current) – Kara Burke, MPH State HAI Plan Coordinator (through Dec 2013) – Cindi Dubner, BS Student Data Analyst – Christen Mayer, DrPHc, CLS(ASCP), CIC Student Data Analyst – Yifeng Wu, PhD Technical Advisory Workgroup Physicians
John Crane, MD, Erie County Medical Center Sarah Elmendorf, MD, Albany Medical Center Paul Graman, MD, Strong Memorial Hospital Brian Koll, MD, Beth Israel Medical Center Marisa Montecalvo, MD, Westchester Medical Center Lisa Saiman, MD, MPH, Columbia University Medical Center Kent Sepkowitz, MD, Memorial Sloan-Kettering Cancer Center Michael Tapper, MD, Lenox Hill Hospital Brian Valerian, MD, FACS, FASCRS, Albany Medical Center
Infection Preventionists Audrey Adams, RN, MPH, CIC, Montefiore Medical Center Donna Armellino, RN, DNP, CIC, North Shore University Hospital Melissa Bown, NP-C, Saratoga Hospital LeAnna Grace, RN, BSN, CIC, Rome Memorial Hospital Linda Greene, RN, MPS, CIC, Highland Hospital Janet Haas, RN, DNSc, CIC, Westchester Medical Center Charlene Ludlow, RN, CIC, Erie County Medical Center Jill Patak, RN, CIC, Our Lady of Lourdes Hospital
Consumer Arthur Levin, MPH, Center for Medical Consumers
Researcher Eileen Graffunder, BA, Albany Medical Center
Healthcare Organization Representatives Donna Farnsworth, RN, MHA, CIC, New York State APIC Coordinating Council
Hillary Jalon, MS, United Hospital Fund Lauren Johnston, RN, MPA, CNAA-BC, FACHE, NYC Health & Hospitals Corporation Karline Roberts, MS, IPRO, Medicare Quality Improvement Contactor for NY Zeynep Sumer, MS, Greater New York Hospital Association
Mary Therriault, RN, MS, Healthcare Association of New York State

149
References 1 Fridkin SK, Baggs J, Fagan R, et al. Vital signs: Improving antibiotic use among hospitalized patients. MMWR. Morbidity and mortality weekly report. 2014;63(09);194-200. 2 Magill SS, Edwards JR, Bamberg W, Beldavs ZG, Dumyati G, et al. Multistate Point-Prevalence Survey of Health Care – Associated Infections. NEJM. 2014; 370:1198-208. 3 New York State Department of Health. Statewide Planning and Research Cooperative System. http://www.health.ny.gov/statistics/sparcs/. (accessed August 14, 2014). 4 Scott RD. The direct medical costs of healthcare-associated infections in U.S. hospitals and the benefits of prevention. CDC, Division of Healthcare Quality Promotion, Atlanta GA, March 2009. Report CS200891-A. http://www.cdc.gov/HAI/pdfs/hai/Scott_CostPaper.pdf. (accessed August 14, 2014). 5 March M, Haley V, Lutterloh E. Analysis of the impact of surgical site infections on post-operative length of stay following hip replacements and revisions in New York State, 2008–2012. Poster, 2014 CSTE Conference, Nashville. 6 Moehring RW, Lofgren ET, Anderson DJ. Impact of change to molecular testing for Clostridium difficile infection on healthcare facility-associated incidence rates. Infect Control Hosp Epidemiol. 2013. 34:1055-1061. 7 Gould CV, Edwards JR, Cohen J, Bamberg WM, Clark LA, et al. Effect of nucleic acid amplification testing on population-based incidence rates of Clostridium difficile infection. Clin Infect Dis. 2013;57:1304-7.
8 Huang SS, Avery TR, Song Y, et al. Quantifying interhospital patient sharing as a mechanism for infectious disease spread. Infect Control Hosp Epidemiol. 2010;31:1160–1169. 9 Haley VB, DiRienzo AG, Lutterloh EC, Stricof RL. Quantifying bias in National Healthcare Safety Network Laboratory-identified Clostridium difficile infection rates. Infect Control Hosp Epidemiol. 2014;35(1):1-7. 10 Swaminathan M, Sharma S, Blash SP, Patel G, Banach DB, Phillips M, LaBombardi V, Anderson KF, Kitchel B, Srinivasan A, Calfee DP. Prevalence and risk factors for acquisition of carbapenem-resistant Enterobacteriaceae in the setting of endemicity. Infect Control Hosp Epidemiol. 2013; 34:809-817. 11 Borer A, Saidel-Odes L, Riesenberg K, Eskira S, Peled N, Nativ R, Schlaeffer F, Sherf M. Attributable mortality rate for carbapenem-resistant Klebsiella pneumoniae bacteremia. Infect Control Hosp Epidemiol. 2009; 30: 972-976.
150
12 Mouloudi E, Protonotariou E, Zagorianou A, Iosifidis E, Karapanagiotou A, Giasnetsova T, Tsioka A, Roilides E, Sofianou D, Gritsi-Gerogianni N. Bloodstream infections caused by metallo-β-lactamase/Klebsiella penumoniae carbapenemase-producing K. pneumoniae among intensive care unit patients in Greece: risk factors for infection and impact of type of resistance on outcomes. Infect Control Hosp Epidemiol. 2010; 31:1250-1256. 13 Schwaber MJ, Klarfeld-Lidgji S, Navon-Venezia S, Schwartz D, Leavitt A, Carmeli Y. Containment of a country-wide outbreak of carbapenem-resistant Klebsiella pneumoniae in Israeli hospitals via a nationally implemented intervention. Clin Infect Dis. 2011; 52:848–855. 14 Enfield KB, Huq NN, Gosseling MF, Low DJ, Hazen KC, Toney DM, Slitt G, Zapata HJ, Cox HL, Lewis JD, Kundzins JR, Mathers AJ, Sifri CD. Control of simultaneous outbreaks of carbapenemase-producing Enterobacteriaceae and extensively drug resistant Acinetobacter baumannii infection in an intensive care unit using interventions promoted in the centers for disease control and prevention. Infect Control Hosp Epidemiol. 2014; 35:810-814. 15 CDC. Vital signs: Carbapenem-resistant enterobacteriaceae. MMWR 2013; 62:165-170 16 Cohen AL, Calfee D, Fridkin SK, Huang SS, Jernigan JA, et al. Recommendations for metrics for multidrug-resistance organisms in healthcare settings: SHEA/HICPAC position paper. Infect Disease Hosp Epidemiol. 2008. 29: 901-913. 17 Dudeck MA, Weiner LM, Malpiedi PJ, Edwards JR, Peterson KD, Sievert D. Risk adjustment for healthcare facility-onset C. difficile and MRSA Bacteremia laboratory-identified event reporting in NHSN. 2012, CDC report. 18 New York State Department of Health. Vital statistics of New York State 2012. Table 33a: Deaths and death rates by selected causes and race New York State 2012. https://www.health.ny.gov/statistics/vital_statistics/2012/table33a.htm 19 CDC. Get Smart for Healthcare. http://www.cdc.gov/getsmart/healthcare/inpatient-stewardship.html. (accessed July 5, 2013). 20 Dancer SJ, Kirkpatrick P, Corcoran DS, et al. Approaching zero: temporal effects of a restrictive antibiotic policy on hospital-acquired Clostridium difficile, extended-spectrum B-lactamase-producing coliforms and methicillin-resistant Staphylococcus aureus. International Journal of Antimicrobial Agents. 2013; 41:137-142. 21 Nathwani D, Sneddon J, Malcolm W, et al. Scottish Antimicrobial Prescribing Group (SAPG): development and impact of the Scottish National Antimicrobial Stewardship Programme. International Journal of Antimicrobial Agents. 2011; 38:16-26.

151
22 Valiquette L, Cossette B, Garant MP, Diab H, Pepin J. Impact of a reduction in the use of high-risk antibiotics on the course of an epidemic of Clostridium difficile-Associated disease caused by the hypervirulent NAP1/027 strain. Clin Infect Dis. 2007;45 Suppl 2:S112-21. 23 Singh N, Rogers P, Atwood CW, Wagener MW, Yu VL. Short-course empiric antibiotic therapy for patients with pulmonary infiltrates in the intensive care unit. American Journal of Respiratory and Critical Care Medicine. 2000; 162:505-511. 24 Carling P, Fung T, Killion A, Terrin N, Barza M. Favorable impact of a multidisciplinary antibiotic management program conducted during 7 years. Infect Control Hosp Epidemiol. 2003; 24:699-706. 25 Dellit TH, Owens RC, McGowan JE Jr, et al. Infectious Diseases Society of America and the Society for Healthcare Epidemiology of America guidelines for developing an institutional program to enhance antimicrobial stewardship. Clin Infect Dis. 2007; 44:159-77. 26 Goff DA. Antimicrobial stewardship: bridging the gap between quality care and cost. Curr Opin Infect Dis. 2011; 24 Suppl 1:S11-20. 27 CDC. Core elements of hospital antibiotic stewardship programs. Atlanta, GA: US Department of Health and Human Services, CDC; 2014. Available at http://www.cdc.gov/getsmart/healthcare/pdfs/core-elements.pdf (accessed July 8, 2014). 28 CDC. National and State Healthcare-Associated Infections Progress Report. March 2014. Available at http://www.cdc.gov/HAI/pdfs/progress-report/hai-progress-report.pdf. (accessed July 2, 2014) 29 Birnbaum D, Zarate R, Marfin A. SIR, you’ve led me astray! Infect Control Hosp Epidemiol. 2011; 32:276-282. 30 Haley VB, Van Antwerpen C, Tserenpuntsag B, et al. Use of administrative data in efficient auditing of hospital-acquired surgical site infections, NYS 2009-2010. Infect Control Hosp Epidemiol. 2012; 33:565-571. 31 Hazamy PA, Van Antwerpen C, Tserenpuntsag B, Haley VB, Tsivitis M, et al. Trends in validity of central line-associated bloodstream infection surveillance data, New York State, 2007-2010. Am J Infect Control. 2013;41:1200-4. 32 New York State Department of Health. Adult Cardiac Surgery Reporting System. http://www.health.ny.gov/statistics/diseases/cardiovascular/. (accessed August 14, 2014). 33 Dodek PM, Norena M, Ayas NT, Romney M, Wong H. Length of stay and mortality due to Clostridium difficile infection acquired in the intensive care unit. Journal of Critical Care. 2013; 28: 335-340.
152
34 Gravel D, Miller M, Simor A, Taylor G, Gardam M, McGeer A, Hutchinson J, Moore D, Kelly S, Boyd D, Mulvey M, Canadian Nosocomial Infection Surveillance Program. Health care-associated Clostridium difficile infection in adults admitted to acute care hospitals in Canada: a Canadian Nosocomial Infection Surveillance Program study. Clinical Infectious Diseases. 2009; 48:568-576.
35 Kenneally C, Rosini JM, Skrupky LP, Doherty JA, Hollands JM, Martinez E, McKenzie W, Murphy T, Smith JR, Micek ST, Kollef MH. Analysis of 30-Day mortality for Clostridium difficile-associated disease in the ICU setting. Chest. 2007; 132:418-424.
36 Loo VG, Poirier L, Miller MA, Oughton M, Libman MD, Michaud S, Bourgault A, Nguyen T, Frenette C, Kelly M, Vibien A, Brassard P, Fenn S, Dewar K, Hudson TJ, Horn R, René P, Monczak Y, Dascal A. A predominantly clonal multi-institutional outbreak of Clostridium difficile-associated diarrhea with high morbidity and mortality. New England Journal of Medicine. 2005; 353:2442-2449.
37 Pépin J, Valiquette L, Cossette B. Mortality attributable to nosocomial Clostridium difficile-associated disease during an epidemic caused by a hypervirulent strain in Quebec. Canadian Medical Association Journal. 2005: 173(9).
38 Tabak YP, Zilberberg MD, Johannes RS, Sun X, McDonald LC. Attributable burden of hospital-onset Clostridium difficile infection: a propensity score matching study. Infect Control Hosp Epidemiol. 2013; 34:588-596.
39 Harbarth S, Rutschmann O, Sudre P, Pittet D. Impact of methicillin resistance on the outcome of patients with bacteremia caused by Staphylococcus aureus. Archives of Internal Medicine. 1998; 158:182-189.
40 DeKraker MEA, Wolkewitz M, Davey PG, Grundmann H. Clinical impact of antimicrobial resistance in European hospitals: excess mortalitiy and length of hospital stay related to methicillin-resistant Staphylococcus aureus bloodstream infections. Antimicrobial Agents and Chemotherapy. 2011; 55:1598-1605.
41 Carmeli Y, Eliopoulos G, Mozaffari E, Samore M. Health and economic outcomes of vancomycin-resistant enterococci. Archives of Internal Medicine. 2002; 162:2223-2228.
42 Edmond MB, Ober JF, Dawson JD, Weinbaum DL, Wenzel RP. Voncomycin resistant enterococcal bacteremia: Natural history and attributable mortality. Clinical Infectious Diseases. 1996; 23:1234-1239.
43 Song X, Srinivasan A, Plaut D, Perl TM. Effect of nosocomial vancomycin-resistant enterococcal bacteremia on mortality, length of stay, and costs. Infect Control Hosp Epidemiol. 2003; 24:251-256.
44 Stosor V, Peterson LR, Postelnick M, Noskin GA. Enterococcus faecium bacteremia: does vancomycin resistance make a difference? Archives of Internal Medicine. 1998; 158:522-527.

153
45 Blot S, Vandewoude K, Colardyn F. Nosocomial bacteremia involving Acinetobacter baumannii in critically ill patients: a matched cohort study. Intensive Care Medicine. 2003; 29:471-475.
46 Grupper M, Sprecher H, Mashiach T, Finkelsteing R. Attributable mortality of nosocomial Acinetobacter bacteremia. Infect Control Hosp Epidemiol. 2007; 28:293-298.
47 Wisplinghoff H, Perbix W, Seifert H. Risk factors for nosocomial bloodstream infections due to Acinetobacter baumannii: a case-control study of adult burn patients. Clin Infect Dis. 1999; 28:59-66.