hospital maternity care report card, 2016
TRANSCRIPT

1 | P a g e
Revised on 6/14/2021
New Jersey
Hospital Maternity Care
Report Card, 2019

2 | P a g e
HEALTHCARE QUALITY AND INFORMATICS
Prepared by:
Erin Mayo, DVM, MPH Genevieve Lalanne-Raymond, RN, MPH
Mehnaz Mustafa, MPH, MSc Yannai Kranzler, PhD
Technical Support
Andreea A. Creanga, MD, PhD
Debra Bingham, DrPH, RN, FAAN Jennifer Fearon, MPH Marcela Maziarz, MPA
Hospital Partners
Diana Contreras, MD-Atlantic Health System Lisa Gittens-Williams, MD Obstetrics & Gynecology– University Hospital
Thomas Westover, MD, FACOG- Cooper University Health Care
Perry L. Robin, MD, MSEd, FACOG- Cooper University Health Care Hewlett Guy, MD, FACOG- Cooper University Health Care
Suzanne Spernal, DNP, APN-BC, RNC-OB, CBC- RWJ Barnabas Health

3 | P a g e
Table of Contents
Statute ...............................................................................................................................................5
Summary of the Statute ...................................................................................................................5
Summary of Findings ......................................................................................................................6
Key Recommendations....................................................................................................................7
Background........................................................................................................................................8
Obstetric Hemorrhage .....................................................................................................................9
Severe Maternal Morbidity ..............................................................................................................9
Post-admission Infections ................................................................................................................9
Third- and Fourth-Degree Perineal Lacerations ............................................................................... 10
Episiotomy ................................................................................................................................... 10
Methods ........................................................................................................................................... 10
Data Sources ................................................................................................................................ 10
Summary of Steps to Create Analytic File ...................................................................................... 11
Electronic Birth Certificate Data, 2019 ................................................................................... 11
Data Matching .............................................................................................................................. 12
Figure 2. Summary of Data Matching Process: EBC to Inpatient Hospitalization Records, New
Jersey, 2019 ............................................................................................................................ 13
The Study Population ............................................................................................................. 13
Identification of delivery-associated complications ......................................................................... 14
Risk Factors for Delivery-Associated Complications .............................................................. 15
Table 1. List of Covariables Considered for Analysis ...................................................................... 16
Statistical Analysis ........................................................................................................................... 18
Risk Adjustment ........................................................................................................................... 18
Table 2a. Risk Factors Identified for Obstetric Hemorrhage ............................................................. 20
Table 2b. Risk Factors Identified for Severe Maternal Morbidities with Transfusion ......................... 21
Table 2c. Risk Factors Identified for Post-admission Infections – All Deliveries ............................... 22
Table 2d. Risk Factors Identified for Post-admission Infections – Cesarean Deliveries ...................... 23
Table 2e. Risk Factors Identified for Post-admission Infections – Vaginal Deliveries ........................ 24
Limitations....................................................................................................................................... 25
Obstetric Hemorrhage ................................................................................................................... 25
Severe Maternal Morbidities with Transfusion ................................................................................ 25
Post-admission Infections .............................................................................................................. 25
Third- and fourth-degree Perineal Lacerations ................................................................................ 25

4 | P a g e
Episiotomy ................................................................................................................................... 26
References ....................................................................................................................................... 27
Appendix A: Inclusion & Exclusion Criteria to Identify Reported Complications.................................. 29
Obstetric Hemorrhage ................................................................................................................... 29
Post-admission Infection ............................................................................................................... 29
Third- and Fourth-degree Perineal Lacerations................................................................................ 30
Episiotomy ................................................................................................................................... 31
Severe Maternal Morbidity ............................................................................................................ 31

5 | P a g e
Statute
Summary of the Statute
In 2018, New Jersey legislature enacted P.L. 2018, c.82, which requires the Department of
Health to issue a report on hospital maternity care. Specifically, the statute states that:
1. The Commissioner of Health shall gather and compile information necessary to develop a
New Jersey Report Card of Hospital Maternity Care (Report Card), as provided for in this act. The Report Card, which shall be updated annually and made available on the website of the Department of Health, shall be designed to inform members of the public about
maternity care provided in each general hospital licensed pursuant to P.L.1971, c.136 (C.26:2H-1 et 13 seq.), so that a member of the public is able to make an informed
comparison.
2. For each hospital, the Report Card shall include:
a. the number of vaginal deliveries performed; b. the number of cesarean deliveries performed; and c. the rate of complications experienced by a patient receiving maternity care:
i. for a vaginal delivery, which shall include the rate of maternal hemorrhage, laceration, infection, or other complication as prescribed by
the Commissioner of Health; and ii. for a cesarean delivery, which shall include the rate of maternal
hemorrhage, infection, operative complication, or other complication as
prescribed by the Commissioner of Health.
3. Notwithstanding the provisions of section 2 of this act to the contrary, the commissioner shall revise or add complications or other factors to be included in the Report Card based on maternal quality indicators as may be recommended by the American Congress of
Obstetricians and Gynecologists.
A major goal of this report is to provide important information on maternal health care
provided in New Jersey by licensed birthing general acute care hospitals.

6 | P a g e
Summary of Findings
Overview of Delivery Hospitalizations for NJ mothers in 2019:
• The racial/ethnic profile of NJ mothers is changing; minorities now represent 53% of all
births compared to 46% in 2000
• Compared to 2018, there was
o a 2% decline in the number of delivery hospitalizations at 49 licensed birthing
general acute care hospitals
o a 2% increase in mothers covered by private insurance
o a 3% decrease in mothers covered by Medicaid
• Cesarean delivery rates dropped to 33.3% of all delivery hospitalizations, a decrease of
3% from the 2018 rate and a decrease of 14% from the highest rate in 2010
• Cesarean deliveries had higher rates of complications (obstetric hemorrhage, post-
admission infections, Severe Maternal Morbidity [SMM]) than vaginal deliveries
Variation in Delivery Outcomes by Hospital:
• Vaginal Birth after Cesarean (VBAC) rates for all delivery hospitalizations varied from
hospital to hospital, ranging from 0% to 7.9%, with a statewide rate of 2.4%
• Episiotomy rates varied widely hospital to hospital, from 1% to 28%, while the statewide
rate was 6.3%
• Rates of third- and fourth-degree perineal laceration without an instrument varied from
0% to 3.6%, compared to the statewide rate of 1.4%
• The rate of SMM with transfusion was significantly higher than the statewide rate at 9
birth hospitals (18%), which is an increase from 2018 during which 6 birthing hospitals
(12%) had significantly higher rates, but is a drop from 2016 during which 10 birthing
hospitals (20%) had significantly higher rates
• Thirteen birth hospitals (27%) had significantly higher post-admission infections rate
than the statewide rate, which is an increase from 2018 during which 11 birthing
hospitals (22%) had significantly higher post-admission infections rates, but the same as
2016
• Of the 49 birthing hospitals in New Jersey, 18 (37%) had significantly higher Obstetric
hemorrhage rates than the statewide rate, while 13 (27%) had significantly lower
Obstetric hemorrhage rates than the statewide rate
• Only 20 of the 49 hospitals (41%) did not have any risk-adjusted complication rates that
were significantly higher than the statewide rate investigated in the current report, which
means that greater than half of all birthing facilities in NJ have significantly higher rates
of complications in at least one of the three reported categories (obstetric hemorrhage,
post-admission infections, SMM)

7 | P a g e
Complication Rates by Race/Ethnicity:
• Asian mothers had the highest rate of third- and fourth-degree perineal lacerations
without instrument with 3.1 per 100 delivery hospitalizations while the rate for Non-
Hispanic Black mothers was the lowest at 0.9 per 100 delivery hospitalizations.
• Asian mothers had the highest rate of episiotomy with 14.7 per 100 delivery
hospitalizations, while the rate for Non-Hispanic Black mothers was the lowest at 3.6 per
100 delivery hospitalizations.
• Non-Hispanic Black mothers had the highest rate of SMM with transfusion at a rate of
35.6 per 1,000 delivery hospitalizations, which is a decrease from the 2018 rate of 37.7
per 1,000 delivery hospitalizations; the rate for Non-Hispanic White mothers was the
lowest at 13.6 per 1,000 delivery hospitalizations.
• Non-Hispanic Black mothers suffered the highest rate of post-admission infections at a
rate of 23.0 per 1,000 delivery hospitalizations while the rate for Non-Hispanic White
mothers was the lowest at 11.2 per 1,000 delivery hospitalizations.
• Non-Hispanic Black mothers suffered the highest rate of Obstetric hemorrhage with 60.6
per 1,000 delivery hospitalizations, and the rate for Non-Hispanic White mothers was
46.7 per 1,000 delivery hospitalizations.
Key Recommendations
In collaboration with New Jersey Maternal Care Quality Collaborative (NJMCQ):
• Further research will be needed to understand the mechanisms that contribute to Obstetric
hemorrhage, third- and fourth-degree perineal lacerations, post-admission infections and
Severe Maternal Morbidity (SMM) at the hospital level.
• Variation in outcomes between hospitals highlight the need to encourage the use of
standardized practice guidelines, such as the adoption of a standard measure for
Quantitative Blood Loss (QBL) to ensure accuracy of data.
• Based on the statistically significant risk-adjusted complication rates (i.e. SMM, post-
admission infections, obstetric hemorrhage) amongst mothers who experienced cesarean
deliveries, it is important to identify the modifiable risk factors that contribute to cesarean
delivery through carefully designed research studies.
While there is a wealth of research and proven methodologies to improve maternal outcomes, the current report highlights the continuing need for improvement in New Jersey. For example,
nulliparous status is found to be associated with an increased risk of complications. This suggests that labor and delivery management guidelines should be developed and adopted to address the
differences in labor progression and outcomes between nulliparous and multiparous mothers. Through cooperation between hospitals and the NJMCQC, the development and adoption of appropriate quality improvement methods will have a vast impact on the quality of maternity
care in New Jersey.

8 | P a g e
Background
An increasing body of literature documents childbirth as a significant life event that can
be both positive and traumatic depending on the woman’s experience during delivery (Berg M et al., 2003; Elmir R et al., 2010). This experience is largely influenced by an array of mild adverse
effects to life-threatening events or death that can occur during or shortly after delivery. These morbidities and complications require various levels of intervention from non-invasive (i.e. medication taken by mouth or intravenously) to invasive (i.e. blood transfusion) interventions to
save both the woman’s life and her offspring’s life. To fully understand and reduce maternal morbidities and delivery complications, there is a need for consistent measurement, collection,
analysis and dissemination of data related to specifically address labor and delivery. Availability of good quality health care data that allows the construction of performance metrics to support quality improvement efforts is fundamental. Patients and their physicians can use these metrics
to inform their discussion in determining the best hospital for the patients’ health care and labor and delivery needs.
In this report, the Department of Health uses data collected on all hospital-based births as
reported through the Electronic Birth Certificate (EBC) system. The EBC data was
complemented by matching records with hospitalization discharge records from each of the hospitals where births occurred. The process also allowed us to capture additional maternal
health characteristics that were not included in the EBC. To account for the patient mix at each birthing facility, risk-adjusted rates of delivery-
associated complications, described below, were then calculated . ‘Risk-adjusted’ rates are rates calculated that reflect the mother’s health conditions including her social, demographic,
economic statuses. The risk-adjustment process allows for fair comparisons across hospitals, which treat diverse patient populations. Risk-adjusted rates are expressed as ratios of expected complications to observed complications harmonized by the statewide complication rate.
Statistical significance is assessed by whether the statewide rate crosses the range between the lower and upper bounds of the confidence limits. A difference is considered ‘statistically
significant’ when the statewide rate falls outside the confidence limits estimated for the hospital rate. As an example, a hospital’s rate is statistically significantly higher than the statewide rate if the corresponding hospital’s rate confidence bound is completely above the statewide rate. By
comparison, we say the hospital’s rate is statistically significantly lower than the statewide rate when the statewide rate falls above the corresponding hospital confidence bound.
The measures assessed in this report are: third- and fourth-degree perineal laceration,
episiotomy, obstetric hemorrhage, post-admission infections and Severe Maternal Morbidity as a
surrogate for “Other Complications”. In the following sections, we will discuss each measure in more detail.

9 | P a g e
Obstetric Hemorrhage
Per the American Congress of Obstetricians and Gynecologists (ACOG), obstetric
hemorrhage is a cumulative blood loss greater than 1,000 ml regardless of the method of delivery
(i.e. vaginal or cesarean birth) or blood loss accompanied by signs or symptoms of hypovolemia
within 24 hours after the birth process (ACOG Practice Bulletin No.183, 2017). However, blood
loss greater than 500mL in a vaginal delivery is abnormal and should be investigated and
managed (ACOG Practice Bulletin No.183, 2017). Obstetric hemorrhage is common amongst
women during delivery or post-delivery secondary to uterine atony, genital tract trauma (i.e.
vaginal or cervical lacerations), uterine rupture, retention of placental tissue, or maternal
coagulation disorders (ACOG Practice Bulletin No.183, 2017). In addition to being strongly
associated with severe maternal morbidities, about a quarter of maternal deaths are due to
hemorrhage during delivery or post-delivery (WHO, 2012). Considering the potential negative
maternal outcomes linked to obstetric hemorrhage, healthcare providers are encouraged to
closely assess for potential risk factors and be ready to implement multidisciplinary and
multifaceted guidelines to maintain hemodynamic stability while identifying and treating the
cause of blood loss in cases where it occurs (ACOG Practice Bulletin No.183, 2017).
Severe Maternal Morbidity
The Centers for Disease Control and Prevention (CDC) refers to Severe Maternal
Morbidity (SMM) as a list of unexpected outcomes of labor and delivery that result in signif icant
short- or long-term consequences to a woman’s health (CDC, 2017). This list of unexpected
outcomes of labor and delivery (morbidities) encompasses a continuum of health conditions
including life-threatening and disabling diseases, organ dysfunction and/or receipt of invasive
therapy, during labor and/or after delivery (Frioz et al., 2013). The 2014 SMM report published
by the CDC showed a steady national increase in SMM. It is argued that certain
sociodemographic factors (i.e. increasing maternal age), chronic disease and increasing rate of
cesarean deliveries may have contributed to the rise in SMM rates (Martin et al., 2017).
Considering the potential consequences of SMM on a woman’s health, the CDC recommends
identifying the underlying factors of SMM and designing interventions to target them with the
goal of improving the quality of maternal care.
Post-admission Infections
Bacterial infections that occur during labor or the puerperium (period of approximately
six weeks following childbirth) usually have a good prognosis when identified and treated
promptly, however, occasionally they can become severe and result in morbidity or rarely
mortality (Cantwell R et al., 2011). Beyond the immediate effects of the infection, long-term
complications can include chronic pelvic pain, fallopian tube blockage or infertility (WHO,
2015). Factors that can lead to infections include pre-existing maternal conditions, such as
diabetes or obesity, as well as conditions that may arise during labor, such as premature rupture
of the membranes and cesarean birth (Acosta CD et al., 2014). Current recommendations for
prevention of infections include judicious use of prophylactic antibiotics (ACOG Practice
Bulletin No.199, 2018). While most postpartum infections are diagnosed after the patient is

10 | P a g e
discharged from the hospital (Yokoe D et al., 2001), the current report only includes those
diagnosed during the initial delivery hospitalization.
Third- and Fourth-Degree Perineal Lacerations
Vaginal and perineal trauma often occur during vaginal birth, either spontaneously or secondarily from an episiotomy, which is a surgical incision of the perineum to enlarge the
opening for passage of the baby during delivery. Third- and fourth-degree perineal lacerations are severe tears of the vagina and perineum that also may involve tissues of the anus (Royal College, 2007 & 2015). Short-term consequences of these lacerations may include pain and
infection (Buppasiri et al., 2014; Fitzpatrick et al., 2005), while potential long-term complications include incontinence and fistula formation (Guise et al., 2007). While lacerations
during vaginal birth are not completely avoidable, there are measures that can help avoid or lessen their severity. The American Congress of Obstetricians and Gynecologists (ACOG) has compiled a set of recommendations to mitigate the risk of obstetric lacerations, including the
avoidance of routine episiotomy (ACOG Practice Bulletin No.198, 2018).
Episiotomy
An episiotomy is a surgical incision of the perineum to enlarge the posterior aspect of the
vagina and is generally performed during the second stage of labor. National rates of episiotomy
have been decreasing, with approximately 12% of vaginal deliveries including an episiotomy in
2012 (ACOG Practice Bulletin No.198, 2018). Current recommendations are to restrict the use of
this procedure, including in specific clinical situations, such as shoulder dystocia and operative
vaginal delivery for which there is insufficient evidence of benefit of the procedure (ACOG
Practice Bulletin No.198, 2018).
Methods Data Sources
Electronic Birth Certificate (EBC) Data: The Health Department’s Office of Vital Statistics
has been collecting data on all live births in New Jersey since 1966 in electronic format with its most recent birth records reported through the Vital Information Platform (VIP). In addition to registering information about the child, EBC contains demographic information, including the
mother’s age, race, ethnicity, education status, health insurance status, the mother’s health status as well as information about the pregnancy, such as parity, prenatal care and method of delivery.
Inpatient Hospital Discharge Data: The Office of Health Care Quality Assessment (HCQA) of the Centers for Healthcare Quality and Informatics in the New Jersey Department of Health has
been collecting data on hospital encounters via the New Jersey Hospital Discharge Data Collection System (NJDDCS) since 1980. As of 2004, NJDDCS includes emergency, inpatient,
outpatient and same day surgery discharges. A hospital discharge record contains demographic, geographic, International Classification of Diseases, tenth Revision, Clinical Modification (ICD-10-CM) diagnosis and procedure codes, hospital charges, discharge statuses, types of services
provided and other data elements. The department collects all hospital discharges that occurred in each calendar year. Thus, a 2019 birth-related hospitalization that occurs at the end of the

11 | P a g e
calendar year may be reported with 2020 discharges. Moreover, NJDDCS is hospital encounter data where a patient (in this case, a mother) could have multiple hospitalizations within the same
calendar year. For the purposes of this report, only the first birth-related encounter is included.
The Report Card uses maternal information reported in the EBC and additional data
elements from hospital discharge records by matching each birthing mother’s information with her corresponding hospital discharge clinical information reported through ICD-10-CM
diagnosis and procedure codes.
Summary of Steps to Create Analytic File
Inpatient Hospitalization Data
• Inclusion criteria o All females who gave birth at a Hospital in New Jersey
o 12 to 65 years of age o First record for each patient (mother)
o 2019 birth-related hospitalizations and 2020 discharges for late 2019 admissions
• Exclusion criteria o Duplicate records for same encounter o Males o Younger than 12 years old or older than 65 years old
o Same Day Surgery, ER outpatient or Other Outpatient discharges
Electronic Birth Certificate Data, 2019
• Inclusion criteria o All New Jersey hospital births
In cases of multiple births, select only 1 record
• Exclusion criteria o All out-of-state births o Births in freestanding birthing centers, home, clinic/doctor’s office,
other/unspecified location o Multiple babies to same mother except the first record
12 | P a g e
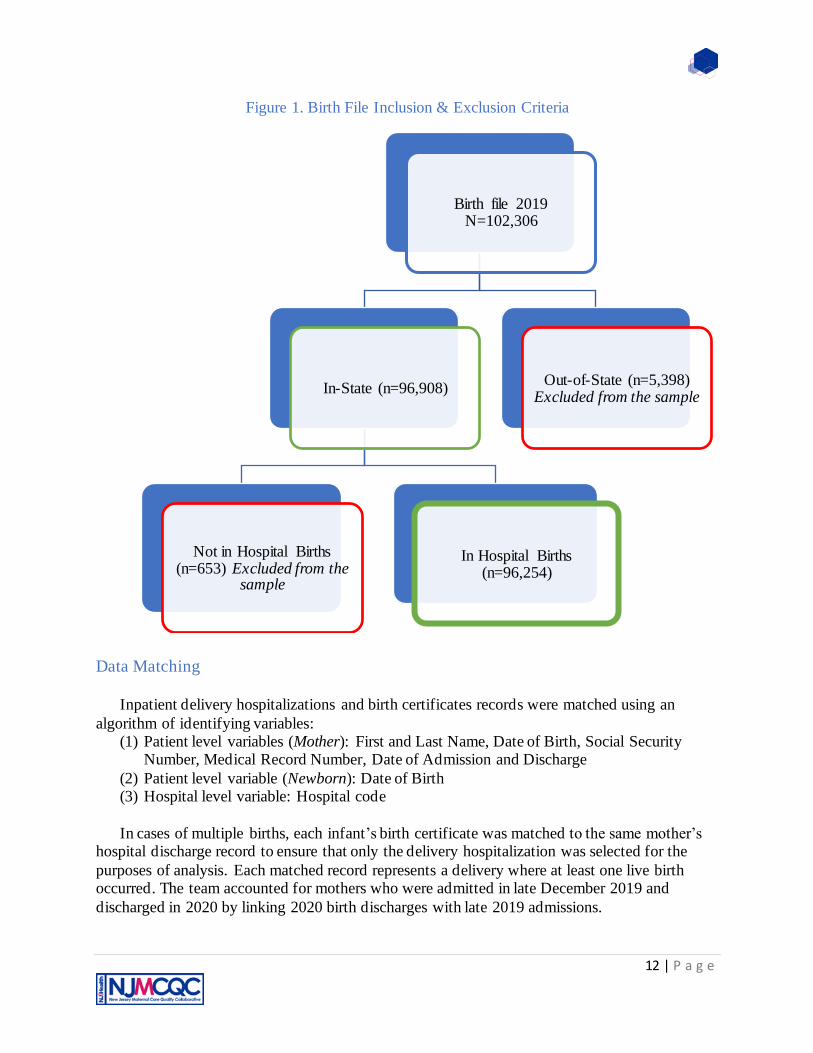
Figure 1. Birth File Inclusion & Exclusion Criteria
Data Matching
Inpatient delivery hospitalizations and birth certificates records were matched using an
algorithm of identifying variables: (1) Patient level variables (Mother): First and Last Name, Date of Birth, Social Security
Number, Medical Record Number, Date of Admission and Discharge
(2) Patient level variable (Newborn): Date of Birth (3) Hospital level variable: Hospital code
In cases of multiple births, each infant’s birth certificate was matched to the same mother’s
hospital discharge record to ensure that only the delivery hospitalization was selected for the
purposes of analysis. Each matched record represents a delivery where at least one live birth occurred. The team accounted for mothers who were admitted in late December 2019 and
discharged in 2020 by linking 2020 birth discharges with late 2019 admissions.
Birth file 2019 N=102,306
In-State (n=96,908)
Not in Hospital Births (n=653) Excluded from the
sample
In Hospital Births (n=96,254)
Out-of-State (n=5,398) Excluded from the sample

13 | P a g e
Figure 2. Summary of Data Matching Process: EBC to Inpatient Hospitalization Records, New
Jersey, 2019
*8 records from Mullica Hill and unknown birthing facilities removed for analysis
The Study Population
As part of the process to obtain data to analyze, the team identified 96,254 in-hospital deliveries out of the 102,306 New Jersey births in 2019. These deliveries were comprised of all
records including singleton births and multiple births. Of the 96,254 in-hospital deliveries identified, 94,627 deliveries were successfully matched to hospital discharge records for a match rate was 98.3%. Inability to match all records is due to multiple factors, including large
discrepancies in the reported identifying variables and incidences of non-reported discharge records for some 2019 deliveries. However, as no pattern in key characteristics of the unlinked
Matched Records
94,627(98.3%)
2019 Admissions -Inpatient
Hospitalization Records
N=273,663
2019 In-Hospital Birth Records
N=96,254
Number of
Matched
Delivery
Hospitalizations N=93,107*

14 | P a g e
records as compared to linked records was seen, it was concluded that there was no systematic bias introduced by proceeding with the current analysis. Hospitals with greater than 10%
unlinked records have been flagged to alert viewers to consider the reported numbers carefully. To identify the number delivering mothers, the first record for each singleton birth or first record of multiple births (e.g. twins, triplets) was used in creating the preliminary analysis file to obtain
93,107 records.
Once the analytic file was created, the next steps included identifying, defining and reviewing the required reportable measures as suggested in the Statute, namely: hemorrhage (Obstetric hemorrhage), laceration (third- and fourth-degree perineal laceration), episiotomy,
infections (post-admission infections) and other complications (where Severe Maternal Morbidity is used as surrogate).
Identification of delivery-associated complications
Obstetric Hemorrhage
The ACOG standard defines hemorrhage as blood loss of greater than 1,000cc ml regardless of the method of delivery (i.e. vaginal or cesarean birth) or blood loss accompanied by signs or symptoms of hypovolemia within 24 hours. The Maternal Blood Loss amount reported
in cc in the birth certificate data is used to determine the amount of maternal blood loss (hemorrhage) during the delivery hospitalization. There are several caveats when using the above
information to identify obstetric hemorrhage. First, there is no specified time-period for the blood loss; it is assumed that all hospitals are measuring blood loss during the same time-period during the hospitalization. Second, the method of blood loss measurement may not be performed
similarly across all facilities; some may use a quantified blood loss measurement method while others may report estimated blood loss. Lastly, there is no specification whether signs of
hypovolemia were present, which could aid in the final determination of a true diagnosis of hemorrhage.
Severe Maternal Morbidity as proxy for “Other Complications” Severe Maternal Morbidity (SMM) events were identified during delivery hospitalizations
using an algorithm developed by researchers at the Centers for Disease Control and Prevention (CDC) (CDC,2017). The algorithm identifies 18 indicators of SMM that represent either life
threatening conditions—such as eclampsia or acute renal failure—or procedure codes for life-saving procedures—such as blood transfusion, ventilation or hysterectomy. The 18 indicators
were identified using ICD-10-CM diagnosis codes and procedure codes as prescribed by the CDC (CDC,2017).
In addition to the above algorithm, to ensure the most conservative estimate of SMM, we excluded hospitalizations with a length of stay less than the 90th percentile as calculated
separately for vaginal, primary and repeat cesarean deliveries (Callaghan WM et al., 2012). All SMM hospitalizations associated with in-hospital mortality or transfer-in or -out of the delivery facility, as well as those associated with procedure codes were included, regardless of length of
stay. In hospital death was identified via the discharge status specifying the patient as ‘expired’. Additionally, transfers were identified using both discharge status and admission source
information.

15 | P a g e
Post-admission Infections
A comprehensive list of ICD-10-CM diagnosis codes, presented in Appendix A of this
report, along with information from Electronic Birth Certificate (presence of Intrapartum
infections and Clinical Chorioamnionitis) data are used to identify all cases of delivery-
associated infections that occur during the delivery hospitalization. Additionally, only cases of
infection that are not present on admission are included to eliminate instances of pre-admission
infections from the final analysis.
Third- and Fourth-degree Perineal Laceration (vaginal birth only) Perineal laceration associated with delivery is divided into two categories: third - and
fourth-degree perineal lacerations differentiated by those with and without instrument. To identify perineal lacerations, we used the Agency for Healthcare Research and Quality (AHRQ)
Patient Safety Indicator PSI 18 and PSI 19 definitions and associated ICD-10-CM diagnosis codes, as well as the occurrence of a third- or fourth-degree perineal laceration as reported in the Electronic Birth Certificate data (see Appendix A). Perineal laceration is associated with having
a large baby (Groutz A. et al., 2011; Vale de Castro, M. et al., 2016), therefore in addition to the AHRQ PSI guidelines, vaginal delivery hospitalizations excluding those with overweight babies
(those weighing greater than 4,000 grams) are included in the rate calculation of this complication to account for the variable distribution of overweight babies in our NJ delivery hospitalizations.
Episiotomy (vaginal birth only)
To identify episiotomy, we used the associated ICD-10-CM procedure code: 0W8NXZZ
(see Appendix A). To account for providers that may follow the guideline to use episiotomy for
management of shoulder dystocia (Royal College, 2015), only vaginal delivery hospitalizations
excluding those with shoulder dystocia are included in the rate calculation of this complication.
Risk Factors for Delivery-Associated Complications
The observed complication rate for a measure in each facility is estimated as the number of patients that experienced the complication during the delivery hospitalization divided by the
total number of delivery hospitalizations at risk for that complication in that facility during the period of investigation. However, this observed complication rate does not provide a fair assessment of the quality of care provided by the facility or providers, because it does not
account for potential risk factors present prior to hospitalization. When assessing outcomes, it is important to account for differences in patient characteristics; for example, hospitals (facilities)
that serve patients with pre-existing health conditions, such as cardiac or respiratory diseases, would be expected to have higher rates of complications.
To perform a fairer assessment of the quality of maternal healthcare provided by NJ
hospitals that perform deliveries, the Department uses risk-adjustment to estimate complication rates. Risk adjustment is a method to account for the pre-delivery risk factors of each patient that
may affect health care outcomes and improve comparability of results. In doing so, hospitals that serve high risk patients will not be at a disadvantage when their estimated rates are presented side-by-side with facilities that serve healthier patients. Risk adjustment is performed using
statistical regression modeling, an indirect method of standardization. A mixed effects stepwise

16 | P a g e
logistic regression model was fitted for the outcome of interest, and risk factors that were controlled for included social, demographic and pre-hospitalization risk factors. For each
reported outcome, the selected risk factors were identified based on a literature review and expert consultations using the principles of appropriateness, viability (i.e., sufficient number of events) and data availability. The fitted model was used to obtain the predicted number of complications
for each hospital, which is then used to compare against the observed number of complications for each hospital. Further details on the statistical risk adjustment methodology are provided in
the following section. The pre-delivery risk factors used in the statistical models include mothers’ socio-
demographic characteristics (e.g., race/ethnicity, age, health insurance coverage, educational
attainment, marital status), clinical and obstetric factors (e.g., parity, method of delivery, body mass index, prenatal care) (Table 1). We also adjusted for clinical comorbidities (e.g., diabetes;
hypertension; chronic liver, respiratory, cardiac and renal diseases; placental disorders) as well as behaviors associated with increased risk of complications (e.g., tobacco use, alcohol and illicit drug abuse) (Table 1). These factors were obtained from ICD-10-CM diagnosis codes as reported
through the hospitalization database and the information in the Electronic Birth Certificate. A report, which assessed the validity of information obtained from birth files compared with that in
hospital discharge data, shows that a combination of the two data sources is most accurate (Lydon-Rochelle M. et al., 2005). In this report:
• A complication is considered if documented by a corresponding diagnosis code, or if it was identified on the birth file.
• Method of delivery is defined as specified by the Agency for Healthcare Research and Quality Inpatient Quality Indicator 33 to identify primary and repeat cesarean deliveries.
Table 1. List of Covariables Considered for Analysis
Values/Categories
Sociodemographic Characteristics
Race/ Ethnicity Non-Hispanic White
Non-Hispanic Black Hispanic Non-Hispanic Asian
Other/ Multi-race
Maternal Age <35 35+
Educational Status < High School
High School Some College College and College+
Health Insurance Coverage Private Insurance Medicaid Self-Pay/Charity Care
Other
Marital Status Married Not Married

17 | P a g e
Clinical & Obstetric factors/ Comorbidities
Method of Delivery Vaginal (with and without instrument) Cesarean (Primary, Repeat)
Parity Nulliparous Multiparous
Gestational Age Premature- before 37 weeks of gestation Mature- after 37 weeks of gestation
Diabetes Mellitus (Gestational & Preexisting)
Yes/No
Hypertension (Gestational &
Preexisting)
Yes/No
Chronic Disease: Cardiac, Renal, Respiratory, Liver
Yes/No
Placental Disorders (Placenta Abruptio,
Previa and /or Accreta)
Yes/No
Uterine ruptured and/or Uterine atony Yes/No
HIV status Positive/ Negative
Prenatal Care Utilization Early (1st Trimester) Late/None (None, 2nd & 3rd Trimester)
Pre-pregnancy Body Mass Index (BMI) Underweight (Below 18.5)
Normal (18.5 – 24.9) Overweight (25.0 – 29.9)
Obese (30.0 and Above)
Length of Labor Precipitous Labor (Less than 3 hours) Prolonged Labor (Greater than or equal to 20 hours)
Infant Birthweight Low birthweight less-than 2,500 grams
Normal-birthweight- between 2,500 grams and 4,000 grams Overweight (macrosomia)- over 4,000 grams
Induction of Labor (Labor induction is the process or treatment that stimulates
childbirth and delivery)
Yes/No
Epidural or Spinal Anesthesia Yes/No
Shoulder Dystocia Yes/No
Premature Rupture of Membranes No PROM Full term PROM
Preterm PROM PROM Gestation unspecified
Cervical dilation at time of admission
(cm.)
≤3 cm
4+ cm
Preexisting Anemia Yes/No
Preeclampsia Yes/No
Behavioral Risk Factors
Substance Use Yes/No
Alcohol Use Yes/No
Tobacco Use Yes/No

18 | P a g e
Statistical Analysis
Risk Adjustment
Patient case mix varies across hospitals, which may result in variation of delivery outcomes. Therefore, to ensure each NJ birthing facility gets a fair assessment, it is paramount to
account for each hospital’s patient characteristics (race/ethnicity, age, etc.) and clinical and obstetric risk factors (i.e. hypertension, diabetes, uterine disorders) using risk adjustment. Using a random intercept multivariable logistic regression analysis method, an indirect method of
standardization, researchers can control for patient characteristics and other risk factors that may affect birth outcomes.
A mixed effects stepwise logistic regression model, which included the previously
discussed pre-delivery clinical factors and demographic characteristics, was fitted to the data for
each category of delivery-associated complication for the period covered in this report. The
models identified the risk factors important in predicting whether a patient would experience the
specific complication under investigation. The general form of the mixed effect logistic
regression model for estimating the ‘logit’ of the probability of experiencing the complication of
interest is as follows (SAS/STAT 14.3 User’s Guide, 2017):
E[Y|γ] = g−1(Xβ+Zγ)
Y = (n x 1) vector of observed values of dependent variable, where n = number of observations
X = (n x p) matrix of fixed effects, where n = number of observations, p = proportion of sample
elements that have a particular attribute
β = vector of regression coefficients for fixed-effects parameters
Z = (n x r) design matrix for the random effects, where n= number of observations, r = sample
correlation coefficient, based on all the elements from a sample
γ = (r x 1) vector of random effects, where r = sample correlation coefficient, based on all the
elements from a sample
g = differentiable monotonic link function (g-1 is the inverse)
The statistically significant factors for each complication identified by stepwise logistic
regression models are presented in Tables 2a-2c. Each list includes only those factors that were
statistically significant in predicting the class of complication under investigation with p-values
of 0.05 or smaller.
These models were used to predict the number of a given complication type, which was
then compared with the observed rates to create the adjustment factor. This adjustment factor
was then applied to the statewide rate for the given complication type to produce the risk-
adjusted rate for the hospital.
𝑅𝑖𝑠𝑘 𝐴𝑑𝑗 𝑅𝑎𝑡𝑒 =𝑂𝑏𝑠𝑒𝑟𝑣𝑒𝑑
𝐸𝑥𝑝𝑒𝑐𝑡𝑒𝑑× 𝑆𝑡𝑎𝑡𝑒𝑤𝑖𝑑𝑒 𝑟𝑎𝑡𝑒
Ninety five percent confidence intervals were calculated for the risk adjusted rate using the
following formula (Kahn H., 1989):

19 | P a g e
𝐶𝐼𝐼𝑆𝑅 = ±1.96√(𝑂𝑏𝑠𝑒𝑟𝑣𝑒𝑑/𝐸𝑥𝑝𝑒𝑐𝑡𝑒𝑑)
𝐸𝑥𝑝𝑒𝑐𝑡𝑒𝑑× 𝑆𝑡𝑎𝑡𝑒𝑤𝑖𝑑𝑒 𝑟𝑎𝑡𝑒
Rates with confidence intervals above the statewide rate were deemed significantly higher than
statewide rate, and conversely hospitals with confidence intervals below the statewide rate were
considered to have significantly lower rates than the statewide rate.
The odds ratios are derived from the coefficients and are used to compare the relative
importance of the risk factors in predicting complications during delivery. For each of the risk
factors identified in Tables 2a-2e, the odds ratio represents how likely a patient is to develop
complications compared to a patient in the reference group. For example, Table 2a shows that a
delivering woman is almost eight times (odds ratio = 7.8) as likely to experience an obstetric
hemorrhage after she had surgical/cesarean birth (primary, repeat) with no placental or uterine
disorders compared to a delivering woman who did not have the surgical/cesarean birth or have
any placental or uterine disorders, assuming that these delivering mothers have the same set of
other risk factors presented in the table.
In another example, the odds of developing post-admission infection during the delivery
hospitalization for a delivering mother who is Hispanic is almost twice the odds (odds ratio=
1.95) compared with that of a patient who is Non-Hispanic White (Table 2c).

20 | P a g e
Table 2a. Risk Factors Identified for Obstetric Hemorrhage
Patient Risk Factors Identified Logistic Regression Results
Coefficient P-value Odds Ratio
Demographic Factors
Race/ Ethnicity
Non-Hispanic White Ref.
Non-Hispanic Black 0.09072 0.0735 1.095
Hispanic 0.09761 0.0181 1.103
Non-Hispanic Asian -0.01974 0.7261 0.98
Other/ Multi-race -0.2905 0.0277 0.748
Maternal Age 0.01604 <.0001 1.016
Clinical & Obstetric factors/ Comorbidities
Method of Delivery
Vaginal and No Placental or Uterine Disorders Ref.
Cesarean (Primary, Repeat) with Placental or Uterine Disorders
3.2321 <.0001 25.333
Cesarean (Primary, Repeat) No Placental or Uterine Disorders
2.0542 <.0001 7.801
Vaginal with Placental or Uterine Disorders 1.9125 <.0001 6.77
Preeclampsia
No Ref.
Yes 0.2736 <.0001 1.315
Infection-Chorioamnionitis
No Ref.
Yes 0.81 <.0001 1.314
Preexisting Anemia
No Ref.
Yes 0.2733 <.0001 2.248
Pre-pregnancy Body Mass Index (BMI) 0.01542 <.0001 1.016
Intercept -5.4722
C-statistic 0.807
Number of Postpartum Hemorrhage (N) 4,708

21 | P a g e
Table 2b. Risk Factors Identified for Severe Maternal Morbidities with Transfusion
Patient Risk Factors Identified
Logistic Regression Results
Coefficient P-value Odds Ratio
Demographic Factors
Race/ Ethnicity
Non-Hispanic White Ref.
Non-Hispanic Black 0.3981 <.0001 1.489
Hispanic 0.3883 <.0001 1.474
Non-Hispanic Asian 0.2298 0.0126 1.258
Other/ Multi-race 0.2691 0.1259 1.309
Clinical & Obstetric factors/ Comorbidities
Method of Delivery
Vaginal and No Postpartum Hemorrhage Ref.
Cesarean (Primary, Repeat) with Postpartum Hemorrhage 2.6921 <.0001 14.763
Cesarean (Primary, Repeat) and No Postpartum Hemorrhage 1.0413 <.0001 2.833
Vaginal with Postpartum Hemorrhage 3.4671 <.0001 32.044
Parity
Multiparous Ref.
Nulliparous 0.1612 0.0015 1.175
Preexisting Anemia
No Ref.
Yes 0.9093 <.0001 2.483
Preeclampsia
No Ref.
Yes 0.8502 <.0001 2.34
Cardiac
No Ref.
Yes 0.7198 <.0001 2.054
Renal
No Ref.
Yes 0.8891 <.0001 2.433
Infection-Chorioamnionitis
No Ref.
Yes 0.7802 <.0001 2.182
Intercept -5.5336
C-statistic 0.832
Number of Severe Maternal Morbidities with Transfusion (N) 1,901

22 | P a g e
Table 2c. Risk Factors Identified for Post-admission Infections – All Deliveries
Logistic Regression Results
Coefficient P-value Odds Ratio
Demographic Factors
Non-Hispanic White
Non-Hispanic White Ref.
Non-Hispanic Black 0.6536 <.0001 1.922
Hispanic 0.6691 <.0001 1.953
Non-Hispanic Asian 0.5303 <.0001 1.699
Other/ Multi-race 0.5178 0.0053 1.678
Private Insurance
Medicaid Ref.
Self-Pay/Charity Care 0.2554 0.0059 1.291
Non-Hispanic White 0.3175 <.0001 1.374
Clinical & Obstetric factors/ Comorbidities
Parity & Prolonged Length of Labor (> or = 20 hours)
Multiparous, No Prolonged labor Ref. Multiparous, Prolonged labor 1.8722 <.0001 6.503
Nulliparous, No Prolonged labor 1.4949 <.0001 4.459
Nulliparous, Prolonged labor 2.6807 <.0001 14.595
Gestational Age
Mature (after 37 weeks of gestation) Ref.
Premature (before 37 weeks of gestation) 0.2903 0.0004 1.337
Induction 0.4848 <.0001 1.624
Premature Rupture of Membranes 0.5216 <.0001 1.685
Hypertension (Gestational & Preexisting) -0.3007 0.0012 0.74
Tobacco Use 0.3233 0.0102 1.382
Epidural or Spinal Anesthesia 0.3956 <.0001 1.485
Intercept -6.3072
C-statistic 0.798
Number of Post-admission Infection (N) 1,623

23 | P a g e
Table 2d. Risk Factors Identified for Post-admission Infections – Cesarean Deliveries
Logistic Regression Results
Coefficient P-value Odds Ratio
Demographic Factors
Non-Hispanic White
Non-Hispanic White Ref.
Non-Hispanic Black 0.5223 <.0001 1.686
Hispanic 0.5145 <.0001 1.673
Non-Hispanic Asian 0.5066 <.0001 1.66
Other/ Multi-race 0.09992 0.7392 1.105
Private Insurance
Medicaid Ref.
Self-Pay/Charity Care 0.2387 0.0141 1.27
Non-Hispanic White 0.3808 0.0321 1.463
Clinical & Obstetric factors/ Comorbidities
Parity & Prolonged Length of Labor (> or = 20 hours)
Multiparous, No Prolonged labor Ref. Multiparous, Prolonged labor 1.8378 <.0001 6.283
Nulliparous, No Prolonged labor 1.4826 <.0001 4.404
Nulliparous, Prolonged labor 2.3665 <.0001 10.66
Gestational Age
Mature (after 37 weeks of gestation) Ref.
Premature (before 37 weeks of gestation) 0.2068 0.0696 1.23
Induction 0.9619 <.0001 2.617
Premature Rupture of Membranes 0.8439 <.0001 2.326
Hypertension (Gestational & Preexisting) -0.4345 0.0005 0.648
Tobacco Use 0.3289 0.0716 1.389
Epidural or Spinal Anesthesia 0.1633 0.1765 1.177
Intercept -5.8181
C-statistic 0.832
Number of Post-admission Infection (N) 767
24 | P a g e
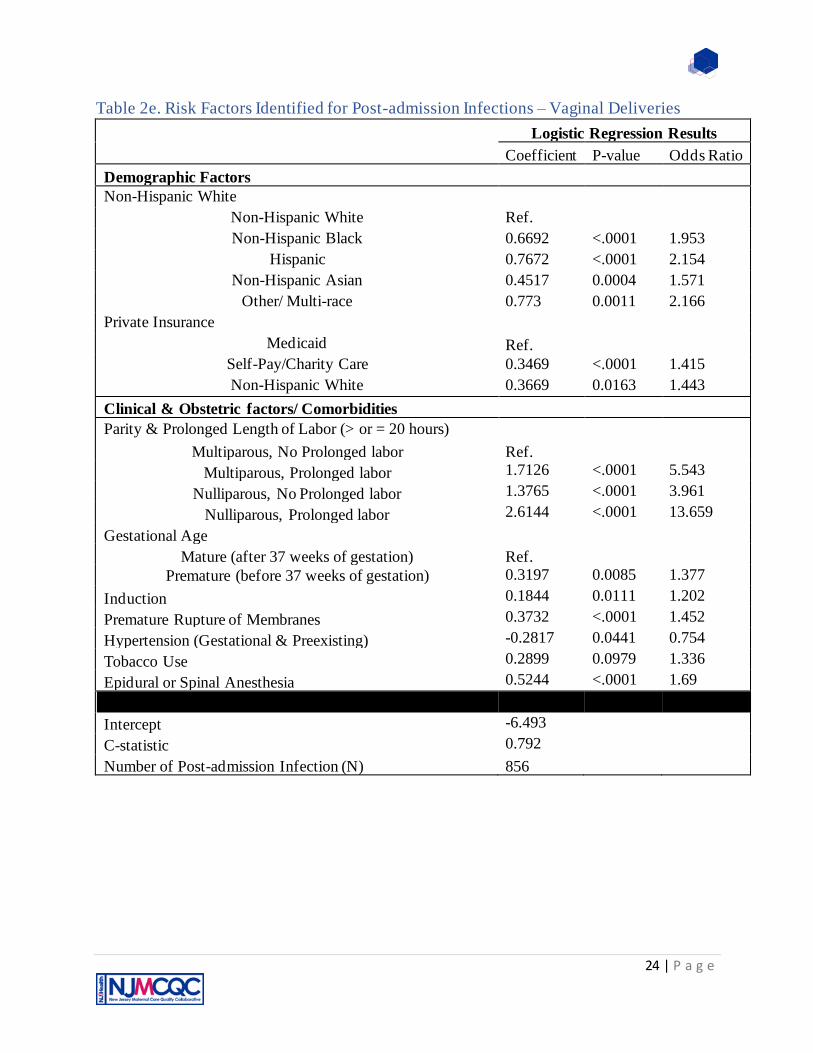
Table 2e. Risk Factors Identified for Post-admission Infections – Vaginal Deliveries
Logistic Regression Results
Coefficient P-value Odds Ratio
Demographic Factors
Non-Hispanic White
Non-Hispanic White Ref.
Non-Hispanic Black 0.6692 <.0001 1.953
Hispanic 0.7672 <.0001 2.154
Non-Hispanic Asian 0.4517 0.0004 1.571
Other/ Multi-race 0.773 0.0011 2.166
Private Insurance
Medicaid Ref.
Self-Pay/Charity Care 0.3469 <.0001 1.415
Non-Hispanic White 0.3669 0.0163 1.443
Clinical & Obstetric factors/ Comorbidities
Parity & Prolonged Length of Labor (> or = 20 hours)
Multiparous, No Prolonged labor Ref. Multiparous, Prolonged labor 1.7126 <.0001 5.543
Nulliparous, No Prolonged labor 1.3765 <.0001 3.961
Nulliparous, Prolonged labor 2.6144 <.0001 13.659
Gestational Age
Mature (after 37 weeks of gestation) Ref.
Premature (before 37 weeks of gestation) 0.3197 0.0085 1.377
Induction 0.1844 0.0111 1.202
Premature Rupture of Membranes 0.3732 <.0001 1.452
Hypertension (Gestational & Preexisting) -0.2817 0.0441 0.754
Tobacco Use 0.2899 0.0979 1.336
Epidural or Spinal Anesthesia 0.5244 <.0001 1.69
Intercept -6.493
C-statistic 0.792
Number of Post-admission Infection (N) 856

25 | P a g e
Limitations
Obstetric Hemorrhage
Hemorrhage rates should be considered carefully. While they are defined using a
nationally recognized standard definition and identified using the report of quantity of blood loss, there are limitations to consider with the reported quantities. There is no standard method for
measuring the quantity of blood loss, because there is no universal system of timing and manner of measurement. Therefore, variation in method of recording blood loss volume may be occurring between hospitals. Additionally, the new ACOG definition does not account for
method of delivery. A less stringent rule for vaginal delivery, “1,000cc of blood loss regardless of method of delivery”, means that only severe situations are considered ‘obstetric hemorrhage’
whereas no similar stringency is applied to cesarean delivery. Finally, other clinical factors used to assess the clinical impact of blood loss (such as other signs of hypovolemia) are not reported. Moreover, in cases where there is a large amount of amniotic fluid or irrigation, it is difficult to
provide an exact quantity for the loss of blood (Lyndon A et al., 2015). Therefore, comparing rates across hospitals should be done with these limitations in mind.
Severe Maternal Morbidities with Transfusion
In the transition from ICD-9-CM to ICD-10-CM coding schema, the codes specified by the CDC to identify transfusion rely on the hospital to identify the route of administration. This
coding scheme does not appear to be universally used by all hospitals, which results in difficulty identifying transfusions. This results in an underestimation of the extent of transfusions in some facilities, though it is noted that since the first report of 2016 data, hospitals do appear to be
addressing this concern. Additionally, the inclusion of transfusion, which some consider a useful proxy for identifying instances of hemorrhage, with other complications, such as eclampsia or
aneurysm, implies that transfusion is a negative outcome. However, high transfusion rates may reflect an appropriate recognition and response to the underlying cause for needing a transfusion, i.e. hemorrhage. When considering transfusion rates at a hospital, readers are advised to also take
into consideration the total picture of the clinical outcomes for a better understanding of a facility’s performance.
Post-admission Infections
Currently, there is no standard definition of ‘post-admission delivery-associated
infection’. The definition used to identify infection in the current report reflects a carefully considered list of diagnoses that reflect clinically rational and significant post-delivery genitourinary tract and other infections that represent quality of maternal care and not just a
general infection. Additionally, it is recognized that most delivery-associated infections are diagnosed and treated post-discharge from the hospital (Yokoe D et al., 2001). The current report
examines only the delivery hospitalization; therefore, the rate of infections is likely underestimated.
Third- and fourth-degree Perineal Lacerations
The use of rates of third- and fourth-degree perineal lacerations as a performance metric for maternal care has been recently questioned. A study determined that operative delivery and
26 | P a g e
shoulder dystocia were the factors with greatest risk of lacerations. However, the measures to reduce lacerations, such as avoiding operative vaginal delivery, may inadvertently lead to higher
rates of cesarean births (Friedman A. et al.,2015). Given the current stated goals of reducing cesarean rates in NJ, lacerations may be unavoidable in certain circumstances. As such, interpretation of rates needs to be done with care and with consideration for the characteristics of
the hospital’s patient mix. Based on the findings of the logistic regression analysis on the 2018 data, nulliparous mothers have a much greater risk of lacerations. Providing these first-time
mothers with counseling and following guidelines in the ACOG Practice Bulletin on Prevention and Management of Obstetric Lacerations at Vaginal Delivery may help lessen the impact of these types of complications.
Episiotomy
An episiotomy is usually done to facilitate the delivery of an infant, however the
procedure confers a risk of advanced perineal tears and obstetric anal sphincter injuries (OASIS); additionally, evidence of effectiveness of the procedure in managing shoulder dystocia is also
lacking (ACOG Practice Bulletin No.198, 2018). Current recommendations are to limit routine use of episiotomy, instead using clinical judgement to determine its appropriate use. As such, rates of episiotomy vary greatly among hospitals in NJ. This may be a reflection more of hospital
culture, provider training and preference rather than a reflection of delivery complication. As such, interpretation of episiotomy rates should be conducted within the context of the other
reported metrics.

27 | P a g e
References ACOG Practice Bulletin No. 199: Use of Prophylactic Antibiotics in Labor and Delivery Obstetrics &
Gynecology: September 2018 - Volume 132 - Issue 3 - p e103-e119.
Acosta CD, Kurinczuk JJ, Lucas DN, Tuffnell DJ, Sellers S, Knight M. Severe maternal sepsis in the UK,
2011-2012: a national case-control study. PLoS Med. 2014;11(7): e1001672.
American College of Obstetricians and Gynecologists’ Committee on Practice Bulletins—Obstetrics. Practice Bulletin No. 198: Prevention and Management of Obstetric Lacerations at Vaginal Delivery. Obstet Gynecol. 2018 Sept;132(3): e87-e102. American College of Obstetricians and Gynecologists’ Committee on Practice Bulletins—Obstetrics. Practice Bulletin No. 76: Postpartum Hemorrhage. Obstet Gynecol. 2006 Oct;108(4): 1039-1047. American College of Obstetricians and Gynecologists’ Committee on Practice Bulletins—Obstetrics. Practice Bulletin No. 183: Postpartum Hemorrhage. Obstet Gynecol. 2017 Oct;130(1): e168-e182. Antibiotic prophylaxis for third- and fourth-degree perineal tear during vaginal birth. Buppasiri P, Lumbiganon P, Thinkhamrop J, Thinkhamrop B. Cochrane Database Syst Rev. 2014 Oct 7; (10):CD005125.
Berg M, Lundgren I, Lindmark G. (2003). Childbirth Experience in Women at High Risk: Is It Improved
by Use of a Birth Plan?.J Perinat Educ., 12(2): 1–15. J Perinat Educ. 2003 Spring; 12(2): 1–15.
doi: 10.1624/105812403X106784
Callaghan WM, Creanga AA, Kuklina EV. Severe Maternal Morbidity Among Delivery and Postpartum Hospitalizations in the United States. Obstetrics and Gynecology 2012; 120:1029-36. Cantwell R, Clutton-Brock T, Cooper G, Dawson A, Drife J, Garrod D, et al. Saving Mothers’ Lives:
Reviewing maternal deaths to make motherhood safer: 2006-2008. The Eighth Report of the Confidential
Enquiries into Maternal Deaths in the United Kingdom. BJOG. 2011;118 Suppl 1:1-203.
Elmir R., Schmied V., Wilkes L., & Jackson D. (2010). Women’s perceptions and experiences of a traumatic birth: A meta-ethnography. Journal of Advanced Nursing, 66(10), 2142–2153 10.111/j.1365-2648.2010. 05391.x
Firoz,T., Chou,D., Dadeszen, P.V., Agrawal,P., Vanderkruik,R., Tunçalp, O., Magee, L., Den Broek,
N.,Say,L. Measuring maternal health: focus on maternal morbidity. Bull World health Organ,2013;
doi: 10.2471/BLT.13.117564.
Friedman A, Ananth CV, Prendergast E, D’Alton ME, Wright JD. Evaluation of third-degree and fourth-
degree laceration rates as quality indicators. Obstetrics & Gynecology: 2015; 125(4): 927-934.
Groutz A, Hasson J, Wengier A, et al. Third- and fourth-degree perineal tears: prevalence and risk factors in the third millennium. Am J Obstet Gynecol 2011;204:347.e1-4.

28 | P a g e
Guise JM, Morris C, Osterweil P, Li H, Rosenberg D, Greenlick M. Incidence of fecal incontinence after childbirth. Obstet Gynecol. 2007 Feb; 109(2 Pt 1):281-8.
Kahn H. and Sempos C. (1989) Statistical Methods in Epidemiology. New York: Oxford University
Press.
Lydon-Rochelle M., Holt V., Cardenas V., et al. The reporting of pre-existing maternal medical conditions and complications of pregnancy on birth certificates and in hospital discharge data. Am J Obstet Gynecol. 2005; 193: 125-34. Lyndon, A., McNulty, J., VanderWal, B., Gabel, K., Huwe, V., Main, E. Cumulative Quantitative Assessment of Blood Loss. CMQCC Obstetric Hemorrhage Toolkit v.2; March 24, 2015. Martin, J., Hamilton, B., Osterman, J.K.M., Driscoll, AK., Mathews, T.J. National Vital Statistic
Reports-Births: Final Data for 2015. Division of Vital Statistics. Volume 66, Number1. Retrieved from:
https://www.cdc.gov/nchs/data/nvsr/nvsr66/nvsr66_01.pdf
Royal College of Obstetricians and Gyneacologists. The management of third- and fourth- degree perineal tears. (Green-top Guideline No.29), March 2007 Royal College of Obstetricians and Gyneacologists. The management of third- and fourth- degree perineal tears. (Green-top Guideline No.29), June 2015
SAS Institute Inc. 2017. SAS/STAT® 14.3 User’s Guide. Cary, NC: SAS Institute Inc.
SAS/STAT 15.1 User’s Guide. The GLIMMIX Procedure. Retrieved from :
https://documentation.sas.com/?docsetId=statug&docsetTarget=statug_glimmix_overview04.htm&docset
Version=15.1&locale=en on June 2nd, 2019.
Severe Maternal Morbidity in the United States. (2017, November 27). Retrieved from https://www.cdc.gov/reproductivehealth/maternalinfanthealth/smm/severe-morbidity-ICD.htm Short-term and long-term effects of obstetric anal sphincter injury and their management. Fitzpatrick M, O'Herlihy C. Curr Opin Obstet Gynecol. 2005 Dec; 17(6):605-10. Vale de Castro Monteiro, M., Pereira, G.M.V., Aguiar, R.A.P. et al. Risk factors for severe obstetric perineal lacerations. Int Urogynecol J 27, 61–67 (2016).
WHO Recommendations for Prevention and Treatment of Maternal Peripartum Infections. Geneva:
World Health Organization; 2015.

29 | P a g e
Appendix A: Inclusion & Exclusion Criteria to Identify Reported
Complications
Obstetric Hemorrhage
Denominator inclusion criteria:
All delivery hospitalizations; Stratified by method of delivery
• Cesarean
• Vaginal – assumption that all delivery hospitalizations not identified as cesarean were
vaginal deliveries
Numerator inclusion criteria:
Maternal Blood Loss – reported as cc in Electronic Birth Certificate. Any blood loss greater than
or equal to 1,000mL regardless of vital signs or method of delivery as Obstetric Hemorrhage
Post-admission Infection
Denominator inclusion criteria:
All delivery hospitalizations; Stratified by method of delivery
• Cesarean
• Vaginal – assumption that all delivery hospitalizations not identified as cesarean were
vaginal deliveries
Numerator Inclusion criteria:
EBC identified cases (coded response and EBC field category and name)
Yes Characteristics of Labor and Delivery: Intrapartum Infection
Yes Characteristics of Labor and Delivery: Clinical Chorioamnionitis
Hospital Discharge identified cases (ICD-10 codes and diagnosis)
O860 Infection of obstetric surgical wound
O8600 Infection of obstetric surgical wound, unspecified
O8601 Infection of obstetric surgical wound, superficial incisional site
O8602 Infection of obstetric surgical wound, deep incisional site
O8603 Infection of obstetric surgical wound, organ and space site

30 | P a g e
O8609 Infection of obstetric surgical wound, other surgical site
O8612 Endometritis following delivery
O8621 Infection of kidney following delivery
O8681 Puerperal septic thrombophlebitis
O8689 Other specified puerperal infections
O41121x Chorioamnionitis, first trimester
O41122x Chorioamnionitis, second trimester
O41123x Chorioamnionitis, third trimester
O41129x Chorioamnionitis, unspecified trimester
Inclusion (specific to ICD-10 identified cases): cases in which Present on Admission ‘No’
included
Numerator exclusion criteria:
Cases in which Diagnosis Present on Admission coded as ‘Yes’ (specific to ICD-10 identified
cases)
Third- and Fourth-degree Perineal Lacerations
Denominator inclusion criteria:
Vaginal delivery hospitalizations only
Stratified by use of instrument during delivery (with vs. without instrument) as defined in AHRQ
PSI 18 and PSI 19
Denominator exclusion criteria:
Cesarean deliveries
Deliveries of overweight babies (>4,000 grams at birth; reported in EBC Birth Weight-grams)
Numerator inclusion criteria:
EBC identified cases (coded response and EBC field category and name)
Yes RH Immune, Mother’s Morbidity & Discharge Information: Third - or fourth-degree perineal laceration
Hospital Discharge identified cases (ICD-10 codes and diagnosis)
O702 Third degree perineal laceration during delivery
31 | P a g e
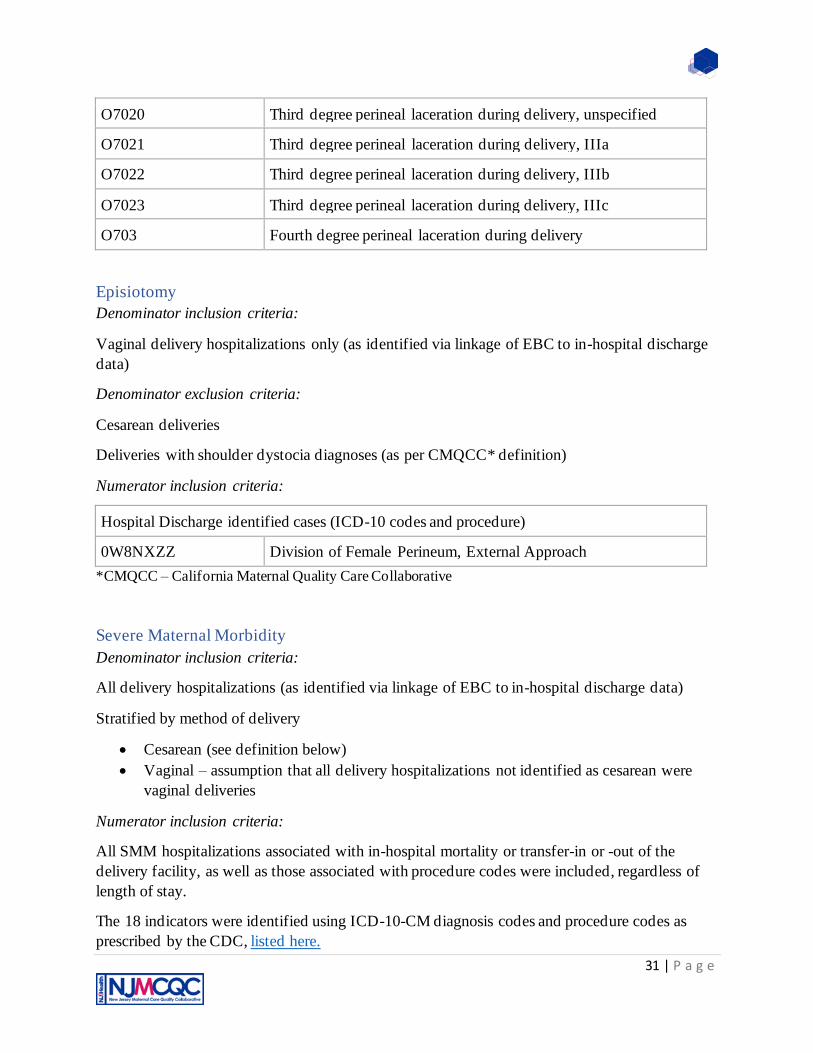
O7020 Third degree perineal laceration during delivery, unspecified
O7021 Third degree perineal laceration during delivery, IIIa
O7022 Third degree perineal laceration during delivery, IIIb
O7023 Third degree perineal laceration during delivery, IIIc
O703 Fourth degree perineal laceration during delivery
Episiotomy
Denominator inclusion criteria:
Vaginal delivery hospitalizations only (as identified via linkage of EBC to in-hospital discharge
data)
Denominator exclusion criteria:
Cesarean deliveries
Deliveries with shoulder dystocia diagnoses (as per CMQCC* definition)
Numerator inclusion criteria:
Hospital Discharge identified cases (ICD-10 codes and procedure)
0W8NXZZ Division of Female Perineum, External Approach
*CMQCC – California Maternal Quality Care Collaborative
Severe Maternal Morbidity
Denominator inclusion criteria:
All delivery hospitalizations (as identified via linkage of EBC to in-hospital discharge data)
Stratified by method of delivery
• Cesarean (see definition below)
• Vaginal – assumption that all delivery hospitalizations not identified as cesarean were
vaginal deliveries
Numerator inclusion criteria:
All SMM hospitalizations associated with in-hospital mortality or transfer-in or -out of the
delivery facility, as well as those associated with procedure codes were included, regardless of
length of stay.
The 18 indicators were identified using ICD-10-CM diagnosis codes and procedure codes as
prescribed by the CDC, listed here.

32 | P a g e
Numerator exclusion criteria:
Hospitalizations with a length of stay less than the 90th percentile as calculated separately for
vaginal, primary and repeat cesarean deliveries (Callaghan WM et al., 2012).