hospital payroll costs, productivity, and employment under
TRANSCRIPT
Hospital Payroll Costs Productivity and Employment Under Prospective Reimbursement
by David Kidder and Daniel Sullivan
This paper reports preliminary findings from the National Hospital Rate-setting Study regarding the effects of State prospective reimbursement (PRJ programs on measures of payroll costs and employment In hospitals PR effects were estimated through reduced-form equations using American Hospital Association Annual Survey data on over 2 700 hosshypitals from 1969 through 1978 These tests suggest that hosshypitals responded to PR by lowering payroll expenditures PR also seems to have been associated with reductions in fullmiddot time equivalent staff per adjusted Inpatient day However tests did not confirm the hypothesis that hospitals reduce payroll per full-time equivalent staff as a result of PR
Introduction
In 1972 Congress amended the Social Security Act with the passage of Section 222(A) which encourages States to establish prospective rate-setting programs for hospital reimbursement The burden of hospital cost inflation on State and Federal health exshypenditures provided the impetus for this legislation
State agencies empowered to set prospective reimmiddot bursement (PR) rates have some control over how much hospitals may earn from certain patient revenue sources during the next year Traditional retrospective reimbursement which is determined by charges inshycurred in the previous year pays either all or a preshyscribed fraction of any cost Increases claimed by a hospital Prospective reimbursement makes hospitals liable for cost increases above the levels approved prior to expenditure To protect Its financial position under PR a hospital must either generate enough additional nonpatient revenue to cover unanticipated cost Increases or find ways to contain operating costs PR can be judged successful If costs decline without a reduction in health care quality or access
The National Hospital Rate-Setting Study (NHAS)-funded in 1978 by the Health Care Financing Administration-has begun to analyze State PR proshygrams to determine whether or not PA affects hosshypital cost-cutting behavior Preliminary findings reshyported in a paper by Coelen and Sullivan (1981) suggest that it does Total per diem expenditures demiddot creased as much as 105 percent In Maryland after the institution of a mandatory version of PR in 1976 Postmiddot PR costs declined in all programs studied The
The National Hospital Rate-Setting Study was funded in 1978 by the Health care Financing Administration under Contract No HCFA-500middot7amp0036
smallest effect was 27 percent for the version of New Yorks program that was instituted in 1971 On the other hand NHRSs preliminary evidence also Indishycates that hospitals In some States may have reshysponded to PR by increasing the volume of inpatient admissions and days (Worthington 1980) and by reshyducing levels of services (Qomwell and Kanak 1980)
A study of PR effects on payroll and labor producmiddot tlvity provides a useful supplement to the analysis of PR and costs Payroll Is a major line item making up over one-half of total expenditures for most hospitals In addition labor costs tend to be easier to adjust in the short run than fixed costs of buildings and equipshyment Hospitals may cut labor costs by reducing staff by finding ways to make existing staff more proshyductive and by resisting pressures to increase wages Thus a study of staffing composition and proshyductivity through the integrated set of tests in this paper helps describe one facet of the hospital reshysponse to PR All of the preliminary NHRS studies inmiddot eluding results for payroll costs and employment reshyported here test simple hypotheses about hospital remiddot sponses to PR In tater work by the NHAS hypotheses that were strongly supported in prelimshyinary analyses will be explored in greater detail
The following discussion begins with a brief review of previous research into PR effects on payroll cost and employment and then describes the formal charshyacteristics of State programs Four research hyshypotheses follow with a specification of the analysis variables constructed to test these hypotheses After a description of methodology and data sources the results of the tests are presented and discussed
HEALTH CARE FINANCING AEVIEWIDECEM8EA 19amp2Volume 4 Numbet 2 89
Research on Hospital Labor Costs and Prospective Reimbursement
The literature on hospital labor expenditure analyzes the components of labor cost defined in the hypotheses of this paper productivity earnings (wages) per employee and staff skill-mix
Productivity
The evidence on levels of hospital productivity under PR is not conclusive Some studies (Spectrum 1978 [Indiana] and Applied Management Sciences 1975 [Western PennsylvaniaD argue that PR raises productivity A study of the downstate New York proshygram suggests that PR arrested a decline in producmiddot tivity (Dowling et al 1976) The Abt Associates 1976 study of upstate New York (Cromwell et al 1976) however finds a negative estimate of the PR effect on productivity Though the estimated effect was stashytistically insignificant Geomets 1974 New Jersey study reached the same conclusions
Earnings (Wages) Per Employee
Researchers readily perceive aPR effect on earnshyings but do not agree on whether the effect is posimiddot tlve or negative Most studies associate PR either with lower earnings per full-time equivalent (FTE) (Sloan and Stetnwald 1978 Sloan and Steinwald 1979 and Spectrum 1976) or with slower annual rates of wage Inflation (Applied Management Sciences 1975) Early New York studies however found higher wage levels (Cromwell et a 1976) and more rapid wage inflation (Dowling 1976) in hospitals covered by PR
Skill-Mix
Few studies have analyzed hospital staffing patmiddot terns only one looked at PR effects on skillmiddotmix in hospitals Jensen eta (1980) show that ratios of registered to licensed practical nurses declined but that ratios of registered nurses to other types of staff increased
These studies of PR labor cost effects conclude that hospitals act differently after PA is established However most studies assess State PA programs without accounting for changes made over time which have tightened the rate-review process They used different measures of productivity and earnings and tested hypotheses with a variety of statistical models The advantage of the NHRS study lies in its scope (many separate State programs can be comshypared using standardized measures and methods)
Full-time equivalent In this paper follows the American Hospital Associations definition Each full-time employee counts as one FTE and each part-time employee counts as one-half FTE
and In its time coverage (most programs were begun or strengthened In the period 1974middot1976 leaving two to three years of subsequent PR experience for analysis)
Rigor and Effectiveness of PR Programs
The literature demonstrates that the size and direcmiddot tlon of estimated PA effects vary considerably among States In part this variation Is due to differences in rigor and effectiveness among State programs
Table 1 condenses and simplifies characteristics of 10 State PR programs for which this paper presents statistical tests In general the cost-containment efshyfects of PA should be most effective with programs under mandatory budget review and compliance and which set explicit payment rates programs that conshytrol total rather than per unit revenues or charges based on a thorough review of departmental costs programs that cover all payers rather than a few and programs that Impose utilization controls to limit hosshypitals ability to raise revenues by increasing lengths of stay In addition automatic screens that Identify excessive Increases In wages fringes employment and payroll costs should promote control of employmiddot ment costs
The information in Table 1 suggests that New York Maryland and Minnesota have most of the charmiddot acteristlcs associated with rigorous effective PA proshygrams Arizona Indiana and Kentucky rely on voluntary measures and limited payer coverage and appear to be least rigorous The mix of characteristics in the other States precludes any reasonable ranking
In practice two States with Identical PR program characteristics may operate quite differently Informal bargaining between rate-setters and hospitals with Interim changes In rate decisions may weaken a promiddot cess that appears to be mechanical and final Agreeshyments between union groups and rate-setting comshymissions on collectively bargained wage raises may pass through as allowable charge rate increases as In New York On the other hand Marylands ratemiddot setting agency works informally with the parties inmiddot volved during negotiation to promote wage settlemiddot menta that are acceptable from the public point of vlew 2 Union activity complicates an already complex dynamic political process Unions hospital adminismiddot trators and rate-review authorities are drawn by the requirements of PA into general or sequential bimiddot lateral bargaining The resolution of disputes may then occur through heightened conflict and thirdmiddot party Intervention (mediation or arbitration)
bullInformation on labor-related activities of various State rate-setting agencies may be found in case studies compiled by the National Hospital Rate-Setting Study (Hamilton et sf 1980)
HEALTH CARE FINANCING REVIEWDECEMBER 1982Volume 4 Number 2 90
~~
g ~m ~z gtz g z Q
~m s a m n mbullm m ~
Ibullbull z c v bullN
0~
TABLE 1
Prospective Reimbursement Program Characteristics
Authority Labor Screens and Revenue Payer Utilization and
State Enforcement Review Coverage Control Guidelines
New York Mandatory review and Set per diem (Medicaid All but Medicare Occupancy length of Voluntary wage increase compliance legal sane- and Blue Cross) charge stay guidelines lions set payment rates increase (others) reshy
view routine and ancllshylary costs
Maryland Mandatory review and Set department unit All payers None Voluntary wage increase compliance legal saneshy revenue review departshy guidelines tlons ment level revenue
New Jersey Mandatory review and Set per diem review Medicaid None Voluntary wage increase compliance legal saneshy department level costs Blue Cross guidelines ttons set payment rates Washington Mandatory review and Set total patient revmiddot All payers None Screens on wages compliance legal sane- enue review department employment and labor lions set payment rates level costs cost
Connecticut Mandatory review and Set total patient revshy Commercial and self-pay None Voluntary wage increase compliance legal sane- enue review departshy guidelines lions ment level costs
Massachusetts Mandatory review and Set Medicaid per diem Medicaid commercial Occupancy (Medicaid) Voluntary wage increase compliance Medicaid charge-based total and self-pay guidelines payment rates weak patient revenue review legal authority over capital and operating charge-based payers budgets
Arizona Mandatory review Set total patient rev- Blue Cross commercial None None voluntary compliance enue and some charge and self-pay no legal sanctions rates review aggregate
costs Minnesota Mandatory review Set total patient rev- Blue Cross commercial None Screens on wages
voluntary compliance enue review aggregate and self-pay employment and no legal sanctions costs labor costs
Indiana Voluntary review and Individual contracts Blue Cross None None compliance budget review
Kentucky Voluntary review Individual contracts Blue Cross None None mandatory compliance budget review
Program details are not included for Western Pennsylvania one of the original core study areas which proved to show no statistically significant PR effects In any part of the labor analysis Two secondary States Indiana and Kentucky demonstrated significant PR effects and their program characteristics are included
Although formal program characteristics do not fully define effectiveness they supplement statistical findings and help pinpoint areas that need further reshysearch If a voluntary PR program is demonstrably more effective In reducing employment Costs than the most rigorous mandatory program then more Inmiddot stltutlonal detail or a more refined statistical model Is needed to explain this anomaly
Hypotheses
Research Hypotheses
If prospective reimbursement encourages hospitals to cut costs the following story suggests some testable hypotheses that relate PR to employment productivity and payroll
bull Hospitals decide to cut total costs bull Hospitals elect to concentrate on unit labor
costs (payroll per adjusted patient day3) In makmiddot ing the cut This appears logical because staff remiddot ductions may be more easily achieved than reducmiddot tions in overhead costs such as utilities and intermiddot est payments Moreover payroll comprises over half of most hospital expenditures and reducmiddot lions here will have an important effect on total costs
bull Cost reductions occur through some or all of the following measures -cutting back staff keeping wages and output (measured in this study as adjusted patient days) constant -increasing the number of adjusted patient days supplied by existing staff keeping wages and the resource Intensity of an average patient day conshystant -cutting or restraining the rate of increase in wages The first two steps increase labor productivity by increasing the output (patient days) produced by a given input (an FTE staff person) Without wage change higher productivity results in lower unit labor cost (more days for the same dollar value of payroll) The last step reduces payroll for existing staff by cutting wages or earnings without changmiddot ing productivity
bull As adjustments occur the composition of hosplmiddot tal staff may change Staff reductions are least likely to hit the core medical staff For example the proportion of registered nurses on hospital payrolls is likely to rise The justification for this argument is based on circumstantial evidence Hospitals have historically complained of AN shortage even as the supply has increased In a cost-cutting crunch It Is reasonable to supmiddot pose that administrators will try to protect AN jobs while achieving economies through reducshytions In staff thought to be less critical to the hospitals medical care function
The four hypotheses tested in this paper are
bull unit labor costs decrease in hospitals under proshyspective reimbursement
bull labor productivity increases in hospitals under prospective reimbursement
bull payroll per employee decreases In hospitals unmiddot der prospective reimbursement and
bull hospital staff composition changes showing a larger proportion of registered nurses in hospitals under prospective reimbursement
Measurement of Analysis Variables
The analysis variables that will be used to test the our hypotheses of this study are
Unit Labor Cost Ideally labor cost should combine ayroll with a measure of hospital output to capture e multiproduct nature of hospital activity (patient
are teaching research and community service) A ultiproduct output index is not available which nemiddot
essltates the use of adjusted patient days (total inmiddot atient days plus day equivalents of outpatient vismiddot s)3 a measure of output frequently used by remiddot earchers and the hospital industry Unit labor cost is easured by total payrollbull per adjusted patient day Labor Productivity Productivity measures the outmiddot
ut that can be produced from a given amount of inmiddot ut An ideal measure of productivity would comshyare levels of staff and other Inputs such as equipmiddot ent and supplies to an index of output Many ecoshyomic studies use only labor productivity because bors input in terms of full-time equivalents or total
erson hours can generally be measured more easily an can inputs of capital or supplies For this paper
vidence for a labor productivity effect is demonmiddot trated if a full-time equivalent staff person produces ore adjusted patient days under PR A stronger test of rate-settings productivity lmplimiddot
ations would control for changes in the quality of atient days because hospitals might achieve apparmiddot nt productivity gains by admitting less costly cases r by speeding up the process of care at the possible xpense ot unfavorable outcomes Tests that intemiddot rate productivity findings with studies of PR effects
The American Hospital Associations weight assumes at approximately three outpatient visits are equivalent in source requirements to one inpatient day bullPayroll excludes staff physicians salaries Hospital emmiddot
ioyment of physicians does not relate systematically to st or levels of patient care activity because most physimiddot
ans services in US hospitals are provided by private feemiddot r-service practitioners Including salaried house staff would riously misstate the actual physician inputs in hospitals
separate analysis of American Hospital Association staff hysician data will be conducted at a later stage in the HRS study Fringe benefits are also excluded from the easure of payroll used here
f
pthcmcpitsm
pppmnlapthesm
cpeoeg
thre
pcocifoseApNm
HEALTH CARE FINANCING REVIEWDECEMBER 1982Volume 4 Number 2 92
on case-mix lengths of stay and quality of care will be conducted later in the NHRS study We have howmiddot ever alluded to preliminary findings regarding volume effects in order to qualify the evidence from our estimiddot mated productivity effects
A full-time equivalent staff per 1000 adJusted pamiddot tlent days will be the preliminary measure of producshytivity Higher FTE requirements per day mean lower labor productivity
Payroll Per Employee The price for labor is best measured by job-specific wage rates Hospital wage data are collected and published but the geographimiddot cal coverage and timing are inadequate for statistical tests of the PR hypothesis Payroll-per-worker data must be substituted for wages but total payroll can be affected by changes In the kinds of employees on staff whether or not there is a change in wage rates With this caveat in mind labors price is measured in this paper as payroll per 1000 FTEs
Composition of Hospital Staff Hospitals may change staff composition either to emphasize certain services or to reduce or increase specialization in the occupational structure as a tool for reducing or Inmiddot creasing volume It is difficult to Identify particular occupations most likely to be protected in a cost-cutmiddot tlng period It was argued earlier that hospitals prefmiddot erences should be to protect the jobs of nursing staff given a perceived shortage of registered nurses For this reason the preliminary measure of staff comshyposition we shall examine is RN full-time equivalents per total fullmiddottme equivalent staff
Methodology and Data
The objective of the analysis presented is to ldentimiddot fy the overall effect if any that PR programs have on hospital payroll costs staffing and productivity The analysis also measures the relative effects of differmiddot ent State programs As noted earlier identifying these effects helps determine how hospitals reduce total costs when faced with PR constraints
The following estimates derive from estimations of regression equations that explain variations in costs In terms of PR and other variables This model estimiddot mates what effect PR has on various measures but does not provide information on why these effects occur
We shall estimate the effect of PR on levels of payshyroll per day FTEs per day and other analysis variamiddot bles An alternative specification to be explored later will estimate PR effects on the rates of change in these variables In general our task Is to distinguish shifts that are not attributable to changes in measureshyable characteristics of sample hospitals differences among market areas differences among States not captured by other variables and a time trend asmiddot sumed to be identical for all hospitals
US Department of labor Bureau of labor Statistics Inmiddot dustry Wage Survey Hospitals and Nursing Homes (various years)
The form of the equation used ritost nearly resemshybles a reduced form model in which analysis variamiddot bles are related to exogenous explanatory variables Although this approach means that we forego an exshyplanation of the structure of the hospital costproducshytivity system we gain a clearer test of PRs effects as Coelen and Sullivan (1981) point out in some demiddot tail
The general estimating equation is specified as folmiddot lows
Y = 8o + a1DS + a2DA + B3DSA + bX In this equation Y and X measure the analysis variamiddot ble and a vector of hospitalarea explanatory variables respectively OS measures State effects that are not captured by the X variables DA measures any trend in Y not associated with PR or any of the X varishyables Finally OSA measures the PR effect on Y for hospitals In a given State Identifying any shifts in the level of YIn the PR State after a particular version of PR was introduced that are not explained by the Xs the time trend (DA) or the underlying unmeasured characteristics of the State (OS) In fact the coeffl cient B3 measures the size of this shift
This specification generalizes easily to account for the existence of multiple programs and even multiple versions of programs Each program needs one set of OS DA and DSA variables To reflect the introduction of a new version of a program new OA and OSA variashybles are needed but the OS variable used to denote the hospitals in the old version of the program will serve for the new version If two programs are impleshymented at the same time the same DA variable will serve tor both The coefficient of each OSA variable estimates the impact of the corresponding PA proshygrams
Table 2 presents and defines all explanatory variamiddot bles used in the estimating equations Note that the time trend variable DA has been measured in the series of year dummies 070-078 State effects (OS) are measured by Dssmiddot Finally the PR effect DSA has been measured by Dssyy which is identified by State and by the year in which a new PR program or a modmiddot ification of an old program was Implemented
tAs Coelen and Sullivan (1981) note The use of both studycontrol and prelpost data provides a much stronger evaluation design than would standard use of only studycontrol or only prelpost comparisons Since numerous factors influencing hospital behavior are known to vary geoshygraphically since data cannot be obtained on many of these (eg physicians attitudes incidence of certain illnesses) at reasonable cost and since interstate variations in some of the variables are likely to be correlated with presence absence of PR programs a simple studycontrol comparlmiddot son is almost certain to yield biased results Nor is a preJ post comparison an adequate design since unmeasured (omitted due to lack of data) variables are also likely to change over time The four-way design used here does not require spatial or temporal constancy of omitted variables It requires only that there be no change in the difference In omitted variables that is correlated with the Implementation of reimbursement controls
HEALTH CARE FINANCING REVIEWDECEMBER 1982Volume 4 Number 2 93
TABLE2
Definitionbull of Explanatory Vartabtee
nmeiState 070078 Dummy variables equal10 In year Indicated by the two digits (eg 1970 for 070) and all
later years equal 00 for earlier years Oss Dummy variables equal10 for all years If hospital is In State as 00 otherwise (ss lndlmiddot
cates the two-letter abbreviation of the State)
Hospital Characterletlcs (Production) DBED1middotDBED3 Dummy variables 10 for all years for hospitals In size category Indicated by number
(1 =over 400 beds 2=250-399 beds 3= 1()()249 beds) equal 00 otherwise OGOV Dummy variable equals 10 If hospital Is operated by nonfederal government agency 00
otherwise OMEOSCHL Dummy variable equals 10 If hospital has been affiliated with a medical school for 8 out
of the 10 years studied 00 otherwise ONUASCHL Dummy variable equals 10 If hospital has been affiliated with a school of nursing for 8
out of the 10 years studied 00 otherwise OPAOF Dummy variable equals 10 if hospital is organized as a for-profit Institution 00 othershy
wise (Location) CRIME Crimes per 100000 population In county In 1975 (X = 4171) OSMSA Dummy variable equals 10 If hospital IS located in SMSA 00 otherwise p Population in county (X = 490131) POPOENS Population (In 1008) per square mile In county (X = 196) TEMP 30year mean temperature In county (X = 528)
Population Characteristics (Demand) (Demographic) BIRTH Births per 10000 population In county (X = 1544) EOUC Median years of educational attainment for county population (X = 117) INCOME Personal Income per capita In county (X = 4411) PGT65 Percent of population In county over 65 years (X = 1182) WHITE Percent of population in county comprised of whites (X = 9223) (Insurance) AFOC Percent of population on AFOC (Medicaid) in county (X = 0408) COMAOJ Proportion of population covered by commercial (Including Blue Cross) insurance In
county (X = 7957) POPT18 Proportion of population enrolled in Medicare Part A In county (X = 1137) (Physicians) MOPOP Active patient-care physicians per capita In county (X = 00012) SPMO Percent of physicians In county who are specialty physicians (X = 491)
Market Characteristics (Lsbor) OFTESHA Dummy variable equals 10 If hospitals FTE share Is greater than 05 equals 00 othershy
wise OTHAMON Dummy variable equals 10 If FTE share of another hospital In county Is greater than
005 equals 00 otherwise UNEM APT Proportion of labor force In county which Is unemployed UNION Dummy variable equals 10 If hospital employees are covered by a collective bargaining
agreement 00 otherwise WAGE Average annual earnings of persons employed in seiVIce Industry in county (X = 7048) (Product) BEOPOP Total number of beds per capita In short-term hospitals In county (X = 0005) NHBPC Total number of nursing home beds per capita In county (X = 00078) NHOSP Total number of short-term hospitals in county (X = 134)
(continued)
HEALTH CARE FINANCING REVIEWDECEMBER 19821Volume 4 Number 2
TABLE 2 (continued)
Definitions of Explanatory Variables
Regulatory CNss Dummy variable equals 10 for those years in which Certificate of Need review was in
effect in State ss 00 for other years and for hospitals In other States (ss Is two-letter abmiddot breviation for the State)
OPSAO Dummy variable equals 10 for all years for any hospital with binding PSRO review (either delegated or nondelegated) 00 otherwise
PSAO Dummy variable equals 10 for only those years in which a hospital was covered by binding PSRO review 00 otherwise
Dssyy Dummy variables equals 10 for hospital in State ss in years yy and later 00 otherwise (ss is the two-letter abbreviation for a State yy indicates the first fiscal year during which PR [or a version of PRJ was In place)
Other explanatory variables were selected to conmiddot trol for hospital or area Influences on costs employshyment and staffing that might confound the estimamiddot tlon of PR effects Only variables thought to be indemiddot pendent of PR influence were included in order to avoid bias associated with simultaneous relationships between the dependent and explanatory variables Thus a hospitals ownership status (nonprofit profit) a variable included In the equation would not change In response to PR but ownership might be a factor that influences how hospitals adjust to PR Admismiddot sion levels can be affected by PR if hospitals try to generate more revenue by increasing the number of inpatient admissions and days
All explanatory variables not categorical in nature (taking on a value of zero or one) are measured in log form Since no prior hypotheses exist about the relamiddot tive importance of different explanatory variables remiddot gressions were estimated in stepwise fashion Variamiddot bles that show the most significant statistical relamiddot tionships occur first Variables not significant at the 10 level were dropped In this process Runs atmiddot tempted with all variables included did not alter the ~ubstance of our findings
The sampling frame from which the 2693 hospitals used in this study were drawn is a subset of the 8160 hospitals for which data exist for at least one year bemiddot tween 1970 and 1977 in the annual survey of the American Hospital Association (AHA) Hospitals were omitted from the frame if they were operated by a Federal agency were not classified as general-service hospitals were located outside the 48 contiguous States and the District of Columbia or had median
annual average length of stay (between 1970 and 1977) In excess of 15 days 1 A 25-percent random sample was selected from the entire frame and a supplement was drawn to provide a census for the nine study Statesareas and for six other States with Statewide mature PR programs Including Colorado Indiana Kentucky Nebraska Rhode Island and Wismiddot consln A total of 2558 hospitals comprise the samshyple which includes some that opened or closed durmiddot ing the 1Q-year sample period 1969 to 1978 The maximiddot mum sample size available for analysis comprises 23576 hospital years
Raw data on hospital characteristics were obtained from the American Hospital Associations unedited computer tapes These data were edited and cleaned by Abt Associates staff following procedures dismiddot cussed in greater detail by Coeien and Sullivan (1981) Data on other explanatory variables were selected from a variety of sources including AMA publications (numbers of physicians) Sales and Marketing Manmiddot agement (income) census publications (population) and Employment and Training Report of the President (unemployment) Regulatory variables were taken from information collected by Policy Analysis Inc for a contract for Health Resources Administration (cermiddot tiflcate of need) the Health Standards and Quality Bureau (professional standards review organization [PSRO] review) and case studies of the National Hosmiddot pital Rate-Setting Study (PR characteristics) Area varmiddot lables for each hospital were defined for the county or State in which the hospital operated
The AHA defines short-term hospitals as those having an average length of stay of less than 30 days per admission It is very likely however that hospitals with long lengths of stay (20-30 days) provide different types of care and operate on a different implicit production function than do hospitals with short lengths of stay (3middot10 days) To maximize the homeshygeneity of the NHRS sample without excluding a large group of hospitals short-term is defined in this study as length of stay of fewer than 15 days The median of mean length of stay across years is used to define short-term
HEALTH CARE FINANCING REVIEWDECEMBER 19ll2fVolurne 4 Number 2 95
Effects of Prospective Reimbursement on Payroll and Employment
This section presents the results of hypothesis tests for the individual States Based on this studys findings a strong case emerges for the argument that hospitals cut payroll costs in response to PR in part by raising employee productivity
Tables 3 through 5 show estimated levels of the dlfmiddot ferent analysis variables for three years 1969 (the first year for which the data exist) 1975 (a year around which several new or redesigned State PR programs were established) and 1978 (the last year for which the data exist) Two types of data are shown levels and annualized percentage changes The series for all States show average levels corrected for changes in those hospital and area characteristics included in the estimating equations Estimated levels for each State include the percentage effects of PR shown In parentheses next to each State name For example payroll per day in Arizona was 6 percent lower after PR was implemented In 1974 (Table 3) Each table
also Includes annualized changes for the entire perimiddot od and separately for the premiddot and post-1975 periods These rates were not estimated statistically but were computed from the estimated levels
Labor Coat Payroll Per AdJusted Patient Day
Labor cost estimates yielded the largest number of significant PR effects found in this analysis All conmiddot firm the hypothesis that hospitals respond to PR by lowering payroll expenditures Some diversity among States exist in the size of these effects as Table 3 shows
Only States with PR effects that proved to be significant at the 5 percent level or better were included in the tables as footnotes Indicate This Is an exacting standard and the direction of estimated PR effects that were not significant at this level Is noted Also provided Is At for each of the estlmiddot mating equations Further Information on these regressions is available from the authors
The alternative explanation that quantity and quality of patient days may have changed rather than the productivishyty of hospital labor should be noted
TABLE3
Payroll Per AdJusted Patient Day Levels for All States and Estimated Prospective Reimbursement Effects In Individual Statesbull
Levels for Selected Years (Dollars Per Day) Annual Percent Change
StateYear (Percent Change
DuetoPR) 1969shy 1975middot 1969shy1969 1975 1978 1975 1978 1978
All States2 34 56 72 +87 +87 +87
Arizona 40 62 81 +76 +93 +82 1974(-06)
Connecticut 40 60 78 +70 +91 +77 1975(-08)
Indiana 31 51 66 +87 +90 +88 1960(-08)
Kentucky 29 44 57 + 72 +90 +78 1975(-06)
Massachusetts 39 64 79 +86 + 73 +82 1976(-06)
Maryland 37 61 71 +87 +52 +75 1976 (- 10)
New Jersey 32 51 64 +81 + 79 +80 1977(-03)
New York 35 57 66 +85 +50 + 73 1978(-11)
Each PR State with a statistically significant (5 percent level) PR effect on payroll per adjusted patient day is listed with the year the PR program was established and with the estimated percent effect of PA on the level of payroll per day Effects not significant at the 5 percent level Included negative effects for Minnesota (1978) and Washington (1978) positive effects for Washington (1976) and an effect too small in size and statistical significance to be reliable for New York (1971) The At for the payroll per day regression equation was 76
2Figures for the individual States include estimated PR effects
HEALTH CARE FINANCING REVIEWDECEMBER 1982Voume 4 Number 2
The largest PR effects are observed in New York and Maryland which have State programs that are Identified as potentially rigorous and effective (based on formal characteristics) The overall percentage change In payroll per day from 1969-1978 in both these States was lower than the average for all States This results from a significant drop In the anmiddot nual increase from 1975 to 1978 In fact both New York and Maryland began the study period In 1969 with payroll costs higher than the average but ended with lower than average costs They are the only States in the study group to make this shift Three other States (Arizona Connecticut and Massachumiddot setts) remained above average In payroll costs though they approached the mean of all States over the study period Three States with below average costs (Indishyana Kentucky and New Jersey) finished the period with costs further below average
Evidence from States with less significant PR efshyfects lends support to these findings For example Minnesota and Washington Implemented programs in 1978 that had negative effects on payroll costs The positive PR coefficient for Washingtons 1976 promiddot gram does not seriously challenge these findings beshycause the program was revised and strengthened in
1978 Although New York and Maryland hospitals showed the largest PR-related payroll reductions the relationship between program rigor and measured efmiddot feet is tenuous New Jersey a State with mandatory review and compliance and with authority to set payshyment rates reduced payroll costs by 3 percent after instituting PR Arizona with voluntary compliance and no legal enforcement powers showed a reducshytion of 6 percent
Labor Productivity FTE Staff Per Adjusted Patient Day
Solid evidence exists that hospitals curbed payroll costs per day by reducing staff per adjusted patient day The data In Table 4 show that though the number of FTE staff needed to produce a given number of days increased this rise occurs more slowly in States with significant PR effects
Once again New Yorks PR programs show dramatshyic changes in the relationship of the Initial program (1971) to the strengthened version (1976) Although the single largest estimated effect-a drop of 10 pershycent in FTE requirements-occurred in the Maryland program the combined effects of the two New York
TABLE4
FTE Staff Per Adjusted Patient Day Levels for all States and Estimated Prospective Reimbursement Effects In Individual Statesbull
Levels tor Selected Years (FTEs Per 1000 Days) Annual Percent Change
StateYear (Percent Change
Due to PR) 1969shy 1975shy 1969middot 1969 1975 1976 1975 1978 1978
All States2 68 78 83 +23 +21 +22
Arizona 66 73 77 +12 +18 +14 1974(-07)
Connecticut 71 77 62 + 14 +21 + 16 1975 (- 06)
Kentucky 63 69 73 +15 + 19 +16 1975(-05)
Massachusetts 75 86 89 +23 + 11 +19 1976 (- 03)
Maryland 71 82 87 +24 +20 +23 1976 (- 10)
New York 71 79 77 +18 -09 +09 1971 (- 03) 1976 (- 08)
bullEach PR State with a statistically significant (5 percent level) PR effect on FTE staff per adjusted patient day Is listed with the year the PR program was established and with the estimated percent effect of PR on the level of FTE staff per day Efmiddot fects not significant at the 5 percent level included negative effects for Indiana (1960) Minnesota (1978) New Jersey (1977) and Washington (1978) and a positive effect for Washington (1976) The R for the FTE staff regression equation was 32
Figures for the Individual States Include estimated PR effects
HEALTH CARE FINANCING REVIEWDECEMBER 1982fVolume 4 NumMr 2 97
programs produce the only reduction inFTE requiremiddot ments after 1975 New York began the period with higher than average FTE levels per day and ended with levels well below the average Connecticut was the only other State to effect this change However Connecticuts 1978 FTE level (82) cannot be dlstlnmiddot guished statistically from the average (83)
Estimated effects that did not clear the 5 percent significance screen strengthen our findings Indiana (1960) Minnesota (1978) New Jersey (1977) and Washington (1978) show reductions In FTE requireshyments associated with PR Once again the countershyIntuitive positive effect estimated for Washingtons 1976 program tells little given the opposite result obmiddot talned for the 1978 program
Price Payroll Per FTE Staff
The consistent findings reported for tests on the payroll and FTE per day hypotheses cannot be duplishycated for payroll per FTE About one-half of the States with significant PR effects show the hypotheshysized reduction in payroll per FTE the other half shows equally significant increases In payroll per
FTE Increases in payroll per day can be caused by wage increases (measured by payroll per FTE) inmiddot creases in FTE requirements or both Since payroll per day increased for all States by 8 to 9 percent per year payroll per FTE unsurprlslngly increased by about 6 percent a year The rest of payroll cost inshycreases (2 to 3 percent) comes as shown In Table 4 from a rise In FTE requirements per day
Although all PR States (Table 5) except Washington and Minnesota grew at rates below the average only Minnesota altered Its relative position It ended the period with a payroll per FTE level higher than avermiddot age after beginning the study at average State promiddot grams not included in the table offer no help in deflnmiddot ing a direction for the PR effect Arizonas payroll per FTE showed a PR-related increase and New Jerseys showed a decrease Kentucky (1975) Maryland (1976) and Washington (1978) provided no usable results New Yorks performance though consistent with the hypothesis based on the 1976 program varies over the whole period Maryland another State rated pomiddot tentially effective in PR cost-control characteristics furnished no usable results No pattern emerges among State programs that suggests that program characteristics affect payroll per FTE outcomes
TABLES
Payroll Per FTE Staff Levels for All States and Estimated Prospective Reimbursement Effects In Individual States1
Levels for Selected Years (Dollars Per 1000 FTEs) Annual Percent Change
StatelY ear (Percent Change
Due to PR) 1969 1975 1978
1969shy1975
1975shy1978
1969shy1978
All States 50 71 86 +60 +66 +62
ConnecticuP 1975(- 04)
56 77 93 +54 +65 +58
Indiana 47 64 77 +53 +64 +56 1960(- 05)
Massachusetts 54 76 91 +59 +62 +60 1978 (- 02)
Minnesota 50 71 89 +60 + 78 +66 1978(- 03)
New York 52 76 89 +65 +54 +62 1971 (03) 1976(- 03)
Washington 56 79 98 +59 +74 +64 1976(02)
Each PR State with a statistically significant (5 percent level) PR effect on payroll per FTE staff patient day is listed with the year the PR program was established and with the estimated percent effect of PR on the level of payroll per FTE staff Efshyfects not significant at the 5 percent level included a positive effect tor Arizona (1974) and a negative effect tor New Jersey (1977) Effects too small in size and statistical significance to be reliable Included Kentucky(1975) Maryland (1976) and Washington (1978) The R2 for the payroll per FTE staff regression equation was 79
Figures for the individual States include estimated PR effects
HEALTH CARE FINANCING REVIEWDECEMBER 1982Volume 4 Number 2 98
SkiiimiddotMix Registered Nurses Per FTE Staff
The hypothesis that hospitals will use relatively more RNs when forced to economize in payroll or staff was not firmly supported by the tests made Three of the four States with significant PA variables showed above average rates of growth in ANs per FTE but the estimated PA effects ranged from 8 pershycent fewer ANs per FTE in Indiana to 7 percent more in Kentucky PA-related changes in AN proportions are dramatic in New York Both 1971 and 1976 vermiddot slons associated with Increases in the level of RNs per FTE The effect raises the average New York AN share of employment from 2 percent below average for all States to near equality Maryland another State described as rigorous in PA regulation shows no sigmiddot nificant AN effect
Discussion and Conclusions
Results of tests on the payroll per day and FTE per day hypotheses support the argument that under PA hospitals cut payroll costs and increase productivity However price and skill-mix hypotheses tested In remiddot gressions of payroll per FTE and ANs per FTE show few statistically significant PA effects and great inmiddot consistency in the size and direction (that is positive versus negative) of these effects Hospitals are submiddot ject to area wage movements which are likely to be influenced as much by labor supply forces as by PA cost-cutting influences on hospital labor demand AN proportions may also reflect area supply factors more than hospital demand Evidence from hospital staffing studies supports the argument that hospitals propormiddot tional use of RNs relates significantly to local AN supply measured as ANs per 1000 population (see Jensen et al 1980)
Payroll cost findings support earlier NHAS tests of PA effects on total unit costs (expense per patient day) reported by Coelen and Sullivan (1980) All States with significant reductions in payroll costs associated with PA also showed significant reductions in total costs However relative magnitudes could not be dimiddot rectly compared For example New York which had an estimated 11 percent payroll cost reduction due to PR showed a 3 percent total cost reduction Marymiddot lands total and payroll cost reductions both amounted to 10 percent
We noted earlier the argument that apparent changes in productivity may be due to alterations in the amount and quality of services provided Other preliminary NHAS findings suggest that hospitals may respond to PR by altering volume and service provision According to Worthington (1980) Maryland and New York showed significant increases in occumiddot pancy rates and average inpatient lengths of stays that were associated with PA Both findings are conshysistent with decreased total and payroll costs per day Adoption rates of all types of hospital services dropped in New York after 1971 (community and qualmiddot lty enhancing services) 0 and 1976 (complexity enmiddot hancing services) One can argue that retarded sermiddot vice adoption is consistent with cost-containment and might be associated with FTE staff reductions
We cannot resolve the question of quality versus productivity effects of PR based only on the reduced form analysis In this paper This preliminary work sugmiddot gests however that hospitals have responded to PR in ways that could result in more efficient operation A more complete explanation of Interactions among costs volume service intensity and other areas pomiddot tentially affected by PR is part of the NHAS agenda for future research
bullbullsee Cromwell and Kanak 1980 Berrys (1973) three-way classification of hospital services was used In this study The first group of services hospitals add include seven to enmiddot hance quality of care Then eleven services that expand the complexity of treatments offered may be added Finally some hospitals add services oriented toward the community
Acknowledgments
The authors wish to thank Richard Yaffe Marilyn FaIlk Craig Coeen and the anonymous referees tor helpful commiddot ments on drafts of this paper
HEALTH CARE FINANCING REVIEWDECEMBER 1982Volume 4 Number 2 99
References
Applied Management Sciences Analysis of Prospective Reshyimbursement Systems Western Pennsylvania Final report submitted to SSAIORS under contract no HEWmiddotOS-74-226 August 1975
Berry Ralph E On Grouping Hospitals for Economic Analymiddot sis Inquiry 105-12 December 1973
Coelen Craig and Daniel Sullivan An Analysis of the Efmiddot feels of Prospective Reimbursement Programs on Hospital Expenditures Health Care Financing RevBw Winter 1981
Cromwell Jerry and James A Kanak An Analysis of the Efmiddot fects of Prospective Reimbursement Programs on Hospital Adoption and Service Sharing Unpublished National Hospimiddot tal Rate-Selling Study December 6 1980
Cromwell J et al Analysis of Prospective Payment Systems for Upstate New York Final report prepared for DHEW under contract no HEW-08middot74middot261 1976
Dowling W L P J House J M Lehman G L Meade N Teague V M Trivedi and C A Watts Prospective Relmmiddot bursement In Downstate New York and Its Impact on Hospf tas-A Summary Discussion paper number 3 prepared for HEW under contract no HEW-08middot74-248 December 1976
Geomet Inc Analysis of the New Jersey Hospital Prospecshytive Reimbursement System 1968middot1973 Final report prepared for DHEW under contract no HEWmiddotOS-74-268 February 1976
Hamilton Diane et a The National Hospital Rate-Setting Study A Comparative Review of Nine Prospective RateSetmiddot tlng Programs Health Care Financing AdministrationCADS August 1980
Jensen Gail et al Quantification of Factors causing Variashytions In Hospital Staffing and Analysis of Monthly AHA Hosmiddot pita Data Abt Associates Inc Contract no HRS-232middot79-0076 October 21 1980
Sloan Frank A and Bruce Steinwald WageSettlng In Hospf tals Evidence from the 60s and 70s D C Heath Lexington Books Lexington Massachusetts 1979
Sloan Frank A and Bruce Steinwald Hospital Costs and Inmiddot put CholctJs Eltscts of Insurance Regulation and Other Factors 1978
Sloan Frank A and Bruce Steinwald Effects of Regulation on Hospital Costs and Input Use Presented at American Economics Association meetings Chicago Illinois August28 1978
Spectrum Research Inc Prospective Rate Setting in Indiana Impact on Hospital Costs Quaflty and Management Denver Polley Center 1976
US Department of Labor Bureau of Labor Statistics Industry Wage Survey Hospitals and Nursing Homes Various years
Worthington Nancy L The Effects of Prospective Relmmiddot bursement Programs on Volumes of Hospital Services Unmiddot published National Hospital Rate-Setting Study October 24 1980
HEALTH CARE FINANCING REVIEWDECEMBER l8821Vol11me 4 Number 2 100
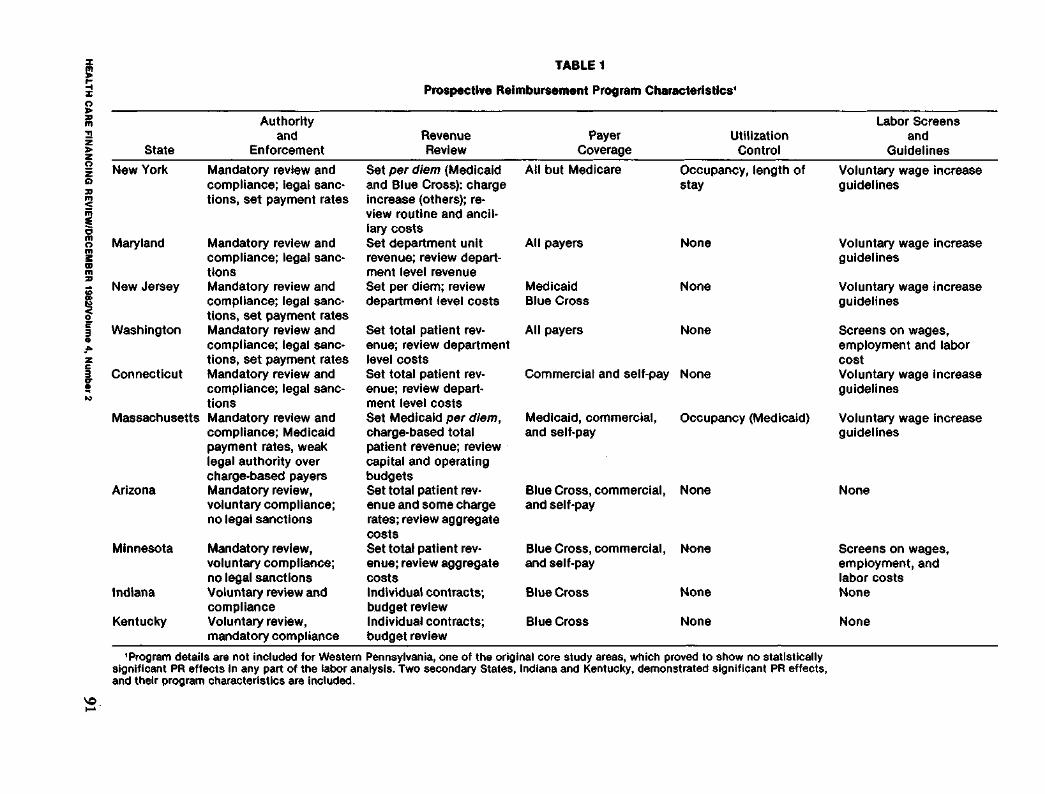
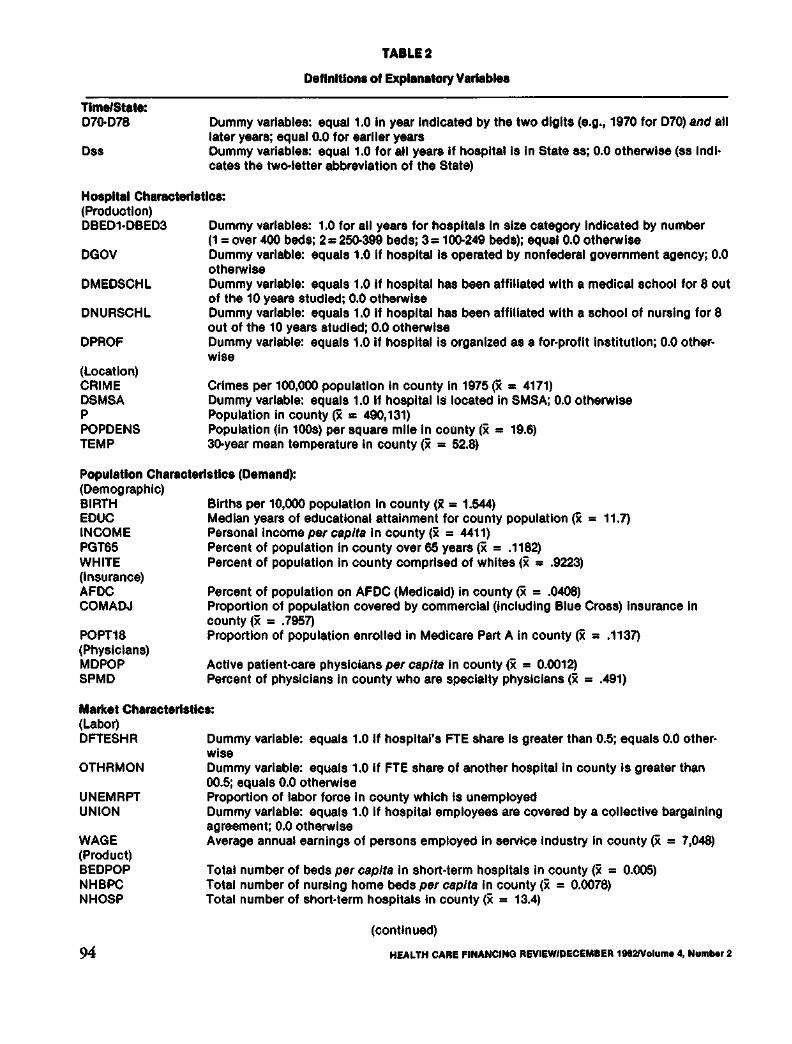
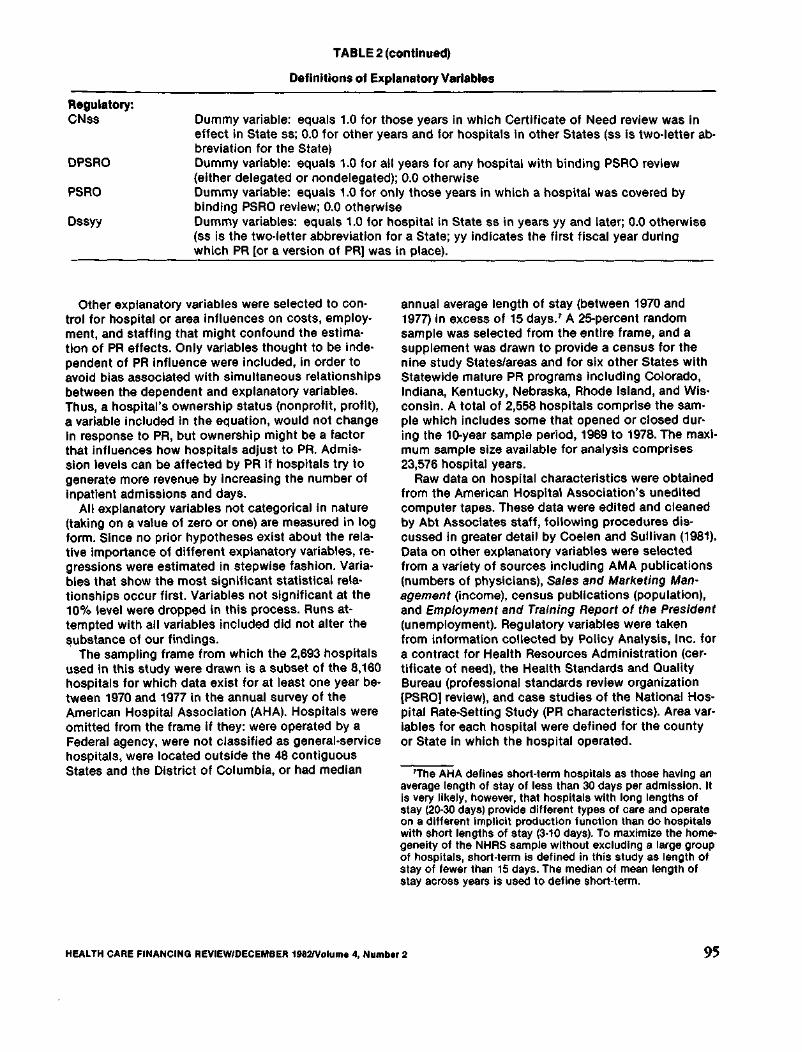
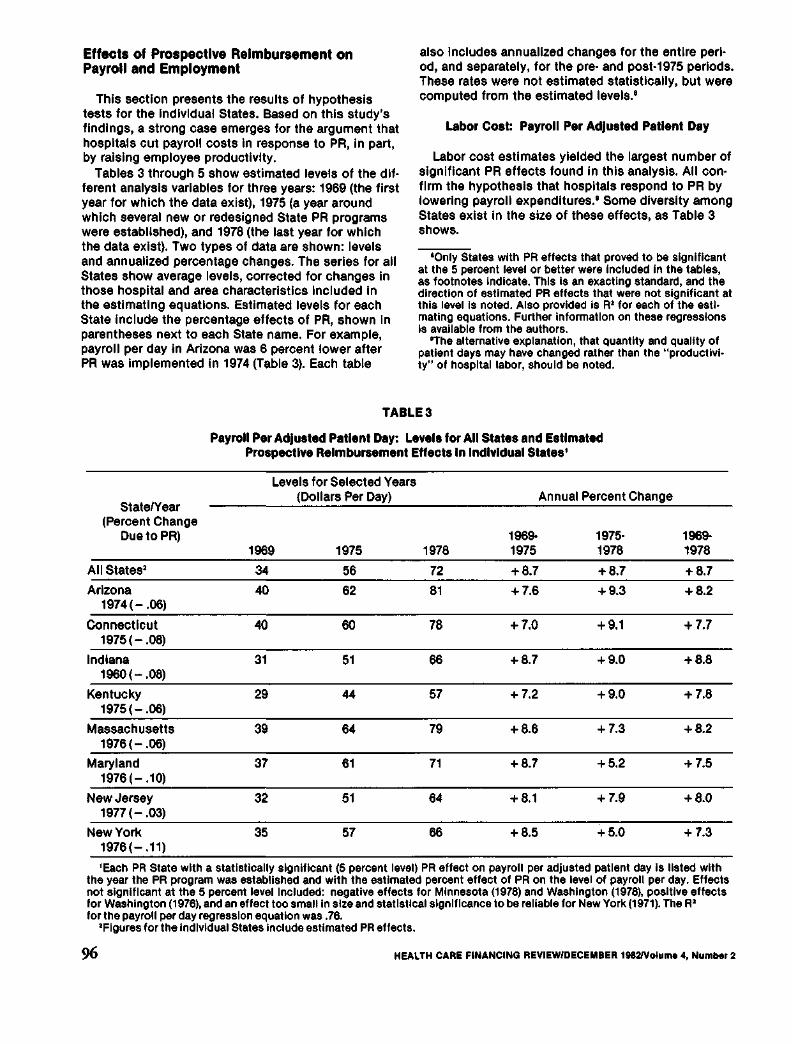
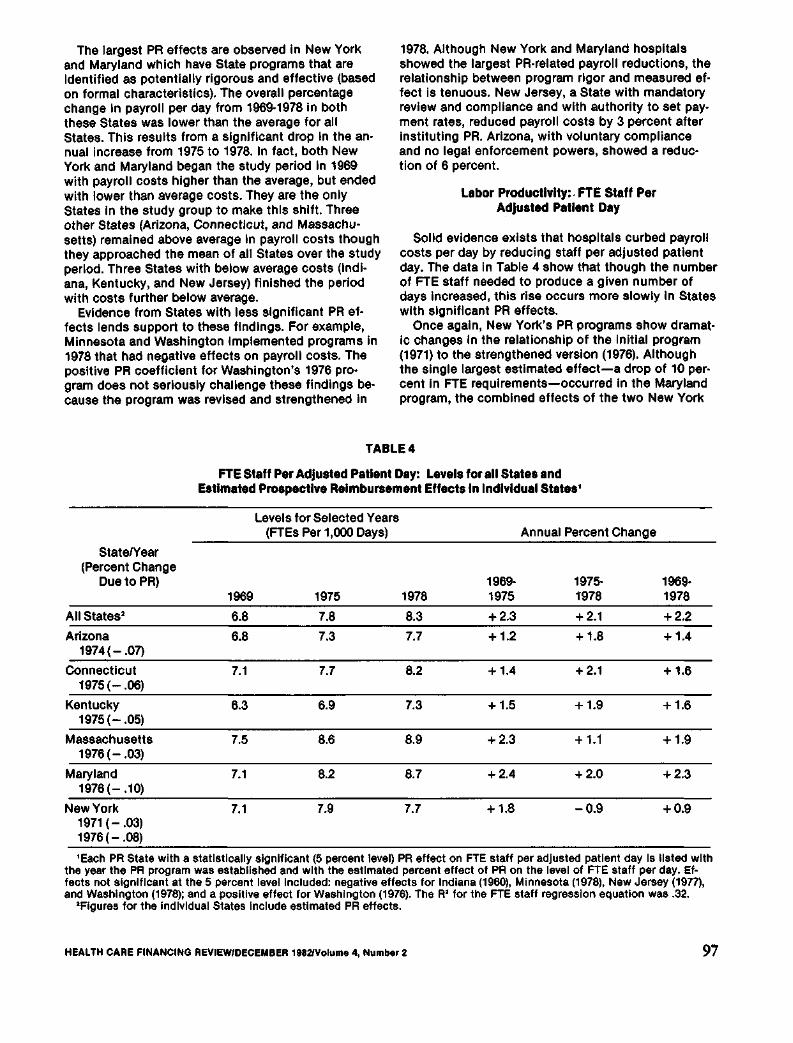
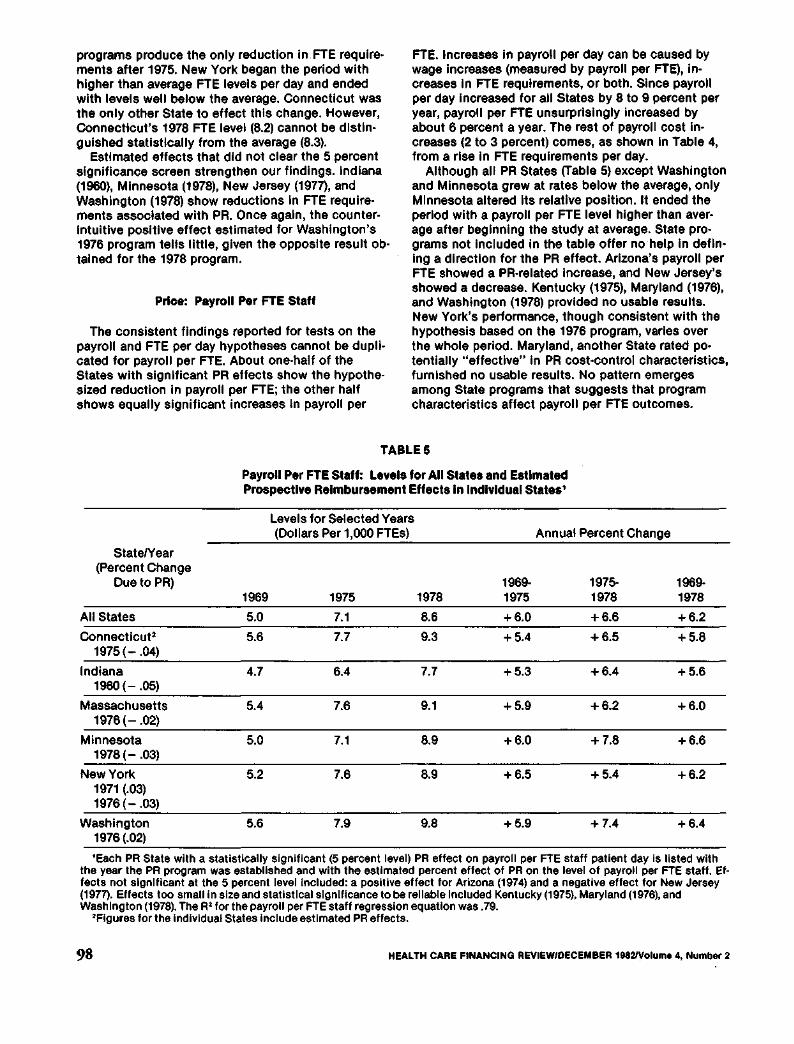