hospital trusts productivity in the english nhs · che research paper 117 hospital trusts...
TRANSCRIPT

CHE Research Paper 117
Hospital Trusts Productivity in the English NHS: Uncovering Possible Drivers of Productivity Variations
Maria Jose Aragon Aragon, Adriana Castelli, James Gaughan


Hospital trusts productivity in the English NHS: uncovering possible drivers of productivity variations
Maria Jose Aragon Aragon Adriana Castelli James Gaughan
Centre for Health Economics, University of York, UK October 2015
Background to series
CHE Discussion Papers (DPs) began publication in 1983 as a means of making current research material more widely available to health economists and other potential users. So as to speed up the dissemination process, papers were originally published by CHE and distributed by post to a worldwide readership. The CHE Research Paper series takes over that function and provides access to current research output via web-based publication, although hard copy will continue to be available (but subject to charge). Acknowledgements
We thank John Bates, Keith Derbyshire, Muhammed Jan, Caroline Lee and Tongtong Qian for early discussions, Chris Bojke and Katja Grašič for their assistance with the preparation of the data, Martin Chalkley for early comments and suggestions, Adam Roberts and John Appleby for comments provided at the Health Economists’ Study Group meeting 2015 held in Lancaster. The Hospital Episode Statistics are copyright © 2010/11 - 2012/13, re-used with the permission of The Health & Social Care Information Centre. All rights reserved. This is an independent study commissioned and funded by the Department of Health in England as part of a programme of policy research at the Centre for Health Economics (103/0001 ESHCRU). The views expressed are those of the authors and not necessarily those of the Department of Health. Further copies
Copies of this paper are freely available to download from the CHE website www.york.ac.uk/che/publications/ Access to downloaded material is provided on the understanding that it is intended for personal use. Copies of downloaded papers may be distributed to third-parties subject to the proviso that the CHE publication source is properly acknowledged and that such distribution is not subject to any payment. Printed copies are available on request at a charge of £5.00 per copy. Please contact the CHE Publications Office, email [email protected], telephone 01904 321405 for further details.
Centre for Health Economics Alcuin College University of York York, UK www.york.ac.uk/che © Maria Jose Aragon Aragon, Adriana Castelli, James Gaughan

Hospital Trusts productivity in the English NHS: uncovering possible drivers of productivity variations i
Table of Contents
Abstract ................................................................................................................................................... ii 1. Introduction ........................................................................................................................................ 1 2. Methods .............................................................................................................................................. 2 2.1 Hospital outputs ................................................................................................................................ 2 2.2 Hospital inputs .................................................................................................................................. 2 2.3 Hospital productivity index ............................................................................................................... 3 2.4 Examining variations in hospital productivity ................................................................................... 4 3. Data ..................................................................................................................................................... 7 3.1 NHS output and inputs ...................................................................................................................... 7 3.1.1 Hospital mergers ............................................................................................................................ 7 3.2 Regressors ....................................................................................................................................... 10 4. Results ............................................................................................................................................... 13 4.1 Variation in hospital Trusts productivity ......................................................................................... 14 5. Discussion and conclusions ............................................................................................................... 16 References ............................................................................................................................................ 18 Appendix ............................................................................................................................................... 20 Table 1: Names and codes for merging Trusts, 2011/12 and 2012/13 .................................................. 8
Table 2: Summary Statistics for NHS Outputs and Inputs, 2010/11 – 2012/13...................................... 9
Table 3: Regressors – description and source ...................................................................................... 10
Table 4: Summary statistics explanatory variables, 2010/11 – 2012/13 .............................................. 12
Table 5: Variations in Labour and Total Factor Productivity Trusts rankings, 2010/11 – 2012/13 ...... 13
Table 6: OLS Cross-section models of hospital productivity scores, 2010/11 – 2012/13 ..................... 15
ii CHE Research Paper 117
Abstract
In 2009, the NHS Chief Executive warned that a potential funding gap of £20 billion should be met by extensive efficiency savings by March 2015. Our study investigates possible drivers of differential Trust performance (productivity) for the years 2010/11-2012/13. Productivity is measured as Outputs/Inputs. We extend previous productivity work at Trust level by including a fuller range of care settings, including Inpatient, A&E and Community Care, in our output measure. Inputs include staff, equipment, and capital resources. We analyse variation in Total Factor and Labour Productivity with ordinary least squares regressions. Explanatory variables include efficiency in resource use measures, Trust and patient characteristics. We find productivity varies substantially across Trusts but is consistent across time. Larger Trusts are associated with lower productivity. Patient age groups treated is also found to be important. Foundation Trust status is associated with lower Total Factor Productivity, while treating more patients in their last year of life is surprisingly associated with higher Labour Productivity. Variation in productivity is persistent across years, and not fully explained by case-mix adjustment. A lack of convergence in productivity may indicate outstanding scope to improve Trust productivity based on mimicking the practises of the most productive providers. Keywords: Hospital, productivity indices, productivity variation

Hospital Trusts productivity in the English NHS: uncovering possible drivers of productivity variations 1
1. Introduction
In 2009, the NHS Chief Executive warned the NHS that, due to financial pressures faced by the UK government, a potential funding gap of up to £20 billion should be met by extensive efficiency savings by March 2015, the so-called Quality, Innovation, Productivity and Prevention (QIPP) challenge. The efficiency savings should be achieved through nationally-driven changes such as pay restraint (40%); from improved efficiency in hospitals and other health services (40%); and from transforming how services are delivered, e.g. treating more patients as day care cases rather than as overnight care patients (20%) (Appleby et al., 2014, Public Accounts Committee, 2011, Public Accounts Committee, 2013). In this changed policy and financial environment, optimising productivity becomes all the more vital. Variation in practice can indicate the presence of unnecessary additional cost at one end of the spectrum and innovative best practice at the other; our study attempts to identify possible drivers of differential hospital productivity for the years immediately after the announcement of the Nicholson challenge, 2010/11 - 2012/13. To this end, we follow the approach adopted in Castelli et al. (2014) to construct Labour and Total Factor Productivity measures for each hospital Trust in England. We then use these productivity measures as our dependent variable in our regressions analysis to uncover potential drivers of productivity variations. Our work differs from Castelli et al. (2014) in that (1) we extend the definition of hospital output, then limited to inpatient and outpatient activity only, to include all healthcare services produced and delivered to NHS patients by NHS hospital Trusts in England; (2) we update the analysis temporally by considering three new financial years; (3) we calculate both Total Factor and Labour Productivity measures; and finally, (4) we consider a list of new possible regressors that are known to affect hospital performance. We classify these variables into four different groups: hospital characteristics, quality of care indicators, patient characteristics and resource use. The structure of the paper is as follows. The form of the output and input measures used to construct our productivity measures are presented in section 2. Section 2 also contains the specification of the regression model used with a description of the explanatory variables. Data used to populate the output and input measures and the explanatory variables are described in section 3. Section 4 reports the results for both the hospital productivity measures and rankings as well as the results from the regression analyses. Discussion and concluding remarks are provided in section 5.
2 CHE Research Paper 117
2. Methods
As Castelli et al. (2014), we define the productivity of a hospital Trust as the ratio of the total amount of hospital output produced over either total labour inputs or total amount of inputs (labour, capital and intermediate) used to produce this output. The productivity measure of hospital Trust h is calculated as:
𝑃𝑟𝑜𝑑𝑢𝑐𝑡𝑖𝑣𝑖𝑡𝑦 𝑜𝑓 ℎ𝑜𝑠𝑝𝑖𝑡𝑎𝑙 𝑇𝑟𝑢𝑠𝑡 ℎ = 𝑂𝑢𝑡𝑝𝑢𝑡𝑠ℎ
𝐼𝑛𝑝𝑢𝑡𝑠ℎ (1)
Hence, in order to estimate hospital Trust productivity (both Labour and Total Factor), it is necessary to correctly define and calculate the numerator (outputs) and denominator (inputs) of eq. (1).
2.1 Hospital outputs
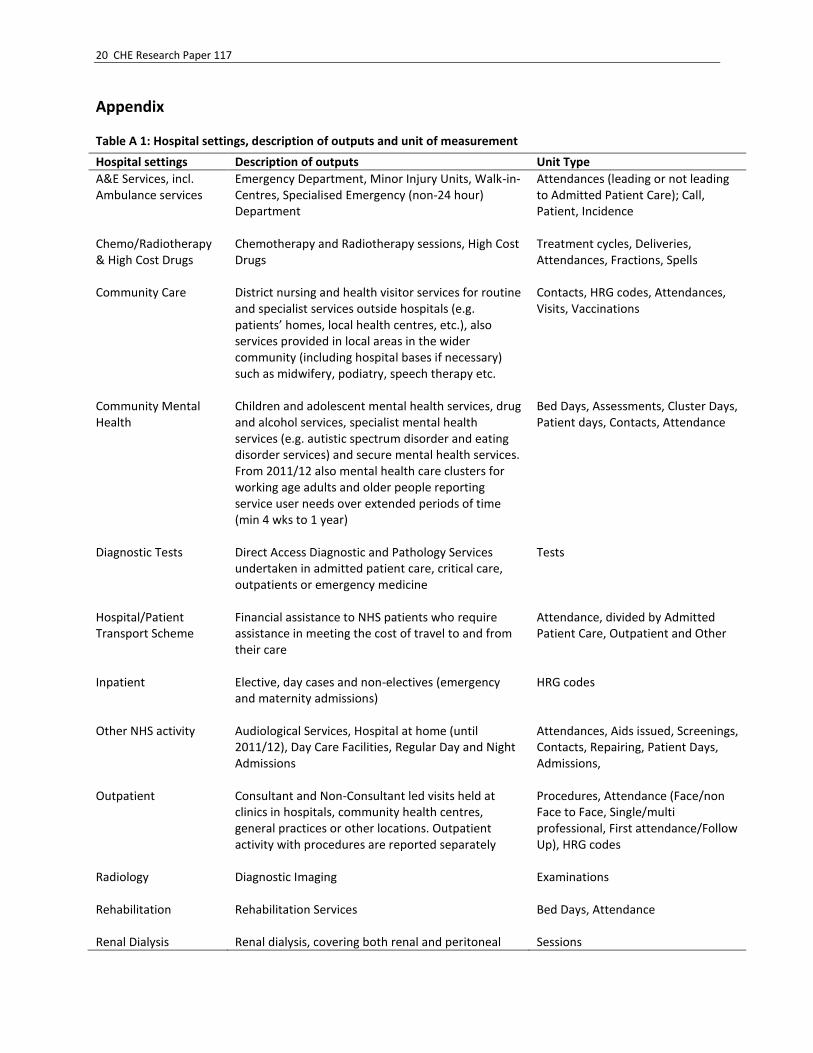
In this work, we consider as hospital output all healthcare goods and services (e.g. Inpatient, outpatient, A&E, etc.) produced and delivered by NHS Hospital Trusts to NHS patients (thus excluding private patients) in England. Patients have diverse healthcare needs and receive a range of different treatments. These different treatments and needs are taken into account through the classification of patients into an array of different output categories, chosen to best fit the type of care provided. For example, all patients admitted to hospital as inpatients are classified into one of over 1,400 different Healthcare Resource Groups (HRGs). Table A-1 in the Appendix presents the full list of the various hospital output considered in this work with their respective unit of measurement. The total number of patients treated/healthcare goods and services delivered by each hospital Trust is aggregated up into an overall measure of hospital output using national average unit costs. This is consistent with the Payment by Results policy (PbR). Thus, the ‘cost-weighted’ hospital output 𝑋ℎ is defined as:
𝑋ℎ = ∑ 𝑥𝑗ℎ𝑐�̅�𝐽𝑗=1 (2)
Where 𝑥𝑗ℎ represents the number of patients categorised to output category j with j=1,…,J in hospital
Trust h. The cost weight is defined as 𝑐�̅� = 𝑐𝑗/�̂� where 𝑐𝑗 represents the national average cost for
patients allocated to output j and �̂� is the national average cost across all patients.
2.2 Hospital inputs
The provision of hospital treatment involves utilising a variety of different inputs during the production process. These inputs include labour, capital and intermediate inputs. Capital is defined as any non-labour input with an asset life of more than a year, such as land and buildings. Intermediate inputs comprise all other non-labour inputs, such as drugs and dressings, disposable supplies and equipment, and use of utilities. Labour is defined as all types of staff (medical and non-medical) employed by Trusts, including agency staff. In our analyses we consider both Labour and Total Factor Productivity. In the Labour productivity measure, we include as inputs a direct measure of NHS labour and hospital Trusts’ expenditure on agency staff.

Hospital Trusts productivity in the English NHS: uncovering possible drivers of productivity variations 3
The direct NHS labour measure is calculated using information on physical quantities of labour, defined in terms of Full Time Equivalent (FTE) staff, which are then aggregated using national average wages, as follows:
𝑍ℎ𝐷𝐿 = ∑ 𝑧𝑛ℎ𝜔𝑛
𝑁𝑛=1 (3)
where znh is the volume of input type n with n= 1,…,N in hospital h, and ωn is the national average wage for input type n. Information on the physical quantities of agency staff employed by hospital Trusts is not available. We
therefore use information on the total expenditure on agency staff (𝐸ℎ𝐴) by each hospital Trust. This is
then added to each hospital Trust’s direct labour measure (𝑍ℎ𝐷𝐿) to obtain a Total Labour measure as
follows:
𝑍ℎ𝐿 = ∑ 𝑧𝑛ℎ𝜔𝑛 + 𝐸ℎ
𝐴𝑁𝑛=1 (4)
Details about the physical quantities of capital and intermediate inputs are hard to come by, but comprehensive details are available about how much hospitals spend on these inputs. Hence, our Total Factor Productivity measure for each hospital is constructed by combining the total labour measure
(𝑍ℎ𝐿) with expenditure data on capital and intermediate inputs. The measure of total hospital inputs is
specified as:
𝑍ℎ𝑇𝐹 = 𝑍ℎ
𝐿 + 𝐸ℎ𝑀 + 𝐸ℎ
𝐾 = ∑ 𝑧𝑛ℎ𝜔𝑛 + 𝐸ℎ𝐴𝑁
𝑛=1 + 𝐸ℎ𝑀 + 𝐸ℎ
𝐾 (5)
Where 𝑍ℎ𝑇𝐹 is an aggregation of the Labour measure (𝑍ℎ
𝐿), intermediate goods and services (𝐸ℎ𝑀) and
capital (𝐸ℎ𝐾).
2.3 Hospital productivity index
Finally, we construct the hospital Trust productivity ratios by combining equation (2) separately with equations (4) and (5), to obtain respectively the Labour (6) and the Total Factor Productivity (7) indices:
𝑃ℎ𝐿 =
𝑋ℎ
𝑍ℎ𝐿 =
∑ 𝑥𝑗ℎ𝑐�̅�𝐽𝑗=1
∑ 𝑧𝑛ℎ𝜔𝑛+𝐸ℎ𝐴𝑁
𝑛=1 (6)
𝑃ℎ𝑇𝐹 =
𝑋ℎ
𝑍ℎ𝑇𝐹 =
∑ 𝑥𝑗ℎ𝑐�̅�𝐽𝑗=1
∑ 𝑧𝑛ℎ𝜔𝑛+𝐸ℎ𝐴+𝐸ℎ
𝑀+𝐸ℎ𝐾𝑁
𝑛=1 (7)
To help with interpretation and comparison of productivity across hospitals, we standardise the productivity ratios for each hospital against the relevant national average productivity ratio and convert them into a percentage term.
The standardized Labour and Total Factor Productivity formulae (𝑃ℎ𝑆,𝐿 𝑎𝑛𝑑 𝑃ℎ
𝑆,𝑇𝐹) for each hospital h are defined as follows:
𝑃ℎ𝑆,𝐿 = {[(
𝑋ℎ
𝑍ℎ𝐿)
1
𝐻⁄ ∑
𝑋ℎ
𝑍ℎ𝐿ℎ ] − 1} × 100 (8)
4 CHE Research Paper 117
𝑃ℎ𝑆,𝑇𝐹 = {[(
𝑋ℎ
𝑍ℎ𝑇𝐹)
1
𝐻⁄ ∑
𝑋ℎ
𝑍ℎ𝑇𝐹ℎ ] − 1} × 100 (9)
Where 𝑋ℎ is the volume of output produced, 𝑍ℎ𝐿 is the amount of Labour input (NHS and agency staff)
used in hospital h and 𝑍ℎ𝑇𝐹 is the amount of all inputs used in hospital h. For example, if the
standardized Labour Productivity measure (𝑃ℎ𝑆,𝐿) in hospital h is 10, this means that Labour Productivity
in that hospital is 10% higher than the national average.
2.4 Examining variations in hospital productivity
Variations in hospital Trust productivity are examined by estimating Ordinary Least Squares (OLS) regressions with robust standard errors to account for potential heteroskedasticity. Our dependent variables are the standardised Labour and Total Factor Productivity measures, which we regress against a number of explanatory variables that have been identified as influencing hospital performance. The OLS regression model is given by:
𝑦ℎ = 𝛽0 + ∑ 𝛽𝑔𝐻𝑔ℎ5𝑔=1 + +𝛽6𝑄6ℎ + ∑ 𝛽𝑔𝑃𝑔ℎ
10𝑔=7 + ∑ 𝛽𝑔𝐸𝑔ℎ
12𝑔=11 + 𝜀ℎ (10)
We have divided explanatory variables into four groups: variables that relate to hospital characteristics (H), quality of care (Q), patient characteristics (P) and efficiency in resource use (E). Hospital characteristics, including workforce characteristics (H): Public NHS hospitals are divided into Foundation Trusts (FTs) and non-Foundation Trusts (NFTs). FTs are not-for-profit public organisations with greater managerial and financial autonomy from direct central government control (Department of Health, 2003). FTs are allowed to keep surpluses, which they can use to either increase staff salaries and/or to re-invest in capital equipment. Further, FTs are allowed to borrow money to invest in improved services for patients and service users (Monitor, 2015). FTs were introduced in the English NHS in 2004/05, with the expectation that these should be more productive, introduce greater innovation and obtain greater on the job satisfaction (Department of Health, 2010a, Verzulli et al., 2011), given their new incentive structure. Teaching hospitals are thought to have higher costs and to appear less productive than non-teaching hospitals because they tend to treat more complex or more severe patients. Moreover, teaching activity introduces delays to the treatment process as part of a consultant’s role is to train medical students (Street et al., 2010a). Hence, it is important to understand whether teaching activity is a possible driver of differences in Trusts’ productivity. To this end, many studies introduce a simple dummy variable in their regression analyses to identify a hospital as either a teaching hospital or not. This identification is, however, reductive in that some form of teaching activity is performed in all types of hospital Trusts. So, rather than using a dummy for teaching status, we identify the extent of teaching activities by measuring the total number of undergraduate medical students placed in any hospital Trust. Larger Trusts can benefit from scale economies and acquire experience from greater throughput. They might also face diseconomies from greater complexity of organizational structure. Size can be measured in terms of either throughput or number of beds. Propper et al. (2004) consider in turn both measures of hospital Trust size in modelling Trust performance in terms of death rates, whilst Kolstad and Kowalski (2012) and Aiken et al. (2014) use only the number of beds to adjust for hospital size. Recognising that size is positively correlated with Trusts’ teaching status and to a lesser extent with our

Hospital Trusts productivity in the English NHS: uncovering possible drivers of productivity variations 5
continuous measure of teaching, including a measure of size enables us to disentangle scale effects from teaching effects. Finally, an advantage of using number of beds as a measure of size is its independence from approaches to treatment, which impact on throughput, such as the use of day cases and average length of stay, which are considered separately. In this paper, we use number of beds as our preferred measure of size. Percentage of medical workforce employed over total workforce employed by each hospital Trust is an adjustment for the skill mix employed by different Trusts. The impact of a different skill mix on productivity depends on the relationship between the Trust’s chosen skill mix and its optimal skill mix. A greater concentration of doctors increases the supply of skills best provided by this staff group. If there is a relative lack of these skills, an increase would result in greater productivity. This might be through being able to see patients more frequently on rounds or to discharge them more swiftly after it becomes appropriate to do so. The Market Forces Factor (MFF) is a way of accounting for the unavoidable geographical differences in costs of production between providers.1 The measure includes several elements of providers’ running costs for non-medical staff, medical and dental staff, land and buildings (Monitor, 2013). We use the Staff MFF in the Labour Productivity regressions and the Overall MFF in the TFP regressions. We expect these variables to be negatively related to the hospital productivity measures as the presence of a higher cost for Labour and land and buildings should reduce the productivity of Trusts affected. Quality of hospital care (Q): In terms of quality of hospital care we consider only survival rates at Trust level. Mortality or its mirror survival rate is a simple measure of quality with the advantages of being clearly defined and straight forward to observe. As such, mortality remains a key measure of hospital performance. “Preventing people from dying prematurely” is one of five overarching measures used in the NHS Outcomes Framework 2011/12 (Department of Health, 2010b) and one of the areas of assessment in the recent Keogh Review (Keogh, 2013) of 14 specific Trusts. We expect Trusts’ survival rates to be negatively related to Trusts’ productivity, both in terms of Labour and Total Factor, because providing better care to patients should require the use of more resources, for any given level of activity, and hence result in lower productivity. Patient characteristics (P): HRGs do not capture perfectly differences in care requirements among patients. Recognising this, we consider some variables capturing patient case-mix. First, we consider the percentage of patients falling into three age categories: aged 0 to 15 years, aged 46 to 60 years and over 60 years, with patients aged 16 to 45 years forming the reference category. It is known that older patients tend to have multi-comorbidities and as a consequence that treating them is more resource and cost intensive. Further, we consider the proportion of patients in their last year of life. It is known - ’red herring’ hypothesis - that the costs of care are at their highest, independently of age, for patients in their last year of life (Roberts et al., 2012). This will have a negative impact on Trusts productivity. We, therefore, expect hospitals that treat a greater proportion of patients in their last year of life to be less productive.
1 The MFF will to some extent capture regional differences in hospital Trust productivity. Thus, we have decided not to include
further geographical variables in our regression models.
6 CHE Research Paper 117
Efficiency in resource use (E): Hospital Trusts are increasingly asked to think of new and innovative ways of transforming service delivery to speed up care, improve care quality and patient experience, to the ultimate end of saving costs and increase efficiency. Ways of achieving this include “re-designing or shifting services away from the traditional setting of the hospital and out towards community based care” (NHS Improving Quality, 2015). To this end, the Department of Health has developed the so-called ‘Better Care, Better Value’ indicators which summarise providers’ performance on a number of indicators and which can be used “locally to help inform planning, to inform views on the scale of potential efficiency savings in different aspects of care and to generate ideas on how to achieve these savings” (NHS Improving Quality, 2015). We use two of the ‘Better Care, Better Value’ indicators as potential drivers of variation in Trusts productivity: length of stay and day surgery rates.2 We expect hospital Trusts with shorter length of stay and with a greater proportion of their elective activity carried out as day cases to be more productive.
2 Day surgery for a set of procedures is also associated with a Best Practice Tariff since 2010/11.
Hospital Trusts productivity in the English NHS: uncovering possible drivers of productivity variations 7
3. Data
3.1 NHS output and inputs
Hospital inpatient activity is extracted from the Hospital Episode Statistics (HES) database (The Health and Social Care Information Centre, 2012/13), whilst all other hospital outputs are derived from the Reference Cost (RC) database (Department of Health, 2011, Department of Health, 2012, Department of Health, 2013). The HES database comprises more than 15 million patient records in each financial year. Each record represents a Finished Consultant Episode (FCE), recording the information related to the time a patient spends under the care of a particular consultant. The majority (over 89%) of patients remains under the care of the same consultant for the whole duration of their hospital stay; however, a small proportion is cared for by more than one consultant because they are transferred from one specialty to another. By combining the episodes of care received by each individual patient, we construct a “provider spell” for each patient, capturing their entire hospital stay. A provider spell for each patient is calculated using the most recent methodology published by the then NHS Information Centre (now Health and Social Care Information Centre or HSCIC) (The Health and Social Care Information Centre, 2014). As each FCE is associated with an HRG; we allocate patients with multiple episodes to the HRG recorded in their first FCE. Using national average unit costs from the RC database, we assign a cost to each FCE in HES and to each outpatient attendance. The cost of a spell is calculated on the basis of the most expensive FCE within the spell (Castelli et al., 2011). We then calculate the national average cost of a patient spell for each HRG. These national averages form the set of cost weights 𝑐𝑗 by which we aggregate patients in
different HRGs and outpatient categories into a single index of output. Apart from providing the national average unit cost information for inpatient output, the RC database is also the source of information for all remaining types of Trusts’ outputs for both volume of activity and national average unit costs. Information on hospitals’ volume of NHS staff used in the production of hospital activity is taken from the Electronic Staff Record (ESR), through the NHS iView workforce database (https://iview.ic.nhs.uk/), which is then combined to Payroll and Human Resources system from the NHS, from which we derive the national average earnings for each occupational group. The data contain numbers of FTE staff employed in the NHS. In 2012/13 there were 585 groups for all staff employed in the NHS. Finally, the Trusts’ expenditure on agency staff, capital and intermediate inputs for 2010/11 and 2011/12 is derived from the Trusts’ Financial Returns (TFRs) for non-Foundation Trusts and from the Annual Accounts for Foundation Trusts, which are provided by the Department of Health and Monitor respectively. Expenditure on capital and intermediate inputs for 2012/13 continue to be derived from FTs’ Annual Accounts and are taken from the new Financial Monitoring Accounts for non-Foundation Trusts. However, expenditure on agency staff is no longer readily identifiable in the FTs’ Annual Accounts and in the Financial Monitoring Accounts for non-Foundation Trusts for 2012/13, thus we have used data provided by the Department of Health instead. 3.1.1 Hospital mergers
A number of hospital mergers have occurred over the period under investigation. These are set out in Table 1. We found that after mergers occurred, in a few cases, both output and input data continued to

8 CHE Research Paper 117
be reported separately by merging Trusts. In these cases, we have proceeded by attributing to the merged Trust any information on outputs and/or inputs reported separately by its constituent Trusts. Attributed figures are compared with equivalent data in previous years to check these are on trend and to exclude any potential double counting. Table 1: Names and codes for merging Trusts, 2011/12 and 2012/13
2011/12
Merging Trusts Merged Trusts
Nuffield Orthopaedic Centre NHS Trust (RBF) Oxford University Hospitals NHS Trust (RTH) Oxford Radcliffe Hospital NHS Trust (RTH) Winchester and Eastleigh Healthcare NHS Trust (RN1) Hampshire Hospitals NHS FT (RN5) Basingstoke and North Hampshire NHS FT (RN5)
2012/13
Merging Trusts Merged Trusts
York Teaching Hospital NHS FT (RCB) York Teaching Hospital NHS FT (RCB) Scarborough and North East Yorkshire NHS Trust (RCC) Trafford Healthcare NHS Trust (RM4) Central Manchester and Manchester Children's
University Hospitals NHS FT (RW3) Central Manchester and Manchester Children's University Hospitals NHS FT (RW3) Barts and the London NHS Trust (RNJ) Barts Health NHS Trust (R1H) Whipps Cross University Hospital NHS Trust (RGC) Newham University Hospital NHS Trust (RNH)
Table 2 provides summary statistics of all hospital Trusts’ activity provided in the different health care settings, and about hospital Trusts’ inputs for the years 2010/11 to 2012/13. Please note that the total number of Hospital Trusts varies by year, being equal to 166 provider Trusts in 2010/11, 164 in 2011/12 and 161 in 2012/13. Also, it is worth noting that not all hospital Trusts provide activity in all the settings; hence, the variation in the total number of Trusts reporting activity in each setting. In particular, we find that all Trusts provide activity both in terms of inpatient and outpatient settings. At the other extreme, less than 30 Trusts report any activity in Community Mental Health. Finally, we note that two hospital Trusts did not report Direct Labour data in 2010/11; these are the Chesterfield Royal Hospital NHS Foundation Trusts (RFS) and Moorfields Eye Hospital NHS Foundation Trust (RP6).

Hospital Trusts productivity in the English NHS: uncovering possible drivers of productivity variations 9
Table 2: Summary Statistics for NHS Outputs and Inputs, 2010/11 – 2012/13
Variable
2010/11
2011/12
2012/13
N Mean Std. Dev.
N Mean Std. Dev.
N Mean Std. Dev.
Hospital Outputs
Elective and day cases
166 41,966 24,254
164 43,561 24,648
161 44,691 25,292
Non-Electives
166 43,452 24,681
164 43,835 24,089
161 44,891 25,203
A&E
152 99,993 46,158
151 109,302 51,385
148 112,390 57,084
Chemo/Radiotherapy & High Cost Drugs
164 31,807 39,502
161 31,299 36,340
160 42,014 52,257
Community Care
149 76,270 121,177
147 221,778 298,557
144 238,663 310,998
Community Mental Health
24 11,344 11,390
27 61,229 169,587
28 111,964 258,957
Diagnostic Tests
150 2,119,259 1,315,580
154 2,176,772 1,433,650
152 2,234,692 1,503,636
Hospital/Patient Transport Scheme
84 4,986 5,193
N/A
N/A
Other NHS Activity
154 24,425 15,737
153 27,664 17,037
152 28,101 17,343
Outpatient
166 435,269 227,969
164 437,076 228,661
161 451,489 249,937
Radiology
165 50,148 31,421
162 53,370 32,095
160 58,155 38,833
Rehabilitation
86 15,213 12,906
96 18,132 17,330
93 16,813 17,137
Renal Dialysis
67 59,149 51,470
61 66,355 49,342
64 64,624 53,073
Specialist Services
163 20,259 15,319
161 23,612 18,160
158 26,727 21,312
Hospital Inputs (£000)
NHS Labour (Direct)
164 137,584 84,297
164 145,049 84,385
161 153,940 90,913
Agency Labour
166 7,672 6,335
164 7,415 5,581
161 9,615 7,446
Intermediate goods and services
166 65,239 48,405
164 73,453 53,398
161 102,285 84,558
Capital
166 32,541 23,783
164 38,781 28,761
161 62,497 52,005

10 CHE Research Paper 117
3.2 Regressors
The explanatory variables included in our analyses come from various sources. These are briefly set out in Table 3. Table 3: Regressors – description and source
Variable Description Source
Number of Students (per 100 FTE)
Number of students
Medical workforce + non-medical workforce* 100 DH
Foundation Trust Indicator
Equal to one if Trust has FT status, zero otherwise Monitor (1)
Size [number of beds] Average number of total available beds NHS England (2)
Medical / Workforce [%] Medical workforce
Medical workforce + non-medical workforce* 100 DH
Staff MFF [%] Staff MFF * 100 DH
MFF [%] Overall MFF * 100 DH
30-day Survival Rate [%] (1 - Deaths in-hospital or within 30 days of discharge
Total number of spells) *100
Derived from HES and ONS
Patients in last year of life [%]
Spells with patients in last year of life
Total number of spells* 100
Derived from HES and ONS
Patients aged 0-15 [%] Spells with patients aged 0-15 years
Total number of spells* 100
Derived from HES
Patients aged 46-60 [%] Spells with patients aged 46-60 years
Total number of spells* 100
Derived from HES
Patients aged over 60 [%] Spells with patients aged over 60 years
Total number of spells* 100
Derived from HES
Day Cases / Elective Spells [%]
Day cases
Number of elective spells* 100
Derived from HES
Average LoS [days] Average LoS (LoS = date spell ended - date spell started) Derived from HES
Sources: DH = Department of Health; HES = Hospital Episode Statistics; ONS = Office for National Statistics. Notes: (1) https://www.gov.uk/government/publications/nhs-foundation-trust-directory/nhs-foundation-trust-directory; (2) http://www.england.nhs.uk/statistics/statistical-work-areas/bed-availability-and-occupancy/bed-data-overnight/
The number of full time medical undergraduate students is taken from information provided by the DH for 2011/12, as this is the most complete dataset currently available. It is therefore assumed in our regression models that the ratio of students to overall workforce is stable over time. Where mergers occurred in 2012/13, the number of students in the constituent Trusts was summed to generate a figure for the merged Trust. Where mergers occurred in 2011/12, figures from merged Trusts in 2011/12 had to be apportioned back in some way to the merging Trusts in 2010/11. This apportionment was based

Hospital Trusts productivity in the English NHS: uncovering possible drivers of productivity variations 11
on the proportion of full time medical students reported by said Trusts in a separate dataset for 2010/11. The 2010/11 dataset is not used in its entirety due to it coming from a different source and not being directly comparable to the 2011/12 data. A patient is defined as being in their last year of life for an observed admission if his/her reported date of death occurs within one year of the start of their hospital treatment. This variable is calculated using the date of death data collated by the Office of National Statistics (ONS), which we merge to the HES database. From the same data, we identify deaths occurring within 30 days from discharge, from which we derive the 30 day survival variable. We also derive from the HES database the average length of stay measures for all hospital elective and non-elective patients, the proportion of day cases over total elective admissions and the four age groupings. The number of available beds is released quarterly by NHS England.3 In order to make maximum use of this information, the average number of beds available in the four quarters of each financial year is used as our measure of size for each Trust. Some Trusts do not report the number of beds for every quarter. In this case, the average of quarters where the number of beds is reported is used as the measure of size. Where Trusts merged within a financial year, beds information is available for the constituent Trusts of the merger for some quarters and the merged Trust for others. In these cases, the sum of beds available in constituent Trusts is taken as the number of beds available in the merged Trust for quarters before the merger. Medical workforce in this context represents doctors, while non-medical workforce includes all other types of staff, e.g. nurses, midwives, ambulance staff, support staff. Summary statistics for the variables used in the regression analyses are set out in Table 4. The number of students per 100 FTE staff is the only regressor which is time invariant. Variation seen in Table 4 in this variable reflects only changes due to mergers. Number of students/workforce is around 2%. A small number of Trusts acquires Foundation Trust status during the study period, the proportion of Trusts with FT status increasing from 0.56 to 0.61. The average Trust contains 671-682 beds, employs 12% of medical staff and has an average survival rate of 98%. Around 9% of patients treated are in their last year of life. Both the rate of day cases and minimising length of stay improve over the three financial years. In 2010/11, the variable ‘size’ is missing for Rotherham NHS Foundation Trust (RFR) and Sheffield Teaching Hospitals NHS Foundation Trust (RHQ). In 2012/13, Isle of Wight NHS Trust (R1F) and Barts Health NHS Trust (R1H) did not report non-medical workforce information; therefore, we were not able to calculate the percentage of medical workforce over total workforce and the ‘Number of Students per 100 FTE’ variables.
3 http://www.england.nhs.uk/statistics/statistical-work-areas/bed-availability-and-occupancy/bed-data-overnight/

12 CHE Research Paper 117
Table 4: Summary statistics explanatory variables, 2010/11 – 2012/13
Variable
2010/11
2011/12
2012/13
N Mean Std. Dev.
N Mean Std. Dev.
N Mean Std. Dev.
Nr of Students (Per 100 FTE)
166 2.07 1.50
164 1.96 1.41
159 1.91 1.38
Foundation Trust Indicator
166 0.56 0.50
164 0.57 0.50
161 0.61 0.49
Size [Number of Beds]
164 670.56 362.89
164 678.09 378.77
161 681.93 374.97
Medical / Workforce [%]
166 12.71 2.23
164 12.41 2.38
159 12.43 2.44
30 Day Survival Rate [%]
166 97.47 0.91
164 98.64 0.47
161 98.59 0.48
Patient in last year of life [%]
166 8.71 4.20
164 8.87 4.15
161 9.00 4.08
Patient aged 0-15 [%]
166 14.47 13.68
164 14.29 13.70
161 14.42 13.87
Patient aged 46-60 [%]
166 16.54 4.45
164 17.02 4.24
161 17.22 4.28
Patient aged over 60 [%]
166 39.69 10.44
164 40.29 10.69
161 40.75 10.67 Day Cases / Elective Spells [%]
166 75.75 10.93
164 77.07 10.30
161 77.85 10.81
Average LoS [Days]
166 2.71 0.57
164 2.65 0.57
161 2.33 0.58
Staff MFF [%]
166 100.51 9.93
164 100.47 9.98
N/A
Overall MFF [%] 166 100.70 6.71
164 100.68 6.75
N/A
Hospital Trusts productivity in the English NHS: uncovering possible drivers of productivity variations 13
4. Results
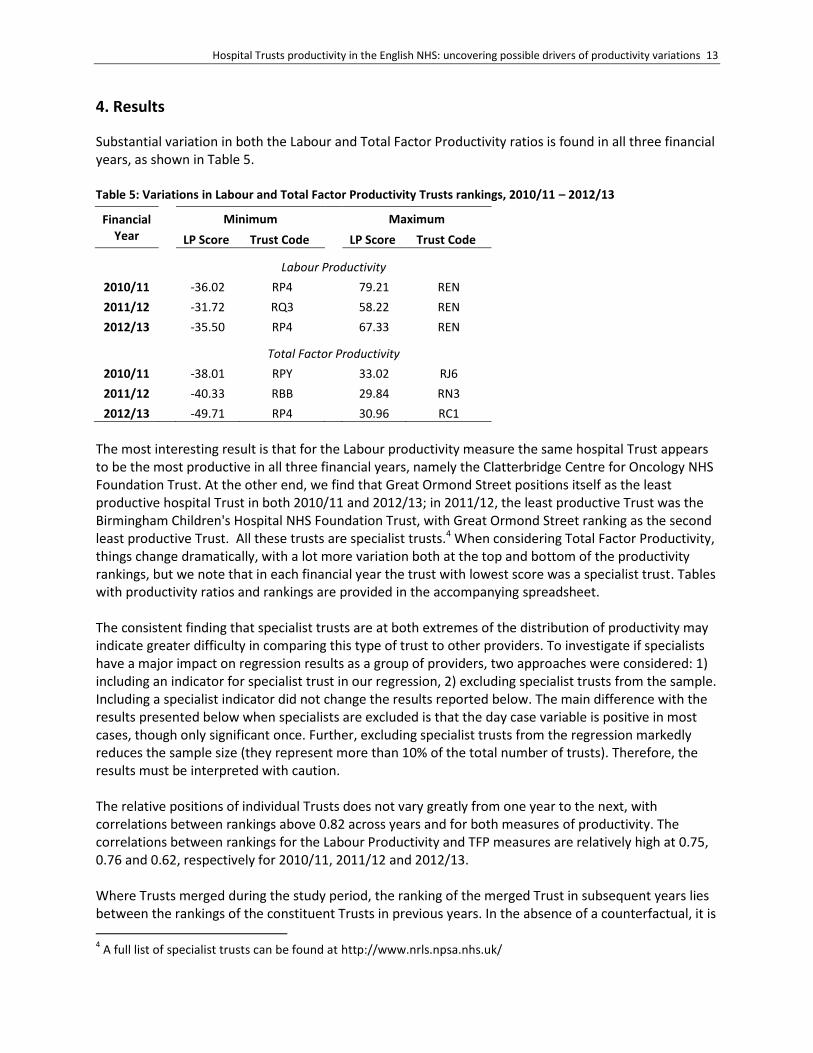
Substantial variation in both the Labour and Total Factor Productivity ratios is found in all three financial years, as shown in Table 5. Table 5: Variations in Labour and Total Factor Productivity Trusts rankings, 2010/11 – 2012/13
Financial Year
Minimum Maximum
LP Score Trust Code
LP Score Trust Code
Labour Productivity
2010/11
-36.02 RP4
79.21 REN
2011/12
-31.72 RQ3
58.22 REN
2012/13
-35.50 RP4
67.33 REN
Total Factor Productivity
2010/11
-38.01 RPY
33.02 RJ6
2011/12
-40.33 RBB
29.84 RN3
2012/13 -49.71 RP4
30.96 RC1
The most interesting result is that for the Labour productivity measure the same hospital Trust appears to be the most productive in all three financial years, namely the Clatterbridge Centre for Oncology NHS Foundation Trust. At the other end, we find that Great Ormond Street positions itself as the least productive hospital Trust in both 2010/11 and 2012/13; in 2011/12, the least productive Trust was the Birmingham Children's Hospital NHS Foundation Trust, with Great Ormond Street ranking as the second least productive Trust. All these trusts are specialist trusts.4 When considering Total Factor Productivity, things change dramatically, with a lot more variation both at the top and bottom of the productivity rankings, but we note that in each financial year the trust with lowest score was a specialist trust. Tables with productivity ratios and rankings are provided in the accompanying spreadsheet. The consistent finding that specialist trusts are at both extremes of the distribution of productivity may indicate greater difficulty in comparing this type of trust to other providers. To investigate if specialists have a major impact on regression results as a group of providers, two approaches were considered: 1) including an indicator for specialist trust in our regression, 2) excluding specialist trusts from the sample. Including a specialist indicator did not change the results reported below. The main difference with the results presented below when specialists are excluded is that the day case variable is positive in most cases, though only significant once. Further, excluding specialist trusts from the regression markedly reduces the sample size (they represent more than 10% of the total number of trusts). Therefore, the results must be interpreted with caution. The relative positions of individual Trusts does not vary greatly from one year to the next, with correlations between rankings above 0.82 across years and for both measures of productivity. The correlations between rankings for the Labour Productivity and TFP measures are relatively high at 0.75, 0.76 and 0.62, respectively for 2010/11, 2011/12 and 2012/13. Where Trusts merged during the study period, the ranking of the merged Trust in subsequent years lies between the rankings of the constituent Trusts in previous years. In the absence of a counterfactual, it is
4 A full list of specialist trusts can be found at http://www.nrls.npsa.nhs.uk/

14 CHE Research Paper 117
not possible to determine from this finding if/and how much the process of merging and change in size impacts on both Labour and Total Factor productivity.
4.1 Variation in hospital Trusts productivity
The results for the Ordinary Least Squares (OLS) models of Labour and Total Factor Productivity are presented in Table 6. Hospital characteristics (H): Foundation Trusts are found to be not statistically significantly different from non-Foundation Trusts when it comes to their Labour Productivity measure, and fair indeed worse than non-Foundation Trusts when the Total Factor Productivity measure is considered in both 2011/12 and 2012/13. A small negative association is found between both Labour and Total Factor Productivity and Trust size, though more strongly significant for the Total Factor Productivity measure. A positive association between Labour Productivity and the proportion of medical workforce is consistent across time but only significant in the last financial year of our analysis, and then only at 10% level. The association becomes negative for the Total Factor Productivity measure. Finally, a negative association (significant only in 2011/12) between both Labour and Total Factor Productivity and the Market Forces Factor is found. This is an indication that higher costs for either labour only or labour and capital (building and land) are indeed reflected in lower productivity as expected. Quality Indicators (Q): Our results show that 30 day post discharge survival rate is associated with lower Total Factor Productivity for the financial years 2010/11 and 2012/13. The coefficient is of similar size for 2011/12, albeit not significant. Patient Characteristics (P): We find a positive association between patients in their last year of life and Labour productivity. This result is in contrast to our expectations, following the ‘Red Herring’ hypothesis, of higher costs being concentrated in end of life care, irrespective of age, and hence resulting in lower productivity. Further, we find that hospital Trusts treating a relatively higher proportion of patients in age groups 0-15 and 46-60 are less productive compared to those treating a higher proportion of patients in the reference group (16-45 years). Efficiency (E): An unexpected result is the consistently negative association between productivity (both Labour and Total Factor) and the proportion of elective activity performed as day cases. This result is, however, only significant in the Labour Productivity model for 2012/13. As expected, Trusts that keep their patients in hospital for longer periods of time have on average lower productivity, whichever measure of productivity is considered, albeit this association is found to be statistically significant only for the Total Factor Productivity measure.

Hospital Trusts productivity in the English NHS: uncovering possible drivers of productivity variations 15
Table 6: OLS Cross-section models of hospital productivity scores, 2010/11 – 2012/13
Labour Productivity
Total Factor Productivity
2010/11 2011/12 2012/13
2010/11 2011/12 2012/13
Nr of Students (per 100 FTE)
0.706
-0.110
0.074
0.205
-0.818
-0.473
(1.003)
(0.826)
(0.761)
(0.793)
(0.733)
(0.841)
Foundation Trust Indicator
1.549
-0.783
-1.133
-2.080
-2.669 * -9.461 ***
(1.949)
(2.077)
(1.752)
(1.689)
(1.594)
(1.717)
Size [number of beds]
-0.008 ** -0.005 * -0.003
-0.009 *** -0.007 *** -0.006 **
(0.003)
(0.003)
(0.003)
(0.002)
(0.002)
(0.003)
Medical / Workforce [%]
0.886
1.024
0.948 *
-0.035
0.009
-1.182 **
(1.292)
(0.781)
(0.502)
(1.005)
(0.602)
(0.513)
MFF [%] (1)
-0.300
-0.341 ** -
-0.195
-0.727 *** -
(0.251)
(0.164)
(0.287)
(0.189)
30-day Survival Rate [%]
0.596
3.571
4.330
-6.587 ** -5.822
-6.938 *
(3.578)
(5.487)
(4.265)
(3.088)
(4.658)
(3.976)
Patients in last year of life [%]
1.091
1.046 ** 1.453 **
-0.494
0.203
0.411
(1.092)
(0.526)
(0.603)
(0.807)
(0.432)
(0.531)
Patients aged 0-15 [%]
-0.646 *** -0.717 *** -0.817 ***
-0.548 *** -0.704 *** -0.888 ***
(0.223)
(0.270)
(0.229)
(0.168)
(0.249)
(0.214)
Patients aged 46-60 [%]
-1.425 * -2.098 ** -2.204 ***
-1.535 *** -2.092 *** -2.693 ***
(0.742)
(0.860)
(0.658)
(0.576)
(0.775)
(0.615)
Patients aged over 60 [%]
-0.023
0.050
-0.115
-0.070
-0.102
-0.166
(0.230)
(0.230)
(0.216)
(0.174)
(0.216)
(0.199)
Day Cases / Elective Spells [%]
-0.247
-0.209
-0.340 **
0.076
-0.014
-0.143
(0.181)
(0.166)
(0.136)
(0.140)
(0.158)
(0.140)
Average LoS [days]
-1.379
1.821
-3.188
-4.968 * -3.548
-7.986 ***
(3.368)
(3.615)
(2.473)
(2.765)
(3.141)
(2.902)
N
162
164
159
162
164
159 R-Squared 0.2696
0.2648
0.3372
0.4327
0.5156
0.5511
All regressions include a constant, not reported in the Table. ***, ** and * indicate 1%, 5% and 10% significance, respectively. (1) Staff MFF in Labour Productivity regressions, and Overall MFF in TFP regressions.
16 CHE Research Paper 117
5. Discussion and conclusions
We find substantial variation in hospital Trusts Labour and Total Factor Productivity in all three financial years considered. Individual hospital Trust’s relative productivity does not vary dramatically from year to year, neither across definition of productivity. Some of the variation in either Labour or Total Factor Productivity might be explained by the characteristics of hospitals, and to this end we estimated OLS regression models. Foundation Trust hospitals appear to be less productive than non-Foundation Trust hospitals, a result which is consistent with the findings by Castelli et al. (2014), for the financial years 2008/09 and 2009/10. The authors also noted that the difference between FTs and non-FTs disappeared if Labour Productivity was considered, concluding that the capacity for FTs to make capital investments may be reflected in lower productivity in the short term and that the additional capital investment had not “yet yielded a proportionate increase in output” (Castelli et al., 2014). The continued presence of a difference between the two measures of productivity considered in our paper may indicate that FT investment in capital has continued in subsequent years and this in part offsets productivity benefits of earlier investments. The negative association found between survival rate and hospital Trusts productivity might be an indication that investing in higher quality of care costs money, in terms of increased use of inputs per patients. This is particularly true for the Total Factor Productivity measure, which may indicate a concentration of investments in higher quality capital and intermediate goods. Surprisingly, treating more patients in their last year of life is associated with higher Labour Productivity. The counter-intuitive result might be due to the fact that the proportion of patients in their last year of life is more closely linked to hospital inpatient activity, rather than the diverse array of healthcare goods and services considered in this analysis. Hospital inpatient activity represents between 49 and 51 % of the total value of all hospital activity in the financial years considered here. So as a sensitivity analysis5, we restricted hospital output to inpatient and outpatient activity only finding a strong and negative association between patients in their last year of life and the hospital Trust productivity measures (both Labour and Total Factor). Further, we found a positive association between the oldest age group (over 60) and higher productivity. The two results combined point to the joint conclusion that the vast majority of higher costs is concentrated in end of life care, irrespective of age, and that older patients, not in their last year of life, incur “relatively speaking” lower healthcare costs, hence the positive association with higher productivity scores. The relation between Trusts’ size and productivity seems to support the idea that diseconomies of scale faced by larger Trusts, due to their more complex organisational structure, dominate the economies of scale enjoyed by these providers of higher throughput and reduced procurement costs. The positive association between the proportion of medical workforce (over total workforce) and Labour productivity may indicate that medical staff is an important component of the skill mix of more productive Trusts.
5 Results available on request.
Hospital Trusts productivity in the English NHS: uncovering possible drivers of productivity variations 17
Further, we are not able to explain why hospitals treating a greater proportion of patients as a day case are less productive. To gain further understanding of this result, we have run a number of sensitivity tests, using alternative definitions of the day case variable, including an activity weighted version, but still obtaining similar results. Finally, in our study we have used only one indicator of hospital care quality, namely survival rate. This is due to the unavailability of robust and (time) consistent indicators (both in terms of processes and outcomes) of quality of hospital activity that is delivered outside the usual hospital inpatient setting. Castelli et al. (2007b) in their national productivity measure of the English NHS use waiting times and survival rates adjusted by life years gained to quality adjust hospital inpatient output. We found that the same measures at the hospital Trust level were introducing too much noise in our productivity estimates and that they were actually indicative of factors outside the Trusts’ direct control, and not necessarily reflecting the quality of hospital care provided. For example, life years gained, measured in terms of life expectancy, at the Trust level are more an indication of the socio-economic characteristics of the patient population served by any hospital Trust than of the quality of hospital care provided. As in Castelli et al. (2014), our analysis of hospital Trust productivity still suggests that there is substantial scope for productivity improvements across the English hospital sector.

18 CHE Research Paper 117
References
Aiken, L. H., Sloane, D. M., Bruyneel, L., Van Den Heede, K., Griffiths, P., Busse, R., Diomidous, M., Kinnunen, J., Kózka, M., Lesaffre, E., Mchugh, M. D., Moreno-Casbas, M. T., Rafferty, A. M., Schwendimann, R., Scott, P. A., Tishelman, C., Van Achterberg, T. & Sermeus, W. 2014. Nurse staffing and education and hospital mortality in nine European countries: a retrospective observational study. The Lancet, 383, 1824-30. Appleby, J., Galea, A. & Murray, R. 2014. The NHS productivity challenge. Experience from the front line. London: The King's Fund. Castelli, A., Dawson, D., Gravelle, H. & Street, A. 2007b. Improving the measurement of health system output growth. Health Economics, 16, 1091-1107. Castelli, A., Laudicella, M., Street, A. & Ward, P. 2011. Getting Out What We Put In: Productivity of the English National Health Service. Health Economics, Policy and Law, 6, 313-35. Castelli, A., Street, A., Verzulli, R. & Ward, P. 2014. Examining variations in hospital productivity in the English NHS. European Journal of Health Economics. Department Of Health 2003. Health and Social Care (Community Care and Standards) Act. In: Health, D. O. (ed.). London. Department Of Health 2010a. Equity and Excellence: Liberating the NHS. In: Health, D. O. (ed.). London. Department Of Health 2010b. The NHS outcomes framework 2011/12. London: Department of Health. Department Of Health 2011. NHS Reference Costs 2010-11 17 November 2011 ed. London: Department of Health. Department Of Health 2012. NHS Reference Costs 2011-12. 8 November 2012 ed. London: Department of Health. Department Of Health 2013. NHS Reference Costs 2012-13. 21 November 2013 ed. London: Department of Health. Keogh, B. 2013. Review into the quality of care and treatment provided by 14 hospital trusts in England: Overview report. Kolstad, J. T. & Kowalski, A. E. 2012. The impact of health care reform on hospital and preventive care: Evidence from Massachusetts. Journal of Public Economics, 96, 909-29. Monitor 2013. A Guide to the Market Forces Factor. NHS England Publications Gateway. Monitor. 2015. Available: http://www.monitor-nhsft.gov.uk/ [Accessed 31/03/2015 2015]. NHS Improving Quality. 2015. NHS Better Care, Better Value Indicators [Online]. Available: http://www.productivity.nhs.uk/Content/Introduction [Accessed 31/03 2015].
Hospital Trusts productivity in the English NHS: uncovering possible drivers of productivity variations 19
Propper, C., Burgess, S. & Green, K. 2004. Does competition between hospitals improve the quality of care?: Hospital death rates and the NHS internal market. Journal of Public Economics, 88 1247-72. Public Accounts Committee 2011. Health landscape review. Oral evidence taken before the Public Accounts Committee, Tuesday 25 January 2011, Una O’Brien and Sir David Nicholson. Public Accounts Committee 2013. Department of Health: progress in making NHS efficiency savings. Thirty-ninth report of session 2012–13. HC 865. London: The Stationery Office Limited. Roberts, A., Marshall, L. & Charlesworth, A. 2012. A decade of austerity? The funding pressures facing the NHS from 2010/11 to 2021/22. London: Nuffield Trust. Street, A., Scheller-Kreinsen, D., Geissler, A. & Busse, R. 2010a. Determinants of hospital costs and performance variation: Methods, models and variables for the EuroDRG project. Working Papers in Health Policy and Management, 3. The Health And Social Care Information Centre 2012/13. Hospital Episode Statistics. In: Centre, T. H. A. S. C. I. (ed.). The Health And Social Care Information Centre 2014. Methodology to create provider and CIP spells from HES APC data. Leeds: Health and Social Care Information Centre. Verzulli, R., Jacobs, R. & Goddard, M. 2011. Do hospitals respond to greater autonomy? : evidence from the English NHS, Centre for Health Economics, research paper 64.
20 CHE Research Paper 117
Appendix
Table A 1: Hospital settings, description of outputs and unit of measurement
Hospital settings Description of outputs Unit Type
A&E Services, incl. Ambulance services
Emergency Department, Minor Injury Units, Walk-in-Centres, Specialised Emergency (non-24 hour) Department
Attendances (leading or not leading to Admitted Patient Care); Call, Patient, Incidence
Chemo/Radiotherapy & High Cost Drugs
Chemotherapy and Radiotherapy sessions, High Cost Drugs
Treatment cycles, Deliveries, Attendances, Fractions, Spells
Community Care District nursing and health visitor services for routine
and specialist services outside hospitals (e.g. patients’ homes, local health centres, etc.), also services provided in local areas in the wider community (including hospital bases if necessary) such as midwifery, podiatry, speech therapy etc.
Contacts, HRG codes, Attendances, Visits, Vaccinations
Community Mental Health
Children and adolescent mental health services, drug and alcohol services, specialist mental health services (e.g. autistic spectrum disorder and eating disorder services) and secure mental health services. From 2011/12 also mental health care clusters for working age adults and older people reporting service user needs over extended periods of time (min 4 wks to 1 year)
Bed Days, Assessments, Cluster Days, Patient days, Contacts, Attendance
Diagnostic Tests Direct Access Diagnostic and Pathology Services
undertaken in admitted patient care, critical care, outpatients or emergency medicine
Tests
Hospital/Patient Transport Scheme
Financial assistance to NHS patients who require assistance in meeting the cost of travel to and from their care
Attendance, divided by Admitted Patient Care, Outpatient and Other
Inpatient Elective, day cases and non-electives (emergency
and maternity admissions) HRG codes
Other NHS activity Audiological Services, Hospital at home (until
2011/12), Day Care Facilities, Regular Day and Night Admissions
Attendances, Aids issued, Screenings, Contacts, Repairing, Patient Days, Admissions,
Outpatient Consultant and Non-Consultant led visits held at
clinics in hospitals, community health centres, general practices or other locations. Outpatient activity with procedures are reported separately
Procedures, Attendance (Face/non Face to Face, Single/multi professional, First attendance/Follow Up), HRG codes
Radiology Diagnostic Imaging Examinations Rehabilitation Rehabilitation Services Bed Days, Attendance Renal Dialysis Renal dialysis, covering both renal and peritoneal Sessions

Hospital Trusts productivity in the English NHS: uncovering possible drivers of productivity variations 21
dialysis Specialist Services Specialist Palliative Care, Cystic Fibrosis, Critical Care
Services, Coronary Care Unit (only in 2010/11), Cancer Multi Disciplinary Teams
Bed Days, Attendances, Patient Journey, Outreach Services, Patients, Treatment Plan