hospitalisations for emergency-sensitive conditions in
TRANSCRIPT

846 Bollmann A, et al. Emerg Med J 2021;38:846–850. doi:10.1136/emermed-2021-211183
Short report
Hospitalisations for emergency- sensitive conditions in Germany during the COVID- 19 pandemic: insights from the German- wide Helios hospital networkAndreas Bollmann ,1 Sven Hohenstein,1 Vincent Pellissier,1 Sebastian König,1 Laura Ueberham,1 Gerhard Hindricks,1 Andreas Meier- Hellmann,2 Ralf Kuhlen,3 on behalf of Helios hospitals, Germany
To cite: Bollmann A, Hohenstein S, Pellissier V, et al. Emerg Med J 2021;38:846–850.
Handling editor Katie Walker
► Additional supplemental material is published online only. To view, please visit the journal online (http:// dx. doi. org/ 10. 1136/ emermed- 2021- 211183).1Heart Center Leipzig at University of Leipzig and Leipzig Heart Institute, Leipzig, Germany2Helios Hospitals, Berlin, Germany3Helios Health, Berlin, Germany
Correspondence toProfessor Andreas Bollmann, Heart Center Leipzig at University of Leipzig and Leipzig Heart Institute, Leipzig 04289, Germany; andreas. bollmann@ helios- gesundheit. de
Received 14 January 2021Accepted 7 September 2021Published Online First 20 September 2021
© Author(s) (or their employer(s)) 2021. No commercial re- use. See rights and permissions. Published by BMJ.
ABSTRACTBackground While there are numerous reports that describe emergency care during the early COVID- 19 pandemic, there is scarcity of data for later stages. This study analyses hospitalisation rates for 37 emergency- sensitive conditions in the largest German- wide hospital network during different pandemic phases.Methods Using claims data of 80 hospitals, consecutive cases between 1 January and 17 November 2020 were analysed and compared with a corresponding period in 2019. Incidence rate ratios (IRRs) comparing the two periods were calculated using Poisson regression to model the number of hospitalisations per day.Results There was a reduction in hospitalisations between 12 March and 13 June 2020 (coinciding with the first pandemic wave) with 32 807 hospitalisations (349.0/day) as opposed to 39 379 (419.0/day) in 2019 (IRR 0.83, 95% CI 0.82 to 0.85, p<0.01). During the following period (14 June–17 November 2020, including the start of second wave), hospitalisations were reduced from 63 799 (406.4/day) in 2019 to 59 910 (381.6/day) in 2020, but this reduction was not as pronounced (IRR 0.94, 95% CI 0.93 to 0.95, p<0.01). During the first wave hospitalisations for acute myocardial infarction, aortic aneurysm/dissection, pneumonitis, paralytic ileus/intestinal obstruction and pulmonary embolism declined but subsequently increased compared with the corresponding periods in 2019. In contrast, hospitalisations for sepsis, pneumonia, obstructive pulmonary disease and intracranial injuries were reduced during the entire observation period.Conclusions There was an overall reduction of absolute hospitalisations for emergency- sensitive conditions in Germany during the first 10 months of the COVID- 19 pandemic with heterogeneous effects on different disease categories. The increase in hospitalisations for acute myocardial infarction, aortic aneurysm/dissection and pulmonary embolism requires attention and further studies.
INTRODUCTIONWhile there are numerous reports that describe emergency calls,1 ED visits2 and hospital admis-sions3–6 for several medical and surgical conditions during the early COVID- 19 pandemic (first wave), there is scarcity of data during later pandemic stages (ie, the second wave, and the period between waves). In addition, a comprehensive overview
covering previously defined emergency- sensitive conditions7 is also missing.
With this study, we wish to complement previous reports by providing and comparing hospitalisation data for patients with emergency- sensitive condi-tions hospitalised in a large German- wide hospital network during different phases of the pandemic.
METHODSStudy cohortWe performed a retrospective analysis of claims data of 80 Helios hospitals in Germany. The Helios hospital group operates metropolitan and regional acute care hospitals ranging from basic to maximum care, outpatient clinics and prevention centres across Germany (https://www. helios- gesund-heit. de/). Patients have free choice of healthcare providers independent of insurance status. Helios hospitals provide inpatient care to about 1.2 million patients annually that corresponds to about 7% of all hospitalisations in Germany.
Key messages
What is already known on this subject ► There has been a reduction in ED visits and hospital admissions for several emergent medical and surgical conditions during the early COVID- 19 pandemic (first wave).
What this study adds ► Using claims data of 80 German- wide Helios hospitals, we found an absolute overall reduction of hospitalisations for emergency- sensitive conditions in Germany during the COVID- 19 pandemic until mid- November 2020 with heterogeneous effects on different disease categories. While hospitalisations for sepsis, pneumonia, obstructive pulmonary disease and intracranial injuries were reduced during the entire observation period, there was an increase in hospitalisations for acute myocardial infarction, aortic aneurysm/dissection, pneumonitis, paralytic ileus/intestinal obstruction and pulmonary embolism after the first wave compared with the corresponding period in 2019.
on Novem
ber 27, 2021 by guest. Protected by copyright.
http://emj.bm
j.com/
Em
erg Med J: first published as 10.1136/em
ermed-2021-211183 on 20 S
eptember 2021. D
ownloaded from
on N
ovember 27, 2021 by guest. P
rotected by copyright.http://em
j.bmj.com
/E
merg M
ed J: first published as 10.1136/emerm
ed-2021-211183 on 20 Septem
ber 2021. Dow
nloaded from
on Novem
ber 27, 2021 by guest. Protected by copyright.
http://emj.bm
j.com/
Em
erg Med J: first published as 10.1136/em
ermed-2021-211183 on 20 S
eptember 2021. D
ownloaded from

847Bollmann A, et al. Emerg Med J 2021;38:846–850. doi:10.1136/emermed-2021-211183
Short report
Consecutive cases with an emergent hospital admission between 1 January and 17 November 2020 (study period) were analysed and compared with a corresponding period covering the same weeks in 2019 (control period). Cause- specific hospi-talisations were defined based on the primary discharge diagnosis according to International Statistical Classification of Diseases and Related Health Problems (German Modification) codes for 37 mortality- related emergency- sensitive conditions according to the Panel on Emergency- Sensitive Conditions (table 1, online supplemental table 1).7 Cases with confirmed COVID- 19 infec-tion (U07.1) were not excluded from this analysis. For a descrip-tion of the German Diagnosis Related Groups system, please see online supplemental file 1.
Due to the retrospective study of anonymised data, informed consent was not obtained. Patients and/or the public were not
involved in the design, conduct, reporting or dissemination of this research.
Data analysisAdministrative data were extracted from QlikView (QlikTech, Radnor, Pennsylvania, USA). Incidence rates for admissions were calculated by dividing the cumulative number of admissions by the number of days in each time period. Incidence rate ratios (IRRs) comparing the study period with the control period were calculated using Poisson regressions to model the number of daily hospitalisations with one model per condition and phase (ie, 37×2 models). Inferential statistics were based on gener-alised linear mixed models (GLMMs) specifying hospitals as a random factor. For all Poisson models, we performed tests for
Table 1 Emergency hospital admissions in the German- wide Helios hospital network during the COVID- 19 pandemic
Deficit period Resumption period
n Daily admissions IRR (95% CI) P value n Daily admissions IRR (95% CI) P value
Total
2019 39 379 418.9 63 799 406.4
2020 32 807 349.0 0.83 (0.82 to 0.85) <0.01 59 910 381.6 0.94 (0.93 to 0.95) <0.01
Sepsis (A41)
2019 2326 24.7 4194 26.7
2020 1228 13.1 0.53 (0.49 to 0.57) <0.01 2263 14.4 0.54 (0.51 to 0.57) <0.01
Volume depletion (E86)
2019 1630 17.3 3180 20.2
2020 1264 13.4 0.78 (0.72 to 0.83) <0.01 2985 19.0 0.94 (0.89 to 0.99) 0.01
Delirium, not induced by alcohol and other psychoactive substances (F05)
2019 391 4.2 687 4.4
2020 286 3.0 0.73 (0.63 to 0.85) <0.01 570 3.6 0.83 (0.74 to 0.93) <0.01
Acute myocardial infarction (I21) and other acute ischaemic heart disease (I24)*
2019 2690 28.6 4273 27.2
2020 2534 27.0 0.94 (0.89 to 0.99) 0.03 4568 29.1 1.07 (1.03 to 1.11) <0.01
Pneumonia (J18)
2019 2876 30.6 3743 23.8
2020 2141 22.8 0.74 (0.70 to 0.79) <0.01 3194 20.3 0.85 (0.81 to 0.89) <0.01
Other chronic obstructive pulmonary disease (J44)
2019 2945 31.3 4129 26.3
2020 1901 20.2 0.65 (0.61 to 0.68) <0.01 3235 20.6 0.78 (0.75 to 0.82) <0.01
Pneumonitis due to solids and liquids (J69)
2019 406 4.3 660 4.2
2020 351 3.7 0.86 (0.75 to 0.99) 0.04 745 4.8 1.13 (1.02 to 1.25) 0.02
Paralytic ileus and intestinal obstruction without hernia (K56)
2019 1165 12.4 1894 12.1
2020 1041 11.1 0.89 (0.82 to 0.97) <0.01 2035 13.0 1.07 (1.01 to 1.14) 0.02
Cellulitis (L03)
2019 659 7.0 1236 7.9
2020 510 5.4 0.77 (0.69 to 0.87) <0.01 1123 7.2 0.91 (0.84 to 0.98) 0.02
Acute renal failure (N17)
2019 1192 12.7 1886 12.0
2020 943 10.0 0.79 (0.73 to 0.86) <0.01 1749 11.1 0.93 (0.87 to 0.99) 0.02
Intracranial injury (S06)
2019 3439 36.6 5959 38.0
2020 2739 29.1 0.80 (0.76 to 0.84) <0.01 5066 32.3 0.85 (0.82 to 0.88) <0.01
ICD- 10 codes for the emergency- sensitive conditions are provided in parentheses.7 Shown are conditions with significant changes in both periods while the remaining diseases are summarised in online supplemental table S1.*According to the Panel on Emergency- Sensitive Conditions,7 disease categories are based on primary diagnosis. We have summarised acute myocardial infarction (I21) and other acute ischaemic heart disease (I24) as well as cerebral infarction (I63) and unspecified stroke (I64) since case volume for I24 and I64 was <10.ICD- 10, International Statistical Classification of Diseases and Related Health Problems; IRR, incidence rate ratio.
on Novem
ber 27, 2021 by guest. Protected by copyright.
http://emj.bm
j.com/
Em
erg Med J: first published as 10.1136/em
ermed-2021-211183 on 20 S
eptember 2021. D
ownloaded from

848 Bollmann A, et al. Emerg Med J 2021;38:846–850. doi:10.1136/emermed-2021-211183
Short report
overdispersion by calculating the sum of squared Pearson resid-uals and comparing it with the residual df.
We report IRR together with 95% CIs for the comparisons of the two periods and p values for the interactions. For the calcu-lation of ORs, we used logistic GLMMs with logit link function. For all tests, we used R (V.3.6.1) and applied a two- tailed 5% error criterion for significance.
RESULTSDuring the 2020 study period (deficit and resumption phase combined), there was a total of 453 082 emergent inpatient hospitalisations (1407.1/day) and 17 813 ambulatory ED visits (55.3/day), significantly less than 484 368 (1504.2/day; IRR 0.94, 95 % CI 0.93 to 0.94, p<0.01) and 31 306 (97.2/day, IRR 0.57, 95% CI 0.56 to 0.58, p<0.01), respectively, seen in 2019. This decrease was also evident when comparing 2020 cases with years prior to 2019 (online supplemental table 2). Median case volume per hospital decreased from 4718 (IQR 1835–9107) to 4040 (1678–8115) for inpatient hospitalisations and from 183 (78–282) to 136 (70–239) for ambulatory ED visits.
Hospital inpatient admissions for emergency- sensitive condi-tions, cases with SARS- CoV- 2 infections at Helios hospitals and daily new SARS- CoV- 2 infections in Germany are depicted in figure 1 and per hospital in online supplemental figure 1. There was a reduction in hospitalisations between 12 March and 13 June 2020 coinciding with the first pandemic wave. During this
period, there were 32 807 hospitalisations (349.0/day) including 286 PCR- confirmed COVID- 19 cases compared with 39 379 (418.9/day) in 2019 (IRR 0.83, 95% CI 0.82 to 0.85, p<0.01). During the observational period 14 June–17 November 2020 which included the start of the second infection wave, emergency- sensitive hospitalisations were reduced from 63 799 (406.4/day) in 2019 to 59 910 (381.6/day) in 2020 including 436 COVID- 19 cases, (IRR 0.94, 95% CI 0.93 to 0.95, p<0.01) but this reduction was not as pronounced as during the first infection wave.
Hospitalisations for the individual emergency- sensitive condi-tions stratified for both periods show a heterogeneous pattern (table 1 and online supplemental table 1). Hospitalisations for sepsis, pneumonia, obstructive pulmonary disease and intra-cranial injuries as primary diagnoses were reduced during the entire pandemic, even including COVID- 19 cases. Similarly, when expanding the definition of pneumonia (J18) to include all severe acute respiratory infections (J09–J22, excluding hospital- acquired infections U69.0), IRR was 0.76 (95% CI 0.74 to 0.78, p<0.01) in the first wave and 0.97 (95% CI 0.94 to 0.99, p<0.01) in the June–November period. In contrast, there was an increase in hospitalisations for acute myocardial infarction (IRR 1.07, 95% CI 1.03 to 1.11, p<0.01), aortic aneurysm and dissec-tion (IRR 1.21, 95% CI 1.02 to 1.44, p=0.03), pneumonitis (IRR 1.13, 95% CI 1.02 to 1.25, p=0.02), paralytic ileus/intes-tinal obstruction (IRR 1.07, 95% CI 1.01 to 1.14, p=0.02) and
Figure 1 Total weekly hospital admissions for emergency- sensitive conditions (upper panel), weekly hospitalisations of cases with SARS- CoV- 2 infections at Helios hospitals (middle panel) and weekly new SARS- CoV- 2 infections in Germany (lower panel). Smooth curves for weekly admission rates were fitted via Locally Weighted Scatterplot Smoothing with a degree of smoothing of α=0.25. Grey areas represent 95% CIs. A 2020 deficit period starting at the first the day with non- overlapping 95% CIs and ending at the last day with non- overlapping intervals was defined. The first day at which the intervals are overlapping again was defined as the start of the resumption period (dotted vertical lines).
on Novem
ber 27, 2021 by guest. Protected by copyright.
http://emj.bm
j.com/
Em
erg Med J: first published as 10.1136/em
ermed-2021-211183 on 20 S
eptember 2021. D
ownloaded from

849Bollmann A, et al. Emerg Med J 2021;38:846–850. doi:10.1136/emermed-2021-211183
Short report
pulmonary embolism (IRR 1.14, 95% CI 1.06 to 1.23, p<0.01) after the first infection wave compared with the corresponding period in 2019.
Tests for the Poisson models showed that overdispersion was not present in the analyses.
In- hospital mortality was affected in several conditions (table 2), but remained unchanged in the majority (online supplemental table 2).
DISCUSSIONThis study was performed in the largest German- wide hospital network by analysing emergency admissions in general and for emergency- sensitive conditions from claims data. This compre-hensive list7 has been suggested for the assessment of the acute care system but modifications (eg, expansion of definitions for unspecific pneumonia, J18) may be warranted.8
We found an initial reduction in several emergency- sensitive conditions including myocardial infarction, heart failure, diabetes mellitus and pancreatitis that corresponded with the initiation of national public health emergency measures, and this decline persisted for several weeks. These findings are in agree-ment with previous studies.2–6 The reasons for this are unclear. On the one hand, there may be a true reduction in the inci-dence of emergencies as a result of lower physical or psycho-logical stress, improved medication adherence, diminished air pollution, traffic, and infectious disease transmission, or better outpatient care delivery models. In fact, the consistently lower rates of exacerbation of respiratory conditions or trau-matic intracranial injuries support this hypothesis. On the other hand, it is possible that patients were reluctant to seek medical
attention due to fear of contagion at the hospital. In addition, the emphasis on social distancing might have inappropriately persuaded patients to avoid in- person medical care. While this reduction was pronounced during the first wave and affected multiple conditions, hospitalisations for the majority of those resumed to previous year levels during later pandemic phases.
Of special concern is the increased incidence of hospital-isations for acute myocardial infarction, aortic aneurysm and dissection as well as pulmonary embolism after the first infection wave compared with the corresponding period in 2019. While the former may be a result of reduced cardiovascular care during the early pandemic,5 6 the latter could also be associated with preceding COVID- 19 infections.9 If the increased incidence of hospitalisations for acute myocardial infarction, aortic dissection and pulmonary embolism is a signal for a rising incidence of those conditions in the population, this could at least in part explain the observed excess mortality in Germany between late July and mid- October 2020.10 Those signals require attention and further studies.
In the majority of conditions, in- hospital mortality remained unchanged during the study period, but in several, such as sepsis, pneumonia and heart failure, mortality increased. While the former may at least in part be attributed to preceding or unde-tected SARS- CoV- 2 infections, the latter has been shown to asso-ciate with increased case severity.11
There are several limitations to this study. Health insur-ance claims data are created for administrative, financial and reimbursement purposes but not research. Nevertheless, it is frequently used for answering questions about healthcare util-isation and healthcare surveillance. Due to hospital acquisitions
Table 2 In- hospital mortality for emergency- sensitive conditions
Year
Deficit period Resumption period
Proportion (n) OR (95% CI) P value Proportion (n) OR (95% CI) P value
Sepsis
2019 10.5% (229) 10.1% (392)
2020 26.3% (303) 3.05 (2.52 to 3.68) <0.01 24.5% (505) 2.90 (2.51 to 3.36) <0.01
Other disorders of fluid, electrolyte and acid–base balance
2019 4.7% (18) 5.1% (44)
2020 3.8% (13) 0.80 (0.38 to 1.65) 0.55 3.0% (26) 0.57 (0.34 to 0.93) 0.03
Heart failure
2019 5.6% (330) 5.2% (447)
2020 6.9% (344) 1.26 (1.08 to 1.47) <0.01 5.7% (496) 1.11 (0.97 to 1.27) 0.11
Pneumonia
2019 6.7% (183) 6.4% (228)
2020 9.2% (186) 1.42 (1.15 to 1.75) <0.01 6.1% (185) 0.96 (0.78 to 1.17) 0.67
Other chronic obstructive pulmonary disease
2019 3.1% (86) 3.1% (121)
2020 4.5% (81) 1.48 (1.09 to 2.02) 0.01 3.3% (101) 1.06 (0.81 to 1.39) 0.66
Respiratory failure, not elsewhere classified
2019 28.8% (49) 29.5% (75)
2020 44.2% (53) 1.95 (1.20 to 3.20) <0.01 35.4% (97) 1.31 (0.91 to 1.89) 0.15
Vascular disorders of intestine
2019 20.7% (57) 22.2% (93)
2020 21.7% (60) 1.06 (0.71 to 1.60) 0.77 16.2% (73) 0.68 (0.48 to 0.95) 0.02
Other diseases of digestive system
2019 5.1% (27) 6.3% (56)
2020 8.6% (38) 1.75 (1.06 to 2.95) 0.03 6.8% (56) 1.09 (0.74 to 1.60) 0.67
Shown are conditions with significant changes in at least one period while the remaining diseases are summarised in online supplemental table S2.Based on 183 803 cases (93.8%). We excluded cases with discharge due to hospital transfer or unspecified reason. Proportion of excluded cases was stable ranging between 5.9% and 6.5% per year and period.
on Novem
ber 27, 2021 by guest. Protected by copyright.
http://emj.bm
j.com/
Em
erg Med J: first published as 10.1136/em
ermed-2021-211183 on 20 S
eptember 2021. D
ownloaded from

850 Bollmann A, et al. Emerg Med J 2021;38:846–850. doi:10.1136/emermed-2021-211183
Short report
and changes in infrastructures, the composition of the hospital network is constantly evolving. As a result, a limited number of hospitals or wards might exhibit null count for some period and hence slightly bias some estimators. However, our estimations are based using GLMM with the hospital as a random factor. Thanks to this approach, the impact on the estimated effects is reduced because of shrinkage to the population mean, meaning that the most extreme patterns have the least impact. While this study focused on previously defined emergency- sensitive conditions,7 other diseases and emergency care pathways were not studied in detail which could offer additional insights. In addition, our study ended in November 2020, and we do not know whether subsequent surges had similar effects. Finally, the observed changes of in- hospital mortality are of interest but a detailed analysis of this observation is beyond the scope of the present study.
In summary, there was an absolute overall reduction of emer-gent hospitalisations and ED visits in Germany during the first 10 months of the COVID- 19 pandemic with heterogeneous effects on different disease categories. The increase in hospital-isations for acute myocardial infarction, aortic aneurysm/dissec-tion, pneumonitis, paralytic ileus/intestinal obstruction and pulmonary embolism after the first infection wave compared with the corresponding period in 2019 requires attention and further studies.
Twitter Andreas Bollmann @ABollmannMD
Contributors The authors confirm contribution to the paper as follows: study conception and design—AB and RK; data collection—AM- H and RK; data analysis—SH and VP; draft manuscript preparation—AB. All authors reviewed the results, made critical revisions and approved the final version of the manuscript.
Funding The authors have not declared a specific grant for this research from any funding agency in the public, commercial or not- for- profit sectors.
Competing interests None declared.
Patient consent for publication Not applicable.
Ethics approval This study was approved by the Ethics Committee at the Medical Faculty, Leipzig University (#490/20- ek).
Provenance and peer review Not commissioned; externally peer reviewed.
Data availability statement Data are available upon reasonable request.
Supplemental material This content has been supplied by the author(s). It has not been vetted by BMJ Publishing Group Limited (BMJ) and may not have
been peer- reviewed. Any opinions or recommendations discussed are solely those of the author(s) and are not endorsed by BMJ. BMJ disclaims all liability and responsibility arising from any reliance placed on the content. Where the content includes any translated material, BMJ does not warrant the accuracy and reliability of the translations (including but not limited to local regulations, clinical guidelines, terminology, drug names and drug dosages), and is not responsible for any error and/or omissions arising from translation and adaptation or otherwise.
This article is made freely available for use in accordance with BMJ’s website terms and conditions for the duration of the covid- 19 pandemic or until otherwise determined by BMJ. You may use, download and print the article for any lawful, non- commercial purpose (including text and data mining) provided that all copyright notices and trade marks are retained.
ORCID iDAndreas Bollmann http:// orcid. org/ 0000- 0002- 5441- 3906
REFERENCES 1 Valent F, Licata S. Emergency medical services calls during Italy’s COVID- 19 Lockdown.
Ann Emerg Med 2020;76:812–4. 2 Westgard BC, Morgan MW, Vazquez- Benitez G, et al. An analysis of changes in
emergency department visits after a state Declaration during the time of COVID- 19. Ann Emerg Med 2020;76:595–601.
3 Anderson TS, Stevens JP, Pinheiro A, et al. Hospitalizations for emergent medical, surgical, and obstetric conditions in Boston during the COVID- 19 pandemic. J Gen Intern Med 2020;35:3129–32.
4 Baum A, Schwartz MD. Admissions to Veterans Affairs hospitals for emergency conditions during the COVID- 19 pandemic. JAMA 2020;324:96–9.
5 Bollmann A, Hohenstein S, Meier- Hellmann A, et al. Emergency hospital admissions and interventional treatments for heart failure and cardiac arrhythmias in Germany during the Covid- 19 outbreak: insights from the German- wide Helios Hospital network. Eur Heart J Qual Care Clin Outcomes 2020;6:221–2.
6 Bollmann A, Pellissier V, Hohenstein S, et al. Cumulative hospitalization deficit for cardiovascular disorders in Germany during the Covid- 19 pandemic. Eur Heart J Qual Care Clin Outcomes 2020;28:qcaa071.
7 Berthelot S, Lang ES, Quan H, et al. Panel on Emergency- Sensitive conditions (PESC). identifying emergency- sensitive conditions for the calculation of an emergency care inhospital standardized mortality ratio. Ann Emerg Med 2014;63:418–24.
8 Vashi AA, Urech T, Carr B, et al. Identification of emergency care- sensitive conditions and characteristics of emergency department utilization. JAMA Netw Open 2019;2:e198642.
9 Vlachou M, Drebes A, Candilio L, et al. Pulmonary thrombosis in Covid- 19: before, during and after hospital admission. J Thromb Thrombolysis 2021;51:978–84.
10 König S, Hohenstein S, Ueberham L, et al. Regional and temporal disparities of excess all- cause mortality for Germany in 2020: is there more than just COVID- 19? J Infect 2021;82:186–230.
11 König S, Hohenstein S, Meier- Hellmann A, et al. In- hospital care in acute heart failure during the COVID- 19 pandemic: insights from the German- wide Helios Hospital network. Eur J Heart Fail 2020;22:2190–201.
on Novem
ber 27, 2021 by guest. Protected by copyright.
http://emj.bm
j.com/
Em
erg Med J: first published as 10.1136/em
ermed-2021-211183 on 20 S
eptember 2021. D
ownloaded from

SUPPLEMENT
Hospitalizations for emergency-sensitive conditions in Germany
during the Covid-19 pandemic
Insights from the German-wide Helios hospital network
Andreas Bollmann,1 Sven Hohenstein,1 Vincent Pellissier,1
Sebastian König,1 Laura Ueberham,1 Gerhard Hindricks,1
Andreas Meier-Hellmann,2 Ralf Kuhlen 3
on behalf of Helios hospitals, Germany
1 Heart Center Leipzig at University of Leipzig and Leipzig Heart Institute, Leipzig Germany
2 Helios Kliniken, Berlin, Germany
3 Helios Health, Berlin, Germany
Corresponding author: Andreas Bollmann, MD, PhD Heart Center Leipzig at University of Leipzig Strümpellstr. 39 04289 Leipzig Germany Phone: ++49 341 865 1410 Fax: ++49 341 865 1460 Email: [email protected]
BMJ Publishing Group Limited (BMJ) disclaims all liability and responsibility arising from any relianceSupplemental material placed on this supplemental material which has been supplied by the author(s) Emerg Med J
doi: 10.1136/emermed-2021-211183–5.:10 2021;Emerg Med J, et al. Bollmann A

Index
German Diagnosis Related Groups
Table S1. Emergency hospital admissions in the German-wide Helios hospital network during
the Covid-19 pandemic.
Table S2. Hospitalizations in emergent bed-based, emergent bed-based for emergency-
sensitive conditions and ambulatory care between 2016 and 2020.
Table S3. In-hospital mortality for emergency-sensitive conditions.
Figure S1. Hospitalizations per hospital in 2019 and 2020.
BMJ Publishing Group Limited (BMJ) disclaims all liability and responsibility arising from any relianceSupplemental material placed on this supplemental material which has been supplied by the author(s) Emerg Med J
doi: 10.1136/emermed-2021-211183–5.:10 2021;Emerg Med J, et al. Bollmann A

German Diagnosis Related Groups
The German Diagnosis Related Groups (G‐DRG) system is used for hospital reimbursement in
Germany since 2004 and is subject to encoded diagnoses (International Statistical Classification
of Diseases, German Modification; ICD-10 GM) and procedures (German procedure
classification; OPS). This obligatory documentation and accounting system is specified and
regulated in detail by mandatory coding instructions and requires the coding of a main diagnosis
for all in-hospital cases reflecting the underlying cause for hospital admission. Up to 15% of
the codes are controlled – and corrected if required – by specialized physicians (“Medizinischer
Dienst der Krankenversicherung”) independently from health insurances and hospitals.
Administrative data for this study were extracted from QlikView (QlikTech, Radnor,
Pennsylvania, USA).
BMJ Publishing Group Limited (BMJ) disclaims all liability and responsibility arising from any relianceSupplemental material placed on this supplemental material which has been supplied by the author(s) Emerg Med J
doi: 10.1136/emermed-2021-211183–5.:10 2021;Emerg Med J, et al. Bollmann A

Table S1. Emergency hospital admissions in the German-wide Helios hospital network during
the Covid-19 pandemic. ICD-10 codes for the emergency-sensitive conditions are provided in
parenthesis.7
Deficit period Resumption period
n Daily admissions
IRR (95% CI) P value n Daily
admissions IRR
(95% CI) P value
Diabetes mellitus type 2 (E11)
2019 1,291 13.7 2,147 13.7
2020 1,102 11.7 0.85 (0.79−0.92) < 0.01 2,057 13.1 0.96
(0.90−1.02) 0.16
Other disorders of fluid, electrolyte and acid-base balance (E87)
2019 412 4.4 920 5.9
2020 357 3.8 0.87 (0.75−1.00) 0.04 919 5.8 1.00
(0.91−1.09) 0.98
Other disorders of brain (G93)
2019 59 0.6 121 0.8
2020 49 0.5 0.83 (0.57−1.21) 0.34 122 0.8 1.01
(0.78−1.30) 0.95
Pulmonary embolism (I26)
2019 660 7.0 1,215 7.7
2020 660 7.0 1.00 (0.90−1.11) 1.00 1,386 8.8 1.14
(1.06−1.23) < 0.01
Cardiac arrest (I46)
2019 143 1.5 238 1.5
2020 138 1.5 0.97 (0.76−1.22) 0.77 233 1.5 0.98
(0.82−1.17) 0.81
Heart failure (I50)
2019 6,152 65.4 9,054 57.7
2020 5,187 55.2 0.84 (0.81−0.87) < 0.01 9,101 58.0 1.01
(0.98−1.03) 0.73
Subarachnoid haemorrhage (I60)
BMJ Publishing Group Limited (BMJ) disclaims all liability and responsibility arising from any relianceSupplemental material placed on this supplemental material which has been supplied by the author(s) Emerg Med J
doi: 10.1136/emermed-2021-211183–5.:10 2021;Emerg Med J, et al. Bollmann A

2019 67 0.7 110 0.7
2020 62 0.7 0.93 (0.66−1.31) 0.66 112 0.7 1.02
(0.78−1.32) 0.89
Intracerebral haemorrhage (I61)
2019 320 3.4 546 3.5
2020 331 3.5 1.03 (0.89−1.21) 0.67 498 3.2 0.91
(0.81−1.03) 0.13
Other non traumatic intracranial haemorrhage (I62)
2019 57 0.6 102 0.6
2020 43 0.5 0.75 (0.51−1.12) 0.16 102 0.6 1.00
(0.76−1.32) 1.00
Cerebral infarction (I63) and unspecified stroke (I64)*
2019 3,018 32.1 4,960 31.6
2020 2,824 30.0 0.94 (0.89−0.98) 0.01 5,035 32.1 1.02
(0.98−1.06) 0.45
Aortic aneurism and dissection (I71)
2019 131 1.4 224 1.4
2020 138 1.5 1.05 (0.83−1.34) 0.67 271 1.7 1.21
(1.02−1.44) 0.03
Adult respiratory distress syndrome (J80)
2019 11 0.1 16 0.1
2020 34 0.4 3.09 (1.57−6.09) < 0.01 25 0.2 1.56
(0.84−2.92) 0.16
Respiratory failure, not elsewhere classified (J96)
2019 184 2.0 277 1.8
2020 131 1.4 0.71 (0.57−0.88) < 0.01 305 1.9 1.10
(0.94−1.29) 0.23
Duodenal ulcer (K26)
2019 329 3.5 577 3.7
2020 306 3.3 0.93 (0.80−1.08) 0.35 598 3.8 1.04
(0.93−1.16) 0.53
BMJ Publishing Group Limited (BMJ) disclaims all liability and responsibility arising from any relianceSupplemental material placed on this supplemental material which has been supplied by the author(s) Emerg Med J
doi: 10.1136/emermed-2021-211183–5.:10 2021;Emerg Med J, et al. Bollmann A

Vascular disorders of intestine (K55)
2019 288 3.1 440 2.8
2020 287 3.0 1.00 (0.85−1.17) 0.97 471 3.0 1.07
(0.94−1.22) 0.30
Diverticular disease of intestine (K57)
2019 1,225 13.0 2,190 14.0
2020 1,101 11.7 0.90 (0.83−0.97) < 0.01 2,166 13.8 0.99
(0.93−1.05) 0.71
Peritonitis (K65)
2019 122 1.3 220 1.4
2020 122 1.3 1.00 (0.78−1.29) 1.00 233 1.5 1.06
(0.89−1.27) 0.53
Hepatic failure (K72)
2019 75 0.8 103 0.7
2020 50 0.5 0.67 (0.47−0.95) 0.03 95 0.6 0.92
(0.70−1.22) 0.57
Acute pancreatitis (K85)
2019 745 7.9 1,221 7.8
2020 651 6.9 0.87 (0.79−0.97) 0.01 1,195 7.6 0.98
(0.90−1.06) 0.59
Other diseases of digestive system (K92)
2019 548 5.8 916 5.8
2020 467 5.0 0.85 (0.75−0.96) < 0.01 865 5.5 0.94
(0.86−1.04) 0.22
Shock, not elsewhere classified (R57)
2019 54 0.6 101 0.6
2020 61 0.7 1.13 (0.78−1.63) 0.51 122 0.8 1.21
(0.93−1.57) 0.16
Fracture of lumbar spine and pelvis (S32)
2019 1,065 11.3 1,796 11.4
BMJ Publishing Group Limited (BMJ) disclaims all liability and responsibility arising from any relianceSupplemental material placed on this supplemental material which has been supplied by the author(s) Emerg Med J
doi: 10.1136/emermed-2021-211183–5.:10 2021;Emerg Med J, et al. Bollmann A

2020 1,013 10.8 0.95 (0.87−1.04) 0.25 1,711 10.9 0.95
(0.89−1.02) 0.15
Fracture of femur (S72)
2019 2,322 24.7 3,787 24.1
2020 2,398 25.5 1.03 (0.98−1.09) 0.27 4,097 26.1 1.08
(1.04−1.13) < 0.01
Complications of cardiac and vascular prosthetic devices, implants and grafts (T82)
2019 382 4.1 677 4.3
2020 357 3.8 0.93 (0.81−1.08) 0.35 658 4.2 0.97
(0.87−1.08) 0.60
BMJ Publishing Group Limited (BMJ) disclaims all liability and responsibility arising from any relianceSupplemental material placed on this supplemental material which has been supplied by the author(s) Emerg Med J
doi: 10.1136/emermed-2021-211183–5.:10 2021;Emerg Med J, et al. Bollmann A
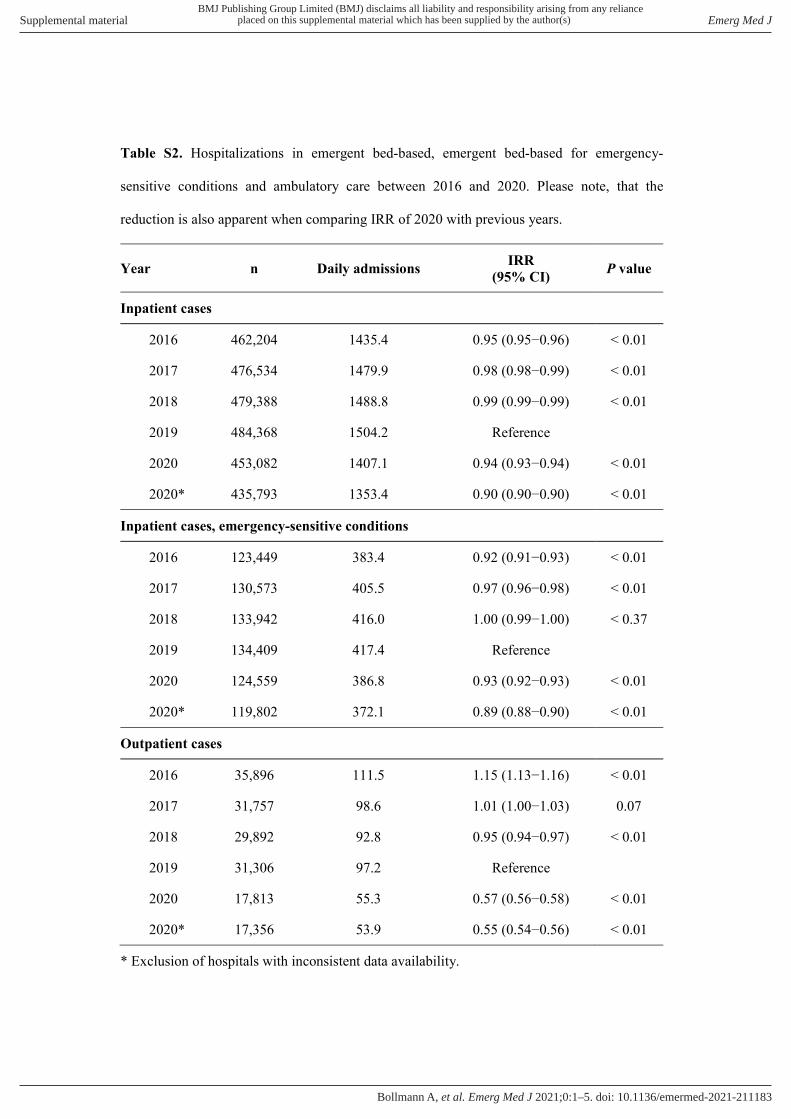
Table S2. Hospitalizations in emergent bed-based, emergent bed-based for emergency-
sensitive conditions and ambulatory care between 2016 and 2020. Please note, that the
reduction is also apparent when comparing IRR of 2020 with previous years.
Year n Daily admissions IRR (95% CI) P value
Inpatient cases
2016 462,204 1435.4 0.95 (0.95−0.96) < 0.01
2017 476,534 1479.9 0.98 (0.98−0.99) < 0.01
2018 479,388 1488.8 0.99 (0.99−0.99) < 0.01
2019 484,368 1504.2 Reference
2020 453,082 1407.1 0.94 (0.93−0.94) < 0.01
2020* 435,793 1353.4 0.90 (0.90−0.90) < 0.01
Inpatient cases, emergency-sensitive conditions
2016 123,449 383.4 0.92 (0.91−0.93) < 0.01
2017 130,573 405.5 0.97 (0.96−0.98) < 0.01
2018 133,942 416.0 1.00 (0.99−1.00) < 0.37
2019 134,409 417.4 Reference
2020 124,559 386.8 0.93 (0.92−0.93) < 0.01
2020* 119,802 372.1 0.89 (0.88−0.90) < 0.01
Outpatient cases
2016 35,896 111.5 1.15 (1.13−1.16) < 0.01
2017 31,757 98.6 1.01 (1.00−1.03) 0.07
2018 29,892 92.8 0.95 (0.94−0.97) < 0.01
2019 31,306 97.2 Reference
2020 17,813 55.3 0.57 (0.56−0.58) < 0.01
2020* 17,356 53.9 0.55 (0.54−0.56) < 0.01
* Exclusion of hospitals with inconsistent data availability.
BMJ Publishing Group Limited (BMJ) disclaims all liability and responsibility arising from any relianceSupplemental material placed on this supplemental material which has been supplied by the author(s) Emerg Med J
doi: 10.1136/emermed-2021-211183–5.:10 2021;Emerg Med J, et al. Bollmann A

Table S3. In-hospital mortality for emergency-sensitive conditions.
Deficit period Resumption period
Year Proportion (n) Odds ratio (95% CI) P value Proportion (n) Odds ratio (95% CI) P value
Diabetes Mellitus type 2
2019 2.9% (36) 2.4% (50)
2020 3.9% (41) 1.33 (0.85− 2.11) 0.21 2.6% (52) 1.08 (0.73− 1.60) 0.70
Volume depletion
2019 4.3% (67) 3.6% (111)
2020 5.1% (62) 1.21 (0.85− 1.73) 0.29 3.0% (85) 0.82 (0.61− 1.09) 0.16
Delirium, not induced by alcohol and other psychoactive substances
2019 4.8% (16) 4.0% (23)
2020 5.0% (12) 1.04 (0.47− 2.23) 0.92 4.0% (19) 0.98 (0.52− 1.83) 0.96
Other disorders of brain
2019 18.2% (10) 8.8% (10)
2020 6.7% (3) 0.32 (0.07− 1.13) 0.10 16.1% (18) 1.99 (0.89− 4.69) 0.10
Acute Myocardial Infarction (AMI) or Other acute ischemic heart disease
2019 6.4% (158) 5.5% (216)
2020 7.1% (165) 1.10 (0.88− 1.38) 0.40 6.2% (261) 1.13 (0.94− 1.36) 0.19
Pulmonary embolism
2019 10.5% (67) 10.8% (126)
2020 8.7% (55) 0.81 (0.55− 1.17) 0.27 8.8% (117) 0.80 (0.61− 1.04) 0.10
Cardiac arrest
2019 96.3% (129) 94.4% (219)
2020 92.7% (127) 0.49 (0.15− 1.43) 0.21 91.2% (206) 0.61 (0.29− 1.25) 0.18
Subarachnoid haemorrhage
2019 28.8% (15) 23.3% (20)
BMJ Publishing Group Limited (BMJ) disclaims all liability and responsibility arising from any relianceSupplemental material placed on this supplemental material which has been supplied by the author(s) Emerg Med J
doi: 10.1136/emermed-2021-211183–5.:10 2021;Emerg Med J, et al. Bollmann A
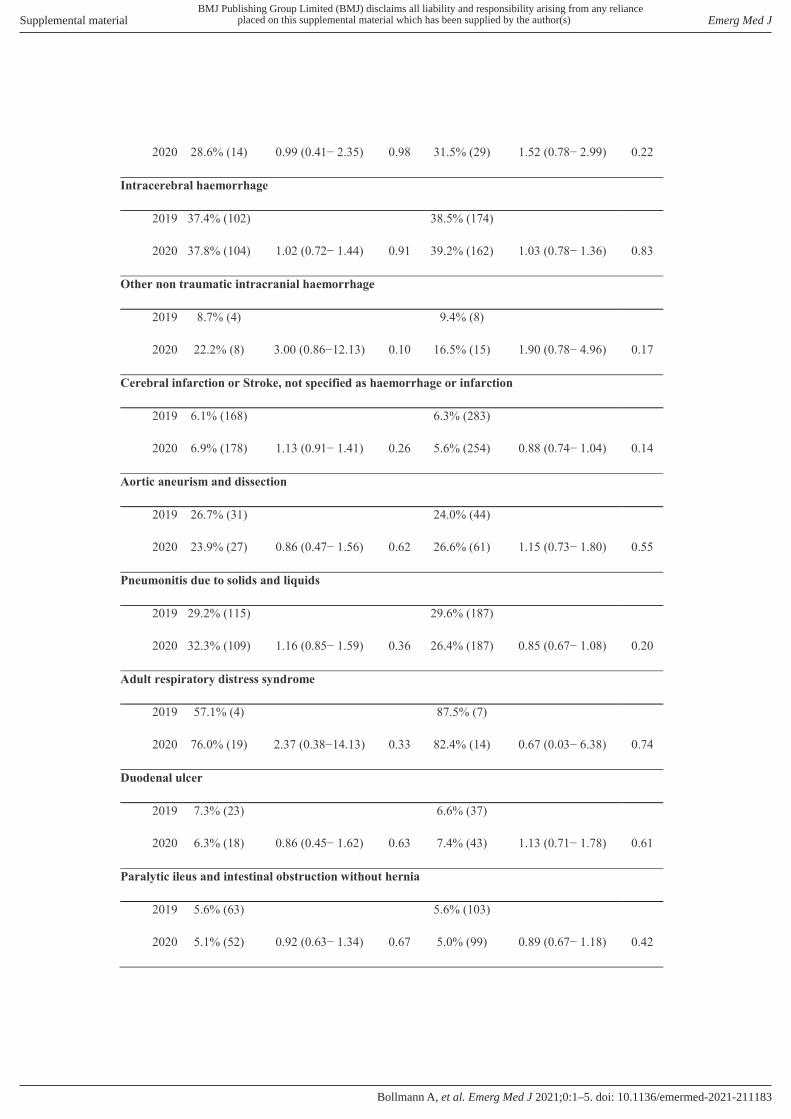
2020 28.6% (14) 0.99 (0.41− 2.35) 0.98 31.5% (29) 1.52 (0.78− 2.99) 0.22
Intracerebral haemorrhage
2019 37.4% (102) 38.5% (174)
2020 37.8% (104) 1.02 (0.72− 1.44) 0.91 39.2% (162) 1.03 (0.78− 1.36) 0.83
Other non traumatic intracranial haemorrhage
2019 8.7% (4) 9.4% (8)
2020 22.2% (8) 3.00 (0.86−12.13) 0.10 16.5% (15) 1.90 (0.78− 4.96) 0.17
Cerebral infarction or Stroke, not specified as haemorrhage or infarction
2019 6.1% (168) 6.3% (283)
2020 6.9% (178) 1.13 (0.91− 1.41) 0.26 5.6% (254) 0.88 (0.74− 1.04) 0.14
Aortic aneurism and dissection
2019 26.7% (31) 24.0% (44)
2020 23.9% (27) 0.86 (0.47− 1.56) 0.62 26.6% (61) 1.15 (0.73− 1.80) 0.55
Pneumonitis due to solids and liquids
2019 29.2% (115) 29.6% (187)
2020 32.3% (109) 1.16 (0.85− 1.59) 0.36 26.4% (187) 0.85 (0.67− 1.08) 0.20
Adult respiratory distress syndrome
2019 57.1% (4) 87.5% (7)
2020 76.0% (19) 2.37 (0.38−14.13) 0.33 82.4% (14) 0.67 (0.03− 6.38) 0.74
Duodenal ulcer
2019 7.3% (23) 6.6% (37)
2020 6.3% (18) 0.86 (0.45− 1.62) 0.63 7.4% (43) 1.13 (0.71− 1.78) 0.61
Paralytic ileus and intestinal obstruction without hernia
2019 5.6% (63) 5.6% (103)
2020 5.1% (52) 0.92 (0.63− 1.34) 0.67 5.0% (99) 0.89 (0.67− 1.18) 0.42
BMJ Publishing Group Limited (BMJ) disclaims all liability and responsibility arising from any relianceSupplemental material placed on this supplemental material which has been supplied by the author(s) Emerg Med J
doi: 10.1136/emermed-2021-211183–5.:10 2021;Emerg Med J, et al. Bollmann A

Diverticular disease of intestine
2019 1.7% (20) 1.2% (26)
2020 1.6% (17) 0.95 (0.49− 1.82) 0.87 1.3% (28) 1.09 (0.64− 1.88) 0.75
Peritonitis
2019 14.5% (16) 9.6% (20)
2020 13.3% (15) 0.90 (0.42− 1.93) 0.78 8.3% (18) 0.86 (0.44− 1.68) 0.66
Hepatic failure
2019 35.9% (23) 42.2% (38)
2020 26.8% (11) 0.65 (0.27− 1.52) 0.33 46.2% (37) 1.18 (0.64− 2.16) 0.60
Acute pancreatitis
2019 2.1% (15) 1.6% (19)
2020 2.2% (14) 1.06 (0.50− 2.23) 0.87 1.5% (17) 0.91 (0.47− 1.77) 0.79
Cellulitis
2019 1.2% (8) 1.3% (16)
2020 1.4% (7) 1.13 (0.39− 3.16) 0.82 0.6% (7) 0.48 (0.18− 1.13) 0.11
Acute renal failure
2019 15.5% (173) 13.4% (236)
2020 17.1% (148) 1.12 (0.88− 1.42) 0.36 14.4% (235) 1.09 (0.90− 1.32) 0.39
Shock, not elsewhere classified
2019 55.1% (27) 58.8% (57)
2020 69.5% (41) 1.86 (0.85− 4.13) 0.12 69.0% (80) 1.56 (0.89− 2.75) 0.12
Intracranial injury
2019 2.5% (82) 2.1% (124)
2020 2.7% (72) 1.11 (0.80− 1.53) 0.52 2.6% (125) 1.21 (0.94− 1.55) 0.14
Fracture of lumbar spine and pelvis
BMJ Publishing Group Limited (BMJ) disclaims all liability and responsibility arising from any relianceSupplemental material placed on this supplemental material which has been supplied by the author(s) Emerg Med J
doi: 10.1136/emermed-2021-211183–5.:10 2021;Emerg Med J, et al. Bollmann A

2019 1.7% (17) 2.5% (41)
2020 2.5% (23) 1.43 (0.76− 2.73) 0.27 2.8% (43) 1.12 (0.73− 1.74) 0.60
Fracture of femur
2019 4.8% (96) 5.9% (195)
2020 4.9% (103) 1.03 (0.77− 1.37) 0.84 5.1% (178) 0.85 (0.69− 1.05) 0.14
Complications of cardiac and vascular prosthetic devices, implants and grafts
2019 1.9% (7) 2.5% (16)
2020 1.8% (6) 0.91 (0.29− 2.77) 0.87 1.6% (10) 0.64 (0.28− 1.40) 0.27
Based on 183,803 cases (93.8%). We excluded cases with discharge due to hospital transfer or unspecified reason. Proportion of excluded cases was stable ranging between 5.9 and 6.5% per year and period.
BMJ Publishing Group Limited (BMJ) disclaims all liability and responsibility arising from any relianceSupplemental material placed on this supplemental material which has been supplied by the author(s) Emerg Med J
doi: 10.1136/emermed-2021-211183–5.:10 2021;Emerg Med J, et al. Bollmann A

Figure S1. Hospitalizations per hospital in 2019 (red) and 2020 (green). Case numbers are
displayed per hospital with 2019 bars below 2020 bars for every hospital.
BMJ Publishing Group Limited (BMJ) disclaims all liability and responsibility arising from any relianceSupplemental material placed on this supplemental material which has been supplied by the author(s) Emerg Med J
doi: 10.1136/emermed-2021-211183–5.:10 2021;Emerg Med J, et al. Bollmann A