host community perceptions of the impacts...
TRANSCRIPT

HOST COMMUNITY PERCEPTIONS OF THE IMPACTS OF THEAUSTRALIAN FORMULA ONE GRAND PRIX IN MELBOURNEA COMPARISON OF RESIDENT REACTIONS IN 1999 WITH 2002
By Liz Fredline, Marg Deery and Leo Jago

HOST COMMUNITY PERCEPTIONS - IMPACTS OF FORMULA ONE GRAND PRIX – MELBOURNE
TECHNICAL REPORTS The technical report series present data and its analysis, meta-studies and conceptual studies, and are considered to be of value to industry, government and researchers. Unlike the Sustainable Tourism Cooperative Research Centre’s Monograph series, these reports have not been subjected to an external peer review process. As such, the scientific accuracy and merit of the research reported here is the responsibility of the authors, who should be contacted for clarification of any content. Author contact details are at the back of this report.
EDITORS Prof Chris Cooper University of Queensland Editor-in-Chief Prof Terry De Lacy Sustainable Tourism CRC Chief Executive Prof Leo Jago Sustainable Tourism CRC Director of Research National Library of Australia Cataloguing in Publication Data
Fredline, Elizabeth. Host community perceptions of the impacts of the Australian Formula One Grand Prix in Melbourne : a comparison of resident reactions in 1999 with 2002. Bibliography. ISBN 1 876685 47 6. 1. Australian Formula One Grand Prix - Public opinion. 2. Grand prix racing - Social aspects - Victoria - Melbourne. I. Deery, Margaret. II. Jago, Leo. III. Cooperative Research Centre for Sustainable Tourism. IV. Australian Formula One Grand Prix. V. Title. 796.72099451
Copyright © CRC for Sustainable Tourism Pty Ltd 2004 All rights reserved. Apart from fair dealing for the purposes of study, research, criticism or review as permitted under the Copyright Act, no part of this book may be reproduced by any process without written permission from the publisher. Any enquiries should be directed to Brad Cox, Communications Manager [[email protected]] or Trish O’Connor, Publishing Manager [[email protected]].
Acknowledgements
The Sustainable Tourism Cooperative Research Centre, an Australian Government initiative, funded this research.
ii

Comparison of resident reactions in 1999 with 2002
CONTENTS
ABSTRACT_____________________________________________________________________________ V CHAPTER 1 INTRODUCTION ____________________________________________________________ 1
RESEARCH OBJECTIVES ___________________________________________________________________ 1 CHAPTER 2 REVIEW OF LITERATURE___________________________________________________ 2 CHAPTER 3 METHOD___________________________________________________________________ 3
POPULATION AND SAMPLING FRAMES ________________________________________________________ 3 SAMPLING METHODS_____________________________________________________________________ 3 INSTRUMENT DESIGN_____________________________________________________________________ 3 ADMINISTRATION METHOD ________________________________________________________________ 4
CHAPTER 4 RESULTS___________________________________________________________________ 5 CHARACTERISTICS OF THE 2002 SAMPLE ______________________________________________________ 5 OVERALL PERCEPTIONS OF IMPACTS IN 2002 __________________________________________________ 6 PERCEPTIONS OF SPECIFIC IMPACTS IN 2002 ___________________________________________________ 7 FUTURE PREFERENCES___________________________________________________________________ 10 COMPARISON OF PERCEPTION OF IMPACTS OF GRAND PRIX WITH OTHER EVENTS _____________________ 10 LONGITUDINAL COMPARISON _____________________________________________________________ 11 QUALITATIVE ANALYSIS AND THE USE OF FIRST WORDS _________________________________________ 13 COMMUNITY SEGMENTATION _____________________________________________________________ 14 PERCEPTIONS OF IMPACT ACROSS CLUSTERS__________________________________________________ 15 RELATIONSHIP BETWEEN CLUSTER MEMBERSHIP AND FIRST WORDS ________________________________ 17
Profiling of clusters___________________________________________________________________ 17 Proximity to Track ___________________________________________________________________ 17 Contact and Use of Recreational Facilities _________________________________________________ 17 Grand Prix and other Motorsport Attendance _______________________________________________ 17 Involvement in Tourism _______________________________________________________________ 17 Leisure Activities ____________________________________________________________________ 18 Community Attachment _______________________________________________________________ 19 Socio-Political Values_________________________________________________________________ 19 Demographic Variables________________________________________________________________ 19
COMPARISON OF FUTURE PREFERENCES AND OTHER EVENTS ACROSS CLUSTERS _____________________ 19 COMPARISON OF CLUSTER MEMBERSHIP OVER TIME ___________________________________________ 20
CHAPTER 5 CONCLUSION _____________________________________________________________ 21 SUMMARY ____________________________________________________________________________ 21 RECOMMENDATIONS FOR PLANNING AND MANAGEMENT ________________________________________ 21 LIMITATIONS __________________________________________________________________________ 21 FUTURE RESEARCH DIRECTIONS ___________________________________________________________ 22
APPENDIX A: COMPARISON OF EFFECT OF DIFFERENT WEIGHTING METHODS ON MEAN PERSONAL IMPACT SCORES _________________________________________________________ 23
REFERENCES _________________________________________________________________________ 24 AUTHORS_____________________________________________________________________________ 25
iii

HOST COMMUNITY PERCEPTIONS - IMPACTS OF FORMULA ONE GRAND PRIX – MELBOURNE
LIST OF TABLES Table 1: Demographic characteristics of the sample_______________________________________________ 5 Table 2: Overall perceptions of personal and community level impacts________________________________ 7 Table 3: Perceptions of specific impacts________________________________________________________ 7 Table 4: The most strongly perceived personal impacts of the Grand Prix______________________________ 9 Table 5: The most strongly perceived community impacts of the Grand Prix ___________________________ 9 Table 6: Comparison of single and multi-item measures of overall impact _____________________________ 9 Table 7: Preferences for future of Grand Prix___________________________________________________ 10 Table 8: Rating of personal and community benefit of major Melbourne events ________________________ 11 Table 9: Comparison of population proportions (CENSUS96) _____________________________________ 11
with sample proportions (GP2002 survey) ______________________________________________ 11 Table 10: Comparison of personal and community impact means from 1999 to 2002____________________ 12 Table 11: Comparison of relative importance of impacts over time __________________________________ 13
(top and bottom 5 ranked impacts) ____________________________________________________ 13 Table 12: Use of first words to describe the Grand Prix ___________________________________________ 14 Table 13: Comparison of between and within group variability_____________________________________ 14 Table 14: Comparison of overall perceptions of impact across clusters _______________________________ 15 Table 15: Comparison of specific perceptions of impact across clusters ______________________________ 15 Table 16: Comparison of first word usage across clusters _________________________________________ 17 Table 17: Summary of cluster profiles ________________________________________________________ 18 Table 18: Recode of leisure activity participation variables ________________________________________ 19 Table 19: Preferences for future of Grand Prix__________________________________________________ 19 Table 20: Rating of personal and community level benefits of events across clusters ____________________ 20 Table 21: Comparison of cluster membership over time __________________________________________ 20
LIST OF FIGURES Figure 1: Comparison of the populations used in the two studies_________________________________ 3 Figure 2: Responses from each postal district________________________________________________ 6 Figure 3: Comparison of distributions of single and multi-item measures of community impact _______ 10
iv

Comparison of resident reactions in 1999 with 2002
Abstract This report presents the findings from a comparative study of the host community perceptions of the impacts of the Australian Formula One Grand Prix in 1999 and in 2002. The study, which has used the same survey instrument for both years, examines the perceived impact of this event on the quality of personal life and also of the community. It uses the concept of resident perceptions to measure the impact of a range of variables from the event such as noise, traffic and waste. In total, the study obtained 279 responses in each year, although these represented different response rates. The findings from the study suggest that, over time, the number of those respondents in the “unconcerned” category has grown and those at the extremes have decreased. There appears to be less antagonism to the noise and operational components of the event in the latter sample and an increased value placed on the economic contribution the event makes to the city. The report concludes with recommendations to management and policy makers.
v

HOST COMMUNITY PERCEPTIONS - IMPACTS OF FORMULA ONE GRAND PRIX – MELBOURNE
vi

Comparison of resident reactions in 1999 with 2002
1
Chapter 1
Introduction Recent case study work in the area of residents’ perceptions of the impacts of tourism and events has highlighted some of the key social costs and benefits often associated with concentrated tourism activity. It has also shed light on the differential effects that these costs and benefits may have on various subsections of the community. Despite the fact that much of this research has been conducted in very different destinations, and the type of tourism activity under examination was often highly diverse, many commonalities have been observed (Fredline & Faulkner 2000).
An important question remains unanswered though; do the perceptions of residents vary over time? This question is particularly important in the case of recurring events, where there is an expectation that the event will be ongoing, and there is an opportunity to improve the management of impacts over time. However, the only examples of longitudinal examination of host community perceptions of events is with regard to one-off mega-events such as the Olympic Games in Calgary (Ritchie & Aitken 1984, 1985; Ritchie & Lyons 1987, 1990; Ritchie & Smith 1991) and the America’s Cup in Fremantle (Soutar & McLeod 1989, 1993), where residents’ perceptions were measured at various intervals prior to and following the event.
Research Objectives This report presents some of the results from a project assessing the social impacts of a range of different events. The objectives of the project as a whole were: 1. To examine host community perceptions of event impacts across a range of events and host communities,
specifically; • A comparison of residents’ reactions to the Australian Formula One Grand Prix in Melbourne in
2002, with data previously collected in 1999, in an effort to identify longitudinal changes in community reactions; and
• A comparison of different themed events in the same community. The Grand Prix data collected in 2002 were compared with data on resident reactions to the Melbourne Moomba Festival, a community oriented event; and
• A comparison of similar themed events in different sized communities. The Moomba festival data were compared to data collected at the Art Is… Festival in Horsham, a regional community about 275 km west of Melbourne.
2. Progression toward development of a compressed generic instrument to evaluate impacts of events and
facilitate comparison. 3. Examination of intrinsic variation within communities with regard to their reactions to events.
This report presents the results of the comparison referred to in objective 1A; the remaining objectives are
addressed in another technical report soon to be available from STCRC.

HOST COMMUNITY PERCEPTIONS - IMPACTS OF FORMULA ONE GRAND PRIX – MELBOURNE
2
Chapter 2
Review of Literature There is a small but growing body of literature examining the impacts of special events on the host community as perceived by local residents. Much of this work draws on the broader area of host community reactions to more general tourism activity, which is justified on the grounds that events are just one of many different types of tourism attraction. With regard to general tourism activity, there has been widespread reference to what have become known as the stage based models. The most commonly referred to of these is Butler’s (1980) Tourism Destination Life Cycle Model, which describes how changes in the number and type of tourists over time are associated with changes in tourism infrastructure, environmental assets and the competitive environment. In describing these changes Butler refers to increasing negative social and environmental impacts potentially associated with the advanced stages of tourism development. It is suggested that when activity becomes oriented towards high-volume mass tourism then impacts may eventually reach a level which will aggravate local residents. Similarly, Doxey’s Irridex Model (1975) suggests that residents’ responses to tourism may pass through a series of stages including euphoria, apathy, irritation and antagonism, as continued exposure to intensifying negative impacts is reflected by increasing annoyance.
These models are simplistic, and there are many other variables relating to the characteristics of the destination and the type of tourism activity, which will mediate the relationship between the stage of tourism development and host community reaction. However, these models are valuable to the extent that they highlight the fact that negative social impacts will most likely be exacerbated unless preventative planning and management action is taken.
However, whilst these stage-based models may be appropriate for explaining the growing irritation that accompanies the gradual build up of impacts associated with general tourist activity, the growth of impacts of an event may have a quite different progression. The winning of the right to stage a major event inevitably attracts media attention, and, amongst some segments of the community, is often associated with euphoria derived from a feeling of success. It may also be possible however, particularly if there are any controversial aspects of the proposed event, for some community sectors to oppose the initiative as soon as they become aware of it. Public and private discussion of the perceived costs and benefits will then begin with people drawing on their experiences of other events as well as their anticipation of impacts to determine their stance on the issue. Longitudinal research conducted by Soutar and McLeod (1989, 1993) with regard to the America’s Cup Defence Series in 1987 suggested that residents were likely to anticipate more negative impacts prior to the event, than they perceived after the event had actually occurred. Similar results were found in a study of the impacts of the Calgary Winter Olympics, where resident support increased substantially after the event had taken place (Ritchie & Aitken 1984, 1985; Ritchie & Lyons 1987, 1990; Ritchie & Smith 1991). In their study on the Atlanta Olympics in 1996, Mihalik and Simonetta (1999) found declining levels of support in the years leading up to the event. They suggest that this result is consistent with future optimism theory (Mowen & Mowen 1991), which states that when outcomes occur far in the future a greater risk of failure is considered acceptable than when outcomes occur in the present.
With regard to smaller recurring events, the anticipation of impacts may also differ from actuality, especially prior to the inaugural event. In addition, it is likely that residents will be more sensitive to impacts in the time period around the staging of the event, than at other times. Another important factor is that, hopefully, the more years that an event is held the more competent its management team becomes, enabling them to mitigate negative impacts and capitalise on the benefits. This, in association with resident adaptation and selective migration, may actually lead to growing satisfaction with the event over time.
Given the deficit of existing knowledge of how residents’ perceptions to recurring events change over time, no specific relationships were hypothesised in this part of the study. However, some improvement in overall residents’ reactions was anticipated.

Comparison of resident reactions in 1999 with 2002
3
Chapter 3
Method Although very similar methods were employed to collect the data in the two studies there are minor differences that will be highlighted under the relevant sections below.
Population and Sampling Frames Although, the population of interest in the two studies was theoretically the same, the use of different sampling frames demanded a slightly different definition of the population in each case. In the 1999 study, state electoral district (SED) rolls were used as a sampling frame, and all electoral districts of which some part fell within a 10km radius of the centre of the track were included. In 2002, a proprietary list (The National Consumer File maintained by Prime Prospects List Marketing) was used as a frame, and addresses within a 15km radius of the track centre were purchased. Thus the bulk of the population included in each definition is the same, it is only at the margins that the definitions vary slightly as shown in Figure 1.
Figure 1: Comparison of the populations used in the two studies
Sampling Methods Somewhat different sampling methods were employed in the two studies. In 1999, a stratified random sampling approach was used, with the 20 SEDs (as shown in Figure 1) used as the basis for stratification, and an additional strata being created within the electorate of Albert Park, which included everyone who lived within a few streets of the circuit itself. Thus 21 strata were used, and residents were randomly selected within each, in a way that disproportionately over represented those living closer to the track (see Fredline and Faulkner 2000 for greater detail of this procedure). This strategy was pursued because of the hypothesised importance of distance as a predictor of reaction to the event, which was confirmed in this study. For the 2002 study, other objectives had precedence, and a proportionate sample was deemed more appropriate. Thus, sampling was achieved using a simple random selection of all people residing within 15km of the track centre.
The disproportionate sampling used in 1999 necessitated a weighting back process to ensure comparability of the results. This procedure is described in Chapter 4 (Results).
Instrument Design A similar instrument was used in the two studies. Both combined qualitative and quantitative techniques in an effort to gain as many different perspectives of the impacts as possible. The main scale used in these studies is somewhat different from that which was typically used in this type of research at the time of the original study.

HOST COMMUNITY PERCEPTIONS - IMPACTS OF FORMULA ONE GRAND PRIX – MELBOURNE
4
Likert type scales have been used extensively, where reactions to a series of statements about the impacts of tourism/events are recorded in terms of level of agreement or disagreement with the statement. This approach is simple and easy to administer, but it also has a number of shortcomings. Generally, the statements presented to the respondent are biased, implying movement of the impact in a specific direction. However, not all respondents necessarily perceive the impacts in the same way as the researcher, and it is not clear whether disagreement with a statement implies that the respondent thinks that the affect has been in an opposing direction, or that it has not changed at all. An additional complication is that it cannot always be assumed that strong agreement or disagreement with a statement necessarily translates to a serious concern about the impact on quality of life.
In an effort to overcome these problems, a more complex dependent measure was used in these studies. In Part A, for the first set of items, impacts were presented in a neutral manner, and respondents were asked about the direction of change, the options being “increased” and “decreased”, or “worsened” and “improved”, as appropriate. Alternatives of “no change” and “don’t know” were also available. The remaining items referred to impacts that could only conceivably move in one direction, and the above responses were therefore not appropriate, thus the choices available were simply “agree”, “disagree” and “don’t know”. Parts B and C were identical for all the items with respondents asked to rate the impacts on personal quality of life and on the community as a whole using a seven point Likert-type scale ranging from very negative (-3) to very positive (+3), with zero (0) indicating no affect.
In the original study, 38 impact statements were included, while the 2002 instrument contained 45 statements in an effort to include more items relating to social capital impacts. Based on the original results, the wording was changed slightly in some of the items in an effort to improve the comprehension of the scale, however, many of the items were very similar or exactly the same, which facilitated comparison across the two time periods on 34 statements.
The independent variables investigated in this study included proximity to event, level of contact with event, use of recreational facilities, participation in the event, involvement in tourism/event, identification with the theme, community attachment, socio-political values, and a variety of demographic variables including age, gender, and level of education.
Administration Method The instruments were administered in a very similar way in the two iterations, through a postal survey. In both cases, a survey package was dispatched to each person identified in the sample that included a cover letter, a copy of the questionnaire, and a reply paid envelope. In both instances an incentive was offered in the form of a lottery to potentially win $500 cash. In the original study 1000 of these packages were sent out on 23rd March 1999, two weeks after the event had taken place. Of these, 80 were returned as non-deliverable, and 279 were completed and returned, representing an effective response rate of 30.3%. In the later study, a much poorer response rate was achieved, with only 279 usable responses from 2400 with 248 non-deliverables, representing a response rate of 13%.
A number of factors have been identified which may have contributed to this poorer response rate. The later study was operating on a relatively lower budget and on a tighter time line, necessitating a number of pragmatic compromises with regard to the methods. Firstly, the cover letters in the first study were personalised while those in the second study were simply addressed to the “resident”. A follow up letter was sent to encourage response in the first instance but not in the second. Additionally, the timing of the second study meant that questionnaires were dispatched more than six weeks after the event as opposed to two weeks after in the first case. It is reasonable to assume that reactions to an event of this type are heightened around the time of its occurrence, and there is evidence to suggest that those with more extreme reactions to an issue are more likely to respond to a survey in that topic area. Therefore, it is logical to believe that the additional elapse of time in the second study may have impacted the response. Similarly, the first survey was undertaken in the fourth year of the event, while the second survey canvassed residents’ reaction to the seventh year of the Grand Prix in Melbourne. There are two reasons why a decline in response over time might be expected. Firstly, as documented in the literature review, previous research has provided some support for an argument that residents may adapt to the impacts of tourism and events over time. Additionally, the lower response rate may reflect a tendency for some residents to feel that the event has become part of everyday life, and no longer worthy of a reaction. In particular, those who were negatively disposed to the event, such as members and supporters of the Save Albert Park protest group, may have felt that their participation in the 1999 survey gave them an opportunity to vent their frustration, and perhaps some even believed that their negative reaction may have affected some sort of change. Similarly, those who were positively disposed towards the event may have felt a need to defend it, to ensure its continuation. However, three years later, the future of the event would appear to be fairly secure, and thus fewer people may have felt motivated to respond.

Comparison of resident reactions in 1999 with 2002
5
Chapter 4
Results The results of the 1999 survey have been previously reported in detail (Fredline, 2000; Fredline & Faulkner 2002a, 2002b). This section therefore presents the results from the more recent survey, and then draws a comparison with the earlier study.
Characteristics of the 2002 sample At the outset, the demographic profile of the sample was examined and compared, where possible, with known population parameters from the 2001 Census (ABS, 2002). Note that the Census data relate to the entire statistical district of Melbourne, rather than the population defined in this survey (that is, people who reside within 15km of the Grand Prix circuit). Similarly only basic community profiles had been released at the time of analysis, thus education levels and employment status could not be compared.
Table 1: Demographic characteristics of the sample
Frequency Percent Population Proportion χ2 *
Gender Female 114 41.61 51.05 Male 160 58.39 48.95 3.6 (3.841) Age 18-29 years 22 8.33 23.48 (Mean = 50.9 years) 30-39 years 48 18.18 21.23 40-49 years 57 21.59 19.17 50-59 years 59 22.35 15.04 60-69 years 35 13.26 9.58 70-79 years 33 12.50 7.46
80 years and over 10 3.79 4.03 18.9 (12.592)
No formal qualifications 14 5.13 Highest education level completed
Completed year 10 at school 28 10.26
Completed year 12 44 16.12 Trade Qualification 33 12.09
Technical College/TAFE Diploma 30 10.99
Undergraduate Degree 58 21.25 Post Graduate Degree 61 22.34 Employment status Employed 154 56.20 Unemployed 14 5.11 Retired 61 22.26 Student 7 2.55 Student/part-time work 6 2.19 Home duties 15 5.47 Where were you born? Melbourne 150 54.74
Elsewhere in Victoria 34 12.41 Elsewhere in Australia 34 12.41
Total born in Australia
65.75
In another country 56 20.44 34.25 8.5 (3.841) *The calculated value of χ2 appears first, with the appropriate critical value enclosed in parentheses.
As shown in Table 1, there are some issues with regard to representativeness of the sample in terms of demographic characteristics. The sample over represents males, though not significantly, and substantially under represents people in the 18-29 years age group. Conversely, older people, most notably those aged between 50 and 59 years, are over represented. People not born in Australia, are also under represented in the sample. These

HOST COMMUNITY PERCEPTIONS - IMPACTS OF FORMULA ONE GRAND PRIX – MELBOURNE
6
biases are likely to have existed to some extent in the sample frame, for example young people are known to be under represented on the electoral roll, and people not born in Australia, are less likely to be citizens and therefore not enrolled to vote either. However, it is also likely that the administration method exacerbated these biases as young people are likely to change their place of residence more often, and non-Australian born residents are more likely to have language barriers which complicate their participation.
Additionally, inspection of the percentages associated with the categories within the education and employment variables indicates a higher than would be expected proportion of respondents with post graduate degrees, and a lower than would be expected proportion of unemployed people.
These biases are of concern because of their potential to influence the estimates of residents’ reaction to the Grand Prix. Accordingly, when conclusions are made about the impact of the event on the community, it must be acknowledged that some sectors of the community were not as influential in the calculation of these estimates as others. However, this will only affect the results to the extent that these demographic variables are indicative of an associated bias with regard to perceptions of the event. An estimate of the influence of the bias is reported at the end of the results section.
Efforts were also undertaken to examine the sample in terms of its geographical representativeness of the population as defined for the study. Figure 2 below maps the response from each postal district. The map indicates that responses were drawn from many of the postal zones within the population region.
Figure 2: Responses from each postal district
Overall Perceptions of Impacts in 2002 As mentioned in the method section, the main dependent variables examined in this study were the perceptions of the impacts of the event on personal quality of life and on the community as a whole. Two operationalisations of each of these variables were employed. At the beginning of the instrument a single item measure was used with the aim of measuring respondents’ first impressions. Subsequently, specific potential impacts were presented, with residents being asked to comment on the effects of these at both the personal and community levels. As shown in Table 2, using the overall measure, similar proportions felt that the impact was detrimental both personally and for the community at each negative level of the scale. However, while over half of the sample reported no effect on personal quality of life, only 6.9% suggested that the event had no impact on the community as a whole. Rather, 78.5% reported that they perceived the Grand Prix to have some level of positive impact on the community.

Comparison of resident reactions in 1999 with 2002
7
Table 2: Overall perceptions of personal and community level impacts
Very negative
-3 -2 -1
No effect
0 +1 +2
Very positive
+3 Mean Std. Dev
Overall, how does the event affect your personal quality of life? 3.3% 3.3% 8.9% 51.3% 17.7% 4.1% 11.4% 0.35 1.33 Overall, how does the event affect the Melbourne community as a whole? 1.9% 4.6% 8.1% 6.9% 24.1% 28.7% 25.7% 1.36 1.52
Perceptions of Specific Impacts in 2002 With regard to the specific impacts, as referred to in the methods section (Chapter 3), each question in this section of the instrument comprised three parts. Table 3 displays the proportions of the sample selecting each of the options in Part A of the question, as well as the mean ratings of personal and community impact from Parts B and C. As noted in the method section, where respondents selected “no change” or “don’t know”, they were not required to complete Parts B and C. For the purposes of calculating the mean response for the sample, the “no change” responses were coded as zero (0), indicating “no effect”, while the “don’t know” responses were coded as missing and therefore eliminated from the analysis. Thus, the means presented in Table 3 do not include all respondents; they only include those who felt knowledgeable enough to comment on the specific issue.
Table 3: Perceptions of specific impacts PART A PART B PART C Decreased Increased
No Change
Don't Know
Personal Impact Mean
Community Impact Mean
Maintenance of public facilities 7.0 65.2 7.7 20.1 0.71 1.40 Noise levels 3.3 81.5 9.1 6.2 -0.27 -0.79 Employment opportunities 2.2 72.4 9.5 16.0 0.22 1.40 Range of interesting things to do 2.9 68.4 24.0 4.7 0.62 1.21 Number of people in the area around the race track 3.6 59.5 13.9 23.0 0.03 0.42 Rowdy and delinquent behaviour 4.7 26.2 36.0 33.1 -0.16 -0.36 Property values in the vicinity of the track 10.1 32.2 14.1 43.5 0.17 0.49 Crime levels 2.2 10.1 38.0 49.6 -0.05 -0.15 Dangerous driving 1.5 32.1 43.3 23.1 -0.31 -0.45 Entertainment opportunities 3.4 69.4 15.7 11.6 0.51 1.23 Prices of some goods and services 0.7 44.0 34.3 20.9 -0.24 -0.32 Pride that Melbourne residents have in their city 4.5 68.3 19.8 7.5 0.75 1.15 Overall cost of living 0.8 18.0 63.2 18.0 -0.04 -0.05 Litter in the vicinity of the track 7.9 38.2 26.6 27.3 -0.07 -0.42 Damage to the environment 8.6 39.2 37.3 14.9 -0.25 -0.41 Opportunities to meet new people 1.9 64.6 23.5 10.1 0.49 1.09 Opportunities for local business 11.2 67.8 7.5 13.5 0.26 1.21 Parking availability in the vicinity of the track 64.9 9.3 5.2 20.5 -0.41 -1.16 Traffic congestion in the vicinity of the track 4.1 80.4 6.3 9.3 -0.62 -1.18 The number of tourists visiting Melbourne at other times of the year 1.1 56.3 13.7 28.9 0.26 1.26 Excessive drinking and/or drug use 1.9 24.5 33.8 39.8 -0.09 -0.30 Turnover for local businesses 5.7 57.7 7.2 29.4 0.24 1.17 Number of people moving to Melbourne permanently or buying holiday homes here 1.9 13.4 28.4 56.3 0.08 0.43 Public funding for sport 4.4 29.6 21.5 44.4 0.25 0.56

HOST COMMUNITY PERCEPTIONS - IMPACTS OF FORMULA ONE GRAND PRIX – MELBOURNE
8
PART A PART B PART C Decreased Increased
No Change
Don't Know
Personal Impact Mean
Community Impact Mean
The rights and civil liberties of local residents 37.5 7.1 30.9 24.5 -0.19 -0.71 Worsened Improved
No Change
Don't Know
Personal Impact Mean
Community Impact Mean
Appearance of area around track 14.5 72.5 6.2 6.9 0.60 1.19 Public transport 10.1 47.8 29.3 12.7 0.34 0.81 Interactions between locals and tourists 7.2 39.5 22.1 31.2 0.29 0.75 Facilities available to local residents 17.4 43.8 10.9 27.9 0.27 0.66 Social and moral values 13.1 6.5 60.4 20.0 -0.08 0.01
Agree
Disagree
Don't Know
Personal
Impact Mean Community
Impact Mean The media coverage of the event promotes tourism and business development in Melbourne 81.9 10.5 7.6 0.41 1.50
The public money spent on the event would be better spent on other things 36.3 51.6 12.1 -0.27 -0.38
The event entertains local residents and gives them an opportunity to attend a major international event
63.5 22.6 13.9 0.51 0.98
The event disrupts the lives of local residents and causes them stress 61.7 23.7 14.6 -0.19 -0.85
The theme of the event fits poorly with the culture of Melbourne 19.0 66.4 14.6 -0.09 -0.16
Because of the event, the skill base for event management in Melbourne has increased 72.0 9.0 19.0 0.37 1.27
The event increases social inequity because it provides benefits to the rich, but none to the poor
32.4 53.7 14.0 -0.06 -0.32
The event gives us an opportunity to show other people how special our community is 67.6 25.7 6.6 0.50 1.18
The event brings too many people into our community 15.0 75.1 9.9 -0.02 0.02
The event enhances Victoria's reputation as "The Events State" 82.5 11.3 6.2 0.68 1.41
Because of the event, friends come and visit me 21.5 70.4 8.1 0.36 0.38 Ordinary residents get no say in the planning and management of the event 53.1 21.1 25.8 -0.22 -0.77
The event promotes values that are good 38.2 37.8 24.0 0.38 0.67 The event provides opportunities for people to have fun with their family and friends 79.1 13.9 7.0 0.68 1.38
The money that tourists spend when they come to the event helps to stimulate the economy 88.0 6.9 5.1 0.56 1.70
Examination of the means in Table 3 indicates a tendency for respondents to perceive impacts more strongly at a community level than at a personal level. At a personal level, the most strongly perceived benefits, as shown in Table 4, include a range of “social capital” type impacts, as well as the economic impact of tourism assisting in the stimulation of the economy. The only negative impact that was rated outside the range ± 0.5 was traffic congestion.

Comparison of resident reactions in 1999 with 2002
9
Table 4: The most strongly perceived personal impacts of the Grand Prix Mean Pride that Melbourne residents have in their city 0.75 Maintenance of public facilities 0.71 The event provides opportunities for people to have fun with their family and friends 0.68 The event enhances Victoria's reputation as "The Events State" 0.68 Range of interesting things to do 0.62 Appearance of area around track 0.60 The money that tourists spend when they come to the event helps to stimulate the economy 0.56 Entertainment opportunities 0.51 The event entertains local residents and gives them an opportunity to attend a major international event 0.51 The event gives us an opportunity to show other people how special our community is 0.50 Traffic congestion in the vicinity of the track -0.62 A slightly different pattern is observed at the community level, as shown in Table 5, with economic, tourism
and commercial impacts ranking relatively higher than the social and community benefits.
Table 5: The most strongly perceived community impacts of the Grand Prix Mean The money that tourists spend when they come to the event helps to stimulate the economy 1.70 The media coverage of the event promotes tourism and business development in Melbourne 1.50 The event enhances Victoria's reputation as "The Events State" 1.41 Maintenance of public facilities 1.40 Employment opportunities 1.40 The event provides opportunities for people to have fun with their family and friends 1.38 Because of the event, the skill base for event management in Melbourne has increased 1.27 The number of tourists visiting Melbourne at other times of the year 1.26 Entertainment opportunities 1.23 Opportunities for local business 1.21 Range of interesting things to do 1.21 Appearance of area around track 1.19 The event gives us an opportunity to show other people how special our community is 1.18 Turnover for local businesses 1.17 Pride that Melbourne residents have in their city 1.15 Opportunities to meet new people 1.09 Parking availability in the vicinity of the track -1.16 Traffic congestion in the vicinity of the track -1.18
These specific impact statements can then be used as an additional indicator of overall impacts through the creation of a multi-item summated measure. Table 6 compares the means observed using this multi-item measure with those from the single item measures reported earlier. As is typical of multi-item measures, a much smaller range is observed.
Table 6: Comparison of single and multi-item measures of overall impact Single Item
Measure Multi Item Measure
Mean Std. Deviation Mean Std.
Deviation Mean
difference Effect on personal quality of life 0.35 1.33 0.16 0.52 0.19 Effect on the Melbourne community as a whole 1.36 1.52 0.42 0.76 0.93
HOST COMMUNITY PERCEPTIONS - IMPACTS OF FORMULA ONE GRAND PRIX – MELBOURNE
10
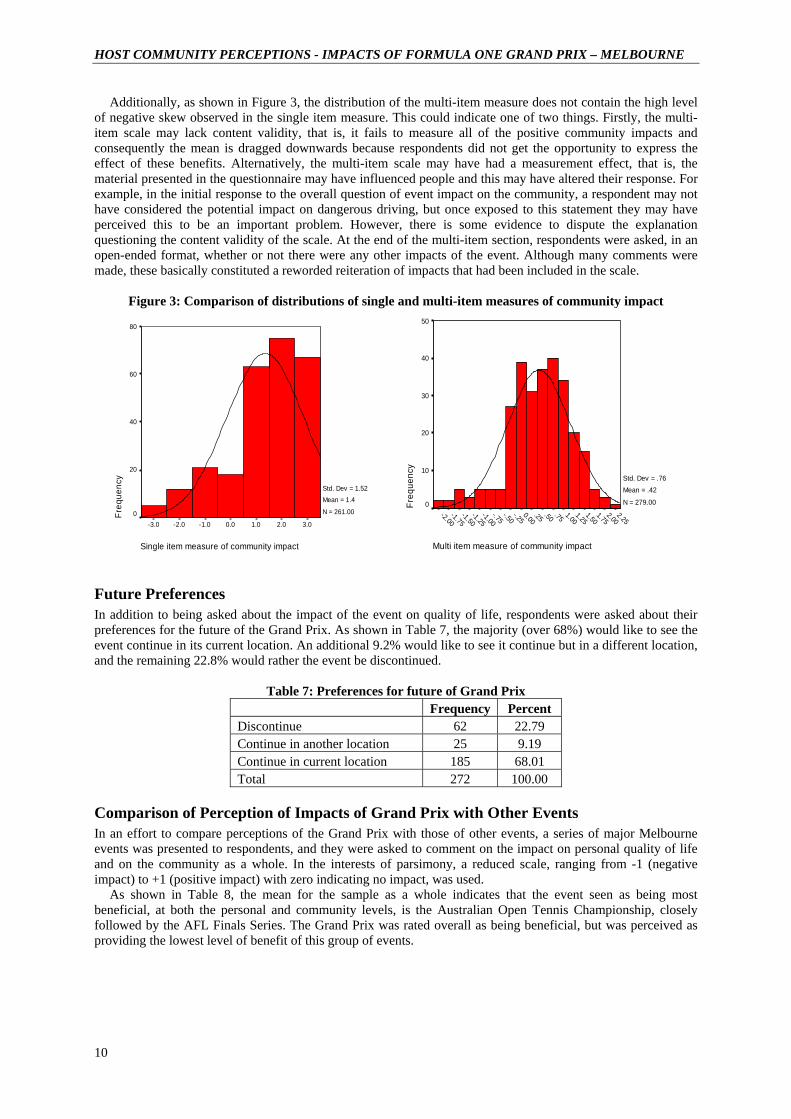
Additionally, as shown in Figure 3, the distribution of the multi-item measure does not contain the high level of negative skew observed in the single item measure. This could indicate one of two things. Firstly, the multi-item scale may lack content validity, that is, it fails to measure all of the positive community impacts and consequently the mean is dragged downwards because respondents did not get the opportunity to express the effect of these benefits. Alternatively, the multi-item scale may have had a measurement effect, that is, the material presented in the questionnaire may have influenced people and this may have altered their response. For example, in the initial response to the overall question of event impact on the community, a respondent may not have considered the potential impact on dangerous driving, but once exposed to this statement they may have perceived this to be an important problem. However, there is some evidence to dispute the explanation questioning the content validity of the scale. At the end of the multi-item section, respondents were asked, in an open-ended format, whether or not there were any other impacts of the event. Although many comments were made, these basically constituted a reworded reiteration of impacts that had been included in the scale.
Figure 3: Comparison of distributions of single and multi-item measures of community impact
Single item measure of community impact
3.02.01.00.0-1.0-2.0-3.0
Freq
uenc
y
80
60
40
20
0
Std. Dev = 1.52 Mean = 1.4
N = 261.00
Multi item measure of community impact
2.252.00
1.751.50
1.251.00
.75.50.250.00-.25
-.50-.75
-1.00-1.25
-1.50-1.75
-2.00
Freq
uenc
y
50
40
30
20
10
0
Std. Dev = .76 Mean = .42
N = 279.00
Future Preferences In addition to being asked about the impact of the event on quality of life, respondents were asked about their preferences for the future of the Grand Prix. As shown in Table 7, the majority (over 68%) would like to see the event continue in its current location. An additional 9.2% would like to see it continue but in a different location, and the remaining 22.8% would rather the event be discontinued.
Table 7: Preferences for future of Grand Prix Frequency Percent Discontinue 62 22.79 Continue in another location 25 9.19 Continue in current location 185 68.01 Total 272 100.00
Comparison of Perception of Impacts of Grand Prix with Other Events In an effort to compare perceptions of the Grand Prix with those of other events, a series of major Melbourne events was presented to respondents, and they were asked to comment on the impact on personal quality of life and on the community as a whole. In the interests of parsimony, a reduced scale, ranging from -1 (negative impact) to +1 (positive impact) with zero indicating no impact, was used.
As shown in Table 8, the mean for the sample as a whole indicates that the event seen as being most beneficial, at both the personal and community levels, is the Australian Open Tennis Championship, closely followed by the AFL Finals Series. The Grand Prix was rated overall as being beneficial, but was perceived as providing the lowest level of benefit of this group of events.

Comparison of resident reactions in 1999 with 2002
11
Table 8: Rating of personal and community benefit of major Melbourne events Personal Community Australian Open Tennis Championships 0.58 0.98 Australian Football League (AFL) Finals Series 0.57 0.94 Melbourne Festival 0.41 0.89 Melbourne International Flower and Garden Show 0.45 0.88 Spring Racing Carnival 0.42 0.88 Melbourne Food and Wine Festival 0.40 0.85 Melbourne International Comedy Festival 0.36 0.84 Melbourne Moomba Festival 0.37 0.83 Australian Formula One Grand Prix 0.24 0.67
Longitudinal Comparison As previously mentioned, the availability of the data collected in 1999 facilitated a comparison over time. However, as discussed in the method section, the different sampling procedures employed in the two studies necessitated a weighting of the earlier data prior to analysis. A simple weighting process was employed based on the distance of place of residence from the centre of the track. In the first study, addresses were collected and an accurate straight line estimate could be made for each respondent by plotting the coordinates of their place of residence using a GIS (Geographic Information System) and calculating the distance from the specified coordinates of the centre of the Grand Prix circuit. In the later study, the only indicator of address that was collected was postcode, therefore, a similar process was utilized, but the centre of the postal district of each resident was used as a proxy for actual address.
Distance was then recoded into one of four groups, less than 1 km from the track, 1-5 km, 5-10 km, and 10-15 km. The final step was to weight the responses by population proportions to ensure that residents at varying distances from the track influenced the final statistics commensurate with their magnitude within the population. Unfortunately, recent known population proportions were unavailable at the time of analysis, as CENSUS2001, had not been fully released. Therefore two alternative estimates of population proportion were compared; population proportions in CENSUS96 and sample proportions observed in the 2002 Grand Prix survey. The latter should be representative given that random sampling was employed; however the non-response issue clearly has the potential to affect this. These proportions are compared in Table 9 below.
Table 9: Comparison of population proportions (CENSUS96) with sample proportions (GP2002 survey)
Population Proportion
(CENSUS96) Sample Proportion (GP2002 Survey)
Within 1km 0.35 1.46 1-5km 15.09 12.77 5-10km 37.73 30.29 10-15km 46.83 55.47
Both weighting methods were trialled and very little variation was observed (See Table in Appendix A). A decision was made to use the population proportions based on the 1996 Census, as these were definitely accurate at the time, and there is no reason to believe these proportions would change substantially over a six-year period.
As shown in Table 10, the overwhelming trend appears to be a decline in the average strength of feeling over time. Many of the negative impacts were not perceived to be as negative in 2002 as they were in 1999, but similarly, the perception of some benefits is not as strong either. At the personal level, residents appear to be less concerned about the negative impacts of noise, damage to the environment, traffic congestion, and erosion of rights and civil liberties. Similarly, in 2002 there was a significantly lower negative mean score associated with the Grand Prix being perceived as a waste of taxpayers’ money, that it disrupts life for locals, that the theme fits Melbourne poorly, and that ordinary people get no say in the planning and management of the event. A similar decrease in concern about some of these impacts was observed at the community level.
A comparable decline in strength of feeling can be observed with regard to some of the benefits of the Grand Prix. The personal benefit of improved maintenance of public facilities is not perceived as highly in 2002 as it was in 1999, and the perception of tourism promotion as a benefit has also declined over time at both the personal and community level. However, there are some exceptions to this trend, with pride in the city now rated more highly as a personal benefit, as well as turnover for local business, and visitor spending as a boost to the economy.

HOST COMMUNITY PERCEPTIONS - IMPACTS OF FORMULA ONE GRAND PRIX – MELBOURNE
12
Table 10: Comparison of personal and community impact means from 1999 to 2002 Personal Impact Community Impact Impact 2002 1999 t-value sig 2002 1999 t-value sig Appearance of area around track 0.60 0.75 1.20 1.44 Maintenance of public facilities 0.71 0.97 -2.05 0.041 1.69 1.66 Noise levels -0.22 -0.62 4.01 0.000 -0.80 -0.98 Employment opportunities 0.25 0.27 1.43 1.58 Interesting things to do 0.66 0.67 1.22 1.46 Crowded / number of people 0.07 -0.44 4.86 0.000 0.50 -0.16 4.25 0.000 Property values 0.19 -0.01 1.98 0.049 0.53 0.58 Litter -0.03 -0.38 3.11 0.002 -0.39 -0.79 2.63 0.009 Relationships / interactions between locals and tourists 0.34 0.26 0.77 0.88 Entertainment opportunities 0.57 0.61 1.28 1.47 Personal Impact Community Impact Impact 2002 1999 t-value sig 2002 1999 t-value sig Prices of some good and services -0.24 -0.39 -0.33 -0.26 Crime levels -0.01 -0.10 -0.12 -0.13 Pride of residents in their city 0.77 0.47 2.52 0.012 1.16 0.94 Dangerous driving -0.29 -0.54 2.42 0.016 -0.43 -0.71 2.23 0.026 Drinking &/or rowdy behaviour n/a -0.48 n/a n/a
n/a -0.82 n/a n/a
Rowdy and delinquent behaviour -0.15 n/a n/a n/a -0.34 n/a n/a n/a Excessive drinking &/or drug use -0.07 n/a n/a n/a -0.28 n/a n/a n/a Damage to the environment -0.20 -0.66 4.05 0.000 -0.40 -0.77 2.65 0.008 Facilities available to locals 0.29 0.30 0.70 0.65
Opportunities to meet new people 0.52 0.64 1.15 1.23 Opportunities for local business
0.30
0.15
1.29
1.12
Availability of parking -0.37 -0.53 -1.16 -0.83 -2.05 0.041 Traffic congestion -0.56 -0.99 3.70 0.000 -1.16 -1.60 3.33 0.001 Rights and civil liberties -0.18 -0.50 3.36 0.001 -0.73 -0.94 Turnover for local businesses 0.30 0.07 2.66 0.008 1.26 1.02 GP promotes tourism 0.41 0.74 -3.49 0.001 1.53 2.12 -5.27 0.000 GP is a waste of public money -0.26 -0.65 3.71 0.000 -0.35 -0.84 3.35 0.001 Opportunity to attend an international event 0.53 0.45 1.04 1.41 -3.23 0.001 Disrupts life for locals -0.14 -0.55 4.82 0.000 -0.87 -1.09 Theme fits poorly -0.08 -0.30 3.24 0.001 -0.15 -0.34 2.27 0.024 Ordinary residents get no say in planning -0.21 -0.71 5.03 0.000 -0.81 -1.10 2.16 0.031 Visitor spending stimulates the economy 0.59 0.39 2.61 0.009 1.72 1.84 GP brings too many people -0.01 0.00 0.02 0.16 Showcase effect 0.52 0.69 1.22 1.95 -6.80 0.000
A significant change in perceptions over time is indicated by the reporting of t and p values in the above table at α = 0.05. Shading indicates differences significant at α = 0.001, based on a Bonferroni correction made because of the large number of comparisons.

Comparison of resident reactions in 1999 with 2002
13
Thus, as shown in Table 11, many of the impacts rated as most important benefits and costs are fairly consistent over time, but some variation can be observed. In 2002, “pride in Melbourne” is rated as the most important personal benefit of the Grand Prix, whereas in 1999 it did not even make the top five. Additionally, problems with parking appear to be an issue in 2002, while this did not really rank as being important in 1999. At the personal level, the mean score indicates some improvement in parking (though this is not significant), however, at the community level, the perception of parking as a problem has significantly worsened.
Table 11: Comparison of relative importance of impacts over time
(top and bottom 5 ranked impacts) Personal Community
Rank 2002 1999 2002 1999
1 Pride of residents in their city (0.77)
Maintenance of public facilities
(0.97)
Visitor spending stimulates the
economy (1.72) GP promotes tourism (2.12)
2 Maintenance of public facilities
(0.71)
Appearance of area around track (0.75)
Maintenance of public facilities
(1.69) Showcase effect (1.95)
3 Interesting things to do (0.66)
GP promotes tourism (0.74)
GP promotes tourism (1.53)
Visitor spending stimulates the economy (1.84)
4 Appearance of area around track (0.6)
Showcase effect (0.69)
Employment opportunities (1.43)
Maintenance of public facilities (1.66)
5 Visitor spending
stimulates the economy (0.59)
Interesting things to do (0.67)
Opportunities for local business (1.29)
Employment opportunities (1.58)
30 Prices of some
goods and services (-0.24)
Noise levels (-0.62) Noise levels (-0.8) Rights and civil liberties (-0.94)
32 GP is a waste of
public money (-0.26)
GP is a waste of public money (-0.65)
Ordinary residents get no say in
planning (-0.81) Noise levels (-0.98)
32 Dangerous driving (-0.29)
Damage to the environment (-0.66)
Disrupts life for locals (-0.87)
Disrupts life for locals (-1.09)
33 Availability of
parking (-0.37)
Ordinary residents get no say in
planning (-0.71)
Availability of parking (-1.16)
Ordinary residents get no say in planning
(-1.1)
34 Traffic congestion (-0.56)
Traffic congestion (-0.99)
Traffic congestion (-1.16)
Traffic congestion (-1.6)
These results would seem to imply that many of the negative impacts of the Grand Prix have been ameliorated, at least as perceived by respondents in the 2002 survey. However, there also seems to have been some sort of rationalisation with regard to the perception of the event as a panacea of benefits.
Qualitative analysis and the use of first words In both survey instruments a series of open-ended questions was included with the intention of gaining a deeper understanding of the issues and in an effort to triangulate the findings. The first question required respondents to write the first word that came into their minds when they thought about the Grand Prix, the aim being to identify the most salient issues for local residents. Similar words were classified into categories by each of the researchers independently, and then discussed until consensus was reached as to the most appropriate classification for each word.
As shown in Table 12, there has been a substantial decline over the three-year period in the use of words such as inconvenient and problematic and corruption that is consistent with the reduced perception of negative impacts observed in the quantitative results. There has been an associated increase in the use of the word “cars”, which is a fairly neutral reaction toward the event.

HOST COMMUNITY PERCEPTIONS - IMPACTS OF FORMULA ONE GRAND PRIX – MELBOURNE
14
Table 12: Use of first words to describe the Grand Prix
Word Category 1999 2002 Total Number of
Mentions Noise 54.7% 45.3% 117 Excitement 42.2% 57.8% 116 Cars 34.7% 65.3% 101 Inconvenient 75.0% 25.0% 44 Problematic 74.2% 25.8% 31 Benefit 48.3% 51.7% 29 Festival 76.2% 23.8% 21 Boring 45.0% 55.0% 20 Tourist 50.0% 50.0% 18 Environmental impact 41.7% 58.3% 12 Corruption 70.0% 30.0% 10 Location 80.0% 20.0% 5 Expensive 40.0% 60.0% 5 Enthusiasts 75.0% 25.0% 4 Calendar 66.7% 33.3% 3
Community Segmentation In an effort to identify differing representations of the Grand Prix that exist within the Melbourne community, segmentation was undertaken using cluster analysis. This analysis comprised two stages. Firstly, a hierarchical clustering procedure was employed, using Ward’s method and squared Euclidean distances as the measure. The variables used were the 45 personal impact statements, collected in section B. Personal impacts were used rather than community impacts, as the aim was to identify residents who are differentially affected by the event.
A number of solutions were examined, with a five-cluster solution being selected because the solution appeared to be logical and interpretable, and it was comparable with previous research (Fredline, 2000). The means identified for each cluster in this analysis were then used as seeds in a non-hierarchical analysis. This allowed reassignment of cases to the cluster to which they were closest. In hierarchical analysis it is possible for cases to become “trapped” because the centroids of the clusters move at each iteration of the analysis, but reallocation is not possible even if a case becomes closer to a different, newly calculated centroid. Non-hierarchical analysis also provides some diagnostic tools to assist in the evaluation of the solution that are unavailable in the hierarchical technique. For example, Table 13 shows the distances between the cluster centroids in the lower half of the matrix (between group variability), and the means of the distances of each case from its cluster centroid (within group variability) on the diagonal. In an ideal cluster solution the between group variability would be greater that the within group variability. Such perfect discrimination cannot be claimed in this case, however, there appears to be an adequate separation of the groups.
Table 13: Comparison of between and within group variability
Cluster Very Negativen=3
Negativen=26
Unconcernedn=141
Positive n=86
Very Positive n=23
Very Negative 5.5 Negative 10.1 5.6
Unconcerned 13.8 5.5 2.6 Positive 16.0 7.6 3.3 4.2
Very Positive 20.7 12.7 9.6 6.7 6.8
The five-cluster solution basically represented a range of reactions to the event, from highly negative to highly positive, with a group in the middle who appeared to be fairly unconcerned about the personal impacts of the event (as is demonstrated by the means in Tables 14 and 15). However, given the small sample size in the clusters identified at the extreme ends of the scale, a decision was made to collapse the two negative groups and the two positive groups, to facilitate statistical comparisons that would not be possible with such small clusters.

Comparison of resident reactions in 1999 with 2002
15
Perceptions of Impact across Clusters Using the single item measure of overall impact (see Table 9), it is interesting to note that, contrary to the pattern observed across the sample as a whole, the negative group rate the impact of the Grand Prix on their personal quality of life as being substantially more detrimental than the effect on the community as a whole. Clearly, their first instinct is to view themselves as being part of a disadvantaged group. However, when asked to consider each potential impact separately, the rating for the community is very similar to the personal rating. For the unconcerned clusters, both measures indicate a propensity to perceive virtually no impact personally, but to feel an overall community level benefit. Similarly, with the positive group, it is clear that while the perception of personal impacts is positive, there is a belief that it is even better for the community as a whole.
Table 14: Comparison of overall perceptions of impact across clusters Collapsed clusters Negative (n=29) Unconcerned (n=141) Positive (n=109) Personal Community Personal Community Personal Community Overall perception of Impact - single item measure -1.38 -0.54 0.01 1.15 1.25 2.13 Overall perception of Impact - multi item measure -0.77 -0.84 0.01 0.23 0.59 0.99
Table 15 compares the specific impact means across the clusters. It can be observed that, on average, the
negative group perceive almost all of these 34 items to be either detrimental to them personally, or to have no substantial impact. However, they do acknowledge some minor benefits to the community at large, including for example, the stimulation of the economy through visitor spending (0.84), employment opportunities (0.73), the number of tourists visiting Melbourne outside of the Grand Prix period (0.64), and opportunities to meet new people (0.57).
On average, the unconcerned group seem to perceive that most of the items have little or no impact on their personal quality of life, the most substantial perceived benefit being increased pride in the city (0.35) and the most substantial cost being traffic congestion (-0.6). However, at the community level, a far greater range of perceptions can be observed. This group perceives substantial benefits to the community in terms of stimulation of the economy (1.34), the showcase effect brought about by media coverage (1.22), opportunities for residents to have fun with family and friends (1.07), enhancement of Victoria’s reputation as “the Events State” (1.06), and employment opportunities (1.06). On the other hand, they can also see substantial negative impacts such as parking availability (-1.32) and traffic congestion (-1.29).
The positive group perceive very few personal negative impacts, with the only negative score of any magnitude being that for traffic congestion (-0.34). Pride (1.51), appearance of the area around the track (1.49), and maintenance of public facilities (1.47), top the list as personal benefits. At the community level, the negative impacts are perceived with slightly more intensity, for example, traffic (-0.77), parking (-0.62), disruption (-0.46), and noise (-0.35). Correspondingly, there are six community level benefits which are perceived very strongly, with means in excess of +2. These are; stimulation of the economy (2.32), maintenance of public facilities (2.19), showcase effect (2.12), enhancement of reputation as “Events State” (2.11), appearance of area around track (2.10), and opportunities to have fun with family and friends (2.04).
Table 15: Comparison of specific perceptions of impact across clusters Collapsed clusters Negative (n=29) Unconcerned (n=141) Positive (n=109) Personal Community Personal Community Personal Community
Appearance of area around track -0.85 -0.88 0.18 0.87 1.49 2.10 Maintenance of public facilities -0.45 -0.15 0.24 0.98 1.47 2.19 Noise levels -1.71 -2.21 -0.16 -0.83 0.00 -0.35 Employment opportunities -0.27 0.73 0.03 1.02 0.50 1.91 Range of interesting things to do -0.32 -0.04 0.16 0.82 1.42 1.98 Number of people in the area around the race track -1.22 -1.48 -0.05 0.05 0.47 1.36
Rowdy and delinquent behaviour -1.26 -1.87 -0.07 -0.39 0.08 0.12 Property values near the track -0.33 -0.80 0.00 0.37 0.48 0.95 Crime levels -1.18 -1.64 -0.07 -0.26 0.18 0.25 Dangerous driving -1.62 -1.90 -0.29 -0.43 0.00 -0.11 Entertainment opportunities -0.70 -0.26 0.18 0.95 1.15 1.87 Prices of some goods and services -1.00 -1.35 -0.17 -0.28 -0.15 -0.13

HOST COMMUNITY PERCEPTIONS - IMPACTS OF FORMULA ONE GRAND PRIX – MELBOURNE
16
Collapsed clusters Negative (n=29) Unconcerned (n=141) Positive (n=109) Personal Community Personal Community Personal Community Pride that Melbourne residents have in their city -0.57 0.00 0.35 0.85 1.51 1.73
Overall cost of living -0.74 -0.83 0.02 -0.01 0.04 0.06 Litter in the vicinity of the track -1.09 -1.95 -0.06 -0.51 0.19 0.06 Damage to the environment -2.00 -2.00 -0.24 -0.57 0.23 0.21 Opportunities to meet new people 0.09 0.57 0.12 0.75 1.01 1.58 Opportunities for local business -0.30 -0.20 0.10 0.89 0.56 1.86 Parking availability near the track -1.78 -2.59 -0.37 -1.32 -0.10 -0.62 Traffic congestion near the track -1.69 -2.28 -0.60 -1.29 -0.34 -0.77 The number of tourists visiting Melbourne at other times of the year -0.50 0.64 0.02 0.82 0.68 1.85
Excessive drinking and/or drug use -0.79 -2.00 -0.06 -0.35 0.02 0.15 Turnover for local businesses -0.80 -0.20 0.12 0.77 0.59 1.85 Number of people moving to Melbourne permanently or buying holiday homes here
-0.30 -0.30 -0.02 0.17 0.30 0.91
Public funding for sport -0.81 -0.81 -0.07 0.13 0.90 1.44 The rights and civil liberties of local residents -1.33 -2.54 -0.11 -0.70 0.04 -0.18
Public transport -0.32 -0.44 0.04 0.45 0.84 1.51 Interactions between locals and tourists -0.54 -1.31 0.00 0.36 0.74 1.48 Facilities available to local residents -1.32 -1.68 0.11 0.28 0.85 1.66 Social and moral values -1.26 -1.39 -0.04 -0.02 0.17 0.43 The media coverage of the event promotes tourism and business development in Melbourne
-0.23 0.23 0.10 1.22 0.93 2.12
The public money spent on the event would be better spent on other things -1.96 -2.12 -0.11 -0.34 -0.03 0.02
The event entertains local residents and gives them an opportunity to attend a major international event
-0.04 0.12 0.07 0.62 1.15 1.58
The event disrupts the lives of local residents and causes them stress -1.26 -2.22 -0.14 -0.83 0.07 -0.46
The theme of the event fits poorly with the culture of Melbourne -1.14 -1.59 -0.01 -0.05 0.05 0.05
Because of the event, the skill base for event management in Melbourne has increased
-0.04 0.60 0.12 0.99 0.74 1.73
The event increases social inequity because it provides benefits to the rich, but none to the poor
-1.26 -2.04 0.04 -0.31 0.09 0.08
The event gives us an opportunity to show other people how special our community is
-0.16 0.16 0.13 0.88 1.08 1.78
The event brings too many people into our community -0.85 -1.00 -0.03 0.05 0.19 0.23
The event enhances Victoria's reputation as "The Events State" -0.04 0.33 0.20 1.06 1.43 2.11
Because of the event, friends come and visit me -0.07 -0.07 0.10 0.16 0.83 0.81
Ordinary residents get no say in the planning and management of the event -1.64 -2.25 -0.01 -0.86 -0.03 -0.18
The event promotes good values 0.04 0.00 0.01 0.24 0.95 1.40 The event provides opportunities for people to have fun with their family and friends
-0.04 0.33 0.22 1.07 1.42 2.04
The money that tourists spend when they come to the event helps to stimulate the economy
0.12 0.84 0.18 1.34 1.14 2.32

Comparison of resident reactions in 1999 with 2002
17
Relationship between cluster membership and first words When the first word data were examined by cluster membership, using Chi-square analysis (χ2
(28) = 254.05, p<0.05), a clear relationship can be observed with regard to some categories. As shown in Table 16, the word categories of “problematic”, “environmental impacts” and “corruption” were used more frequently by negative cluster members. Ambivalent cluster members used the neutral word categories “cars” and “boring” more often, while positive cluster members were most likely to use words in the “excitement” category.
Table 16: Comparison of first word usage across clusters
Negative Ambivalent Positive Total No. of Mentions Noise 28.2% 52.1% 19.7% ↓ 117 Excitement 0.9% ↓ 22.6% ↓ 76.5% ↑ 115 Cars 4.0% ↓ 56.4% ↑ 39.6% 101 Inconvenient 47.7% 34.1% 18.2% ↓ 44 Problematic 74.2% ↑ 25.8% 0% ↓ 31 Benefit 21.4% 35.7% 42.9% 28 Festival 9.5% 28.6% 61.9% 21 Boring 5.3% 94.7% ↑ 0% ↓ 19 Tourist 0% ↓ 50.0% 50.0% 18 Environmental impact 50.0% ↑ 33.3% 16.7% 12 Corruption 80.0% ↑ 20.0% 0% ↓ 10 Location 20.0% 40.0% 40.0% 5 Expensive 40.0% 40.0% 20.0% 5 Enthusiasts 25.0% 50.0% 25.0% 4 Calendar 33.3% 33.3% 33.3% 3
Arrows indicate significant standardised residuals with ↑ indicating a higher than expected frequency and ↓ indicating a lower than expected frequency.
Profiling of clusters As referred to in the review of literature, previous research has identified a number of variables that tend to be associated with varying perceptions of the impacts of tourism and events. Thus, in an effort to test these relationships, and to more fully describe the clusters, a series of Chi-square and One-way ANOVA tests were undertaken and the results of these are summarised below and in Table 17.
Proximity to Track As mentioned in earlier this Chapter, exact address was not collected in the 2002 survey, therefore, the distance from the centre of the track to the centre of the postal district in which each respondent resided was used as a proxy for actual distance. As can be seen in Table 16, although the mean distances vary in a way that would be expected (smallest mean for the negative group and largest mean for the unconcerned group), the difference is not significant.
Contact and Use of Recreational Facilities Those in the unconcerned cluster tend to have less contact with the event zone, with a higher than expected proportion never travelling through this area. Similarly, a large proportion of this group never use Albert Park for recreational purposes.
Grand Prix and other Motorsport Attendance As would be expected, those in the positive cluster are more likely to have attended the Grand Prix, either in 2002 or in previous years, and they are also more frequent attendees at other motorsport events. They are also more likely to indicate an interest in Grand Prix racing (identification with theme).
Involvement in Tourism The Chi-Square test for this variable is significant overall, even though none of the cells have significant residuals when tested independently. The proportions shown in Table 16 indicate that positive cluster members are more likely to have higher levels of involvement in tourism.

HOST COMMUNITY PERCEPTIONS - IMPACTS OF FORMULA ONE GRAND PRIX – MELBOURNE
18
Leisure Activities Respondents were asked to indicate their frequency of involvement in a series of 15 leisure activities on an ordinal level scale ranging from never (0) to several times a week (5). This type of scale was used, rather than an attempt to measure participation using a ratio level variable, because the latter would have been a much more onerous task for respondents. However, in an effort to analysis the data in a more meaningful way, they were recoded to approximate participation scores with the characteristics of ratio level data, as shown in Table 18. The new coding is a crude indicator of the number of times per year in which the activity is participated.
Table 17: Summary of cluster profiles Variable Response Negative
1 Unconcerned
2 Positive
3 Proximity to Track F(2, 271) = 1.36, p>0.05 Mean Distance in km 10.12km 12.07km 11.56km
Travel through Event Zone at least once a week 41.4% 26.4% 47.2% Travel through Event Zone less than once a week 51.7% 49.3% 43.4%
Contact with area around track* χ2
(4) = 17.88, p<0.05 Never travel through Event Zone 6.9% 24.3%↑ 9.4% Use park at least once a week 17.2% 10.1% 23.4% Use park less than once a week 62.1% 45.7% 51.4%
Use of Recreational Facilities* χ2
(4) = 16.07, p<0.05 Never use park 20.7% 44.2%↑ 25.2% Attended this year’s Grand Prix 3.4% 2.9%↓ 25.2%↑ Attended previous Grand Prix events 13.8% 16.4%↓ 40.2%↑
Event Attendance* χ2
(4) = 65.73, p<0.05 Never attended the Grand Prix event 82.8% 80.7%↑ 34.6%↓ Frequent
3.4%
5.8%
15.0%↑
Occasional 31.0% 35.3% 54.2%
Other Motorsport Attendance* χ2
(4) = 24.58, p<0.05 Never 65.5% 59.0% 30.8%↓ Interested in Grand Prix 3.4%↓ 18.6%↓ 47.7%↑ Not particularly interested in Grand Prix 27.6% 41.4% 50.5%
Identification with Theme* χ2
(4) = 78.44, p<0.05 Not at all interested in Grand Prix 69%↑ 40%↑ 1.9%↓ Worked at the Grand Prix or currently work in/own a business perceived to be positively affected by the event
6.9% 16.4% 25.2%
Has at some stage worked in/owned a business perceived to be positively affected by the event 10.3% 5.7% 13.1%
Lives with someone who works in/owns a business perceived to be positively affected by the event
0% 7.9% 7.5%
Involvement in Tourism* χ2
(6) = 14.74, p<0.05
No involvement with a business perceived to be positively affected by the event 82.8% 70% 54.2%
Leisure Activities* F(2, 268) = 24.58, p<0.05 Visit Museum or Art Gallery 11.3823 2.211 2.641
F(2, 268) = 5.92, p<0.05 Visit Natural Area 6.24 3.043 9.292 I love it, I can't think of anywhere else I would rather live 60.71% 49.63% 61.39%
I enjoy living in Melbourne but can think of other places I would enjoy equally 35.71% 46.67% 36.63% Community Attachment
χ2(4) = 3.87, p>0.05
I only live here because of circumstances demand it and would prefer to live somewhere else 3.57% 3.70% 1.98%
Post materialist 55.2%↑ 17% 9.2%↓ Mixed 41.4% 68.1% 66.1%
Socio-Political Values – Materialism* χ2
(4) = 36.98, p<0.05 Materialist 3.4% 14.9% 24.8% Democrats / Greens 39.3% ↑ 17.9% 9.3% Labor 21.4% 30.1% 21.6% Liberal / National 7.1% 35.8% 52.6%↑
Political Self-Identification* χ2
(6) = 28.99, p<0.05 No Political Loyalty 32.1% 16.3% 16.5% Age F(2, 261) = 1.68, p>0.05 Mean age in years 46.25yrs 52.24yrs 50.45yrs
Gender Female 57.1% 40.7% 38.7% χ2
(2) = 3.20, p>0.05 Male 42.9% 59.3% 61.3% No tertiary education 14.3% 34.1% 34.3% Trade qual./Technical College/ TAFE diploma 7.1%↓ 17.8% 35.2%↑ Education*
χ2(4) = 26.69, p<0.05 University education 78.6%↑ 48.1% 30.5%↓
*indicates significant relationship or mean difference where α=0.05 Subscripts denotes a significant difference from the group with the designated number

Comparison of resident reactions in 1999 with 2002
19
Table 18: Recode of leisure activity participation variables Variable Level Original
coding New
coding Never 0 0 Once a year or less often 1 1 Several times a year 2 2 Less than once a week but usually at least once a month 3 12 About once a week 4 52 Several times a week 5 104
The mean participation rates for these recoded variables were then compared across clusters to examine
variations in leisure preferences. As shown in Table 17, differences were only observed with regard to visits to museums and art galleries, with negative cluster members visiting these attractions far more frequently than members of the other two groups. Additionally, positive cluster members were observed to visit natural areas more often than those in the unconcerned group.
Community Attachment Community attachment was operationalised in three ways, place of birth, years of residence, and through a single item measure with three levels, as shown in Table 17. None of these variables had a significant relationship with cluster membership.
Socio-Political Values Inglehart’s materialist / post-materialist value scale was used as an indicator of socio-political values, along with a question which simply asked respondent to identify the political party with which they most identified. These two variables are understandably highly inter-related. As shown in Table 17, negative cluster members were much more likely to have primarily post-materialist values and to identify with the Democrats or the Green Party. In contrast, the positive group was more likely to identify with coalition parties and tended towards more materialist values.
Demographic Variables No significant relationships were observed between cluster membership and age or gender. However, education level appeared to have some association with perceptions of event impacts. Those in the negative cluster were much more likely to have a university level education, while those in the positive group had higher incidences of trade qualifications or technical college / TAFE diplomas.
Comparison of Future Preferences and Other Events across Clusters With regard to preferences for the future of the event, as would be expected, the positive group are much more likely to support continuation of the Grand Prix in its current location, whereas the majority of the negative cluster would prefer discontinuation, as shown in Table 19.
Table 19: Preferences for future of Grand Prix
χ2(4) = 60.67, p<0.05 Negative
1 Unconcerned
2 Positive
3 Discontinue 72.4%↑ 22.1% 10.3%↓ Continue in another location 6.9% 14.0% 3.7% Continue in current location 20.7%↓ 64.0% 86.0%↑
In the comparison of perceived impacts of different types of event, some interesting differences can be
observed, as shown in Table 20. The only negative scores for any of the events listed are for the Grand Prix, and these are the ratings of the negative cluster. As with the single item overall score presented earlier (Table 14), this group seem to perceive that this event has a more negative impact on them personally than it has for the community as a whole. This is in contrast to their perception of the impacts of all the other events, and the perceptions of all other groups with regard to all events. There is a general pattern of positive cluster members being more positive toward events in overall, but they do not have the highest ratings of benefit for all events. Additionally, the relative ranking of the events varies substantially across the groups. The negative group ranked the Melbourne Festival as having the most substantial personal benefit, but at the community level, both the Australian Open Tennis and the International Comedy Festival were rated as provided positive benefits by all

HOST COMMUNITY PERCEPTIONS - IMPACTS OF FORMULA ONE GRAND PRIX – MELBOURNE
20
respondents. The unconcerned group also rated the Grand Prix as the lowest in terms of its personal and community wide benefit. At both the personal and community level they rated the AFL Final Series and the Australian Open Tennis as being highly beneficial. These two events were also rated very highly by the positive cluster, however, as would be expected, this group also rated the Grand Prix as having substantial benefits at both the personal and community levels.
Table 20: Rating of personal and community level benefits of events across clusters Personal Impact Community Impact
Negative Unconcerned Positive Negative Unconcerned Positive Australian Open Tennis Championships 0.48 (5) 0.46 (2) 0.75 (1) 1.00 (1) 0.98 (1) 0.96 (2) Australian Formula One Grand Prix -0.78 (9) 0.06 (9) 0.73 (2) -0.46 (9) 0.63 (9) 0.96 (2) Melbourne Moomba Festival 0.45 (6) 0.28 (7) 0.46 (7) 0.77 (7) 0.82 (7) 0.86 (6) Melbourne Food and Wine Festival 0.59 (3) 0.31(4) 0.45 (8) 0.85 (5) 0.84 (6) 0.86 (6) Melbourne International Comedy Festival 0.64 (2) 0.26 (8) 0.41 (9) 1.00(1) 0.82 (7) 0.83 (9) Melbourne International Flower and Garden Show 0.5 (4) 0.4 (3) 0.5 (5) 0.88 (4) 0.89 (3) 0.86 (6) Australian Football League (AFL) Finals Series 0.36 (7) 0.53 (1) 0.68 (3) 0.8 (6) 0.93 (2) 0.98 (1) Spring Racing Carnival 0.14 (8) 0.31(4) 0.62 (4) 0.52 (8) 0.89 (3) 0.94 (4) Melbourne Festival 0.67 (1) 0.29 (6) 0.48 (6) 0.96 (3) 0.87 (5) 0.89 (5) Average Rating of Events 0.34 0.32 0.56 0.70 0.85 0.90
Comparison of Cluster Membership over Time Given the changes over time referred to earlier this Chapter, it is interesting to compare the relative sizes of the clusters observed in the two samples. Table 21 compares the proportions observed in each cluster in each survey and it can be seen that the proportion in the negative group has declined over time. These proportions have been weighted to compensate for the disproportionate sampling used in 1999. Additionally, it must be noted that the cluster membership being compared here is based on two separate analyses. This pattern seems logical given the observed reduction in perception of specific negative impacts as highlighted in Table 11. However, all of these changes should be considered in light of the potential effects of the non-response bias, as described in Chapter 3.
Table 21: Comparison of cluster membership over time
χ2(2) = 14.40, p<0.05 Negative
1 Unconcerned
2 Positive
3 2002 9.94%↓ 50.88% 39.18% 1999 21.36%↑ 41.26% 37.38%

Comparison of resident reactions in 1999 with 2002
21
Chapter 5
Conclusion
Summary This report has presented some of the results from a study investigating the perceptions of local residents with regard to the impacts of events on their quality of life. More specifically, this report details a comparison between data collected at the Australian Formula One Grand Prix in Melbourne in 1999 and 2002, with the aim of investigating changes over time.
A high level of support for the Grand Prix exists within the community with 68% of residents in favour of the continuation of the event in its current location and an additional 9.2% in favour of continuation but in a different location in 2002. This result has been fairly stable over time with the proportions being 67% and 8% respectively in 1999.
However, the rating of many of the benefits and costs of the events has lessened over time with a clearly observable trend toward ratings of lower impact with regard to both positive and negative issues. It may therefore seem logical to conclude that because of acclimatisation and adaptation of local residents to the impacts of the event, the actual and / or perceived impact on quality of life is lower. However, the subjective nature of the scale may also be a factor, and future research should investigate the development of more objective anchors to contextualise the results of this type of research.
It is interesting to note though, that not all impacts have been perceived to have tended toward the mid point. A few positive impacts, including pride in the city, turnover for local business, and stimulation of the economy through visitor spending, have been increasingly perceived to improve quality of life at a personal level.
Recommendations for Planning and Management The Australian Grand Prix has been a controversial event within the suite of events supported by the Victorian Government. Over time, there appears to have been some acceptance by its detractors of the role the event can play in promoting Melbourne, Victoria and Australia as a desirable destination. Issues such as the level of noise appear to be less of a problem to those surveyed in the earlier study. This may, however, illustrate that residents have adapted to the event – anecdotally, it is well known that many residents close to the race circuit move out of the area over the race period and are therefore not exposed to the event. Tourism planners can use this behaviour to promote other areas. For example, special tourism packages to explore country Victorian regions could target those who are antagonistic to the event and, at the same time, promote tourism yield within regional areas.
The key groups for managers and planners of this event to target are those who are clearly in the negative cluster. The following recommendations focus specifically on members of this negative group, particularly where the results are statistically significant.
Concessions to those respondents in the post-materialist category would foster more positive attitudes towards the event. For example, some financial sponsorship of a community organization - preferably local - by the event organisers may assist in overcoming the opposition to the event. Evidence of corporate organisations being socially responsible is increasing important these days;
Development towards a “green” grand prix may win over those negative attitudes within the Greens/Democrat category. Again, the image, and practice, of a socially and environmentally responsible organization would decrease the level of opposition to the event.
If opposition to this event is to decrease further, it would be important for the event organisers to target the “unconcerned” respondents. These respondents could be persuaded of the economic and destination image benefits to the community as a whole. This may then move this “unconcerned” group into the positive attitude group. Research into the positive benefits for the community is recommended, as is the promotion of such benefits.
The research undertaken here provides a method of understanding the shifts in attitudes that occur within community groups over time. It is important to continue to monitor these attitudes and changes in attitude for other event planners to take into account.
Limitations The poor response rate in the 2002 data collection phase is of concern because of non-response bias and the potential for non-response to be related to specific representations of the impact of the event. As outlined in Chapter 4, there are some demographic groups within the population who are under-represented in the sample, and this should be taken into account in the interpretation of the results. However, even if the proportion of

HOST COMMUNITY PERCEPTIONS - IMPACTS OF FORMULA ONE GRAND PRIX – MELBOURNE
22
residents identified in the cluster analysis (reported in Chapter 4) are not correct, there is reason to believe that the range of reactions has been appropriately identified.
Future Research Directions Future research should seek to include a greater range of cases (events of different types and in different locations) in an effort to reinforce the findings of this study. An excellent opportunity would be to collect data at the Gold Coat Indy, as existing data were collected using similar methods in 1998.
Additionally, as mentioned in earlier this Chapter, efforts to identify an appropriate mechanism for anchoring the results of this type of research in a more objective manner would be useful. Possible options for this include contingent valuation and choice modelling.
Finally, it would be of value to consider the evaluation of the social impacts of event within a framework that seeks to evaluate the impacts of events more holistically. That is, a framework that aims to identify the costs and benefits of events in terms of a triple bottom line reporting approach with additional consideration of long term impacts. In this way, governments and funding agencies could identify which events are most beneficial for the community in an overall sense.

Comparison of resident reactions in 1999 with 2002
23
APPENDIX A: COMPARISON OF EFFECT OF DIFFERENT WEIGHTING METHODS ON MEAN PERSONAL IMPACT SCORES
2002 1999
Weighting Method 1 Based on
proportions in CENSUS96
Weighting Method 2 Based on
Proportions in 2002 survey
Weighting Method 1 Based on
proportions in CENSUS96
Weighting Method 2 Based on
Proportions in 2002 survey
Impact 2002 1999 2002 1999 Appearance 0.60 0.62 0.75 0.77 Maintenance 0.71 0.72 0.97 0.99 Noise -0.22 -0.25 -0.62 -0.60 Employment 0.25 0.21 0.27 0.27 Interesting 0.66 0.63 0.67 0.70 Crowded 0.07 0.04 -0.44 -0.41 Property values 0.19 0.17 -0.01 0.00 Litter -0.03 -0.05 -0.38 -0.39 Interactions 0.34 0.30 0.26 0.30 Entertainment 0.57 0.53 0.61 0.65 Prices -0.24 -0.23 -0.39 -0.40 Crime -0.01 -0.05 -0.10 -0.09 Pride 0.77 0.76 0.47 0.50 Dangerous driving -0.29 -0.30 -0.54 -0.54 Drinking and/or rowdy behaviour n/a n/a -0.48 -0.48 Rowdy and delinquent behaviour -0.15 -0.15 n/a n/a Excessive drinking and/or drug use -0.07 -0.09 n/a n/a Damage to the environment -0.20 -0.24 -0.66 -0.64 Facilities 0.29 0.29 0.30 0.32 Meet new people 0.52 0.49 0.64 0.69 Local business 0.30 0.27 0.15 0.18 Parking -0.37 -0.40 -0.53 -0.52 Traffic -0.56 -0.61 -0.99 -0.95 Rights -0.18 -0.18 -0.50 -0.48 Turnover 0.30 0.26 0.07 0.08 Promotes tourism 0.41 0.41 0.74 0.77 Public money -0.26 -0.26 -0.65 -0.63 International event 0.53 0.52 0.45 0.46 Disrupts -0.14 -0.17 -0.55 -0.55 Theme -0.08 -0.08 -0.30 -0.29 Planning -0.21 -0.22 -0.71 -0.68 Economy 0.59 0.57 0.39 0.41 People -0.01 -0.01 0.00 0.01 Showcase effect 0.52 0.49 0.69 0.71

HOST COMMUNITY PERCEPTIONS - IMPACTS OF FORMULA ONE GRAND PRIX – MELBOURNE
24
REFERENCES Australian Bureau of Statistics (2002) Victoria: 2001 Census Basic Community Profile and Snapshot. ABS:
Canberra Butler, R. W. (1980) The Concept of a Tourist Area Cycle of Evolution: Implications for Management of
Resources. Canadian Geographer, 24(1), pp. 5-12. Doxey, G. V. (1975) A Causation Theory of Visitor Resident Irritants: Methodology and Research Inferences.
Travel and Tourism Research Association Sixth Annual Conference Proceedings (pp. 195-198). Fredline, E. (2000). Host Community Reactions to Major Sporting Events: The Gold Coast Indy and the
Australian Formula One Grand Prix in Melbourne. PhD thesis, Griffith University. Fredline, E., and Faulkner, B. (2000) Host Community Reactions: A Cluster Analysis, Annals of Tourism
Research, 27(3), pp. 763-784. Fredline, E., and Faulkner, B. (2002a) Residents' Reactions to the Staging of Major Motorsport Events Within
Their Communities: A Cluster Analysis. Event Management, 7(2), pp. 103-114. Fredline, E., and Faulkner, B. (2002b) Variations in Residents' Reactions to Major Motorsport Events: Why
Residents Perceive the Impacts of Event Differently. Event Management, 7(2), pp. 115-126. Mihalik, B. J., and Simonetta, L. (1999). A Midterm Assessment of the Host Population's Perceptions of the
1996 Summer Olympics: Support, Attendance, Benefits, and Liabilities. Journal of Travel Research, 37(3), pp. 244-248.
Mowen, J. C., and Mowen, M. M. (1991) Time and Outcome Valuation: Implications for Marketing Decision Making. Journal of Marketing, 55, pp. 54-62.
Ritchie, J. R. B., and Aitken, C. E. (1984) Assessing the Impacts of the 1988 Olympic Winter Games: The Research Program and Initial Results. Journal of Travel Research, 22(3), pp. 17-25.
Ritchie, J. R. B., and Aitken, C. E. (1985) OLYMPULSE II - Evolving Resident Attitudes Towards the 1988 Olympic Winter Games. Journal of Travel Research, 23(3), pp. 28-33.
Ritchie, J. R.B., and Lyons, M. M. (1987) OLYMPULSE III / IV: A Midterm Report on Resident Attitudes Concerning the 1988 Olympic Winter Games. Journal of Travel Research, 26(1), pp. 18-26.
Ritchie, J. R. B., and Lyons, M. M. (1990) OLYMPULSE VI: A Post Event Assessment of Resident Reaction to the XV Olympic Winter Games. Journal of Travel Research, 28(3), pp. 14-23.
Ritchie, J. R. B., and Smith, B. H. (1991) The Impact of a Mega-Event on Host Region Awareness: A Longitudinal Study. Journal of Travel Research, 30(1), pp. 3-10.
Soutar, G., and McLeod, P. B. (1989). The Impacts of America’s Cup on Fremantle Residents: Some Empirical Evidence, in G.J. Syme, B.J. Shaw, D.M. Fenton, & W.S. Mueller (Eds). The Planning and Evaluation of Hallmark Events. Aldershot, Avebury. pp. 92-102
Soutar, G., and McLeod, P. B. (1993). Residents’ perceptions on impact of the America’s Cup. Annals of Tourism Research, 20(3), pp. 571-82.

Comparison of resident reactions in 1999 with 2002
AUTHORS Dr Liz Fredline Liz Fredline is a Senior Research Fellow at RMIT University and specialises event impact research, including both tourism and business events. She is also keenly interested in research methodology and quantitative analysis. Dr Fredline was the chief statistician for the National Business Events Study. Email: [email protected] Dr Margaret Deery Margaret Deery is an Associate Professor and Director of the Centre for Hospitality and Tourism Research at Victoria University. She has worked in tourism research and education for the last fourteen years on a number of projects ranging from the social impacts of tourism on communities to the role of turnover culture on employee behaviour in tourism organizations. She has project managed many tourism research studies and has published widely from these projects. Associate Professor Deery was the project leader for the National Business Events Study. Email: [email protected]
Prof Leo Jago Leo Jago is the Deputy CEO and Director of Research for the Sustainable Tourism CRC and a Professor in tourism at Victoria University. Much of Leo's research over the last ten years has focussed on business and tourism events. He has undertaken many studies into the economic, social and branding impacts of events on communities as well as exploring the behaviour of attendees. Professor Jago is the international Chair of the Academic Council of DOME (Data on Meetings and Events). Email: [email protected]
25

CAIRNSNQ CoordinatorProf Bruce PrideauxPh: +61 7 4042 [email protected]
DARWINNT CoordinatorMs Alicia BoylePh: + 61 8 8946 [email protected] GOLD COAST
National Network ManagerMr Brad CoxPh: +61 7 5552 [email protected]
BRISBANETourism Infrastructure andEngineering EnvironmentsResearchDr David LockingtonPh: +61 7 3365 [email protected]
LISMORERegional TourismResearchMr Dean CarsonPh: +61 2 6620 [email protected]
SYDNEYNSW CoordinatorDr Tony GriffinPh: +61 2 9514 [email protected]
MELBOURNEVIC CoordinatorProf Betty WeilerPh: +61 3 9904 [email protected]
LAUNCESTONTAS CoordinatorProf Trevor SofieldPh: + 61 3 6324 [email protected]
CANBERRAACT CoordinatorDr Brent RitchiePh: +61 2 6201 [email protected]
PERTHWA CoordinatorDr Diane LeePh: + 61 8 9360 [email protected]
ADELAIDESA CoordinatorProf Graham BrownPh: +61 8 8302 [email protected]
NATIONAL NETWORK
CRC for Sustainable Tourism Pty Ltd
[ABN 53 077 407 286]
PMB 50
GOLD COAST MC QLD 9726
AUSTRALIA
Telephone: +61 7 5552 8172
Facsimile: +61 7 5552 8171
Email: [email protected]
http://www.crctourism.com.au