host country attractiveness for cdm non-sink...
TRANSCRIPT

Host countryattractiveness forCDM non-sinkprojects
Martina Jung
HWWA DISCUSSION PAPER
312Hamburgisches Welt-Wirtschafts-Archiv (HWWA)
Hamburg Institute of International Economics2005
ISSN 1616-4814
Hamburgisches Welt-Wirtschafts-Archiv (HWWA)Hamburg Institute of International EconomicsNeuer Jungfernstieg 21 – 20347 Hamburg, GermanyTelefon: 040/428 34 355Telefax: 040/428 34 451e-mail: [email protected]: http://www.hwwa.de
The HWWA is a member of:
• Wissenschaftsgemeinschaft Gottfried Wilhelm Leibniz (WGL)• Arbeitsgemeinschaft deutscher wirtschaftswissenschaftlicher Forschungsinstitute
(ARGE)• Association d’Instituts Européens de Conjoncture Economique (AIECE)
HWWA Discussion Paper
Host country attractiveness forCDM non-sink projects
Martina Jung
HWWA Discussion Paper 312http://www.hwwa.de
Hamburg Institute of International Economics (HWWA)Neuer Jungfernstieg 21 – 20347 Hamburg, Germany
e-mail: [email protected]
This paper was prepared within the HWWA Research Programme „InternationalClimate Policy“.
I would like to thank Achim Mucha and my colleagues at the HWWA for helpfulcomments and discussions on the paper. The International Max Planck ResearchSchool of Earth System Modelling provided financial support. All errors and opinionsare mine.
Edited by the Department World Economy

HWWA DISCUSSION PAPER 312March 2005
Host country attractiveness forCDM non-sink projects
ABSTRACT
In the present study, CDM host countries are classified according to their attractivenessfor CDM non-sink projects. A cluster analysis is conducted based on three differentfactors determining host country attractiveness (mitigation potential, institutional CDMcapacity and general investment climate) in order to elaborate a CDM host countryclassification. The results suggest that only a small proportion of potential hostcountries will attract most of the CDM investment. The CDM (non-sink) stars areChina, India, Brazil, Argentina, Mexico, South Africa, Indonesia and Thailand. Theyare followed by attractive countries like Costa Rica, Trinidad and Tobago, Mongolia,Panama, and Chile. While most of the promising CDM host countries are located inLatin America and Asia, the general attractiveness of African host countries is relativelylow (with the exception of South Africa). Policy implications of this rather inequitablegeographical distribution of CDM project activities are discussed briefly.
Keywords: Clean development mechanism, Kyoto Protocol, attractiveness, cluster analysis
JEL-Classifications: Q25, C49
Martina JungHamburg Institute of International Economics (HWWA)Neuer Jungfernstieg 2120347 HamburgPhone: +49 40 42834 434E-mail: [email protected]

3
Introduction
The Kyoto Protocol which sets legally binding emission reduction targets for the so-called
Annex-I countries1 (mainly industrialized countries and countries with economies in
transition) includes the flexible mechanisms emissions trading, Joint Implementation (JI), and
the Clean Development Mechanism (CDM). The latter allows Annex-I countries to use
credits generated by emission reduction (or carbon sequestration) projects in developing
countries for compliance. However, the CDM is not only supposed to assist countries with
emission reduction commitments under the Kyoto Protocol in achieving their GHG targets,
but also to contribute towards sustainable development in the host countries. Annex-I
countries can provide financing for CDM projects either via equity investment (co-)financing
the emission reduction project, via forward purchases or by buying the already produced
“certified emission reduction” (CER) on the secondary market.2 According to a recent
decision of the Executive Board, CERs can also be created by unilateral CDM projects.3 After
the main rules governing the CDM were decided at the Seventh Session of the Conference of
the Parties (COP 7) in 2001, a process of refinement of implementation modalities and the
development of the necessary infrastructure for the complex CDM project cycle began. While
the overall contribution of CDM in the compliance of Annex-I countries will depend on a
variety of different factors outside the influence of host countries, the distribution of the CDM
investment does and will depend mainly on the attractiveness of host countries for CDM.4
Against the background of the Kyoto Protocol entering into force in February 2005, and the
kick-off of the CDM market, the question arises how CDM investment flows will be
distributed between the competing potential host countries. This is especially relevant, since
Decision 17/CP.7 of the Marrakech Accords emphasizes the importance of an “equitable
geographic distribution of clean development mechanism project activities at regional and sub
regional levels” (UNFCCC 2001).
When looking for factors influencing the direction of CDM investment flows, the literature
does not provide a satisfying answer. Often, one will find the simplistic assumption, that
1 The term Annex-I country is often used to refer to the countries with emission targets under the KyotoProtocol. This is, however, not exact. Annex I refers to the UNFCCC. Parties with emission reduction targets arelisted in Annex B of the Kyoto Protocol, therefore labeled Annex-B countries. Only two countries (Turkey andBelarus) are Annex-I countries, but are not listed in Annex B.2 See also Arquit Niederberger and Saner (2005)3 For a detailed study on unilateral CDM , see Jahn et al. (2004)4 This is true for almost all of the forms of CDM investment, however, not for the unilateral CDM. Whileforward purchase agreements allow buyers to reduce the risks involved in a concrete CDM project, the risk ofCER accrual remains. Here country risks play an important role.

4
CDM flows will mainly follow the pattern of foreign direct investment (FDI) flows. Arquit
Niederberger and Saner (2005) criticize this assumption and clarify CDM-related
determinants of FDI flows. Fankhauser and Lavric (2003) study the attractiveness of JI host
countries, and identify three factors determining the attractiveness of a JI host country:
- the scope for cheap emission reductions,
- the institutional capacity of a host country to process JI deals, and
- the general investment climate.
These factors apply to CDM5 investment as well as for JI and are used in the following as a
basis for defining the attractiveness of CDM host countries for non-sink projects.6
While the simplistic assumption that CDM follows FDI flows only considers the last of these
three factors, I use the explorative tool of cluster analysis to classify CDM host countries by
using information on all three factors. Cluster analysis is a multivariate statistical procedure
that identifies relatively homogenous groups of elements in a given data set. It has to be
emphasized, though, that cluster analysis is an explorative tool, based on different plausible
algorithms.7 It is therefore useful for developing a first classification or investigating a
conceptual scheme for grouping elements, which can help to improve the understanding of the
respective issue (Aldenderfer and Blashfeld 1984, Bacher 2002, Mucha 1992).
The host country classification based on their attractiveness for CDM non-sink projects
provides a first picture of what the distribution of CDM flows might look like in a mature
CDM market. While the present study is concerned with a more general picture, host country
ratings (for example the one by Point Carbon8) are much more detailed, but focussed on a
smaller set of countries. Therefore, both can be seen as complementary approaches in
explaining CDM host country attractiveness.
Indicators for host country attractiveness
For using the three factors emission reduction potential, institutional CDM capacity and
general investment climate in the cluster analysis, appropriate indicators have to be identified.
114 host countries for which the respective data was available are included in the analysis.
5 A survey conducted by Point Carbon (2002) identifies a supportive CDM approval system as well as theinvestment climate as the most important factors influencing CDM investment.6 We are limiting our analysis to non-sink projects, since the CDM forestry potential is quite different from theemission reduction potential in the non-sink sector. Furthermore, data on potentials for CDM forestry projects issubject to rather high uncertainties.7 The software package CLUSTAN is used for the analysis.8 For details see: http://www.pointcarbon.com/category.php?categoryID=723

5
The indicators used in this analysis are summarized in Table 1 below. While Fankhauser and
Lavric (2003) use expected carbon emissions per GDP as a measure of a countries´ emission
reduction potential, I argue that the expected absolute greenhouse gas emissions (GHG) are a
better indicator. First, the absolute value of emissions is more appropriate because the
indicator emission intensity (e.g. CO2 emissions/GDP) is not comparable due to its complex
formation and the different factors influencing the level of this indicator (Sun 2000).
Secondly, only focussing on CO2 is not sufficient to reflect the wide range of greenhouse gas
emission reduction options eligible under the CDM; currently most of the CDM projects
actually reduce non-CO2 gases.9 Thus, data on GHG emissions in 2001, taken from the
Climate Analysis Indicators Tool - CAIT - (WRI 2003) serve as an indicator for emission
reduction potential in CDM host countries.
Until emission reduction credits can be generated by a CDM project, projects have to pass a
relatively complex project cycle. As prerequisites for a CDM project to be submitted to the
Executive Board, the country has to have ratified the Kyoto Protocol and is obliged to have a
Designated National Authority (DNA) operating. The latter has to approve the CDM project
activity and confirm that it is complying with the national definition of sustainability. For
setting-up a well-functioning and efficient DNA, there is a need for expert knowledge inside
the government on rules and modalities governing the CDM.10 It can be assumed that those
countries which participated in the AIJ pilot phase (Activities Implemented Jointly), and
completed a National Strategy Study analyzing their CDM potential will be able to profit
from the experiences and knowledge gained. Therefore, the indicators ratification of the
Kyoto Protocol11, participation in the AIJ pilot phase, timely establishment of a Designed
National Authority (DNA)12 as well as completion of a National Strategy Study (NSS)13 form
an index representing the institutional CDM capacity of a CDM host country14.
As an indicator for the general investment climate, I create an index based on the World
Governance Research Indicators Dataset15 (World Bank 2004), using the dimensions of
political stability, regulatory quality and rule of law.16
9 Of the projects available for validation comments on the UNFCCC CDM website by Feb. 10 2005, 84% ofestimated CERs come from non-CO2 gases.10 Michaelowa (2003) deals with the tasks of host countries in the CDM project cycle, and highlights theimportance of effective host country institutions for reaping benefits from the CDM market. Willems (2004)deals with the role of the institutional capacity in selecting climate actions in general.11 As of 5 October 2004 (www.unfccc.int)12 Defined as DNA operating by 4 November 2004.13 As of November 2004.14 Countries for which none of these criteria apply, will therefore have a minimum value of zero, the ones forwhich all of them apply a maximum value of 4.15 For details on the Governance Indicators see Kaufmann et al. (1999a), Kaufmann et al. (1999b), Kaufmann etal. (2003) as well as the website at: http://www.worldbank.org/wbi/governance/govdata2002/index.html.
6
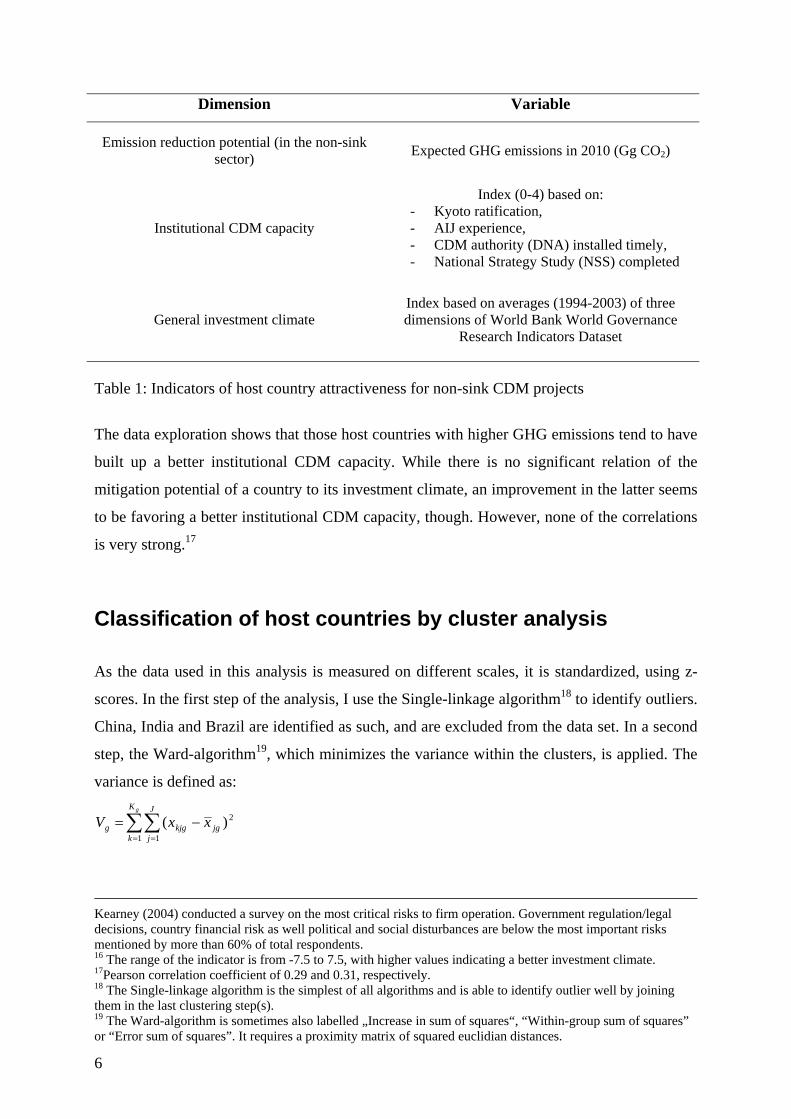
Dimension Variable
Emission reduction potential (in the non-sinksector) Expected GHG emissions in 2010 (Gg CO2)
Institutional CDM capacity
Index (0-4) based on:- Kyoto ratification,- AIJ experience,- CDM authority (DNA) installed timely,- National Strategy Study (NSS) completed
General investment climateIndex based on averages (1994-2003) of threedimensions of World Bank World Governance
Research Indicators Dataset
Table 1: Indicators of host country attractiveness for non-sink CDM projects
The data exploration shows that those host countries with higher GHG emissions tend to have
built up a better institutional CDM capacity. While there is no significant relation of the
mitigation potential of a country to its investment climate, an improvement in the latter seems
to be favoring a better institutional CDM capacity, though. However, none of the correlations
is very strong.17
Classification of host countries by cluster analysis
As the data used in this analysis is measured on different scales, it is standardized, using z-
scores. In the first step of the analysis, I use the Single-linkage algorithm18 to identify outliers.
China, India and Brazil are identified as such, and are excluded from the data set. In a second
step, the Ward-algorithm19, which minimizes the variance within the clusters, is applied. The
variance is defined as:
∑∑= =
−=gK
k
J
jjgkjgg xxV
1 1
2)(
Kearney (2004) conducted a survey on the most critical risks to firm operation. Government regulation/legaldecisions, country financial risk as well political and social disturbances are below the most important risksmentioned by more than 60% of total respondents.16 The range of the indicator is from -7.5 to 7.5, with higher values indicating a better investment climate.17Pearson correlation coefficient of 0.29 and 0.31, respectively.18 The Single-linkage algorithm is the simplest of all algorithms and is able to identify outlier well by joiningthem in the last clustering step(s).19 The Ward-algorithm is sometimes also labelled „Increase in sum of squares“, “Within-group sum of squares”or “Error sum of squares”. It requires a proximity matrix of squared euclidian distances.
7
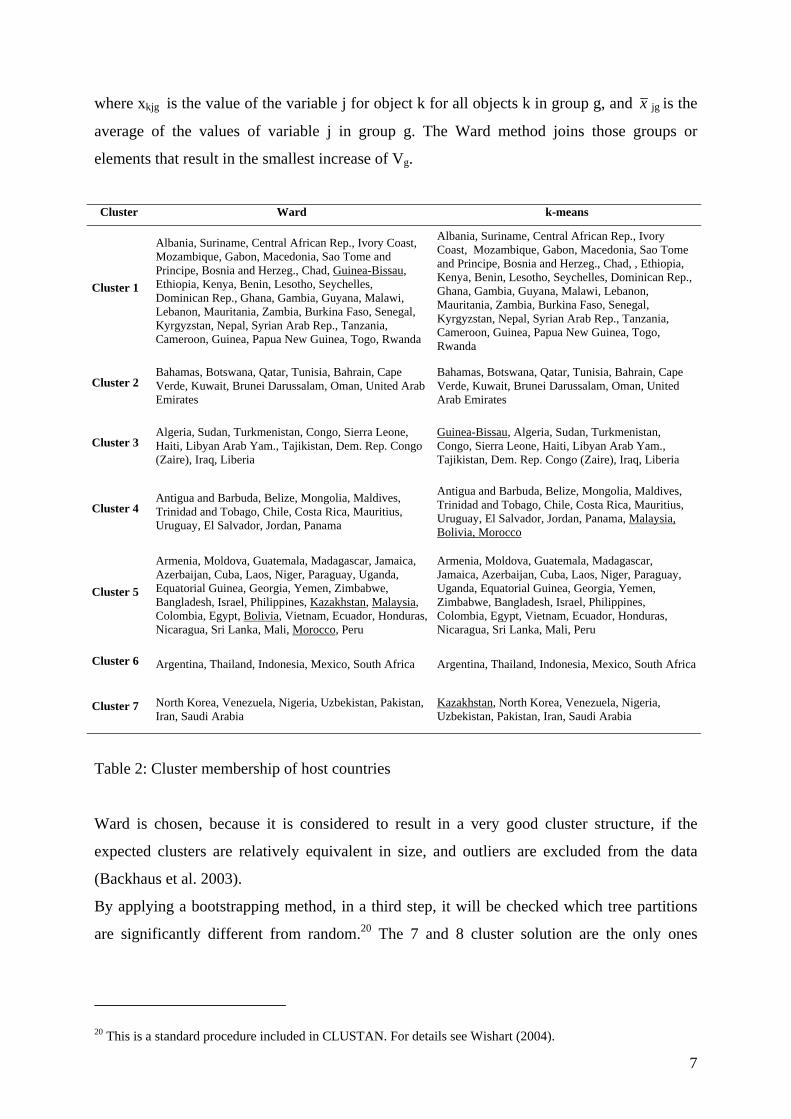
where xkjg is the value of the variable j for object k for all objects k in group g, and x jg is the
average of the values of variable j in group g. The Ward method joins those groups or
elements that result in the smallest increase of Vg.
Cluster Ward k-means
Cluster 1
Albania, Suriname, Central African Rep., Ivory Coast,Mozambique, Gabon, Macedonia, Sao Tome andPrincipe, Bosnia and Herzeg., Chad, Guinea-Bissau,Ethiopia, Kenya, Benin, Lesotho, Seychelles,Dominican Rep., Ghana, Gambia, Guyana, Malawi,Lebanon, Mauritania, Zambia, Burkina Faso, Senegal,Kyrgyzstan, Nepal, Syrian Arab Rep., Tanzania,Cameroon, Guinea, Papua New Guinea, Togo, Rwanda
Albania, Suriname, Central African Rep., IvoryCoast, Mozambique, Gabon, Macedonia, Sao Tomeand Principe, Bosnia and Herzeg., Chad, , Ethiopia,Kenya, Benin, Lesotho, Seychelles, Dominican Rep.,Ghana, Gambia, Guyana, Malawi, Lebanon,Mauritania, Zambia, Burkina Faso, Senegal,Kyrgyzstan, Nepal, Syrian Arab Rep., Tanzania,Cameroon, Guinea, Papua New Guinea, Togo,Rwanda
Cluster 2Bahamas, Botswana, Qatar, Tunisia, Bahrain, CapeVerde, Kuwait, Brunei Darussalam, Oman, United ArabEmirates
Bahamas, Botswana, Qatar, Tunisia, Bahrain, CapeVerde, Kuwait, Brunei Darussalam, Oman, UnitedArab Emirates
Cluster 3Algeria, Sudan, Turkmenistan, Congo, Sierra Leone,Haiti, Libyan Arab Yam., Tajikistan, Dem. Rep. Congo(Zaire), Iraq, Liberia
Guinea-Bissau, Algeria, Sudan, Turkmenistan,Congo, Sierra Leone, Haiti, Libyan Arab Yam.,Tajikistan, Dem. Rep. Congo (Zaire), Iraq, Liberia
Cluster 4Antigua and Barbuda, Belize, Mongolia, Maldives,Trinidad and Tobago, Chile, Costa Rica, Mauritius,Uruguay, El Salvador, Jordan, Panama
Antigua and Barbuda, Belize, Mongolia, Maldives,Trinidad and Tobago, Chile, Costa Rica, Mauritius,Uruguay, El Salvador, Jordan, Panama, Malaysia,Bolivia, Morocco
Cluster 5
Armenia, Moldova, Guatemala, Madagascar, Jamaica,Azerbaijan, Cuba, Laos, Niger, Paraguay, Uganda,Equatorial Guinea, Georgia, Yemen, Zimbabwe,Bangladesh, Israel, Philippines, Kazakhstan, Malaysia,Colombia, Egypt, Bolivia, Vietnam, Ecuador, Honduras,Nicaragua, Sri Lanka, Mali, Morocco, Peru
Armenia, Moldova, Guatemala, Madagascar,Jamaica, Azerbaijan, Cuba, Laos, Niger, Paraguay,Uganda, Equatorial Guinea, Georgia, Yemen,Zimbabwe, Bangladesh, Israel, Philippines,Colombia, Egypt, Vietnam, Ecuador, Honduras,Nicaragua, Sri Lanka, Mali, Peru
Cluster 6 Argentina, Thailand, Indonesia, Mexico, South Africa Argentina, Thailand, Indonesia, Mexico, South Africa
Cluster 7 North Korea, Venezuela, Nigeria, Uzbekistan, Pakistan,Iran, Saudi Arabia
Kazakhstan, North Korea, Venezuela, Nigeria,Uzbekistan, Pakistan, Iran, Saudi Arabia
Table 2: Cluster membership of host countries
Ward is chosen, because it is considered to result in a very good cluster structure, if the
expected clusters are relatively equivalent in size, and outliers are excluded from the data
(Backhaus et al. 2003).
By applying a bootstrapping method, in a third step, it will be checked which tree partitions
are significantly different from random.20 The 7 and 8 cluster solution are the only ones
20 This is a standard procedure included in CLUSTAN. For details see Wishart (2004).

8
deviating significantly from randomness. The 7 cluster solution of the Ward method21 is used
as the starting partition for a cluster analysis using the k-means method.22 Contrary to
hierarchical clustering methods as Ward, k-means belongs to the partitioning cluster methods
which sort the cases in a series of iterations until converging to a stable partition of k clusters.
The comparison of cases in the k-means method is based on the squared euclidian distance of
the case to the cluster centers. If a case is found to be nearer to a cluster it is not part of, it will
be moved to this cluster, until all the cases are in their nearest cluster. As k-means is able to
identify very good cluster structure if a good starting partition and the cluster number are
known, it can be used to “calibrate” the results of the Ward method.
Table 2 summarizes the cluster memberships of host countries for the Ward and the k-means
method. Host countries which were moved to other clusters by the k-means method are
underlined.
The last step of the cluster analysis is the most challenging one, namely the interpretation of
the clusters found. In the following, I will only look at the results obtained by the k-means
method. Analyzing cluster centers, shown in Table 3, gives a first impression of the main
characteristics of each group.
CDMcapacity
Mitigationpotential
Investmentclimate Exemplar
Cluster 1 -0,650 -0,452 -0,128 SenegalCluster 2 -0,856 -0,319 1,494 BahrainCluster 3 -0,982 -0,216 -1,749 Libyan Arab.Yam.Cluster 4 1,096 -0,314 1,202 PanamaCluster 5 0,823 -0,159 -0,203 CubaCluster 6 1,654 3,169 0,421 South AfricaCluster 7 -0,564 1,789 -0,533 Venezuela
Table 3: Cluster means (k-means) and exemplars
As the data was standardized for the cluster analysis, the mean over all countries is zero.
Therefore, negative values show that a variable in the respective cluster has a significant
lower mean than in the total population and vice versa. Now, each cluster can be broadly
described in a qualitative manner, as done in Table 4, with the first term indicating a groups
characteristic as compared to the mean of all the countries in the data set (based on Table 3),
and the term in brackets expressing the absolute range given in each cluster. The ranges
21 The 7 cluster solution is selected because it is characterized by a clear increase in the fusion coefficient whichcan be illustrated by an “elbow” in the inverse scree plot.22 For more details, see Bacher (2002), Mucha (1992), Aldenderfer and Blashfield (1984)

9
included in Table 4 show that there can be a considerable variance in each cluster, which is
important regarding the homogeneity of the clusters obtained. For the interpretation of the
clusters, not only the mean, but also the variance will have to be taken into account.
CDM capacity Mitigation potential Investment climate
Meancomparedto average
Range in clusterMean
comparedto average
Range in clusterMean
comparedto average
Range in cluster
Cluster 1 Low No - low Low Very low - low Bad Very bad - bad
Cluster 2 Low No - low Low Very low - low Very good Good - very good
Cluster 3 Low No - low Low Very low - low Extremelybad Extremely bad
Cluster 4 High Medium - very high Low Very low - high Very good Good - very good
Cluster 5 High Medium - very high Low Very low - high Bad Very bad - medium
Cluster 6 Very high High - very high Extremelyhigh
Very high–extremely high Good Very bad – good
Cluster 7 Low No – medium Very high High – extremelyhigh Bad Very bad - good
Table 4: Cluster characteristics
In order to test the homogeneity of the clusters, F-values are calculated for each variable and
each cluster based on the following formula:
)(),(
JVGJVF =
with V(J,G) representing the variance of variable J in group g, and V(J) the variance of
variable J over all cases.
Table 5: F-values for each cluster and variable
CDM capacity Mitigation potential Investment climate
Cluster 1 0.16456583 0.0317284 0.17425392Cluster 2 0.18697479 0.10517629 0.13606474Cluster 3 0.14355742 0.17311233 0.42185129Cluster 4 0.34663866 0.17472665 0.24127466Cluster 5 0.22969188 0.23779605 0.17298938Cluster 6 0.21008403 1.21960878 0.41401113Cluster 7 0.55042017 0.87168136 0.47824987
10
Values smaller than 1 indicate that the cluster can be considered as homogenous (Backhaus et
al. 2003). Table 5, which includes the respective F-values, shows that only in cluster 6, there
is a doubt about cluster homogeneity regarding the mitigation potential.
In the following, I will analyze and interpret each cluster separately with the aim to classify
countries regarding their attractiveness for future CDM non-sink investment.
Cluster 1 is characterized by rather low institutional CDM capacity, low mitigation potential
and a relatively bad investment climate. Consequently, it is to be expected that the countries
in cluster 1 will not be able to attract any significant CDM (non-sink)23 investment flows.
Therefore, this group can be labelled as very unattractive for (non-sink) CDM. The majority
of the countries belonging to this group are located in Africa (e.g. Mauritania, Ivory Coast,
Ethiopia, Kenya, Tanzania). Some Eastern European countries (e.g. Albania, Macedonia), as
well as Syria, Nepal, Papua New Guinea and Kyrgyzstan are part of this group as well.
Cluster 2 includes those countries which are characterized by low institutional CDM capacity
and mitigation potential, and which – contrary to cluster 1 – have a very good investment
climate. Of the 10 countries in this group, half belongs to the Arabian oil exporting countries
(e.g. Bahrain, Kuwait, Qatar, United Arab Emirates), while the others are spread over the
whole globe (Bahamas, Tunisia, Botswana, Cape Verde, Brunei). In spite of their good
investment climate, these countries can also be considered rather insignificant CDM host
countries, since no climate project related conditions are given. As OPEC is not supporting
the international climate regime in general, and those countries having a rather high
mitigation potential (as compared to the other countries in the group) are the OPEC member
states24, these countries will not play any role in the CDM at all. This however may change if
OPEC countries realize that significant revenues can be generated through CDM projects; a
first indication is the rapid ratification of the Kyoto Protocol by a number of OPEC countries
after Russian ratification ensured its entry into force. From the above, it can be concluded that
cluster 2 will as well join the coalition of host countries which are very unattractive for (non-
sink) CDM investments, but that some of these countries may move into Cluster 4 in the near
future.
The 12 countries forming Cluster 3 are characterized by a low institutional CDM capacity,
low mitigation potential, and an extremely bad investment climate. This group comprises
countries of Northern, Western and Central Africa (e.g. Algeria, Liberia, Congo, Sudan) as
23 Countries with bad investment climate and a low institutional CDM capacity will probably attract as littleinvestment in LULUCF as in non-sink projects, since these two criteria will count for the investment inLULUCF projects as well.24 United Arab Emirates, Kuwait and Qatar

11
well as countries like Haiti, Tajikistan and Turkmenistan. There are few chances that any of
the countries in this group will play a significant role in the CDM market, although, some of
the countries would offer some mitigation potential (e.g. Algeria, Iraq). Therefore, countries
in cluster 3 can be considered to belong to the very unattractive (non-sink) CDM host
countries as well.
Cluster 4 includes countries with a medium to very high CDM capacity, and a (very) good
general investment climate. However, the majority of the countries have a rather small
mitigation potential, although the cluster includes as well some few countries which are
characterized by high GHG emissions (Chile, Malaysia and Morocco). The small mitigation
potential of most of the countries in this cluster can be explained by the fact that most of them
are very small (e.g. Belize, Antigua and Barbuda, Uruguay, Panama, Costa Rica, Trinidad and
Tobago, Jordan, Mauritius, Maldives). In general, host countries in cluster 4 can be rated as
“attractive for CDM” (non-sink) investors, without being able to provide a big portion of
CDM credits in the world-wide market, though.
Cluster 5 is very similar to cluster 4 regarding institutional CDM capacity and mitigation
potential, with the difference that most of the host countries in this group offer a worse
investment climate than countries in cluster 4. Egypt is an exception, and cannot be clearly
distinguished from cluster 4. Members of this group are located in Latin America (e.g.
Colombia, Guatemala, Ecuador, Peru, Nicaragua, Paraguay), in Africa (e.g. Mali, Niger,
Uganda), and South East Asia (Laos, Philippines, Vietnam). Furthermore, countries like
Yemen, Jamaica, Israel, Armenia, Azerbaijan, and Georgia are part of cluster 5 as well. Only
a limited attractiveness for non-sink CDM projects can be assigned to this group, although
some individual countries might offer a greater potential than others, with for example
Vietnam and Egypt appear to be the most promising CDM (non-sinks) countries in this group.
The relatively small cluster 6 comprises the 5 countries Argentina, Indonesia, Mexico, South
Africa, and Thailand. Based on the cluster means, these countries are CDM-frontrunners, with
extremely high CDM capacity, exceptionally high mitigation potential and a good investment
climate. When looking at the data for each country, the doubt about the homogeneity of the
cluster regarding the mitigation potential can be ruled out. The exceptionally high values for
Indonesia, Mexico and South Africa as compared to can explain the problematic F-value. The
values, however, allow a consistent interpretation of the cluster regarding the mitigation
potential. Nevertheless, the data shows a rather big range of values for the investment climate,
where Indonesia is clearly identified as a negative outlier in the group. The countries in this
group can be described as very promising CDM (non-sink) countries, keeping in mind,

12
though, that Indonesia’s attractiveness might be hampered to some extent by its relatively bad
investment climate.
The common feature of host countries in cluster 7 is mainly their extremely high mitigation
potential, while values for the institutional CDM capacity and the investment climate vary
considerably. Although investors might find a considerable potential for CDM (non-sink)
projects in these countries, they will probably be deterred either by a very bad investment
climate or a very low CDM capacity. Due to the latter, host countries in cluster 7 are
considered unattractive for CDM (non-sink) projects.
Last but not least, the three countries (China, India, and Brazil) which had been excluded
from the data set as outliers are mentioned as well. These three countries are characterized by
a huge mitigation potential, a good institutional CDM capacity and a good investment
climate, and are known to be the most promising CDM (non-sink) host countries.
Resulting from the above, four main groups of host countries for CDM non-sink projects can
be identified: countries which are very unattractive, countries which are attractive to a limited
extent, attractive countries, as well as very attractive countries. The attractiveness of CDM
host countries as represented by the respective clusters is summarized in Table 6.
Veryunattractive
Attractive to alimited extent Attractive Very attractive
ClustersCluster 1Cluster 2Cluster 3Cluster 7
Cluster 5 Cluster 4 Cluster 6, China,India, Brazil
Table 6: Clusters regarding their attractiveness as CDM (non-sink) host countries
In the interpretation of clusters, I already mentioned the case of Egypt which would fit as well
to cluster 4, but has been included to cluster 5 by the cluster analysis. In real world data, there
always exist unstable cases which cannot be clearly attributed to one group. It is therefore an
essential part of the interpretation of the cluster analysis to point out which of the elements are
not clearly attributable to one cluster only. Table 7 shows the cases which are very similar to
another cluster25, and denotes if this ‘instability’ does have consequences for the above host
country attractiveness classification (as illustrated in Table 6). 19 cases could be identified as
25 Defined as the distance to its nearest cluster being smaller 0.25 than the distance to any of the other clusters.

13
also being very close to the mean of another cluster. The countries Benin, Lesotho and
Seychelles, and Cape Verde appear to lie somewhere between cluster 1 and cluster 2. As both
clusters include very unattractive CDM host countries, this instability does, however, not
change our host country classification.
Country Member ofcluster
Not clearlydistinguishedfrom cluster
Affectsclassification
ofattractiveness
Benin 1 2 NoBolivia 4 5 YesBosnia and Herzeg. 1 3 NoCape Verde 2 1 NoChad 1 3 NoEgypt 5 4 YesGuinea-Bissau 3 1 NoIsrael 5 4 YesJamaica 5 4 YesKazakhstan 7 1 NoKenya 1 3 NoLesotho 1 2 NoMorocco 4 5 YesPhilippines 5 4 YesRwanda 1 3 NoSeychelles 1 2 NoTurkmenistan 3 1 NoUzbekistan 7 5 YesVietnam 5 4 Yes
Table 7: Countries not clearly attributable to one cluster and effect onclassification of attractiveness for CDM
The latter applies as well to the border cases between cluster 1 and 3 (Bosnia and
Herzegovina, Chad, Guinea-Bissau, Kenya, Rwanda, and Turkmenistan) and cluster 7 and 1
(Kazakhstan). Nevertheless, in some of the cases host country attractiveness might be
estimated wrongly if only relying on the cluster membership as given by the k-means method.
As already noted above, ranges in cluster 4 and 5 are relatively big, which hinders the
interpretation of the CDM attractiveness of host countries in these clusters. The 7 countries
that could belong as much to cluster 4 as to cluster 5 are either the lesser attractive cases of
cluster 4 (Bolivia, Morocco), or the rather promising cases of cluster 5 (Egypt, Israel,
Jamaica, Philippines, Vietnam). Uzbekistan, although being a member of the very unattractive
group 7, seems to stick out from this group due to its tendency to belong to the countries
which are attractive to a limited extent.

14
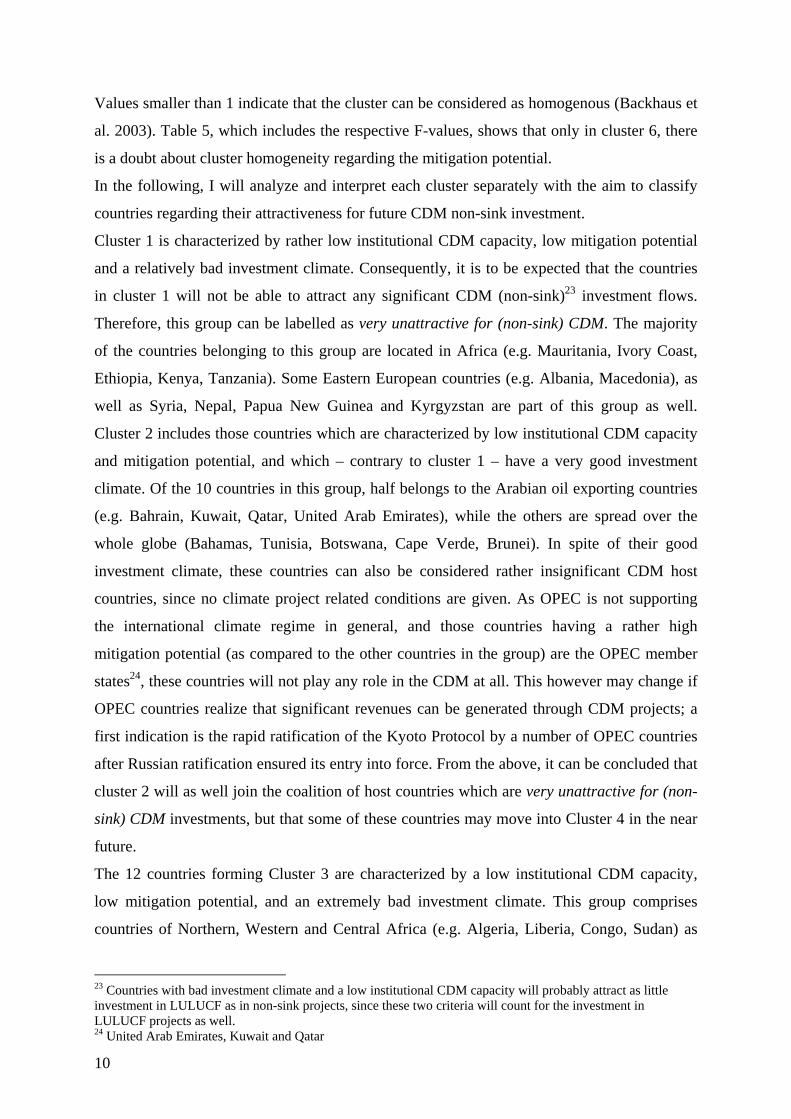
Figure 1 illustrates the classification of host countries by coloring countries according to their
attractiveness for CDM non-sink investment. Thus, it provides a first picture of the probable
geographical distribution of future CDM (non-sink) investment flows. The darker the color,
the more attractive a country can be considered for non-sink CDM investment. The unstable
cases, whose classification is affected by their instability, are presented separately (striped
grey). 26
The fact that relatively big countries belong to the category of the very attractive non-sink
CDM host countries can be explained by the use of absolute GHG emissions as an indicator
for mitigation potential. However, it is to be expected that a range of smaller countries (e.g.
Costa Rica, Chile, Trinidad and Tobago) will be quite attractive for CDM non-sink
investments as well. Furthermore, it has to be noted, that all the very attractive host countries,
with the exception of South Africa, are located either in Latin America or Asia (mainly
Central, East, South and South East Asia). Most of the host countries in Western Asia, and
especially in Africa, do not seem to be very promising CDM candidates.
Assuming that future CDM (non-sink) investment flows will be directed mostly towards the
host countries which have been classified as attractive and very attractive, it is likely that a
relatively small proportion of all potential host countries will receive most of the CDM
investment in the market. Furthermore, it can be expected that the geographical distribution of
CDM flows will be concentrated in certain regions or even countries.
The above classification illustrates as well that the simplistic assumption of CDM following
the same paths as traditional FDI flows, is a relatively good approximation - at least for those
countries with the highest FDI attractiveness. From the countries included in the present
analysis, China, India, Malaysia, Brazil, Thailand, Mexico and Indonesia are the developing
countries with the highest FDI confidence index in 2004 (Kearney 2004). With the exception
of Malaysia, all of these countries are as well classified as the most attractive CDM host
countries.
26 Results of the classification for each country are also presented in Appendix A.
Figure 1: Map the host country classification15

16
Current CDM project status
Being aware that the current distribution of CDM investment cannot be considered
representative of the one in a mature market, it is still worth having a look at the current status
of CDM projects with the CDM Executive Board. Figure 2 shows the expected amount of
CERs generated from CDM projects by 2012 available for validation comments27 on the
UNFCCC CDM website by Feb. 10 2005. Assuming that the amount of CERs is positively
correlated to the amount of investment in the respective project, Figure 2 can give an
indication to which extent early CDM (non-sink) investment are compatible with my
classification of host countries.
0,8 0,7
41,1
1,1 1,9 1,4 0,7 0,9
29,9
0,9 1,3 0,9
12,6
0,6
6,8
0,003 0,04 0,42 0,253,8
4,7
11,8
-3
2
7
12
17
22
27
32
37
42
Argen
tina
Armen
ia
Bolivia
Brazil
Bhutan ChileChina
Costa R
ica
Ecuad
or
Guatemala
Honduras India
Indonesia
Malays
ia
Mexico
Moldova
Morocc
o
Philippines
South Afri
ca
South Korea
Thailan
d
Vietnam
mill
ion
CER
s un
til 2
012
(tCO
2-e)
Figure 2: Expected amount of CERs generated from CDM projects by 2012 available for validation comments on the UNFCCC CDM website (10 Feb. 2005).
The countries with the biggest amount of CERs from non-sink CDM projects in the first
commitment period are Brazil, India, South Korea and Argentina. While South Korea was not
included in the present analysis, the other three have all been classified as very attractive host
countries. The latter classification seems to be confirmed by the early CDM investments.
China, Mexico, South Africa, Thailand and Indonesia are lagging behind as compared to their
‘CDM host country attractiveness’. However, only the fact that they belong to the first 22
countries with CDM projects at the current stage, is an indication that their attractiveness for
CDM non-sink projects is considerable. Three of the smaller countries classified as
‘attractive’ (Chile, Costa Rica, Malaysia), as well as four of the ‘somehow attractive

17
countries’ (Bolivia, Morocco, Philippines, Vietnam) are also participating in the first phase of
CDM project proposals. The remaining countries Armenia, Bhutan, Ecuador, Guatemala,
Honduras and Moldova are all classified as countries ‘attractive to a limited extent’, with the
exception of Bhutan which was not included in the present analysis.
This very first CDM project data shows quite some correspondence with the cluster analysis
results. It has to be kept in mind, though, that we are in a very early phase of the CDM
market. The few projects submitted so far can just give an indication, but cannot necessarily
be considered representative of what a future distribution of CDM projects might look like.
Policy implications
The expectation that it might only be relatively few host countries receiving most of the CDM
(non-sink) investment flows is not compatible with the above mentioned claim for an
equitable geographical distribution of CDM project activities in the Marrakech Accords.28
Rules and modalities of the Kyoto Protocol like the exemption of CDM projects in least
developed countries (LDCs) from the adaptation levy as well as the rules for small scale
CDM projects aim at rendering CDM projects in less attractive host countries more attractive.
However, it cannot be expected that they will considerably change the distribution of CDM
investment flows. Measures like the improvement of the general investment climate are more
long-term measures and more a development than a climate policy issue.
Consequently, of the three variables included in the cluster analysis, only the improvement of
the CDM institutions and capacity by capacity building will be an appropriate measure
available to climate policy for promoting a more equal distribution of CDM activities.29 It has
to be questioned, though, whether CDM capacity building makes sense in all cases. For host
countries with a considerable mitigation potential and an acceptable investment climate, CDM
capacity building will be promising in order to make these countries more attractive for
private CDM investment. Countries whose mitigation potential is very small will, however,
27 Includes submitted projects, those under review as well as registered ones.28 I am neglecting here, that my results are only valid for non-sink projects. Nevertheless, the overall distributionof CDM projects is unlikely to be distributed in a more equal manner than the results suggest for non-sink CDMprojects.29 For details on the capacity building activities having taken place so far, see Michaelowa (2004).

18
not necessarily turn into attractive host countries if they build up a good institutional CDM
capacity.30
When focussing only on the general investment climate, an increase in the CER price31
appears to be another appropriate tool to achieve a more equitable distribution, since it will be
able to compensate the higher risk of countries with rather bad investment climate, thus
increasing investment into less attractive countries. However, this argument might not be as
straightforward as it seems at first sight. With higher prices investors might as well prefer
more costly options in already experienced and less risky host countries, which could lead to a
further geographical concentration of CDM investment.
The above discussion leads to the conclusion that it is rather against the general principle of a
market-based tool like the CDM to result in an equal geographical distribution of projects.
Measures taken will probably be able to decrease the concentration of projects in certain
countries and regions to a small extent, but will not solve the problem entirely. Considering
that the CDM is a market-based tool, it might be more appropriate to ask for an equal
distribution of CDM opportunities, rather than CDM project activities.
Advantages and limits of the approach chosen
Finally, I would like to discuss the strengths and weaknesses of the approach I have chosen
for the present analysis. As it was the goal to include as many host countries in the analysis as
possible, relatively few and rough indicators had to be used. Especially, the indicator for
CDM capacity is only capable to a limited extent of measuring the quality of institutions.
More details on the quality of CDM institutions can only be investigated by country case
studies, which are currently available for few countries only.
Furthermore, relatively little is known on the relative importance of factors influencing CDM
investment. In the present study, therefore, an equal weight of the three dimensions is
assumed. In the future, further factors, e.g. host country climate project experience, might as
well play a role for investors’ decisions. However, the three selected indicators cover the most
important dimensions of host country attractiveness. Host country ratings include similar
dimensions, but were so far limited on the most promising host countries. Furthermore, the
advantage of cluster analysis over rankings is that it uses a known concept for classifying host
30 There might be even cases, where the costs of such capacity and institution building will by far outgrow anyfuture CDM inflows. A case in point is Cambodia where about a million $ have flown into capacity building butwhich is utterly unlikely to generate any CDM projects.31 For example due to strict targets in a second commitment period.

19
countries, thus making the classification rule explicit. It has to be emphasized, though, that it
is not free of subjectivity, as the researcher´s choice on the variables to be included, and the
fusion algorithm to be used will influence the results. Therefore, host country ratings and a
classification approach as the one chosen in the present analysis can be considered
complementary tools, both with their own strengths and weaknesses.
Summary and conclusion
The present study uses cluster analysis for the classification of 114 potential CDM host
countries based on their attractiveness for CDM non-sink projects. The three dimensions of
host country attractiveness considered are the mitigation potential, the institutional CDM
capacity and the general investment climate. Based on the combination of the three latter
factors four levels of attractiveness are identified, and countries are classified according to
their cluster memberships. Those cases which are very close to two clusters are classified
separately as unstable cases.
The results suggest that the CDM investment in non-sink projects will be concentrated in
rather few countries. The CDM (non-sink) stars are China, India, Brazil, Argentina, Mexico,
South Africa, Indonesia and Thailand. They are followed by attractive countries like Costa
Rica, Trinidad and Tobago, Mongolia, Panama, and Chile. While most of the promising CDM
host countries are located in Latin America and Asia, the general attractiveness of African
host countries is relatively low (with the exception of South Africa). These results have some
policy implications, since it is expected that the inclusion of forestry projects in the CDM will
not improve this inequitable geographical distribution.32 One measure available to climate
policy for the promotion of a more equal geographical distribution of CDM project activities -
as asked for by the Marrakech Accords - is a well coordinated and planned CDM capacity
building in host countries. In the short run, capacity building might contribute to mitigating
the problem, without being able to solve it entirely. However, since the CDM is a market-
based tool, it seems more appropriate to ask for an equal distribution of CDM opportunities,
rather than CDM project activities.
32 However, the inclusion of CDM forestry projects will increase CDM investment in the Latin Americancountries.

20
References
Aldenderfer, Mark S.; Blashfield, Roger K. (1984) Cluster Analysis. Series: Quantitative
Applications in the Social Sciences, SAGE University Paper 44, Newbury Park
Arquit Niederberger, Anne., and Saner, Raymond. (2005) Exploring the relationships between
FDI flows and CDM potential. Forthcoming in:
Transnational Corporations, vol. 14, no.1 (April 2005), online available at:
http://www.unctad.org/sections/dite_dir/docs/tnc_vol14_no1_en.pdf
Bacher, Johann (2002): Clusteranalyse. Second edition, Oldenbourg Verlag, München
Backhaus, Klaus; Erichson, Bernd; Plincke, Wulf; Weiber, Rolf (2003) Multivariate
Analysemethoden – eine anwendungsorientierte Einführung. Tenth edition, Springer, Berlin
Fankhauser, Samuel; Lavric, Lucia (2003) The investment climate for climate investment:
Joint Implementation in transition countries. European Bank for Reconstruction and
Development, Working Paper No. 77, January 2003
Jahn, Michael; Michaelowa, Axel; Raubheimer, Stefan, Liptow, Holger (2004) Measuring the
Potential of Unilateral CDM – A Pilot Study. HWWA Discussion Paper 263
Kaufmann, Daniel; Kraay, Aart and Zoido-Lobaton, Pablo (1999a) Aggregating Governance
Indicators. World Bank Policy Research Department Working Paper No. 2195.
Kaufmann, Daniel; Kraay, Aart and Zoido-Lobaton, Pablo (1999b) Governance Matters.
World Bank Policy Research Department Working Paper No. 2196.
Kaufmann, Daniel; Kraay, Aart; Mastruzzi, Massimo (2003) Governance Matters III:
Governance Indicators for 1996-2002. World Bank Policy Research Department Working
Paper
Kearney, A.T. (2004) FDI confidence index. The Global Business Policy Council, October
2004, Volume 7. Online available at: www.atkearney.com
21
Michaelowa, Axel (2003) CDM host country institution building, Mitigation and Adaptation
Strategies for Global Change, 8 (2003), 201-220
Michaelowa, Axel (2004) CDM Incentives in Industrialized Countries – The Long and
Winding Road. International Review for Environmental Strategies, Volume 5, No. 1 p. 217-
231
Mucha, Hans-Joachim (1992) Clusteranalyse mit Mikrocomputern, Akademie Verlag, Berlin
Point Carbon (2002) Is there a business case for small-scale CDM projects? In Carbon Market
Analyst, 22 December 2002
Sun, J.W. (2000) Is CO2 emission intensity comparable? Viewpoint, Energy Policy 28 (2000)
1081-1084
UNFCCC (2001) Report of the Conference of the Parties on its seventh session, held at
Marrakech from 29 October to 10 November, FCCC/CP/2001/13/Add.2
Willems, Stéphane (2004) Institutional capacity and climate actions: summary paper.
OECD/IEA Paper COM/ENV/EPOC/IEA/SLT(2004)2
Wishart, David (2004) Clustan Graphics Primer – A guide to Cluster analysis, third edition,
Edinburgh
World Resources Institute (2003): Climate Analysis Indicators Tool (CAIT) version 1.5.,
Washington, DC. Available at: http://cait.wri.org.
22
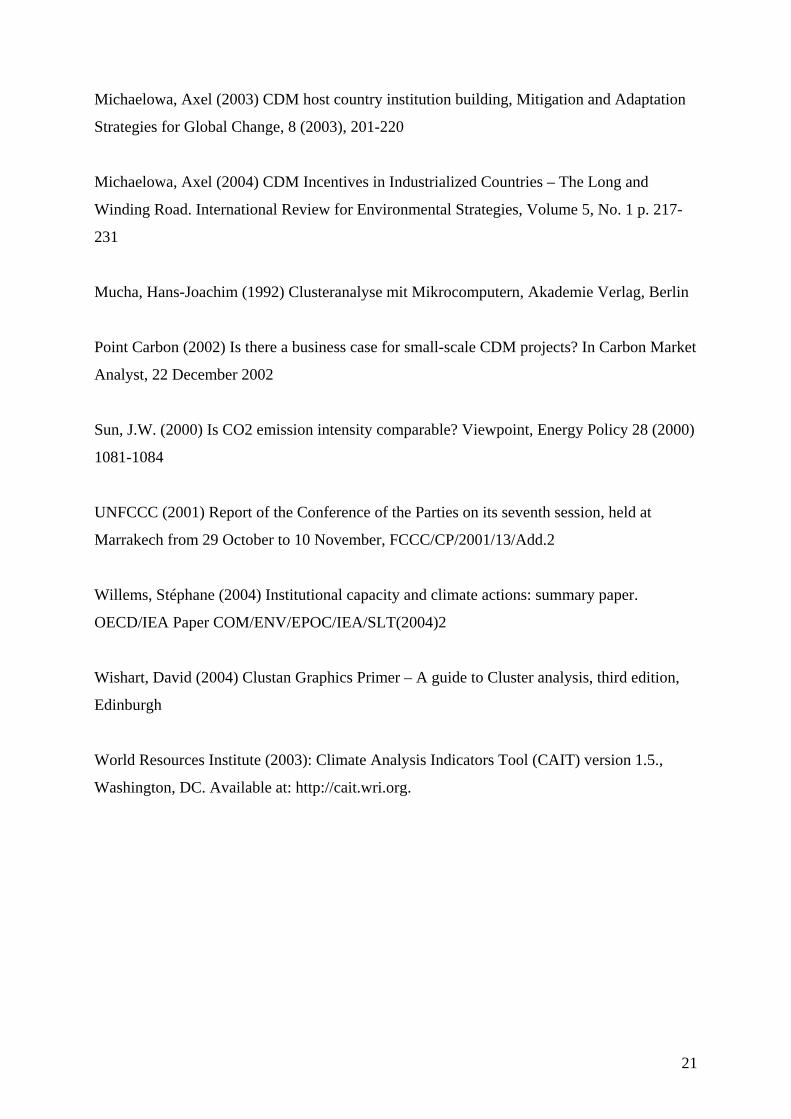
Appendix A: Host country classification
Veryattractive Attractive Attractive to a
limited extent Very unattractive
Argentina Antigua and Azerbaijan Algeria, AlbaniaBrazil Belize Armenia Bahrain, BotswanaIndia Chile Bangladesh BahamasMexico Costa Rica Sri Lanka Bosnia and HerzegovinaSouth Africa El Salvador Colombia Benin, BruneiThailand Jordan Cuba Chad, CongoChina Mongolia Ecuador Dem. Congo (Zaire)Indonesia Mauritius Equatorial Guinea Cameroon
Maldives Georgia Central African RepublicMalaysia Guatemala Cape VerdePanama Honduras Dominican Republic EthiopiaTrinidad and Tobago Laos Gambia, Gabon, GhanaUruguay Madagascar Guinea, Guyana
Moldova Haiti, IranMali Ivory CoastNiger Iraq, KenyaNicaragua Kyrgyzstan, North KoreaParaguay Kuwait, KazakhstanPeru Lebanon, Liberia, LesothoUganda Libyan Arab.Yam., MalawiYemen Macedonia, MauritaniaZimbabwe Oman, Mozambique
Bolivia* Nigeria, NepalEgypt* Suriname, PakistanIsrael* Papua New Guinea
Jamaica* Guinea-BissauMorocco* Qatar, Rwanda
Philippines* Saudi Arabia, SeychellesVietnam* Senegal, Sierra Leone
Sudan, SyriaUnited Arab EmiratesTajikistan, TogoSao Tome and PrincipeTunisia, TurkmenistanTanzania, Burkina FasoVenezuela, Zambia
Uzbekistan** * somewhat attractive, **attractive to a very limited extent