host species-specific metabolic fingerprint database for...
TRANSCRIPT

Host species-specific metabolic fingerprint database for
tracking the sources of faecal contamination in surface
waters
Warish Ahmed
This thesis is submitted in fulfillment of the requirements for the
Degree of Doctor of Philosophy
Faculty of Science, Health and Education
The University of the Sunshine Coast
Australia
August 2005

II
DEDICATION
This thesis is dedicated to my wife Anamika who provided moral support to pursue this
research.

III
ABSTRACT
Many phenotypic and genotypic methods known as microbial source tracking (MST) methods have been used
to trace the source of faecal contamination in surface waters. Advantages and/or disadvantages of these
methods have been evaluated in ecological studies. Among the phenotypic methods, a biochemical
fingerprinting method apparently meets most (if not all) of the essential criteria of an ideal MST method. In
this study, the method was initially evaluated for identifying the source of human faecal contamination in a
catchment. Strains of two indicator bacteria, namely enterococci and Escherichia coli of 39 septic tanks were
typed and their biochemical phenotypes (BPTs) were compared with those found in a nearby creek. Identical
BPTs of enterococci (n= 98 BPTs) and E. coli (n=53 BPTs) from 33 and 26 septic tanks were respectively found
in the creek. Certain septic tanks contained unique BPTs which served as their signature to identify the failing
septic systems. The method was then used to develop a large and a representative metabolic fingerprint
database of both indicator bacteria by testing 3,985 isolates of enterococci and 3,107 isolates of E. coli from 9
animal host groups in a selected catchment. The animal host groups tested include: horses, cattle, ducks,
chickens, sheep, pigs, dogs, deer and kangaroos. Isolates were divided into unique (UQ) and shared (SH) BPTs
based on their appearance in only one (i.e. UQ-BPT) or more (i.e. SH-BPTs) host-groups. These BPTs were also
compared with those found in septic tanks as representative of human BPTs. BPTs shared between human
and animals were excluded from the database. In this way it was possible to obtain 3 categories of BPTs of
both indicator bacteria in the database. These include BPTs unique to individual animal host groups, BPTs
shared among animals, and BPTs unique to humans. The developed database was able to identify 71% of
enterococci BPTs and 67% of E. coli BPTs in water samples. Among enterococci, 10% of BPTs were identical to
human BPTs and 61% were identical to animals and the rest could not be identified. Similarly, among E. coli,
13% of BPTs were identical to human BPTs and 54% were identical to animals. The representativeness of the
database was evaluated in a cross catchment study where a local database was also developed for
comparison. According to the local database, 6% of enterococci BPTs and 7.2% of E. coli BPTs were identical
to humans and 44% of enterococci BPTs and 45.8% E. coli BPTs belonged to animals. These figures for the
existing database were 7.1% (for enterococci) and 7.8% (for E. coli) for human and 55.3% (for enterococci)
and 57% (for E. coli) for animals. A sub-database of E. coli strains carrying one or more virulence genes was
developed to identify the sources of pathogenic E. coli in water samples. Using specific primers and the
polymerase chain reaction (PCR), the presence of 15 virulence genes commonly found in E. coli strains causing
intestinal and extra-intestinal infections in humans were tested. These included genes responsible for
attachment and effacement (eaeA), production of verotoxins (VT) 1, 2 and 2e, heat-labile toxin (LT), heat-
stable toxins (ST) 1 and 2, enteroinvasive (Einv), enteroaggregative (EAgg), cytotoxic necrotizing factors
(CNF) 1 and 2, haemolysin A (hlyA), P-fimbriae (papC), lipopolysaccharides (LPS) O111 and O157 side chains.
Eleven percent of the BPTs from animal species carried one or more virulence genes tested whilst 6% BPTs
isolated from water samples also carried these genes. Although virulence genes were identified in strains from
7 animal species and 8 septic tanks, water samples contained virulent BPTs from dog and chicken only

IV
indicating that combination of E. coli virulence properties and biochemical fingerprinting can also be used as a
tool to identify the sources of pathogenic bacteria in surface waters. Whilst the biochemical fingerprinting
method showed to be an ideal method for MST, the developed database showed to be highly specific and
representative in tracing the source of human and animal faecal contamination in a local and cross-catchment
study in the region. This study also indicates that strains of E.coli belonging to unique BPTs of the database
could carry certain virulence properties and combination of these two specific characters can provide
additional information regarding the impact of point and non-point sources of contamination on health of the
water ways.

V
STATEMENT OF ORIGINALITY
This work has not been previously submitted for a degree or diploma in any other university. To the best of
my knowledge and belief, the thesis contains no material previously published or written by another person
except where due reference is made in the thesis itself.
Warish Ahmed
August 2005

VI
PUBLICATIONS ARISING FROM THIS THESIS
1. Ahmed, W., R. Neller, and M. Katouli. 2005. Evidence of septic systems failure determined by a bacterial
biochemical fingerprinting method. J. Appl. Microbiol. 98: 910-920.
2. Ahmed, W., R. Neller, and M. Katouli. 2005. Host species-specific metabolic fingerprint database of
enterococci and Escherichia coli and its application to identify the sources of fecal contamination in surface
waters. Appl. Environ. Microbiol. 71: 4461-4468.
3. Ahmed, W., R. Neller, and M. Katouli. 2005. Population similarity of enterococci and Escherichia coli in
surface waters: A predictive tool to trace the sources of fecal contamination. J. Water Health. 4: 347-356
4. Ahmed, W., J. Tucker, J. Harper, R. Neller, and M. Katouli. 2005. Comparison of the efficacy of an existing
versus a locally developed metabolic fingerprint database to identify non-point sources of fecal contamination
in a coastal lake. Water Res. 40: 2339-2348
5. Ahmed, W., J. Tucker, K. Bettelheim, R. Neller, and M. Katouli. 2005. Detection of virulence genes in
Escherichia coli of an existing metabolic fingerprint database to predict the sources of pathogenic E. coli in
surface waters. Water Res. 41: 3785-3791.

VII
ACKNOWLEDGEMENTS
Special thanks to my supervisor Dr. Mohammad Katouli who provided guidance, support and was always
there when I needed him throughout the project. I sincerely thank Assoc. Prof. Dr. Ron Neller who believed in
this project and provided financial support when needed. Thanks also to Dr. Donald Meyers and Dr. Peter
Duncan for their valuable comments throughout this study.
I would like to thank the Maroochy Shire Council and the Caloundra City Council for their financial assistance
and cooperation in completing this study. A special thanks to Ross Jenkins for his assistance in GIS mapping.
I would like to thank my colleagues, Mr. Jack Tucker who taught me how to undertake PCR and assisted me in
completing molecular work. I thank Mr. Grant Cotterill and Mr. Andrew Oxley for their help in collecting stinky
septic samples. Thanks to Ms. Lyris Snowden, Mr. Daniel Morgan, Mr. Anthony Weston, Mr. Daniel Owen, Mr.
Peter MacDougall and Ms. Sandra Hipwood for their kind help in collecting animal waste and water samples.
For their assiastance in the labpratory I would like to thank Mr. Chris Gaham and Mr. James Harper. Thanks to
Dr. Wendy Barron, Mr. Daniel Powell, Mr. David Glover and Ms. Amanda Thomson for their technical
expertise. Thanks to all my colleagues at the laboratory - we have become good friends and I really enjoyed
working with you guys.
Finally to my wife Anamika. Without your support it was never possible to complete this journey.
VIII
TABLE OF CONTENTS
Abstract III
List of Figures XI
List of Tables XII
CHAPTER 1: General Introduction and Literature review 1
1.1 Microbial contamination of waters 1
1.2 General objectives of the thesis 3
1.3 Water quality Indicators 4
1.3.1 Coliform bacteria 5
1.3.2 E. coli 6
1.3.3 Enterococci 7
1.3.4 Bifidobacteria 8
1.3.5 Clostridium perfringens 9
1.3.6 Bacteroides 9
1.3.7 Bacteriophages 9
1.4 Limitations of indicator bacteria 10
1.5 Overview of microbial source tracking (MST) methods 10
1.5.1 Database-dependent genotypic methods 13
1.5.2 Database-dependent phenotypic methods 15
1.5.3 Database-independent methods 19
1.5.4 Chemical methods 20
1.6 Comparison of methods 22
1.7 Application of database dependent methods 27
1.7.1 Antibiotic resistance analysis (ARA) 27
1.7.2 Carbon source utilization (CSU) 27
1.7.3 Ribotyping 28
1.7.4 Pulsed-field gel electrophoresis (PFGE) 28
1.7.5 Repetitive extragenic palindromic (rep) PCR 29
1.7.6 Methods comparison studies 29
1.8 Key assumptions of MST methods 29
1.8.1 Host specificity 30
1.8.2 Temporal stability 30
1.8.3 Geographical stability 31
IX
1.8.4 Representativeness 31
1.8.5 Primary versus secondary habitat 32
1.9 Concluding review remarks 32
1.10 Thesis direction and structure 33
CHAPTER 2: Evidence of septic system failure: a catchment based study 35
2.1 The ecological context of this thesis 35
2.1.1 Failing septic systems 36
2.1.2 Impacts of failing septic systems 37
2.2 Materials and methods 40
2.2.1 Study area 40
2.2.2 GIS Identification of septic system 41
2.2.3 Performance of surveyed septic systems 43
2.2.4 Classification of defective septic systems 44
2.2.5 Eudlo Creek mainstream sampling sites 46
2.2.6 Preliminary bacteriological investigation 48
2.2.7 Sampling sites in Eudlo Township 48
2.2.8 Septic systems sampling 50
2.4.9 Identification of indicator bacteria 50
2.2.10 Biochemical fingerprinting 50
2.3 Results 53
2.3.1 Preliminary bacteriological assessment 53
2.3.2 Comparison of bacterial populations in sub-catchments A and B 54
2.3.3 BPTs of indicator bacteria in septic tanks 56
2.3.4 BPTs of indicator bacteria in water samples 58
2.3.5 Diversity of indicator bacteria in septic tanks and water samples 58
2.3.6 Comparison of septic BPTs to water samples 59
2.3.7 Population similarities between septic tanks and creek water samples 61
2.6 Discussion 63
CHAPTER 3: Host species-specific database for microbial source tracking 67
3.1 Introduction 67
3.2 Materials and methods 68
3.2.1 Host groups sampling 68
3.2.2 Database development 69
3.2.3 Surface water sampling 70
X
3.2.4 Statistical analysis 72
3.3 Results 72
3.3.1 Number of faecal indicator bacteria in water samples 72
3.3.2 Database 76
3.3.3 Ecological application of the database 79
3.3.4 Population similarity analysis-an alternative approach 83
3.5 Discussion 85
CHAPTER 4: The efficacy of a metabolic fingerprint database to trace faecal
contamination in cross catchment study
92
4.1 Introduction 92
4.2 Materials and methods 93
4.2.1 Selected catchment 93
4.2.2 Host groups sampling 94
4.2 3 Isolation of enterococci and E. coli 94
4.2.4 Typing and development of a local database 95
4.2.5 Lake sampling 95
4.2.6 Statistical analysis 97
4.3 Results 97
4.3.1 Abundance of indicator bacteria in the lake 97
4.3.2 Development of a local database 98
4.3.3 Faecal source tracking 101
4.4 Discussion 104
CHAPTER 5: Identication of virulence genes in Escherichia coli strains 109
5.1 Introduction 109
5.2 Materials and methods 111
5.2.1 Sources of isolates 111
5.2.2 DNA extraction from septic tank samples 112
5.2.3 DNA extraction from isolates 112
5.2.4 PCR amplification 113
5.2.5 Serotyping 116
5.3 Results 116
5.3.1 Prevalence of virulence genes 117
5.3.2 Distribution of virulence genes 118
5.3.3 Source tracking of virulence genes 121

XI
5.4 Discussion 122
CHAPTER 6: General discussion and conclusion 127
References 135
Appendix 155

XII
LIST OF FIGURES
Figure 2.1 GIS identification of unregistered septic system 42
Figure 2.2 Photographs of few surveyed septic systems 45
Figure 2.3 Perecentage distributions of the performance of surveyed septic tanks 46
Figure 2.4 Sampling sites and sub-catchments in the study area 47
Figure 2.5 Number of enterococci and E. coli isolates in sub-catchments 55
Figure 2.6 Population similarity among septic tanks and water samples 62
Figure 3.1 Sampling sites on Eudlo Creek mainstream 71
Figure 3.2 Number of enterococci and E. coli during the wet and the dry season 73
Figure 3.3 Population similarity of enterococci and E. coli at different sampling sites 75
Figure 3.4 Occurrence of enterococci and E. coli BPTs among host groups 79
Figure 3.5 Percentage contribution of enterococci and E. coli from host groups 82
Figure 3.6 Population similarities of enterococci and E. coli among host groups 83
Figure 4.1 Sampling sites on Currimundi Lake 96
Figure 4.2 Abundance of enterococci and E. coli in Currimundi Lake 97
Figure 4.3 Percentage contribution of enterococci and E. coli from host groups 104

XIII
LIST OF TABLES
Table 1.1 Advantages and disadvantages of source tracking methods 24
Table 2.1 Number of septic systems and water samples tested 49
Table 2.2 Number of isolates tested and number of BPTs found in septic tanks 57
Table 2.3 Number of shared and unique BPTs found in all septic tanks 58
Table 2.4 Comparison of bacterial diversity between septic tanks and water samples 59
Table 2.5 Identical BPTs of indicators found in septic tanks and water samples 60
Table 3.1 Mean diversity of indicator bacteria at different sampling sites 74
Table 3.2 Number of samples and isolates tested from each host group 76
Table 3.3 Mean diversity of enterococci and E. coli in host groups 77
Table 3.4 Number of unique and shared BPTs in host groups 78
Table 3.5 Distribution of enterococci BPTs found in horses with other host groups 78
Table 3.6 Comparison of BPTs from water samples with the database 81
Table 3.7 Population similarity of indicator bacteria from host groups and water samples 84
Table 4.1 Number of BPTs and diversity for different sampling sites 98
Table 4.2 Number of indicator bacteria and BPTs in the local and the existing database 99
Table 4.3 Number of unique and shared BPTs in the local and the existing database 100
Table 4.4 Comparison of BPTs from water samples with databases 103
XIV
Table 5.1 Primer sequence and the amplicon size of virulence genes 115
Table 5.2 Number of BPTs in animal host groups and water samples 117
Table 5.3 BPTs carrying one or more virulence genes 118
Table 5.4 Distribution of virulence genes among host groups 120
Table 5.5 Prevalence of virulence genes in septic tanks 121
Table 5.6 Comparison of virulence genes between water samples and host groups 122

XV
LIST OF ABBREVIATIONS
AFLP: Amplified fragment length polymorphism.
ANOVA: Analysis of variance.
ARA: Antibiotic resistance analysis.
ARP: Antibiotic resistance profiles.
AS: Australian standard.
AWTS: Aerobic wastewater treatment system.
BPT: Biochemical phenotype.
bp: Base pair.
BTB: Bromothymol blue.
CFU: Colony forming unit.
CSOs: Combined sewer overflows.
CSU: Carbon source utilization.
DAEC: Diffusely adherent E. coli
Di: Diversity index.
DNA: Deoxyribonucleic acid.
DNTPs: Deoxyneucleoside triphosphates
EAEC: Enteroaggregative E. coli
EDTA: Ethylenediamine tetra acetic acid.
EHEC: Enterohemorrhagic E. coli.
EIEC: Enteroinvasive E. coli.
EPEC: Enteropathogenic E. coli
ERIC: Enterobacterial repetitive intergenic consensus.
ETEC: Enterotoxigenic E. coli.
EU: European Union.
GI: Gastrointestinal.
GIS: Geographical Information System.
ID: Identity.
LB: Luria Bertani
LT: Heat labile toxin
MARA: Multiple antibiotic resistance analysis.
NPS: Non point sources.
MF: Membrane filtration.
MLEE: Multilocus enzyme electrophoresis.

XVI
MST: Microbial source tracking
NHMRC: National Health and Medical Research Centre.
NSW: New South Wales.
OWTS: On-site waste water treatment system.
Pap: pyelonephritis-associated pili.
PCR: Polymerase chain reaction.
PFGE: Pulsed-field gel electrophoresis.
PhPlate: PhenePlate.
PS: Point sources.
Qld: Queensland.
qPCR: Quantitative PCR.
rep: Repetitive extragenic palindromic.
rpm: Revolution per minute
rRNA: Ribosomal ribonucleic acids.
RT-PCR: Reverse transcription PCR.
SA: South Australia.
SC: Sub-catchment.
SH-BPTs: Shared BPTs.
Sp: Population similarity.
ST: Heat stable toxin.
STP: Sewerage treatment plant.
TMDL: Total maximum daily load.
t-RFLP: Terminal-restriction length fragment polymorphism.
TSB: Tryptic soy broth.
UPGMA: Unweighted pair group method with arithmetic averages
USEPA: The United States Environmental Protection Agency.
UQ-BPTs: Unique BPTs.
Vic: Victoria.
VT: Verotoxin

1
CHAPTER 1
General Introduction and Literature Review
1.1 Microbial contamination of waters
Microbial contamination in coastal areas results in degradation of recreational and commercial uses of water
in many parts of the world. Bacterial contamination has been cited as a leading cause of surface water
contamination in the United States and many other countries of the world (7). Because of this, faecal
contamination from human and animals is believed to be one of the major causes for increased
microbiological and nutrient loads in coastal and inland waterways (2, 189, 224). Poor water quality results in
the deaths of an estimated 5 million children annually (293). Non-point sources (NPS) such as:
• land application of animal faeces (305),
• run-off from animal farms (23, 56),
• faecal inputs from birds (154),
• domestic and wild animals (21, 116, 125),
• malfunctioning septic trenches (109, 125, 153),
• storm water drainage and urban run-off (116, 153, 197) and/or point sources (PS) such as
• industrial effluents and municipal wastes (223)
are known to be potential sources of such contamination.
Faecal contamination from human and animal waste imposes health risks to those who use water for
recreational purposes (102) and/or a secondary risk to shellfish consumers due to the potential presence of
pathogens in the shellfish closure (141). It has been reported that various human enteric pathogens such as
Salmonella spp., Shigella spp., hepatitis A and Norwalk viruses have been found in surface waters due to
human faecal contamination (21, 67, 139, 203, 232). Wastewater from domestic and/or farm animals such as
cattle, horses and poultry may further contribute pathogens such as Escherichia coli belonging to serotype
O157:H7, Cryptosporidium spp. and Giardia spp. which generally enter surface water via land run-off during
rainfall events (56, 67, 94, 134, 137, 196, 203, 249).
Identification of major sources (i.e. humans and/or animals) of these faecal bacteria, as well as potential
pathogens in waters, is therefore necessary to minimize the potential public health risks associated with such
contamination. In addition, microbial source identification is an integral part of the development of the total
maximum daily load (TMDL) program which is a calculation of the maximum amount of a contaminant that a
water body can receive from PS and NPS contamination and still meet water quality standards (31). Knowing
whether a pollution source is human or animal is necessary to plan TMDL.

2
Identification and/or quantification of pathogenic bacteria, viruses and cysts of protozoan parasites in surface
waters is on the other hand is a cumbersome task due to numerous pathogens that may be present in the
waterways from diffuse sources at any given time (249). For instance, it has been reported that more than 100
enteric viruses may be present in human faeces and wastewater (228). Therefore, it is not feasible to test
water samples for the presence of each pathogenic organism. In addition, isolation and identification of these
pathogens can in some cases be costly, quite difficult and laborious (276) as the number of pathogens in
receiving waters may be low due to dilution. These factors collectively limit the use of pathogens to evaluate
the quality of surface water. Alternatively, the use of indicators has been proposed to resolve this dilemma.
1.2 General objectives of the thesis
Faecal indicator bacteria are used to ascertain the presence of faecal contamination and the possibility of
pathogenic microorganisms in surface waters. To trace the source of contamination, several microbial source
tracking methods (MST) have been used to establish a database of faecal indicator bacteria from known host
groups (database-dependent methods). These methods are however, either not sufficiently discriminatory to
differentiate between indicator bacteria in the same species, or are not sufficiently reproducible. In addition,
some of the currently used methods are either complicated and require special trained personnel, or are
costly and can be labour intensive, and therefore not suitable for testing a large number of isolates. The
current literatures also suggest that database-dependent methods require further evaluation in terms of their
size and representativeness. Stability of faecal indicator bacteria in the environment is another important
factor, which needs to be addressed. Finally, it is not known whether a database developed for a given
catchment can be used in another catchment within the same geographical region. An expansion of these
concepts will be explored later in this chapter.
Nonetheless, a biochemical fingerprinting method has been reported that apparently meets many of the above
mentioned criteria of an ideal MST method. The overall objectives of this thesis therefore were to:
(a) evaluate the usefulness of a biochemical fingerprinting method to identify human faecal
contamination in receiving waters
(b) develop a large and representative database that can be used to differentiate between human and
animal sources of faecal contamination and
(c) evaluate the validity of such a database in cross catchment studies within the same geographical
region.
Whilst MST methods use faecal indicator bacteria only as a means of identifying the potential presence of
human and animal pathogens in surface waters, the overall objectives of this thesis were expanded to identify
the possibility of the presence of virulence genes among indicator bacteria that can be used as a direct or
additional means of identifying the presence and the source(s) of pathogens in a given catchment.

3
The remainder of this chapter will now provide an overview of the pertinent literature and theoretical
framework for the research undertaken.
1. 3 Water quality indicators
An indicator may be biological (i.e. bacteria) or a chemical substances (i.e. sterols) commonly found in the
faeces of warm-blooded animals in high concentrations and released to the environment with the faeces. In
1880 Van Fritsch observed Klebsiella in human faeces as well as in water and introduced the term “indicators”
(212). Indicator microorganisms are used to predict the presence of potential pathogenic microorganisms.
However, to be an ideal candidate, an indicator bacterium of human pathogens should meet certain criteria
such as:
• It should be native to the intestine of warm-blooded animals including humans (32).
• It should not be pathogenic (212).
• The number of indicator should be higher than pathogens (212).
• Should enter the surface water through defecation of human and animals.
• It should be easily isolated, enumerated and identified in any basic microbiological laboratory (197).
• It should be resistant to variety of environmental stresses (32).
• It should survive long enough in the natural waters to be detected.
• It should not multiply in the environment and their presence should be associated with the presence of
pathogenic bacteria (32, 249).
1.3.1 Coliform bacteria
Coliforms have long been used to assess the quality of recreational/surface and/or ground waters and
shellfish-harvesting waters (121, 125, 129, 142, 240, 249, 259). These groups of bacteria include E. coli and
several coli-like (coliform) bacteria, mainly belonging to the family Enterobacteriaceae are commonly found in
the gastrointestinal tracts of all warm-blooded animals (54, 128, 129, 199, 294, 299).
During the early 1900’s, the technology was not sufficiently advanced enough to distinguish E. coli from other
coliforms and therefore most of the coliforms recovered from humans and animal faeces were assumed to
reflect the presence of E. coli. As a result, the term “total coliform” was considered to be equivalent to E. coli. It
is now known that total coliform bacteria comprises of at least four genera of the family Enterobacteriaceae
that could all ferment lactose. These genera are Escherichia, Klebsiella, Enterobacter and Citrobacter and
collectively they represent 1% of total bacterial populations in human and animal faeces. Among total
coliforms however, E. coli represents the majority of the population (90-95%). These bacteria which are being
erroneously referred to as “Faecal coliforms” are also known as “thermotolerant coliforms” because they are
metabolically active at 44ºC. During early 1950’s, though more specific tests were developed to easily

4
distinguish E. coli from the rest of coliforms, the use of “Faecal coliforms” was so commonplace that they were
not dropped in favour of E. coli.
Over the past few years coliform dynamics have been examined in several studies (21) and their value as an
indicator has recently been questioned, because these bacteria can also be derived from various sources such
as soil, agricultural run-off, composted animals, decaying vegetation and industrial processes (67, 121, 169).
For instance, it has been reported that Klebsiella group may thrive in industrial and/or agricultural wastes
and therefore, their presence in surface waters do not necessarily indicate faecal contamination from warm-
blooded animals (212). It has also been reported that their ecology and prevalence differ from pathogenic
microorganisms (58, 66, 262). The sensitivity of these bacteria to environmental stresses is low compared to
viruses and protozoans. These factors collectively limit these groups of bacteria as a standard indicator to
assess the quality of surface and ground waters. Because of these limitations, bacteria such as E. coli,
enterococci, Bifidobacterium spp., Clostridium perfringens and Bacteroides spp. have been suggested as
alternative indicators (115). A recent discussion paper by the National Health and Medical Research Council
(NHMRC), Australia, proposed that E. coli is an ideal faecal indicator to assess the quality of recreational
waters (211).
1.3.2 E. coli
E. coli has been widely used as a faecal indicator bacterium and is considered “the pioneer marker” as these
bacteria colonize in the intestine of human and other warm-blooded animals in relatively high numbers (22,
53, 93, 182, 222, 240). It can be easily distinguished from other faecal coliform on the basis of the presence of
β-glucuronidase. E. coli posses several desirable characteristics of an ideal indicator as mentioned earlier such
as not normally pathogenic, easy to culture and detect, the concentration in receiving waters is much higher
than those of pathogens (73, 276) and they may survive a prolonged period in natural environments under
favourable conditions (22). The United States Environmental Protection Agency (USEPA) and the European
Union (EU) recommended E. coli as mandatory microbial indicator to assess the quality of water. However, it
has also been reported that E. coli can replicate in pristine waters in tropical rain forest even in the absence of
faecal input (66). This may limit its utility as an ideal indicator in tropical environments.
1.3.3 Enterococci
Faecal streptococci are Gram-positive, catalase-negative cocci that cleave esculin and are not inhibited by bile
salts. They are classified as group D streptococci by antiserum reactivity. The enterococci that were formerly
classified as faecal streptococci are also considered to be an ideal water quality indicator (9) and classified in
the genus Enterococcus (191).

5
Enterococci are most often suggested as alternatives to coliforms. The use of enterococci as a water quality
indicator dates back to 1900 when they were found to be common commensal bacteria in the intestine of
warm-blooded animals (104). Enterococci can be identified by their ability to grow at 10-45ºC, at high pH (i.e.
pH=9.6), and in medium with 6.5% NaCl. So far, 19 species have been included in the genus (275). The most
common species of enterococci include E. faecalis, E. faecium, E. durans, E. gallinarum and E. avium among
which E. faecalis and E. faecium are exclusively found in humans. Enterococci has the ability to survive in the
natural environment for lengthy periods under favourable conditions (22, 121, 129, 165, 198, 258), do not
replicate in the natural waters (298), their presence in surface waters indicates recent contamination (105),
are less numerous than faecal coliform in human faeces (84) and rapid methods are available for their
detection and identification. Several epidemiological studies have reported a correlation between enterococci
concentrations and swimming-associated gastrointestinal diseases in recreational waters (40, 41, 53, 93, 142,
240). In 1998, the EU recommended enterococci as substitute for faecal coliforms (212).
1.3.4 Bifidobacteria
Bifidobacteria are anaerobic, Gram-positive bacteria which are considered as potential faecal indicator due to
their high abundance in human faeces relative to those of faecal coliforms (75). The presence of Bifidobacteria
in surface waters indicates that faecal contamination has occurred through human faeces, as they do not
normally found in animals (31, 32, 236, 249). The key advantage of Bifidobacteria is that they do not replicate
in the environment due to their strict growth requirements (190). Bifidobacteria have the ability to ferment
sorbitol and can be easily detected in sorbitol agar (236). However, one disadvantage of these bacteria is that
they do not survive in the environment for lengthy periods (26, 45, 236) and are therefore limited as an
indicator of recent contamination events (103). The use of Bifidobacteria is also limited due to the difficulty in
isolation and identification using traditional biochemical methods (195).
1.3.5 Clostridium perfringens
C. perfringens are spore-forming, sulphite-reducing, rod-shaped anaerobic bacteria which has been used as an
indicator of faecal contamination. They are commonly found in the intestine of warm-blooded animals and
have been isolated from natural waters (47). Spores of C. perfringens are largely of faecal origin (264) and
comprise approximately 0.5% of the faecal flora. The advantage of using this bacterium is that unlike other
indicator bacteria, they do not replicate in natural waters (64). However, the use of C. perfringens may not be
suitable for identifying recent pollution events as these bacteria can be quite resistant to environmental
stresses. It has been reported that the number of C. perfringens has been shown correlated with human
enteric viruses (92, 229) in surface waters.

6
1.3.6 Bacteroides
Bacteroides are anaerobic non-spore forming bacteria commonly found in the gut of warm-blooded animals
including humans. The number of these bacteria is quite high in faeces, representing more than 30% of total
human faecal flora. One advantage of using such bacteria is that they do not replicate in the natural
environment and their presence in natural waters indicates recent contamination has occurred (199).
However, the use of these bacteria as an indicator is limited due to difficulties in isolation and identification in
the laboratory compared with E. coli and/or enterococci.
1.3.7 Bacteriophages
Bacteriophages are viruses that infect bacteria found in human intestines. Bacteriophages are generally found
in large number in sewage and wastewater. Three groups of bacteriophages have been proposed as indicators.
These include somatic coliphage (135, 166), male-specific RNA coliphage (131) and phages infecting
Bacteroides fragilis (111, 150, 269). It has been reported that coliphage lack host specificity. For instance, F+
coliphages attack E. coli as well as other coliforms (236). It has also been reported that F+ coliphages and
somatic coliphages can multiply in the environment and may act as a false indicator (181). Somatic coliphages
are not host specific and therefore not regarded as true indicators of faecal and/or enteric viral
contamination. Large volume of water samples need to be analysed for isolation of this bacterium and may not
be feasible for routine monitoring (181).
1.4 Limitations of indicator bacteria
Identification of major contaminating sources can be of great value for the management of faecal
contamination of surface waters (26, 176). However, a major limitation of using faecal indicator bacteria is
that their presence/absence in surface waters can only be used to predict the quality of water. It has to be
noted that there is no universal indicator that posses all of the characteristics outlined earlier (section 1.3).
Moreover, the indicators do not provide definitive information regarding the possible source(s) of
contamination (103, 129, 130, 173, 197, 299). Thus it is virtually impossible to identify the sources of faecal
contamination based on these indicators alone.
1.5 Overview of microbial source tracking (MST) methods
Historically, the ratio of faecal streptococci and faecal coliform has been used as a means of distinguishing
between human and animal sources of contamination (8, 61, 68, 70). This method is based on the concept that
animal faeces contain high levels of faecal streptococci with respect to humans. In contrast, human faeces
contain higher levels of faecal coliforms than animals. When the ratio is >4 the possible source of
contamination is human and when the ratio is <0.7, animals are regarded as the main source (79). This
method is no longer considered reliable due to the fact that the ratio can be influenced by temperature and
sediment. Under warm conditions or in temperate regions faecal coliform growth may exceed the ratio even in

7
the absence of human sources. In addition, this method cannot discriminate among various animal species
(38, 74).
Over the past ten years, microbiologists have developed several techniques, collectively known as MST
methods which can be used to predict the various sources of animal and/or human faecal contamination.
Indeed some of these methods are designed to differentiate among animal species (116, 199, 249, 299). The
objective of these methods is to overcome the limitation of traditional indicator bacteria and more accurately
identify the sources of faecal contamination.
These methods can be broadly categorized as microbial (116, 249) and chemical methods (251). Microbial
methods can be further categorized as genotypic and phenotypic methods. Genotypic methods include
ribotyping (43, 125, 224), pulsed-field gel electrophoresis (PFGE) (255, 256), ribosomal genetic markers (26,
27), repetitive (rep) DNA sequences (67), amplified fragment length polymorphism (AFLP) (186), enterotoxin
biomarkers (217), and F+ coliphages genotyping (55). Phenotypic methods used for detection of indicator
bacteria in surface waters include antibiotic resistance analysis (ARA) or multiple antibiotic resistance
analysis (MARA) (129, 223, 302, 303), carbon source utilization (CSU) (122) by using Biolog system and
biochemical fingerprinting with the Phene Plate system (PhPlate) (291).
Some of these microbiological methods have been further categorized as database dependent methods, based
on the hypothesis that phenotypic or genotypic characteristics of specific strains are associated with specific
animals (10, 126, 153, 197). On the basis of this hypothesis, a database is made of either genotypic or
phenotypic profile of the indicator bacteria from several known host groups is assembled and classified
according to the host groups (254, 299) using a variety of statistical methods such as discriminant, cluster and
principal component analyses. The developed database is then used to compare with profiles obtained from
the same indicator bacteria found in surface waters. In this manner, the source(s) of unknown environmental
isolates can be identified or at least predicted based on the similarity to the database. Genotypic database-
dependent methods distinguish between sources of faecal contamination by identifying patterns in the genetic
material of bacterial isolates and matching them with the database from known host groups, while phenotypic
database-dependent methods rely on growth patterns produced when bacterial isolates are subjected to a
given test system. Certain genotypic methods may not require development of a database and are referred to
as “database-independent methods”. These include host specific polymerase chain reaction (PCR) (67, 224),
(terminal-restriction length fragment polymorphism (t-RFLP) (26, 27), toxin gene biomarkers (123, 217) and
immunological tests which differentiate between sources by identifying the presence of genetic markers
unique to the faecal bacteria of the targeted host groups. Database-independent methods operate at the
population level rather than the isolate level. Certain genotypic methods target viruses that occur in human
faeces while not present in animals and include those that detect human enteroviruses and adenoviruses or F+

8
coliphage, a virus that infects E. coli. Chemical methods such as detection of caffeine (249) and faecal sterols
analysis (183) has also been used to detect the source(s) of faecal contamination in surface waters.
1.5.1 Database-dependent genotypic methods
Genotypic methods target the whole genome (257, 279), particular genes (123, 217), or a specific DNA
sequence (26, 27) and characterize faecal indicator bacteria into different types according to their genotypic
profiles. These methods are briefly discussed below.
Pulsed field gel electrophoresis (PFGE)
PFGE considered as being the most popular methods for typing bacterial isolates (215). This method is highly
discriminatory and stable for analysis of numerous species of bacteria such as E. coli, enterococci,
Staphylococcus aureus, Acinetobacter spp., Pseudomonas aeruginosa, and Mycobacterium avium (13, 20, 117,
208, 231, 245, 248). In this method, DNA fingerprints are generated by in situ detergent-enzyme lysis and
digestion with infrequently cutting restriction endonucleases. The digested bacterial plugs are then subjected
to electrophoresis. The pulsed-field allows clear separation of very large molecular length DNA fragments
ranging from 10 to 800 kb. The electrophoresis patterns are visualized following staining of the gels with a
fluorescent dye. A reference database is then developed according to bacterial types and compared to
unknown environmental isolates. The key advantages of PFGE are excellent discriminatory power and
reproducibility (80). However, this technique has not been frequently used for MST studies and therefore
requires further evaluation.
Repetitive extragenic palindromic (rep)-PCR
Rep-PCR targets repetitive extragenic palindromic (rep) elements to compare bacterial genome diversity (46,
62, 152, 167, 242). This method uses PCR and specific primers such as BOX primer (i.e. 154 base-pair [bp]),
rep primer (35-40 bp) or enterobacterial repetitive intergenic consensus (ERIC primer) (124-127 bp) to
amplify specific portions of the microbial genome (284) followed by electrophoresis, staining and visualising
band pattern for each genomic DNA. This method is based on the hypothesis that isolates having
indistinguishable banding patterns can be regarded as genetically identical (i.e. genetically related). The
banding patterns are stored in a database and compared with unknown environmental isolates to identify the
source. This method has been extensively used for MST studies as it is rapid, simple and requires modest
resources (286). Amongst the genotypic methods, it is the least expensive and requires less technical
expertise. This method has shown to be reproducible in one single study (285) although changes in protocol
may yield different fingerprint pattern in different laboratories (249, 280).

9
Ribotyping
Ribosomal ribonucleic acids (rRNA) are an integral part of all living cells, and the genes coding rRNA tend to
be highly conserved (80). In this method, DNA is isolated from bacterial isolates and cut into fragments using
one single restriction enzyme such as HindIII (224) or a combination of two enzymes such as EcoR1 and pvuII
(243). The resulting fragments are separated based on their molecular weight using gel electrophoresis.
Hybridization with a labelled DNA probe creates a pattern of the fragments, which are specific to each strain.
Several studies have been conducted to determine the sources of E. coli using this method (43, 125, 224). The
fingerprints are then analysed by discriminant analysis and compared to a reference database. Ribotyping is
considered one of the most reproducible genotypic methods. Ribotypes are relatively stable characteristics
within a species, however, epidemiologically unrelated isolates sometimes demonstrate the same pattern,
thereby limiting their discriminatory power (194). Ribotyping may also not differentiate amongst animal host
groups. The success of this method relies on developing an extremely large database from a broad geographic
area as temporal and geographical variability may affect the ribotype pattern of faecal indicator bacteria (109,
125). In addition, the laboratory analyses are expensive and labour intensive (249).
Sequence-based source tracking of E. coli
This method is based on the enzyme β-glucuronidase that is present in most of the E. coli (193). Several
commercial methods (i.e. Colilert, ColiPAD) have been developed for the detection of E. coli, based on this
enzyme (32). A PCR method can be used to sequence β-glucuronidase gene (uidA) and distinguish E. coli
populations from surface waters (77). This method has been recently used to identify the sources of faecal
contamination in Michigan, USA (234). However, identical alleles (genetic variation of uidA) have been
isolated from several faecal samples while some were unique to individual host group (234). Application of
this method for faecal source tracking requires further evaluation.
1.5.2 Database-dependent phenotypic methods
Phenotypic methods measure the type and quantity of substances produced by faecal indicator bacteria. The
most commonly used phenotypic methods include ARA and CSU. Phenotypic methods are rapid and
inexpensive with regards to genotypic methods.
Antibiotic resistance analysis (ARA)
ARA is a phenotypic database-dependent method which has been used extensively for MST studies using E.
coli and/or enterococci. Antibiotics are used to prevent and treat infections in humans and domestic animals
as well as to promote growth in animals. Microorganisms develop resistance to antibiotics to which they are
regularly exposed. This method is based on the hypothesis that bacteria present in the intestine of different
animals, subjected to different types and concentrations of antibiotics would result in host-specific resistance
10
profiles. ARA fingerprints of unknown environmental isolates are compared to a reference database which is
developed from several known host groups.
There is currently no standard panel of antibiotics and concentrations used for this method. Antibiotics are
basically selected on the basis of their uses in different host groups. This method has shown to be successful in
discriminating E. coli and enterococci isolated from animal species (156, 164, 223). However, it has been
reported that the use of ARA with E. coli may not be informative as these groups of bacteria are intrinsically
resistant to certain antibiotics (e.g. vancomycine). This method has gained popularity because it is rapid,
simple, and inexpensive and can be performed in any basic microbiological laboratory. Furthermore, it
requires less technical expertise than any molecular methods. However, it has to be noted that, antibiotic
resistance is often carried on plasmids, which can be lost from cells under certain conditions such as
cultivation, storage or environmental changes (249). In addition, strains from different locations may show
variations in sensitivities to antibiotics due to variable antibiotic use among humans and livestock. A large
reference database is required that contain antibiotic resistance profiles (ARP) from a wider region. Changes
in antibiotic use may change the antibiotic resistance pattern of faecal bacteria. Furthermore, antibiotic
sensitivity is not useful in situations where the isolates show no significant resistance patterns.
Carbon source utilization (CSU)
The Biolog system is based on the CSU. It is a phenotypic database-dependent method that has been recently
used for MST (122) and compares differences in the utilization of several carbon and nitrogen substances by
bacterial isolates. This method has been developed for species identification and can be used with the Biolog
database to identify more than 2,000 species of microorganisms. This method has also been extensively used
for characterization and identification of microorganisms in medical microbiology (136), soil and aquatic
microbiology (213). Hagedorn et al. (122) successfully used the CSU method to identify the sources of faecal
contamination in surface water. This method is rapid and simple, requiring only a micro-plate reader to
determine CSU pattern. For each bacterial isolate, it yields a fingerprint pattern, which is saved to a database
and compared with the pattern of unknown environmental isolates.
Serotyping
Microorganisms of the same species can differ in terms of the expression of antigenic determinants on the cell
surface. Serotyping can be used to detect such differences and therefore is an important tool for
epidemiological studies of Gram-negative bacteria such as E. coli, Haemophilus influenza etc. This method has
been used to differentiate E. coli from different sources (59, 107). It has been reported that different serotypes
of E. coli can be associated with different host groups although shared serotypes among animals and human
have also been observed (28, 127, 221). This method however has a few limitations such as the expense of

11
typing reagents and many of the strains are either non-typeable or share identical serotypes (194). Serotyping
has not been widely used for MST and requires further evaluation.
Bacteriophage typing
Bacteriophages are viruses that are capable of infecting and lysing bacterial cells. A given phage strain may be
able to grow inside several strains of bacteria of the same species. Phage typing has been the mainstay of
strain discrimination for many years (33). In this technique, isolates are characterized by their susceptibility
or resistance to lysis by each member of a panel of bacteriophages (194). Phage typing can only be
undertaken at reference laboratories because it requires maintaining stocks of biologically active phages and
control strains. Many strains are non-typeable with the available bacteriophages panels and therefore
new/other phages are often needed to be included in the panel. It has also been reported that phage typing
has a poor discriminatory power (194).
Biochemical fingerprinting
The biochemical fingerprinting method is based on the kinetics measurements of bacterial metabolism of
several different substrates (175, 204). It is based on the hypothesis that bacterial isolates, belonging to the
same clone, share identical metabolic properties, whereas isolates with different genotypes have differences
in one or more of the measured metabolic processes, and thus will show different activities in the reactions
involved. Kühn and Möllby (174) developed a typing system based on biochemical fingerprinting and
numerical analysis of data obtained from the typing of bacterial isolates. This system is semi-automated and
was originally developed for the typing of E. coli (204). However, it was further developed for typing of other
metabolically active bacteria such as enterococci (35, 143, 287), salmonella species (158, 159), Klebsiella
species (172), aeromonas species (86, 177, 233) and many others (34). The system has been shown to have a
high degree of discrimination and reproducibility (143, 160, 173, 176, 287) and the stability of the typing
markers has been assessed upon subculturing and /or storage (157). The system is an ideal method for typing
a large number of isolates in a short period of time. In addition, this method could be easily performed in any
laboratory without the need of sophisticated equipments. The limitation of this system is that it can only be
used for bacteria that are metabolically active. This method has not been frequently used in MST studies.
1.5.3 Database-independent methods
In recent years, several database-independent methods have been used in MST studies (26, 27, 149, 214, 217).
These methods are generally PCR-based and offer several advantages over database-dependent methods. For
instance, these methods circumvent the need for the cultivation of bacterial isolates and the development of a
reference database. PCR amplification of 16S rDNA from bacteroides, has been used for MST studies (26, 27,
85), however the use of bacteroides as an indicator for this method requires further investigation as they do
not survive in the environment for lengthy periods.

12
Reverse transcription PCR (RT-PCR) and quantitative PCR (qPCR) have also been used to detect human
viruses such as adenoviruses and enteroviruses in surface waters (214). Adenoviruses are exclusively found
in human faeces while enteroviruses are found in cattle and other domestic animals (149, 187, 230). However,
these indicators may not discriminate among animal host groups.
PCR detection of E. coli virulence genes, which are clinically significant may also be a potential method and
would provide a better indication of water health (109). Biomarkers, based on enterotoxin genes in E. coli
have also been proposed (217). The advantage of such method is that, it targets clinically significant E. coli
rather than commensal E. coli found in the intestine.
Detection of bacteriophages has also been used for MST in surface waters. Bacteriophages are suitable to
indicate human contamination and are not capable of further discriminating among animal host groups (263).
In addition, host phage assay (i.e. B. fragilis) is cumbersome task due to their presence at low number in
surface waters (259).
1.5.4 Chemicals methods
Optical brighteners
It has been reported that the laundry detergent compounds such as optical brighteners and ethylenediamine
tetra acetic acid (EDTA) have been found in groundwater (6, 19, 82, 155, 244). Optical brighteners can be used
as a potential indicator of grey water discharge (244). However, this method is only suitable for PS
identification. In addition, this method does not indicate public health risks that may be associated with
domestic on-site wastewater treatment systems (OWTSs) failure.
Caffeine and pharmaceuticals
Caffeine and human pharmaceuticals have also been used as potential indicators of contamination of surface
and ground waters by OWTSs (251). Caffeine is of anthropogenic origin and is, found in beverages and many
pharmaceutical products. It has been suggested that the presence of caffeine in the environment could
indicate the presence of human sewage (39). Seiler et al. (251) reported a low concentration of caffeine in
shallow wells compared with high concentration found in domestic septic tanks. The reason could be due to
the fact that dilution and partial breakdown of these compounds may occur either in the septic tank itself or in
the absorption field (251). However, application of these compounds as indicator of contamination is limited
because high concentration of these chemicals must be present in receiving waters. It has been reported that
only 3% of ingested caffeine is excreted in the urine (267). A dilution of more than 1:200 would make it
difficult to detect (244).

13
Pharmaceuticals substances such as pentobarbital, meprobamate, and phensuximide are used to cure diseases
(251). These substances are also potential wastewater indicators and have also been detected in groundwater
(71).
Fluorescent dye
Fluorescent dyes can also be used to identify the point sources of contamination such as OWTSs (244).
Charcoal packets are placed at suspected sources(s) or contaminated water and retrieved one or two weeks
after the time of placement and analysed for the presence of dye. If the dye is detected from the contaminated
water, then the place where the dye was deposited is contributing to pollution (244). This method however,
requires intensive field sampling and landowner cooperation to investigate all possible sources (244).
Faecal sterols
Human and animal faeces contain sterols and stanols (a by product of sterols). The sterol profiles of human
and animal faeces vary from each other due to different feeding habitat, gut flora and types of metabolism.
Sterols such as 5ß-stanols and coprostanol are dominant in human faeces and have not been naturally found
in surface waters unless contaminated by human faeces (283). Similarly, animals such as cattle, sheep and
horses faeces are dominated by 24-ethylcoprostanol which is different from human sterol and can be used as
biomarkers for faecal contamination from these host groups (183). Leeming et al. (183) profiled a range of
sterols and stanols in human and animal faeces and concluded that sterol/stanols ratios are distinctive
enough to differentiate between human and animal host groups. This method is considered a viable
alternative to microbiological indicators of faecal contamination (207) and has been used to identify faecal
contamination in surface waters (184). This method is appropriate for specific studies investigating the
proportion of human and animal faecal contamination and therefore, not suitable for the identification of NPS
contamination (244). The laboratory analysis can be expensive and labour-intensive, requires filtration of
large volume of water.
1.6 Comparison of methods
Whilst most of the MST methods have shown to be successful in determining the dominant source(s) of faecal
contamination in surface waters, an overview of their advantages and disadvantages seems imperative before
practical application of these methods for any specific ecological studies.
The advantages and disadvantages of these methods have been discussed in several reviewed papers (80, 197,
199, 249). For instance, it has been shown that genotypic methods, although quite discriminatory, some of
them can be laborious and /or expensive or not suitable for ecological studies where a large number of
isolates need to be tested (125, 215). In contrast, phenotypic methods such as ARA can be used to test a large
number of isolates and is rather inexpensive. However, it is known that antibiotic resistance genes can be lost

14
from or gained by bacteria under certain conditions (90, 249). Chemical methods such as caffeine or faecal
sterol detection require stringent sampling, are labour intensive and can be quiet expensive.
A general consensus from the literature is that no single method is clearly superior to others (116, 265, 266)
and that a combination of different methods where applicable should be used in ecological studies to obtain
confirmatory results. This will certainly increase the confident levels for correct sources identification.
However, such an approach depends on several factors including:
• The objective of source identification (i.e. TMDL development and/or water health assessment).
• Scale of source identification (human vs. animals or individual host groups.
• Size of the catchment.
• Number of PS and NPS sources in the catchment and
• Laboratory cost and turnaround time.
Table 1.1 outlines the advantages and disadvantages of most commonly used source tracking methods.

15
Tab
le 1
.1 A
dv
an
tag
es
an
d d
isa
dv
an
tag
es
of
sou
rce
tra
ckin
g m
eth
od
s.
Met
ho
ds
(ref
eren
ces)
T
arge
t in
dic
ato
r A
dva
nta
ges
Dis
adva
nta
ges
Gen
oty
pic
met
ho
ds
1
PF
GE
(25
5)
E. c
oli
En
tero
cocc
i
1. H
igh
ly d
iscr
imin
ato
ry
2. H
igh
ly r
ep
rod
uci
ble
3
. Qu
an
tita
tiv
e
4. D
iscr
imin
ate
iso
late
s fr
om
mu
ltip
le h
ost
gro
up
s
1. R
eq
uir
es
de
ve
lop
me
nt
of
a l
arg
e r
efe
ren
ce d
ata
ba
se
2. B
act
eri
al
cult
ure
re
qu
ire
d
3. T
oo
se
nsi
tiv
e t
o b
roa
dly
dis
crim
ina
te s
ou
rce
4. D
ata
ba
se t
em
po
rall
y a
nd
ge
og
rap
hic
all
y s
pe
cifi
c
5. L
ab
ou
r-in
ten
siv
e
6. R
eq
uir
es
spe
cia
l tr
ain
ing
2
Re
p-P
CR
(43
, 67
, 15
3, 1
97
, 25
2)
E. c
oli
1
. Ra
pid
2. R
eq
uir
es
mo
de
st r
eso
urc
es
3. R
eq
uir
es
less
te
chn
ica
l e
xp
ert
ise
4. Q
ua
nti
tati
ve
5. D
iscr
imin
ate
iso
late
s fr
om
mu
ltip
le h
ost
gro
up
s
1. R
eq
uir
es
de
ve
lop
me
nt
of
a r
efe
ren
ce d
ata
ba
se
2. B
act
eri
al
cult
ure
re
qu
ire
d
3. D
ata
ba
se t
em
po
rall
y a
nd
ge
og
rap
hic
all
y s
pe
cifi
c
4. R
esu
lts
ma
y v
ary
in
dif
fere
nt
lab
ora
tori
es
du
e t
o
dif
fere
nt
pro
toco
ls
3
Rib
oty
pin
g
(43
, 44
, 12
6, 1
79
, 22
4, 2
49
, 25
0, 2
97
).
E. c
oli
En
tero
cocc
i
1. H
igh
ly s
tab
le
2. D
iscr
imin
ate
iso
late
s fr
om
mu
ltip
le h
ost
gro
up
s
3. Q
ua
nti
tati
ve
4. C
an
be
au
tom
ate
d
1. R
eq
uir
es
de
ve
lop
me
nt
of
a l
arg
e r
efe
ren
ce d
ata
ba
se
2. B
act
eri
al
cult
ure
re
qu
ire
d
3. C
om
ple
x f
ing
erp
rin
tin
g p
roce
du
re
4. L
ab
ou
r in
ten
siv
e
5. D
ata
ba
se t
em
po
rall
y a
nd
ge
og
rap
hic
al
spe
cifi
c
6. L
ack
of
dis
crim
ina
tory
po
we
r
7. R
eq
uir
es
spe
cia
l tr
ain
ing
Ph
eno
typ
ic m
eth
od
s
1
AR
A
(63
, 10
0, 1
13
, 12
1, 1
29
, 22
3, 2
53
, 29
4,
29
9, 3
02
, 30
3, 3
04
)
E. c
oli
En
tero
cocc
i
1. R
ap
id
2. R
eq
uir
e l
imit
ed
tra
inin
g
3. Q
ua
nti
tati
ve
4. D
iscr
imin
ate
iso
late
s fr
om
mu
ltip
le h
ost
gro
up
s
5. I
ne
xp
en
siv
e
6. Q
ua
nti
tati
ve
1. R
eq
uir
es
de
ve
lop
me
nt
of
a r
efe
ren
ce d
ata
ba
se
2. B
act
eri
al
cult
ure
re
qu
ire
d
3. A
nti
bio
tic
resi
sta
nce
ca
rrie
d o
n p
lasm
ids
wh
ich
ca
n
be
lo
st o
r g
ain
ed
du
rin
g c
ult
iva
tio
n a
nd
sto
rag
e
4. D
ata
ba
se t
em
po
rall
y a
nd
ge
og
rap
hic
all
y s
pe
cifi
c
5. I
sola
tes
on
ly r
esi
sta
nt
to a
nti
bio
tics
ca
n b
e t
yp
ed
6. C
an
yie
ld f
als
e-p
osi
tiv
e.

16
2
C
SU
(12
2)
E. c
oli
En
tero
cocc
i 1
. Ra
pid
2. R
eq
uir
e l
imit
ed
tra
inin
g
3. H
igh
sta
bil
ity
4. Q
ua
nti
tati
ve
5. D
iscr
imin
ate
iso
late
s fr
om
mu
ltip
le h
ost
gro
up
s
1. R
eq
uir
es
de
ve
lop
me
nt
of
a r
efe
ren
ce d
ata
ba
se.
2. b
act
eri
al
cult
ure
re
qu
ire
d
3. D
ata
ba
se t
em
po
rall
y a
nd
ge
og
rap
hic
all
y s
pe
cifi
c
4. M
eth
od
s v
ari
ati
on
3
Bio
chem
ica
l fi
ng
erp
rin
tin
g
(3, 4
, 29
1)
E. c
oli
En
tero
cocc
i
1. R
ap
id
2. S
em
i-a
uto
ma
ted
3. R
eq
uir
e l
imit
ed
tra
inin
g
4. H
igh
sta
bil
ity
5. Q
ua
nti
tati
ve
6. D
iscr
imin
ate
iso
late
s fr
om
mu
ltip
le h
ost
gro
up
s
1. R
eq
uir
es
de
ve
lop
me
nt
of
a r
efe
ren
ce d
ata
ba
se
2. T
arg
et
ind
ica
tor
cult
iva
tio
n r
eq
uir
ed
3. D
ata
ba
se t
em
po
rall
y a
nd
ge
og
rap
hic
all
y s
pe
cifi
c
4. O
nly
me
tab
oli
call
y a
ctiv
e b
act
eri
a c
an
be
ty
pe
d
Dat
abas
e in
dep
end
ent
met
ho
ds
1
Ho
st-s
pec
ific
PC
R
(26
, 27
, 36
, 10
3, 1
69
, 18
8)
Ba
cte
roid
es
Bif
ido
ba
cte
ria
En
tero
cocc
i
Rh
od
oco
ccu
s
F+ c
oli
ph
ag
e
Ad
en
ov
iru
s
En
tero
vir
us
1. R
ap
id
2. D
ev
elo
pm
en
t o
f a
re
fere
nce
da
tab
ase
no
t
req
uir
ed
3. B
act
eri
al
cult
ure
no
t re
qu
ire
d
1. N
on
-qu
an
tita
tiv
e
2. M
ay
no
t su
rviv
e l
on
g i
n n
atu
ral
wa
ters
.
3. P
rim
ers
cu
rre
ntl
y n
ot
av
ail
ab
le f
or
all
re
lev
an
t
ho
sts.
2
Vir
us-
spec
ific
PC
R
(88
)
Ad
en
ov
iru
s
En
tero
vir
us
1. R
ap
id
2. D
ev
elo
pm
en
t o
f a
re
fere
nce
da
tab
ase
no
t
req
uir
ed
3. T
arg
et
ind
ica
tor
cult
iva
tio
n n
ot
req
uir
ed
4
. Ho
st s
pe
cifi
c
5. H
igh
se
nsi
tiv
ity
1. N
on
-qu
an
tita
tiv
e
2. C
an
id
en
tify
on
ly h
um
an
so
urc
es
3. L
ow
in
nu
mb
er,
re
qu
ire
s l
arg
e s
am
ple
siz
e
4. C
an
be
ab
sen
t w
he
n h
um
an
co
nta
min
ati
on
ev
ide
nt
5. C
on
cen
tra
tio
n a
nd
pu
rifi
cati
on
of
vir
al
nu
cle
ic a
cid
fro
m e
nv
iro
nm
en
tal
sam
ple
s ca
n b
e d
iffi
cult
.
3
Gen
e sp
ecif
ic P
CR
(21
7)
E. c
oli
to
xin
ge
ne
1. D
ev
elo
pm
en
t o
f a
re
fere
nce
da
tab
ase
no
t
req
uir
ed
2. B
act
eri
al
cult
ure
no
t re
qu
ire
d
3. P
rov
ide
dir
ect
ev
ide
nce
th
at
po
ten
tia
l h
arm
ful
ba
cte
ria
pre
sen
t
4. R
ap
id
1. N
on
-qu
an
tita
tiv
e
2. C
an
no
t d
iscr
imin
ate
am
on
g m
ult
iple
ho
st g
rou
ps
3. i
de
nti
fy o
nly
hu
ma
n
4. P
rim
ers
cu
rre
ntl
y n
ot
av
ail
ab
le f
or
all
re
lev
an
t
ho
sts.
5. R
eq
uir
es
spe
cia
l tr
ain
ing

17
4
F+ R
NA
co
lip
ha
ge
(5
, 55
) F
+ c
oli
ph
ag
e
1. D
ev
elo
pm
en
t o
f a
re
fere
nce
da
tab
ase
no
t
req
uir
ed
2. D
iscr
imin
ate
iso
late
s b
etw
ee
n h
um
an
an
d
an
ima
ls
3. H
igh
sta
bil
ity
1. N
on
-qu
an
tita
tiv
e
2. C
an
id
en
tify
on
ly h
um
an
3. L
ack
of
ho
st s
pe
cifi
city
4. C
on
cen
tra
tio
ns
can
be
lo
w i
n e
nv
iro
nm
en
tal
sam
ple
s
5. C
oli
ph
ag
es
cult
iva
tio
n r
eq
uir
ed
Ch
emic
al m
eth
od
s
1
Op
tica
l b
rig
hte
ne
rs
- 1
. In
dic
ate
hu
ma
n c
on
tam
ina
tio
n
2. I
ne
xp
en
siv
e
3. s
imp
le
1. M
ay
no
t in
dic
ate
re
cen
t co
nta
min
ati
on
2. C
an
no
t id
en
tify
no
n-p
oin
t so
urc
es
3. D
oe
s n
ot
pro
vid
e i
nfo
rma
tio
n r
eg
ard
ing
pu
bli
c
4. h
ea
lth
ris
ks
2
Ca
ffei
ne/
ph
arm
ace
uti
cals
-
1. I
nd
ica
te h
um
an
co
nta
min
ati
on
1
. An
aly
sis
ex
pe
nsi
ve
2. E
asi
ly d
eg
rad
ed
by
so
il m
icro
be
s
3. S
en
siti
vit
y i
ssu
es
4. D
ilu
tio
n m
ak
es
it d
iffi
cult
to
de
tect
in
re
ceiv
ing
wa
ters
3
F
aec
al
ster
ols
an
aly
sis
(10
3, 1
83
)
- 1
. Hig
h s
en
siti
vit
y
2. C
an
dis
tin
gu
ish
be
twe
en
hu
ma
n a
nd
an
ima
l
con
tam
ina
tio
n.
1. E
xp
en
siv
e
2. c
ert
ain
ste
rols
Ca
n b
e f
ou
nd
in
pla
nts
3. E
asi
ly d
eg
rad
ed
by
so
il m
icro
be
4
. Ma
y n
ot
ind
ica
te r
ece
nt
con
tam
ina
tio
n
5. N
ot
rele
va
nt
to h
um
an
he
alt
h

27
1.7 Application of database dependent methods
1.7.1 Antibiotic resistance analysis (ARA)
ARA has been widely used in MST studies (100, 113, 121, 129, 223, 253, 294, 299, 302, 303, 304). For
example, a large enterococci database (i.e. 7,058 isolates) was developed from human, livestock and wildlife
sources from a watershed in Virginia. Cattle were identified as predominant (more than 78%) sources of
faecal contamination when this database was used in an ecological study (121). Another study developed a
database for enterococci and E. coli from 8 host groups in order to identify the sources of faecal contamination
in sub-tropical waters in Florida (129). Both enterococci and E. coli databases were in agreement in this study
in identifying humans as the predominant sources of contamination. Graves et al. (113) developed an ARA
database comprising of 1,174 enterococci isolates from 7 host groups. In all, 2,012 isolates were tested from a
watershed in Virginia, of which 50% were identified as livestock followed by wildlife (40%) and human
(10%). Whitlock et al. (299) compared 2,398 E. coli isolates from 4 host groups in an urban watershed in
Florida, and reported that the majority of faecal E. coli isolates in the studied creek were from wild animals,
followed by humans and dogs. Geary and Davies (100) used ARA to identify the sources of faecal
contamination in a shellfish growing area in NSW, Australia. In all, 166 enterococci isolates were tested from 4
host groups. Application of this database in an ecological study could not identify any dominant source.
1.7.2 Carbon Source Utilization (CSU)
Hagedorn et al. (122) developed a CSU database of 365 enterococci isolates from human (i.e. 105 isolates) and
non-human (i.e. 260 isolates) sources. Ninety unknown enterococci isolates were collected from 3 sampling
sites with pre- suspected sources. The database was able to identify the suspected sources correctly. However,
this method has not been frequently used in MST and requires further evaluation.
1.7.3 Ribotyping
Parveen et al. (224) analysed 238 E. coli isolates from human and nonhuman sources and reported that 97%
of the non-human and 67% of human ribotypes were correctly classified by discriminant analysis (DA).
Similarly, Carson et al. (43) analysed 287 E. coli isolates from different host groups of which 95% were
correctly identified as human and 99% were correctly identified as animals. It has to be noted that none of
these databases have been used in ecological studies. Scott et al. (250) tested 515 E. coli isolates from a
watershed in Southern California. Of these, 88% isolates were identified as animal sources and the remaining
was identified as humans. Samadpour and Checowitz (243) were able to identify more than 71% of ribotypes
collected from a watershed in Seattle, WA, against those in their database. This study, however, did not
provide information regarding how ribotyping was performed or the data was analysed. It should be noted
however, that ribotyping may not be a suitable method for discriminating isolates from different animal
species (250).

28
1.7.4 Pulsed-field gel electrophoresis (PFGE)
Parveen et al. (225) used PFGE to test 32 E. coli isolates from estuarine waters receiving faecal contamination
from a variety of sources but were not able to distinguish between human and animal sources. However,
Simmons et al. (257) tested a large collection (i.e. 439) of E. coli isolates and identified wild animals and dogs
as predominant sources. This method has not been extensively used in MST studies and requires further
evaluation.
1.7.5 Repetitive extragenic palindromic (rep) PCR
Dombek et al. (67) reported that rep-PCR fingerprinting of E. coli strains can be used to differentiate between
human and animals host groups and reported that 100% of the chicken and cow isolates, 83% of the human
isolates were assigned to the correct host groups. Another study used ARA in combination with rep-PCR to
identify the sources of E. faecalis in Pensacola Beach, Florida and identified seagulls as main contributor.
1.7.6 Methods comparison studies
The performance of a combination of ARA, AFLP and 16S rRNA sequences has been evaluated to differentiate
319 E. coli isolates from human and animals. Among all the methods tested, AFLP performed better than
others. Moyda et al. (206) evaluated PFGE, rep-PCR and ribotyping to identify the sources of contamination in
water samples spiked with faeces from known sources. All methods were able to identify the dominant
sources. However, the methods also yielded false positive rates as high as 57%. In another study, Stoeckel et
al. (266) compared seven protocols including ARA, CUP, ribotyping using the restriction enzyme HindIII and
EcoR1, PFGE, rep-PCR and BOX-PCR. A low accuracy obtained for all methods tested.
1.8 Key assumptions of MST methods
In MST methods, the clonal population structure of indicator bacteria is used to categorize microorganisms on
the basis of their genotypic or phenotypic fingerprint. However, the successful outcome of MST methods
depends on several key assumptions (109). These are briefly discussed below.
1.8.1 Host specificity
The indicator bacterium should be host specific that contribute faecal contamination to waterways. However,
certain indicator bacteria appear not to be quite host-specific as they are present in multiple host groups.
These groups of indicator bacteria are referred as cosmopolitan (299). It has been argued that the lack of host
specificity could be due to either insufficient sampling of indicator bacteria or the lack of discriminatory
power of the typing method used. It has to be noted though that highly discriminatory method such as PFGE

29
identifies cosmopolitan isolates. Cosmopolitan host distribution is well documented in E. coli (125, 197) and
F+ specific coliphages (55). However, no single study has specifically addressed this issue.
1.8.2 Temporal stability
The indicator bacterium should be stable within individual host group over time. E. coli populations which
occur only once at a single sampling occasion are referred to as transient populations, whilst others occurring
multiple times are referred to as resident populations (48). These resident populations within host group
should be stable over time, and if not, then the database needs to be updated regularly if being utilised in
ecological studies. The temporal stability of E. coli in different host groups is well documented. In a recent
study, individual cattle within a cattle herd were sampled at random on several occasions. The residents E. coli
represented only 8.3% of 240 isolates tested from the herd (147). These findings suggested that the E. coli
obtained from a single host at a given time might not be representative of E. coli populations in the faeces of
the same host over time. It is postulated that the lack of temporal stability could also be due to a small number
of isolates tested in these studies (265). However, a recent study demonstrates that a large ARA database of
enterococci is stable for up to a year (304).
1.8.3 Geographical stability
The indicator bacterium should exhibit geographical stability and therefore a database developed from one
geographical area is valid for another geographical area. Geographical variation can limit the universal
application of a database. Little is known on the geography of faecal indicator bacteria. Miller and Hartl (201)
tested E. coli strains from farm animals and humans and reported that strains are clonal in nature and not
geographically specific. Another recent study tested 568 E. coli from Idaho and at three locations in Georgia
for four host groups, reporting that geographical variation exist among these host groups (125).
1.8.4 Representativeness
Database representativeness is one of the most important factors in database dependent MST studies. This
factor (i.e. how many isolates required to develop a representative database) has not been addressed in any
studies. However, it has to be noted that, cost and time can limit this factor. Development of a large genotypic
reference database could be quite costly depending on the typing method used with regards to phenotypic
database. The size of the database also depends on the discriminatory ability of the typing methods used. For
instance, a large database may be required to capture the genetic variability, if highly discriminatory PFGE is
used. Under sampling of faecal bacteria can compromise representativeness of a database leading to its
inability to capture the temporal or geographical variability as well as high diversity of faecal indicator
bacteria (299, 304). A recent study has shown that rarefaction analysis of E. coli rep-PCR database comprised
of 1,535 isolates from 13 host groups was not close to saturation (153), which demonstrated the high
30
diversity of E. coli. It has been suggested that stringent sampling protocols may be required to capture the
genetic diversity that exists in E. coli (147).
1.8.5 Primary versus secondary habitat
Gastrointestinal (GI) tracts of host groups are considered as primary habitat for faecal indicator bacteria while
environments are secondary habitat. One of the hypotheses in MST is that the clonal composition of the
isolates from water (i.e. secondary habitat) represents the clonal composition of the isolates in the host
groups (i.e. primary habitats) responsible for faecal inputs to the environment. However, several studies have
shown that distinct differences exist among the primary versus secondary habitats of E. coli. Whittam (301)
tested 113 E. coli electrophoretic types (by multilocus enzyme electrophoresis or MLEE) from bird faeces
(primary habitat) and the litter (secondary habitat) on which they had defecated. Only 10% of the isolates
were found in both the primary and secondary habitat. Another study using multi locus electrophoretic
enzyme of E. coli from two septic tanks and their associated residents showed that E. coli strains from only
one septic tank was similar to those of the residents. In contrast strains recovered from the septic tank of the
second household were genetically distinct from strains recovered from its associated residents. Based on the
differences between the growth rate and temperature response of these strains they concluded that changes
in the primary and secondary habitat of the strains could limit efforts to identify the sources of faecal pollution
in the environment (110). Topp et al. (274) observed that E. coli isolates from swine manure slurry
(secondary habitat) were different from soil inoculated with the same slurry (tertiary habitat), although many
types were shared between the two habitats. The shift of faecal indicator in the primary versus secondary
habitat also may be due to under sampling and require further evaluation.
1.9 Concluding review remarks
Throughout this review of the literature, it was established that certain indicator bacteria such as enterococci
and E. coli have been used more frequently than others, but that none of these indicators are regarded as
universal or posses all criteria of an ideal faecal indicator bacteria. Similarly, while some MST methods have
been used more frequently than others, there is no universal method available to address all required criteria
of a suitable typing method.
It was also been found that the performance of the majority of database-dependent methods were either
limited by their size, representativeness and discriminatory power, or that their suitability as a MST method
has not been fully evaluated in ecological studies and requires further evaluation.
1.10 Thesis direction and structure
The objectives of this thesis (section 1.2) focus on an evaluation of the ecological usefulness of a biochemical
fingerprinting method in microbial source tracking. A catchment based study was designed, utilizing a

31
catchment known to have poor surface water quality that could be derived from either / both failing septic
systems or a varity of domesticated (farm and pet) or wild animals. In a catchment based approach a
comparison is made between componets of a catchment (sub-catchments or reaches) that exhibit a variety of
differing land-use. The following chapter (Chapter 2) explores whether the biochemical fingerprinting method
can be used to detect faling septic systems in the selected catchment. In this catchment there has been much
argument as to whether the high incidence of on-site septic system failure on properties contributes to low
surface water quality. In Chapter 3 the ecological utility of the technique is explored further by developing a
host - species specific database. Essentially Chapter 3 investigates whether the method is sufficiently sensitive
to discriminate amongst different animal species, and explores how large database is required. How
representative such a developed database would then be in an adjacent and similar catchment is then
evaluated in Chapter 4, where the developed database is compared to a similar localised database. The final
component of this thesis (Chapter 5) seeks to develop a sub-database of E. coli strains from animal host
groups that are carrying one or more virulence genes and to compare with those found in surface waters, in
order to identify the potential sources of such clinically significant strains.

32
CHAPTER 2
Evidence of septic system failure: a catchment based study
2.1 The ecological context of this thesis
Septic systems are designed to accept domestic wastewater and prevent biological and nutrient contaminants
from entering surface and ground waters. A septic system consists of a tank that provides preliminary
treatment of domestic household wastes, allowing sedimentation of solids and flotation of fats and greases,
and a soil absorption field where final treatment includes biological stabilization and pathogen removal (98).
Such systems are common in non-sewered urban and rural residential areas (98). For instance, in the United
States more than 25% of people rely on septic systems alone (241, 246) and for Australia this figure is around
12% (97). Septic systems may fail and the failure rate can be considerably high (i.e. more than 40% in
Australia) (146, 247). However, the rate may vary in different communities, and failure rates of around 55%
and 82% for two communities in South Australia (SA) have been reported (96).
The poor performance of septic systems and the potential for environmental damage have been addressed in
Australia (97, 219). For instance, bacteriological monitoring for Coffs Harbour City Council, NSW waterways
reported a 10-fold increase in faecal coliform for a residential catchment serviced by septic systems when
compared with another catchment serviced by centralized STP. Beard and co-workers (24) observed high
levels of faecal coliform in catchments with variable landuse. However, the highest level of faecal indicator
bacteria was found in two catchments with high density of septic systems. Another study at Benalla, Vic,
Australia reported that contamination of ground waters in areas where the septic systems density exceeded
more than 15/km2 (140).
From the public health point of view, there is a concern regarding the impact of such failed septic systems on
both surface (24) and ground waters quality (138, 144). In the United States, several studies have reported
the potential impacts of failing systems to ground waters (15, 106, 238, 246, 306). The literature, however,
has few detailed field evaluation (19, 52, 99, 235, 290). In Australia, only a few studies investigated the
impacts of septic systems on ground water quality (99, 138, 140, 300). It has to be noted that, none of these
studies have provided direct evidence of septic system failure on surface water quality degradation.
2.1.1 Failing septic systems
A failing septic system is considered one that discharges nutrients and pathogens at concentrations exceeding
standard water quality guidelines (185). For instance, Australian standard 1547 (18) for disposal systems for
effluent from domestic premises has recommended that after treatment of wastewater, the biological oxygen

33
demand, suspended solids and faecal coliforms should not exceed 20 mg/L, 30 mg/L and 10 organisms/ 100
ml respectively, and that any system whose discharges exceeding those criteria is considered to be failing.
The failure of septic tanks generally means a failure of the absorption field, which consists of a distribution
box where the wastewater is collected and distributed equally to a network of perforated pipes covered with
geo-textile fabric and/or loamy soil (185). Absorption fields mainly rely on the surrounding soil to treat
wastewater, where microorganisms digest the organic matter and eventually form a biological mat, leaving
solids and nutrients in the wastewater (185, 202). The removal of biological constituents occurs in the mat
(200), which slows the water movement through the soil and helps to keep the area below the mat from
becoming saturated when all of its pores are filled with water. The most frequent cause of septic system
failure is clogging of the absorption field which is mainly caused by the organic matter of the effluent (132,
170). Neglecting to pump the tank may result in increased levels of solids going into the absorption field
(133).
In the soil anaerobic bacteria react with the sulphur found in the wastewater and convert it to sulphides.
These sulphides again react with the metals in the soil and precipitate as black substances. The anaerobic
bacteria also produce polysaccharide slimes and gums which hinder and eventually stop the natural action of
the absorption field by clogging the channels of flow and therefore preventing aerobic bacterial activity (308).
This results in slow absorption of wastewater that can lead to blockage and eventually failure of the
absorption field. In terms of system failure, 75% of all system failures have been attributed to hydraulic
overloading (145). This failure can also be caused by other factors, such as:
� the absorption area being too small or not complying with standard,
� unsuitable soil,
� failure to pump or improper feeding of the system,
� undersized or improperly designed systems (145),
� using more water that the soil can absorb,
� physical damages to pipeline,
� compact soil in the absorption field and
� lack of maintenance (108, 260).

34
2.1.2 Impacts of failing septic systems
Human health
Human can be exposed to septic effluents by direct contact with effluents that are overflowing from the tank
or indirect exposure such as contamination of ground water that are used for drinking water. Exposure to
septic effluents may pose a serious health risk as it may contain pathogenic microorganisms such as viruses,
bacteria, protozoa and helminthes (60, 95, 200). For instance, an outbreak of hepatitis A was attributed to
stormwater contaminated by wastewater (289). Transmission of hepatitis E, which is the most common form
of acute viral hepatitis, occurs primarily via water contaminated with faeces. It has been reported that in the
United States, 14% of all waterborne disease caused by ingestion of enteric bacteria, which may be partly
originates from septic effluents (57).
Pathogenic E. coli strains such as enteropathogenic E. coli (EPEC), enterotoxigenic E. coli (ETEC), and
enterohemorrhagic E. coli (EHEC) are responsible for severe diarrhoeal disease and can be transmitted to
human via contaminated wastewater (51, 180). In 1975, more than 2,000 people in Oregon, USA developed
gastrointestinal disorder caused by EPEC E. coli (239). E. coli O157:H7 outbreak also has been reported in
recreational waters (49, 163). Waterborne outbreaks of shigellosis have been reported from recreational
waters contaminated with wastewater (81, 277). Weissman (296) reported an outbreak of shigellosis in
which more than 1,200 people were infected. Failing on-site wastewater treatment systems (OWTSs) were
sourced as primary contributor. Other types of bacteria such as Vibrio, Mycobacterium, Clostridium, Leptospira,
and Yersinia species have been isolated from untreated wastewater (200).
An outbreak of Norwalk related virus has been reported and OWTSs have been identified as the probable
cause of contamination (270). The reoviruses and adenoviruses, known to cause respiratory illness,
gastroenteritis and eye infections and have been isolated from wastewater (200). Protozoan such as
Cryptosporodium parvum, Cyclopora and Giardia lambila, found in wastewater, are of important concern in
terms of their disease producing capability in human (60). Wallis and co-workers (292) have reported an
outbreak of waterborne giardiasis in Temagami, Ontario and the source of the outbreak was traced to
municipal wastewater systems leaking to surface water.
Ground water quality
Effluents from failed septic systems may deteriorate ground water quality (98). In addition, ground water
could be contaminated biologically by percolation from sources such as surface spreading of treated and
untreated wastewater and land spreading of sludge (288). Tuthill et al. (278) reported that improperly
constructed septic system may cause contamination of ground water with high levels of coliform and nitrates.
United States EPA has identified the septic tanks as the third most common source of groundwater
contamination. It has been reported that bacteria have been found 18.6 km downstream of the source of
35
contamination, which were thought to be derived from defective septic systems (83, 192). The long distance
transport of bacteria and viruses in groundwater has been reported in several other studies as well (65, 120).
Vaughn et al. (282) reported that human enteric viruses were detected 60 m away from septic systems. Yates
and Yates (307) reported that virus transport in ground water could be quite rapid, at 400 ft within 100 days.
Another study at Venus Bay, Vic, Australia (138), has reported that the shallow aquifer was contaminated with
significant levels of faecal bacteria up to 500 m distance from the cluster of septic systems. Finally, Bechdol et
al. (25) reported the potential groundwater contamination by viruses from septic system discharges and
predicted that wells were at risk when septic systems were located 30 m up gradient.
Recreational water quality
Bacterial contamination has been reported for impaired recreational water quality in the United States (281).
Natural Resources Defence Council (210) reported that approximately 600 to 1,300 beach closures from 1992
to 1997 due to degradation of bathing water quality caused by bacterial contamination. U.S EPA has reported
that septic systems and storm water drainage are potential sources of such contamination. High levels of
faecal bacteria are associated with increased risk of diseases for recreational waters (40). The sewer
overflows are also responsible for contributing Giardia and Cryptosporadium in drinking and recreational
waters (91, 168). Swimmers are at higher risk of gastrointestinal and respiratory illness and eye, ear and skin
infections at beaches known to be polluted (87, 115). A recent survey of water quality at swimming beaches
around Dodges Ferry, Tasmania, Australia reported higher faecal indicator bacteria violating acceptable level
(237). However, the source of the microbiological contamination was unclear. Storm water run off and failing
septic systems considered contributing sources. Another survey reported that in late 1999, a 1000 km long
bloom of toxic blue-green algae occurred on the Murray-darling River in Eastern Australia. In this case, the
specific source could not be identified and non-point discharges were reported as major contributing factors
(118).
Failed septic systems may release nutrients and potential pathogenic microorganisms to the surface and/or
ground waters, but no study to data has provided direct evidence of septic system failure by tracing the faecal
indicator bacteria found in surface waters back to the septic systems. Whilst this study was undertaken to
evaluate the usefulness of the biochemical fingerprinting method to identify human faecal contamination in
two sub-catchments entirely serviced by septic systems and to provide evidence of septic system failure in
these catchments.

36
2.2 Materials and methods
2.2.1 Study area
The Eudlo Catchement is located within the Maroochy Shire in Southeast of Qld, Australia. The total area of the
catchment is approximately 7,980 ha and mostly comprises rural areas, including Eudlo Township. This area
is developing rapidly and the population is approximately 6,000. The creek is approximately 8 km in length
and has been reported by the Environmental Protection Agency (EPA) and Waterwatch (a community-based
water quality monitoring group) to be contaminated with faecal bacteria and nitrates that do not comply with
standard water quality guidelines (12). The source(s) of these high levels of bacteria have not been identified.
However, the EPA has suggested that possible sources include a large number of conventional septic systems,
farm/domestic animals and pets. In addition, septic systems in this area are not being monitored by local
council and have the potential to fail and contaminate the Eudlo Creek. Only 10% of the catchment is serviced
by centralized sewerage treatment plant (STP), leaving a large area serviced by various on-site wastewater
treatment systems (OWTSs) such as conventional septic systems and aerobic wastewater treatment systems
(AWTS) and holding tanks.
2.2.2 GIS identification of septic systems
The total number of septic systems in Maroochy Shire has been estimated to be around 16,000 (146). The
number of ‘registered’ septic systems throughout the Shire is 2,435 of which, the Eudlo Catchment accounted
for 252, but the number is undoubtedly much higher than this. For this reason, an attempt was made to
identify the unregistered septic systems in the catchment by using Geographical Information System (GIS)
datasets (provided by the Maroochy Shire Council). The land use dataset contained spatial information about
the different categories of lands and classifies them into categories such as single detached house, recreational
areas, retail, community, animal farms, agricultural land and vacant lands. The registered septic systems
dataset, AWTS datasets, holding tanks datasets as well as sewer-benefited area dataset were overlaid on the
land use dataset. It was hypothesized that every parcel of lands (except vacant and an agriculture lot) must
have a septic system if it is not connected to sewer or contains either AWTS or holding tanks. Those land
parcels were highlighted and assumed to have a septic system. In all, 1,534 land parcels were identified by this
process as shown in Figure 2.1.

37
(a) (b)
(c) (d)
Figure 2.1 Geographical Information System (GIS) identification of unregistered septic systems in
Eudlo Catchment. (a): Land use dataset, (b): Land use patterns, (c): Sewer benefited area and
different types of on-site waste water treatment systems, (d): Assumed septic systems and (e):
Aerial photography of the catchment.
Landuse data Landuse patterns
Sewer benefited area
Registered septic
AWTS
Assumed septic tanks

38
2.2.3 Performance of surveyed septic systems
Using GIS, 1,534 septic systems were identified in the Eudlo Catchment. However, it was not feasible to survey
a large number of systems due to access restriction and time constraints. Instead, Eudlo Township, which is
entirely serviced by septic systems, was chosen for performance evaluation. An introductory letter stating the
purpose of the survey was mailed to 90 properties in Eudlo Township area and a total of 48 participating
letters were received over a two-week period. To assess the performance of the septic systems an assessment
criterion comprising visual inspection and sludge test was developed. The visual inspection and face-to-face
survey with occupants include the following investigation.
• Age of the septic systems.
• Capacity of tank.
• Time since desludged.
• Problems with trenches (soggy or not).
• Effluent breaching.
• Undersized systems.
• Odour.
• Distance of trenches from creek.
• Distance of trenches from bore.
Sludge test
If a sludge layer exceeded more than one third of the tank capacity, then the tank was in need of pump out,
otherwise the solids may reach the absorption field leading to clogging of the absorption field and its
eventually failure. Nonetheless, it was not possible to perform the sludge test on all surveyed tanks because
some were found to be sealed or awkwardly located.
2.2.4 Classification of defective septic systems
The surveyed septic systems were classified into 5 categories including
• satisfactory,
• technical faults,
• minor failure,
• moderate failure, and
• major failure
on the basis of the sludge build up in the tank, effluents breaching to the surface (soggy trenches), odour and
other minor technical and structural observations. In this study, a major failure was designated when

39
effluents from the septic tanks breached the surface or solids were carried over to the absorption field. A few
of the surveyed septic tanks area are shown in Figure 2.2.
Of the 48 septic systems surveyed 32 (67%) tanks needed cleaning out during the survey (Figure 2.2 a, b, c, d,
e and g) and 23 (72%) of these systems had soggy absorption fields. Four (8%) tanks had structural problems
such as broken baffles or lids (Figure 2.2 f). Two (4%) systems had technical faults (i.e. the absorption field
being located near water bore and the tanks were installed below the flood level). Three (6%) tanks had
insufficient capacity for the household wastes and only seven (15%) systems were found well-maintained.
Eventually, nine septic systems were not included because the properties were vacant during the survey
and/or they were located in areas not accessible for sampling leaving 39 septic tanks, which were available
for sampling. Figure 2.3 shows the classification of defective septic systems in the Eudlo Township.
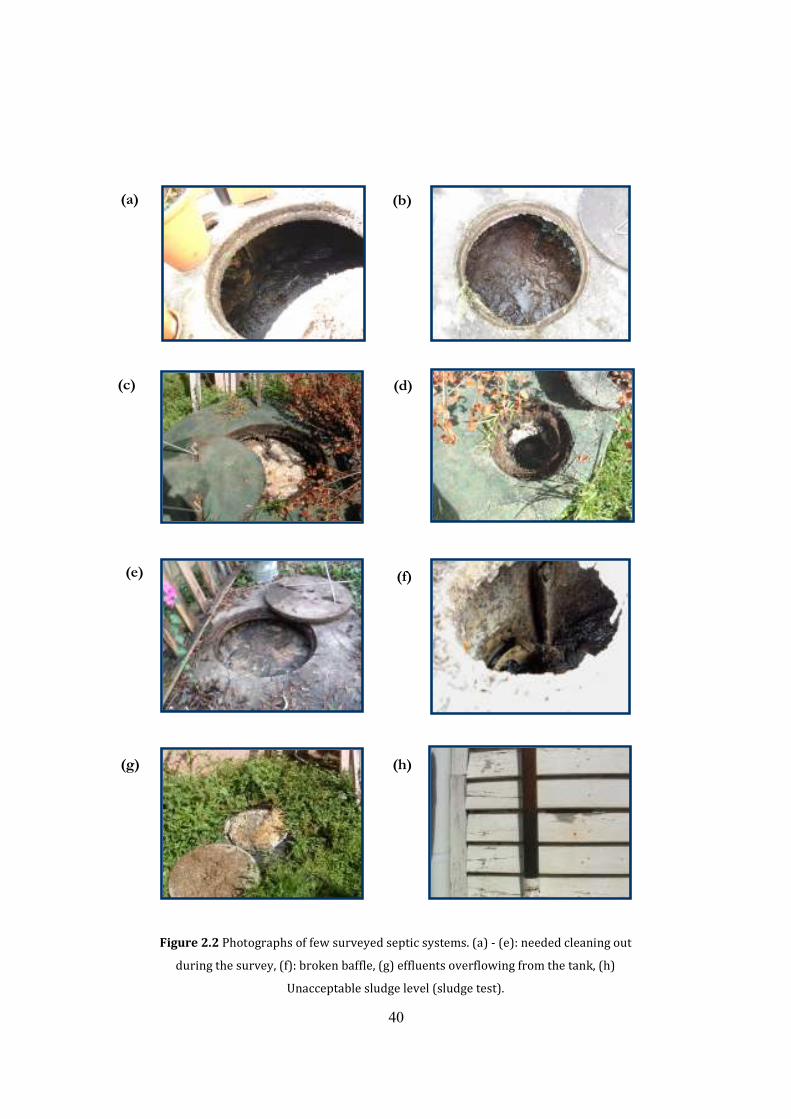
40
(e)
(a) (b)
(c) (d).
(f)
(g) (h)
Figure 2.2 Photographs of few surveyed septic systems. (a) - (e): needed cleaning out
during the survey, (f): broken baffle, (g) effluents overflowing from the tank, (h)
Unacceptable sludge level (sludge test).

41
2.2.5 Eudlo Creek mainstream sampling sites
A catchment-based approach was used in this study, in which sampling sites were chosen from both affected
and non-affected areas within the catchment. As mentioned earlier, the Eudlo Catchment was selected based
on the prevalence of septic systems (approximately 1,534) and because most of the areas (i.e. >85%) of the
catchment were not serviced by centralized STPs. Sampling sites were chosen in Eudlo Creek mainstream
which has continuous water flow throughout the year. Five sampling sites (i.e. I-V) were carefully chosen
depending on the landuse settings. In addition, six sub-catchments (SC-A to SC-F) within the Eudlo Catchment
were also chosen as preliminary potential study area. One-off samples were collected from five sires (i.e. I-V)
in the mainstream during low tide as well as from an upstream (U) and downstream (D) site of these six SCs
(Figure 2.4 a). These SCs reflected a variety of land-use activities designed to capture the variability and
potential sources of faecal contamination. Two of the SCs (SC-A and SC-B) were classified as urban with a high
density of septic systems and animal farms in close proximity to natural waterways (Figure 2.4 b). The
remaining four SCs were largely rural land-use and peri-urban activities with reduced densities of septic
systems.
Figure 2.3 Percentage distribution of performance of the surveyed septic tanks (n=48) in
Eudlo Township based on the visual inspection and sludge level test.
Major
Failure
59%Moderate
failure
10%
Minor faults
8%
Technical
faults
5%
Satisfactory
18%

42
500 m
(a) (b)
Figure 2.4 (a): Sampling sites (I-V) on Eudlo Creek mainstream and selected sub-catchments (SC-A to SC-
F) with an upstream (U) and downstream (D) sampling sites (), (b): Study area (Eudlo Township), sub-
catchment A and B (SC-A and SC-B) showing the location of the upstream (U) and downstream (D)
sampling sites (⊗) and the location of septic systems (�).

43
2.2.6 Preliminary bacteriological investigation
Using aseptic technique, water samples from all sites (i.e. I-V) were collected in 500 ml sterile screw top
bottles from 30 cm below the water surface in the middle of the creek. Samples were kept on ice during
transportation to the laboratory and tested for the presence of enterococci and E. coli within 6 h after
collection. The membrane filtration (MF) method was used to process all water samples, as this method is
highly reproducible and can be used to test a large volume of water samples within a short period of time
(11). Different dilutions of water samples were filtered through a 0.45 µm pore size membrane (Millipore,
USA) with the aid of a vacuum pump - as a result the bacteria remained on the filter paper. The filter paper
was then placed on m-enterococcus agar plates (Difco, UK) and chromogenic E. coli/coliform (Oxoid, UK) and
the plates were incubated at 37ºC ± 0.5oC for 48 h (for enterococci) and 24 h (for E. coli). This chromogenic
medium allows specific detection of E. coli through substrate cleavage by the enzyme glucuronidase and
formation of purple colonies, which are different from other faecal coliforms (rose/pink colonies). After
incubation, the plates that contained colonies ranging 30 to 300 colony-forming units (CFU) were enumerated
with the aid of a colony counter and expressed the number in 100 ml. All samples were tested in triplicate.
2.2.7 Sampling sites in Eudlo Township
Based on the preliminary data on the number of enterococci and E. coli obtained from these six SCs, two of
these SC (SC-A and SC-B) that yielded higher number of faecal indicator bacteria than others, were selected for
further study (Figure 2.4 b). Both SCs initially drain pristine areas but then flow through the Eudlo Township.
Of the 39 septic tanks sampled 25 (64%) were located within 60 to 70 m distance of the creek of SC-B (Figure
2.4 b). From these two selected SCs, 30 water samples were collected on a two-week interval basis between
July and December 2003. Samples were collected from the upstream SC-A (U) and downstream SC-A (D) of SC-
A and from upstream SC-B (U) and downstream SC-B (D) of SC-B on seven to eight occasions and again tested
for the number of faecal indicator bacteria (Table 2.1). An additional site, located 5 km upstream of the study
area, was also selected and considered as “control site” (not shown in Figure 2.4). The control site is
characterized by a low density of septic systems and receives water mainly from pristine areas, not easily
accessible to human and therefore containing low levels of faecal indicator bacteria. Altogether, 7 samples
were collected from the control site for enumeration of faecal indicator bacteria throughout the study. Of
these, 21 water samples were further tested (from upstream and downstream of both SC) for biochemical
fingerprinting of faecal indicator bacteria (Table 2.1). Water samples were collected and processed in the
same manner described earlier (see 2.4.6 for details).
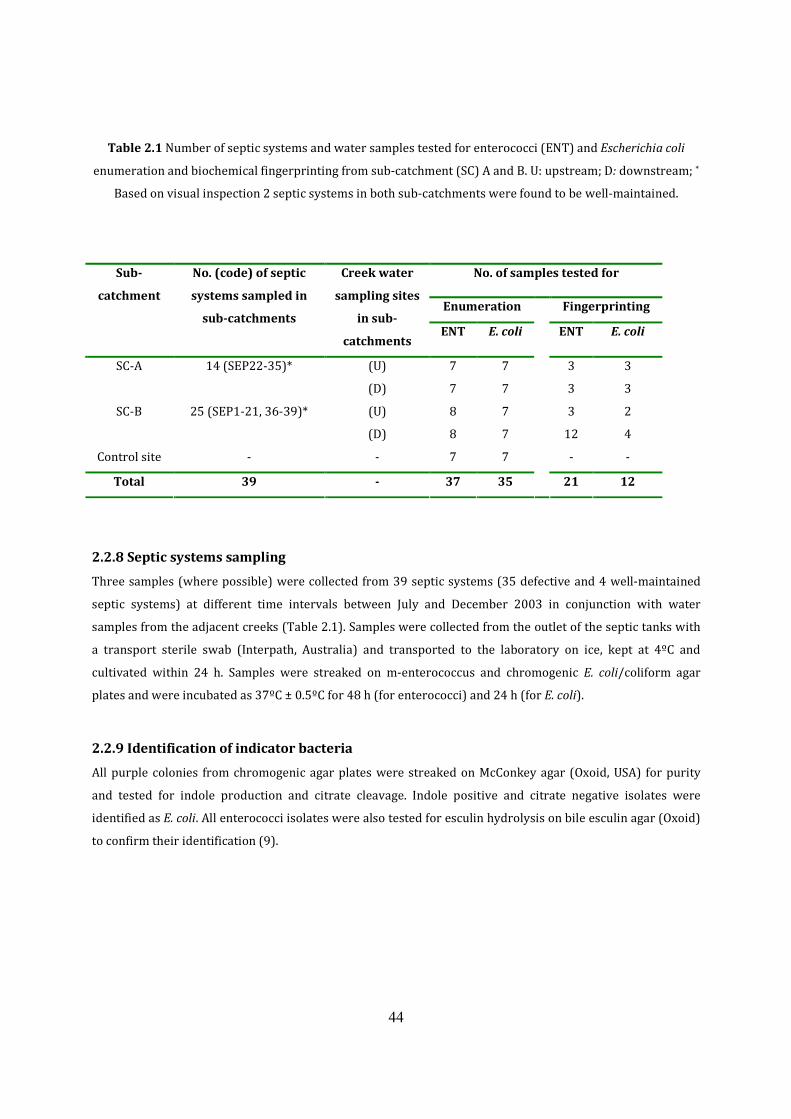
44
Table 2.1 Number of septic systems and water samples tested for enterococci (ENT) and Escherichia coli
enumeration and biochemical fingerprinting from sub-catchment (SC) A and B. U: upstream; D: downstream; *
Based on visual inspection 2 septic systems in both sub-catchments were found to be well-maintained.
No. of samples tested for
Enumeration Fingerprinting
Sub-
catchment
No. (code) of septic
systems sampled in
sub-catchments
Creek water
sampling sites
in sub-
catchments ENT E. coli ENT E. coli
SC-A 14 (SEP22-35)* (U) 7 7 3 3
(D) 7 7 3 3
SC-B 25 (SEP1-21, 36-39)* (U) 8 7 3 2
(D) 8 7 12 4
Control site - - 7 7 - -
Total 39 - 37 35
21 12
2.2.8 Septic systems sampling
Three samples (where possible) were collected from 39 septic systems (35 defective and 4 well-maintained
septic systems) at different time intervals between July and December 2003 in conjunction with water
samples from the adjacent creeks (Table 2.1). Samples were collected from the outlet of the septic tanks with
a transport sterile swab (Interpath, Australia) and transported to the laboratory on ice, kept at 4ºC and
cultivated within 24 h. Samples were streaked on m-enterococcus and chromogenic E. coli/coliform agar
plates and were incubated as 37ºC ± 0.5ºC for 48 h (for enterococci) and 24 h (for E. coli).
2.2.9 Identification of indicator bacteria
All purple colonies from chromogenic agar plates were streaked on McConkey agar (Oxoid, USA) for purity
and tested for indole production and citrate cleavage. Indole positive and citrate negative isolates were
identified as E. coli. All enterococci isolates were also tested for esculin hydrolysis on bile esculin agar (Oxoid)
to confirm their identification (9).

45
2.2.10 Biochemical fingerprinting
Biochemical fingerprinting with the PhPlate system (PhPlate AB, Stockholm, Sweden) uses quantitative
measurements of the kinetics of several biochemical reactions of bacteria in micro-titer plates with
dehydrated substrates (161, 171, 204). The typing reagents used in this method are specifically chosen for
different groups of bacteria (i.e. enterococci or E. coli) to give an optimal discriminatory power and
reproducibility (204). For each bacterial isolate, it yields a biochemical fingerprint (BPT) made of several
quantitative data, which are used with the PhPlate software to calculate the level of similarity between the
tested isolates. Prepared microtitre plates contain 8 sets of 11 different substrates and one inoculation well
containing only buffer in each row for rapid typing of different bacterial species such as enterococci (287), E.
coli (176) and allow testing of 8 isolates per plate or may contain 4 sets of 24 or 2 sets of 48 substrate per
plate depending on the bacterial species and/or the purpose of the study.
In this study we used two types of plates specifically developed for typing of enterococci strains (PhP-RF
plates) and E .coli (PhP-RE plates). Reagents used in the PhP-RF plates include L-Arabinose, lactose, melibiose,
melezitose, raffinose, inositol, sorbitol, mannitol, galactolactone, amygdalin, and gluconate. Reagents used in
the PhP-RE plates include cellobiose, lactose, rhamnose, deoxyribose, sucrose, sorbose, tagatose, D-arabitol,
melbionate, galactolactone and ornithine.
Preparation of suspending medium
A stock solution containing 1.1% (w/v) of bromothymol blue (BTB) and 10% (v/v) of 1 M NaOH in distilled
water was prepared and kept at 4ºC. The suspending medium for enterococci contains 0.2% (w/v) proteose
peptone, 0.05% (w/v) yeast extract, and 0.5% (w/v) NaCl, and 0.011% (w/v) BTB and for E. coli 0.1% (w/v)
proteose peptone, and 0.011% (w/v) BTB. The pH was adjusted to 7.8-8.0 with diluted Hcl or NaOH.
Fingerprinting procedure
From each septic tank sample, up to 64 enterococci and 32 E .coli and from 21 water samples up to 40
enterococci and 32 E .coli colonies (where possible in all above cases) were typed with the PhPlate system.
Three hundred and fifty micro litres of appropriate growth medium was dispensed into the first well of each
row (not containing any dehydrated reagents) and 150 µl of the same growth medium was also dispensed to
the rest of the wells by the aid of a multi-channel pipette. Each bacterial colony to be tested (both enterococci
and E. coli) was picked from the agar plates with sterile tooth pick and suspended into the first well of each
row (contained 350 µl of growth medium). The plates were left at room temperature for 1 h. The bacterial
suspension in the first well of each row was then homogenized using a multi-channel pipette. Twenty-five
micro litres of suspension (aliquots) were transferred into each of the other 11 wells (containing 150 µl
growth medium). Plates were then incubated at 37°C and the absorbance (A620) of each reaction was
measured at 16, 40 and 64 h for enterococci and at 7, 24 and 48 h for E .coli by using a micro plate reader

46
(Labsystems multiskan, Helsinki, Finland) connected to a personal computer. The values were automatically
transferred to the computer, multiplied by 10 and stored in the computer as integer values, yielding a score
ranging from 0 to 30 for each test. After the last reading, the mean value from all three readings of each well
was calculated for each isolate (biochemical fingerprint) ranging from 0 (yellow, acidic reaction) to 30 (dark
blue alkaline reaction). The biochemical fingerprints of all isolates were compared pair-wise, and the
similarity between each pair of strains was calculated as the correlation coefficient (r) and clustered
according to the un-weighted pair group method (UPGMA) with arithmetic averages (261).
An identity (ID) level (176) was established based on the reproducibility of the system after testing 20 isolates
in duplicate. Isolates with similarity higher than the ID-level were regarded as identical and assigned to
similar BPTs. BPTs with identical isolates were called common (C-BPT) and those with one isolate were called
single (S-BPT) (178).
Phenotypic diversity and population similarity
The phenotypic diversity among the isolates was measured with Simpson’s index of diversity (Di) (17). Di
depends on isolates distribution into different BPTs. Diversity is high (maximum 1) for a population
consisting of different BPTs and is low (minimum 0) if the population consists of few BPTs. The phenotypic
similarity between different bacterial populations in two or more samples was calculated as population
similarity (Sp) coefficients and determined as (Sx + Sy)/2, where Sx is the similarity of population x in
population y and Sy is the similarity of population y in population x. The Sp-coefficient calculates the
proportion of isolates that are identical in two or more compared bacterial populations (173). For example, if
two populations contain similar dominating BPTs, the Sp-value is high (maximum 1), but if they contain
different BPTs, the Sp-value is low (minimum 0). Clustering of Sp coefficients was performed according to the
UPGMA method to yield a dendrogram.
Data analysis
All data handling, including optical readings, calculations of correlations and coefficients, Di, Sp-values as well
as clustering and printing dendrograms were performed using the PhPlate software version 4001 (PhPlate
AB, Stockholm, Sweden).

47
2.3 Results
2.3.1 Preliminary bacteriological assessment
Samples collected from the Eudlo Creek mainstream showed that the level of enterococci was high in
downstream site (i.e. site I). E. coli also showed a similar pattern, however, the number of E. coli was much
higher than that of enterococci for all sites (see appendix 1 for details). Samples collected from upstream and
downstream within the six SCs showed the level of enterococci was higher in downstream samples of SC-A
and SC-B compared to others. Similarly, the level of E. coli was higher in downstream samples for the same
SCs. The level of both enterococci and E. coli in upstream of these two SCs was quite low compared to those
found in downstream (see appendix 2 for details).
2.3.2 Comparison of bacterial populations in sub-catchments A and B
Enterococci
The samples collected from upstream (394 ± 161) and downstream (409 ± 159) in SC- A, showed that the
level of enterococci in these sites did not significantly differ from each other (Figure 2.5 a) However, there
were significant differences (p=0.001 for upstream and p=0.001 for downstream) between these sites and the
control site (210 ± 80) (Figure 2.5 a). Similar results were found in SC-B. The upstream (492 ± 203) and
downstream (495 ± 216) in SC did not differ significantly from each other. However, there were significant
differences (p= 0.001 for upstream and p= 0.001 for downstream) between these sites and the control site
(Figure 2.5 b).
E. coli
The number of E. coli in upstream (280 ± 99) and downstream (349 ± 84) sites in SC-A did not differ
significantly from each other (Figure 2.5 c). However, there were again significant differences (p=0.001 for
upstream and p=0.001 for downstream) between these sites and control site (152 ± 46) (Figure 2.5 c). There
was however a significant difference (p=0.01) between the number of E .coli in upstream (289 ± 82) and
downstream (573 ± 253) sites in SC-B. The number of these bacteria in these sites also significantly differed
(p=0.001 for upstream and p=0.001 for downstream) from those of the control (Figure 2.5 d).

48
0
150
300
450
600
Upstream Downstream Control
Sub-catchment A
CF
U/1
00
ml
0
150
300
450
600
750
Upstream Downstream Control
Sub-catchment B
CF
U/1
00
ml
0
150
300
450
600
Upstream Downstream Control
Sub-catchment A
CF
U/1
00
ml
0
300
600
900
Upstream Downstream Control
Sub-catchment B
CF
U/1
00
ml
Figure 2.5 The mean and standard deviation of enterococci (a and b) and Escherichia coli (c and d)
isolates at upstream and downstream locations in sub-catchments A and B relation to the control site.
(a) P-value 0.0010 (upstream vs control) and 0.0012 (downstream vs control). (b) P-value 0.0044
(upstream vs control) and 0.01 (downstream vs control). (C) P-value 0.0092 (upstream vs control)
and 0.01 (downstream vs. control). (d). P-value 0.0023 (upstream vs control), 0.001 (downstream vs
control) and 0.0153 (upstream vs downstream).
(a) (b)
(d) (c)

49
2.3.3 BPTs of indicator bacteria in septic tanks
The presence of different BPTs of indicator bacteria corresponding to those found in water samples was
investigated in samples collected from all septic tanks. This study further investigated whether these indicator
bacteria can be traced back to any individual failing septic tank as well.
Enterococci
A total number of 1,072 enterococci isolates were typed from 35 septic tanks (i.e. 31 defective and 4 well-
maintained septic tanks). Among enterococci isolates, up to 11 BPTs were found in each septic tank, yielding a
total number of 194 BPTS in all septic tanks (Table 2.2). To identify different BPTs from all septic tanks, BPTs
obtained from each septic tank were compared with others. In all, 110 BPTs were found in all septic tanks
(Table 2.3). These BPTs were referred to as total-BPTs, of which 79 were unique (i.e. UQ-BPTs) to individual
septic tanks and the remaining 31 BPTs were shared (i.e. SH-BPTs) between two or more septic tanks (Table
2.3). These total-BPTs were used to develop a human enterococci database (see chapter 3).
E. coli
Similar approach was used for E. coli. A total number of 621 E. coli isolates were typed from 33 septic tanks
(i.e. 30 defective and 3 well-maintained septic tanks). Among these indicator bacteria, up to 12 BPTs were
found in each septic tank, yielding a total number of 163 in all septic tanks (Table 2.2). When BPTs obtained
from each septic tank were compared with each other, a total of 114 BPTs (total-BPTs) were found in all
septic tanks (Table 2.3). Of these, 87 BPTs were UQ-BPTs and the remaining 27 BPTs were SH-BPTs between
two or more septic tanks (Table 2.3). These total-BPTs were used to develop a human E. coli database (see
chapter 3).
Table: 2.2 Number of isolates tested and number of biochemical phenotypes (BPTs) found among enterococci
(ENT) and E. coli isolates in septic tanks. WM: Well-maintained.
No. of occasion tested (no. of isolates tested per occasion)
No of BPTs found Septic tank ID
ENT E. coli ENT E. coli
SEP 1 2 (31, 23) 1 (6)
5 2
SEP 2 1 (15) 1 (23) 5 12
SEP 3 1 (31) 1 (10) 11 4
SEP 4 1 (31) 2 (13, 10) 2 7
SEP 5 1 (31) 2 (6, 24) 5 8
SEP 6 1 (39) 1 (7) 2 3
SEP 7 1 (23) 1 (4) 1 4
SEP 8 1 (39) 1 (23) 4 4
SEP 9 1(8) 1 (15) 2 4
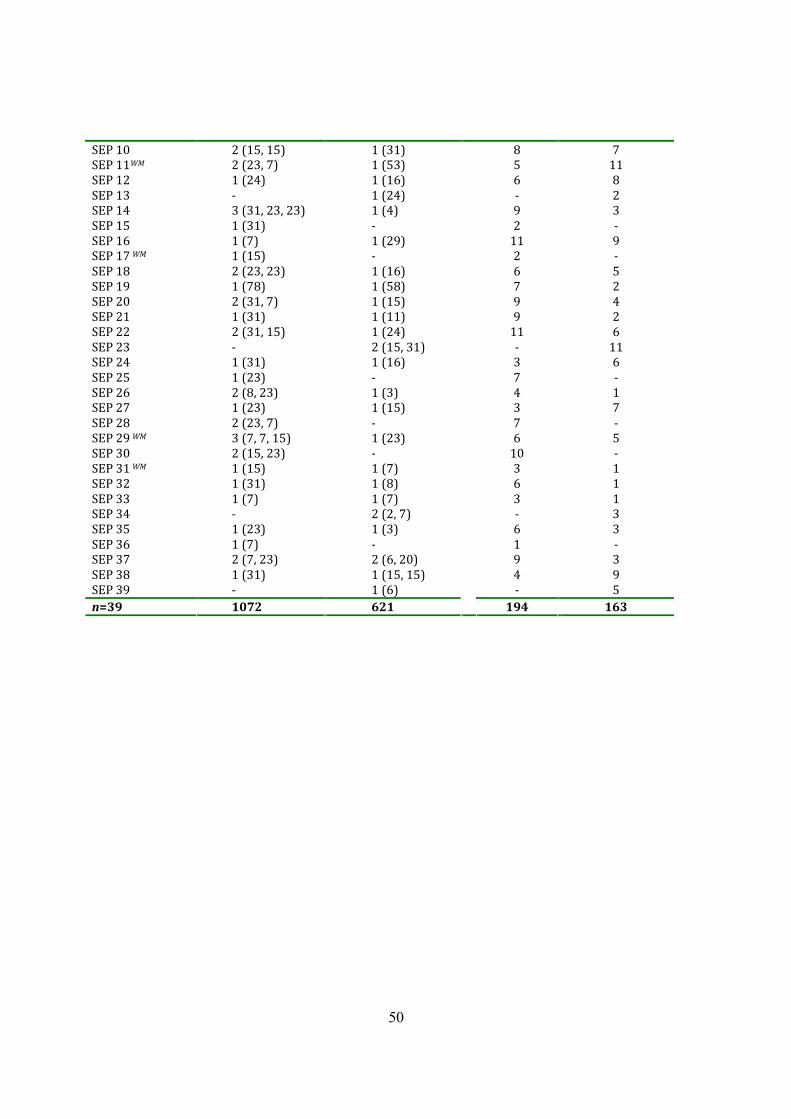
50
SEP 10 2 (15, 15) 1 (31) 8 7
SEP 11WM 2 (23, 7) 1 (53) 5 11
SEP 12 1 (24) 1 (16) 6 8
SEP 13 - 1 (24) - 2
SEP 14 3 (31, 23, 23) 1 (4) 9 3
SEP 15 1 (31) - 2 -
SEP 16 1 (7) 1 (29) 11 9
SEP 17 WM 1 (15) - 2 -
SEP 18 2 (23, 23) 1 (16) 6 5
SEP 19 1 (78) 1 (58) 7 2
SEP 20 2 (31, 7) 1 (15) 9 4
SEP 21 1 (31) 1 (11) 9 2
SEP 22 2 (31, 15) 1 (24) 11 6
SEP 23 - 2 (15, 31) - 11
SEP 24 1 (31) 1 (16) 3 6
SEP 25 1 (23) - 7 -
SEP 26 2 (8, 23) 1 (3) 4 1
SEP 27 1 (23) 1 (15) 3 7
SEP 28 2 (23, 7) - 7 -
SEP 29 WM 3 (7, 7, 15) 1 (23) 6 5
SEP 30 2 (15, 23) - 10 -
SEP 31 WM 1 (15) 1 (7) 3 1
SEP 32 1 (31) 1 (8) 6 1
SEP 33 1 (7) 1 (7) 3 1
SEP 34 - 2 (2, 7) - 3
SEP 35 1 (23) 1 (3) 6 3
SEP 36 1 (7) - 1 -
SEP 37 2 (7, 23) 2 (6, 20) 9 3
SEP 38 1 (31) 1 (15, 15) 4 9
SEP 39 - 1 (6) - 5
n=39 1072 621
194 163
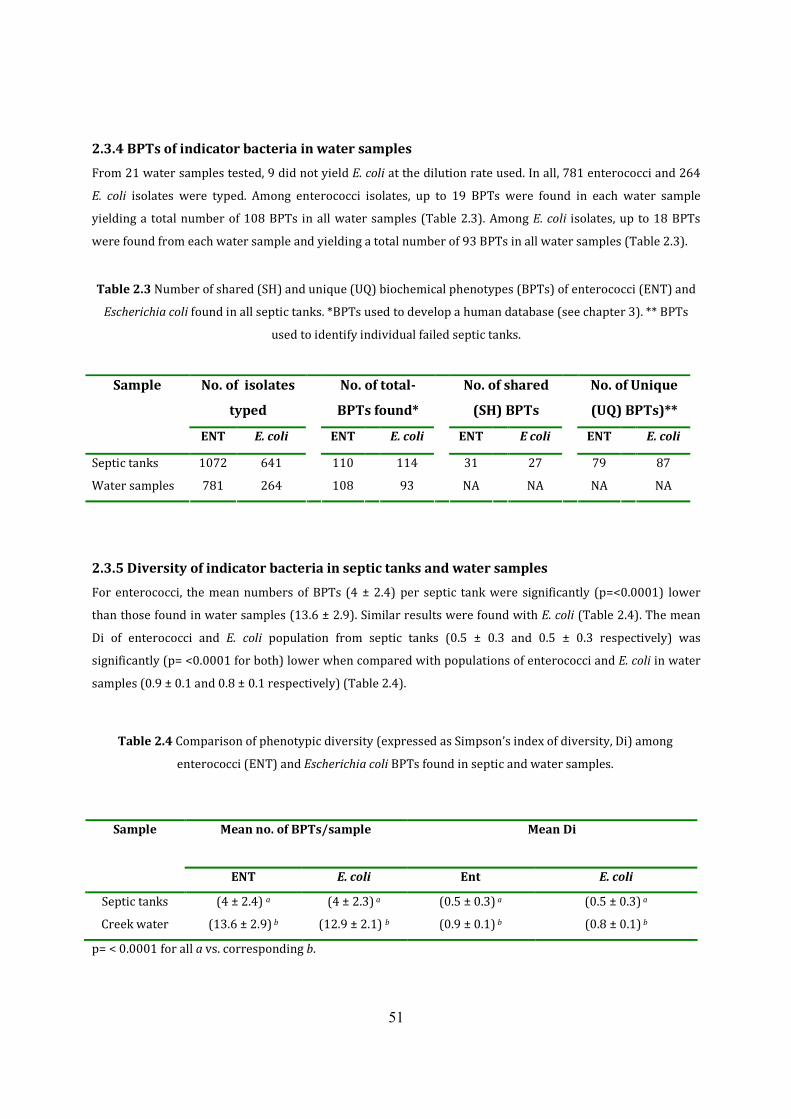
51
2.3.4 BPTs of indicator bacteria in water samples
From 21 water samples tested, 9 did not yield E. coli at the dilution rate used. In all, 781 enterococci and 264
E. coli isolates were typed. Among enterococci isolates, up to 19 BPTs were found in each water sample
yielding a total number of 108 BPTs in all water samples (Table 2.3). Among E. coli isolates, up to 18 BPTs
were found from each water sample and yielding a total number of 93 BPTs in all water samples (Table 2.3).
Table 2.3 Number of shared (SH) and unique (UQ) biochemical phenotypes (BPTs) of enterococci (ENT) and
Escherichia coli found in all septic tanks. *BPTs used to develop a human database (see chapter 3). ** BPTs
used to identify individual failed septic tanks.
No. of isolates
typed
No. of total-
BPTs found*
No. of shared
(SH) BPTs
No. of Unique
(UQ) BPTs)**
Sample
ENT E. coli ENT E. coli ENT E coli ENT E. coli
Septic tanks 1072 641
110 114 31 27 79 87
Water samples 781 264 108 93
NA NA
NA NA
2.3.5 Diversity of indicator bacteria in septic tanks and water samples
For enterococci, the mean numbers of BPTs (4 ± 2.4) per septic tank were significantly (p=<0.0001) lower
than those found in water samples (13.6 ± 2.9). Similar results were found with E. coli (Table 2.4). The mean
Di of enterococci and E. coli population from septic tanks (0.5 ± 0.3 and 0.5 ± 0.3 respectively) was
significantly (p= <0.0001 for both) lower when compared with populations of enterococci and E. coli in water
samples (0.9 ± 0.1 and 0.8 ± 0.1 respectively) (Table 2.4).
Table 2.4 Comparison of phenotypic diversity (expressed as Simpson’s index of diversity, Di) among
enterococci (ENT) and Escherichia coli BPTs found in septic and water samples.
Mean no. of BPTs/sample
Mean Di Sample
ENT E. coli Ent E. coli
Septic tanks (4 ± 2.4) a (4 ± 2.3) a (0.5 ± 0.3) a (0.5 ± 0.3) a
Creek water (13.6 ± 2.9) b (12.9 ± 2.1) b (0.9 ± 0.1) b (0.8 ± 0.1) b
p= < 0.0001 for all a vs. corresponding b.

52
2.3.6 Comparison of septic BPTs to water samples
Enterococci
When 194 BPTs from 35 septic systems were compared to water samples, 98 BPTs from 33 septic tanks (29
defective and 4 well-maintained) were found in different water samples (mainly from downstream of both
SCs) on several occasions (Table 2.5). Of these, 81 SH-BPTs were found in more than one septic tank.
However, 17 UQ-BPTs (specific to septic tanks) were only found in 12 defective septic tanks and were
identical to downstream water samples (Table 2.5).
E. coli
When 163 BPTs from 33 septic tanks (30 defective and 3 well-maintained) were compared with the water
samples, 53 BPTs from 26 septic tanks (24 defective and 2 well-maintained) were also found in different
water samples. Of these, 36 BPTs were found in more than one septic tank and 17 UQ-BPTs were found in 13
defective and 1 well- maintained septic tank (i.e. SEP31). UQ-BPTs of both enterococci and E. coli from 4
defective septic tanks (i.e. SEP 2, 10, 12 and 22) were found in water samples (Table 2.5).
Table 2.5 Identical biochemical phenotypes (BPTs) and unique BPTs of enterococci and E. coli found in septic
tanks and water samples. WM: Well-maintained septic systems.
Identical BPTs common to septic tanks and water samples (no. of
unique BPTs)
No. of water samples containing identical septic BPTs
Septic tank code
Enterococci E. coli
Enterococci E. coli
SEP 1 2 (1) 2 2
SEP 2 (3) 5 (1) 2 2
SEP 3 9 (2) 1 7 1
SEP 4 - 5 (1) - 2
SEP 5 2 5 (1) 2 4
SEP 6 2 - 2 -
SEP 7 2 3 (2) 1 1
SEP 8 3 (1) 2 3 1
SEP 9 2 (1) 2 7
SEP 10 3 (1) 2 (1) 3 3
SEP 11 WM 1 - 1 -
SEP 12 2 (1) 2 (1) 2 1
SEP 13 - (2) - 1
SEP 14 6 (1) 6 1
SEP 15 1 - 1 -
SEP 17 WM 1 - 1 -
SEP 18 5 2 5 1
SEP 19 3 (2) 1 3 1
SEP 20 2 - 2 -
SEP 21 2 1 2 1

53
SEP 22 6 (1) (1) 4 1
SEP 23 - 6 - 5
SEP 24 (1) 1 1 -
SEP 25 6 (1) - 4 -
SEP 26 4 (1) 1 3 -
SEP 27 3 - 2 -
SEP 28 3 (2) - 2 -
SEP 29 WM 4 1 3 -
SEP 30 4 - 3 -
SEP 31 WM 3 (1) 3 1
SEP 32 4 (1) - 3 -
SEP 33 2 - 2 -
SEP 34 - 2 (1) - 1
SEP 35 1 1 1 1
SEP 36 1 - 1 -
SEP 37 3 1 3 1
SEP 38 2 (2) 2 3
SEP 39 - 2 - 2
n=38 98 (17) 53 (17)
- -
2.3.7 Population similarities between septic tanks and creek water samples
Enterococci and E. coli populations from each septic tank were also compared with corresponding
populations from water samples collected from upstream and down stream of SC-A and SC-B. Different Sp-
values were obtained for each comparison for both faecal indicator bacteria. For certain septic tanks,
enterococci populations showed higher similarities (high Sp-values) with downstream water samples than E.
coli while this was quite the reverse for other septic tanks. For instance, while a high similarity was found
between enterococci populations from septic tank 3 (i.e. SEP3) and those of downstream water samples
(Figure 2.6 a), there was no similarity (Sp-value of 0) between the E. coli populations of this septic tank and
the same water samples (Figure 2.6 c). Similarly, whilst enterococci populations from septic tank 4 (i.e. SEP4)
showed no similarity (Sp-value of 0) to downstream water samples (Figure 2.6 a), there was a low similarity
between E. coli populations of this septic tank and water samples (Figure 2.6 c) However, both enterococci
and E. coli populations from these two septic tanks showed lower Sp-values (if any) to upstream samples
(Figures. 2.6 b, d).

62
SEP 3
(b)
Sp-value
(b)
(a) SEP 3
B (D)-9
B (D)-10
B (D)-12
B (D)-11
B (D)-3
B (D)-4
B (D)-6
B (D)-7
B (D)-8
B (D)-1
B (D)-2
B (D)-5
SEP 4
SEP 3
B (U)-3
B (U)-1
B (U)-2
SEP 4
Enterococci
(c)
SEP 4
B (D)-2
B (D)-1
B (D)-3
B (D)-4
SEP 3
SEP 4
B (U)-1
B (U)-2
E. coli
Figure 2.6 Representative examples of UPGMA dendrograms of Sp-coefficients (a) enterococci isolates
between septic tanks (SEP 3) and (SEP 4) and downstream [B (D)-1 to B (D)-12] and (b) upstream [B
(U)-1 to B (U)-3] water samples of the sub-catchment B (c) E. coli between septic tanks (SEP 3 and SEP
4) and downstream [B (D)-1 to B(D)-4] and (d) upstream [B (U)-1 to B (U)-2] water samples of the sub-
catchment B.

63
2.4 Discussion
A failing/defective septic system is considered to be one that allows the discharge of effluents with nutrients
and pathogens. The failure of a septic system generally refers to a failure of the absorption field. Failure to
pump effluents results in excess effluents building up in the tank, which eventually enters the absorption field.
The organic matter present in the effluent can cause clogging of the soil in the absorption field (132, 170),
which hinders the movement of effluents. The failure of a septic system can also be caused by other factors
such as the absorption area being too small, unsuitable depth or type of soil, undersized or improperly
designed septic tanks, a high water table and physical damages to pipeline and lack of maintenance (108). In
this study, 32 septic systems needed cleaning out during the survey, of which 23 systems had soggy
absorption fields (considered absorption field failure).
Samples were collected from the outlet of the septic tanks instead of the absorption field. This was done to
provide a better understanding of the indicator bacteria present in septic tanks rather than absorption field,
which may contain indicator bacteria from other potential sources (i.e. domestic animals). The presence and
abundances of different types of enterococci and E .coli in both the septic tanks and water samples were also
investigated to specifically address the failure of septic systems.
The study area contained 48 septic systems in an area of around 1.2 km2. Previous studies reported a high
failure rate of septic system occurs in areas generally containing high densities of septic systems (146). This
was consistent with the finding that 41 septic systems (85%) were classified defective when assessed by
standard inspection guidelines adopted by the local government (i.e. Maroochy Shire Council), and of these, 23
systems showed signs of absorption field failure. However, the results showed a higher rate of septic system
failure when enterococci and E .coli from septic tanks were compared with water samples. Identical BPTs of
both indicator bacteria specific to these septic tanks were found in water samples. These results indicate that
while an absorption field may not shows signs of failure, faecal indicator bacteria can still be released into the
nearby creeks.
Furthermore, the level of both faecal indicator bacteria was significantly higher in downstream than upstream
sites, although it was not consistent for both indicator bacteria or in both SCs. For instance, the level of E. coli
was significantly higher in downstream than upstream of SC-B, where 25 septic systems are located within 60
to 70 m range of the creek.
Analysis of water samples showed that the diversity of both faecal indicator bacteria in surface water was
significantly higher than in septic tanks. This more diverse population is probably due to the fact that surface
water receives bacteria from diffuse sources such as animal farms or industrial processes via surface run-off.
It is also possible that not all indicator bacteria introduced into septic systems through defecation and
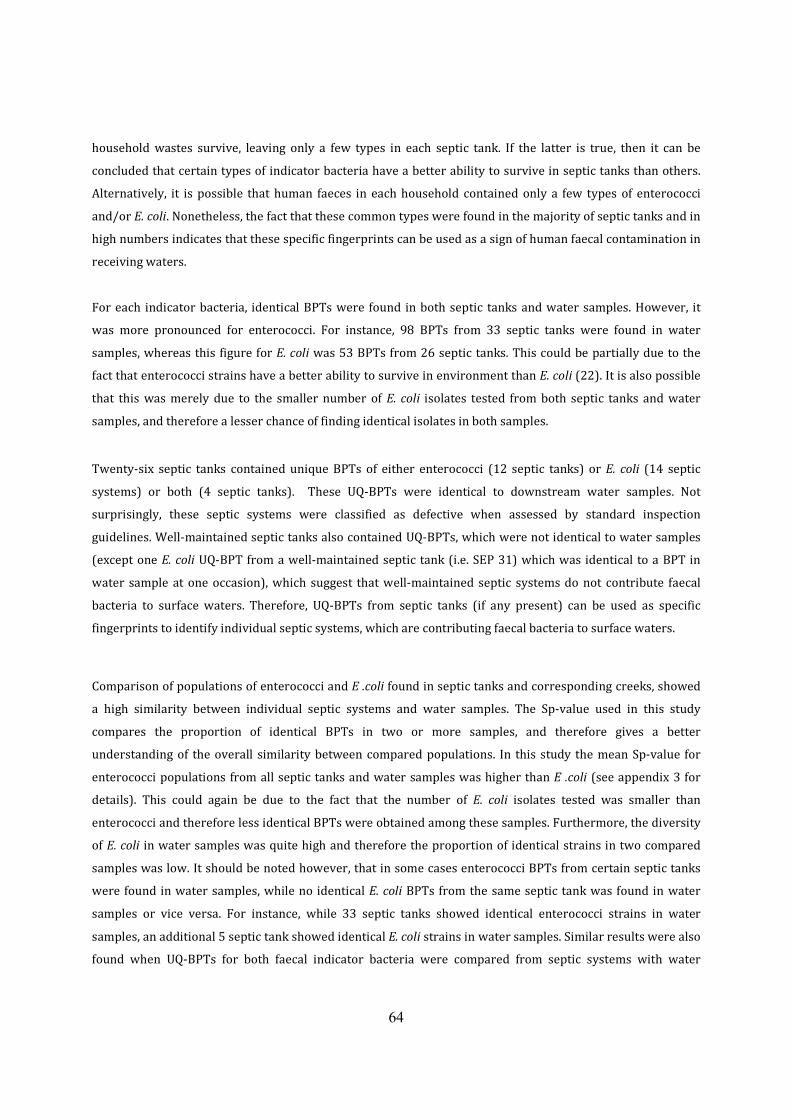
64
household wastes survive, leaving only a few types in each septic tank. If the latter is true, then it can be
concluded that certain types of indicator bacteria have a better ability to survive in septic tanks than others.
Alternatively, it is possible that human faeces in each household contained only a few types of enterococci
and/or E. coli. Nonetheless, the fact that these common types were found in the majority of septic tanks and in
high numbers indicates that these specific fingerprints can be used as a sign of human faecal contamination in
receiving waters.
For each indicator bacteria, identical BPTs were found in both septic tanks and water samples. However, it
was more pronounced for enterococci. For instance, 98 BPTs from 33 septic tanks were found in water
samples, whereas this figure for E. coli was 53 BPTs from 26 septic tanks. This could be partially due to the
fact that enterococci strains have a better ability to survive in environment than E. coli (22). It is also possible
that this was merely due to the smaller number of E. coli isolates tested from both septic tanks and water
samples, and therefore a lesser chance of finding identical isolates in both samples.
Twenty-six septic tanks contained unique BPTs of either enterococci (12 septic tanks) or E. coli (14 septic
systems) or both (4 septic tanks). These UQ-BPTs were identical to downstream water samples. Not
surprisingly, these septic systems were classified as defective when assessed by standard inspection
guidelines. Well-maintained septic tanks also contained UQ-BPTs, which were not identical to water samples
(except one E. coli UQ-BPT from a well-maintained septic tank (i.e. SEP 31) which was identical to a BPT in
water sample at one occasion), which suggest that well-maintained septic systems do not contribute faecal
bacteria to surface waters. Therefore, UQ-BPTs from septic tanks (if any present) can be used as specific
fingerprints to identify individual septic systems, which are contributing faecal bacteria to surface waters.
Comparison of populations of enterococci and E .coli found in septic tanks and corresponding creeks, showed
a high similarity between individual septic systems and water samples. The Sp-value used in this study
compares the proportion of identical BPTs in two or more samples, and therefore gives a better
understanding of the overall similarity between compared populations. In this study the mean Sp-value for
enterococci populations from all septic tanks and water samples was higher than E .coli (see appendix 3 for
details). This could again be due to the fact that the number of E. coli isolates tested was smaller than
enterococci and therefore less identical BPTs were obtained among these samples. Furthermore, the diversity
of E. coli in water samples was quite high and therefore the proportion of identical strains in two compared
samples was low. It should be noted however, that in some cases enterococci BPTs from certain septic tanks
were found in water samples, while no identical E. coli BPTs from the same septic tank was found in water
samples or vice versa. For instance, while 33 septic tanks showed identical enterococci strains in water
samples, an additional 5 septic tank showed identical E. coli strains in water samples. Similar results were also
found when UQ-BPTs for both faecal indicator bacteria were compared from septic systems with water

65
samples. These findings suggest that combinations of both enterococci and E .coli should be used to trace the
source(s) of bacterial contamination in such investigations.
In conclusion, this study showed that the biochemical fingerprinting method (with the PhPlate system) can
serve as a potential tool to trace the source of human faecal contamination in surface waters. However, in this
study, it was not possible to quantify the percentage contribution of faecal contamination by humans or
animals (if any) in this creek. The high diversity of indicator bacteria in water samples also suggested that
other sources such as domestic and/or wild animals may also be contributing to the faecal load of the creek.
That certain BPTs of both indicator bacteria were not traceable to any septic tanks supports this assumption.
To address these issues an attempt was made to refine this method by including details from animal species
residing in the catchment: the extent to which the method could also be used to distinguish between human
and animal sources of faecal contamination could thus be evaluated.

66
CHAPTER 3
Development of a host species-specific database and its application for
microbial source tracking
3.1 Introduction
Microbial source tracking (MST) methods such as the biochemical fingerprinting method used in the last
chapter have recently emerged as a tool to identify point sources (PS) and non-point sources (NPS) of faecal
contamination in surface waters (116, 199, 249, 299). As shown by example in Chapter 2, these methods are
based on the development of a database of faecal indicator bacteria from known host groups, on the basis of
their genotypic and phenotypic traits. The same traits of faecal indicator from surface waters are then
compared to those with the database to determine their likely source of origin. The advantage of such
database dependent methods is the ability to identify NPS faecal contamination or at least the dominant
sources in a given catchment. In addition, these methods can quantify the contaminating sources, which is
vital for the development of total maximum daily load (TMDL) calculations. In contrast, database-independent
methods cannot provide such information and instead typically provide presence/absence of
pathogens/faecal indicators only (116).
However, the concern with such database dependent methods is that they may not adequately represent the
bacterial assemblage. It has been suggested that database developed for ecological studies should consist of
between 1,000 to 2,000 isolates per source (266). However, there are cost considerations for developing such
a large database. Sampling protocol is another important factor that may also lead to a non-representative
database. For instance, typing one or two isolates from a host may not represent the diverse populations
found among indicator bacteria. In catchment based studies the efficacy of a database to identify the sources
of contamination may also be affected by factors such as reainfall events in the studied catchment. During a
wet season surface run-off may lead to increased levels of indicator bacteria in receiving waters because of
improved transfer pathways. Alternatively a dilution effect may be observed. It is necessary, therefore, in a
catchment based ecological study to evaluate to what degree a database can identify the sources during both a
wet and a dry season and what effect seasonality has on total maximum daily loads.
The aim of this aspect of the study was to develop a large host-species specific metabolic fingerprint database
of enterococci and E. coli, isolated from different host groups, to identify the sources of faecal contamination in
the Eudlo Creek in Southeast Queensland and to explore aspects of the ecological application of such a
database during both the wet and the dry season.
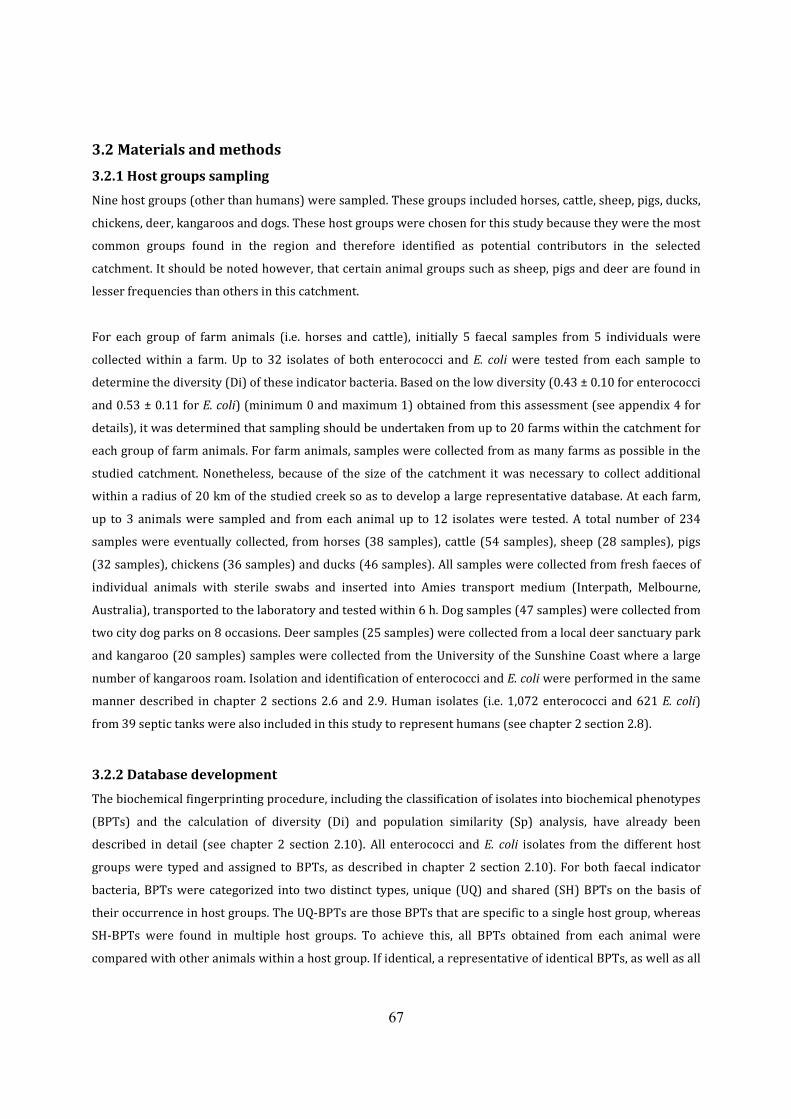
67
3.2 Materials and methods
3.2.1 Host groups sampling
Nine host groups (other than humans) were sampled. These groups included horses, cattle, sheep, pigs, ducks,
chickens, deer, kangaroos and dogs. These host groups were chosen for this study because they were the most
common groups found in the region and therefore identified as potential contributors in the selected
catchment. It should be noted however, that certain animal groups such as sheep, pigs and deer are found in
lesser frequencies than others in this catchment.
For each group of farm animals (i.e. horses and cattle), initially 5 faecal samples from 5 individuals were
collected within a farm. Up to 32 isolates of both enterococci and E. coli were tested from each sample to
determine the diversity (Di) of these indicator bacteria. Based on the low diversity (0.43 ± 0.10 for enterococci
and 0.53 ± 0.11 for E. coli) (minimum 0 and maximum 1) obtained from this assessment (see appendix 4 for
details), it was determined that sampling should be undertaken from up to 20 farms within the catchment for
each group of farm animals. For farm animals, samples were collected from as many farms as possible in the
studied catchment. Nonetheless, because of the size of the catchment it was necessary to collect additional
within a radius of 20 km of the studied creek so as to develop a large representative database. At each farm,
up to 3 animals were sampled and from each animal up to 12 isolates were tested. A total number of 234
samples were eventually collected, from horses (38 samples), cattle (54 samples), sheep (28 samples), pigs
(32 samples), chickens (36 samples) and ducks (46 samples). All samples were collected from fresh faeces of
individual animals with sterile swabs and inserted into Amies transport medium (Interpath, Melbourne,
Australia), transported to the laboratory and tested within 6 h. Dog samples (47 samples) were collected from
two city dog parks on 8 occasions. Deer samples (25 samples) were collected from a local deer sanctuary park
and kangaroo (20 samples) samples were collected from the University of the Sunshine Coast where a large
number of kangaroos roam. Isolation and identification of enterococci and E. coli were performed in the same
manner described in chapter 2 sections 2.6 and 2.9. Human isolates (i.e. 1,072 enterococci and 621 E. coli)
from 39 septic tanks were also included in this study to represent humans (see chapter 2 section 2.8).
3.2.2 Database development
The biochemical fingerprinting procedure, including the classification of isolates into biochemical phenotypes
(BPTs) and the calculation of diversity (Di) and population similarity (Sp) analysis, have already been
described in detail (see chapter 2 section 2.10). All enterococci and E. coli isolates from the different host
groups were typed and assigned to BPTs, as described in chapter 2 section 2.10). For both faecal indicator
bacteria, BPTs were categorized into two distinct types, unique (UQ) and shared (SH) BPTs on the basis of
their occurrence in host groups. The UQ-BPTs are those BPTs that are specific to a single host group, whereas
SH-BPTs were found in multiple host groups. To achieve this, all BPTs obtained from each animal were
compared with other animals within a host group. If identical, a representative of identical BPTs, as well as all

68
non-identical BPTs, were initially saved in the database and regarded as total-BPTs for each host group of
animals. Further, total-BPTs from each host group were cross-referenced with those of others to calculate the
occurrence of BPTs among different host groups. For instance, if a BPT from a host group (e.g. horse) was
identical to a BPT from another (e.g. sheep), this BPT was regarded as SH-BPT between two host groups. If a
BPT from a host group was not detected in any other groups, it was regarded as UQ-BPT.
3.2.3 Surface water sampling
Six sampling sites (control and EC1-EC5) were chosen on the Eudlo Creek mainstream (Figure 3.1) (control
site not shown in Figure 3.1). The control site was located 5 km upstream of the study area and received water
mainly from pristine areas not easily accessible to humans and containing naturally low levels of faecal
indicator bacteria. Site EC1 was located upstream of the Eudlo Township and was characterized by a limited
number of septic systems and animal farms. Sites EC2-EC5 were situated downstream of the Township and
were affected by the high density of septic systems in the Township itself and a number of animal farms.
Water samples were collected at 3 occasions from the control and 3 sites (EC1 to EC3) during January to
February 2004 (wet season) (9 samples and 3 controls), and at 4 occasions from the control and 5 sites (EC1
to EC5, only 2 samples from site EC4) during August to September 2004 (dry season) (18 samples and 4
controls). In all, 27 water samples and 7 controls were collected from these sites. Water samples were
collected and processed as described in chapter 2, section 2.6. Identification and confirmatory test of
enterococci and E. coli were performed as described in chapter 2, section 2.9. From each water sample from
sites EC1-EC5, up to 39 (where possible) isolates were typed with the PhPlate system as described in chapter
2 section 2.10.
Maroochy River
Eudlo sub-catchement boundary
EC1 EC2
EC3
EC4 EC5
Eudlo creek mainstream
I km
Map Legends
○ Septic systems ∆ Animal farms
N
Figure 3.1 Sampling sites (EC1-EC5) on Eudlo Creek mainstream. Conventional septic systems () within 50 m
distance of the creek and animal farms (∆) within the catchment.

69
3.2.4 Statistical analysis
Analysis of variance (ANOVA) was used to compare the significant difference between the numbers of faecal
indicator bacteria among sampling sites. Mann-Whitney’s non-parametric test was used to compare the
significant difference between the mean number of faecal indicator bacteria, the mean number of BPTs in
water samples during the wet and the dry seasons and to determine the significant difference between the
mean number of enterococci BPTs and E. coli BPTs found in all host groups. In addition, this test was also
performed on the overall diversity of enterococci and E. coli from all host groups.
3.3 Results
3.3.1 Number of faecal indicator bacteria in water samples
Both enterococci and E. coli were detected in all water samples throughout the study. The number of
enterococci and E. coli collected from sites EC1-EC5 during the wet season ranged from 510 to 921 CFU/100
ml and 340 to 1014 CFU/100 ml respectively. During the dry season, these figures ranged from 101 to 700
CFU/100 ml for enterococci and 120 to 600 CFU/100 ml for E. coli. The number of enterococci in the control
site was 176 CFU/100 ml during the wet season and 102 CFU/100 ml during the dry season. For E. coli these
values were 163 CFU/100 ml during the wet season and 237 CFU/100 ml during the dry season. One-way
ANOVA demonstrated that the number of indicator bacteria at the various sampling sites differed significantly
from the control site during the wet season for both enterococci and E. coli and during the dry season for
enterococci only (Figures 3.2a and b).

70
Figure 3.2 The mean and standard deviation of (a) enterococci and (b) E. coli
during wet (�) and dry (�) seasons at different sampling sites (EC1-EC5).
Enterococci during the wet season: EC1, EC2, and EC3 vs. Control = p<0.01.
Enterococci during the dry season: EC2, EC4 vs. control = p<0.05, and EC3 vs. control =
p<0.01.
E. coli during the wet season: EC2, EC3 vs. control = p<0.001.
0
250
500
750
1000
Control EC1 EC2 EC3 EC4 EC5
Sampling sites
CF
U/1
00m
l
(a) Enterococci
0
250
500
750
1000
1250
Control EC1 EC2 EC3 EC4 EC5
Sampling sites
CF
U/1
00m
l
(b) E. coli
0
250
500
750
1000
Wet season Dry season
CF
U/1
00m
l
0
250
500
750
1000
Wet season Dry season
CF
U/1
00
ml
P=0.03
P=NS

71
The mean diversity of enterococci BPTs during the wet seasons (0.85 ± 0.02) was significantly different (p=
0.03) from that of the dry season (0.73 ± 0.05). For E. coli, the mean diversity of BPTs did not differ between
the wet (0.93 ± 0.04) and dry season (0.90 ± 0.06) (Table 3.1).
Table 3.1 Mean diversity (Di) of enterococci and Escherichia coli isolates collected from 5 sampling sites (EC1
to EC5) during the wet and the dry season.
Mean diversity (Di)
Enterococci E. coli
Sampling site
Wet season Dry season Wet season Dry season
EC1 0.83 0.70 0.97 0.83
EC2 0.86 0.68 0.88 0.85
EC3 0.87 0.73 0.95 0.94
EC4 - 0.82 - -
EC5 - 0.75 - 0.97
n=5 0.85 ± 0.02 0.73 ± 0.05
0.93 ± 0.04 0.90 ± 0.06
For each season, the indicator bacteria from each sampling site were pooled and similarities between
populations at different sites were calculated as the population similarity (Sp) (see chapter 2 section 2.10 for
details). It was found that there were high similarities between both indicator bacterial populations at
different sampling sites (Figure 3.3 a and b). However, the mean Sp for enterococci population (i.e. 0.44) was
much higher than that of E. coli populations (i.e. 0.26) over the entire sampling periods (i.e. both the wet and
the dry season). Seasonally, the mean similarity between both bacterial populations was much higher during
the wet season (0.49 for enterococci and 0.33 for E. coli) than the dry season (i.e. 0.38 for enterococci and 0.18
for E. coli) (Figure 3.3 a and b).

72
b. E. coli
a. Enterococci
Sampling
sites
EC1 99
EC2 113
EC3 118
No. of isolates
tested
Wet season
Mean Sp-value 0.49
0 0.2 0.4 0.6
EC3 108
EC5 69
EC2 108
EC4 69
EC1 107
Dry season
Mean Sp-value 0.38
Sampling
sites No. of isolates
tested
0 0.2 0.4 0.6
EC1 79
EC3 97
EC2 80
No. of isolates
tested
Wet season
Mean Sp-value 0.33
Sampling sites
0 0.2 0.4 0.6
EC1 79
EC2 95
EC3 80
EC5 40
Sampling
sites No. of isolates
tested
Dry season
Mean Sp-value 0.18
0 0.2 0.4 0.6
Figure 3.3 UPGMA dendrograms of population similarity for (a) enterococci and (b) and
Escherichia coli at different sampling sites in the Eudlo Creek (EC1 to EC5) during both the wet
and dry season.

73
3.3.2 Database
A total number of 4,057 enterococci and 3,728 E. coli isolates were typed from 10 host groups. Within each
host group, different BPTs were found, some of which were identical. Representative of the identical BPTs and
the non-identical BPTs were initially included in the database and regarded as total-BPTs found in each host
group. Applying this approach, a total number of 526 BPTs of enterococci and 530 BPTs of E. coli were
obtained from all host groups. Table 3.2 shows the number of isolates tested and the number of total-BPTs
found in each host group. For enterococci, the ratio of BPTs over the number of total isolates tested from each
host group ranged from 7.3% (for sheep) to 18.7% (for horse) yielding a mean value of 13.9 ± 4.0 for all host
groups. With E. coli this ratio ranged from 8.2% (for sheep) to 17% (for ducks), yielding a mean value of 14.4 ±
2.5 (Table 3.2). The mean number of total enterococci and E. coli BPTs found in all host groups did not differ
significantly (p=0.97).
Table 3.2 Number of enterococci and Escherichia coli isolates tested from each host group and the number of
total-BPTs found. *Mean and standard deviation.
No. of isolates tested No. of total-BPTs found (% over
isolates)
Host groups No. of
samples
Enterococci E. coli
Enterococci E. coli
Human 56 1072 621 94 ( 8.8) 92 (14.8)
Horses 38 407 407 76 (18.7) 60 (14.7)
Dogs 47 404 408 49 (12.1) 64 (15.7)
Ducks 46 408 404 58 (14.2) 69 (17)
Cattle 55 411 401 47 (11.4) 53 (13.2)
Chicken 36 408 408 74 (18.1) 59 (14.5)
Pigs 32 312 400 54 (17.3) 53 (13.3)
Sheep 27 287 367 21 ( 7.3) 30 ( 8.2)
Deer 25 204 200 28 (13.7) 31 (15.5)
Kangaroos 20 144 112 25 (17.4) 19 (17.)
Total 382 4057 3728
526 (13.9 ± 4)* 530 (14.4 ± 2.5)*

74
The mean diversity of both enterococci and E. coli within each host group ranged from 0.41 ± 0.38 (for sheep)
to 0.75 ± 0.25 (for horses) and from 0.44 ± 0.27 (for sheep) to 0.85± 0.07 (for deer) respectively (Table 3.3).
However, the overall diversity of both indicator bacteria (0.6 ± 0.1 for enterococci versus 0.65 ± 0.1 for E. coli)
did not differ significantly (p=0.36).
Table 3.3 The mean diversity index (Di) of enterococci and Escherichia coli in host groups. P= < 0.2 for a1 vs.
b1 and a2 vs. b2; P= < 0.005 for a3 vs. b3.
Enterococci E. coli Host groups
Mean Di Mean Di
Human 0.50 ± 0.30 0.50 ± 0.30
Horses 0.75 ± 0.25a1
0.63 ± 0.26 b1
Dogs 0.45± 0.32 0.57 ± 0.27
Ducks 0.72 ± 0.23 0.77 ± 0.22
Cattle 0.54 ± 0.34 0.53 ± 0.28
Chicken 0.72 ± 0.26 a2 0.82 ± 0.18 b2
Pigs 0.68 ± 0.28 0.73 ± 0.24
Sheep 0.41 ± 0.38 0.44 ± 0.27
Deer 0.59 ± 0.32 a3 0.85 ± 0.07 b3
Kangaroos 0.64 ± 0.20 0.72 ± 0.14
Unique (UQ) and shared (SH) BPTs
When the total-BPTs of all host groups were compared with each other, it was found that certain BPTs were
specific to individual host groups. These BPTs were referred to as UQ-BPTs. For enterococci, the range of UQ-
BPTs among host groups varied from 7 (in sheep) to 66 (in humans). For E. coli, this figure ranged between 6
(in kangaroos) to 69 (in humans) (Table 3.4). The mean percentage of total UQ-BPTs among enterococci and
E. coli was 56% and 51% respectively. Other BPTs were found in multiple host groups and they were referred
to as SH-BPTs.
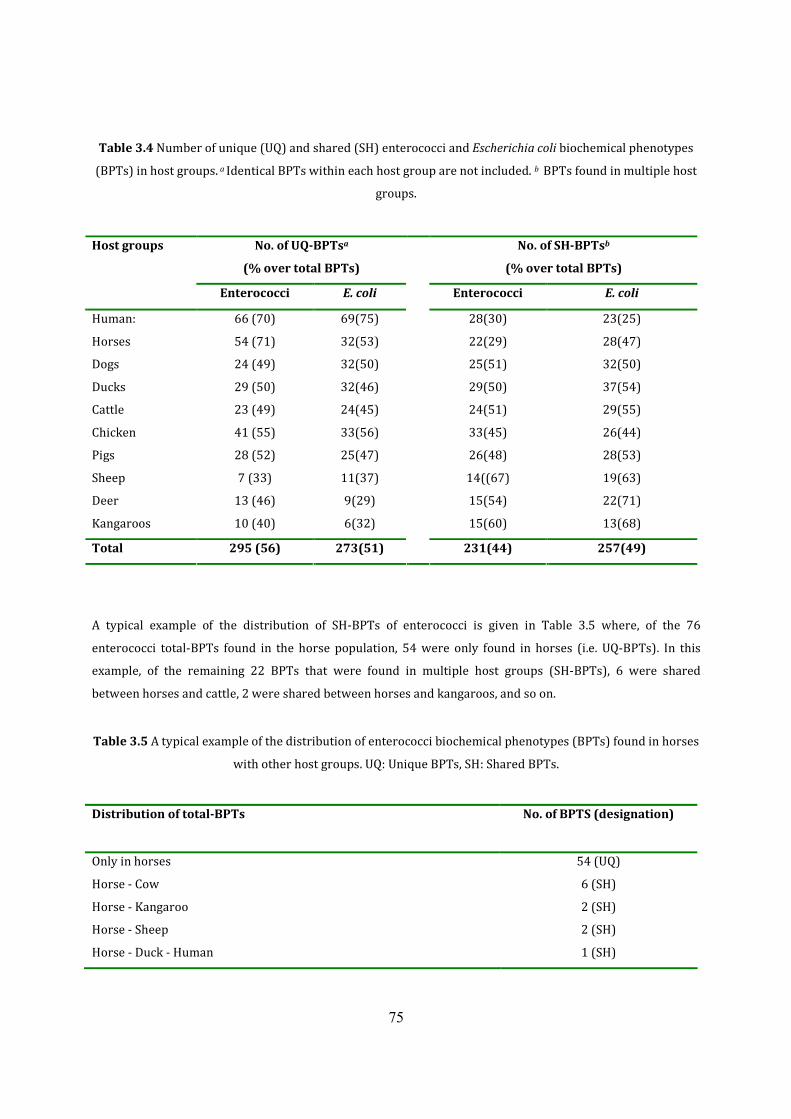
75
Table 3.4 Number of unique (UQ) and shared (SH) enterococci and Escherichia coli biochemical phenotypes
(BPTs) in host groups. a Identical BPTs within each host group are not included. b BPTs found in multiple host
groups.
No. of UQ-BPTsa
(% over total BPTs)
No. of SH-BPTsb
(% over total BPTs)
Host groups
Enterococci E. coli
Enterococci E. coli
Human: 66 (70) 69(75) 28(30) 23(25)
Horses 54 (71) 32(53) 22(29) 28(47)
Dogs 24 (49) 32(50) 25(51) 32(50)
Ducks 29 (50) 32(46) 29(50) 37(54)
Cattle 23 (49) 24(45) 24(51) 29(55)
Chicken 41 (55) 33(56) 33(45) 26(44)
Pigs 28 (52) 25(47) 26(48) 28(53)
Sheep 7 (33) 11(37) 14((67) 19(63)
Deer 13 (46) 9(29) 15(54) 22(71)
Kangaroos 10 (40) 6(32) 15(60) 13(68)
Total 295 (56) 273(51)
231(44) 257(49)
A typical example of the distribution of SH-BPTs of enterococci is given in Table 3.5 where, of the 76
enterococci total-BPTs found in the horse population, 54 were only found in horses (i.e. UQ-BPTs). In this
example, of the remaining 22 BPTs that were found in multiple host groups (SH-BPTs), 6 were shared
between horses and cattle, 2 were shared between horses and kangaroos, and so on.
Table 3.5 A typical example of the distribution of enterococci biochemical phenotypes (BPTs) found in horses
with other host groups. UQ: Unique BPTs, SH: Shared BPTs.
Distribution of total-BPTs
No. of BPTS (designation)
Only in horses 54 (UQ)
Horse - Cow 6 (SH)
Horse - Kangaroo 2 (SH)
Horse - Sheep 2 (SH)
Horse - Duck - Human 1 (SH)

76
Horse - Duck - Chicken 1 (SH)
Horse - Dog - Kangaroo 1 (SH)
Horse - Cattle - Duck 2 (SH)
Horse - Chicken - Pig 1 (SH)
Horse - Cattle - Human - Pig 1 (SH)
Horse - Cattle - Human - Sheep - Deer 1 (SH)
Horse - Cattle - Duck - Sheep - Dog - Chicken - Pig - Kangaroo 4 (SH)
Total 76
For enterococci, the range of SH-BPTs among host groups varied from 14 (in sheep) to 33 (in chickens) and
for E. coli, varied from 13 (in kangaroos) to 37 (in ducks) (see Table 3.5). Therefore, a total of 295 enterococci
BPTs and 273 E. coli BPTs occurred only once in the database while 231 BPTs for enterococci and 257 BPTs
for E. coli occurred in multiple host groups. The occurrence of BPTs for both indicator bacteria among
different host groups is shown in Figure 3.4. All BPTs (i.e. UQ or SH-BPTs) from animal groups that were not
found in humans were collectively categorized as animal-BPTs. The animal-BPTs consisted of 432 enterococci
BPTs and 438 E. coli BPTs, of which 229 (53%) enterococci BPTs and 204 (47%) E. coli BPTs were UQ-BPTs
(see Tables 3.3 and 3.4).
3.3.3 Ecological application of the database
In all, 27 water samples were collected from Eudlo Creek and from each water sample up to 40 enterococci
and E. coli isolates (where possible) were typed and compared with the database. A total of, 791 enterococci
isolates (330 isolates during the wet season and 461 isolates during the dry season) and 550 E. coli (244
Figure 3.4 Occurrence of enterococci (�) and Escherichia coli (�) biochemical
phenotypes (BPTs) across host groups.
0
75
150
225
300
1 2 3 4 5 6>
Occurrence of phenotyeps across animal groups
No
. o
f B
PT
s

77
isolates during the wet season and 306 isolates during the dry season) isolates were tested from the
water samples.
Among the 330 enterococci isolates tested during the wet season, 116 BPTs were identified, of which, 16
(13.8%) were sourced from humans (i.e. UQ-BPTs) and 71 (61.2%) were sourced from animals (i.e. animals-
BPTs) (Table 3.6). Similarly, among the 244 E. coli isolates tested from the water samples 122 BPTs were
found, of which 20 (16.4%) were of human origin and 82 (67.2%) belonged to animals. Twenty-nine
enterococci BPTs and 20 E. coli BPTs were either shared between humans and animals or did not match the
database and were therefore regarded as unknown BPTs (Table 3.6). A large number of bacterial isolates
were tested during the dry season. Among the 461 enterococci isolates tested during this period 132 BPTs
were found, of which 10 (7.6%) were derived from humans (i.e. UQ-BPTs) and 81 (61.3%) derived from
animals (i.e. animal-BPTs) (Table 3.6). Similarly, among the 306 E. coli isolates 160 BPTs were found, of which
16 (10%) were of human origin and 69 (43.1%) belonged to animals (Table 3.6). Forty one enterococci BPTs
and 75 E. coli BPTs either shared between humans and animals or did not match the database.

78
Tab
le 3
.6 C
om
pa
riso
n o
f e
nte
roco
cci
an
d E
sch
eric
hia
co
li b
ioch
em
ica
l p
he
no
typ
es
(BP
Ts)
fro
m w
ate
r sa
mp
les
wit
h t
he
da
tab
ase
. DS:
Dry
sea
son
, WS:
Wet
se
aso
n
No
. of t
ota
l-B
PT
s id
enti
cal t
o d
atab
ase
No
. of i
sola
tes
test
ed (
no
. of
tota
l-B
PT
s fo
un
d)
Hu
man
UQ
-BP
Ts
An
imal
-BP
TS
U
nk
no
wn
BP
Ts
Sam
pli
ng
occ
asio
n
Sam
pli
ng
site
s
EN
T
E. c
oli
En
tero
cocc
i E
. co
li
En
tero
cocc
i E
. co
li
E
nte
roco
cci
E. c
oli
1 W
S
EC
1
EC
2
EC
3
32
(1
0)
38
(1
5)
39
(1
6)
32
(1
2)
25
(1
5)
14
(1
1)
2
1
1
1
4
1
6
9
13
5
11
8
2
5
2
6
0
2
2 W
S
EC
1
EC
2
EC
3
29
(9
)
39
(1
3)
40
(1
0)
23
(1
4)
22
(1
2)
65
(2
6)
1
1
2
3
2
4
5
6
7
11
8
17
3
6
1
0
2
5
3 W
S
EC
1
EC
2
EC
3
38
(1
2)
36
(1
4)
39
(1
7)
19
(1
0)
21
(1
4)
23
(8
)
2
3
3
2
3 -
8
8
9
5
11
6
2
3
5
3
0
2
Sub
-to
tal
9
33
0 (
11
6)
24
4 (
12
2)
1
6
20
7
1
82
29
2
0
4 D
S
EC
1
EC
2
EC
3
EC
4
EC
5
22
(9
)
23
(1
0)
23
(8
)
23
(6
)
23
(1
0)
18
(1
0)
19
(1
2)
20
(1
2)
17
(1
3)
10
(16
)
1 - - - -
1 - 2
3 -
6
8
3
3
6
5
5
5
5
4
2
2
5
3
4
4
7
5
5
6
5 D
S
EC
1
EC
2
EC
3
EC
4
EC
5
23
(7
)
23
(7
)
23
(7
)
23
(8
)
23
(7
)
7 (
5)
14
(6
)
11
(8
)
-
13
(1
1)
1
1
1 - -
- - - - 2
4
4
5
6
4
4
2
3 - 4
2
2
1
2
3
1
4
5 -
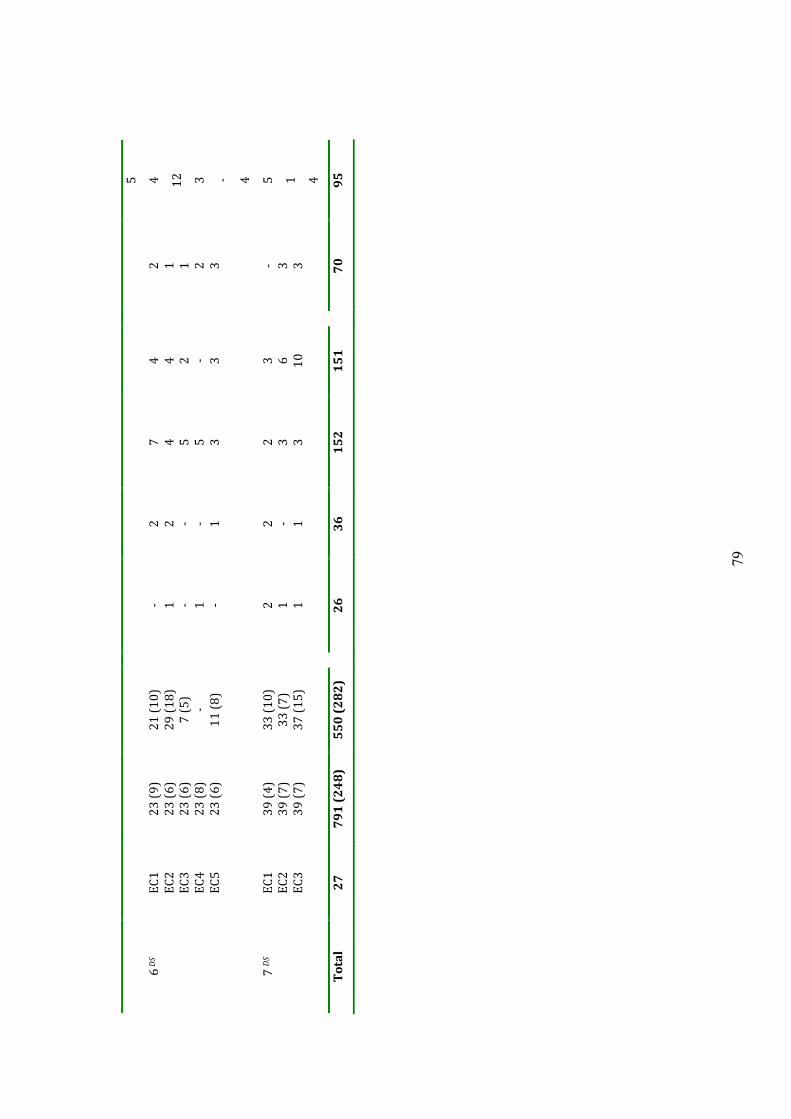
79
5
6 D
S
EC
1
EC
2
EC
3
EC
4
EC
5
23
(9
)
23
(6
)
23
(6
)
23
(8
)
23
(6
)
21
(1
0)
29
(1
8)
7 (
5)
-
11
(8
)
- 1 - 1 -
2
2 - - 1
7
4
5
5
3
4
4
2 - 3
2
1
1
2
3
4
12
3 - 4
7 D
S
EC
1
EC
2
EC
3
39
(4
)
39
(7
)
39
(7
)
33
(1
0)
33
(7
)
37
(1
5)
2
1
1
2 - 1
2
3
3
3
6
10
- 3
3
5
1
4
To
tal
27
7
91
(2
48
) 5
50
(2
82
)
26
3
6
15
2
15
1
7
0
95
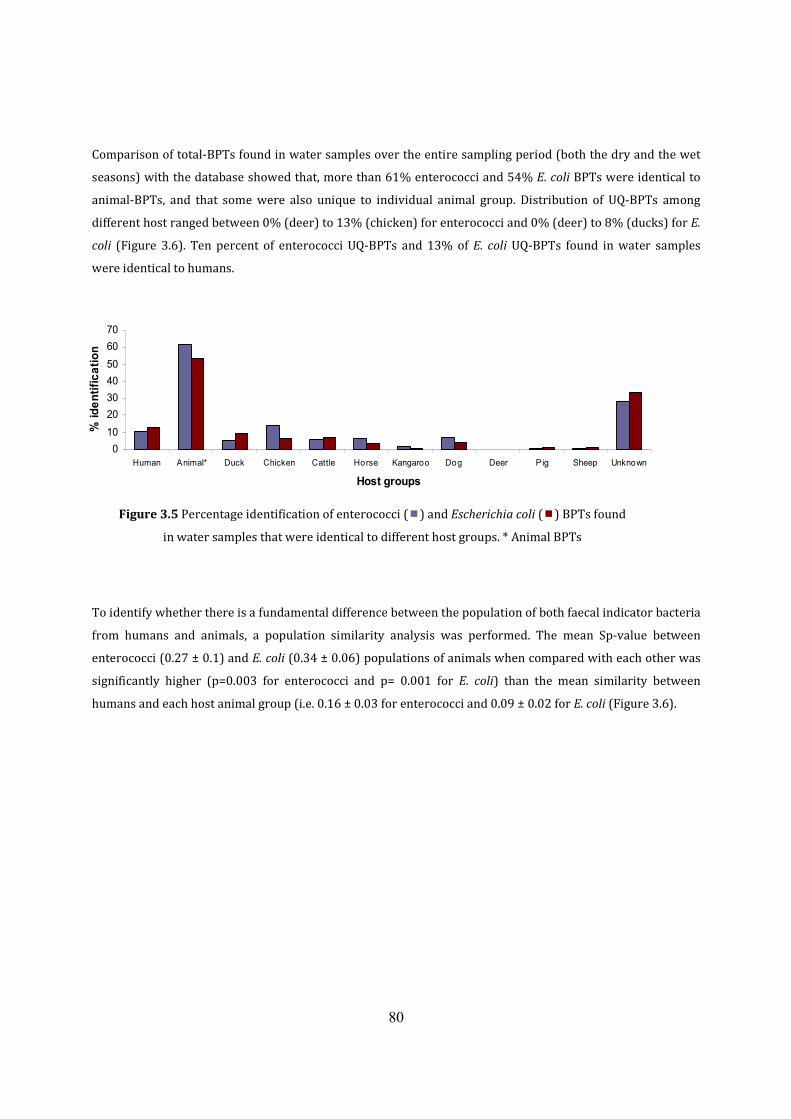
80
Comparison of total-BPTs found in water samples over the entire sampling period (both the dry and the wet
seasons) with the database showed that, more than 61% enterococci and 54% E. coli BPTs were identical to
animal-BPTs, and that some were also unique to individual animal group. Distribution of UQ-BPTs among
different host ranged between 0% (deer) to 13% (chicken) for enterococci and 0% (deer) to 8% (ducks) for E.
coli (Figure 3.6). Ten percent of enterococci UQ-BPTs and 13% of E. coli UQ-BPTs found in water samples
were identical to humans.
To identify whether there is a fundamental difference between the population of both faecal indicator bacteria
from humans and animals, a population similarity analysis was performed. The mean Sp-value between
enterococci (0.27 ± 0.1) and E. coli (0.34 ± 0.06) populations of animals when compared with each other was
significantly higher (p=0.003 for enterococci and p= 0.001 for E. coli) than the mean similarity between
humans and each host animal group (i.e. 0.16 ± 0.03 for enterococci and 0.09 ± 0.02 for E. coli (Figure 3.6).
Figure 3.5 Percentage identification of enterococci (�) and Escherichia coli (�) BPTs found
in water samples that were identical to different host groups. * Animal BPTs
0
10
20
30
40
50
60
70
Human Animal* Duck Chicken Cattle Horse Kangaroo Dog Deer Pig Sheep Unknown
Host groups
% id
en
tifi
ca
tio
n

81
3.3.4 Population similarity analysis - an alternative approach
Whilst comparison of BPTs found in water samples with those of the developed database provided an
accurate way of identifying the sources, a population similarity analysis was performed between host groups
and water samples to obtain a rapid overview of the dominant sources of faecal contamination.
In this approach, Enterococci and E. coli populations from each animal species were compared with those of
water samples during the wet and dry seasons. Although enterococci population from animals showed a
higher similarity (higher Sp-value) to water samples than E. coli (Table 3.7), the similarity of both indicator
Figure 3.6 A UPGMA dendrogram of population similarity of (a) enterococci and (b) Escherichia
coli populations from all host groups.
Duck
Horse
Sp-value
0 0.2 0.4
(a)
Host groups
0
Sp-value
0.4 0.2
(b)
Host groups
Chicken Pig
Cattle Deer
Duck Dogs Sheep
Kangaroos Human
Chicken Pig Cattle Deer
Dog
Sheep Horse Kangaroos Human

82
bacterial populations was higher for water samples during the wet season than the dry season. The highest
Sp-values were obtained with dogs, horses, cows and kangaroos (Table 3.7).
Table 3.7 Comparison of population similarity (Sp-value) of enterococci and Escherichia coli isolated from
host groups and water samples.
Population similarity value to water samples
Enterococci E. coli
Host groups
Wet season Dry season Wet season Dry season
Dogs 0.46 0.36 0.36 0.21
Horses 0.43 0.22 0.33 0.17
Cows 0.42 0.23 0.37 0.27
Kangaroos 0.41 0.17 0.24 0.15
Pigs 0.32 0.19 0.25 0.19
Sheep 0.30 0.14 0.16 0.16
Deer 0.29 0.17 0.25 0.19
Chickens 0.28 0.21 0.26 0.20
Ducks 0.28 0.22 0.35 0.26
Human 0.20 0.20 0.17 0.14
3.5 Discussion
Identification of potential source(s) of faecal contamination in surface waters requires a method that is
capable of distinguishing between human and animal sources. Ideally, the method should also be sufficiently
sensitive to discriminate different animal species. In this study, a biochemical fingerprinting method was used
to develop a host-specific metabolic fingerprint database of two recommended faecal indicator bacteria,
enterococci and E. coli (1, 249) that can be used to trace the sources of faecal contamination in the Eudlo
Creek catchment. Furthermore, a population similarity analysis was used to provide a rapid overview of the
possible sources of contamination.
In developing this database, two important factors were considered. One was the number of isolates to be
tested from each animal species, and the other was how well these numbers represent the diversity of
indicator bacteria among the animal species. The initial analysis of the diversity of faecal indicator bacteria
showed that animals of the same species within a farm carry many identical BPTs and therefore share
common bacterial populations. This was somewhat expected and can be explained by frequent contact of

83
animals with each other and/or dietary similarity (125, 126, 161). However, a higher diversity was obtained
when animals of the same species from one farm were compared with others within a radius of around 20 km
of the studied catchment.
For this reason, as discussed in earlier part of this chapter, the number of sampling farms was increased while
the number of samples from each farm decreased to between 2 and 3. In addition the number of isolates to be
tested from each sample decreased to 10 to 12 isolates. The comparison of total-BPTs in each host group
with other showed that many identical BPTs were shared in multiple host groups. Bacteria are
ubiquitous in the environment and can be found transitionally in many animal species
simultaneously. Similar shared fingerprints have also been reported among different host groups in
other studies (125, 126,197). However, in this study, the percentage of shared (SH) BPTs among
host groups was quite high. This is due to the fact that not only was a large number of isolates tested
from each host group, but also a wide range of host groups were used to develop the database and
therefore more SH-BPTs were found among host groups.
A recent molecular-based study (153) defined unique genotypes on the basis of specificity to individual host
group rather than comparing these genotypes to those found in other host groups. In the present study, UQ-
BPTs were defined as those BPTs that occurred once only in each host group after comparing with all other
total-BPTs found in other host groups. The number of UQ-BPTs in this study varied among different host
groups. Certain host groups (i.e. sheep, deer and kangaroos) contained a smaller number of UQ-BPTs than
others. This may be explained by the fact that a smaller number of samples tested from these host groups
from limited locations and therefore the sampling effort may not have captured the diversity found among
these host groups. Despite so, it was found that these UQ-BPTs can be used as specific fingerprints to pinpoint
the sources of faecal contamination in surface waters. In contrast, some SH-BPTs were found in two or more
animal species including humans. These BPTs could not be used to distinguish the various sources of faecal
contamination and were excluded from the database. However, it was also found that certain SH-BPTs, though
found among different animal species, were not found in humans and could therefore be categorized in a
broader category of animal-BPTs among the studied groups.
Using the developed database, 10% of enterococci BPTs and 13% of E. coli BPTs in water samples were
identified as human UQ-BPTs. It should be noted that, human samples were obtained from septic tanks rather
than fresh human faecal samples and therefore, some UQ and/or SH strains may have not survived in the
septic tanks and therefore not detected. Of the animal-BPTs, 101 (66%) of enterococci BPTs and 93 (62%) of
E. coli BPTs were unique to individual host groups. On the basis of UQ-BPTs for enterococci, chickens

84
contributed 13% of bacterial contamination followed by humans at 13%. For E. coli, humans contributed 13%
followed by ducks at 9%. Both the enterococci and E. coli databases were in close agreement in terms of
identifying the sources of contamination (i.e. for humans 10% enterococci and 13% E. coli; and for cattle 6%
enterococci and 7% E. coli were identified from same water samples) though it was not always consistent for
certain host groups (i.e. for chickens 14% enterococci and 6% E. coli) indicating that combination of both
indicators may provide a better and probably more realistic picture that the sources were correctly identified.
Similar results were obtained when sources of faecal contamination were investigated among the failed septic
systems in previous chapter. However, interestingly enough, total-BPTs from deer were not identical to those
found in the water samples. This can be explained by the fact that there were no wild deer within the
catchment, and the samples were obtained from a sanctuary outside the catchment. This negative control
element of the study provides further validity to the accuracy of the database and the technique in predicting
the sources of contamination.
Certain BPTs of both faecal indicator bacteria found in water samples did not match the database. This may be
due to the fact that either the database was not large enough to capture the diversity of these indicator
bacteria, or that these unknown BPTs might have originated from other non-point sources or a combination of
both. It has been suggested that a library size of up to 40,000 isolates may be needed to capture the genetic
diversity present among E. coli (153). In this study, the number of enterococci and E. coli isolates tested was
4,057 and 3,728 respectively, which when compared to existing database in the literature, is quite high (26,
27, 43, 125, 197, 223, 249, 299). Furthermore, two indicator bacteria (instead of one) provide a higher
specificity for the database to identify the sources correctly.
The ability to analyse the bacterial population similarity (Sp) is another advantage of using the biochemical
fingerprinting and the PhPlate software. This analysis was used to measure the proportion of identical
bacterial isolates in two or more samples and to provide a better understanding of the overall similarity
between compared populations (i.e. host group versus water samples). However, in such an analysis, the
sampling protocol should focus on testing a large number of bacterial isolates from both the suspected
source(s) and the receiving waters. To identify the level of indicator bacteria and their sources during the wet
and the dry seasons in the creek and their possible sources, Sp-values of enterococci and E. coli populations in
the creek were compared with those obtained from different host groups.
The mean Sp-value for both faecal indicator bacteria between different sampling sites in the creek was higher
in the wet than the dry season. This result was somewhat expected as during the wet season a large number of
bacteria are believed to be washed into the creek via surface run-off. Under these conditions, the chance of
finding similar BPTs between two compared populations is high. It has to be noted that, when the diversity of
two bacterial populations is low, the degree of similarity between these populations is determined by the

85
similarity between the dominant BPTs in these samples. In this study, the diversity of enterococci in water
samples during the wet season was significantly higher than during the dry season. This however, was not the
case for E. coli, probably because these strains are naturally more diverse in the environment than enterococci
(3, 22). It was also found that the mean Sp-value of enterococci during both wet and the dry seasons were
higher than those of E. coli. Similar results have also been reported by Vilanova et al. (287), but the reason for
this is not fully understood. One possible explanation is that enterococci survive longer in natural waters than
E. coli (22). This may influence their diversity as new BPTs are cumulatively added into the existing BPTs
resulting in an overall higher diversity and subsequently higher population similarity.
The populations of both faecal indicator bacteria collected from human showed a low similarity with those
collected from water samples. This may again be due to the fact that the diversity of both enterococci and E.
coli in septic tanks was low and therefore comparison with water samples that normally receive bacteria from
different sources would yield a low population similarity value. The highest population similarities were
found between dogs with water samples followed by horses, cows and kangaroos. These animal species were
common throughout the catchment. Interestingly, the bacterial populations from these animal species showed
a low similarity with water samples during the dry season. These data suggest that surface runoff during the
wet season has a strong impact on bacterial concentrations in this study and that the faecal bacteria from
animals, both domestic and wild, can be the major sources of bacterial contamination in this catchment. In this
study, an overall higher population similarity was found for enterococci than E. coli during both seasons,
indicating that irrespective of the season, the use of population similarity analysis for enterococci could be
more advantageous over E. coli. It also suggests that the population analysis of indicator bacteria can provide
a rapid means of predicting the possible sources of contamination in surface waters.
Nonetheless, results obtained from such studies should be interpreted with great caution as some host groups
may share a portion of identical population with other host groups. For instance, the Sp-value for enterococci
between deer and water samples was around 0.29 during the wet season, although the studied area did not
contain any wild deer. This is probably because a portion of the indicator bacteria from deer is shared with
other animals (see Figure 3.6), and therefore yields a higher Sp-value. To overcome this problem, it is
important that the knowledge of the landuse data and the dominant sources in the catchment must be
identified for such analysis.
In conclusion, a metabolic fingerprinting database was developed based on the stringent sampling and testing
of a large number of indicator bacteria from 10 host sources (including human) which was capable of
identifying the sources of up to 65% of the indicator bacteria in the studied creek. The database was also
capable of differentiating between human and animal sources as well as within animals. Furthermore, it

86
provided additional support for the results obtained in chapter 2 that majority of the human unique BPTs
found in septic tanks did not show any similarity with those found in animals.
Another important factor that has to be considered is that the number and the types of animals within a study
area may vary over time due to agricultural practices and/or animal migration (153) and therefore it may not
be possible to include samples from all animals that reside in a study area. This will restrict the ability of a
database to trace the sources of contamination within a watershed. In addition, it is known that geographical
variability exists among indicator bacteria (125), which limits the efficiency of a database to identify unknown
environmental isolates when these bacteria are collected from another geographical area. Temporal stability
and representativeness are also considered as important factors that may limit the use the use of a database
developed for a specific catchment in another catchment within the same geographical region. Because of such
uncertainity with spatial and temporal stability, it was decided to evaluate the application of the developed
database to another catchment within the same geographical region. The results of such evaluation are
presented in the next chapter.

87
CHAPTER 4
The efficacy of a metabolic fingerprint database to trace faecal
contamination in a cross catchment study
4.1 Introduction
Despite the successful application of many catchment-based database-dependent methods in ecological
studies (113, 122, 250), there is a need to explore a more regional (multi-catchment) approach (304).
Although there is an understood inherent difference between catchments, in many regions the spatial
variability between catchments is of the same order of magnitude as that between sub-catchments. The
question must be asked therefore is that if the variability within a catchment has been adequately captured,
and adjacent catchments are of a similar nature (i.e. soils, land-use), to what extent then can a database
dependent model derived from one catchment be applied to others.
A general consensus is that an ideal database should contain a large number of representative isolates from a
wide range of host groups residing in the studied catchment. However, it is not yet known how many isolates
from host groups should be included in a database and what constituents a representative database.
Furthermore, the temporal and geographical variability that exists among indicator bacteria may restrict the
use of indicators for a regional/universal database (125) and it has been suggested that a specific database
may be needed for every catchment (125, 224). This approach, however, is unlikely to be cost effective and
unlikely to be adopted as a monitoring tool for regulating authorities.
As discussed in chapter 3, when developing the metabolic fingerprint database, a stringent sampling protocol
was developed for collecting faecal samples from animal host groups that was grounded on the diversity of
faecal indicator bacteria among individual animals within a farm and the overall diversity of bacteria in each
farm. Moreover, the concept of unique biochemical phenotypes (UQ-BPTs) was used to relate indicator
bacteria to a specific host group. This database development approach potentially lends itself to a more
regional application.
To evaluate the efficacy of such a database in a cross catchment study, a similar approach was adopted to
develop a local database to be used and compared with the existing ones in identifying the sources of faecal
contamination in a coastal lake catchment in the adjacent local government area.

88
4.2 Materials and Methods
4.2.1 Selected catchment
The Currimundi Lake catchment in Caloundra City was chosen for this study. The city is the second largest
municipality (i.e. 1,107 km2) and one of the fastest growing cities in Australia with an annual growth rate of
3.54%. The population is approximately 70,000. Currimundi Lake, being located in the heart of the city, is
mainly used for recreational activities. The lake has a distinctive “ria” like image and is thus quite linear and
narrow (Figure 4.1). Furthermore, it is subject to tidal inundation and the entrance periodically closes
following the formation of sand plugs due to tidal wave action. Once closed, the entrance will only be re-
opened by storm runoff following heavy rainfall events. The surrounding population of the lake is serviced by
several STPs. Routine monitoring, conducted by the Caloundra City Council, has shown high levels of faecal
coliforms that do not comply with the national standard water quality guidelines (211).
4.2.2 Host groups sampling
To develop a local database for comparison with the developed database, 6 host groups were sampled
between March 2005 and May 2005. These included horses, cattle, ducks, chickens, dogs and humans. These
host groups were chosen because they were most common groups throughout the region and therefore
identified as potential contributors in the selected catchment. In all, 155 samples were collected, including
horses (32 samples), cattle (29 samples), chickens (30 samples), ducks (34 samples), dogs (27 samples) and
humans (3 composite samples from a STP servicing residential areas). Faecal samples from domestic animals
were collected from upstream farms whilst those for dogs were collected from city dog parks and a dog
kennel. Human samples were collected as composite samples from a STP servicing residential areas. All
samples (except STP) were collected from fresh defecation of individual animals with sterile swabs and
inserted into Amies transport medium (Interpath, Melbourne, Australia) and transported on ice to the
laboratory and tested within 6 h.
4.2.3 Isolation of enterococci and E. coli
STP samples (10 ml) were suspended in 100 ml of buffered water (0.0425g/l KH2PO4 and 0.4055 g/l MgCl2)
and vortex for 3 min. Serial dilutions were made and filtered through a 0.45 µm pore size (47mm diameter)
nitrocellulose membranes (Advantec, Japan) and placed on m-enterococcus (Difco, UK) and RAPID’ E. coli 2
(REC 2) with supplement (Bio-rad, USA) agar plates. Faecal samples from all animal host groups were directly
streaked on m-enterococcus and REC 2 agar plates. Plates were then incubated at 37ºC for 48 h (for
enterococci) and at 44ºC for 24 h (for E. coli). The REC 2 medium, used for isolation of E. coli is based on the
detection of 2 enzyme activities; β-D-glucuronidase (β-gluc) and β-D-galactosidase (β-gal). The hydrolysis of
chromogenic substrates results in purple E. coli (β-gluc positive/ β-gal positive) and blue coliform colonies (β-
gluc negative/ β-gal positive). The supplement added to the medium inhibits interfering Gram-negative flora,
89
which can be found in wastewater and natural waters. Single purple colonies from this medium were streaked
on McConkey agar (Oxoid, USA) for purity and tested for iodole production and citrate cleavage. Confirmatory
test of indicator was performed as described before (see chapter 2).
4.2.4 Typing and development of a local database
From each individual animal host up to 7 enterococci and 7 E. coli colonies were typed with the biochemical
fingerprinting as described in chapter 2 (section 4.10). Calculation of diversity of both indicator bacteria in
water samples as well as identification of unique (UQ) and shared (SH) BPTs in the local database was also
undertaken as described in chapter 3, (section 4.10). In brief, the UQ-BPTs are those BPTs that are specific to a
single host group, whereas SH-BPTs were found in multiple host groups.
4.2.5 Lake sampling
Water samples were collected from 7 sites (CU1-CU7) from March 2005 to April 2005. The sample sites were
located at various points along the length of the lake. Sample site CU1 was located in the upper reaches of the
lake borders on rural landuse with both animal and cultivated practices. Sample sites CU2 to CU4 were located
adjacent to a high-density residential land-use connected to a centralized STP. Sample site CU5 was also
situated in a highly populated residential area and is proximal to a number of storm water outlets. Sample site
CU6 was located close to a coastal National Park that is bordered mainly by non-residential landuse. Sample
site CU7 was located at the mouth of the lake (being separated from the ocean by a sand plug) and is
extensively used for recreational activities.
In all, 28 samples were collected from these 7 sites (4 samples from each site over a two week intervals) and
tested in triplicate. Water samples were collected and processed in the same manner as described in chapter 2
(section 4.6) except that in this study chromogenic coliform/E. coli medium was replaced with REC 2 medium.
The identification, confirmation and fingerprinting of these isolates were carried out as described in chapter 2
(section 4.9 and 4.10). From each water sample a maximum of 32 (where possible) enterococci and 24 E. coli
isolates (where possible) were typed for comparison with the database.

90
4.2.6 Statistical analysis
One-way analysis of variance (ANOVA) was used to compare the significance of difference of bacterial
populations among water samples from sites CU1 to CU7.
4.3 Results
4.3.1 Abundance of indicator bacteria in the lake
The mean number of enterococci throughout the lake did not differ significantly except that a higher number
was found in site CU1 compared to other sites (p<0.05 for CU1 vs. CU2, CU3 and CU7) (Figure 4.2). The mean
number of E. coli in site CU5 (1241 ± 197) was almost three times higher than enterococci found at each
sampling site and was significantly higher than the number of E. coli found in upstream (p=0.001) and
downstream sites (p=0.05) (Figure 4.2).
Figure 4.1 Sampling sites (CU1 to CU7) on Currimundi Lake.
Residential area
Residential area
Residential area
National park
CU1
CU2
CU3 CU4
CU5
CU6
CU7
Ocean
Residential area
Agricultural and farming
practices

91
In all, 649 enterococci and 505 E. coli isolates from all sites were biochemical fingerprinted (Table 4.1). The
mean diversity index (Di) of both faecal indicator bacteria (0.84 ± 0.11 for enterococci and 0.84 ± 0.10 for E.
coli) was quite high (maximum 1) for all sites and ranged between 0.78 and 0.91 for enterococci and 0.79 and
0.98 for E. coli (Table 4.1).
Table 4.1 Number of enterococci and Escherichia coli isolates tested from each sampling site (CU1-CU7) and
their diversity (Di). a Overall mean diversity. S. D: Standard deviation.
No. of isolates tested
(no of total-BPTs found)
Mean diversity (Di) ± S.D Sampling sites
Enterococci E. coli
Enterococci E. coli
CU1 104 (31) 62 (21) 0.78 ± 0.09 0.8 ±0.05
CU2 84 (32) 54 (14) 0.83 ± 0.18 0.84±0.05
CU3 72 (28) 69 (31) 0.91 ± 0.07 0.89±0.06
CU4 119 (29) 67 (27) 0.83 ± 0.09 0.89±0.06
CU5 113 (26) 69 (25) 0.82 ± 0.11 0.89±0.04
CU6 94 (26) 92 (37) 0.82 ± 0.19 0.86±0.07
CU7 63 (25) 92 (24) 0.91 ± 0.03 0.79±0.22
Total 649 (197) 505 (179)
0.84 ± 0.11a 0.84±0.10 a
0
400
800
1200
1600
CU1 CU2 CU3 CU4 CU5 CU6 CU7
Sampling sites
CF
U/1
00m
l
Figure 4.2 The abundance of enterococci (�) and Escherichia coli (�) in all sampling sites
(CU1-CU7) in the Currimundi Lake

92
4.3.2 Development of a local database
A local database was initially developed by testing 776 enterococci and 780 E. coli isolates from all 6 host
groups (Table 4.2). Within each host group, different BPTs were compared with each other and a
representative of each BPT was saved in the database. In all, 189 enterococci and 245 E. coli BPTs were found
from 6 host groups. These BPTs were referred to as total-BPTs (Table 4.2). The existing database contained
526 enterococci and 530 E. coli total-BPTs. However, when the total-BPTs of these two databases were
compared, it was found that many BPTs from the local database were identical to those of the existing
database and therefore excluded. In this manner, a merged database was created, which contained 651
enterococci and 623 E. coli total-BPTs (Table 4.2).
Table 4.2 Number of enterococci (ENT) and Escherichia coli isolates tested from each host group and the
number of total-biochemical phenotypes (BPTs) found in the local, existing and merged databases. NT: Not
tested.
Local database Existing database Merged database
No. of isolates tested (No. of total BPTs found)
No. of isolates tested (No. of total BPTs found)
No. of isolates tested (No. of total BPTs found)
Host groups
ENT E. coli
ENT E. coli ENT E. coli
Human 137 (28) 161 (57) 1072
(94)
621 (92)
1209 (110) 782 (102)
Horses 109 (31) 131 (34) 407 (76) 407 (60) 516 (96) 538 (74)
Dogs 126 (21) 121 (36) 404 (49) 408 (64) 530 (64) 529 (77)
Ducks 136 (42) 110 (33) 408 (58) 404 (69) 544 (81) 514 (76)
Cattle 145 (40) 126 (41) 411 (47) 401 (61) 556 (80) 527 (73)
Chicken 123 (27) 131 (44) 408 (74) 408 (59) 531 (92) 539 (88)
Pigs NT NT 312 (54) 400 (53) 312 (54) 400 (53)
Sheep NT NT 287 (21) 367 (30) 287 (21) 367 (30)
Deer NT NT 204 (28) 200 (31) 204 (28) 200 (31)
Kangar
oos
NT NT 144 (25) 112 (19) 144 (25) 112 (19)
Total 776 (189)
780 (245)
4057 (526)
3728 (530)
4833 (651) 4508 (623)
The total-BPTs from all host groups were compared with each other and if identical, they were regarded as
SH-BPTs (shared between two or more host groups). In contrast, non-identical BPTs were regarded as UQ-
BPTs (specific to individual host group). In the local database, 118 UQ-BPTs and 71 SH-BPTs for enterococci
and 137 UQ-BPTs and 108 SH-BPTs for E. coli were found, whilst the existing database contained 295 UQ-
BPTs and 231 SH-BPTs for enterococci and 273 UQ-BPTs and 257 SH-BPTs for E. coli (Table 4.3) indicating
that 62% of enterococci UQ-BPTs and 75% of E. coli UQ-BPTs found in the local database were already present
in the existing database. The mean percentage of total UQ-BPTs over total-BPTs in the local database was

93
62.4% (for enterococci) and 55.9% (for E. coli). For the existing database, these figures were 56% and 51%
respectively (Table 4.3). When the local and existing database were merged, 340 UQ-BPTs and 311 SH-BPTs
for enterococci and 307 UQ-BPTs and 316 SH-BPTs for E. coli were found and the mean percentage of total
UQ-BPTs decreased to 52.2% (for enterococci) and 49.2% for (E. coli) respectively (Table 4.3).
Table 4.3 Number of unique (UQ) and shared (SH) enterococci (ENT) and Escherichia coli biochemical
phenotypes (BPTs) of host groups in the local, existing and merged databases. NT: Not tested
Local database Existing database Merged database
ENT E. coli ENT E. coli ENT E. coli
Host
groups
UQ SH UQ SH
UQ SH UQ SH UQ SH UQ SH
Human 19 9 44 13 66 28 69 23
80 30 71 31
Horses 21 10 17 17 54 22 32 28 72 24 38 36
Dogs 16 5 19 17 24 25 32 32 25 39 40 37
Ducks 30 12 11 22 29 29 32 37 36 45 33 43
Cattle 21 19 22 19 23 24 24 29 31 49 31 42
Chicken 11 16 24 20 41 33 33 26 38 54 43 45
Pigs NT NT NT NT 28 26 25 28 28 26 25 28
Sheep NT NT NT NT 7 14 11 19 7 14 11 19
Deer NT NT NT NT 13 15 9 22 13 15 9 22
Kangaroos NT NT NT NT 10 15 6 13 10 15 6 13
Total 118 71 137 108
295 231 273 257
340 311 307 316
In the local as well as the existing and merged database, certain SH-BPTs were only associated with animals
whereas some were shared between human and animals. The latter was excluded from all databases, as they
could not differentiate the sources between these groups. All BPTs (i.e. UQ or SH-BPTs) from animal host
groups that were not found in humans were collectively categorized as animal-BPTs. In the new database the
animal-BPTs consisted of 161 enterococci and 188 E. coli BPTs of which 99 (61%) enterococci and 93 (49%)
were UQ-BPTs (see Tables 4.2 and 4.3). For the existing database these figures were 432 enterococci BPTs and
438 E. coli BPTs of which, 229 (53%) enterococci BPTs and 204 (47%) E. coli BPTs were UQ-BPTs (see Tables
4.2 and 4.3). For the merged database these figures were 541 enterococci BPTs and 521 E. coli BPTs of which,
260 (48%) enterococci BPTs and 236 (45%) E. coli BPTs were UQ-BPTs (see Tables 4.2 and 4.3).
4.3.3 Faecal source tracking
In order to identify the non-point source(s) of faecal contamination, BPTs from the local, existing and merged
databases were compared with the BPTs found in water samples. From all sampling sites, 197 enterococci

94
BPTs and 179 E. coli BPTs were obtained (see Table 4.1). Of the 197 enterococci BPTs, 12 (6%) were identical
to human (i.e. UQ-BPTs) and 87 (44 %) belonged to animals (i.e. animal-BPTs) when compared with the local
database (Table 4.4). However, the remaining 98 (50%) BPTs could not be identified to any host groups. Of
the 179 E. coli BPTs obtained from the same water samples, 13 (7.2%) were of human BPTs and 82 (45.8%)
belonged to animal-BPTs and the remaining 84 (46.9%) could not be identified. These figures for the existing
database were 14 (7.1%) enterococci BPTs and 14 (7.8%) E. coli BPTs for human (i.e. UQ-BPTs) and 109
(55.3%) enterococci BPTs and 102 (57%) E. coli BPTs for animals (i.e. animal-BPTs). In contrast, the ability of
the merged database to identify environmental BPTs was higher than that of the local database. Eighteen
enterococci BPTs (9.1%) and 17 (9.5%) E. coli BPTs were identified as human, therefore the efficacy of the
merged database has improved 50% (for enterococci) and 30% (for E. coli) over the local database.
Comparison of total-BPTs found in water samples over the sampling period with the local database showed
that 44% enterococci and 45.8% E. coli BPTs were identical to animal-BPTs whereas these figures for the
existing database were 55.3% for enterococci and 57% for E. coli. The merged database also showed an
improvement over both databases (i.e. 66% for enterococci and 63% for E. coli) (Figure 4.3). Importantly,
certain animal-BPTs were shown to be unique to an individual animal group. Distribution of enterococci and
E. coli human UQ-BPTs, animal BPTs as well as animal UQ-BPTs according to the (a) local, (b) existing and (c)
merged as shown in Figure 4.3. The level of human (UQ-BPTs) contribution was higher than any other animal
host groups with an exception in the local database, where duck (7.6%) enterococci UQ-BPTs contributed
more than those of humans (6%). According to the local database, among animal groups, ducks contributed
more than any others (7.6% for enterococci and 6% for E. coli) followed by cattle and horses. Similar results
were also found with the existing and merged database, which identified that the contribution from ducks,
was highest (Figure 4.3), followed by cattle and dogs.

95
Tab
le 4
.4 C
om
pa
riso
n o
f e
nte
roco
cci
(EN
T)
an
d E
sch
eric
hia
co
li B
ioch
em
ica
l p
he
no
typ
es
(BP
Ts)
fro
m w
ate
r sa
mp
les
wit
h t
he
ne
w, e
xis
tin
g a
nd
me
rge
d
da
tab
ase
s.
Lo
cal d
atab
ase
Exi
stin
g d
atab
ase
Mer
ged
dat
abas
e
Hu
man
UQ
A
nim
al B
PT
s H
um
an U
Q
An
imal
BP
Ts
Hu
man
UQ
A
nim
al B
PT
s
Sam
pli
ng
site
s
EN
T
E. c
oli
E
NT
E
. co
li
EN
T
E. c
oli
E
NT
E
. co
li
E
NT
E
. co
li
EN
T
E. c
oli
CU
1
4 (
18
) 1
(2
) 1
4 (
29
) 9
(3
2)
2
(1
6)
1 (
2)
19
(6
5)
14
(4
1)
2
(1
6)
1 (
2)
22
(7
6)
16
(4
9)
CU
2
1 (
2)
0 (
0)
12
(5
0)
7 (
42
)
0 (
0)
1 (
4)
20
(6
2)
8 (
28
)
0 (
0)
1 (
4)
21
(6
6)
9 (
29
)
CU
3
1 (
2)
3 (
5)
9 (
35
) 1
7 (
48
)
0 (
0)
3 (
5)
17
(4
5)
19
(5
3)
0
(0
) 4
(6
) 2
1 (
53
) 2
1 (
57
)
CU
4
2 (
4)
2 (
7)
12
(5
0)
12
(3
7)
3
(9
) 2
(7
) 1
3 (
73
) 1
6 (
43
)
3 (
9)
2 (
7)
15
(8
3)
17
(4
8)
CU
5
1 (
1)
3 (
9)
12
(3
9)
8 (
21
)
1 (
1)
3 (
7)
17
(8
1)
11
(3
8)
2
(2
) 5
(1
1)
19
(9
0)
13
(4
3)
CU
6
2 (
3)
4 (
4)
16
(3
0)
17
(3
5)
3
(7
) 2
(3
) 1
4 (
61
) 2
0 (
38
)
4 (
9)
2 (
3)
19
(7
0)
21
(4
1)
CU
7
1 (
4)
0(0
) 1
2 (
32
) 1
2 (
27
) 5
(1
1)
2 (
6)
9 (
31
) 1
4 (
65
) 7
(1
4)
2 (
6)
12
(3
8)
16
(7
3)
To
tal
12
(3
4)
13
(2
7)
87
(26
5)
82
(24
2)
14
(4
4)
14
(3
4)
10
9
(41
8)
10
2 (
30
6)
18
(5
0)
17
(3
9)
13
1 (
47
6)
11
3 (
34
0)
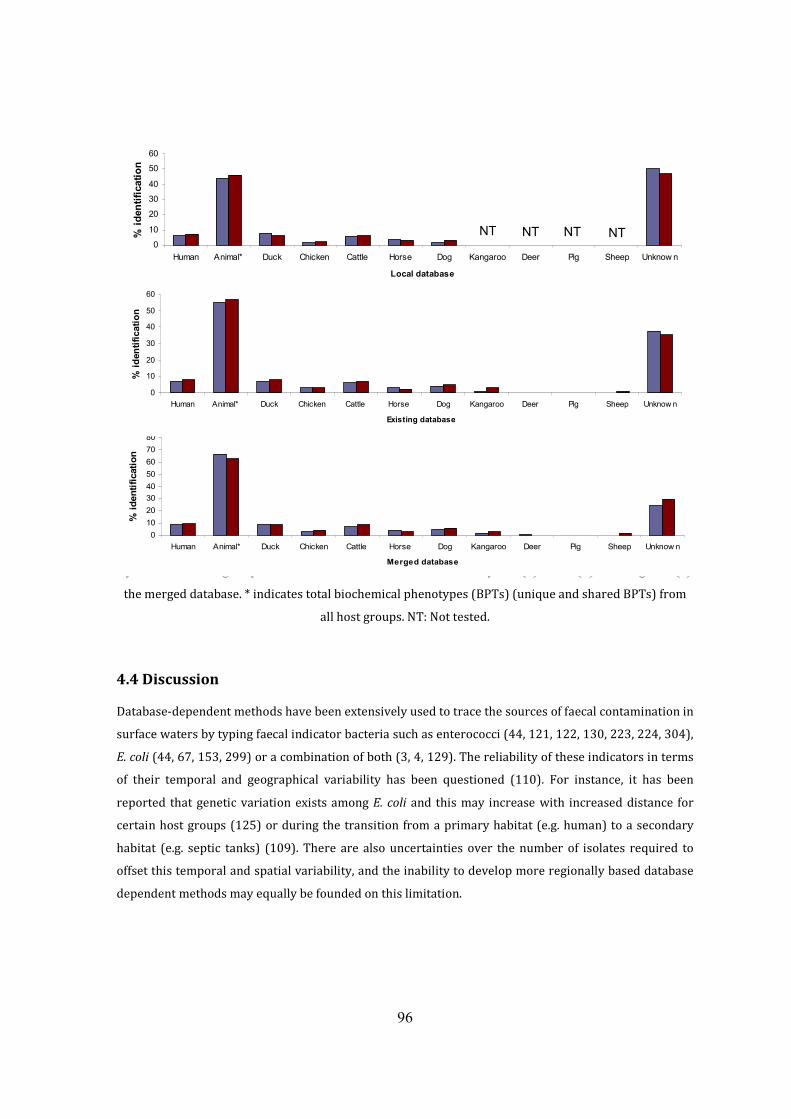
96
Figure 4.3: Percentage contribution of unique (UQ) enterococci (■) and Escherichia coli (�)
by different host group in the Currimundi Lake determined by the (a) local, (b) existing and (c)
the merged database. * indicates total biochemical phenotypes (BPTs) (unique and shared BPTs) from
all host groups. NT: Not tested.
4.4 Discussion
Database-dependent methods have been extensively used to trace the sources of faecal contamination in
surface waters by typing faecal indicator bacteria such as enterococci (44, 121, 122, 130, 223, 224, 304),
E. coli (44, 67, 153, 299) or a combination of both (3, 4, 129). The reliability of these indicators in terms
of their temporal and geographical variability has been questioned (110). For instance, it has been
reported that genetic variation exists among E. coli and this may increase with increased distance for
certain host groups (125) or during the transition from a primary habitat (e.g. human) to a secondary
habitat (e.g. septic tanks) (109). There are also uncertainties over the number of isolates required to
offset this temporal and spatial variability, and the inability to develop more regionally based database
dependent methods may equally be founded on this limitation.
0
10
20
30
40
50
60
70
80
Human Animal* Duck Chicken Cattle Horse Dog Kangaroo Deer Pig Sheep Unknow n
Merged database
% i
den
tifi
cati
on
0
10
20
30
40
50
60
Human Animal* Duck Chicken Cattle Horse Dog Kangaroo Deer Pig Sheep Unknow n
Local database
% i
den
tifi
cati
on
0
10
20
30
40
50
60
Human Animal* Duck Chicken Cattle Horse Dog Kangaroo Deer Pig Sheep Unknow n
Existing database
% i
den
tifi
cati
on
NT NT NT NT
97
In this component of the study an evaluation is made of an existing database with a new local database.
Using the locally developed database, it was shown that both indicator bacteria used in this study (i.e.
enterococci and E. coli) were equally capable of identifying the non-point sources of faecal
contamination in the studied catchment. As identified and discussed in the chapter 3, a combination of
both indicator bacteria increased the confidence level of correct source-identification by complimenting
each other when one indicator bacterium alone failed to identify the source at a particular site. For
instance, faecal contamination at sites CU2 and CU3 could not have been identified as being of human
origin if enterococci only database had been used. The local database, although smaller than the existing
database, is nonetheless comparable with other databases reported in the literature (43, 44, 67, 125,
197, 223, 249, 299).
When a comparison was made of the local and existing database some interesting results were
identified. It was shown that the local database was capable of identifying the sources of more than 50%
of faecal contamination in the studied lake. A major limitation of the local database however, included
the misidentification of sources, and this is a common feature of small databases. For instance, the local
database identified 4 UQ-BPTs of enterococci as human at site CU1. However, when the existing
database was also used, 2 of these were found to be shared with other host groups, suggesting that
results from a database comprising a small number of isolates (i.e. up to 500) should be interpreted with
great care. Management decisions based on such misinterpretations could potential misdirected scarce
local human and financial resources.
In the local database, the mean percentage of UQ-BPTs over total-BPTs was higher than the existing
database. This was due to the fact that the local database consisted of a relatively small number of
isolates (i.e. 776 enterococci and 780 E. coli) and therefore comparisons among 6 host groups yielded
higher UQ-BPTs, whilst the existing database consists of a large number of isolates (i.e. 4,057
enterococci and 3,728 E. coli) and from a wider range of host groups (i.e. 10 host groups), therefore
comparisons of these BPTs would yield a lower percentage of UQ-BPTs than that of the local database.
Not surprisingly, the mean percentage of UQ-BPTs further decreased when the local and the existing
databases were merged.
More than 61% enterococci and 75% E. coli UQ-BPTs from the local database were already present in
the existing database indicating a high representativeness of the UQ-BPTs in the existing database.
Furthermore, the number of UQ-BPTs within each host group of the existing database did not change by
addition of the new BPTs in each group from the local database also suggesting that the UQ-BPTs in the
existing database are specific to host groups. The existing database, although developed from host
98
groups residing in another catchement, identified 7.1% of enterococci BPTs and 7.8% of E. coli BPTs as
being of human origin, which was higher than that identified by the local database (i.e. 6% for
enterococci and 7.2% for E. coli). Similarly, the existing database identified more than 55% (for both
faecal indicator bacteria) of the BPTs as animal-BPTs, which was also higher than that of the local
database (i.e. approximately 45% for both indicator bacteria). As expected, the performance of the
existing database to identify the source of faecal indicator bacteria was improved to 75.6% for
enterococci and 70.6% for E. coli when the two databases were merged.
The stability of the character of an indicator bacteria used for fingerprinting is an important factor for a
database dependent method (304). A recent study has successfully used a merged phenotypic database
to trace the sources of faecal contamination in multiple catchments (304). However, the stability of the
typing characters of such database has not been reported and may require regular updating by testing
more bacterial isolates preferably from different catchments. The overall stability of the existing
database was tested after 9 months by re-typing 50 randomly selected strains representing different
UQ-BPTs (data not shown) and it was found that they were highly stable. Similar results on the stability
of the typing characters used in the biochemical fingerprinting have been reported using laboratory
conditions (157).
The existing database also included samples from deer, sheep and pigs that were not included in the
local database, as these animals either do not exist in this catchment or their numbers and therefore
faecal contribution to the studied lake was considered negligible. When the UQ-BPTs of these host
groups were compared from the existing database to the water samples and it was found that only a few
UQ-BPTs (one enterococci BPT from deer and one E. coli from sheep) were identical with those found in
water samples. It can be postulated that either these two BPTs are not unique to deer and sheep or they
may have come from a very small number of these host groups that may exist in the catchment. Certain
BPTs of both faecal indicator bacteria found in water samples did not match any of the databases tested.
It is possible that these BPTs were originally shared between human and animals and therefore were
excluded from the database. It is also possible that they may have come from other sources such as wild
birds or other wild animals, which are not included in the database. Certain sampling sites showed much
higher E. coli counts than others (i.e. site CU5-CU7). Although, these sites are serviced by local STPs, they
are extensively used for recreational activities and, considering the level of contamination these STPs
are an unlikely contributor. A more likely cause may be the storm water pipes draining into these sites.
In conclusion, this study demonstrated that whilst a locally developed database could partially identify
the sources of faecal contamination in the studied lake, the existing database developed based on a

99
stringent sampling protocol and from a wider range of host groups could be highly represewntative and
identify sources of contamination with higher efficiency than the small locally developed database. As no
database is complete, addition of new data obtained from other catchments will always improve the
performance of the existing databases. The percentage of the improvement however, depends on the
size and representativeness of the existing database, which in this study proved to be quite high.

100
CHAPTER 5
Identification of virulence genes in Escherichia coli strains
5.1 Introduction
Escherichia coli strains are normal inhabitants of the gut of warm-blooded animals including humans
(51). While most gut resident E. coli strains are not pathogenic, certain strains may carry virulence
genes which enable them to cause intestinal infections such as diarrhoea or haemolytic colitis, or extra-
intestinal infections such as neonatal meningitis, nosocomial septicaemia, haemolytic uremic syndrome,
urinary tract and surgical site infections (76, 272). Virulent strains can be categorized as
enteropathogenic E. coli (EPEC), enterotoxigenic E. coli (ETEC), enteroinvasive E. coli (EIEC),
enterohaemorrhagic E. coli (EHEC), enteroaggregative E. coli (EAEC), and diffusely adherent E. coli
(DAEC) (209). These pathogenic strains may cause disease not only in humans but also in animals. For
instance, it has been reported that ETEC and EHEC are found in cattle (16, 218) and other ruminants
(205) due to structural differences in the toxin molecules produced by different strains. For instance,
heat labile toxin 1 (i.e. LT1) and heat stable toxin 1 (i.e. ST1) have been found in humans and/or pigs,
while heat stable toxin 2 (i.e. ST2) is found only in humans (42, 72, 119).
Warm-blooded animals as well as humans may release such bacteria into the environment where they
may be transported to surface water via surface and sub-surface run-off (94, 203, 249). Contamination
of surface waters with these pathogenic strains of E. coli has been reported to result in an increase in the
number of outbreaks and deaths (78, 216). These strains may also belong to several phenotypes and/or
serotypes. It has been reported that more than 100 serotypes of E. coli may carry verotoxin (VT) genes
although, not all of them have been implicated in human disease because they may not possess the
additional virulence attributes required for pathogenesis.
The presence/absence of E. coli and other faecal indicator bacteria in surface water can only be used to
predict the quality of water and do not provide definitive information with respect to their possible
source(s) (103, 130, 173, 197, 299) and health risks that may have been associated with faecal
contamination. Whilst MST methods may provide information with regard to the sources of faecal
contamination they are not sufficiently indicative enough to identify the health risks associated with
such contamination. It has been reported that there are almost 30 virulence genes present in E. coli
strains with the potential to cause disease (109). The use of polymerase chain reaction (PCR) technique
has made it easy to detect the presence of these genes within a short period of time.

101
During the development of the metabolic fingerprint database for this thesis and assignment of the UQ-
BPTs to each host group, it was hypothesized that strains belonging to these BPTs may also contain
specific virulence properties, which differentiate them from others in different host groups. From the
publich health point of view, such information will help identifying risks associated with the use of
surface waters for recreational activities. In this study, attempts were made to test representative
isolates from all host groups and water samples for the presence of certain virulence genes associated E.
coli strains causing intestinal and extra-intestinal infection in human and animals.
5.2 Materials and methods
5.2.1 Sources of isolates
Among the 3,107 E. coli isolates tested from 9 animal host groups, 438 BPTs were found (see chapter 3).
One representative strain of each BPT (i.e. 438 isolates) was saved in vials containing 1.5 ml tryptic soy
broth (Oxoid) with 15% glycerol at –80o C. In all, 204 isolates were selected for this study. If a strain
from any of the animal groups carried one or more virulence genes, the corresponding BPT in the water
samples was identified and tested for the presence of similar genes. Among the 550 E. coli isolates tested
from creek water samples, 282 BPTs were found (see chapter 3). One representative of each BPT (i.e.
282 isolates) was saved for further analysis. In all, 80 isolates were tested for the presence of 15
virulence genes.
During an earlier component of this study, it was recognised that human faecal contamination was
reaching surface waters via defective septic tanks (chapter 2), while strains from both the septic tanks
and surface water were tested for the biochemical fingerprint, no representative isolate was saved for
further evaluation. In this study, to identify whether E. coli strains from human can also carry virulence
genes, samples from 8 defective septic tanks in Eudlo Township were collected and tested. The selected
8 septic tanks were shown to contribute faecal indicator bacteria into the creek and are located within
60 to 70 m of the creek (see chapter 2). Fifty millilitres of faecal materials in septic tanks were collected
in 100 ml sterile bottles and transported to the lab on ice and total genomic DNA was extracted within 2
h after collection.
5.2.2 DNA extraction from septic tank samples
The whole genomic DNA extraction from septic tank samples was performed with the Stool mini kit
(QIAgen, Victoria, Australia) according to the manufacturer’s instruction. In brief, 100 µl effluents were
added into 50 ml tubes and centrifuged at 30,000 rpm for 10 mins to obtain cell pellet. The cell pellet
was resuspended in 200 µl sterile MilliQ water. 1.4 ml buffer ASL was added to each tube and the
suspension was heated for 5 min at 70ºC and centrifuged at 30,000 rpm to pellet effluents particle. The
pellet was discarded and the supernatant was transferred into a new 2 ml tube. InhibitEX tablet was

102
added to each tube and centrifuged at 30,000 rpm for 3 mins to pellet inhibitors bound to inhibitEX. All
the supernatant was transferred into new 1.5 ml tube and 15 µl Proteinase K was added and centrifuged
for 3 mins. In the next step, 200 µl buffer AL was added and vortexed for short time. After incubation 10
mins at 70ºC, 200 µl of ethanol (96-100%) was added to the lysate. The lysate was transferred to
QIAamp spin column, centrifuged at 30,000 rpm for 1 min and 500 µl buffer AW1 was added and
centrifuged at 30,000 rpm for 1 min followed by adding 500 µl Buffer AW2. The tubes were then
centrifuged for 3 min and 200 µl buffer AE added directly on the QIAamp membrane. The tubes were
then centrifuged to elute DNA.
5.2.3 DNA extraction from isolates
E. coli isolates were streaked on McConkey’s agar (Oxoid, UK) from –80oC vials and single colonies were
streaked to confirm their purity. A single colony was then inoculated into 50 ml flask containing 10 ml
Luria Bertani (LB) broth made of 10 g (w/v) tryptone (Oxoid, UK), 5 g (w/v) NaCl, 5 g (w/v) yeast
extract (Oxoid, UK) and 1 L distilled water. The flasks were kept in an incubator shaker at 110 rpm for
18 h. The DNA extraction was performed by xanthogenate extraction method (273). Xanthogenate
solution consisted of 0.5 g (w/v) potassium ethyl xanthogenate (Fluka, Buchs, Switzerland), 10 ml (4 M)
ammonium acetate (Sigma USA), 5 ml (1M) Tris-HCl (Sigma USA), 2 ml (0.45 M) EDTA (Merck Pty Ltd,
Australia) 2.5 ml (20%) SDS (Bio-Rad Laboratories, USA) and 30 ml de-ionized water to make a volume
of 50 ml stock solution. In brief, 1 ml of bacterial growth cultures were inoculated into 1.5 ml sterile
tubes and centrifuged at 12,000 rpm for 3 min. The supernatant was removed by decanting followed by
pipetting. One millilitre of xanthogenate extraction solution was added to the cell pellet, mixed and kept
in a warterbath at 65ºC for 2 h, vortexing every 30 min. The cell debris were precipitated by keeping the
tubes on ice for 10 min. The tubes were then centrifuged at 12,000 rpm for 10 min and the supernatant
was transferred into fresh tubes containing 1 ml of iso-propanol alcohol followed by mixing to
precipitate the DNA and kept in room temperature for 5 min. The tubes were centrifuged again at
12,000 rpm for 10 min, the supernatant were removed and the DNA pellet was suspended in Milli-Q
water and stored at -20º C.
5.2.4 PCR amplification
Fifteen sets of primers were used in this study. Primer sets (Table 5.1) were diluted according to gene
works instructions (Gene Works, Australia). Primer sets for the attachment and effacement (eaeA) gene,
verotoxin (VT) 1,2 and 2e, heat-labile toxin (LT) 1, heat-stable toxins (ST) 1 and 2, enteroinvasive (Einv)
gene, enteroaggregative (EAgg) gene, cytotoxic necrotizing factors (CNF) 1 and 2 were diluted to 25
pmoles concentrations. However, primers for haemolysin A (hlyA), pyelonephritis-associated pili (pap)
C, LPS O111 and O157side chain, were diluted to a concentration of 50pmoles. A standard master mix of
11.8 µl sterile Milli-Q water, 2.4 µl MgCl2, 2.4 µl reaction buffer, 2 µl deoxyneucleoside triphosphates

103
(DNTPs), 0.16 µl of Taq polymerase (Fisher- biotech), 0.4 µl forward and 0.4 µl reverse primer was used
per reaction. This resulted in a total volume of 19.56 µl per tube. Two µl of DNA template was added in
each tube. For hlyA and papC, MgCl2 concentration gradient was performed for optimization. This
resulted in a master-mix of 11.9 µl sterile Milli-Q water, 2.5 µl Mgcl2, 2.4 µl reaction buffer, 2 µl DNTPs,
0.16 µl of Taq polymerase, 0.3 µl forward and 0.3 µl reverse primer per reaction and a total volume of
19.56 µl per tube. Table 5.1 shows the primer sequence and the amplicon size of the genes tested.
PCR (Eppendorf, Mastercycler gradient, Germany) for eaeA, VT1, VT2, VT2e, LT1, ST1, ST2, Einv, Eagg,
CNF1, CNF2 was performed as previously described by Pass et al. (226) and consisted of 5 cycles of 95ºC
for 30 sec and 72ºC for 1 min followed by 25 cycles at 95ºC for 30 sec; 63ºC for 30 sec, 72ºC for 30 sec
and 1 cycle of 72ºC for 5 min. PCR amplification of hlyA consisted of 1 cycles of 94ºC for 30 sec; 30 cycles
of 94ºC for 30 sec, 55ºC for 1 min, 68ºC for 6 min and 1 cycle of 72ºC for 10 min. PCR for O157 and for
O111 LPS side-chain it consisted of 35 cycles of 95ºC for 1 min, 65ºC for 2 min for the first 10 cycles,
decrementing to 60ºC by cycle 15 and 72ºC for 1.5 min incrementing to 2.5 min from cycles 25 to 35.
100 bp ladders (GeneWorks) used to assess the PCR for all of the primers except hlyA for which 1 kb
ladders (GeneWorks) were used.To detect the amplified product, 3 µl aliquot of the PCR product was
examined by electrophoresis through 1.5% agarose gel (Progen Australia) in 1 x TAE buffer (50 X TAE:
242 g Tris base, 57.1 ml glacial acetic acid, made up to 1 L with H2O. Identification of the bands was
established by comparison of the band sizes with molecular weight markers of 100 bp and 1 kb ladder
(Geneworks) after staining with ethidium bromide.

115
Tab
le 5
.1 T
he
pri
me
r se
qu
en
ce a
nd
th
e a
mp
lico
n s
ize
of
15
vir
ule
nce
ge
ne
s fo
un
d a
mo
ng
Esc
her
ich
ia c
oli
str
ain
s a
sso
cia
ted
wit
h i
nte
stin
al
an
d e
xtr
a-
inte
stin
al
site
s.
Tar
get
Gen
e P
ath
oge
nic
fac
tor
Pri
mer
Seq
uen
ces
(5˝-
3˝)
A
mp
lico
n
size
(b
ase
pai
rs)
Co
ntr
ol E
. co
li
stra
ins
Ref
eren
ce
eaeA
A
tta
chin
g a
nd
eff
aci
ng
(E
PE
C)
F:
5’-
TG
AG
CG
GC
TG
GC
AT
GA
GT
CA
TA
C-3
’
R:
5’-
TC
GA
TC
CC
CA
TC
GT
CA
CC
AG
AG
G-3
’
24
1
12
07
9
(22
6)
EA
gg
E
nte
roa
gg
reg
ati
ve
ad
he
sio
n
(EA
EC
)
F:
5’-
AG
AC
TC
TG
GC
GA
AA
GA
CT
GT
AT
C-3
’
R:
5’-
AT
GG
CT
GT
CT
GT
AA
TA
GA
TG
AG
AA
C-3
’
19
4
Ha
gu
e
(22
6)
Ein
v
Inv
asi
on
(E
IEC
) F
: 5
’-T
GG
AA
AA
AC
TC
AG
TG
CC
TC
TG
CG
G-3
’
R:
5’-
TT
CT
GA
TG
CC
TG
AT
GG
AC
CA
GG
AG
-3’
14
0
D4
34
(2
26
)
VT
1
Ve
roto
xin
(E
HE
C)
F:
5’-
AC
GT
TA
CA
GC
GT
GT
TG
CT
GG
GA
TC
-3’
R:
5’-
TT
GC
CA
CA
GA
CT
GC
GT
CA
GT
TA
GG
-3’
12
1
12
07
9
(22
6)
VT
2
Ve
roto
xin
(E
HE
C)
F:
5’-
TG
TG
GC
TG
GG
TT
CG
TT
AA
TA
CG
GC
-3’
R:
5’-
TT
GC
CA
CA
GA
CT
GC
GT
CA
GT
TA
GG
-3’
10
2
12
07
9
(22
6)
VT
2e
V
ero
tox
in (
EH
EC
) F
: 5
’-C
CA
GA
AT
GT
CA
GA
TA
AC
TG
GC
GA
C-3
’
R:
5’-
GC
TG
AG
CA
CT
TT
GT
AA
CA
AT
GG
CT
G-3
’
32
2
E4
08
83
(2
26
)
O1
11
S
ide
-ch
ain
LP
S (
EH
EC
) F
: 5
’-T
AG
AG
AA
AT
TA
TC
AA
GT
TA
GT
TC
C-3
’
R:
5’-
AT
AG
TT
AT
GA
AC
AT
CT
TG
TT
TA
GC
-3’
40
6
97
m 2
71
6
(22
7)
O1
57
O
15
7:H
7 S
ide
-ch
ain
LP
S (
EH
EC
) F
: 5
’-C
GG
AC
AT
CC
AT
GT
GA
TA
TG
G-3
’
R:
5’-
TT
GC
CT
AT
GT
AC
AG
CT
AA
TC
C-3
’
25
9
96
02
-50
69
(2
27
)
hly
A
Α-h
ae
mo
lysi
n (
UP
EC
) F
: 5
’-G
AC
AA
AG
CA
CG
AA
AG
AT
G-3
’
R:
5’-
CA
AC
TG
CA
AT
AA
AG
AA
GC
-3’
29
30
J9
6
(37
)
CN
F1
C
yto
tox
ic n
ecr
oti
zin
g f
act
or
1
(UP
EC
)
F:
5’-
GG
CG
AC
AA
AT
GC
AG
TA
TT
GC
TT
GG
-3’
R:
5’-
GA
CG
TT
GG
TT
GC
GG
TA
AT
TT
TG
GG
-3’
55
2
7/
6/
96
, MA
P
(22
6)
CN
F2
C
yto
tox
ic n
arc
oti
zin
g f
act
or
2
(UP
EC
)
F:
5’-
GT
GA
GG
CT
CA
AC
GA
GA
TT
AT
GC
AC
TG
-3’
R:
5’-
CC
AC
GC
TT
CT
TC
TT
CA
GT
TG
TT
CC
TC
-3’
83
9
7/
6/
96
, MA
P
(22
6)
pa
pC
P
fim
bri
a (
UP
EC
) F
: 5
’-G
AC
GG
CT
GT
AC
TG
CA
GG
GT
GT
GG
CG
-3’
R:
5’-
AT
AT
CC
TT
TC
TG
CA
GG
GA
TG
CA
AT
A-3
’
32
8
J96
(3
7)
LT
1
He
at
lab
ile
to
xin
1 (
ET
EC
) F
: 5
’-T
GG
AT
TC
AT
CA
TG
CA
CC
AC
AA
GG
-3’
R:
5’-
CC
AT
TT
CT
CT
TT
TG
CC
TG
CC
AT
C-3
’
36
0
01
47
:K8
9
(22
6)
ST
I H
ea
t-st
ab
le t
ox
in 1
(E
TE
C)
F:
5’-
TT
TC
CC
CT
CT
TT
TA
GT
CA
GT
CA
AC
TG
-3’
R:
5’-
GG
CA
GG
AT
TA
CA
AC
AA
AG
TT
CA
CA
G-3
’
16
0
11
60
2
(22
6)
ST
II
He
at-
sta
ble
to
xin
2 (
ET
EC
) F
: 5
’-C
CC
CC
TC
TC
TT
TT
GC
AC
TT
CT
TT
CC
-3’
R:
5’-
TG
CT
CC
AG
CA
GT
AC
CA
TC
TC
TA
AC
CC
-3’
42
3
01
49
:K+
K8
8
(22
6)
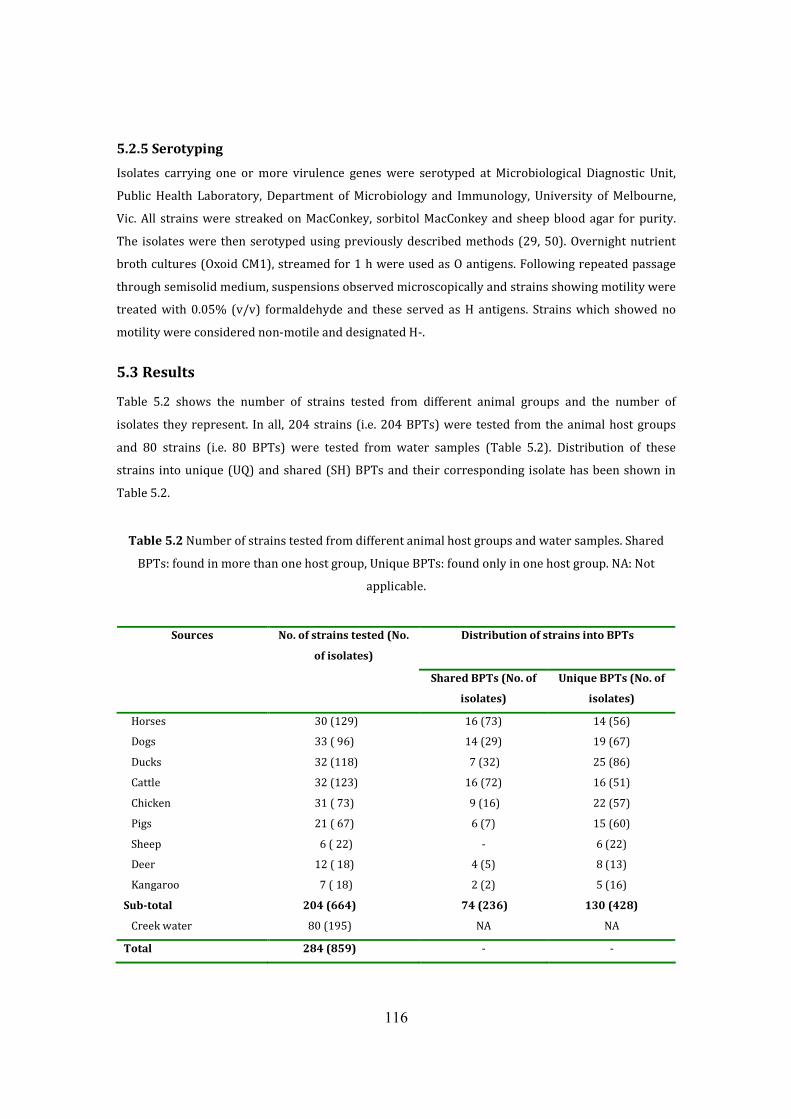
116
5.2.5 Serotyping
Isolates carrying one or more virulence genes were serotyped at Microbiological Diagnostic Unit,
Public Health Laboratory, Department of Microbiology and Immunology, University of Melbourne,
Vic. All strains were streaked on MacConkey, sorbitol MacConkey and sheep blood agar for purity.
The isolates were then serotyped using previously described methods (29, 50). Overnight nutrient
broth cultures (Oxoid CM1), streamed for 1 h were used as O antigens. Following repeated passage
through semisolid medium, suspensions observed microscopically and strains showing motility were
treated with 0.05% (v/v) formaldehyde and these served as H antigens. Strains which showed no
motility were considered non-motile and designated H-.
5.3 Results
Table 5.2 shows the number of strains tested from different animal groups and the number of
isolates they represent. In all, 204 strains (i.e. 204 BPTs) were tested from the animal host groups
and 80 strains (i.e. 80 BPTs) were tested from water samples (Table 5.2). Distribution of these
strains into unique (UQ) and shared (SH) BPTs and their corresponding isolate has been shown in
Table 5.2.
Table 5.2 Number of strains tested from different animal host groups and water samples. Shared
BPTs: found in more than one host group, Unique BPTs: found only in one host group. NA: Not
applicable.
Distribution of strains into BPTs
Sources No. of strains tested (No.
of isolates)
Shared BPTs (No. of
isolates)
Unique BPTs (No. of
isolates)
Horses 30 (129) 16 (73) 14 (56)
Dogs 33 ( 96) 14 (29) 19 (67)
Ducks 32 (118) 7 (32) 25 (86)
Cattle 32 (123) 16 (72) 16 (51)
Chicken 31 ( 73) 9 (16) 22 (57)
Pigs 21 ( 67) 6 (7) 15 (60)
Sheep 6 ( 22) - 6 (22)
Deer 12 ( 18) 4 (5) 8 (13)
Kangaroo 7 ( 18) 2 (2) 5 (16)
Sub-total 204 (664) 74 (236) 130 (428)
Creek water 80 (195) NA NA
Total 284 (859) - -

117
5.3.1 Prevalence of virulence genes
In all, 28 (13.7%) out of the 204 strains tested from 9 host groups contained one or more virulence
genes. These included 2 strains from horses, 8 from dogs, 2 from ducks, 5 from cattle, 7 from chicken,
1 from pigs and 3 from deer (Table 5.3). No virulence genes were identified among sheep and
kangaroos. Eighteen out of above 28 strains (64%) were unique to individual host groups (i.e. UQ-
BPTs) and the remaining 10 were shared between two or more host groups (i.e. SH-BPTs) (e.g. 1 BPT
from horse was shared with cattle) (Table 5.3). Five (6.3%) out of the 80 strains tested from water
samples, carried one or more virulence genes (Table 5.3).
Table 5.3 Strains from different host groups and water samples carrying one or more of the 15
virulence genes tested. SH-BPTs: Shared BPTs (found in more than one host group). UQ-BPTs:
Unique-BPTs (found only in one host group). A: shared with cattle, B: shared with horses, cattle, sheep
and pigs. C: shared with duck, horses, chicken and kangaroos; D: shared with ducks. NA: Not
applicable.
Distribution of strains into BPTs
Sources No. of strains
carrying virulence
genes
(representative
isolates)
SH-BPT
(No. of isolates)
UQ-BPT
(No. of isolates)
% of strains carrying
virulence genes over
total number of strains
tested
Horses 2 (12) 1 (11)A 1 6.70
Dogs 8 (52) 3 (29)B 5 (23) 24.2
Ducks 2 (3) - 2 (3) 6.30
Cattle 5 (99) 5 (99)C - 15.6
Chicken 7 (12) 1 (2)D 6 (10) 22.6
Pigs 1 (13) - 1 (13) 4.76
Sheep - - - -
Deer 3 (5) - 3 (5) 25.0
Kangaroo - - - -
Sub-total 28 (196) 10 (141) 18 (55) 13.72
Creek
water
5 (7) NA NA 6.3
Total 33 (203) - - 11.6
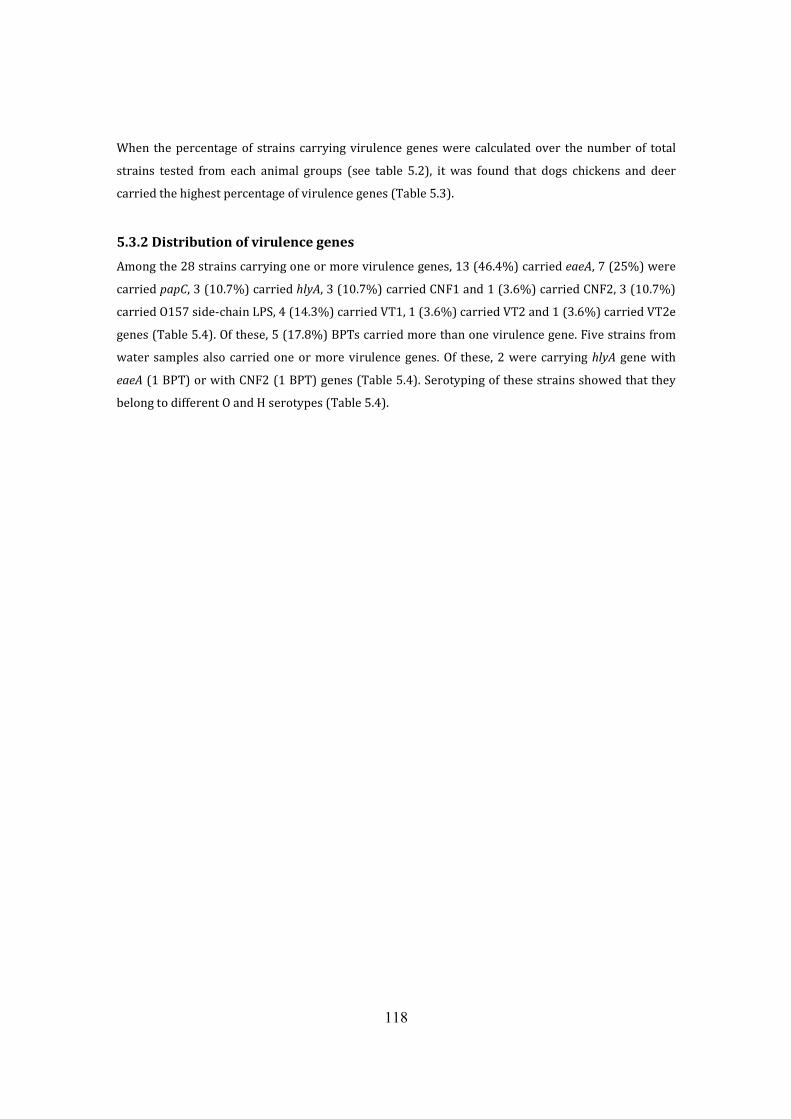
118
When the percentage of strains carrying virulence genes were calculated over the number of total
strains tested from each animal groups (see table 5.2), it was found that dogs chickens and deer
carried the highest percentage of virulence genes (Table 5.3).
5.3.2 Distribution of virulence genes
Among the 28 strains carrying one or more virulence genes, 13 (46.4%) carried eaeA, 7 (25%) were
carried papC, 3 (10.7%) carried hlyA, 3 (10.7%) carried CNF1 and 1 (3.6%) carried CNF2, 3 (10.7%)
carried O157 side-chain LPS, 4 (14.3%) carried VT1, 1 (3.6%) carried VT2 and 1 (3.6%) carried VT2e
genes (Table 5.4). Of these, 5 (17.8%) BPTs carried more than one virulence gene. Five strains from
water samples also carried one or more virulence genes. Of these, 2 were carrying hlyA gene with
eaeA (1 BPT) or with CNF2 (1 BPT) genes (Table 5.4). Serotyping of these strains showed that they
belong to different O and H serotypes (Table 5.4).
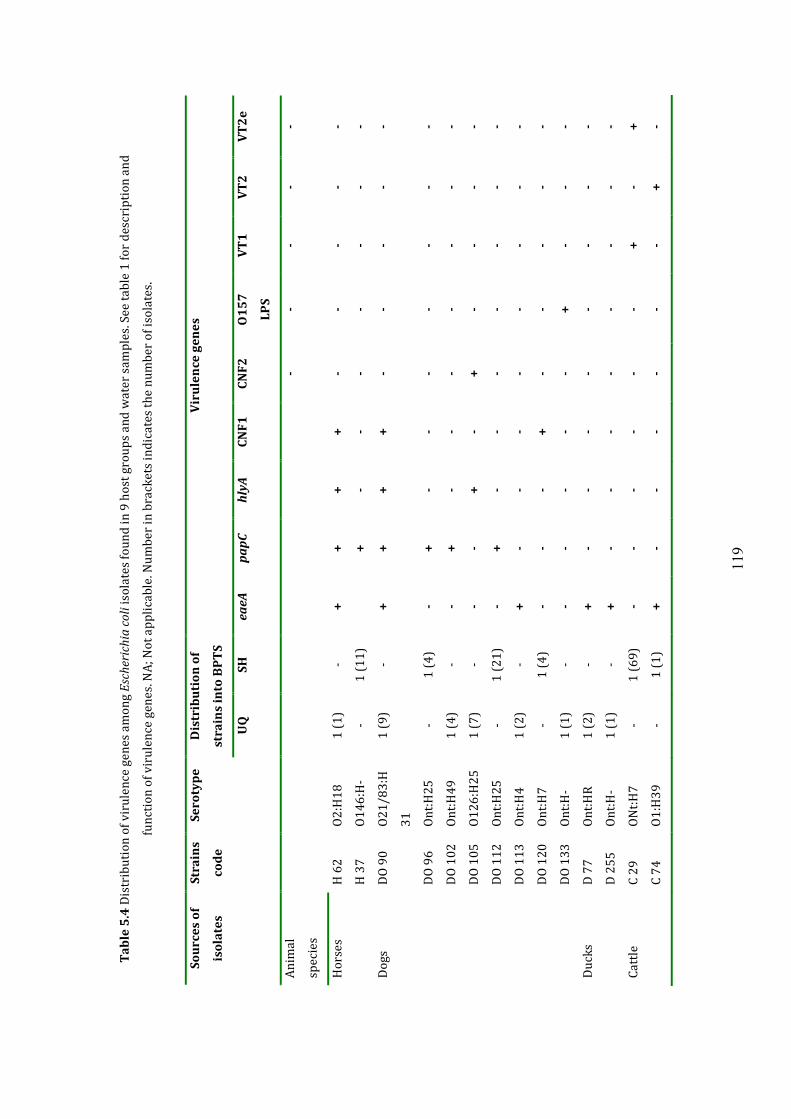
119
Tab
le 5
.4 D
istr
ibu
tio
n o
f v
iru
len
ce g
en
es
am
on
g E
sch
eric
hia
co
li i
sola
tes
fou
nd
in
9 h
ost
gro
up
s a
nd
wa
ter
sam
ple
s. S
ee
ta
ble
1 f
or
de
scri
pti
on
an
d
fun
ctio
n o
f v
iru
len
ce g
en
es.
NA
; N
ot
ap
pli
cab
le. N
um
be
r in
bra
cke
ts i
nd
ica
tes
the
nu
mb
er
of
iso
late
s.
Dis
trib
uti
on
of
stra
ins
into
BP
TS
Vir
ule
nce
gen
es
Sou
rces
of
iso
late
s
Stra
ins
cod
e
Sero
typ
e
UQ
SH
e
ae
A
pa
pC
h
lyA
C
NF
1
CN
F2
O
15
7
LPS
VT
1
VT
2
VT
2e
An
ima
l
spe
cie
s
- -
- -
-
Ho
rse
s H
62
O
2:H
18
1
(1
) -
+
+
+
+
- -
- -
-
H
37
O
14
6:H
- -
1 (
11
)
+
- -
- -
- -
-
Do
gs
DO
90
O
21
/8
3:H
31
1 (
9)
- +
+
+
+
-
- -
- -
D
O 9
6
On
t:H
25
-
1 (
4)
- +
-
- -
- -
- -
D
O 1
02
O
nt:
H4
9
1 (
4)
- -
+
- -
- -
- -
-
D
O 1
05
O
12
6:H
25
1
(7
) -
- -
+
- +
-
- -
-
D
O 1
12
O
nt:
H2
5
- 1
(2
1)
- +
-
- -
- -
- -
D
O 1
13
O
nt:
H4
1
(2
) -
+
- -
- -
- -
- -
D
O 1
20
O
nt:
H7
-
1 (
4)
- -
- +
-
- -
- -
D
O 1
33
O
nt:
H-
1 (
1)
- -
- -
- -
+
- -
-
Du
cks
D 7
7
On
t:H
R
1 (
2)
- +
-
- -
- -
- -
-
D
25
5
On
t:H
- 1
(1
) -
+
- -
- -
- -
- -
Ca
ttle
C
29
O
Nt:
H7
-
1 (
69
) -
- -
- -
- +
-
+
C
74
O
1:H
39
-
1 (
1)
+
- -
- -
- -
+
-
120
C
65
O
nt:
H-
- 1
(8
) +
-
- -
- -
- -
-
C
67
O
nt:
H1
9
- 1
(2
0)
+
- -
- -
- -
- -
C
17
2
O1
62
:H7
-
1 (
1)
+
- -
- -
- -
- -
Ch
ick
en
C
H 1
79
O
nt:
HR
1
(2
) -
+
- -
- -
- -
- -
C
H 2
39
O
15
7:H
10
1
(1
) -
- -
- -
- +
-
- -
C
H 2
40
O
11
9:H
- 1
(2
) -
- -
- -
- -
- -
-
C
H 2
41
O
12
0:H
26
1
(1
) -
+
- -
- -
- -
- -
C
H 2
42
O
13
6:H
26
1
(3
) -
+
- -
- -
- -
- -
C
H 2
45
O
12
3:H
27
1
(1
) -
- +
-
- -
- -
- -
C
H 1
92
O
15
7:H
11
-
1 (
2)
- -
- -
- +
-
- -
Pig
s P
27
1
On
t:H
11
1
(1
3)
- +
-
- -
- -
- -
-
De
er
DE
16
0
O5
:H-
1 (
3)
- -
- -
- -
- +
-
-
D
E 1
62
O
5/
71
:H-
1 (
1)
- -
- -
- -
- +
-
-
D
E 1
63
O
nt:
H2
5
1 (
1)
- -
- -
- -
- +
-
-
Su
rfa
ce
wa
ters
W 8
O
nt:
HR
N
A
NA
-
- +
-
+
- -
- -
W
72
O
60
:H5
3
NA
N
A
- -
- -
+
- -
- -
W
19
O
nt:
HR
N
A
NA
+
-
+
- -
- -
- -
W
94
O
16
7:H
45
N
A
NA
+
-
- -
- -
- -
-
W
21
0
O1
57
:H-
NA
N
A
- -
- -
- +
-
- -

121
All faecal samples from the 8 septic tanks showed the presence of 2 or more of virulence genes with the eaeA
gene being the most common gene found in 7 septic tanks (Table 5.5). Despite BPTs from animals and water
samples, none of the samples from septic tanks contained VT2e and CNF2 genes (Table 5.5).
Table 5.5 Prevalence of virulence genes among faecal samples collected from 8 septic tanks
Virulence genes Septic tank
code eaeA papC hlyA CNF1 O157 LPS VT1 VT2
SEP 1 - - - + + - +
SEP 2 + + + - + - -
SEP 3 + - - + + + +
SEP 4 + + + + + + +
SEP 5 + - - - + - -
SEP 6 + + - + - - -
SEP 7 + + - + - - -
SEP 8 + + - + - - -
5.3.3 Source tracking of virulence genes
Biochemical phenotypes of all 5 strains from water samples carrying virulence genes were compared with
those found in host groups. Of these, 3 BPTs (i.e. 3 strains) were shown to be identical to those of dogs (2
strains) and chickens (1 strain) with two BPTs also carrying similar virulence genes (i.e. DO 90 versus W19
and CH 241 versus W 94 in Table 5.6). The other two BPTs contained virulence genes coding for O157 side-
chain LPS and CNF2 were not identical to biochemical fingerprint data. However, none of the strains from
water and animals had similar serotypes (Table 5.6).
Table 5.6 Comparison of Escherichia coli strains positive for virulence genes in water samples with their
corresponding biochemical phenotypes (BPTs) in animal groups. Ont: O non-typeable. HR: H rough.
Host groups Water samples
Designation of
strains
Virulence genes Serotypes
Corresponding
strains
Virulence genes Serotypes
DO 105 CNF2 O126:H25 W 8 hlyA, CNF2 Ont:HR
DO 90 eaeA, hlyA O21/83:H31 W 19 eaeA, hlyA Ont:HR
CH 241 eaeA O120:H26 W 94 eaeA O167:H45
5.4 Discussion

122
Faecal Indicator bacteria have long been used to determine the presence of potential pathogenic organisms in
surface and ground waters (121, 125, 129, 249, 259). Faecal indicators such as E. coli and enterococci may be
present where faecal contamination originates through defecation of warm-blooded animals (22, 222). Whilst
most E. coli strains are regarded as commensal, certain strains may carry virulence genes that provide them
the ability to cause infection in humans and animals. Pathogenic E. coli strains found in both humans and
animals have been constantly shown to harbour one or more of these virulence genes (30, 69, 151). If these
strains find their way into surface waters (e.g. through defecation of humans or animals) they could cause a
serious health risk problem to the public. For instance, the majority of E. coli associated with outbreaks of
diarrhoea appear to originate from surface and ground waters (112, 295).
On the other hand, it has also been reported that detection of these bacteria in water samples does not always
indicate the presence of pathogenic microorganisms in surface waters (101, 115, 271). For instance, studies
have shown that human pathogenic viruses (189) have been isolated from sites with low levels of faecal
indicator bacteria. None of these studies however, have investigated the pathogenic potential of the indictor
bacteria themselves.
In this study, a collection of E. coli strains isolated from animals and water samples were tested for the
presence of virulence genes. These strains were originally served in this thesis as an indicator to trace the
sources of faecal contamination and many of them belonged to unique biochemical phenotypes (BPTs) that
were specific to individual host group. Furthermore, some of these strains were found in multiple numbers in
each BPT. It was therefore postulated that the identification of virulence genes among these strains would
provide a basis for the calculation the prevalence of pathogenic strains in different animal groups. This
calculation has not been undertaken for this study, as a number of representative strains were tested.
Nonetheless, this approach proved useful in obtaining additional information from the already developed
database by simultaneous identification of clinically important strains in host groups and receiving waters.
This information can also provided a basis for developing a sub-database of pathogenic E. coli and thus
reducing the number of E.coli strains, which are common to many host groups and are not clinically
significant (109).
The sub-database developed as a result of this study consisted of 28 strains that carried one or more of the
virulence genes tested. Of these, 18 strains had unique (UQ) biochemical fingerprint and the remaining 10
strains were shared among up to 4 animal groups. The presence of virulence genes among the latter group
was interesting and probably indicates that these strains have a better ability to colonise more than one
animal group.
Samples collected from septic tanks were tested for the presence of virulence genes by isolating the whole
genomic DNA. Under these conditions it is not possible to identify how many of these virulence genes are
123
found in individual strains. However, the fact that 7 out of 8 samples contained one or more of the virulence
gens indicates that E.coli strains carrying these genes are present and capable of surviving in the septic tanks.
As mentioned before, due to testing the total genomic DNA from these samples, it was not possible to
investigate the prevalence of strains carrying virulence genes in the creek samples. Interestingly, the 8 septic
systems from which samples were collected were classified as defective when assessed by standard
inspection guideline adopted by local government (see chapter 2). Given the prevalence of these virulent
strains in the defective septic systems and that E. coli BPTs specific to some of these tanks were found in
downstream water samples (see chapter 2 table 2.5) it must be considered that these systems are
contributing pathogenic strains into the adjacent creek.
Of interest was the positive PCR-result for the eaeA gene, or a gene with some homology to eaeA among
animal groups. This gene has been associated with enteropathogenic (EPEC) and enterohaemorrhagic E. coli
(EPEC) and is responsible for the attaching and effacing lesions in human enterocytes (148). However, in the
absence of any in vivo study it is not possible to determine whether strains positive for this gene were in fact
capable of expressing them. Of the 7 septic tanks showing the presence of virulence genes, 6 also contained
CNF1 genes. While CNF1 has shown to be associated with strains causing diarrhoea in cattle (220), these
genes are frequently found among strains causing urinary tract infection and therefore it is much easier to
interpret their presence in septic tanks, which receives wastewater from humans, than in animal groups.
Of interest also was the presence of genes coding for O157 side-chain LPS, VTI and VT2 in some septic tanks.
EHEC can cause acute bloody diarrhoea, hemorrhagic colitis (HC) and the life-threatening haemolytic uraemic
syndrome (HUS) in humans (14, 114, 268). Among the animal groups, these genes were only found in cattle. A
number of septic systems also contained papC and hlyA. These genes are normally found among E. coli strains
causing urinary tract infections (89). Indeed, data obtained in this study showed that papC gene were more
distributed among strains from septic tanks (representing humans) and dogs than other animals. There is a
possibility that dogs receive these strains from human, as they are companion animal. None of the strains
tested showed the presence of ST1, ST2 and LT1 genes. E. coli strains carrying these genes are commonly
found among cases of human and animal diarrhoea worldwide (124).
The number of strains carrying virulence genes in water sample was quite low. Only five out of 80 strains
tested from water samples carried one or more virulence genes. This could be due to the dilution of these
strains in large volume of water in the creek making it easy to escape detection. Of these 5 strains, 3 had
biochemical phenotypes identical to those found in the sub-database. Interestingly these 3 strains belonged to
UQ BPTs and were specific to dogs (2 BPTs) and chickens (1 BPT) with 2 strains also having similar virulence
genes (1 identical to dog strain and 1 identical to chicken strain). Despite that, these strains had different
serotypes. The presence of different BPTs within each serotype or vice versa has been reported before (162).
124
It has to be noted that each strain tested in this study belonged to a different BPT and it was expected that
they also differ in their serotype as well. Nonetheless, these data suggest that a combination of serotyping,
biochemical fingerprinting and virulence properties can compliment each other in ecological studies. For
instance, when biochemical fingerprints alone cannot provide the sources of these strains, serotyping in
combination with the virulence genes present in strains can be used to trace the sources of pathogenic strains
in surface waters. Such results however, should be interpreted with care as some genes are carried on
bacterial plasmids and can be lost or gained when introduced into the environment. In addition, the
prevalence of such strains can be quite low in host groups. Therefore, developing a moderate (i.e. 500
isolates) sub-database of BPTs/virulence genes may take quite a sampling effort and testing a large number of
isolates from animals.
In conclusion, this study showed that whilst the biochemical fingerprinting method using E. coli can be
successfully used to trace the source of human and animal faecal contamination in surface water, additional
information such as the presence of virulence genes can be obtained by testing representative isolates from
each BPT for the presence of different virulence genes associated with pathogenic E. coli. This information can
also be used to establish a sub-database to simultaneously identify the source of contamination and the
presence of pathogenic strains of E. coli in each source. From the public health point of view this information
will be of great importance in evaluating the risk associated with public use of the catchment.

125
CHAPTER 6
General discussion and conclusion
The objective of microbial source tracking (MST) methods is to identify the various sources of faecal
contamination in surface waters. To achieve such, many database- dependent methods have been developed
in order to discriminate amongst multiple host groups. Indeed the majority of these methods are capable of
quantifying the percent contribution of different sources. On the other hand, database-independent methods
have also been developed and used in ecological studies. Database-independent methods are considerably
cost effective because development of a reference database is not required. The drawback of such methods is
that they cannot be used to discriminate among multiple host groups and are not quantitative.
Irrespective of whether a method is database dependent or independent, all methods may on some occasions
yield false positives or negatives in ecological studies. Some of the techniques are time consuming, others
labour intensive, and yet others may require use of expensive and sophisticated laboratory equipments. To
date, there has been no consensus on a particular MST method as a “gold standard”. An ideal MST method
should be rapid, reliable, inexpensive, easily performed, should have a high discriminatory power and require
modest resources and minimal technical expertise. The stability of the measuring character of
microorganisms is also a major issue to be considered by a MST method as this can directly affect the
reproducibility of the data obtained from different laboratories.
One of the elements of this thesis is that the method employed for the evaluation and development of a
reference database, known as the biochemical fingerprinting technique, meets many (if not all) characteristics
of an ideal MST method. Biochemical fingerprinting method proved to be simple to perform and is rapid, so
having the ability to test a large number of bacterial isolates within a short time. The latter characteristic is of
particular importance in studying the quality of surface waters in any given catchment, where various non-
point sources contribute to the overall load of the bacteria and the diversity of faecal indicators could be high.
This method is also more cost effective when compared with some of the available MST methods, requires
only a microplate reader for readings the plates. Furthermore, the data analysis is completely supported with
the PhPlate software and is user friendly. The software also offers a population similarity analysis between
two or more compared populations of indicator bacteria and therefore may provide additional information
regarding possible source. Finally, the method also remained highly discriminatory, and the stability of the
biochemical fingerprints was high when a collection of the indicator bacteria were re-tested after a period of
storage.

126
Another important feature of this study was the concurrent use of two well-accepted faecal indicator bacteria
for the development of databases and in ecological studies. This was undertaken on the assumption that they
may compliment each other if one indicator fails to trace the source and therefore, provide a more realistic
picture of the possible sources of contamination. It was also assumed that any agreement (if found) between
these two indicator bacteria to trace the source of contamination would increase the confidence level of the
method.
The third important feature of this study was the development of a large database for both faecal indicator
bacteria. Earlier in this thesis, it was recognised that an ideal database should be highly representative of the
population of the isolates that are distributed spatially. Furthermore, such a database should ideally consist of
well-separated groups as determined by the specificity of their fingerprints. Identical fingerprints of faecal
indicator bacteria can be obtained from two or more individual host. These identical isolates most likely
represent a clonal group of strains that have spread among certain individuals or species. This has to be
carefully investigated and identical isolates within a species should be excluded as they can compromise the
efficacy of a database. In constructing the fingerprint database, duplicate fingerprints obtained from an animal
of the same species were eliminated. This approach allowed selection of a collection of unique fingerprints
from both indicator bacteria within a host group and comparison among host groups yielded specific
fingerprints for each host groups.
One of the major problems with many existing database-dependent methods is the lack of a stringent
sampling protocol from host groups. Collection of faecal samples is normally done from a few individual
animals or from composite samples from few farms, without a pre-assessment of the diversity of the indicator
bacteria in the target groups. In this study, special attention was given to the diversity of samples from animal
groups as well as their representativeness in the studied catchment and the region. For instance while certain
animal groups such as cattle, horses, chickens, ducks and dogs were dominant in the catchment, others were
found at low frequency. To capture a better phenotypic diversity of faecal indicator bacteria within each
animal group, a preliminary diversity analysis was performed on both indicators within the animals of
randomly selected farms and based on the obtained data a comprehensive sampling program was
implemented using as many farms as possible (up to 20 farms) within and outside the studied catchment .
This approach allowed the collection of diverse and highly representative fingerprints of both faecal indicator
bacteria for developing the database. Successful application of this database in a cross-catchment study
proved that this was the case.
Another special feature of this study was the application of a population similarity assay together with the
direct comparison of fingerprints of two indicator bacteria. This was in fact an additional capability of the
PhPlate software that allowed comparing the overall similarities between two or more bacterial populations.

127
The application of this analysis to trace the source of contamination in both catchment-based studies in this
thesis showed a high degree of correlation with the data obtained from direct comparison of fingerprints. This
approach, lthough proving to be simple, and rapid and provided reliable results, should be interpreted with
care as in some cases, it compares the overall similarity of bacterial populations between samples and
therefore will include those bacteria that are partly or even highly shared between different animals groups
and therefore does not specifically identify the contaminating source(s).
The use of two faecal indicator bacteria in this study however, showed that this problem could be partially
overcome as the results obtained from both indicator groups complemented each other. Nonetheless,
interpretation of results obtained from the population similarity analysis should be done in conjunction with
the local knowledge of the native/wild animal sources reside in the catchment.
Analysis of the biochemical fingerprints obtained from different animal groups also indicated that certain
fingerprints, though common among two or more animals were not found in samples collected from humans.
These particular fingerprints may play a role in differentiating between animal and human contamination in
catchment studies. Application of these fingerprints in this thesis showed that this was the case. However,
more stringent sampling from humans faeces (probably via septic tank) and analysis of indictor bacteria
would be required before the application of this concept is fully justified. Water quality managers are
primarily interested in discriminating between animal and human sources of faecal contamination. For
microbial source tracking, it seems reasonable to expect that a useful technique would identify the sources of
greater than 50% of isolates correctly when there are several possible source categories in a catchment. In
this study, the developed database was able to identify more than 65% of both faecal indicator bacteria in the
studied creek. The remaining unidentified sources could have originated from other sources such as birds and
other wild animals or because some undetected fingerprints were shared between human and animals and
therefore it was not possible to discriminate between the sources.
In this study, a large number of representative faecal indicator bacteria from water samples were tested and
therefore it was possible to determine the percentage contribution of different host groups. This is again
another important concept in MST studies, as the diversity of indicator bacteria in surface waters is quite high.
Reviewing the literature earlier in this thesis indicated that MST as used in many studies is a determining
factor for testing the number of isolates from surface waters due to the high costs and resources involved. The
net effect of testing small numbers of isolates in such studies is the lack of accuracy and reliability of the
results in determining the percentage contribution of non-point sources in a given study. This however, was
not the case in this study as the cost and time needed to test high number of isolates with the PhPlate system
was considerably lower than many corresponding methods used for MST.

128
Another important issue in MST is to establish a level of awareness of the level of contribution of different
point and non-point sources of contamination in a catchment during both the dry and the rainy seasons.
Application of the established database in this study during both the dry and wet season showed that the
predictive capacity of the database for both faecal indicator bacteria was higher in the wet season than the dry
season. This may be due to the fact that during the wet season, surface water receives a large number of
bacteria through surface run-off and therefore the chance of finding similar fingerprints of the indicator
bacteria is higher than during the dry season. Interestingly, septic systems also contributed more bacteria
during the wet season than that of the dry season suggesting that despite the failure of these systems, these
bacteria are more easily washed off into the creeks via surface run-off during rainy season.
Geographic variability of faecal indicator bacteria is a determining factor which limits the application of many
established database-dependent methods. Several factors including hydrology and animal migration patterns
may also contribute to the overall bacterial load of a watershed. Temporal variability such as seasonal dietary
shifts or changes in other selective pressures could also lead to a less efficacy of the established databases. An
insufficient sampling program could explain much of the observed temporal and geographic variations of
microbial subspecies and therefore it has been concluded that a database developed for one catchment could
not be used in others. This concept was challenged in this study as it was assumed that such limitations could
be overcome by a stringent sampling as well typing a large isolates and finally by developing a more
representative database. The successful application of the developed database in this thesis in a cross-
catchment study validated this assumption. It also indicated that there was a high stability in the fingerprints
of indicator bacteria within two catchments in the same geographical region. Since no database is probably
ever complete, addition of the new fingerprints from the regional and expanded catchments could add to the
efficacy of the existing database originating in this study.
Another interesting component of this thesis was the establishment of the sub-database (although very small)
of a combination of virulence genes and biochemical fingerprints. Faecal indicator bacteria such as E.coli have
not been considered themselves a potential source of disease in catchment studies. While many virulence
characteristics of bacteria are not host specific, some can be found more commonly associated with a specific
infection and/or in a specific host. This concept was the basis for evaluating the possible use of these factors
in combination with biochemical fingerprinting to obtain a better understanding of the possible source(s) of
contamination. The results, although by no means conclusive, indicated that this might be the case in at least
in some instances. For instance, association of genes in E.coli causing urinary tract infections in humans can
be used in combination a biochemical fingerprint to more conclusively identify septic tanks as the source of
contamination in water. Again, as mentioned before such assessments should always be made in conjunction
with local knowledge of the septic tanks distribution or the prevalence and abundance of local and/or native
animals in a catchment.

129
In conclusion, the selection of a microbial source tracking method for identification of the point or non-point
sources of faecal contamination in a watershed is highly critical and determines the outcome of the study.
Factors such as the discriminatory power and reproducibility of the selected method as well as the stability of
the typing characters of the selected method should be carefully assessed. Additionally, factors such as the
cost of a stringent sampling and testing, ease of performance, the ability of the method to generate data with a
computer- supported analysis and storage for future referencing and comparison are all have to be evaluated.
This of course, requires a good knowledge of the strengths and weaknesses of the existing methods as well as
the types and distribution of possible sources of pollution in the catchment. Only under these conditions, a
highly representative local database can be developed and be used efficiently in regional studies of the faecal
source tracking. In this thesis, attempts were made to use such a method for development of a highly
representative database. The subsequent application of this database to trace the source (i.e. via septic
system) and other points or non-point sources of faecal contamination in two local and regional catchments
proved that the success and usefulness of such method and the developed database for microbial source
tracking. The future direction of this work can be the development of a sub-database of the virulence
characteristics of indicator bacteria to be used and to be further developed in conjunction with the exiting
database in identifying the sources of faecal contamination in regional and greater regional watershed studies.

130
The referencing format of this thesis is in accordance with that of the journal Applied and Environmental
Microbiology, published by the American Society for Microbiology.
REFERENCES
1. Abbot, S., B. Caughley, and G. Scott. 1993. Evaluation of Enterolert for the enumeration of
enterococci in the marine environment. N. Z. J. Mar. Freshwater Res. 32: 505-513.
2. Abdullah, A. R. 1995. Environmental pollution in Malaysia-trends and prospects. Trends in
Analytical Chemistry. 14: 191-198.
3. Ahmed, W., R. Neller, and M. Katouli. 2005a. Evidence of septic systems failure determined
by a bacterial biochemical fingerprinting method. J. Appl. Microbiol. 98: 910-920.
4. Ahmed, W., R. Neller, and M. Katouli. 2005b. Host species-specific metabolic fingerprint
database for enterococci and Escherichia coli and its application to identify sources of fecal
contamination in surface waters. Appl. Environ. Microbiol. 71: 4461-4468.
5. Alderisio, K. A., D. A. Wait, and M. D. Sobsey. 1996. Detection and characterization of male
specific RNA coliphages in a New York City reservoir, p. 133-142. In J. J. McDonnell, D.L.
Leopold, J. B. Stribling and L. R. Neville (ed.), Watershed Restoration Management, New York
City Water Supply Studies. American Water Resources Association, Herndon, VA.
6. Alhajjar, B. J., J. M. Harkin, and G. Chesters. 1990. Indicators of chemical pollution from
septic systems. Groundwater. 28:559-568.
7. Al-Khudhairy, D. H. A., A. Bettendroffer, A. C. Cardoso, A. Pereira, and G. Premazzi. 2001.
Framework for surface water quality management on a river basin scale: case study of Lake
Iseo, Northern Italy. Lakes Reservoirs: Res. Manage. 6: 103-115.
8. Alsumali, A. A., and H. A. Yaseen. 1991. Bacteriological suitability of water from Basra wells
for drinking. Wat. Sci. Technol. 24: 89-93.
9. American Public Health Association. 1995. Standard method for the examination of water
and wastewater. 19th ed. American Public Health Association, Inc., Washington, D. C.
10. Amor, K., D. E. Heinrichs, E. Frirdich, K. Ziebell, R. P. Johnson, and C. Whitfield. 2000.
Distribution of core oligosaccharide types in lipopolysaccharides from Escherichia coli. Infect.
Immun. 68:1116-1124.
11. Anonymous. 1997. Water quality- detection and enumeration of coliform organisms,
thermotolerant coliform Organism and presumptive Escherichia coli. Part 1: membrane
filtration method. International Organization for Standardization. I.S.O. document 9308/1. ISO,
Geneva, Switzerland.
12. ANZECC and ARMCANZ. 2000. Australian and New Zealand guidelines for fresh and marine
water quality. National Water Quality Management Strategy Paper No. 4, Australian and New

131
Zealand Environment and Conservation Council and Agriculture and Resource Management
Council of Australia and New Zealand, Canberra, Australia.
13. Arbeit, R. D. 1995. Laboratory procedures for the epidemiologic analysis of micro-organisms,
p. 190-208. In. P. R. Murray, E. J. Baron, M. A. Pfaller, F. C. Tenover, and R. H. Yolken (ed.),
Manual of clinical microbiology, 6th ed. ASM Press, Washington, D.C.
14. Armstrong, G. D., P. C. Rowe, P. Goodyer, E. Orrbine, T. P. Klassen, G. wells, A. MacKenzie,
H. Lior, C. Blanchard, F. Auclair, B. Thomson, D. J. Rafter, and P. N. McLaine. 1995. A pahse I
study of chemically synthesized verotoxin (Shiga-like toxin) Pk-trisaccharide receptors
attached to chromosorb for preventing hemolytic-uremic syndrome. J. Infect. Dis. 171: 1042-
1045.
15. Arnade, L. J. 1999. Seasonal correlation of well contamination and septic tank distance.
Groundwater. 37: 920-923.
16. Aslam, M., F. Nattress, G. Greer, C. Yost, C. Gill, and L. McMullen. 2003. Origin of
contamination and genetic diversity of Escherichia coli in beef cattle. Appl. Environ. Microbiol.
69: 2794-2799.
17. Atlas, R. 1984. Use of microbial diversity measurements to assess environmental stress, p. 540-
545. In M.J. Klug and C.A. Reddy (ed.), Current perspective in microbial ecology. American
Society for Microbiology, Washington, D.C.
18. Australian Standard 1547. 1994. Disposal of sullage and septic tank effluent from domestic
premises. Published by Standards Australia (Standards Association of Australia) 1 The
Crescent, Homebush, NSW 2140.
19. Barber, L. B. II, E. M. Thurman, M. P. Schroeder, and D. R. LeBlanc. 1988. Long-term fate of
organic micro pollutants in sewage contaminated groundwater. Environ. Sci. Technol. 12: 369-
376.
20. Barbier, N. P., E. Saulnier, S. Chachaty, S. Dumontier, and A. Andermont. 1996. Random
amplified polymorphic DNA typing versus pulsed-field gel electrophoresis for epidemiological
typing of vancomycin-resistant enterococci. J. Clin. Microbiol. 34: 106-109.
21. Barnes, D., and D. M. Gordon. 2004. Coliform dynamics and the implications for source
tracking. Environ. Microbiol. 6: 501-509.
22. Baudisöva, D. 1997 Evaluation of Escherichia coli as the main indicator of faecal pollution. Wat.
Sci. Technol. 35: 333-356.
23. Baxter-Potter, W. R., and M. W. Gilliland. 1988. Bacterial pollution in runoff from agricultural
lands. J. Environ. Qual. 17: 27-34.
24. Beard, J., T. Sladden, and G. Sullivan. 1994. Effluent disposal and waterway contamination.
Environ. Health Rev. 23: 15-19.
25. Bechdol, M. L., A. J. Gold, and J. H. Gorres. 1994. Modelling viral contamination from on-site
wastewater disposal in coastal watersheds. p. 146-153. In: Proceedings of the seventh

132
International Symposium on Individual and small Community Sewage Systems, American
Society of Agricultural Engineers, St Joseph, MI.
26. Bernhard, A. E., and K. G. Field. 2000a. A PCR assay to discriminate human and animal feces
on the basis of the host difference in Bacteroides-Prevotella genes encoding 16S rRNA. Appl.
Environ. Microbiol. 66: 4571-4574.
27. Bernhard, A. E., and K. G. Field. 2000b. Identification of non-point sources of fecal pollution in
coastal waters by using host-specific 16S ribosomal DNA genetic markers from fecal anaerobes.
Appl. Environ. Microbiol. 66:1587-1594.
28. Bettleheim, K. A., N. Ismail, R. Shinebaum, R. A. Shooter, E. Moorehouse, and S. O’ Farrel.
1976. The distribution of serotypes of Escherichia coli in cow pats and other animal materials
compared with serotypes of E. coli isolated from human sources. J. Hyg. 76: 403-406.
29. Bettelheim, K. A., and C. J. Thompson. 1987. New method of serotyping Escherichia coli.
Implementation and verification. J. Clin. Microbiol. 25: 781-786.
30. Beutin, L. 1999. Escherichia coli as a pathogen in dogs and cats. Ver. Res. 30: 285-298.
31. Bitton, G. 2005a. Wastewater Microbiology. p. 746, 3rd edition, Wiley-Liss, Hoboken, N. J.
32. Bitton, G. 2005b. Microbial indicators of fecal contamination: Application to microbial source
tracking. Report submitted to the Florida Stormwater Association.
33. Blair J. E, and R. E. O. Williams. 1961. Phage typing of staphylococci. Bull. W. H. O. 24:771-84.
34. Blanch, A. R., M. Cerda Cueller, and C. Hispano. 2001. Diversity of Vibrio spp. populations in
several exhibition aquaria with a shared water supply. Lett. Appl. Microbiol. 33: 137-143.
35. Blanch, A. R., J. L. Caplin, A. Iversen, I. Kühn, A. Manero, H. D. Taylor, and X. Vilanova.
2003. Comparison of enterococcal populations related to urban and hospital wastewater in
various climatic and geographic European regions. J. Appl. Microbiol. 94: 994-1002.
36. Bonjoch, X., E. Balleste, and A. R. Blanch. 2004. Multiplex PCR with 16s rRNA gene-targeted
primers of Bifidobacterium spp. to identify sources of fecal pollution. Appl. Environ. Microbiol.
70: 3171-3175.
37. Boyd, E. F., and D. L. Hartl. 1998. Chromosomal Regions Specific to Pathogenic Isolates of
Escherichia coli have a phylogenetically clustered distribution. J. Bacteriol. 180: 1159-1165.
38. Brion, G. M., and S. Lingireddy. 1999. A neural network approach to identifying non-point
sources of microbial contamination. Water Res. 33: 3099-3106.
39. Burkhardt, M. R., P. P. Soliven, S. L. Werner, and D. G. Vaught. 1999. Determination of sub-
microgram per liter concentrations of caffeine in surface and groundwater samples by
extraction and liquid chromatography. J. AOAC. Int. 82: 161-166.
40. Cabelli, V. J., A. P. Dufour, L. J. McCabe, and M. A. Levin. 1982. Swimming-associated
gastroenteritis and water quality. Am. J. Epidemiol. 115: 606-616.

133
41. Cabelli, V. J., A. P. Dufour, L. J. McCabe, and M. A. Levin. 1993. A marine recreational water
quality criterion consistent with indicator concepts and risk analysis. J. Water pollut. Cont. Fed.
55: 1306-1314.
42. Candrian, U., B. Furrer, C. Hofflein, C. R. Meyer, M. Jermiini and J. Luthy. 1991. Detection of
Escherichia coli and identification of enterotoxigenic strains by primer-directed enzymatic
amplification of specific DNA sequences. Int. J. Food Microbiol. 12: 339-351.
43. Carson, S. A., B. L. Shear, M. R. Ellersieck, and A. M. H. A. Afsaw. 2001. Identification of faecal
Escherichia coli from humans and animals by Ribotyping. Appl. Environ. Microbiol. 67: 1503-
1507.
44. Carson, S. A., B. L. Shear, M. R. Ellersieck, and J. D. Schnell. 2003. Comparison of ribotyping
and repetitive extragenic palindromic-PCR for identification of fecal Escherichia coli from
humans and animals. Appl. Environ. Microbiol. 69:1836-1839.
45. Carrillo, M., E. Estrada, and T. C. Hazen. 1985. Survival and enumeration of the fecal
indicators Bifidobacterium adolescentis and Escherichia coli in a tropical rain forest watershed.
Appl. Environ. Microbiol. 50: 468-476.
46. Carvalho de Moura, A. C. K. Irino, and M. C. Vidotto. 2001. Genetic variability of avian
Escherichia coli strains evaluated by enterobacterial repetitive intragenic consensus and
repetitive extragenic palindromic polymerase chain reaction. Avian Dis. 45: 173-181.
47. Cato, E. P., W. L. George, S. M. Finegold. 1986. Clostridium, p.1141-1200. In: P. H. A. Sneath, N.
S. Mair, M. E. Sharpe, and J. G. Holt (ed.), Bergey’s Manual of Systematic Bacteriology, vol.2. The
Williams and Wilkins Co., Baltimore, Md.
48. Caugant, D. A., B. R. Levin, and R. K. Selander. 1981. Genetic diversity and temporal variation
in the E. coli population of a human host. Genetics: 98: 467-490.
49. Centre for Disease Control and Prevention. 1996. Surveillance for waterborne diseases
outbreaks- United States, 1993-1994. MMWR 45:1-33.
50. Chandler, M. E., and K. A. Bettelheim. 1974. A rapid method of identifying E. coli ‘H’
antigens. Zentralblatt fur bacteriology Mikrobiologie und Hygiene, I. Abteilung Originale A
129: 74-79.
51. Chart, H. 1998. Toxigenic Escherichia coli. J. Appl. Microbiol. Sym. Suppl. 84: 77S-86S.
52. Childs, K.E., S. B. Upchurch, and B. Ellis. 1974. Sampling of variable, waste migration
patterns in ground water. Groundwater. 12: 369-376.
53. Chung, H., L. A. Jaykus, G. Lovelace, M. D. Sobsey. 1998. Bacteriophages and bacteria as
indicators of enteric viruses in oysters and their harvest waters. Wat. Sci. Technol. 38: 37-
44.
54. Clesceri, L. S., A. E. Greenberg, and A. D. Eaton. 1998. Standard methods for the
examination of water and wastewater. 20th ed. Am. Public Health Assoc., Am. Water Works
Assoc., and Water Environ. Fed., Washington, DC.
134
55. Cole, D., S. C. Long, and M. D. Sobsey. 2003. Evaluation of F+ and DNA coliphages as source-
specific indicators of fecal contamination in surface waters. Appl. Environ. Microbiol. 69: 6507-
6514.
56. Crane, S. R., J. A. Moore, M. E. Grismer and J. R. Miner. 1983. Bacterial pollution from
agricultural sources: A Review. Trans. ASAE 26: 858-872.
57. Craun, G.G. 1991. Causes of waterborne outbreaks in the United States. Wat. Sci. and Technol.
24: 17-29.
58. Craun, G.F., P. S. Berger, and R. L. Calderon. 1997. Coliform bacteria and waterborne disease
outbreaks, J. Am. Water Works Assoc. 89: 96-106.
59. Crichton, P. B., and D. C. Old. 1979. Biotyping of Escherichia coli. J. Med. Microbiol. 12: 473-
486.
60. Crites, R., and G. Tchobanoglous. 1998. Small and decentralized wastewater management
systems. McGraw-Hill Series in Water Resources and Environmental Engineering. New York.
61. Daby, D., J. Turner, and C. Jago. 2002. Microbial and nutrient pollution of coastal bathing
water in Mauritius. Environ. Internat. 27: 555-566.
62. Dalla-Costa, L. M., K. Irino, J. Rodriguez, I. N. Rivera, and L. R. Trabulsi. 1998.
Characterisation of diarrhoeagenic Escherichia coli clones by ribotyping and ERIC-PCR. J. Med.
Microbiol. 47: 227-234.
63. Dart, S. E., and B. A. Wiggins. 2003. Use of antibiotic resistance analysis to determine
reductions in human fecal pollution in Holmans Creek, Abstracts of 103rd General Meeting.
American Society for Microbiology, Washington DC.
64. Davies, C. M., J. A. Long, M. Donald, and N. J. Ashbolt. 1995. Survival of fecal micro-organisms
in aquatic sediments of Sydney, Australia. Appl. Environ. Microbiol. 61: 1888-1896.
65. DeBorde, D. C., W. W. Woessner, B. Lauerman, and P. N. Ball. 1998. Virus occurrence and
transport in a school septic system and unconfined aquifer. Groundwater. 36: 825-834.
66. Desmarais, T. R., H. M. Solo-Gabriele, and C. J. Palmer. 2002. Influence of soil on fecal
indicator organisms in a tidally influenced subtropical environment. Appl. Environ. Microbiol.
68:1165-1172.
67. Dombek, P. E, L. K. Johnson, M. B. Brown, and M. J. Sadowsky. 2000. Use of repetitive DNA
sequences and the PCR to differentiate Escherichia coli isolates from human and animal
sources. Appl. Environ. Microbiol. 66: 2572-2577.
68. Donderski, W., and I. Wilk. 2002. Bacteriological studies of water and bottom sediments of
the Vistula River between Wyszogród and Toruń. Pol. J. Environ. Stud. 1: 33-40.
69. Donnenbergh, M. S. 2002. Escherichia coli: Virulence mechanism of a versatile pathogen.
Amsterdam: Academic Press, 2002.
70. Doran, J. W., and D. M. Linn. 1979. Bacteriological quality of runoff water from pastureland.
Appl. Environ. Microbiol. 3: 985-991.

135
71. Eckel, W. P., B. Ross, and R. K. Isensee. 1993. Pentobarbital found in groundwater.
Groundwater. 31: 801-804.
72. Echeverria, P., P. J. Seriwatana, U. Patmaroj, S. L. Mosley, A. McFarland, O. Chityothin, and
W. Chaicumpa. 1984. Prevalence of heat stable II enterotoxigenic Escherichia coli in pigs,
water and people at farms in Thailand determined by DNA hybridization. J. Clin. Microbiol. 19:
489-491.
73. Edberg, S. C., E. W. Rice, R. J. Karlin, and M. J. Allen. 2000. Escherichia coli: the best biological
drinking water indicator for public health protection. J. Appl. Microbiol. Symp. Suppl. 88:106S-
116S.
74. Edwards, D. R., M. S. Coyne, T. C. Daniel, P. F. Vendrell, J. F. Murdoch, and P. A. Moore, Jr.
1997. Indicator bacteria concentrations of two northwest Arkansas streams in relation to flow
and season. Am. Soc. Agri. Eng. 40: 103-109.
75. Evison, L. M., and A. James. 1974. Bifidobacterium as an indicator of faecal pollution in water,
p. 107-116. In Proceedings of the 7th International Conference on Water Pollution Research.
Pergamon Press Ltd., Oxford, England.
76. Falagas, M., and S. Gorbach. 1995. Practice guidelines: Urinary tract infections. Infect. Dis.
Clin. Prac. 4: 241-257.
77. Farnleitner, A. H., N. Kreuzinger, G. G. Kavka, S. Brillenberger, J. Rath, and R. L. Mach.
2000. Simultaneous detection and differentiation of Escherichia coli populations from
environmental freshwaters by means of sequence variations in a fragment of the beta-D-
glucurodinase gene. Appl. Environ. Microbiol. 66: 1340-1346.
78. Feldman, K. A., J. C. Mohle-Boetani, J. Ward, K. furst, S. L. Abbott, D. V. Ferrero, A. Olsen,
and S. B. Werner. 2002. A cluster of Escherichia coli O157: non-motile infections associated
with recreational exposure to lake water. Public Health Rep. 117: 380-385.
79. Fernández-Molina, M. C., A. Álvarez, and M. Espigares. 2004. Presence of hepatitis A virus in
water and its relationship with indicators of fecal contamination. Water, Air Soil Pollut. 159:
197-208.
80. Farber, J.M. 1996. An introduction to the hows and whys of molecular typing. J. Food. Prot. 59:
1091-1101.
81. Faruque, A. S., T. Teha, and G. J. Fuchs. 1998. Shigellosis in Children: A clinico-
epidemiological comparison between Shigella dysenteries type I and Shigella flexineri. Ann.
Trop. Pediat. 18: 197-201.
82. Fay, S. R., R. C. Spong, S. C Alexander, and E. C Alexandar Jr. 1995. Optical brighteners:
sorption behavior, detection, septic system tracer applications. Published in: Proceedings of the
International Association of Hydro-geologists XXVI International Congress, Edmonton, Alberta,
Canada.

136
83. Feresu, S. B., and J. Van Sickle. 1990. Coliforms as a measure of sewage contamination of the
river Zambezi. J. Appl. Bacteriol. 68: 397-403.
84. Feacham, R. G., D. G. Bradley, H. Gavelick, D. D. Mara.1983. Sanitation and disease: Health
aspects of excreta and wastewater management. J. Wiley & Sons. Chichester, England.
85. Field, K. G., A. E. Bernhard, and T. J. Brode. 2003. Molecular approaches to microbial
monitoring: fecal source detection. Environ. Monit. Assess. 81: 313-326.
86. Fiorentini, C., E. Barbieri, L. Falzano, P. Matarrese, W. Baffone, A. Pianetti, M. Katouli, I.
Kühn, R. Möllby, F. Bruscolini, A, Casiere, and G. Donelli. 1998. Occurrence, diversity and
pathogenicity of mesophilic Aeromonas in estuarine waters of the Italian coast of Adriatic Sea.
J. Appl. Microbiol. 85: 501-511.
87. Fleisher, J. M., D. Kay, M. D. Wyer, and A. F. Godfree. 1998. Estimates of the severity of
illnesses associated with bathing in marine recreational waters contaminated with domestic
sewage. Int. J. Epidemiol. 27: 722-729.
88. Fong, T. T., D. W. Griffin, and E. K. Lipp. 2005. Molecular assays for targeting human and
bovine enteric viruses in coastal waters and their application for library-independent source
tracking. Appl. Environ. Microbiol. 71: 2070-2078.
89. Foxman, B., L. Zhang, K. Palin, P. Tallman, S. Marrs. 1995. Bacterial virulence characteristics
of Escherichia coli isolates from first-time urinary tract infection. J. Infect. Dis. 171: 1514.1521.
90. Freter, R. 1984. Factors affecting conjugal plasmid transfer in natural bacterial communities.
p-105-104. In. M.J. Klug and C.A. Reddy (ed.) Current perspectives in microbial ecology,
Washington, D.C.
91. Froese, K. L., and A. M. K. Bodo. 1999. Health effects associated with wastewater treatment,
disposal, and reuse. Wat. Environ. Res. 71: 1119-1126.
92. Fujioka, R.S., and L. K. Shizumara. 1985. Clostridium perfringens: a reliable indicator of
stream water quality. J. Water Pollut. Cont. Fed. 57:986-992.
93. Fujioka, R. S. 2001. Monitoring coastal marine waters for spore-forming bacteria of faecal and
soil origin to determine point from non-point source pollution. Wat. Sci. Technol. 44: 181-188.
94. Fujioka, R. S. 2002. Microbial indicators of water quality, p-234-243. In C. J. Hurst, R. L.
Crawford, G. R. Knudsen, K. J. McInereny, and L. D. Stetzenbach (ed.), Manual of environmental
microbiology, 2nd ed. ASM Press, Washington, D.C.
95. Gannon, J.J., and M. K. Busse. 1989. E. coli and enterococci levels in urban stormwater, river
water and chlorinated treatment plant effluent. Water Res. 23: 1167-1176.
96. Geary, P.M. 1988. Domestic wastewater management alternatives for the Mt. Lofty ranges
watershed, In. Alternative waste treatment systems, R. Bhamidmarri (ed.) Elsevier Applied
Science, Publishers, London.
97. Geary, P.M. 1992. Diffuse pollution from wastewater disposal in small unsewered
communities. Aust. J. Soil. Wat. Conserv. 5: 28-33.

137
98. Geary, P. M., and E. A. Gardner. 1998. Sustainable on-site treatment systems. p. 12-20. In:
Proceedings of the Eighth National Symposium on Individual and Small Community Sewage
systems, American Society of Agricultural Engineers, St. Joseph, MI.
99. Geary, P.M., and J. H. Whitehead. 2001. Groundwater contamination from on-site domestic
wastewater management systems in a coastal catchment, p. 479-487. 9th National Symposium
on Individual and Small Community Sewage Systems, American Society of Agricultural
Engineers, St. Joseph, MI.
100. Geary P. M., and C. M. Davies. 2003. Bacterial source tracking and shellfish contamination in a
coastal catchment. 47: 95-100
101. Gerba, C. P., S. M. Goyal, R. L. Labelle, I. Cech, and G. F. Bodgan. 1979. Failure of indicator
bacteria to reflect the occurrence of enteroviruses in marine waters. A. J. Pub. Health. 69: 1116-
1119.
102. Gersberg, R, M. Matkovits, D. Dodge, T. McPherson, and J. Boland. 1995. Experimental
opening of a coastal Californian lagoon: effect on bacteriological quality of ocean waters. J.
Environ. Health 58: 24-28.
103. Gilpin, B. J., J. E. Gregor and M. G. Savill. 2002. Identification of the source of faecal pollution
on contaminated rivers. Wat. Sci. Technol. 46:9-15.
104. Gleeson, C., and N. Gray. 1997. The coliform index and waterborne disease. Problems of
microbial drinking water assessment. E and FN Spon, London.
105. Godfree, A. F., D. Kay, and M. D. Wyer. 1997. Faecal streptococci as indicators of faecal
contamination in water. J. Appl. Microbiol. Symp. Suppl. 83: 110S-119S.
106. Gold, A. J., H. Addy, D.Q. Kellog, and A. E. Rosenblett. 1999. Nitrate Removal in Shallow
Groundwater. P. 185-199. In: 10th Northwest On-site Wastewater Treatment Conference
Proceedings, University of Washington, Seattle, WA.
107. Gonzalez, E. A., and J. Blanco. 1989. Serotypes and antibiotic resistance of verotoxigenic
(VTEC) and necrotizing (NTEC) Escherichia coli strains isolated from calves with diarrhoea.
FEMS Microbiol. Lett. 60:31-36.
108. Gordon, D.G. 1989. Managing non-point pollution. An action plan handbook for Puget Sound
Watersheds. Puget Sound Water Quality Authority. Seattle, WA.
109. Gordon, D. M. 2001. Geographical structure and host specificity in bacteria and the
implications for tracing the source of coliform contamination. Microbiology. 147: 1079-1085.
110. Gordon, D. M., S. Bauer, and J. R. Johnson. 2002. The genetic structure of Escherichia coli
populations in primary and secondary habitat. Microbiology. 148: 1513-1522.
111. Grabow, W. O. K., T. E. Neubrech, C. S. Holtzhausen, and J. Jofre. 1995. Bacteroides fragilis
and Escherichia coli bacteriophages: excretion by humans and animals. Wat. Sci. Technol. 5-6:
223-230.

138
112. Grasso, G. M., M. L. Sammarco, G. Ripabelli, and I. Fanelli. 2000. Enumeration of Escherichia
coli and colifirms in surface water by multiple tube fermentation and membrane filtration
methods. Microbios. 103: 119-125.
113. Graves, A. K., C. Hagedorn, A. Teetor, M. Mahal, A. M. Booth, and R. B. Reneau, Jr. 2002.
Antibiotic resistance profiles to determine sources of fecal contamination in a rural Virginia
watershed. J. Environ. Qual. 31: 1300-1308.
114. Griffin, P. M., and R. V. Tauxe. 1991. The epidemiology of infections caused by Escherichia coli
O157:H7, other Enterohemorrhagic E. coli, and the associated haemolytic uremic syndrome.
Epidemiol. Rev. 13: 60-98.
115. Griffin, D. W., E. K. Lipp, M. R. McLaughlin, and J. B. Rose. 2001. Marine recreation and public
health microbiology: quest for the ideal indicator. BioScience 51: 817-825.
116. Griffith, J. F., S. B. Weisberg and C. D. McGee. 2003. Evaluation of microbial source tracking
methods using mixed fecal sources in aqueous test samples. J. Water. Health. 1: 141-151.
117. Grundmann, H. C., D. Schneider, D. Hartung, F. D. Daschner, and T. L. Pitt. 1995.
Discriminatory power of the three DNA-based typing techniques for pseudomonas aeruginosa.
J. Clin. Microbiol. 33: 528-534.
118. Gutteridge Haskins and Davey. 1992. An investigation of Nutrient Pollution in the Murray-
Darling River system, Prepared for Murray-darling River basin Commission, Canberra, A.C.T.
119. Guth B. E., C. L. Pickett, E. M. Twiddy, R. K. Holmes, T. A. Gomes, A. A. Lima, R. L. Guerrant,
B. D. Franco, and L. R. Trabulsi. 1986. Production of type II heat labile enterotoxin by
Escherichia coli isolated from food and human faeces. Infect. Immun. 59: 587-589.
120. Hagedorn, C., D. T. Hansen, and G. H. Simonson. 1978. Survival and movement of faecal
indicator bacteria in soil under conditions of saturated flow. J. Environ. Qual. 7: 55-59.
121. Hagedorn, C., S. L. Robinson, J. R. Filtz, S. M. Grubbs, T. A. Angier, and R. B. Reneau, Jr.
1999. Determining sources of fecal pollution in a rural Virginia watershed with antibiotic
resistance patterns in fecal streptococci. Appl. Environ. Microbiol. 65: 5522-5531.
122. Hagedorn, C., J. B. Crozier, K. A. Mentz, A. M. Booth, A. K. Graves, N. J. Nelson and R. B.
Reneau Jr. 2003. Carbon source utilization profiles as a method to identify sources of faecal
pollution in water. J. Appl. Microbiol. 94:792-799.
123. Hager, M. C. 2001. Detecting bacteria in coastal waters. J. Surf. Wat. Qual. Prof. 2: 16-25.
124. Hart, C. A., R. M. Batt, and J. R. Saunders. 1993. Disrrhoea caused by Escherichia coli. Ann.
Trop. Paediat. 13: 121-131.
125. Hartel, P. G., J. D. Summer, J. L. Hill, J. C. Collins, J. A. Entry, and W. I. Segers. 2002.
Geographic variability of Escherichia coli isolates from animals in Idaho and Georgia. J. Environ.
Qual. 31:1273-1278.
126. Hartel, P. G., J. D. Summer, and W. I. Segars. 2003. Deer diet affects ribotype diversity of
Escherichia coli for bacterial source tracking. Water. Res. 37:3263-3268.
139
127. Hartly, C. L., K. Howne, A. H. Linton, K. B. Linton, and M. H. Richmond. 1975. Distribution of
R plasmids among O-antigen types of Escherichia coli isolated from human and animal sources.
Antimicrob. Agents. Chemother. 8: 122-131.
128. Harwood, V. J., B. D. Parrish, and V. Wagner. 1999. Isolation of fecal coliform bacteria from
the diamondback terrapin (Malaclemys terrapain centrata). Appl. Environ. Microbiol. 65: 865-
867.
129. Harwood, V. J., J. Whitlock, and V. Withington. 2000. Classification of antibiotic resistance
patterns of indicator bacteria by discriminant analysis: use in predicting the source of fecal
contamination in tropical waters. Appl. Environ. Microbiol. 66: 3698-3704.
130. Harwood, V. J., B. Wiggins, C. Hagedorn, R. D. Ellender, J. Gooch, J. Kern, M. Samadpour, A.
C. H. Chapman, B. J. Robinson, and B. C. Thomson. 2003. Phenotypic library-based microbial
source tracking methods: efficacy in the California collaborative study. J. Wat. Health. 1: 209-
224.
131. Havelaar, A. H., and W. M. Hogeboom. 1984. A method for the enumeration of male-specific
bacteriophages in sewage. J. Appl. Microbiol. 56: 439-447.
132. Healy, K., and R. Laak. 1974. Site evaluation and design of seepage fields. J. Environ. Eng. Div.
ASCE (EE5): 1133-1146.
133. Health Department of Western Australia. 1999. Understanding septic tank systems.
Environmental Health Service. EHS 29.
134. Hill, V. R., and M. D. Sobsey. 1999. Microbial indicator reductions in alternative treatment
systems for swine wastewater. Wat. Sci. Technol. 38: 119-122.
135. Hilton, M. C., and G. Stotzky. 1973. Use of coliphages as indicators of water pollution. Can. J.
Microbiol. 19: 741-751.
136. Holmes, B., M. M. Costa, S. L. W. Garner, and O. M. Stevens. 1994. Evaluation of Biolog
system for identification of some gram-negative bacteria of clinical importance. J. Clin.
Microbiol. 32: 1970-1975.
137. Howell, J. M., M. S. Coyne, and P. Cornelius. 1995. Fecal bacteria in agricultural waters of the
Bluegrass Region of Kentucky. J. Environ. Qual. 24: 411-419.
138. Hoxley, G., and M. Dudding. 1994. Groundwater contamination by septic tank effluent two
case studies in Victoria, Australia, p. 145-152. In: Water Down Under 94: Proceedings of 25th
Congress of International Association of Hydrogeologists and the International Hydrology and
Water Resources Symposium of the Institution of Engineers, Adelaide, Australia.
139. Hurst, C. J. 1997. Overview of water microbiology as it relates to public health. p. 133-135. In.
C. J. Hurst et al. (ed.) Manual of environmental microbiology. American Society for
Microbiology, Washington, D.C.
140
140. Hydrotechnology. 1993. Groundwater pollution from septic tank effluent and the potential
impact on adjacent water courses, Benalla. Report prepared for the Murray Darling Basin
Commission, Victoria, Australia.
141. ISSC. 1997. Interstate shellfish sanitation conference guide for the control of molluscan
shellfish. U.S. Department of Health and Human Service, Public Health service, Food and Drug
Administration. 1997 Revision.
142. Irvine, K. N., and G. W. Pettibone.1996. Planning level evaluation of densities and sources of
indicator bacteria in a mixed land use watershed. Environ. Technol. 17: 1-12.
143. Iverson, A., I. Kühn, A. Franklin, and R. Möllby. 2002. High prevalence of vancomycin
resistant enterococci in Swedish sewage. Appl. Environ. Microbiol. 68: 2838-2842.
144. Ivkovic, K. M., K. L. Watkins, R. G. Cresswell, and J. Bauld. 1998. A groundwater quality
assessment of the fractured rock aquifers of the Piccadilly Valley, South Australia, Australian
Geological Survey Organisation Record 1998/16.
145. Jarrett, A. R., D. D. Fritton, and W. E. Sharpe. 1985. Renovation of failing absorption fields by
water conservation and resting. American Association of Agricultural Engineers, Paper No. 85-
2630.
146. Jellife, P.A. 1995. Management of on-site effluent disposal; conclusions from a study on the
performance of 101 systems in Maroochy Shire. Report prepared for Maroochy Shire Council,
Queensland, Australia.
147. Jenkins, M. B., P. G. Hartel, T. J. Olexa, and J. A. Stuedemann. 2003. Putative temporal
variability of Escherichia coli ribotypes from yearling steers. J. Environ. Qual. 32: 305-309.
148. Jerse, A. E., J. Tu, B. D. Tall, and J. B. Kaper. 1990. A genetic locus of enteropathgenic
Escherichia coli necessary for the production of attaching and effacing lesions on tissue culture
cells. Proc. Natl. Acad. Sci. USA. 87: 7839-7843.
149. Jiang, S. C. 2002. Adenovirus as an index of human viral contamination. Microbial source
tracking workshop. Proceedings of US EPA Workshop on Microbial Source Tracking, Marriot
Hotel and Conference Center, Irvine, CA, February pp. 75-88
150. Jofre, J., A. Bosch, F. Lucena, R. Girones, and C. Tartera. 1986. Evaluation of Bacteroides
fragilis bacteriophages as indicators of the virological quality of water. Wat. Sci. Technol. 18:
167-177.
151. Johnson, J. R. 1991. Virulence factors in Escherichia coli urinary tract infection. Clin. Microbiol.
Rev. 4: 80-128.
152. Johnson, J. R., J. J. Brown, U. B. Carlino, T. A. Russo. 1998. Colonization with and acquisition
of uropathogenic Escherichia coli as revealed by polymerase chain reaction-based detection. J.
Infect. Dis. 177:1120-1124.
153. Johnson, L. K., M. B. Brown., E. A. Carruthers., J. A. Ferguson., P. E. Dombek, and M. J.
Sadowsky. 2004. Sample size, library composition, and genotypic diversity among natural

141
populations if Escherichia coli from different animals influence accuracy of determining sources
of fecal pollution. Appl. Environ. Microbiol. 70: 4478-4485.
154. Jones, K., and K. Obiri-Danso. 1999. Non-compliance of beaches with the EU directives of
bathing water quality: evidence of non-point sources of pollution in Morecambe Bay. J. Appl.
Microbiol. Symp. Suppl. 85: 101S-107S.
155. Kaplan, B. O. 1987. Septic system handbook. Lewis Publishers. Chelsea, Michigan.
156. Kaspar, C. W., J. L. Burgess, I. T. Knight, and R. R. Colwell. 1990. Antibiotic resistance
indexing of Escherichia coli to identify sources of fecal contamination in water. Can. J. Microbiol.
36: 891-894.
157. Katouli, M., I. Kühn, R. Möllby. 1990. Evaluation of the stability of biochemical phenotypes of
Escherichia coli upon subculturing and storage. J. Gen. Microbiol. 136: 1681-1688.
158. Katouli, M., I. Kühn, R. Wollin, and R. Möllby. 1992a. Evaluation of the PhP system for
biochemical fingerprinting for typing salmonella strains of serotypes Typhimurium. J. Med.
Microbiol. 37: 252-257.
159. Katouli, M., I. Kühn, A. Brauner, A. A. Farhoudi-Moghaddam, R. Möllby. 1992b. application
of biochemical fingerprinting in investigation of the clonal groups of Salmonella havana. J. Med.
Microbiol. 36: 392-398.
160. Katouli, M., A. Lund, P. Wallgren, I. Kühn, O Söderlind, R. Möllby. 1995. Phenotypic
characterization of the intestinal Escherichia coli of pigs during suckling, post-weaning and
fattening periods. Appl. Environ. Microbiol. 61: 778-783.
161. Katouli, M., A. Lund., P. Wallgren., I. Kühn, O. Söderlind, and R. Möllby. 1997. Metabolic
fingerprinting and fermentative capacity of the intestinal flora of pigs during pre- and post-
weaning periods. J. Appl. Microbiol. 83: 147-154.
162. Katouli, M., A. Brauner, L. K. Haghighi, B. Kaijser, V. Muratov, and R. Möllby. 2005.
Virulence characteristics of Escherichia coli strains causing acute cystitis in young adults in
Iran. J. Infect. 50: 312-321.
163. Keene, W. E., J. M. McAnulty, F. C. Hosley, L. P. Williams and K. Hedberg. 1994. A swimming
associated outbreak of hemorrhagic colitis caused by Escherichia coli O157:H7 and Shigella
sonnie New. Eng. J. Med. 331: 579-84.
164. Kelsey, H., G. Scott, D. E. Porter, B. Thomson, and L. Webster. 2002. Using multiple antibiotic
resistance and land use characteristics to determine sources of fecal coliform bacterial
pollution. Environ. Monit. Assess. 81: 337-348.
165. Kibbey, H. J., C. Hagedorn, and E. L. McCoy. 1978. Use of fecal streptococci as indicators of
pollution in soil. Appl. Environ. Microbiol. 35:711-717.
166. Kott, Y., N. Roze, S. Sperber, and N. Betzer. 1974. Bacteriophages as viral pollution indicators.
Water Res. 8:165-171.

142
167. Koeuth, T. J. Versalovic, and J. R. Lupski. 1995. Differential subsequence conservation of
interspersed repetitive Streptococcus pneumonie BOX elements in diverse bacteria. Genome
Res. 5: 408-418.
168. Kramer, M. H., F. E. Sorhafe, S. T. Goldstein, E. Dalley, S. P. Walhquist, and B. L. Herwaldt.
1988. First reported outbreak in the United States of Cryptosporidiosis associated with a
recreational lake. Clin. Infect. Dis. 26: 27-33.
169. Kreader, C. A. 1995. Design and evaluation of bacteroides DNA probes for the specific
detection of human fecal pollution. Appl. Environ. Microbiol. 61: 1171-1179.
170. Kristiansen, R. 1982. The soil as a renovating medium-clogging of infiltrative surfaces, p. 105-
121. In: Alternative Wastewater Treatment. Eikum, A. S., and R. W. Seabloom (ed.). Reidel
Publishing Company, Dordrecht, Holland.
171. Kühn, I. 1985. Biochemical fingerprinting of Escherichia coli: a simple method for
epidemiological investigations. J. Microbiol. Methods 3: 159-170.
172. Kühn, I., L. G. Burman, L. Erikkson, and R. Möllby. 1990. Subtyping of Klebsiella by
biochemical fingerprinting: A simple system for epidemiological investigations. J. Microbiol.
Methods. 11: 177-185.
173. Kühn, I., G. Allestam, T. A. Strenström, and R. Möllby. 1991. Biochemical fingerprinting of
water coliform bacteria-a new method for measuring the phenotypic diversity and for
comparing different bacterial populations. App. Environ. Microbiol. 57: 3171-3177.
174. Kühn, I., and R. Mollby. 1993. The PhP RS system- A simple micro plate method for studying
coliform bacterial populations. J. Microbial methods. 17: 255-259.
175. Kühn, I., M. Katouli, P. Wallagren, O. Söderlind, and R. Möllby. 1995. Biochemical
fingerprinting as a tool to study the diversity and stability of intestinal microflora. Microecol.
Thera. 23: 140-148.
176. Kühn, I., G. Allestam, M. Engdhal, and T. A. Stenström. 1997a. Biochemical fingerprinting of
coliform bacterial populations-comparisons between polluted river water and factory effluents.
Wat. Sci. Technol. 35: 343-350.
177. Kühn, I., J. Albert, M. Ansaruzzaman, S. A. Alabi, N. A. Bhuiyanand, G. Huys, M. S. Islam, P.
Jansen, K. Kersters, P. K. B. Neogi, and R. Möllby. 1997b. Characterization of aeromonas spp.
isolated from humans with diarrhoea, from healthy controls, and from in surface water in
Bangladesh. J. Clin. Microbiol. 35: 369-373.
178. Kühn, I., G. Allestam, G. Hyus, P. Janssen, K. Kersters, K. Krovacek, and T. A. Strenström.
1997c. Diversity, persistence and virulence of Aeromonas strains isolated from drinking water
distribution systems in Sweden. 63: 2708-2715.
179. Kuntz, R. L., P. G. Hartel, D. G. Godfrey, J. L. McDonald, K. W. Gates, and W. I. Segars. 2003.
Targeted sampling protocol as prelude to bacterial source tracking with Enterococcus fecalis. J.
Environ. Qual. 32: 2311-2318.

143
180. Law, D., and H. Chart. 1998. Enteroaggregative Escherichia coli. J. Appl. Microbiol. 84: 685-
697.
181. Leclerc, H., S. Edberg, V. Pierzo, and J. M. Delattre. 2000. Bacteriophages as indicators of
enteric viruses and public health risk in groundwaters. J. Appl. Microbiol. 88: 5-21
182. Leclerc, H., D. Mossel, S.C. Edberg, and C.B. Strujk. 2001. Advances in the bacteriology of the
coliform group: Their suitability as markers of microbial water safety. Ann. Rev. Microbiol. 55:
201-34.
183. Leeming R., A. Ball., N. J. Ashbolt, and P. D. Nicholas. 1996. Using faecal sterols from humans
and animals to distinguish faecal pollution in receiving waters. Water. Res. 30: 2893-2900.
184. Leeming, R., V. Latham, M. Rayner, and P. Nicholas. 1997. Detecting and distinguishing
sources of sewage pollution in Australia inland and coastal water sediments. ACS Symp.Series
671: 306-319.
185. Lesikar, B. 1999. On-site waste water treatment systems: Septic tank/soil absorption field.
Texas Agricultural Extension Service. Fact Sheet number L-5227. College Station, TX.
186. Leung, K. T., R. Mackereth, Y. C. Tien, and E. Topp. 2004. A comparison of AFLP and ERIC-
PCR analyses for discriminating Escherichia coli from cattle, pig and human sources. FEMS
Microbiol. Ecol. 47: 111-119.
187. Ley, V., J. Higgins, R. Fayer. 2002. Bovine enteroviruses as indicators of fecal contamination.
Appl. Environ. Microbiol. 68: 3455-3461.
188. Linda, K. D., A. E. Bernherd, T. J. Brodeur, J. W. Santo Domingo, J. M. Simpson, S. P. Walters
and K. G. Field. 2005. Host distribution of uncultivated fecal Bacteroidales bacteria reveals
genetic markers for fecal source identification. Appl. Environ. Microbiol. 71: 3184-3191.
189. Lipp, E. K., S. A. Farrah, and J. B. Rose. 2001. Assessment and impact of microbial fecal
pollution and human enteric pathogens in a coastal community. Mar. Pollut. Bull. 42: 286-293.
190. Levin, M. A. 1977. Bifidobacterium as water quality indicators, p. 131-138. In A. W. Hadley, and
B. J. Dutka (ed.), Bacterial indicators-health hazards associated with water. ASTM Publications,
Philadelphia, Pa.
191. Ludwig, W., E. Seewald, R. Kilpper-Bälz, K. H. Schleifer, L. Magrum, C. R. Woese, G. E. Fox,
and E. Stackebrandt. 1985. The phylogenetic position of Streptococcus and Enterococcus. J.
Gen. Microbiol. 131: 543-551.
192. Lund, E. 1978. The survival of viral pathogens in water and waste in the tropics. Prog. Wat.
Technol. 11: 73-79.
193. Martins, M. T., L. G. Rivera, D. I. Clark, M. H. Stewart, R. L. Wolfe, and B. H. Olson. 1993.
Distribution of uidA gene sequences in Escherichia coli isolates in water sources and
comparison with the expression of beta glucuronidase activity in 4-methylumbelliferyl-beta-D-
Glucuronide media. Appl. Environ. Microbiol. 59: 2271-2276.

144
194. Maslow, J. N., M. E. Mulligan, and R. D. Arbeit. 1993. Molecular epidemiology: Application of
contemporary techniques to the typing of micro-organisms. Clin. Infect. Dis. 17: 153-64.
195. Matsuki, T., K. Watanabe, R. Tanaka, M. Fukuda, and H. Oyaizu. 1999. Distribution of
bifidobacterial species in human intestinal microflora examined with 16S rRNA-gene-targeted
species-specific primers. Appl. Environ. Microbiol. 65: 4506-4512.
196. Mawdsley, J. L., R. D. Bardgett, R. J. Merry, B. F. Pain and M. K. Theodorou. 1995. Pathogens
in livestock waste, their potential for movement through soil and environmental pollution.
Appl. Soil. Ecol. 2:1-15.
197. McLellan, S. L. 2004. Genetic diversity of Escherichia coli isolated from urban rivers and beach
water. Appl. Environ. Microbiol. 70: 4658-4665.
198. McFeters, G. A., Bissonnette, G. K. and J. J. Jezeski. 1974. Comparative survival of indicator
bacteria and enteric pathogens in well water. J. Appl. Microbiol. 27: 823-829.
199. Meays, C. L., K. Broersma, R. Nordin, and A. Majumder. 2004. Source tracking fecal bacteria
in water: a critical review of current methods. J. Environ. Manag. 73: 71-79.
200. Meschke, J. and M. Sobsey. 1999. Microbial pathogens and on-site soil treatment Systems.
North Carolina State University Cooperative Extension Service, Raleigh, NC.
201. Miller, R. D., and D. L. Hartl. 1986. Biotyping confirms a nearly clonal population structure in
Escherichia coli. Evolution. 40: 1-12.
202. Minnesota Pollution Control Agency. 1994. Effects of septic system on ground water quality-
Baxter, Minnesota. Prepared by Ground Water Monitoring and Assessment Program (GWMAP).
Minnesota.
203. Moe, C. 2002. Waterborne transmission of infectious agents, p.184-204. In C. J. Hurst, R. L.
Crawford, G. R. Knudsen, K. J. McInereny, and L. D. Stetzenbach (ed.), Manual of environmental
microbiology, 2nd ed. ASM Press, Washington, D.C.
204. Möllby, R., I. Kühn, and M. Katouli. 1993. Computerized biochemical fingerprinting- A new
tool for typing of bacteria. Rev. Med. Microbiol. l4: 231-241.
205. Moon, H. W., R. A. Schneider, and S. L. Moseley. 1986. Comparative prevalence of four
enterotoxin genes among Escherichia coli isolated from swine. Am. J. Vet. Res. 47: 127-132.
206. Moyda, S. P., C. A. Carson, J. J. Fuhrmann, B. K. Hahm, P. G. Hartel, R. L. Kuntz, C. H.
Nakatsu, M. J. Sadowsky, M. Samadpour, and H. Yampara-Iquise. 2003. Comparing
genotypic bacterial source tracking methods that require a host origin database. J. Wat. Health
1: 167-180.
207. Murtaugh, J., and R. L. Bunch. 1976. Sterols as a measure of faecal pollution. J. Wat. Pollut.
Cont. Fed. 39: 404-409.
208. Murray, B. E., K. V. Singh, J. D. Health, B. R. Sharma, and G. M. Weinstock. 1990. Comparison
of genomic DNAs of different enterococcus isolates using restriction endonucleases with
infrequent recognition sites. J. Clin. Microbiol. 28: 2059-2063.
145
209. Nataro, J. P., and J. B. Kaper. 1998. Diarrhoeagenic Escherichia coli. Clin. Microbial. Rev. 11:
142-201.
210. Natural Resources Defence Council. 1998. p. 145. Testing the waters, volume VIII, New York.
211. NHMRC. 1993. Review of Coliforms as Microbial indicators of drinking water quality. National
Health and Medical Research Council, Canberra.
212. NHMRC. 2003. Recommendations to change the use of coliforms as microbial indicators of
drinking water quality. National Health and Medical Research Council, Canberra.
213. Noble, L., and J. Gow. 1998. The effect of suspending solution supplemented with marine
cations on the oxidation of Biolog GN Microplate TM substrates by Vibrionaceae bacteria. Can. J.
Microbiol. 44: 251-258.
214. Noble, R. T., S. M. Allen, A. D. Blackwood, W. Chu, S. C. Jiang, G. L. Lovelace, M. D. Sobsey, J.
R. Stewart, and D. A. Wait. 2003. Use of viral pathogens and indicators to differentiate
between human and non-human fecal contamination in a microbial source tracking comparison
study. J. Wat. Health 1: 195-207.
215. Olive, D. M., and P. Bean. 1999. Principles and applications of methods for DNA-based typing
of microbial organisms. J. Clin. Microbiol. 37:1661-1669.
216. Olsen, S. J., G. Miller, T. Breuer, M. Kennedy, C. Higgins, J. Walford, G. McKee, K. Fox, W.
Bibb, and P. Mead. 2002. A waterborne outbreak of Escherichia coli O157 infections and
hemolytic uremic syndrome: implications for rural water systems. Emerg. Infect. Dis. 8: 370-
375.
217. Olson, B. H., L. A. Khatib, and E. C. Chern. 2002. Source tracking of fecal waste material in
environmental waters using a biomarker based on enterotoxin Genes in E. coli, Proceedings of
US EPA Workshop on Microbial Source Tracking, Marriot Hotel and Conference Center, Irvine,
CA, February pp. 65-68.
218. Omisakin, F., M. MacRae, I. D. Ogden and N. J. C. Strachan. 2003. Concentration and
prevalence of Escherichia coli O157 in cattle feces at slaughter. Appl. Environ. Microbiol.
69:2444-2447.
219. O’Neill, R., G. Roads, and R. Weise. 1993. On-site wastewater treatment and disposal in New
South Wales. Report prepared for Department of Water Resources and University of
Technology, Sydney, NSW, Australia.
220. Orden, J. A., J. A. Ruiz-Santa-Quiteria, D. Cid, S. Garcia, and D. E Lafuenter. 1999. Prevalence
and characteristics of necrotoxigenic Escherichial coli (NTEC) strains isolated from diarrhoeic
calves. Vet. Microbiol. 66: 265-273.
221. Ørskov, F., and I. Ørskov. 1981. Enterobacteriaceae, p. 340-352. In. A. I. Broude (ed.), Medical
Microbiology and infectious disease W. B. Saunders Co., Philadelphia, Pa.
146
222. Ørskov, F. 1984. Genus I. Escherichia Castellani and Chalmers 1919, 941AL. p. 420-423. In N. R.
Kreig and J.G. Holt (ed.) Bergey’s manual of systematic bacteriology. Vol. 1. Williams and
Wilkins, Baltimore, MD.
223. Parveen, S., R. L. Murphree, L. Edmiston, C. W. Kaspar, K. M. Portier, and M. L. Tamplin.
1997. Association of multiple-antibiotic-resistance profiles with point and non-point sources of
Escherichia coli in Apalachicola Bay. Appl. Environ. Microbiol. 63: 2607-2612.
224. Parveen, S., K. M. Portier, K. Robinson, L. Edmiston, and M. Tamplin. 1999. Discrimination
analysis of ribotype profiles of Escherichia coli for differentiating human and non-human
sources of fecal pollution. Appl. Environ. Microbiol. 65: 3142-3147.
225. Parveen, S., N. C. Hodge, R. E. Stall, S. R. Farrah, and M. L. Tamplin. 2001. Genotypic and
phenotypic characterization of human and non-human Escherichia coli. Water Res. 35:379-
386.
226. Pass, M. A., R. Odedra, and R. M. Batt. 2000. Multiplex PCRs for identification of Escherichia
coli virulence genes. J. Clin. Microbiol. 38: 2001-2004.
227. Paton, A. W., and J. C. Paton. 1998. Detection and characterization of Shiga toxigenic
Escherichia coli by using multiplex PCR assay for stx1, stx2, eaeA, Enterohemorrhagic E. coli hlyA,
rfbO111, and rfbO157. J. Clin Microbiol. 36:598-602.
228. Payment, P. 1993. Viruses: Prevalence of Disease. Levels and Sources. In: Safety of Water
disinfection: Balancing Chemical and Microbial Risks. Craun, G.F. (Ed). ILSI Press, Washington.
pp. 99-113.
229. Payment, P., and E. Franco. 1993. Clostridium perfringens and somatic coliphages as
indicators of the efficiency of drinking water treatment for viruses and protozoan cysts. Appl.
Environ. Microbiol. 59: 2418-2424.
230. Pina, S., M. Puig, F. Lucena, J. Jofre, and R. Girones. 1998. Viral pollution in the environment
and in shellfish: Human adenovirus detection by PCR as an index of human viruses. Appl.
Environ. Microbiol. 64: 3376-3382.
231. Poh, C. L., C. C. Yeo, and L. Tay. 1992. Genome fingerprinting by pulsed-field gel
electrophoresis and ribotyping to differentiate Pseudomonas aerginosa serotype 011 strains.
Eur. J. Clin. Microbiol. Infect. Dis. 11:817-822.
232. Puech, M. C., J. M. McAnulty, M. Lesjak, N. Shaw, L. Heron, and J. M. Watson. 2001. A state-
wide outbreak of cryptosporidiosis in New South Wales associated with swimming at public
pools. Epidemiol. Infect. 126:389-396.
233. Rahman, M., P. Colque-Navarro, I. Kühn, G. Hyus, J. Swings and R. Möllby. 2002.
Identification and characterization of pathogenic Aeromonas veronii biovar sobria associated
with Epizootic Ulcerative Syndrome (EUS) in fish Bangladesh. Appl. Environ. Microbiol. 68:
650-655.

147
234. Ram, J. L., R. O. Ritchie, J. Fang, F. S. Gonzalez, and J. P. Selegean. 2004. Sequence-based
source tracking of Escherichia coli bases of genetic diversity of β-glucuronidase. J. Environ.
Qual. 33: 1024-1032.
235. Rea, R. A., and S. B. Upchurch. 1980 Influence of regolith properties on migration of septic
tank effluent. Ground water. 18: 118-125.
236. Rhodes, M. W., and H. Kator.1999. Sorbitol-fermenting bifidobacteria as indicators of diffuse
human faecal pollution in estuarine watersheds. J. Appl. Microbiol. 87: 528-535.
237. Robertson, G.1998. Recreational water quality monitoring: Tigerhead Beach. Report
submitted to Sorell Council, Tasmania, Australia.
238. Rose, J. B., D. W. Griffin and L. W. Nicosia. 1999. Virus transport from septic tanks to coastal
waters. p. 71-80. In: 10th Northwest On-site Wastewater Treatment Conference Proceedings,
University of Washington, Seattle, WA.
239. Rosenberg, M. L., J. P. Koplan, I. K. Wachmuth, J. G. Wells, and E. J. Gangarosa. 1977.
Epidemic diarrhea at Crater Lake from enterotoxigenic Escherichia Coli. A large waterborne
outbreak. Ann. Interim. Med. 86: 714-718.
240. Roll, B. B., and R. S. Fujioka. 1997. Sources of faecal indicator bacteria in a brackish tropical
stream and their impact on recreational water quality. Wat. Sci. Technol. 35: 179-186.
241. Rubin, A. R. 2002. Fulfilling potential of on-site wastewater treatment. Bio-cycle. 43: 66-70.
242. Sadowsky, M. J., and H. G. Hur. 1998. Use of endogenous repeated sequences to fingerprint
bacterial genomic DNA. P. 399-413. In. J.R. Lupski, G. Weinstock, and F. J. de Bruijn (ed.)
Bacterial genomes; structure and analysis. Chapman and Hall, New York, N. Y.
243. Samadpour, M., and N. Checowitz. 1995. Little Soos Creek microbial source tracking: a
survey. University of Washington Department of Environmental Health, Seattle.
244. Sargeant, D. 1999. Faecal contamination source identification method in surface water.
Washington State Department of Ecology. Ecology report no. 99-345.
245. Saulnier, P., C. Bourneix, G. Prevost, and A. Andremont. 1993. Random amplified
polymorphic DNA assay is less discriminant than pulsed-field gel electrophoresis for typing
strains of methicillin-resistant staphylococcus aureus. J. Clin. Microbiol. 31: 982-985.
246. Scandura, J. E., and M. D. Sobsey. 1997. Viral and bacterial contamination of groundwater
from on-site sewage treatment systems. Wat. Sci. Technol. 35: 141-146.
247. Schueler, T. 1999. Microbes and urban watersheds: Water. Protec. Technol. 3: 575-579.
248. Schlichting, C., C. Branger, and J. M. Fournier. 1993. Typing of Staphylococcus aureus by
pulsed-field gel electrophoresis, zymotyping, capsular typing and phage typing: resolution of
clonal relationships. J. Clin. Microbiol. 31: 227-232.
249. Scott, T. M., J. B. Rose, T. M. Jenkins, S. R. Farrah, and J. Lukasik. 2002. Microbial source
tracking: current methodology and future directions. Appl. Environ. Microbiol. 68: 5796-5803.
148
250. Scott, T. M., J. Caren, G. R. Nelson, T. M. Jenkins, and J. Lukasik. 2004. Tracking sources of
fecal pollution in a South Carolina Watershed by ribotyping Escherichia coli: A Case study.
Environ. Forensics. 5: 15-19.
251. Seiler, R. L., S. D. Zaugg, J. M. Thomas, D. L. Howcroft. 1999. Caffeine and pharmaceuticals as
indicators of wastewater contamination in wells. Groundwater 37: 405-410.
252. Serunick, S., W. Verstraete, and S. D. Siciliano. 2003. Use of 16S-23S rRNA Intergenic spacer
region PCR and repetitive extragenic palindromic PCR analyses of Escherichia coli isolates to
identify nonpoint fecal sources. Appl. Environ. Microbiol. 69: 4942-4950.
253. Shehane, S. D., V. J. Harwood, J. E. Whitlock and J. B. Rose. 2005. The influence of rainfall on
the incidence of microbial faecal indicators and the dominant sources of faecal pollution in a
Florida river. J. Appl. Microbiol. doi: 10.1111/j.1365-2672.2005.02554.x
254. Simpson, J. M., J. W. Santo Domingo, and D. J. Reasoner. 2003. Microbial source tracking:
state of the science. Environ. Sci. Technol. 36: 5280-5288.
255. Simmons, G. M., Jr., S. A. Herbain, and C. M. James. 1995. Managing non-point fecal coliforms
sources to tidal inlets. Water Res. Upd. 1995: 64-74.
256. Simmons, G. M., Jr., and S. A. Herbain. 1998. Potential sources of Escherichia coli (E. coli) to
Children’s Pool in La Jolla, California. Final report for the City of San Diego and the County of
San Diego Dep. of Environmental Health, San Diego, CA.
257. Simmons, G. M., D. F. Waye, S. Herbain, S. Meyers, and E. Walker. 2000. Estimating non-
point fecal coliform sources in Northern Virginia’s Four Mile Run watershed, p. 248-267. In T.
Younos and J. poff (ed.), Proceedings of the Virginia Water Research Symposium 2000, VWRRC
Special Report SR-19-2000. Blacksburg.
258. Sinton, L. W., A. M. Donnison, and C. M. Hastie. 1993. Faecal streptococci as faecal pollution
indicators: a review. Part II. Sanitary significance, survival and use. New Zealand J. of Mar.
Freshwat. Res. 27:117-137.
259. Sinton, L. W., R. K. Finlay, and D. J. Hannah. 1998. Distinguishing human from animal faecal
contamination in water: A review. New Zealand J. Mar. Freshwat. Res. 32: 323-348.
260. Smith, T., and M. Ince. 1989. Septic system density and groundwater contamination in Illinois:
A survey of State and Local Regulation. NTIS Report No. PB89-178545.
261. Sneath, P.H. A., and R. R. Sokal. (1973) Numerical taxonomy: the principles and practice of
numerical classification. W.H. Freeman, San Francisco, CA.
262. Sobsey, M. D., K. J. Schwab, and T. R. Handzel. 1990. A simple membrane filter method to
concentrate and enumerate male specific RNA coliphages. J. Am. Water. Works. Assoc. 82:52-
59.
263. Sobsey, M. D. 2002. Coliphage tracking to identify sources of fecal contamination. Proceedings
of US EPA Workshop on Microbial Source Tracking, Marriot Hotel and Conference Center,
Irvine, CA, February pp. 59-63.

149
264. Sorensen, D. L., S. G. Eberl, and R. A. Diksa. 1989. Clostridium perfringens as a point source
indicator in non-point polluted streams. Water Res. 23:191-197
265. Stewart, J. R., R. D. Ellender, J. A. Gooch, S. Jiang, S. P. Moyda, and S. B. Weisberg. 2003.
Recommendations for microbial source tracking methods comparison study. J. Water Health. 1:
225-231.
266. Stoeckel, D. M., M. V. Mathes, K. E. Hyer, C. Hagedorn, H. Kator, J. Lukasik, L. O’Brien, T. W.
Fenger, M. Samadpour, K. M. Strickler, and B. A. Wiggins. C. M. Kephert, V. J. Harwood, M.
A. Anderson, and M. Dontchev. 2004. Comparison of seven protocols to identify fecal
contamination sources using Escherichia coli. Environ. Sci. Technol. 38: 6109-6117.
267. Tang-Liu, D. D., R. L. Williams, and S. Riegelman. 1993. Disposition of Caffeine and its
metabolism in man. J. Pharmacol. Exp. Therap. 24: 180-185.
268. Tarr, P. I. 1995. Escherichia coli. O157: H7: clinical diagnostic and epidemiological aspects of
human infection. Clin. Infec. Dis. 20: 1-10.
269. Tartera, C., and J. Jofre. 1987. Bacteriophages active against Bacteroides fragilis in sewage
polluted waters. Appl. Environ. Microbiol. 53: 1632-1637.
270. Taylor, J.W., G.W. Gary, and H. B. Greenberg. 1981. Norwalk-related viral gastroenteritis due
to contaminated drinking water. Am. J. Epidemiol. 114: 584-592.
271. Taylor, M. B., P. J. Becker, E. J. Van-rensburg, B. N. Harris, I. W. Bailey, and W. O. Grabow.
1995. A serosurvey of water-borne pathogens amongst canoeists in South Africa. Epidemiol.
Infect. 115: 299-307.
272. Thielman, N. M., and R. L. Guerrant. 1999. Escherichia coli. p. 88-200.In: Yu VL, Merigan (Jr.)
T.C and S.L. Barriere (ed.) Epidemiology and pathogenesis of Escherichia coli. The Williams &
Wilkins Company, Baltimore.
273. Tillett, D., and B. A. Neilan. 2000. Xanthogenate nucleic acid isolation from cultured and
environmental cyanobacteria. J. Phycol. 36: 251-258.
274. Topp, E., M. Welsh, Y.-C Tien, A. Dang, G. Lazarovitz, K. Conn, and H. Zhu. 2003. Strain
dependent variability in growth and survival of Escherichia coli in agricultural soil. FEMS
Microbiol. Ecol. 44: 303-308.
275. Topley, W. W. C. 1997. Topley and Wilson’s Microbiology and Microbial infections. A. Balows
(ed.). 9th Edition, Arnold Publishers, London.
276. Toranzos, G.A., and G. A. McFeters. 1997. Detection of indicator micro-organisms in
environmental fresh waters and drinking waters, p. 184-194. In C. J. Hurst, G. R. Knudsen, M. J.
McInerney, L. D. Stetzenbach, and M. V. Walter (ed.), Manual of environmental microbiology.
American Society for Microbiology, Washington, D. C.
277. Tshimanga, M., D. E. Peterson, and R. A. Dlodlo. 1997. Using epidemiologic tools to control
an outbreak of diarrhoea in a textile factory, Bulawayo, Zimbabwe. East Afr. Med. J. 74: 719-
722.
150
278. Tuthill, A., D. B. Meikle, and M. C. R. Alavanja.1998. Coliform bacteria and nitrate
contamination of wells in major soils of Frederick County, Maryland. J. Environ. Health. 60: 16-
21.
279. Tynkkynen, S., R. Satokari, M. Saarela, T, Mattila-Sandholm, and M. Saxelin. 1999.
Comparison of ribotyping, randomly amplified polymorphic DNA analysis, and pulsed-field gel
electrophoresis in typing Lactobacillus rhamnosus and L. casei strains. Appl. Environ. Microbiol.
65: 3908-3914.
280. Tyler, K. D., G. Wang, S. D. Tyler and W. M. Johnson. 1997. Factors affecting reliability and
reproducibility of amplification-based DNA fingerprinting of representative bacterial
pathogens. J. Clin. Microbiol. 35: 339-346.
281. U.S. Environmental Protection Agency. 1996. National water quality Inventory, 1994 Annual
Report to Congress. EPA- 841/R-95-005, Off. Water, Washington, D.C.
282. Vaughn, J. M., E. F. Landry, and M. Z. Thomas. 1983. Entrainment of viruses from septic tank
leach fields through a shallow sandy soil aquifer. Appl. Environ. Microbiol. 45: 1474-1480.
283. Venkatesan, M. I. 1995. Coprostanol and other sterols as innovative indicators for human
pathogen. Environ. Sci. Technol. 24: 208-214.
284. Versalovic, J., T. Koeuth, and J. R. Lupski. 1991. Distribution of repetitive DNA sequences in
eubacteria and application to fingerprinting of bacterial genomes. Nucleic Acid Res. 19: 6823-
6831.
285. Versalovic, J., F. Schneider, F. J. de Brujin, and J.R. Lupski. 1994. Genomic fingerprinting of
bacteria using repetitive sequences-based polymerase chain reaction. Methods. Mol. Cell. Biol.
5: 25-49.
286. Versalovic, J., F. J. de Brujin, and J. R. Lupski. 1998. Repetitive sequence-based PCR (rep-
PCR) DNA fingerprinting of bacterial genomes. Bacterial Genomes: Physical Structure and
analysis, Chapman and hall, New York: 437-454.
287. Vilanova, X., A. Manero, M. Cerdà Cuéller and A. R. Blanch. 2002. The effect of a sewage
treatment plant effluent on the faecal coliforms and enterococci populations of the reception
river waters. J. Appl. Microbiol. 92: 210-214.
288. Vilker, V. L., L. H. Frommhagen, S. Sundaram, and R. Kamdar. 1978. Application of ion
exchange/adsorption models to virus transport in percolating beds. Am. I. Chem. Eng. Symp.
Series. 74: 84-92.
289. Vonstille, W., W. Stille, and R. Sharer.1993. Hepatitis A epidemics from utility sewage in
Ocoee, Florida. Arch. Environ. Health. 48: 120-124.
290. Walker, W. G., J. Bouma, D. R. Keeney, and P. G. Olcott. 1973. Nitrogen transformations
during subsurface disposal of septic tank effluent in sands: II. Groundwater quality. J. Environ.
Qual. 4: 521-525.

151
291. Wallis, J. L., and H. D. Taylor. 2003. Phenotypic population characteristics of the enterococci
in human and animal faeces: Implications for the new European directive on the quality of
bathing waters. Wat. Sci. Technol. 47: 27-32.
292. Wallis, P.M., B. Primrose, and W. J. Robertson. 1998. Outbreak of Waterborne Giardiasis
caused by sewage contamination of drinking water. Environ. Health. Rev. 42: 44-51.
293. Watson, A. 1996. Prediction game. Nature. 381: 386.
294. Webster, L. F., B. C. Thomson, M. H. Fulton, D. E. Chestnut, R. F. Van Dolah, A. K. Leight,
and G. I. Scott. 2004. Identification of sources of Escherichia coli in South Carolina estuaries
using antibiotic resistance analysis. J. Exp. Mar. Biol. Ecol. 298: 175-195.
295. Welch, P., J. David, W. Clarke, A. Trinidade, D. Penner, S. Bernstein, L. Mcdougall, and A. A.
Adesiyan. 2000. Microbial quality of water in rural communities in Trinidad. Rev. Panam. Salud.
Publica. 8: 172-180.
296. Weissman, J. B., G.F. Craun, D. N. Lawrence, R. A. Pollard, M. S. Saslaw, and E. J. Gangarosa.
1976. An epidemic of gastroenteritis traced to a contaminated public water supply. Am. J.
Epidemiol. 103: 391-398.
297. Wheeler, A. L., P. G. Hartel, D. G. Godfrey, J. L. Hill, and W. I. Segars. 2002. Potential of
Enterococcus faecalis as a human fecal indicator for microbial source tracking. J. Environ. Qual.
31: 1286-1293.
298. WHO. 1993. Guidelines for Drinking Water Quality, Second Edition, Volume 1
Recommendations. World Health Organization, Geneva.
299. Whitlock, J. R., D.T. Jones, and V. J. Harwood. 2002. Identification of the sources of fecal
coliforms in an urban watershed using antibiotic resistance analysis. Water Res. 36: 4273-
4282.
300. Whitehead J. H., and P. M. Geary. 2000. Geotechnical aspects of domestic on-site effluent
management systems. Aust. J. Earth Sci. 47: 75-82.
301. Whittam, T. S. 1989. Clonal dynamics of Escherichia coli in its natural habitat. Antonie Van
Leeuwenhoek. 55: 23-32.
302. Wiggins, B. A. 1996. Discriminant analysis of antibiotic resistance patterns in fecal
streptococci, a method to differentiate human and animal sources of fecal pollution in natural
waters. Appl. Environ. Microbiol. 62:3997-4002.
303. Wiggins, B. A, R. W. Andrews, R. A. Conway, C. L. Corr, E. J. Dobratz, D. P. Dougherty, J. R.
Eppard, S. R. Knupp, M. C. Limjoco, J. M. Mettenburg, J. M. Rinehardt, J. Sonsino, R. L.
Torrijos, and M. E. Zimmerman. 1999. Use of antibiotic resistance analysis to identify non-
point sources of fecal pollution. Appl. Environ. Microbiol. 65: 3483-3486.
304. Wiggins, B. A., P.W. Cash, W.S. Creamer, S. E. Dart, P.P. Garcia, T. M. Gerecke, J. Han, B.L.
Henry, K.B. Hoover, E. L. Johnson, K.C. Jones, J. G. McCarthy, J.A. McDonough, S.A. Mercer,
M.J. Noto, H. Park, M.S. Phillips, S.M. Purner, B.M. Smith, E.N. Stevens, and A.K. Varner.

152
2003. Use of antibiotic resistance analysis for representativeness testing of multi-watershed
libraries. Appl. Environ. Microbiol. 69: 3399-3405
305. Wyer, M. D., D. Kay, J. Crowther, J. Whittle, A. Spence, V. Huen, C. Wilson, P. Carbo, and J.
Newsome. 1998. Faecal indicator-budgets for recreational coastal waters: a catchment
approach. J. Chartered Inst. Wat. Environ. Manage. 12: 414-424.
306. Yates, M. V. 1985. Septic tank density and ground-water contamination. Ground Water. 23:
586-591.
307. Yates, M.V. and S.R. Yates. 1998. Septic tank setback distances: A way to minimize virus
contamination of drinking water. Groundwater. 27: 853-864.
308. Zelazny, L. W., D .A. Lietzke, and H. L. Barwood. 1980. Evaluation of septic tank drainfield
failures and a result of soil mineralogical changes, VA. Water Res. Bull. 124.

153