hot surface ignition temperature of dust ... surface ignition temperature of dust layers with and...
TRANSCRIPT

HOT SURFACE IGNITION TEMPERATURE OF DUST LAYERS
WITH AND WITHOUT
COMBUSTIBLE ADDITIVES
by
Haejun Park
A Thesis
Submitted to the Faculty
of the
WORCESTER POLYTECHNIC INSTITUTE
in partial fulfillment of the requirements for the
Degree of Master of Science
in
Fire Protection Engineering
May 2006
APPROVED:
Professor Robert G. Zalosh, Advisor
Joseph A. Senecal, Kiddie-Fenwal, Inc., Co-advisor
Professor Kathy A. Notarianni, Head of Department
Abstract
An accumulated combustible dust layer on some hot process equipment
such as dryers or hot bearings can be ignited and result in fires when the hot
surface temperature is sufficiently high. The ASTM E 2021 test procedure is often
used to determine the Hot Surface Minimum Ignition Temperature for a half inch
deep layer of a particular dust material. This test procedure was used in this thesis
to study possible effects of combustible liquid (such as lubricating oil) and powder
additives in the dust layer as well as air flow effects.
The following combustible dusts were used: paper dust from a printing
press, Arabic gum powder, Pittsburgh seam coal, and brass powder. To develop an
improved understanding of the heat transfer, and oxygen mass transfer phenomena
occurring in the dust layer, additional instrumentation such as a second
thermocouple in the dust layer, an oxygen analyzer and gas sampling line, and an
air velocity probe were used in at least some tests.
Hot Surface Minimum Ignition temperatures were 220oC for Pittsburgh
seam coal, 360oC for paper dust, 270 for Arabic gum powder, and > 400℃ oC for
brass powder. The addition of 5-10 weight percent stearic acid powder resulted in
significantly lower ignition temperature of brass powder. When combustible liquids
were added to the dust layer, the ignition temperatures did not decrease regardless
of the liquids’ ignitibility because the liquids seemed to act as heat absorbents.
Although air velocity on the order of 1 cm/s did not affect test results, much larger
ii

air velocities did affect the results. With 33 cm/s downward airflow at the elevation
of the surface of the layer, Pittsburgh seam coal was not ignited at 230 which was ℃
10 higher than the 220 hot surface ignition temperature without airflow. Based ℃ ℃
on the results and data from the additional instrumentations, modifications of the
ASTM E2021 test procedure are recommended.
iii
Acknowledgement
I heartily thank my parents and family. As farmers, they must have had
hard times both in physically and financially. They were willing to support me
when I decided to study abroad and have prayed for my health and safety more
than anyone else.
I would like to thank my academic and thesis advisor, Professor, Robert G.
Zalosh, for his excellent guidance and support. He has shown concrete trust on me
throughout the period while I have worked on the tests and thesis write-up. He
provided me with scholarships and helped me not to suffer financial hardship. He
supported me not only financially but also spiritually. His work ethic and passion
for the field of fire protection engineering at his old age has been always a good
motivation to me, and even more I thought him as a role model in my life. Now he
is retiring at the end of this semester, 2006 fall, giving me the honor to be his last
M.S. thesis student, I truly want to pray for his health for the rest of his life.
I also would like to thank Dr. Joseph A. Senecal of Kidde-Fenwal, Inc.,
thesis co-advisor, for reviewing my thesis and giving me good advice on the test
procedures and the results.
I also want to thank all other FPE professors and staffs for their
professionalism and support for students.
iv
Table of contents
Abstract......................................................................................................................................... ii
Acknowledgement ....................................................................................................................... iv
Table of contents........................................................................................................................... v
Nomenclature.............................................................................................................................. vii
List of tables...............................................................................................................................viii
List of figures ............................................................................................................................... ix
1. Introduction............................................................................................................................ 13
2. Literature review.................................................................................................................... 15
2.1. Previous study of hot surface ignition.......................................................................................... 15
2.2. ASTM E 2021-01, IEC 61241-2-1 and other test methods .......................................................... 18
2.3. Ignition Handbook by Vytenis Babrauskas .................................................................................. 21
2.4. Self heating, and Frank-Kamenetskii’s theory ............................................................................. 23
2.4.1. Self-heating theory............................................................................................................ 23
2.4.2. Steady state theory for symmetrically cooled bodies ........................................................ 25
2.4.3. Steady state theory for unsymmetrically cooled bodies .................................................... 27
3. Problem statement and assumptions .................................................................................... 29
3.1. Problem statement........................................................................................................................ 29
3.2. Assumptions................................................................................................................................. 31
4. Testing ..................................................................................................................................... 32
4.1. Test objectives.............................................................................................................................. 32
4.2. Test description ............................................................................................................................ 33
4.2.1. Equipment layout .............................................................................................................. 33
4.2.2. Test procedure ................................................................................................................... 38
4.2.3. Test environment............................................................................................................... 39
4.3. Uncertainty and experimental error ............................................................................................. 40
4.3.1. Test equipment inherent errors.......................................................................................... 40
4.3.2. Experimental errors........................................................................................................... 46
4.4. Test material properties ................................................................................................................ 50
4.4.1. Dust................................................................................................................................... 50
4.4.2. Combustible liquids and contaminants ............................................................................. 51
4.5. Preliminary test ............................................................................................................................ 53
v

4.5.1. Pittsburgh seam coal ......................................................................................................... 56
4.5.2. Brass powder..................................................................................................................... 59
4.5.3. Analysis and summary ...................................................................................................... 59
4.6. Ignition temperatures of dust alone.............................................................................................. 60
4.6.1. Newspaper dust................................................................................................................. 60
4.6.2. Gum Arabic powder .......................................................................................................... 65
4.6.3. Analysis and summary ...................................................................................................... 69
4.7. Ignition temperatures of dust with combustible liquids ............................................................... 71
4.7.1. Newspaper dust................................................................................................................. 71
4.7.2. Gum powder with ketone-based liquid solution ............................................................... 87
4.7.3. Analysis and summary ...................................................................................................... 93
4.8. Comparisons of ignition temperatures with and without combustible liquids ............................. 95
4.8.1. Newspaper dust................................................................................................................. 95
4.8.2. Gum Arabic powder ........................................................................................................ 101
4.9. Ignition temperature of Brass powder with stearic acid............................................................. 103
4.10. Oxygen concentration in the Pittsburgh seam coal layer ......................................................... 109
4.10.1. When ignition occurred..................................................................................................112
4.10.2. When ignition did not occur...........................................................................................115
4.10.3. Analysis and summary ...................................................................................................116
4.11. Air flow effects on ignition temperature of Pittsburgh seam coal layer ....................................119
4.11.1. Without air flow, and with inherent air flow on the bench ............................................ 123
4.11.2. With downward air flow................................................................................................ 125
4.11.3. Analysis and summary .................................................................................................. 127
5. Application of test results to ASTM E2021 Standard ....................................................... 128
6. Conclusions and Recommendations ................................................................................... 131
References ................................................................................................................................. 134
Appendix A ............................................................................................................................... 136
Appendix B ............................................................................................................................... 142
vi

Nomenclature
ρ material density (kg/m3)
Q heat of reaction (kJ/kg)
A pre-exponential factor (/s)
E apparent activation energy (kJ/mol)
R universal gas constant (=8.314 J/mol-K)
h convective heat transfer coefficient (kW/m2-K)
k bulk thermal conductivity (kW/m-K)
Ts layer surface temperature (K)
T0 ambient air temperature (K)
Th hot plate temperature (K)
Tm maximum layer temperature (K)
C1 integration constant
C2 integration constants
x distance from the reference point in the slab
θ non-dimensional parameter for T
z non-dimensional parameter for x
δ non-dimensional parameter for heat generation rate
vii
List of tables
Table 1 : Results of some dust layer ignition tests conducted by Bowes .................................... 21
Table 2 : Single-drop hotplate ignition temperatures found by Krasawa et al. ........................... 22
Table 3 : Ignition of spills of turbine oil on a hot surface ........................................................... 22
Table 4 : Comparison of test equipment inherent errors and ASTM requirements ..................... 45
Table 5 : Average amount of dust to fill half of the ring (0.5 inch thick) .................................... 46
Table 6 : Summary of dust properties and provider .................................................................... 50
Table 7 : Flash point and Auto Ignition Temperatures of liquids ................................................ 52
Table 8 : Max. temperatures of paper dust (3g) with ink (3g) at different hot plate temperatures
............................................................................................................................................ 78
Table 9 : Comparison of ignition temperatures of paper dust mixture........................................ 93
Table 10 : Summary of other test results of gum powder mixture .............................................. 94
Table 11 : Dust particles’ volume fraction and bulk density ....................................................... 96
Table 12 : Summary of brass powder (30g) with different amount of stearic acid addition at
400℃ ................................................................................................................................ 104
viii
List of figures
Figure 1 : IEC 62141-10 Maximum allowable surface temperature........................................... 19
Figure 2 : Heat losses and gains, as represented in the Semenov theory .................................... 23
Figure 3 : The geometry of a self-heating, in the form of a symmetric slab ............................... 25
Figure 4 : The geometry of a self-heating, in the form of unsymmetrically cooled slab ............ 27
Figure 5 : Equipment layout on the test bench in the fire science lab......................................... 33
Figure 6 : Process and Instrument diagram................................................................................. 34
Figure 9 : Temperature controller, hot plate, and Solid State Relay layout................................. 37
Figure 10 : Hot plate temperature deviation at 225℃................................................................. 41
Figure 11 : Hot plate temperature deviation at 325℃ ................................................................. 42
Figure 12 : Temperature distributions when hot plate temperatures are at 225 and 325℃ ℃ ..... 42
Figure 13 : Thermocouple position for the hot plate temperature............................................... 43
Figure 14 : Hot plate temperature when dust layer was placed on it .......................................... 44
Figure 15 : Dust layer temperatures of Pittsburgh seam coal at 210℃ ....................................... 48
Figure 16 : Comparison of dust layer temperatures without airflow and on the bench at 210℃ 49
Figure 17 : Pittsburgh seam coal at 210℃ .................................................................................. 54
Figure 18 : Pittsburgh seam coal at 210 for the first 200 sec℃ .................................................. 55
Figure 19 : Cracks in the Pittsburgh seam coal dust layer when ignition occurred..................... 57
Figure 20 : Pittsburgh seam coal at 210℃ .................................................................................. 58
Figure 21 : Pittsburgh seam coal at 220℃ .................................................................................. 58
Figure 22 : Paper dust layer right after being leveled at 350℃................................................... 60
Figure 23 : Paper dust layer temperature at 350℃...................................................................... 62
Figure 24 : Chars formed on the bottom of paper dust layer at 350℃........................................ 63
Figure 25 : Paper dust layer temperature at 360℃...................................................................... 63
ix

Figure 26 : Glowing in the paper dust layer at 360℃ ................................................................. 64
Figure 27 : Paper dust at the end of test at 360℃ ....................................................................... 64
Figure 28 : Gum powder dust layer temperature at 260℃.......................................................... 66
Figure 29 : Cracks in the gum powder dust layer at 260℃......................................................... 67
Figure 30 : Gum powder dust layer temperature at 270℃.......................................................... 67
Figure 31 : Glowing in the gum powder dust layer at 270℃...................................................... 68
Figure 32 : Gum powder dust layer at the end of test at 270℃ .................................................. 68
Figure 33 : Paper dust (3g) with Citgo oil (3g) at 400℃ ............................................................ 72
Figure 34 : Paper dust (3g) with Citgo oil (3g) at 400 , early st℃ age ......................................... 72
Figure 35 : Paper dust (3g) with Citgo oil (3g) at 400 , at the end of test℃ ................................ 73
Figure 36 : Paper dust (3g) with DTE24 (3g) at 400℃ .............................................................. 75
Figure 37 : Paper dust (3g) with DTE24 (3g) at 400 , early stage℃ ........................................... 75
Figure 38 : Paper dust (3g) with DTE24 (3g) at 400 , at the end of test℃ .................................. 76
Figure 39 : Paper dust (3g) with newspaper printing ink (3g) at 340℃...................................... 78
Figure 40 : Paper dust (3g) with newspaper printing ink (3g) at 350℃...................................... 79
Figure 41 : Paper dust (3g) with newspaper printing ink (3g) at 350 , at the end of test℃ ......... 79
Figure 42 : Paper dust (3g) with newspaper printing ink(3g) at 360℃....................................... 80
Figure 43 : Paper dust (3g) with newspaper printing ink (3g) at 360℃...................................... 80
Figure 44 : Paper dust (3g) with n-decane (3g) at 350℃ ............................................................ 82
Figure 45 : Paper dust (3g) with n-decane (3g) at 360℃ ............................................................ 82
Figure 46 : Paper dust (3g) with n-decane (3g) at 360℃ ............................................................ 83
Figure 47 : Paper dust (3g) with kerosene (3g) at 360℃ ............................................................ 85
Figure 48 : Paper dust (3g) with kerosene (3g) at 370℃ ............................................................ 85
Figure 49 : Paper dust (3g) with kerosene (3g) at 370℃ ............................................................ 86
Figure 50 : Gum powder (20g) with ketone-based liquid solution (1g) at 270℃ ....................... 88
Figure 51 : Gum powder (20g) with ketone-based liquid solution (4g) at 270℃ ....................... 89
x

Figure 52 : Gum powder (20g) with ketone-based liquid solution(1g) at 270 , early s℃ tage ..... 89
Figure 53 : Gum powder (20g) with ketone-based liquid solution (1g) at 270 , at the end of test℃
............................................................................................................................................ 90
Figure 54 : Gum powder (20g) with ketone-based liquid solution (2g) at 280℃ ....................... 90
Figure 55 : Gum powder (20g) with ketone-based liquid solution (4g) at 280℃ ....................... 91
Figure 56 : Gum powder (20g) with ketone-based liquid solution (2g), ignition ....................... 91
Figure 57 : Gum powder (20g) with ketone-based liquid solution (2g), at the end of test.......... 92
Figure 58 : Paper dust (3g) alone and with ink (3g) at 6mm high at 350℃................................ 97
Figure 59 : Paper dust (3g) alone and with ink (3g) at 6mm high at 360℃................................ 98
Figure 60 : Paper dust (3g) with Citgo oil (3g) and DTE 24 (3g) at 400℃ ................................ 98
Figure 61 : Paper dust (3g) alone, with ink (3g), and kerosene (3g) at 360 , first 600s℃ ........... 99
Figure 62 : Gum powder (20g) alone and with ketone-based liquid (4g) at 3mm high at 270℃
.......................................................................................................................................... 102
Figure 63 : Gum powder (20g) alone and with ketone-based liquid (2g) at 3mm high at 280℃
.......................................................................................................................................... 102
Figure 64 : Brass powder (30g) with stearic acid (3g) at 170℃ ............................................... 105
Figure 65 : Brass powder (30g) with stearic acid (3g) at 180℃ ............................................... 106
Figure 66 : Brass powder (30g) with stearic acid (0.6g) at 400℃ ............................................ 106
Figure 67 : Brass powder (30g) with stearic acid (1.2g) at 400℃ ............................................ 107
Figure 68 : Brass powder (30g) with stearic acid (1.8g) at 400℃ ............................................ 107
Figure 69 : Brass powder (30g) with stearic acid (3g) at 400℃ ............................................... 108
Figure 70 : At the end of test of brass powder with 4% stearic acid at 400℃ .......................... 108
Figure 71 : Oxygen analyzer......................................................................................................111
Figure 72 : Brass tube coved by thermocouple cover at 6mm above the hot plate ....................111
Figure 73 : Oxygen concentration at 6mm high, Pittsburgh seam coal at 230℃ .......................113
Figure 74 : Pittsburgh seam coal when ignition occurred ..........................................................114
xi

Figure 75 : Oxygen concentration at 6mm high, Pittsburgh seam coal at 220℃ .......................115
Figure 76 : Oxygen concentrations and temperatures at 6mm above the hot plate....................118
Figure 77 : Downward air flow on the hot plate ........................................................................119
Figure 78 : nozzle shape and air distribution pattern from the nozzle ...................................... 120
Figure 79 : Air flow velocity measurement............................................................................... 121
Figure 80 : Pittsburgh seam coal without air flow at 220℃...................................................... 124
Figure 81 : Pittsburgh seam coal temperatures at 6mm high with and w/o air flow at 220℃ .. 124
Figure 82 : Comparison of dust layer at 6mm high with and without air flow at 220℃ .......... 126
Figure 83 : Pittsburgh seam coal with 15SLPM downward air flow on the bench at 230℃ .... 126
xii

1. Introduction
Hot surface ignition temperatures of dust layers refer the minimum surface
temperatures which can ignite a certain thickness of dust layers. It has been an issue
quite a long time in the fire protection engineering field, since layers of small particles
can be easily observed in the coal processing industry, furniture making plant, paper
processing plant, and any facilities having hot processes dealing with small particles.
Ignition in dust layers can even develop into dust explosions if proper confinement
and lifting momentum forming dust clouds are provided. Since dust layers can act as
a fuel or explosion medium easily, research has been focused on dusts’ ignitability.
However, in some cases, the cause of a fire is not dust alone, but the mixture of
combustible liquids. Some combustible liquids such as lubricants, coolants, and grease
are not intended to be mixed with dust and others such as adhesives with wood
particles or sawdust in furniture making facility are.
For example, there was a real fire related to the hot surface ignition of a dust
layer with combustible liquids in a printing press machine. Paper dusts had been
accumulated on a bearing and printing ink infiltrated to the casing gap. The dust
layer on the bearing ignited causing a fire. The bearing worked as a hot surface and
printing ink or certain lubricants acted as added combustible liquids. In this accident
not only the dust layer but also the printing ink affected the ignition and subsequent
fire development (N. Jackson, 2004).
Other fire scenarios are also possible. In veneer board manufacturing facilities,
13

if the temperature of a hot plate compressor or pressing roller is uncontrolled,
sawdust layer can ignite with gluing bond. Although the temperature controller works
properly, the ignition might occur, since the mixture of dust and combustible liquids
might have lower ignition temperature than dust alone or liquid alone. Unexpected
combustible liquids can be involved in the dust processing and vice versa.
14

2. Literature review
2.1. Previous study of hot surface ignition
Hot surface ignition temperatures of dust layers have been researched
especially by the Bureau of Mines and two major papers were published by Yael
Miron and Charles P. Lazzara(1988), and P.C. Bowes and S.E. Townshend(1962).
Yael Miron and Charles P. Lazzara used three types of dust materials: fuels,
agricultural dusts, and metal dusts. Coal and oil shale for fuels, lycopodium,
cornstarch, and grain dust for agricultural dusts, and brass powder for metal
dusts were tested. They analyzed the dust layer ignition temperatures based on
the three different aspects: nature of dust, dust layer thickness and particle size.
For the nature of dust, composition of each dust was briefly reviewed and
linked to the ignition patterns. In case of coal, it is composed of organic and
intertwined inorganic matter and its ignition is a slow, smolder type. Its volatile
contents are also very important factor in terms of ignition temperature; the more
volatile matter is included, the lower the ignition temperatures are.
For the three agricultural materials, lycopodium reacted similarly to coals,
with smolder type ignition. However, cornstarch and grain dust formed char
deterring decomposition of other dust particles and then developed to glowing
combustion. The coated brass powder with stearic acid or metal stearates showed
lower ignition temperature than the other dusts.
For layer thickness, Miron and Lazzara found that the thicker the layer is, the
15
lower the ignition temperature is. As a dust layer thickness increases, the
temperature gradient in the dust layer becomes smaller, which reduces the
conduction rate consequently. This results in the local temperature increases,
exothermic reaction, and ignition at lower temperature of hot plate.
About the particle size, the more complete oxidation occurred in smaller
particle until a certain critical size. If the particle size is much bigger, surface area
and rated combustion are too small to overcome the rate of heat dissipation.
P. C. Bowes and S. E. Townshend wrote the paper in 1962 and provided more
theoretical aspects on hot surface ignition than Miron and Lazzara’s paper. They
used sawdust and test method was different in that dust layer was put on the hot
plate from the beginning of the test and heated up. The test purpose with sawdust
was to see the effects of layer depth, particle size, and packing density and
furthermore the thermal combustion theory which used Frank-Kamenetskii’s
exponential approximation for Arrhenius equation was compared with test data.
The results were that the dust layer depth is the most important factor
affecting the ignition temperature and particle size is not important and packing
density affected the ignition temperatures of only thin layers. The accordance of
test data to the combustion theory was satisfactorily the level of acceptance for
most practical purposes.
B. J. Tyler and D. K. Henderson (1987) used sodium dithionite to identify the
controlling parameters from both computational and analytical self-heating
model. They introduced exothermicity of the test material controlled by the
16
addition of different amount of inert material, with which each model’s results
were evaluated. With high exothermic material matched better the two models
and less correspondence was observed in low exothermicity. They used 75mm
diameter rings having 5 to 40mm heights to hold dust layers. One interesting test
they conducted was to provide air flow. They provided downward air flow at the
rate of 35dm3/min on the dust layer through a glass tube having 1 mm marginal
gap all around the ring. With the provision of 35dm3/min downward air flow,
ignition temperature of 20mm layer was 168 compared to 175 with the ℃ ℃
downward air flow and background temperature decrease just above the dust
layer was recorded from 60 to 35 . ℃ ℃
17
2.2. ASTM E 2021-01, IEC 61241-2-1 and other test methods
ASTM E2021-01 depicts the standardized test method of hot surface ignition
temperature of dust layers. The test method used for this thesis was not much
different from ASTM E2021, since the test purpose is to see if there are ignition
temperatures’ differences with addition of combustible liquids and solids to the
dust layers.
IEC 61241-2-1, Electrical apparatus for use in the presence of combustible
dust - methods for determining the minimum ignition temperatures of dust, also
described the test method for hot surface ignition temperatures of dust layers.
Both ASTM and IEC use 4 inch inner diameter ring in which dusts are filled
and 8 inch diameter of hot plate. Compression to the test material inside the ring
is not applied in both cases. However, there are different criteria for the dust
particle size, layer thickness and ignition symptom.
In ASTM E2021, dust particle size for this test method should be smaller than
75 ㎛ which corresponds to the standard sieve number 200, and IEC requires
100% of particles should be smaller than 200 ㎛ which approximately sieve
number 80. Therefore, ASTM E2021 asks to use particles below mesh 200 sieve
and IEC does below mesh 80 sieve. About the layer thickness, 12.7 mm (1/2 inch)
is applied for ASTM E2021 and other depths can also be used, and 5mm in
priority and 12.5 mm or 15 mm can be used as options for IEC. As previously
reviewed in 2.1, layer thickness is very important factor in deciding hot surface
ignition temperature. The thicker the layers are, the lower the ignition
18
temperatures are.
Ignition temperature criterion is also different between these two test methods.
ASTM accepts glowing, flaming or a temperature rise more than 50℃ above hot
plate surface temperature and IEC does glowing, flaming, a temperature of 450 , ℃
or a temperature more than 250 above the hot plate surface temperature. ℃
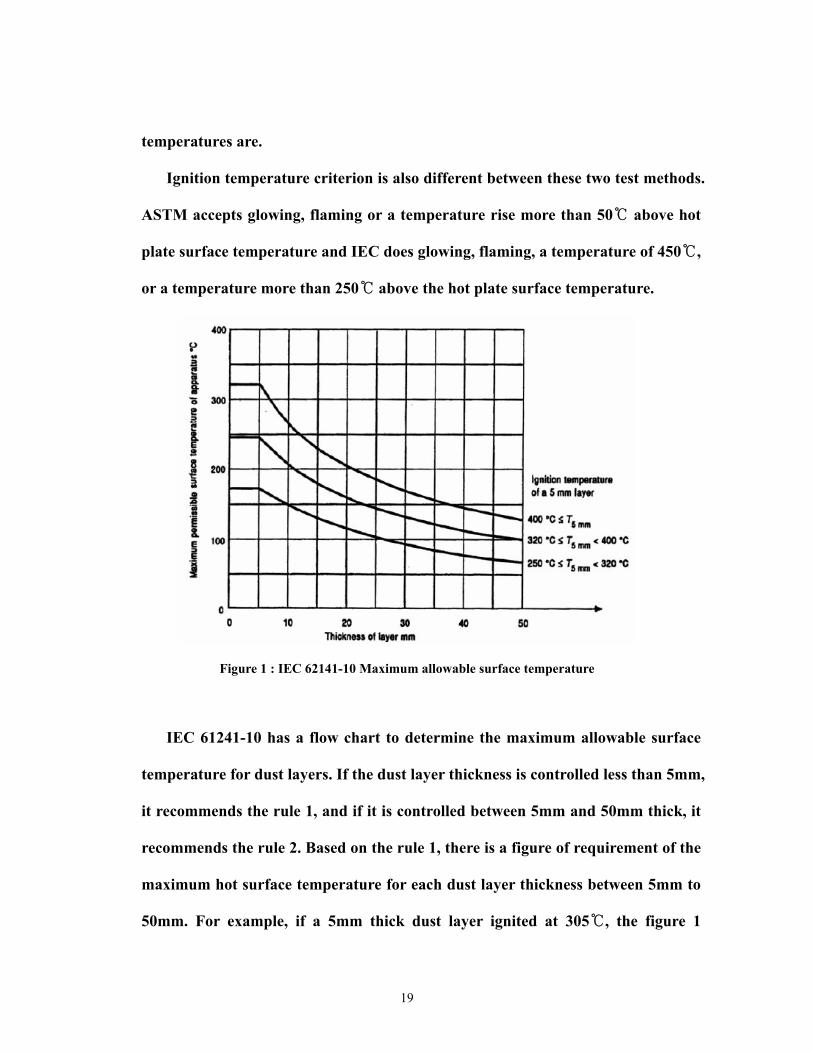
Figure 1 : IEC 62141-10 Maximum allowable surface temperature
IEC 61241-10 has a flow chart to determine the maximum allowable surface
temperature for dust layers. If the dust layer thickness is controlled less than 5mm,
it recommends the rule 1, and if it is controlled between 5mm and 50mm thick, it
recommends the rule 2. Based on the rule 1, there is a figure of requirement of the
maximum hot surface temperature for each dust layer thickness between 5mm to
50mm. For example, if a 5mm thick dust layer ignited at 305 , the figure 1 ℃
19

dictates the maximum hot surface temperature for 10mm thick layer is 150 and ℃
for 30mm is 95 . However, Lunn et al℃ . (2001) have confirmed that these
extrapolated values are very conservative with large safety margin between the
actual hot surface minimum ignition temperatures and the maximum allowable
surface temperatures.
Lunn et al. (2001) also developed a test method for dust piles deeper than
50mm from IEC 61241-10. Four liters of dust particles were piled on the heating
block via a funnel located 14 cm above the heating block. The block’s dimension is
20cm by 10cm by 5cm. The block is connected to the electricity, and its
temperature was controlled. This method was developed for the applications in
which dust layer thickness can not be controlled or larger than 5mm. Dust’s
maximum pile height forming a cone shape depends on the material’s cohesivity.
For example, for 125mm of dust layer in height on the block, 1.5 liters were taken
for sawdust, but 10 liters were taken for coal. Through this test method, 25 ㎛
sawdust was ignited at 230 compared to 340 at which 5mm thick saw dust ℃ ℃
layer was ignited on a hot surface based on the IEC 61241-2. The layer thickness
was verified as a very important factor in hot surface ignition temperature test as
consistent with other researcher’s test results.
20

2.3. Ignition Handbook by Vytenis Babrauskas
Ignition Handbook written by Vytenis Babrauskas contains useful information
of various ignition types and test data. Hot surface ignition of dust layers and
liquid fuels is also dealt with in detail. Theoretical aspects of hot surface ignition
as well as empirical test data are also included.
About the hot surface ignition of dust layers, it cites test results from the paper
of Bowes, and the Bureau of Mines. Hot surface ignition temperature test data
with beech sawdust, coal, cork, and lycopodium shows that the thicker the layer
depth, the lower the ignition temperatures are. This test results are not different
from the previous two papers.
Table 1 : Results of some dust layer ignition tests conducted by Bowes
Ignition temperature(℃) Layer depth
(mm) Beech sawdust Coal Cork Lycopodium
5 350 235 350 283
10 315 205 315 261
20 285 173 280 217
Hot surface ignition of combustible liquids is also studied in this book. It cites
the test results from the paper of Karasawa et al. (1986), which is single drop hot
plate ignition temperature of various combustible liquids.
21

Hot surface ignition temperatures are typically 200~300℃ above the Auto
Ignition Temperatures for the liquids listed above. The reason hot surface ignition
temperatures are higher than AIT is because it loses heat energy in the form of
convection to the surrounding air as opposed to AIT. AIT is surrounded by
uniform temperature environment, so that uniform heat flux is provided from all
directions. The amount of liquids on a hot surface is also another variable. From
the Knowles’ test (1965), as the amount of liquid (turbine oil) on a hot surface
increases, the hot surface ignition temperature decreases.
Table 2 : Single-drop hotplate ignition temperatures found by Krasawa et al.
Diethyl ether n-butanol heptane methanol ethanol
AIT(℃) 195 345 223 470 365
Hot surface Ignition temp. ( )℃
670 650 670 690 717
Table 3 : Ignition of spills of turbine oil on a hot surface
2drops 5ml 30~60ml
Ignition temp. (℃) 450 380 315
In this thesis, two lubricating oils (DTE 24, Citgo oil) and two highly
combustible liquids (n-decane, kerosene) were tested with paper dust. The hot
surface ignition temperatures of kerosene and lubricating oil are cited from the
Skull’s test (1951), and it says, 650 for kerosene and 430 for lubricating oils, ℃ ℃
although it does not inform the amount of liquids dropped on the hot plate and the
specification of the lubricating oil.
22
2.4. Self heating, and Frank-Kamenetskii’s theory
2.4.1. Self-heating theory
heat
gen
erat
ion
or lo
ss ra
te(W
)
Heat generation
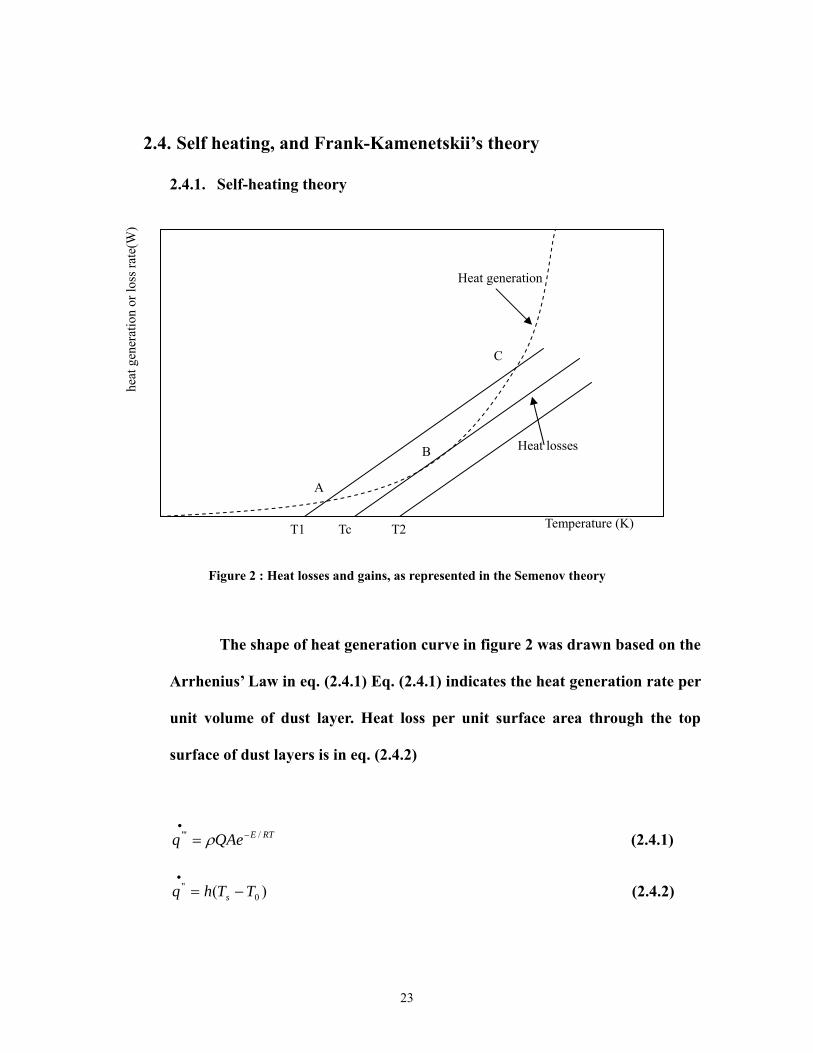
Figure 2 : Heat losses and gains, as represented in the Semenov theory
The shape of heat generation curve in figure 2 was drawn based on the
Arrhenius’ Law in eq. (2.4.1) Eq. (2.4.1) indicates the heat generation rate per
unit volume of dust layer. Heat loss per unit surface area through the top
surface of dust layers is in eq. (2.4.2)
RTEQAeq /''' −•
= ρ (2.4.1)
)( 0'' TThq s −=
•
(2.4.2)
T1 Tc T2
Heat losses
C
B
A
Temperature (K)
23
When the hot plate temperature is below Tc, heat loss through
convection on the dust layer surface is larger than heat generation inside the
dust layer. Therefore, no thermal runaway which is ignition occurs. However,
if the hot plate temperature is slightly higher than Tc, heat generation will be
larger than heat loss. This corresponds to the hot surface ignition
temperature of the dust layer.
If the hot plate temperature is set below T1, the dust layer
temperature will increase gradually and asymptotically approach to the
equilibrium temperature between heat generation and heat loss
corresponding to the point A. If the hot plate temperature is set between T1
and Tc, the dust layer temperature will increase a little bit more than
equilibrium temperature but return to the equilibrium temperature making
small hump before steady state since heat loss is larger than heat generation.
However, if the hot plate temperature is set above Tc, the dust layer
temperature will increase continuously and reach ignition.
Theoretically, when the hot plate temperature is at Tc, the dust layer
temperature would reach ignition at infinite time, however, in real situation,
small increase of heat generation will lead ignition, although there is some
period of steady state condition before ignition. Temperature slightly above
Tc will be the minimum hot surface ignition temperature of dust layers.
24

2.4.2. Steady state theory for symmetrically cooled bodies
Tp
Ts
T0
x=0 x=r
Figure 3 : The geometry of a self-heating, in the form of a symmetric slab
dtdTCq
dxTdk ρ=+
•'''
2
2
(2.4.3)
•
=− '''2
2
qdx
Tdk (2.4.4)
RTEQAeq /''' −•
= ρ (2.4.1)
)( 0'' TThq s −=
•
(2.4.2)
)( 0TThdxdTk s −=− , x = r (2.4.5)
)( 0TThdxdTk s −= , x = -r (2.4.6)
25

For ,10
>>RTE
⎥⎦
⎤⎢⎣
⎡ −−≈
0
0
0
1T
TTRTE
RTE (2.4.7)
),( 020
TTRT
E−=θ (2.4.8)
,rxz =
0/2
20
RTEekQAr
RTE −=
ρδ (2.4.9)
[ ])22/1cosh(ln21ln CCzC +−= δθ (2.4.10)
Eq. (2.4.3) is the governing equation of heat transfer in slab analysis
and eq. (2.4.4) is in steady state condition. Applying eq. (2.4.2) to eq. (2.4.4)
leads eq. (2.4.5) and eq. (2.4.6), the boundary condition.
Non-dimensional parameters, θ, z, and δ are introduced for T, and x,
and heat generation rate respectively, and the solution of the steady state
equation in the form of temperature T is in eq. (2.4.10). However, the
important variable for this equation is not the temperature itself, but the δ,
since δ is the critical parameter whether ignition occurs or not. For δ< δc, no
ignition occurs, and for δ> δc, ignition occurs. The value of δc is the dependent
of only geometry of the concerned material. δc is 0.88 for slab shape, 2.0 for
infinite cylinder shape, and 3.32 for sphere.
26

2.4.3. Steady state theory for unsymmetrically cooled bodies
Tp
Th
Ts
T0
x=0 x=2r
Figure 4 : The geometry of a self-heating, in the form of unsymmetrically cooled slab
Section 2.4.2 was about a slab problem exposed to the uniform
environments. However, if one side of the slab is exposed to the constant heat
flux, which might be the hot plate, δc value is not the same for the
symmetrically cooled slab.
)(20
hTTRT
E−=θ (2.4.11)
hRTE
h
ekQAr
RTE /
2
2−=
ρδ (2.4.12)
δ is proportional to the r2. From the two drawing above, the highest
temperature in the symmetrically cooled bodies, when x=0 corresponds to the
point of Tm (approximately x=0) in the drawing above, and x=r in the first
drawing can corresponds to x=2r in second drawing. Therefore, δc value for
27

un-symmetrically cooled body is 4 times smaller than the case of
symmetrically cooled body, which is 0.22. Another different from
symmetrically cooled case is Th. Th is another variable in the equation for δ.
Therefore, δc in this case is not the only function of geometry, but also include
Th variable which is the hot plate temperature in our case. At a certain hot
plate temperature when δ< δc, ignition can not occur and a slight higher hot
plate temperature when δ> δc, ignition can occur. Specific value of δc will not
be measured, but Th will be decided based on the several tests in this paper.
28

3. Problem statement and assumptions
3.1. Problem statement
Combustible liquids can be often mixed with dust layers on a hot surface.
Motors used to drive a pump, or any type of mechanical equipment has lubricants
and nearby process oils can easily leak in many industrial facilities. There are
quite a lot of possible hot surfaces. It might be related to the interim works or
inherent process. If the industry deals with powder, or dust particles which might
be flour, paper dust, grain dust, or even metal dust, there is possibility of fire from
the mixture of dusts and combustible liquids.
The roles of combustible liquids in ignition or decomposition process of dust
particles are important. Ignition Handbook by Babrauskas states that usually hot
surface ignition temperatures of liquids are much higher than their flash points or
even auto ignition temperatures, because heat energy is not provided from all
direction in case of hot surface test. Heat is only provided from the bottom surface,
and upper surface of combustible liquids are open to air allowing loss of heat
energy via convection. However, what if combustible liquids are partially
contained by dust particles holding up heat energy inside dust layer otherwise
dissipated to the ambient air? What if catalytic chemical reaction occurs under a
high temperature between dust particles and combustible liquids? In these cases,
the ignition temperatures would decrease or time to ignition would become
shorter.
29

On the other hand, if combustible liquids take heat away from the dust layer
in the form of vaporization, or if combustible liquids help heat transfer better
than porous dust layer particle alone, or if the chemical reaction is anti-catalytic,
the ignition temperature would increase, or time to ignition would become longer.
Another question explored in this thesis is the effect of small concentration of
a second powder on the surface ignition of the primary powder. For example,
powdered brass is often coated with stearic acid for improved metallurgical
processing. Therefore, it is of interest to determine how the addition of stearic acid
affects the hot surface ignition temperature of brass powder.
30

3.2. Assumptions
Ignition temperature of a dust layer with addition of a combustible liquid
might increase or decrease compared to that of dust layer alone. If the ignition
temperature is increased, which means more heat flux is needed for ignition, the
combustible liquids would work as a heat sink or having some chemical effects
deterring decomposition or oxidation of dust particles. If the ignition temperature
decrease, mixed combustible liquids would work as a catalyst for exothermic
reactions or decreasing heat transfer loss. For example, combustible liquids
located between dust particles can hold heat provided by hot surface or generated
in the dust layer, and this accumulated heat energy would help ignition of the dust
layer at lower temperature of hot surface.
Time to ignition of dust layers might be increased since a certain portion of
heat provided from a hot plate would be taken away in the form of heat of
vaporization of combustible liquids. The longer the time to ignition is, the more
heat is taken away.
Similar consideration and questions are applicable to the addition of a second
powder, such as stearic acid addition to brass powder.
31

4. Testing
4.1. Test objectives
The first objective is to determine the effect of combustible liquid additives on
the measured hot surface ignition temperatures for various dust materials. Two
hydraulic oils, n-decane, and kerosene were mixed with paper dust, and ketone-
based liquid solution was mixed with Arabic gum powder for this objective.
Another part of this objective is to determine effects of powder additives.
Toward this end, different amounts of stearic acid powder were added to the brass
powder layer to check the differences of the hot surface ignition temperature of
brass powder.
The second objective is to develop an improved understanding of the heat
transfer and oxygen mass transfer phenomena that occur during the ASTM
E2021 test. In order to accomplish this objective, the tests were run with
additional instrumentation in at least some of the tests. The additional
instrumentation include a second thermocouple in the dust layer, an oxygen
analyzer and gas sampling line, and an air velocity probe.
32

4.2. Test description
4.2.1. Equipment layout
Test equipment consists of three major components; one is
temperature controlling devices including solid state relay, another is a hot
plate, and the other is a thermometer, and a computer to record the
temperature changes of thermocouples. Figure 5 shows the actual test
equipment arrangement on the test bench.
Figure 5 : Equipment layout on the test bench in the fire science lab
33

4.2.1.1. Process diagram
Hot plate
eC
Figure 6 : Process and Instrument diagram
A : Temperature controller, CN 8592, Omega engineering
(This is to control the hot plate temperature and maintain the
temperature at a set point during the test period)
B : SSR(Solid State Relay), SSRL240DC25, Omega engineering
(This is to turn it on/off the hot plate to control the temperature
cooperating with temperature controller of CN 8592)
C : Hot plate, ROPH-144, Omega engineering, Max. Temperature of
875℉(468℃)
D : Thermometer, HH506RA, Omega engineering
(This is to check the temperatures and transfer them to the computer
using its own temperature recording software)
D
d e SSR gA
C pow
er
B
h
A E
Computer Temperature controller
Thermometer
34

E : Computer : temperatures are recorded as a excel spreadsheet in the
computer.
e c
a
g
f
Figure 7 : Horizontal section of hot plate and thermocouple layout
b d
a : Hot plate, 8.5inch diameter (Omega engineering ROPH-144)
b : Round shape aluminum plate, 1 inch thick, 8 inch diameter
c : Ring, 4 inch inner diameter, 5inch outer diameter, with 8 slots (1/8 inch
width) to accommodate thermocouples at different heights (1/2, 3/4, 7/8,
15/16 inch depth from the top surface of the ring)
1 inch
4inch
5 inch
1/8 inch
Figure 8 : Aluminum ring with slots to accommodate thermocouples
35

d: Dust layer thermocouple
K)
e : Hot plate thermocouple (Omega engineering, CO1-
f : Insulating material, Cotronic’s 390 ceramic paper
g : Power Supply from SSR for hot plate
h : Power supply for temperature controller
36

Temperature controller input Power for temperature
Figure 9 : Temperature controller, hot plate, and Solid State Relay layout
4/A2- +3/A1
1/L1 2/L2 SSR(SSRL240DC25)
RTD O2 O1 ~
T/C + - + - L2 L1
controller
Hot plate ROPH-144
Thermocouple input
Normal electric wire
Power for hot plate
37
4.2.2. Test procedure
Test procedure for this topic is based on the ASTM E2021 standard
test procedure. First, for safety issues, fire gloves are ready near the test site
and fume hood is turned on. All equipment is plugged in and the intended
temperature is set on temperature controller. Aluminum ring and
thermocouples are positioned to the center of the hot plate and intended
height. Monitoring the temperature of the hot plate with temperature
controller, the thermocouples are checked to see whether they are working
properly. When the hot plate temperature reached the set point and is
stabilized, temperature recording software is run and the prepared dusts are
poured carefully inside the aluminum ring. The amount of dust is
predetermined. No compression is applied to the dust layer. The surface of
dust is equally leveled with small piece of aluminum foil. After the test, the hot
plate is turned off. Aluminum ring and dusts are removed a while after the
hot plate is turned off.
38

4.2.3. Test environment
Tests were conducted on the test bench in the fire science laboratory in
Higgins Laboratory of Worcester Polytechnic Institute. The ambient
temperature was usually maintained around 25℃. To minimize the air flow
near the hot plate, air conditioner was off and only fume hood located above
the test bench was on. The air flow due to the fume hood on was different
depending on the elevation above the test bench. For example, at 60 cm above
the bench, 30 cm/s sideward air flow was measured. However, at the top
surface of dust layer which was half inch above the hot plate surface, 0.5 cm/s
air flow was measured in the ring. The air flow effect on the ignition
temperature of dust layers was discussed further in section 4.11.
39

4.3. Uncertainty and experimental error
This thesis discusses the minimum ignition temperature of dust layer on a hot
surface with and without combustible liquids. With regard to this topic, ASTM
E2021 has specified the test method for “Hot-Surface Ignition Temperature of
Dust Layers” which is very similar with the test method adopted to this paper.
Therefore, most of the experimental procedure and uncertainty during the test
are extracted from ATSM E2021.
4.3.1. Test equipment inherent errors
ASTM 2021 states several requirements of test apparatus.
4.3.1.1. The hot plate temperature should be maintained constantly
within ±5 throughout the time period of the test. ℃
4.3.1.2. Once the hot plate temperature reaches a set point temperature,
the temperature across the plate should be in the range of ±5 .℃
4.3.1.3. The hot plate temperature change should be within ±5 during ℃
the placing of the dust layer on the hot plate and should be restored
within 2 of the previous temperature within 5 minutes of placing the ℃
dust layer.
4.3.1.4. Thermocouple and its readout device should be calibrated, and
should be accurate to within ±3 .℃
4.3.1.5. About 4.3.1.1, temperature deviations of hot plate over the test
period, up to one hour, at a set temperature were measured. At two
different temperature ranges as above, and the error was found within
40
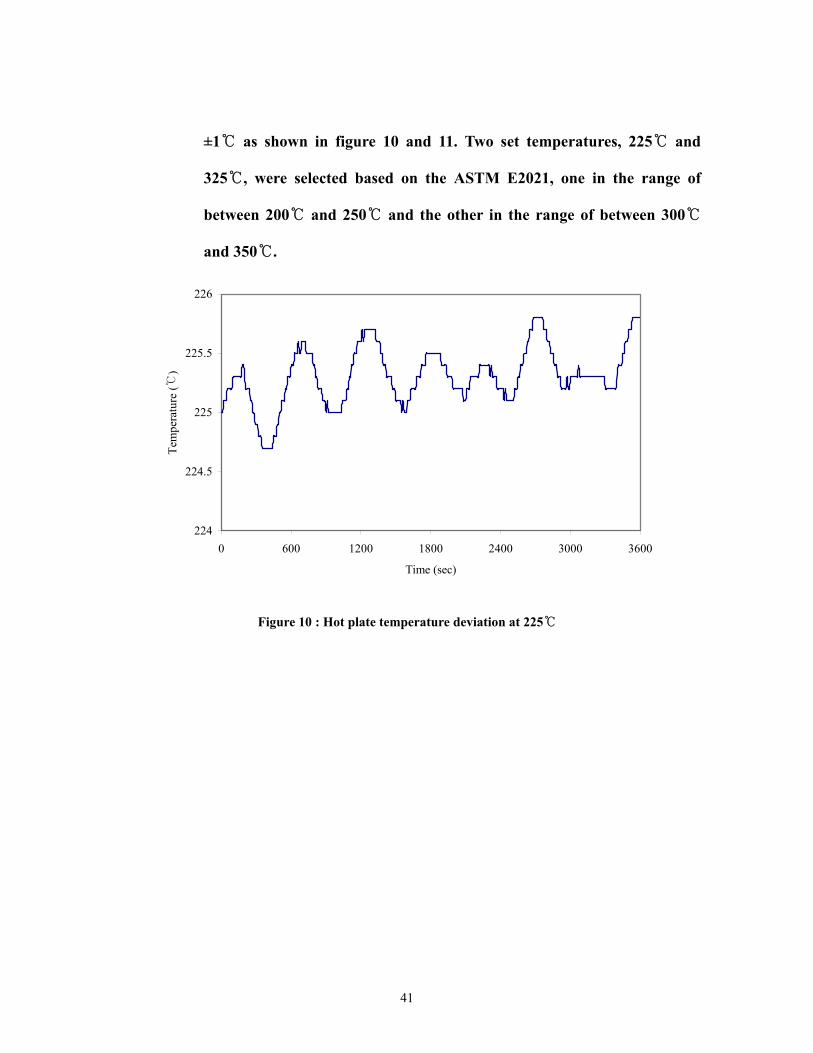
±1℃ as shown in figure 10 and 11. Two set temperatures, 225℃ and
325℃, were selected based on the ASTM E2021, one in the range of
between 200℃ and 250℃ and the other in the range of between 300℃
and 350℃.
224
224.5
225
225.5
226
0 600 1200 1800 2400 3000 3600
Time (sec)
Tem
pera
ture
(℃)
Figure 10 : Hot plate temperature deviation at 225 ℃
41
324
324.5
325
325.5
326
0 600 1200 1800 2400 3000 3600
Time (sec)
Tem
pera
ture
(℃)
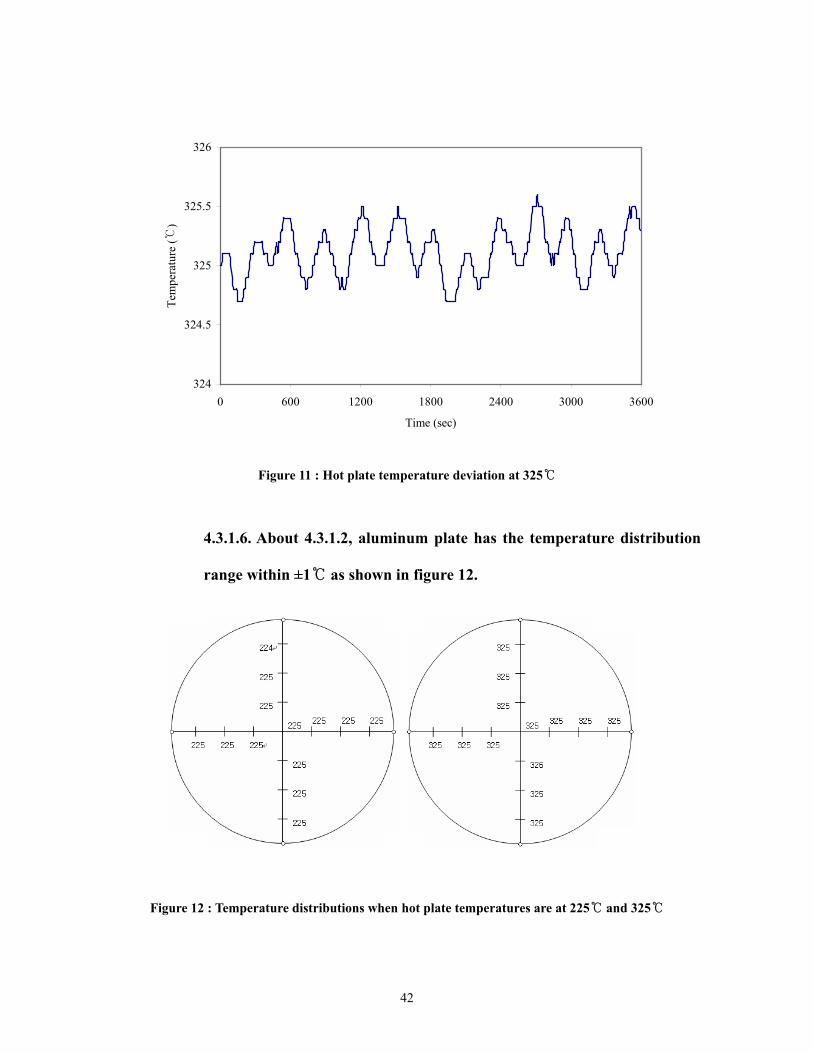
Figure 11 : Hot plate temperature deviation at 325 ℃
4.3.1.6. About 4.3.1.2, aluminum plate has the temperature distribution
range within ±1℃ as shown in figure 12.
Figure 12 : Temperature distributions when hot plate temperatures are at 225 and 325℃ ℃
42
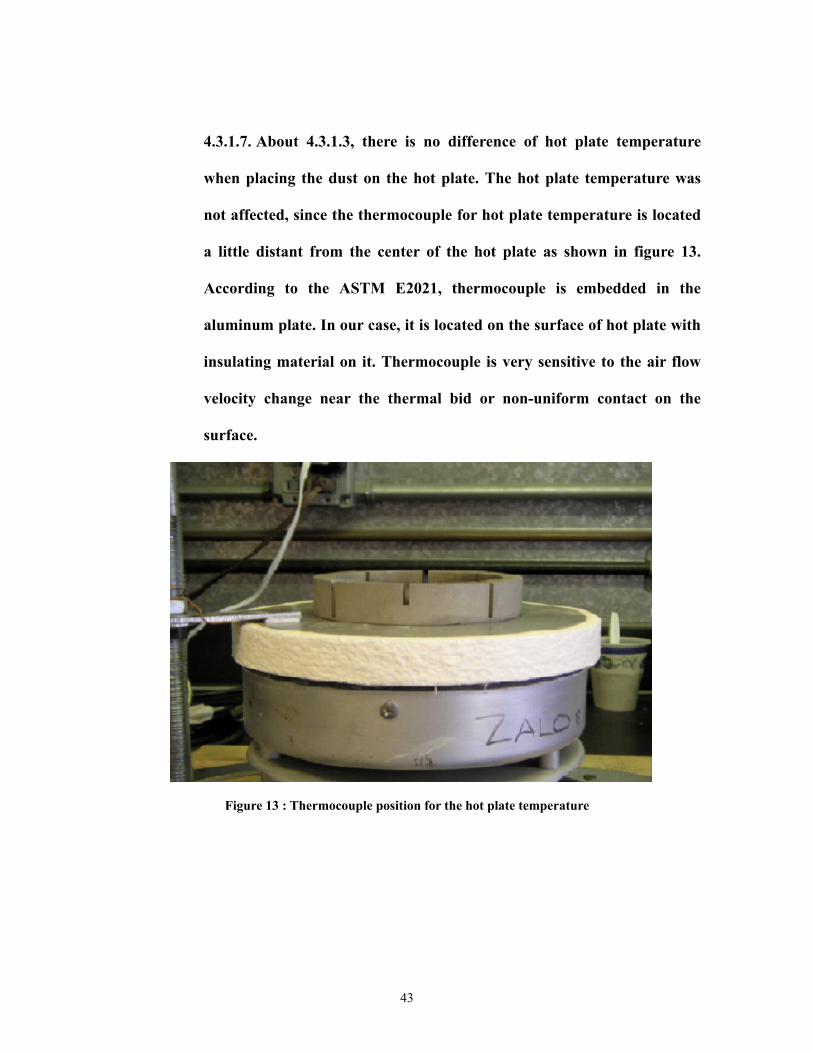
4.3.1.7. About 4.3.1.3, there is no difference of hot plate temperature
when placing the dust on the hot plate. The hot plate temperature was
not affected, since the thermocouple for hot plate temperature is located
a little distant from the center of the hot plate as shown in figure 13.
According to the ASTM E2021, thermocouple is embedded in the
aluminum plate. In our case, it is located on the surface of hot plate with
insulating material on it. Thermocouple is very sensitive to the air flow
velocity change near the thermal bid or non-uniform contact on the
surface.
Figure 13 : Thermocouple position for the hot plate temperature
43
30
80
130
180
230
0 60 120 180 240 300 360 420
Time (sec)
Tem
pera
ture
(℃)
hot plate temp.
dust layer temp.
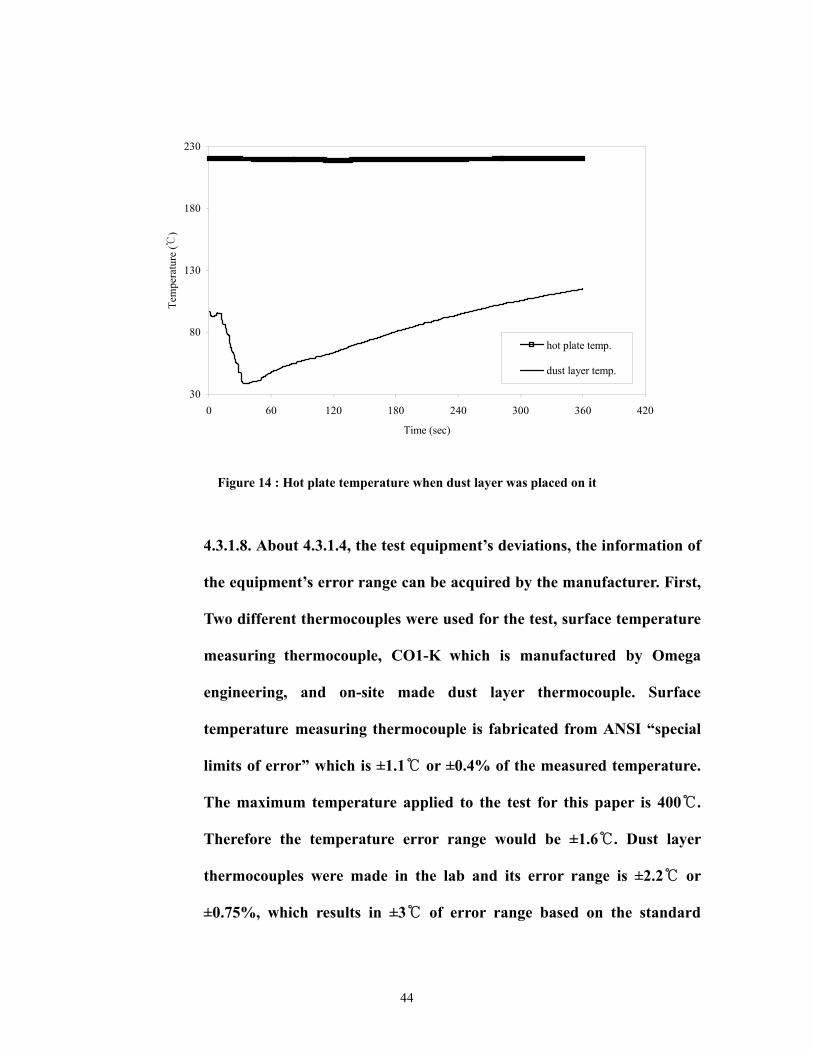
Figure 14 : Hot plate temperature when dust layer was placed on it
4.3.1.8. About 4.3.1.4, the test equipment’s deviations, the information of
the equipment’s error range can be acquired by the manufacturer. First,
Two different thermocouples were used for the test, surface temperature
measuring thermocouple, CO1-K which is manufactured by Omega
engineering, and on-site made dust layer thermocouple. Surface
temperature measuring thermocouple is fabricated from ANSI “special
limits of error” which is ±1.1℃ or ±0.4% of the measured temperature.
The maximum temperature applied to the test for this paper is 400℃.
Therefore the temperature error range would be ±1.6℃. Dust layer
thermocouples were made in the lab and its error range is ±2.2℃ or
±0.75%, which results in ±3℃ of error range based on the standard
44
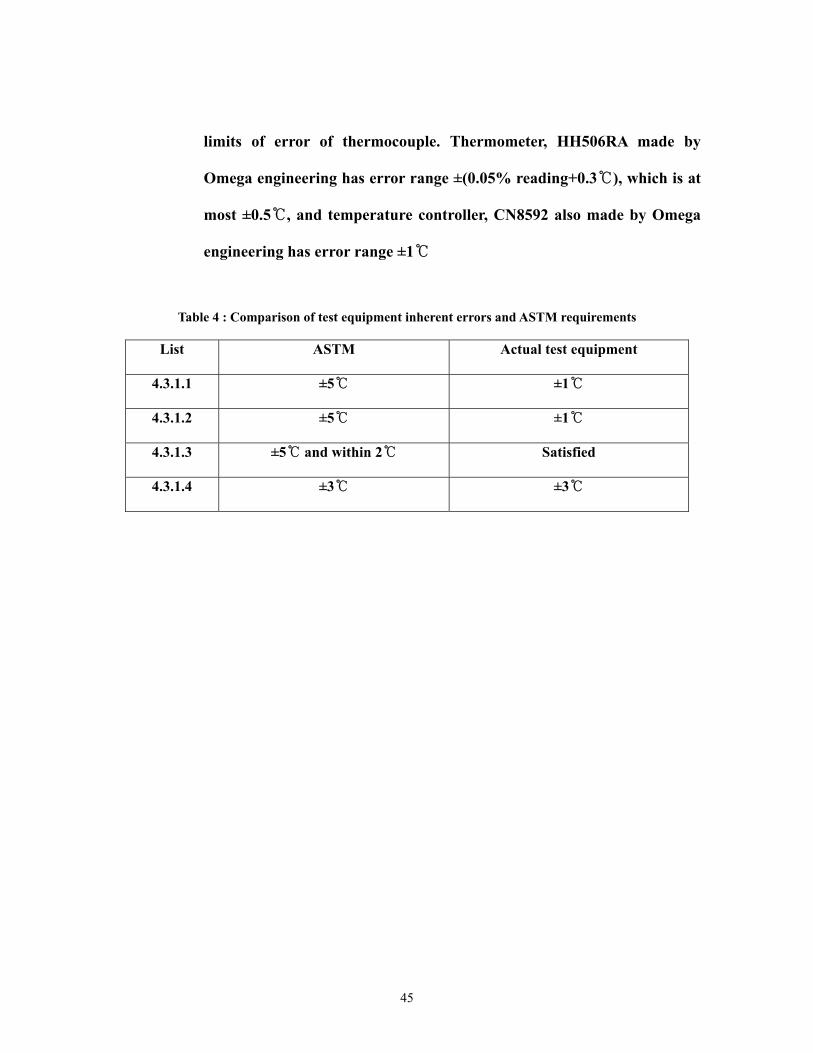
limits of error of thermocouple. Thermometer, HH506RA made by
Omega engineering has error range ±(0.05% reading+0.3℃), which is at
most ±0.5℃, and temperature controller, CN8592 also made by Omega
engineering has error range ±1℃
Table 4 : Comparison of test equipment inherent errors and ASTM requirements
List ASTM Actual test equipment
4.3.1.1 ±5℃ ±1℃
4.3.1.2 ±5℃ ±1℃
4.3.1.3 ±5 and within 2℃ ℃ Satisfied
4.3.1.4 ±3℃ ±3℃
45

4.3.2. Experimental errors
The amount of dust filling the aluminum ring should be decided.
ASTM recommends measuring the amount of dusts to fill the ring three times
and the average value of the value be picked. However, very slight
experimental errors are expected at this procedure. Below are the amounts of
dusts to fill the half inch thickness inside the ring for each time and average
values which were selected.
Table 5 : Average amount of dust to fill half of the ring (0.5 inch thick)
First(g) Second(g) Third(g) Average(g)
Pittsburgh seam coal 56.8 56.3 57.2 57
Brass powder 33.5 32.9 33.1 33
Gum Arabic powder 39.4 40.2 39.8 40
Paper dust 3 2.9 3 3
The positioning of thermocouple in dust layers at each run of test can
not be the same. The slight difference of thermocouple bead’s elevation may
cause significantly different temperature readout. Test environment also
cause experimental errors. The air flow (0.5 cm/s at the surface of dust
layers) caused by fume hood located above the test bench can change the
oxygen concentration inside the dust layer which can change the ignition
temperature accordingly. It turned out that air flow did not change the
ignition temperature of Pittsburgh seam coal dust layer, although it had some
46

effects on the time to ignition; time to ignition for the case of the fume hood
on was 1000 sec longer than without airflow. Temperature variations by air
flow were discussed combined with oxygen concentration later. Ambient
temperature did not seem to affect the ignition temperature much.
The repeatability of tests results were examined with one material,
Pittsburgh seam coal, by doing the same test three times at different date as a
verification case. As shown in figure 15, the average value of maximum
temperature differences among 1st, 2nd, and 3rd tests at 6mm high and 3mm
high were 1.5 and 1 difference which ℃ ℃ were much smaller than ignition
temperature resolution in this thesis, which was 10 . ℃ The test results verified
that the level of repeatability was satisfactory.
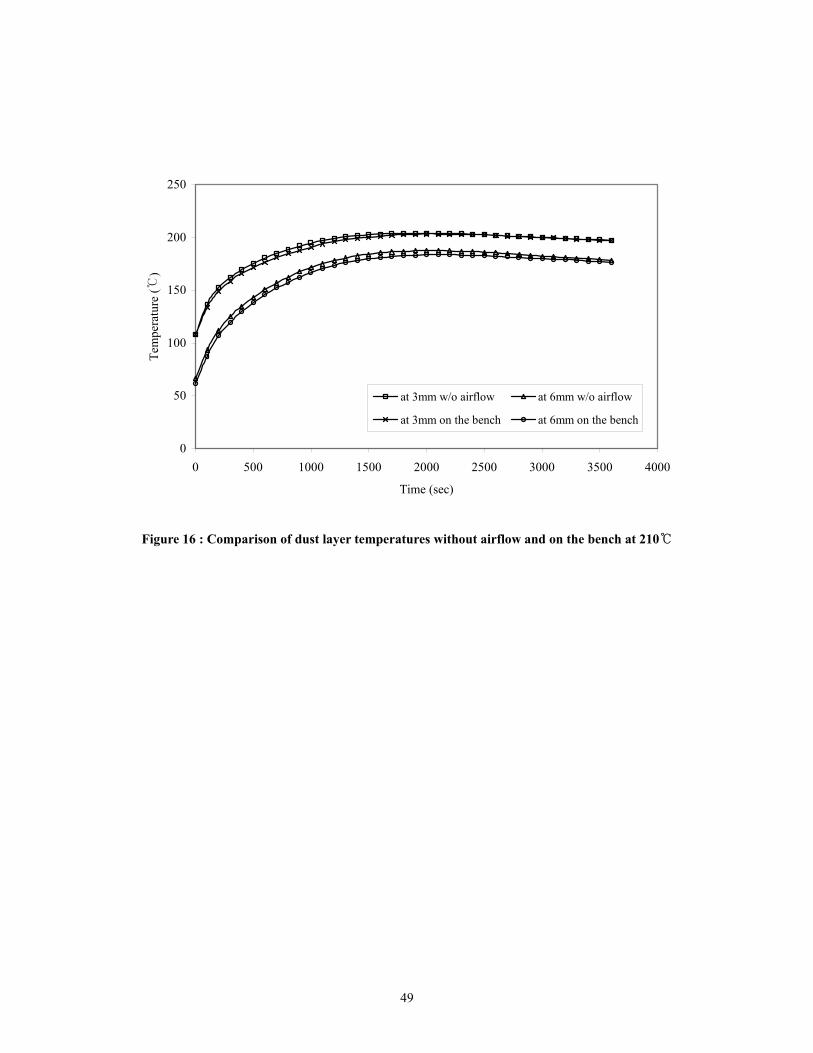
To examine air flow effects on the hot surface ignition temperature of
dust layers, one preliminary test was conducted with Pittsburgh seam coal.
One test was conducted with a 0.5 cm/s (average 0.5 cm/s with the highest
value of 9 cm/s at a certain time) airflow at the top of the surface of dust layer,
as driven by fume hood located above the bench. A second test was conducted
in the adjacent lab where no air flow exists (average 0 m/s for two minutes,
and the highest velocity was 2 cm/s at a certain time) at the top of the surface
of dust layer. In both tests, Pittsburgh seam coal was ignited at 220 and not ℃
ignited at 210 . ℃ Figure 16 shows that the temperature variation at 210 ℃
without air flow and with small air flow (0.5 cm/s at the elevation of surface
of the dust layer) driven by the fume hood. The average temperature
47
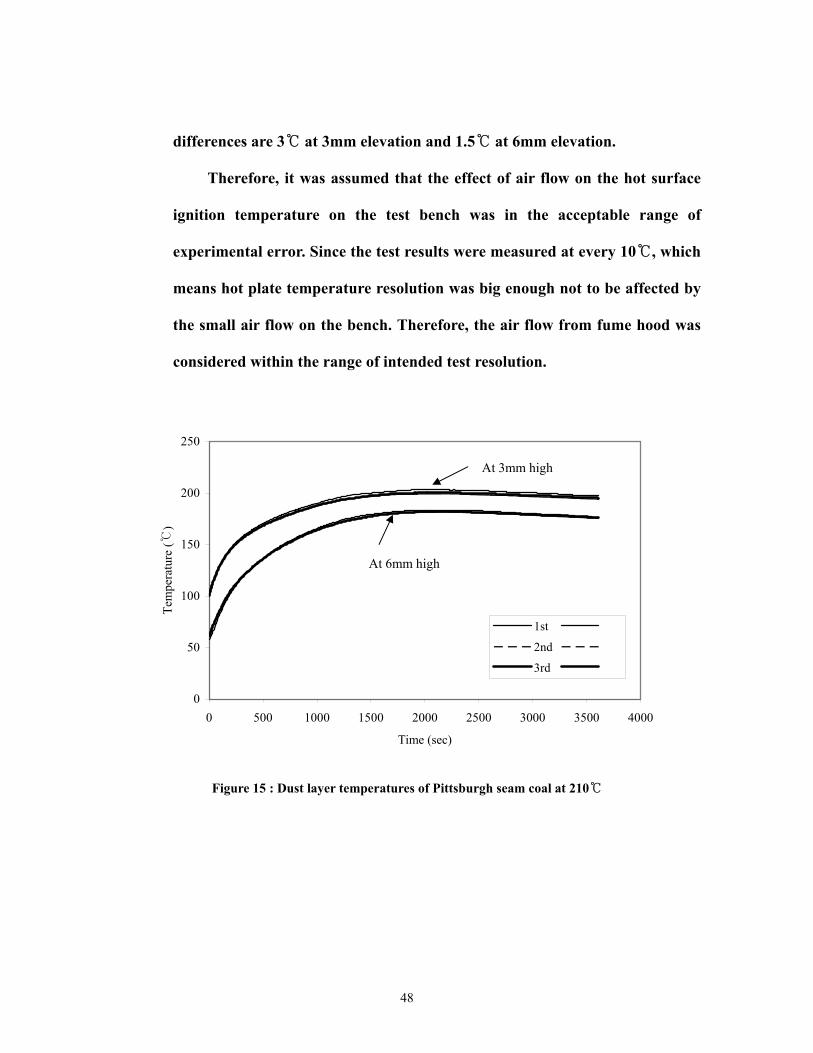
differences are 3 at 3mm elevation and 1.5 at 6mm elevation. ℃ ℃
Therefore, it was assumed that the effect of air flow on the hot surface
ignition temperature on the test bench was in the acceptable range of
experimental error. Since the test results were measured at every 10 , which ℃
means hot plate temperature resolution was big enough not to be affected by
the small air flow on the bench. Therefore, the air flow from fume hood was
considered within the range of intended test resolution.
0
50
100
150
200
250
0 500 1000 1500 2000 2500 3000 3500 4000
Time (sec)
Tem
pera
ture
(℃)
1st
2nd
3rd
At 3mm high
At 6mm high
Figure 15 : Dust layer temperatures of Pittsburgh seam coal at 210℃
48
0
50
100
150
200
250
0 500 1000 1500 2000 2500 3000 3500 4000
Time (sec)
Tem
pera
ture
(℃)
at 3mm w/o airflow at 6mm w/o airflow
at 3mm on the bench at 6mm on the bench
Figure 16 : Comparison of dust layer temperatures without airflow and on the bench at 210℃
49
4.4. Test material properties
4.4.1. Dust
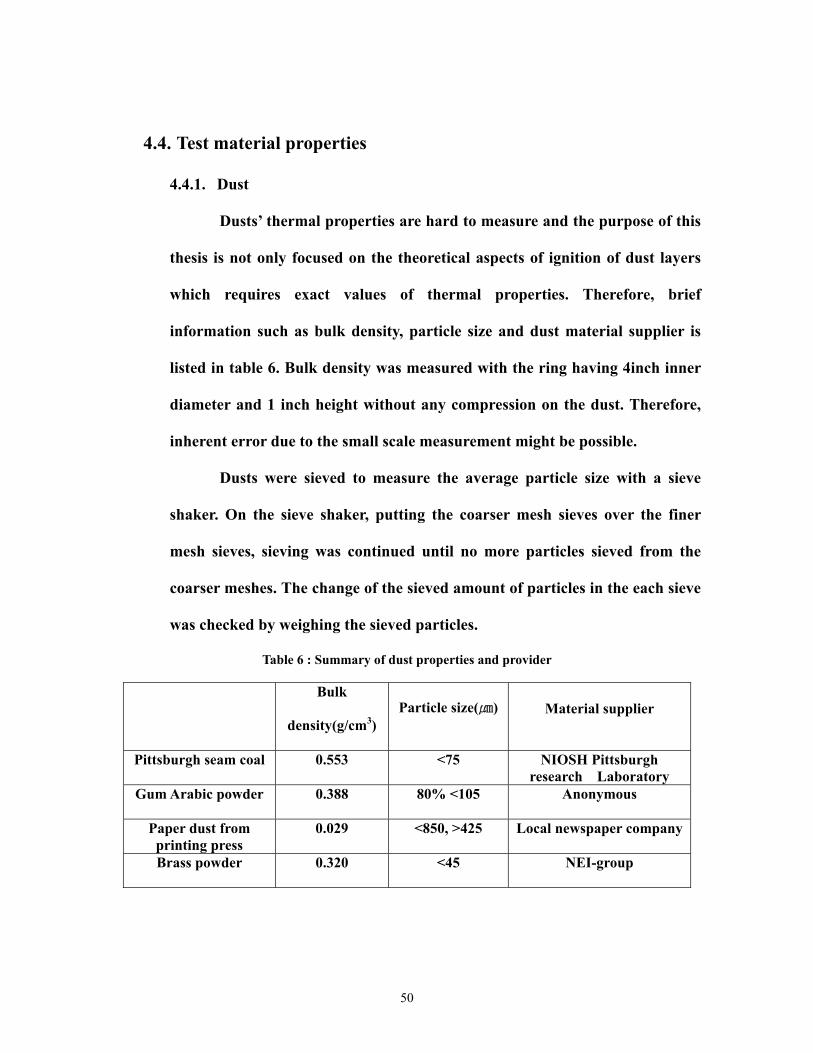
Dusts’ thermal properties are hard to measure and the purpose of this
thesis is not only focused on the theoretical aspects of ignition of dust layers
which requires exact values of thermal properties. Therefore, brief
information such as bulk density, particle size and dust material supplier is
listed in table 6. Bulk density was measured with the ring having 4inch inner
diameter and 1 inch height without any compression on the dust. Therefore,
inherent error due to the small scale measurement might be possible.
Dusts were sieved to measure the average particle size with a sieve
shaker. On the sieve shaker, putting the coarser mesh sieves over the finer
mesh sieves, sieving was continued until no more particles sieved from the
coarser meshes. The change of the sieved amount of particles in the each sieve
was checked by weighing the sieved particles.
Table 6 : Summary of dust properties and provider
Bulk
density(g/cm3)Particle size(㎛) Material supplier
Pittsburgh seam coal 0.553 <75 NIOSH Pittsburgh research Laboratory
Gum Arabic powder 0.388 80% <105 Anonymous
Paper dust from printing press
0.029 <850, >425 Local newspaper company
Brass powder 0.320 <45 NEI-group
50
4.4.2. Combustible liquids and contaminants
Combustible liquids and other contaminants are key factors in this
topic and their thermal properties are important. Flashpoints, AITs, and
liquid suppliers are listed in table 7. Mobil DTE 24, and Citgo press oil 68 are
hydraulic oils being used in a newspaper printing press. Citgo oil is
formulated with premium paraffinic base oils and ashless antiwear additives
which is not zinc-type. Other thermal properties such as specific heat, heat
conductivity might be also important, but are not available. Since the main
concern is about whether it promoted the ignition of dust layers, AIT and
flashpoint were mainly concerned.
AITs of DTE24, and Citgo oil were measured by Kidde-Fenwal
Combustion Research Center with the method of ASTM E659. Black ink’s
and ketone-based liquid solution’s flashpoints were measured on-site with the
pilot ignition source on an open hot plate. Therefore, it might not be exact
value, but enough to give overall range of flashpoint. N-decane and kerosene’s
flashpoints and AITs were from the manufacturer’s MSDS provided along
with the products.
Ink was a black color newspaper printing ink containing high boiling
point petroleum oil which is very similar to mineral oil as solvent, and using
carbon black for its color. The ink also has small amounts of waxes, drying
agents, and lubricants.
51
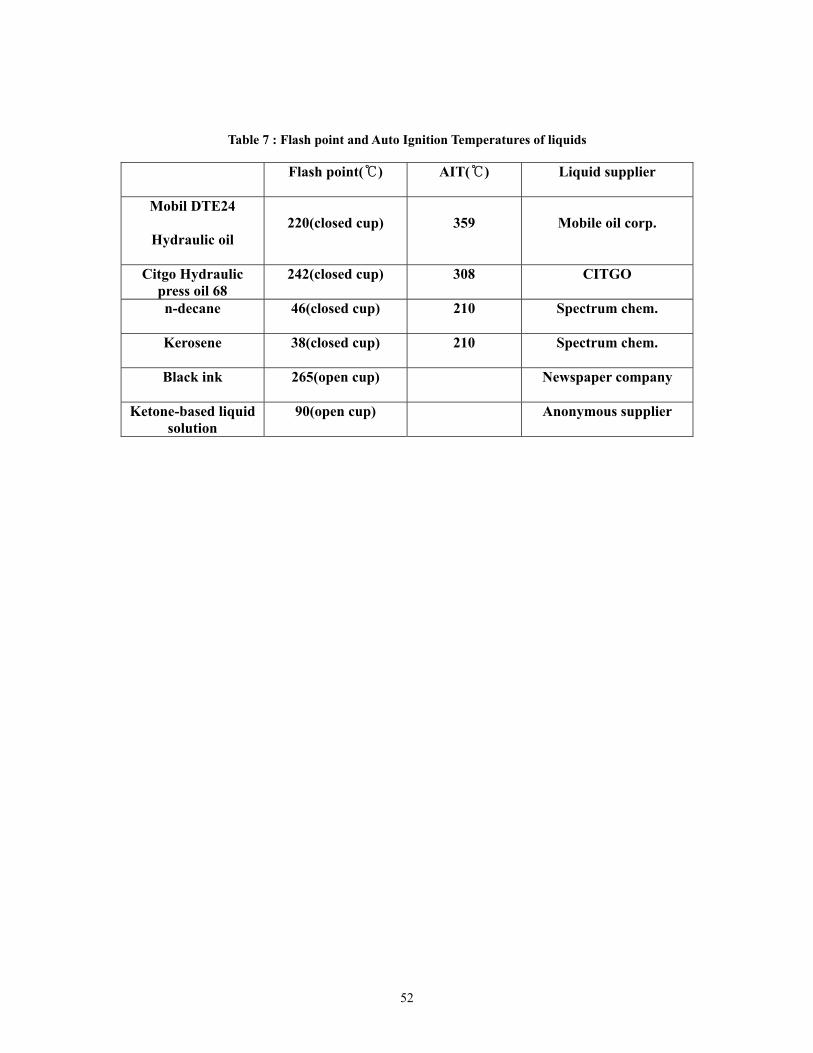
Table 7 : Flash point and Auto Ignition Temperatures of liquids
Flash point( )℃ AIT( )℃ Liquid supplier
Mobil DTE24
Hydraulic oil 220(closed cup) 359 Mobile oil corp.
Citgo Hydraulic press oil 68
242(closed cup) 308 CITGO
n-decane 46(closed cup) 210 Spectrum chem.
Kerosene 38(closed cup) 210 Spectrum chem.
Black ink 265(open cup) Newspaper company
Ketone-based liquid solution
90(open cup) Anonymous supplier
52

4.5. Preliminary test
Preliminary tests were planned to verify the performance of test equipment.
ASTM E 2021 describes three benchmarking test materials: Pittsburgh seam coal,
coated brass flakes, and lycopodium. Specifications are as follows. Pittsburgh
seam bituminous coal is up to 80% of minus 200 mesh, a mass median diameter of
about 45㎛, and 36% volatility. Brass is 100% minus 325 mesh with less than
1.7% of stearic coating. The lycopodium is 100% minus 200 mesh and mass
median diameter of about 28㎛.
The ignition temperatures are recorded in ASTM E2021 as 230~240℃ for
Pittsburgh seam coal, 155~160 for brass flakes, and 240~250 for lycopodium ℃ ℃
spores.
Dust layer temperatures were graphed right after putting dusts inside the ring,
which usually corresponded to the first temperature drop. Related to this test
procedure, inherent errors sometimes occurred. The temperature recorded -
9999 or 9999 when a sudden ℃ ℃ steep temperature change occurred at the
thermocouple for dust layers. Usually this happened at the very early stage when
dust layer was put on the hot plate causing sudden changes of the temperatures of
the thermocouples.
Figure 18 is the magnified graph of the area surrounded a circle in figure 17.
As shown in the figure 18, the initial thermocouple temperatures were 102.2 ℃
and 85.6 for 3mm and 6mm thermocouples respectively. ℃ When the dust was put
on the hot plate just a little earlier than 20s, the temperatures dropped down to
53

44 and 37 . ℃ ℃ The first 20s refers to the period between turning on the
temperature recording software and putting dusts inside the ring. Therefore, this
20s does not have any meaning and would be better not to be considered in
calculating time to ignition. The first downward apex as the starting point to
calculate time to ignition seems appropriate.
0
50
100
150
200
250
0 500 1000 1500 2000 2500 3000 3500 4000
Time (sec)
Tem
pera
ture
(℃)
at 3mm high
at 6mm high
Figure 17 : Pittsburgh seam coal at 210 ℃
54

0
20
40
60
80
100
120
140
0 20 40 60 80 100 120 140 160 180 200
Time (sec)
Tem
pera
ture
(℃)
at 3mm high
at 6mm high
Figure 18 : Pittsburgh seam coal at 210 for the first 200 sec℃
55
4.5.1. Pittsburgh seam coal
Pittsburgh seam coal was provided by NIOSH Pittsburgh Research
Center Laboratory and had size distribution of 75.4% minus 200 mesh and
36.1% minus 325 mesh which satisfied the ASTM standard. The volatility of
this Pittsburgh seam coal was not specified. 57g of Pittsburgh seam coal were
tested at different hot plate temperatures.
The hot surface ignition temperature of Pittsburgh seam coal was
220 which was 10~20 below compared to the ASTM ℃ ℃ E2021 result.
Although ASTM E2021 mentioned one hour as the maximum test period, the
ignition symptom was shown almost at last minute of 3600 sec, the test was
run longer than specified in ASTM E2021. At 210 , ℃ Pittsburgh seam coal did
not ignite. At 220 , the time to ignition was 4060s when the thermoc℃ ouple at
6mm high recorded 270 .℃ When the ignition occurred, there are some cracks
on the surface of Pittsburgh seam coal as shown in the figure 19.
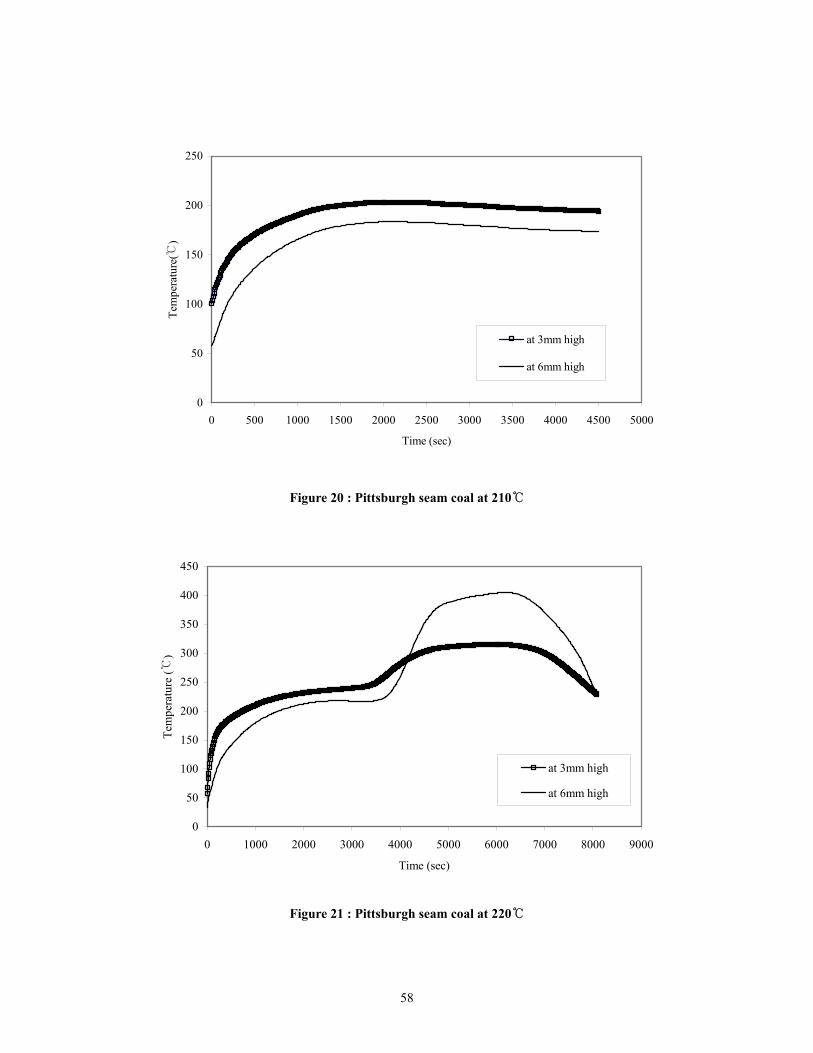
Temperatures measured at elevation of 3mm and 6mm in the dust
layer are shown in figure 20 and 21. When ignition occurred, the temperature
at 3mm high became higher than that of at 6mm high at about 4400 seconds.
This can be explained by the relationship between temperature in the dust
layer and oxidation of dust particles. Temperature is the representation of the
extent of exothermic reaction, and exothermic reaction is dependent of oxygen
concentration in this case. When the ignition occurred, oxygen access level at
6mm above the hot surface is larger than that of 3mm above because oxygen is
56

provided by the diffusion from the dust layer surface. This is explored in more
detail in section 4.10.
Figure 19 : Cracks in the Pittsburgh seam coal dust layer when ignition occurred
57
0
50
100
150
200
250
0 500 1000 1500 2000 2500 3000 3500 4000 4500 5000
Time (sec)
Tem
pera
ture
(℃)
at 3mm high
at 6mm high
Figure 20 : Pittsburgh seam coal at 210℃
0
50
100
150
200
250
300
350
400
450
0 1000 2000 3000 4000 5000 6000 7000 8000 9000
Time (sec)
Tem
pera
ture
(℃)
at 3mm high
at 6mm high
Figure 21 : Pittsburgh seam coal at 220℃
58
4.5.2. Brass powder
Brass powder, Super Brass 75, was purchased from NEI group New
York office via www.easyleaf.com. It was not ignited until the hot plate
temperature reached 400 which is the maximum ℃ temperature of the hot
plate prescribed by ASTM E2021. However, according to the ASTM E2021,
the hot surface ignition temperature of brass powder is 155~160 , which is ℃
much lower than the actual preliminary test here.
Previous paper by Yael Miron and Charles P. Lazzara mentioned the
amount of stearic acid coating material can change the ignition temperature of
brass. Since stearic acid amount of the brass powder used in this test was not
known, it was possible that its ignition temperature was not the range in
ASTM E2021. Further research about the effects of stearic acid was on
ignition temperature was dealt with later section of this paper.
4.5.3. Analysis and summary
Through preliminary tests, test equipment and test procedure were
verified. Although the tested materials were not the one exemplified in ASTM
E2021, the temperature profile of Pittsburgh seam coal was very similar with
ASTM 2021 test result. In case of brass, since the information about stearic
coating level and its compound was not known, it did not seem proper to
compare the test results.
59
4.6. Ignition temperatures of dust alone
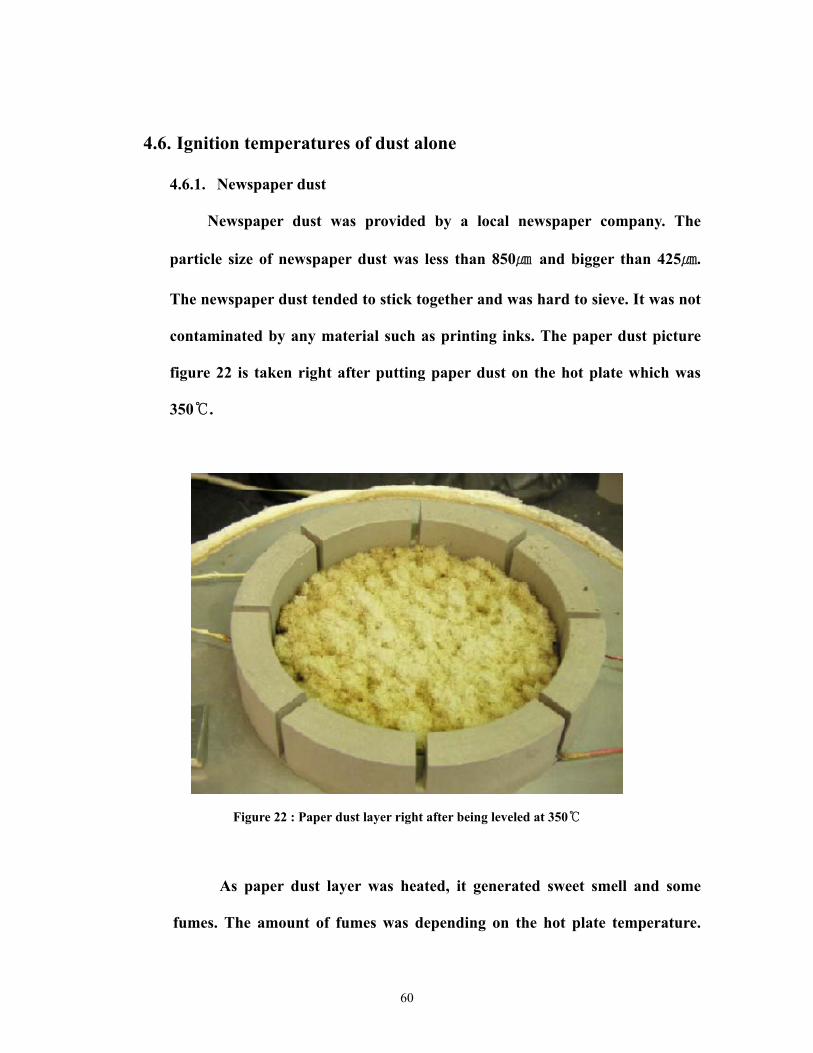
4.6.1. Newspaper dust
Newspaper dust was provided by a local newspaper company. The
particle size of newspaper dust was less than 850㎛ and bigger than 425㎛.
The newspaper dust tended to stick together and was hard to sieve. It was not
contaminated by any material such as printing inks. The paper dust picture
figure 22 is taken right after putting paper dust on the hot plate which was
350℃.
Figure 22 : Paper dust layer right after being leveled at 350 ℃
As paper dust layer was heated, it generated sweet smell and some
fumes. The amount of fumes was depending on the hot plate temperature.
60
The higher the hot plate temperature was, the more fumes were generated.
The fume was not ignitable near the surface of dust layer with pilot ignition
source.
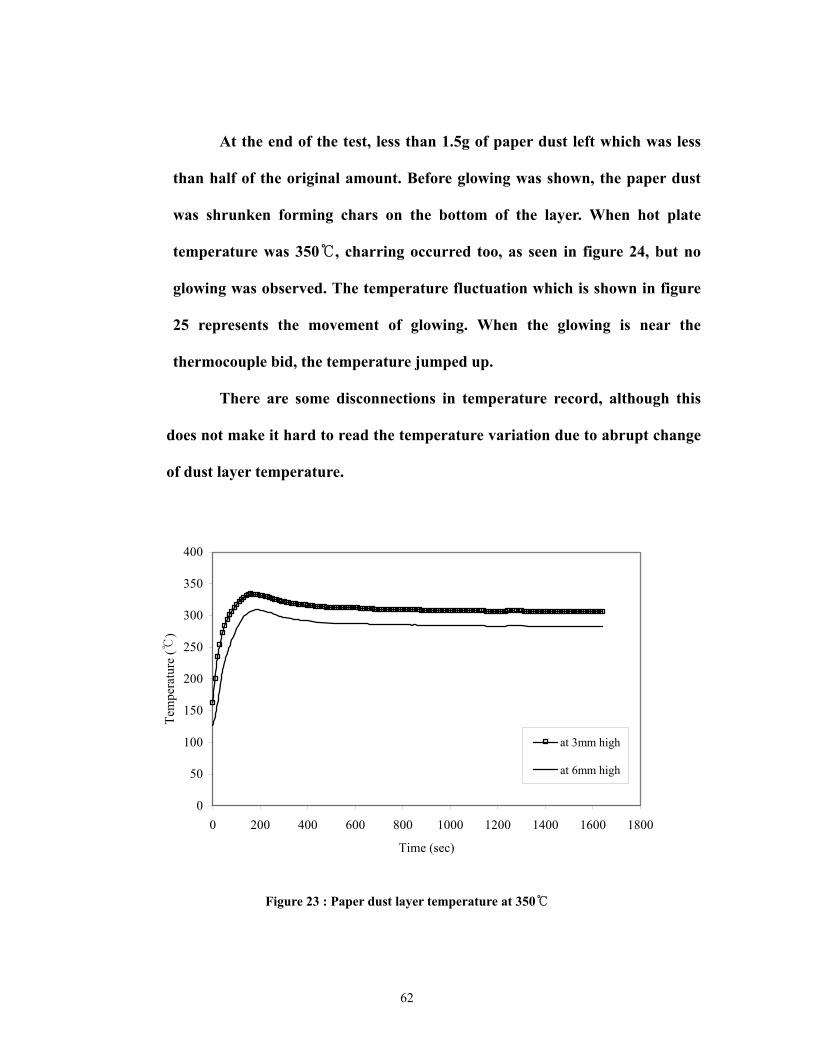
As shown in figure 23, half inch thick paper dust alone did not ignite
at 350℃ reaching the maximum temperature of 334 at 3mm high 165 sec℃ .
Dust layer temperatures remained at 306 for 3mm, and 283 for 6mm ℃ ℃
elevated thermocouples when the temperatures became stable. However,
paper dust ignited at 360 ℃ as shown figure 25. In figure 25, the fluctuation of
temperatures both at 3 and 6mm represents the movement of glowing. After
1400 sec, the dust layer temperatures remained at 289 and 255 for 3mm ℃ ℃
and 6mm elevation respectively, which are lower than the 350 of hot plate. ℃
This seemed to be caused by the paper dust layer which was shrunken as
heated changing the thermocouple elevation.
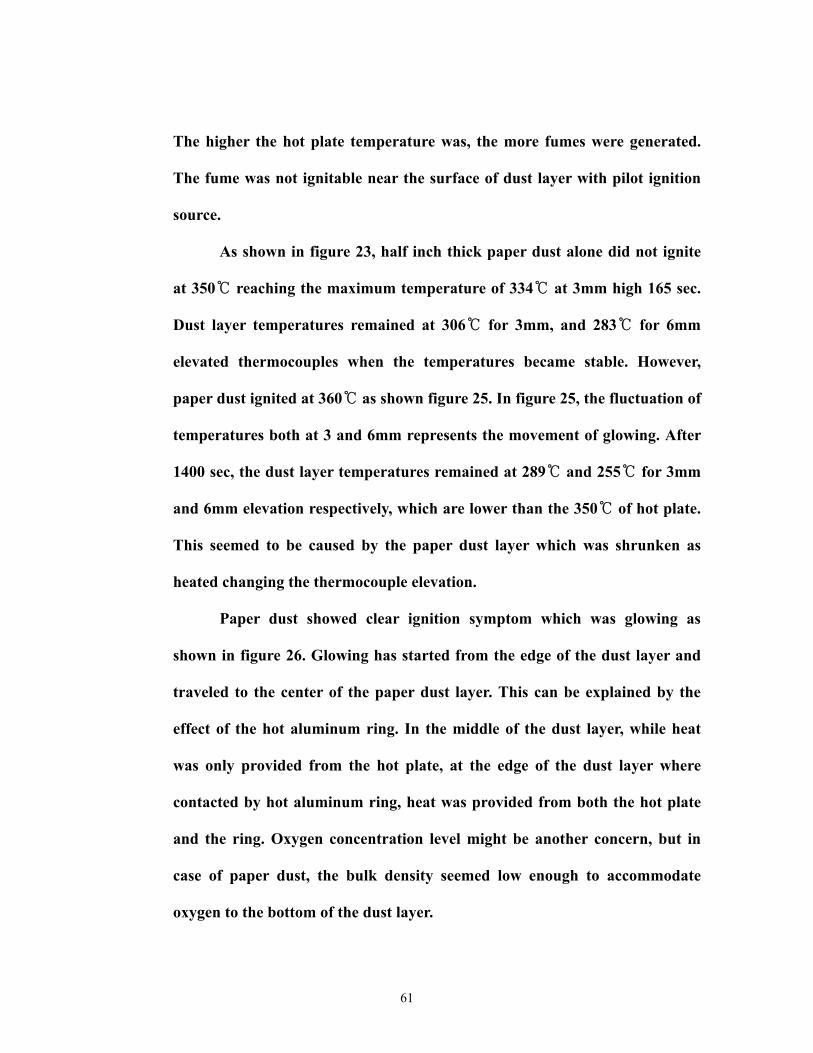
Paper dust showed clear ignition symptom which was glowing as
shown in figure 26. Glowing has started from the edge of the dust layer and
traveled to the center of the paper dust layer. This can be explained by the
effect of the hot aluminum ring. In the middle of the dust layer, while heat
was only provided from the hot plate, at the edge of the dust layer where
contacted by hot aluminum ring, heat was provided from both the hot plate
and the ring. Oxygen concentration level might be another concern, but in
case of paper dust, the bulk density seemed low enough to accommodate
oxygen to the bottom of the dust layer.
61
At the end of the test, less than 1.5g of paper dust left which was less
than half of the original amount. Before glowing was shown, the paper dust
was shrunken forming chars on the bottom of the layer. When hot plate
temperature was 350 , charring occurred℃ too, as seen in figure 24, but no
glowing was observed. The temperature fluctuation which is shown in figure
25 represents the movement of glowing. When the glowing is near the
thermocouple bid, the temperature jumped up.
There are some disconnections in temperature record, although this
does not make it hard to read the temperature variation due to abrupt change
of dust layer temperature.
0
50
100
150
200
250
300
350
400
0 200 400 600 800 1000 1200 1400 1600 1800
Time (sec)
Tem
pera
ture
(℃)
at 3mm high
at 6mm high
Figure 23 : Paper dust layer temperature at 350℃
62
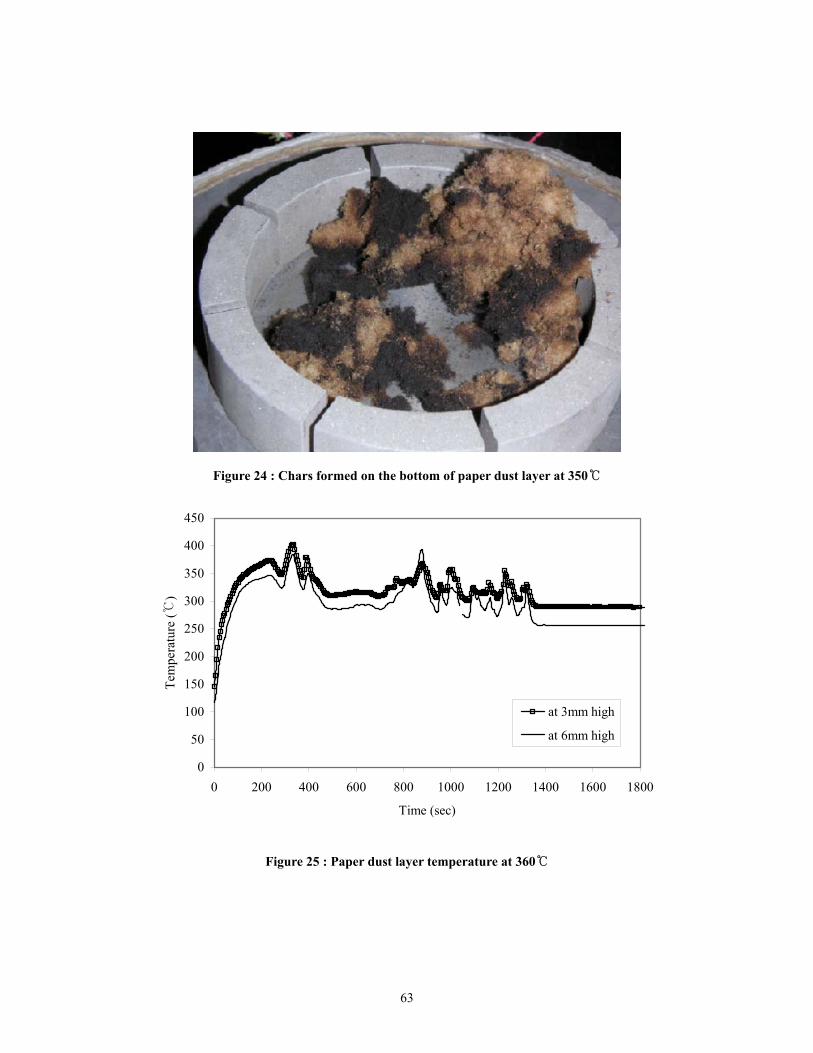
Figure 24 : Chars formed on the bottom of paper dust layer at 350℃
0
50
100
150
200
250
300
350
400
450
0 200 400 600 800 1000 1200 1400 1600 1800
Time (sec)
Tem
pera
ture
(℃)
at 3mm high
at 6mm high
Figure 25 : Paper dust layer temperature at 360 ℃
63
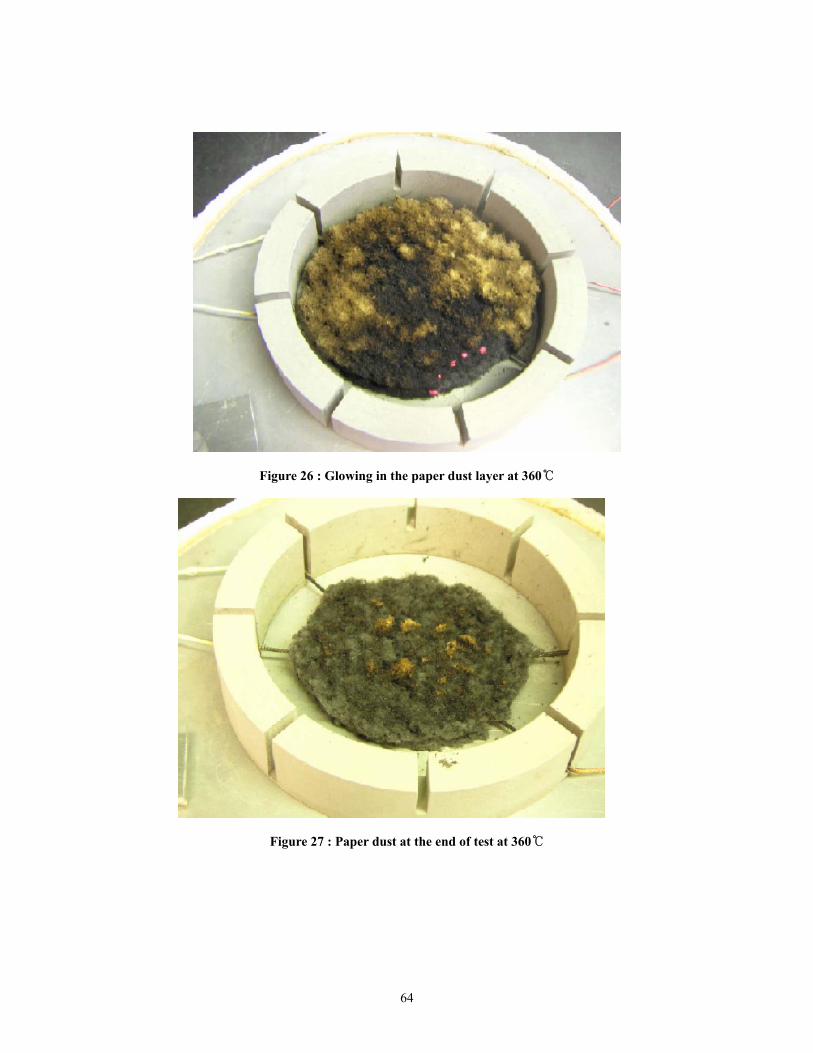
Figure 26 : Glowing in the paper dust layer at 360 ℃
Figure 27 : Paper dust at the end of test at 360 ℃
64

4.6.2. Gum Arabic powder
Gum Arabic powder was provided by a company that does not want to
be identified. The layer thickness for gum powder was one quarter inch
(slightly above 6mm) which was different from other test materials. Two
thermocouples were set at 3mm and 6mm high from the hot plate, too.
As shown in figure 28 and 30, gum powder was not ignited at 260 , ℃
but ignited at 270 . It did not show small hu℃ mp before steady state
temperature profile which was observed in Paper dust and Pittsburgh seam
coal dust layers. It seems that the rate of endothermic decomposition and
exothermic oxidation met together and raise the temperature gradually.
Its maximum temperatures were 566 when ignition occurred from ℃
the thermocouple at 6mm high and was 198 when ignition did not occur ℃
from the thermocouple at 3mm high which was in the middle of the dust layer.
Gum powder was shrunken a little bit, much less than paper dust.
However, as the gum powder layer was heated, some cracks occurred on the
surface of gum powder regardless of ignition as shown in figure 29, and it was
clustered and hardened to semi-solid holding the thermocouples in it. As it is
heated and shrunken holding the thermocouples, the elevation of
thermocouples could be changed and subsequently, the temperature might be
less accurate.
Gum powder generated sweet smell similar with paper dust, but
stronger. It formed char on the bottom of the dust layer first and glowing was
65

observed later. However, the ashes were different. Paper dust left black ashes
but gum powder generated white ashes which was lighter than that of paper
dust. More complete combustion seemed to occur in gum powder case.
0
50
100
150
200
250
0 500 1000 1500 2000 2500 3000 3500 4000
Time (sec)
Tem
pera
ture
(℃)
at 3mm high
at 6mm high
Figure 28 : Gum powder dust layer temperature at 260℃
66

Figure 29 : Cracks in the gum powder dust layer at 260 ℃
0
100
200
300
400
500
600
0 500 1000 1500 2000 2500 3000 3500 4000
Time (sec)
Tem
pera
ture
(℃)
at 3mm high
at 6mm high
Figure 30 : Gum powder dust layer temperature at 270℃
67

Figure 31 : Glowing in the gum powder dust layer at 270℃
Figure 32 : Gum powder dust layer at the end of test at 270 ℃
68

4.6.3. Analysis and summary
The mechanism of hot surface ignition of dust layers is a little different
from that of solid ignition. The hot plate ignition of dust layers is related to
the self-heating theory which was briefly dealt with in the literature review.
When a solid material is heated by external heat source, gas phase fuel
is generated on the surface of the solid by the thermal decomposition.
Exothermic chemical reaction can be the same cause for ignition for both
solid and dust layer ignition. However, the surface area of solid material
exposed to the oxygen is much less than the case of dust layers, since each
particle in the dust layer is exposed to the surrounding oxygen molecules. In
addition, the heat loss through conduction in the molecules and convection on
the surface is much higher in case of solid material than a dust layer. The
contact area of each particle in dust layer is much smaller than fully
connected solid material leading smaller conductive heat loss.
Therefore, the crucial factor that decides the ignition temperature for
dust layer is the surface-area/volume ratio of dust layer, the major difference
between solid material and dust layer, which can decide the amount of oxygen
access and heat loss to the ambient air. For example, dust layers having large
surface area in low bulk density allowing more convective heat loss has fewer
propensities for self ignition. From the past self-heating experiment, thermal
runaway started from the middle of the dust layer where the minimum heat
loss occurs.
69

The hot surface ignition temperatures were 360 for paper dust, ℃ and
270 for gum powder.℃ Gum powder has shown similar temperature increase
pattern with Pittsburgh seam coal which ignited at 220℃, a representative
material for hot surface ignition test. After a certain incubation period while
no ignition symptom was observed, the dust layer temperature increased
steeply.
However, paper dust did not show incubation period before ignition.
Temperature increased steeply from the beginning of the test, and when the
peak temperature recorded, glowing, ignition phenomenon for paper dust,
was observed. The ignition surface temperature of corrugated paper which is
exposed to the external radiant heat flux is 370 from the Industrial Fire ℃
Protection Engineering by Zalosh(2002, p.132) which is not much different
from the hot surface ignition temperature of half inch paper dust layer.
From the fact that paper dust layer which was assumed to have lower
hot surface ignition temperature due to self heating has similar ignition
temperature with corrugated paper, the ignition of paper dust layer seemed to
show less accordance to the F-K self-heating theory. This should be studied
further to avoid improper conclusion, which might be able to draw a
guideline for the application of F-K theory. However, much convection loss
due to low bulk density can explain this.
70
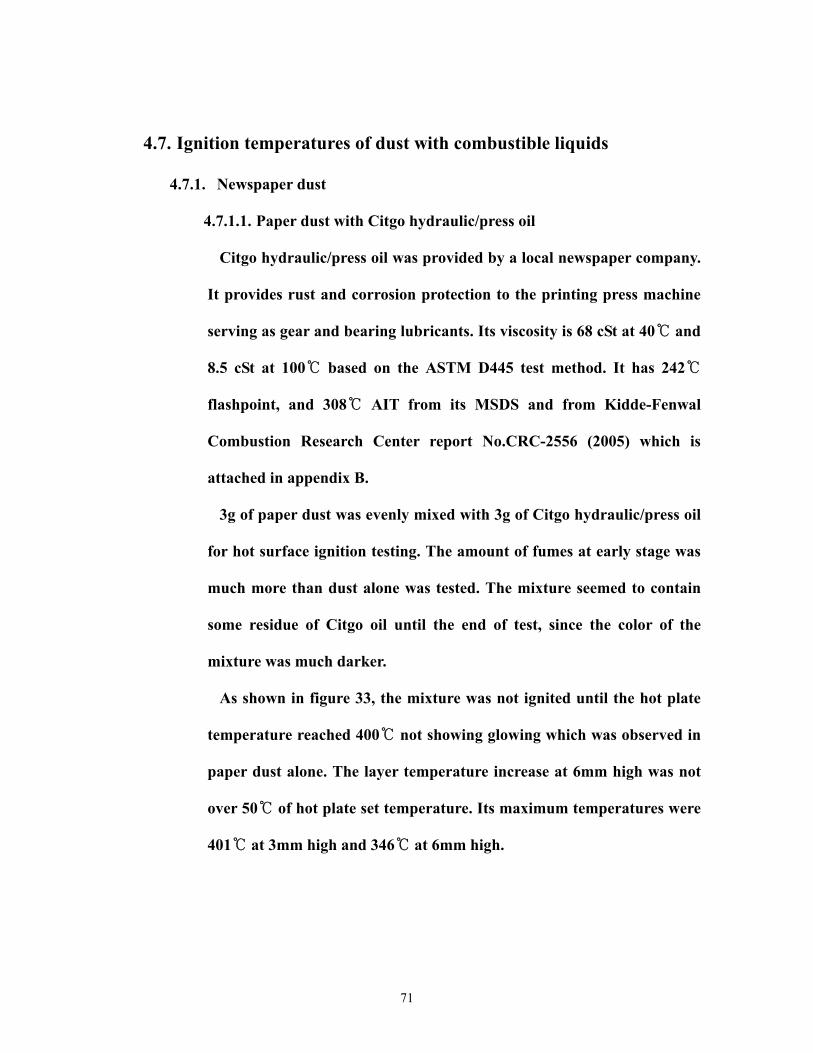
4.7. Ignition temperatures of dust with combustible liquids
4.7.1. Newspaper dust
4.7.1.1. Paper dust with Citgo hydraulic/press oil
Citgo hydraulic/press oil was provided by a local newspaper company.
It provides rust and corrosion protection to the printing press machine
serving as gear and bearing lubricants. Its viscosity is 68 cSt at 40 and ℃
8.5 cSt at 100 based on the ASTM D44℃ 5 test method. It has 242 ℃
flashpoint, and 308 ℃ AIT from its MSDS and from Kidde-Fenwal
Combustion Research Center report No.CRC-2556 (2005) which is
attached in appendix B.
3g of paper dust was evenly mixed with 3g of Citgo hydraulic/press oil
for hot surface ignition testing. The amount of fumes at early stage was
much more than dust alone was tested. The mixture seemed to contain
some residue of Citgo oil until the end of test, since the color of the
mixture was much darker.
As shown in figure 33, the mixture was not ignited until the hot plate
temperature reached 400℃ not showing glowing which was observed in
paper dust alone. The layer temperature increase at 6mm high was not
over 50 of hot plate set temperature. ℃ Its maximum temperatures were
401 ℃ at 3mm high and 346 at 6mm high. ℃
71

0
50
100
150
200
250
300
350
400
450
0 200 400 600 800 1000 1200 1400 1600 1800
Time (sec)
Tem
pera
ture
(℃)
at 3mm high
at 6mm high
Figure 33 : Paper dust (3g) with Citgo oil (3g) at 400℃
Figure 34 : Paper dust (3g) with Citgo oil (3g) at 400 , early stage℃
72
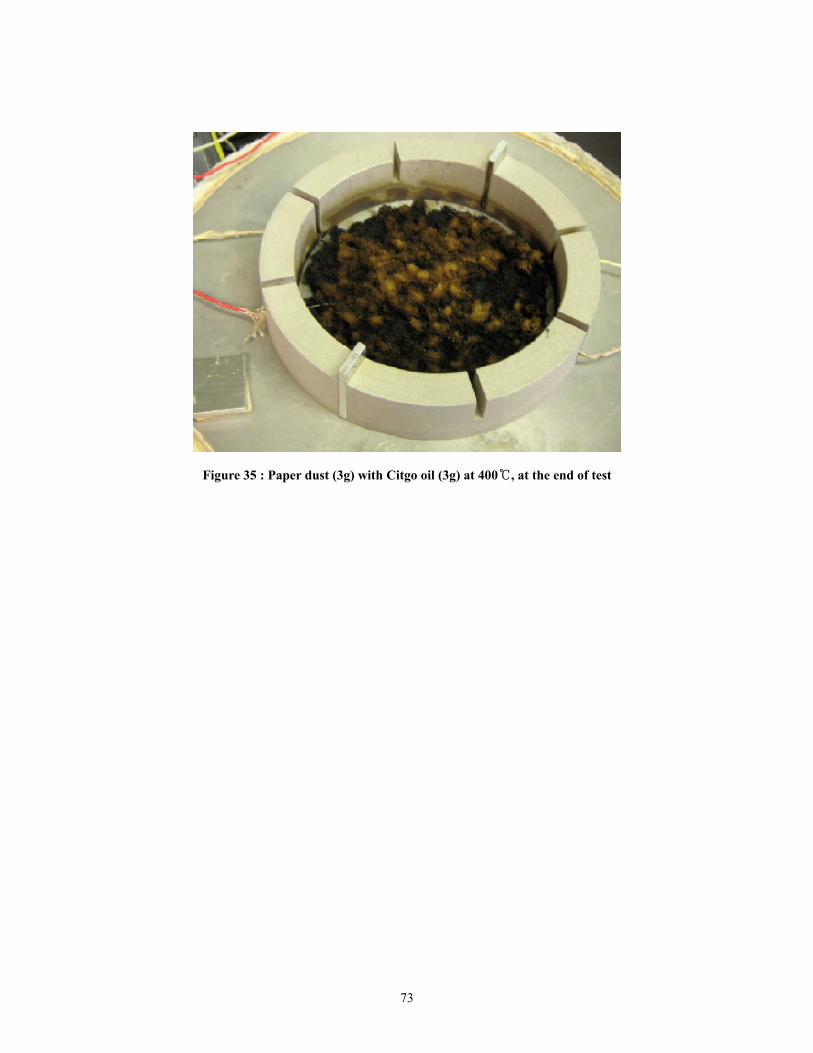
Figure 35 : Paper dust (3g) with Citgo oil (3g) at 400 , at the end of test℃
73

4.7.1.2. Paper dust with DTE 24
DTE 24 which was manufactured by Mobile Oil Corp. was provided
by a local newspaper company, too. It is used also as hydraulic oil for
gear or bearing lubricants. Its viscosity is over 29.8 cSt at 40 and 5.3℃
cSt at 100 . It has 2℃ 20 flashpoint, and 359 A℃ ℃ IT, which is slightly
higher than Citgo oil from its MSDS which is also attached in the
appendix B.
3g of paper dust and 3g of DTE 24 were mixed together and tested in
the same way as Citgo oil. The ignition did not occur up to 400 of hot ℃
plate temperature without glowing as shown in figure 36. The maximum
temperatures of the test recorded 413 at 3mm high at 390 sec, and ℃
350 at 6mm high at 280 sec. ℃ Color and smell of mixture at the end of
test were almost the same with those of Citgo oil mixture.
74

0
50
100
150
200
250
300
350
400
450
0 200 400 600 800 1000 1200 1400 1600 1800
Time (sec)
Tem
pera
ture
(℃)
at 3mm high
at 6mm high
Figure 36 : Paper dust (3g) with DTE24 (3g) at 400℃
Figure 37 : Paper dust (3g) with DTE24 (3g) at 400 , early stage℃
75

Figure 38 : Paper dust (3g) with DTE24 (3g) at 400 , at the end of test℃
76

4.7.1.3. Paper dust with newspaper printing ink
Newspaper Black color printing ink manufactured by US Ink Corp.
was provided by the same newspaper company. 3g of ink was evenly
mixed with 3g paper dust. Its flash point is about 265 and Auto ℃
Ignition Temperature was not known. Different from the previous two
hydraulic oils and paper dust alone, the ignition temperature of ink-
paper dust mixture was not clear, since there was no glowing observed
when ignition occurred.
Referring to figure 40, at 350℃, there was no glowing observed
throughout the test. However, the maximum temperature at 3mm high
in the dust layer was more than 400 which ℃ could have fulfilled the
requirement of ASTM E2021 if ASTM E2021 stated that temperature at
any point of dust layer can be a reference point for ignition. ASTM
E2021 specified that locating thermocouple at the center of dust layers,
i.e. at mid elevation.
Considering that paper dust alone did not really correspond to the
self-heating theory and the temperature at 3mm high was much higher
than the hot plate temperature, it was certain that some exothermic
reaction was occurring in the dust layer which might be able to be
considered as ignition, but not to be able to propagate to other dust
particles showing glowing.
Therefore, 350 was determined to be the ignition temperature of the ℃
77

mixture of paper dust and newspaper printing ink.
At 360℃ and 380℃, glowing was shown, although the temperature at
6mm high was not 50 higher than the ho℃ t plate temperature.
Table 8 : Max. temperatures of paper dust (3g) with ink (3g) at different hot plate temperatures
Hot plate temp.( )℃ Max. temp.
at 3mm high ( )℃
Max. temp.
at 6mm high ( )℃
340 303 271 No glowing
350 408 332 No glowing
360 380 345 glowing
380 411 404 glowing
0
50
100
150
200
250
300
350
0 200 400 600 800 1000 1200 1400 1600 1800
Time (sec)
Tem
pera
ture
(℃)
at 3mm high
at 6mm high
Figure 39 : Paper dust (3g) with newspaper printing ink (3g) at 340 ℃
78

0
50
100
150
200
250
300
350
400
450
0 200 400 600 800 1000 1200 1400 1600 1800
Time (sec)
Tem
pera
ture
(℃)
at 3mm high
at 6mm high
Ignition
Figure 40 : Paper dust (3g) with newspaper printing ink (3g) at 350℃
Figure 41 : Paper dust (3g) with newspaper printing ink (3g) at 350 , at the end of test℃
79

0
50
100
150
200
250
300
350
400
0 200 400 600 800 1000 1200 1400 1600 1800
Time (sec)
Tem
pera
ture
(℃)
at 3mm high
at 6mm high
Figure 42 : Paper dust (3g) with newspaper printing ink(3g) at 360℃
Figure 43 : Paper dust (3g) with newspaper printing ink (3g) at 360℃
80
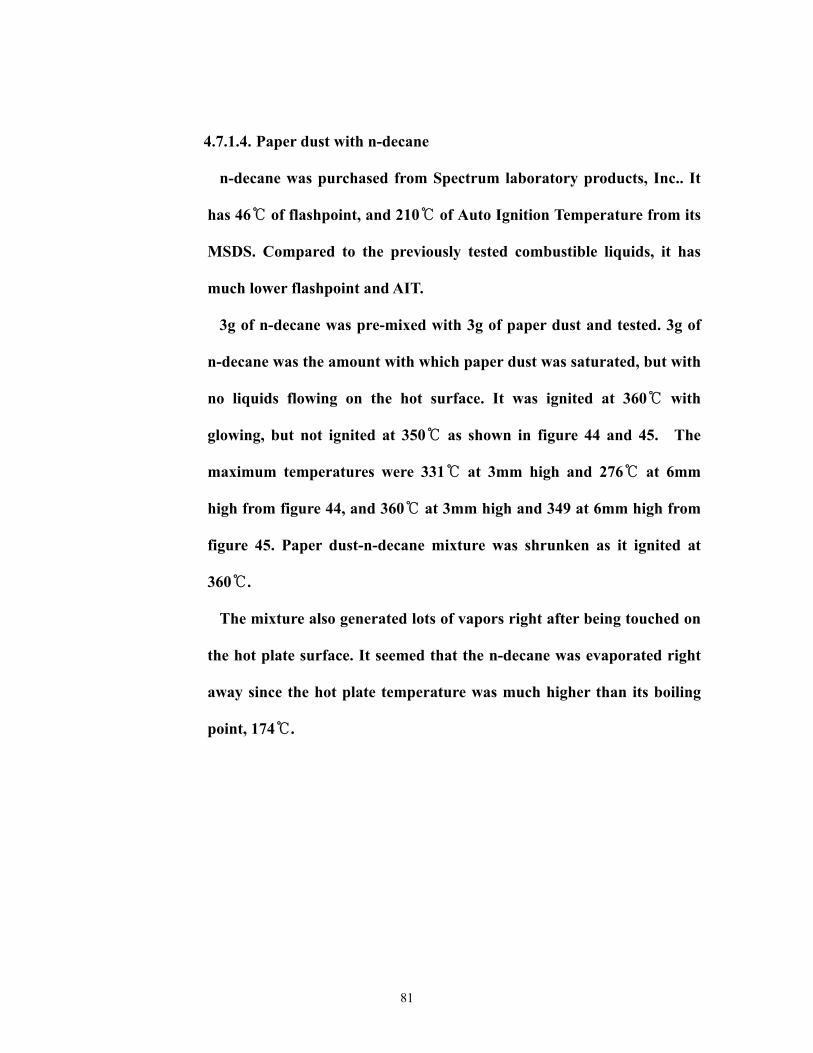
4.7.1.4. Paper dust with n-decane
n-decane was purchased from Spectrum laboratory products, Inc.. It
has 46 of flashpoint, and 21℃ 0 of Auto Ignition Temperature from its ℃
MSDS. Compared to the previously tested combustible liquids, it has
much lower flashpoint and AIT.
3g of n-decane was pre-mixed with 3g of paper dust and tested. 3g of
n-decane was the amount with which paper dust was saturated, but with
no liquids flowing on the hot surface. It was ignited at 360 ℃ with
glowing, but not ignited at 350 as shown in figure 4℃ 4 and 45. The
maximum temperatures were 331 at 3mm high and 276 at 6mm ℃ ℃
high from figure 44, and 360 at 3mm high and 349 at 6mm high from ℃
figure 45. Paper dust-n-decane mixture was shrunken as it ignited at
360 .℃
The mixture also generated lots of vapors right after being touched on
the hot plate surface. It seemed that the n-decane was evaporated right
away since the hot plate temperature was much higher than its boiling
point, 174 . ℃
81

0
50
100
150
200
250
300
350
0 200 400 600 800 1000 1200 1400 1600 1800
Time (sec)
Tem
pera
ture
(℃)
at 3mm high
at 6mm high
Figure 44 : Paper dust (3g) with n-decane (3g) at 350℃
0
50
100
150
200
250
300
350
400
0 200 400 600 800 1000 1200 1400 1600 1800
Time (sec)
Tem
pera
ture
(℃)
at 3mm high
at 6mm high
Figure 45 : Paper dust (3g) with n-decane (3g) at 360℃
82
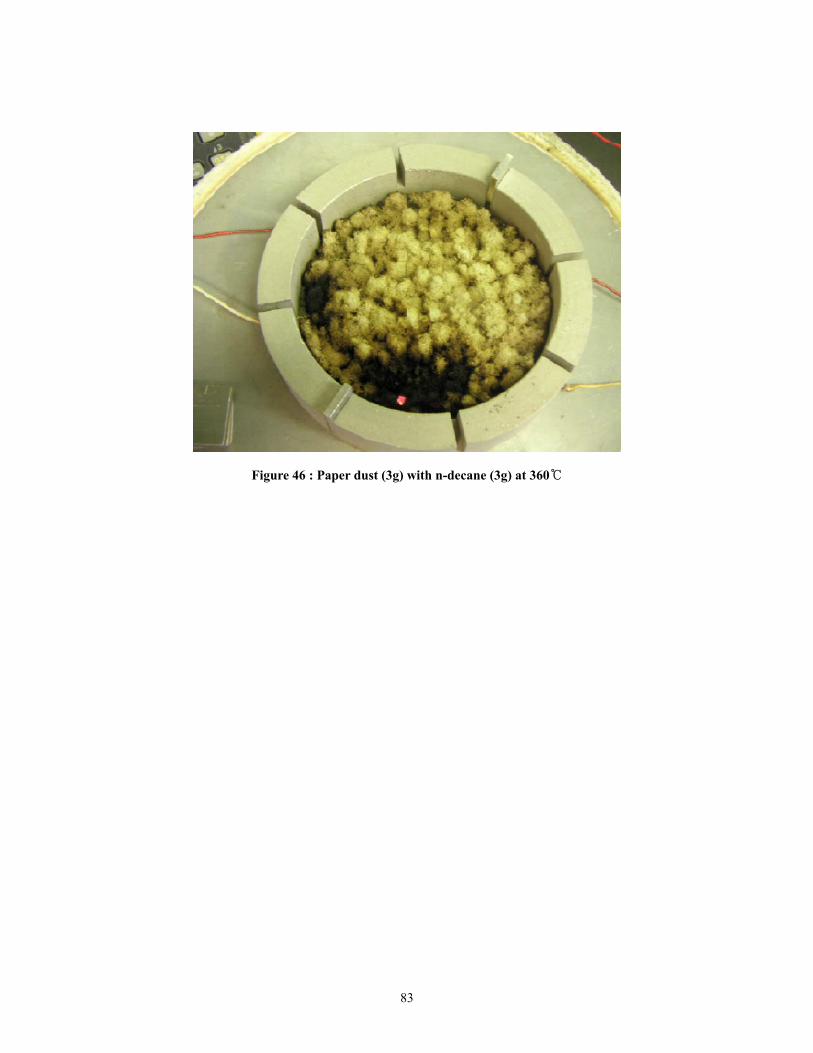
Figure 46 : Paper dust (3g) with n-decane (3g) at 360℃
83
4.7.1.5. Paper dust with kerosene
Kerosene was purchased from the same company, Spectrum
laboratory products, Inc.. It has 38 of flashpoint which is slightly ℃
lower than n-decane, and 210 of Auto Ignition Temperatur℃ e from its
MSDS provided along with the kerosene.
The mixture of 3g of kerosene and 3g of paper dust ignited at 370 ℃
with glowing and did not ignite at 360℃. At 360 , the maximum ℃
temperatures were 339 and 279 for 3 mm and 6mm elevation ℃ ℃
respectively. At 370 when ignition occurred, 417 and 412 ℃ ℃ ℃
recorded for 3mm and 6mm elevation as maximum temperatures.
The ignition procedure was almost same with n-decane. Large amount
of vapors which seemed to be Kerosene were generated right after being
on the hot plate.
84
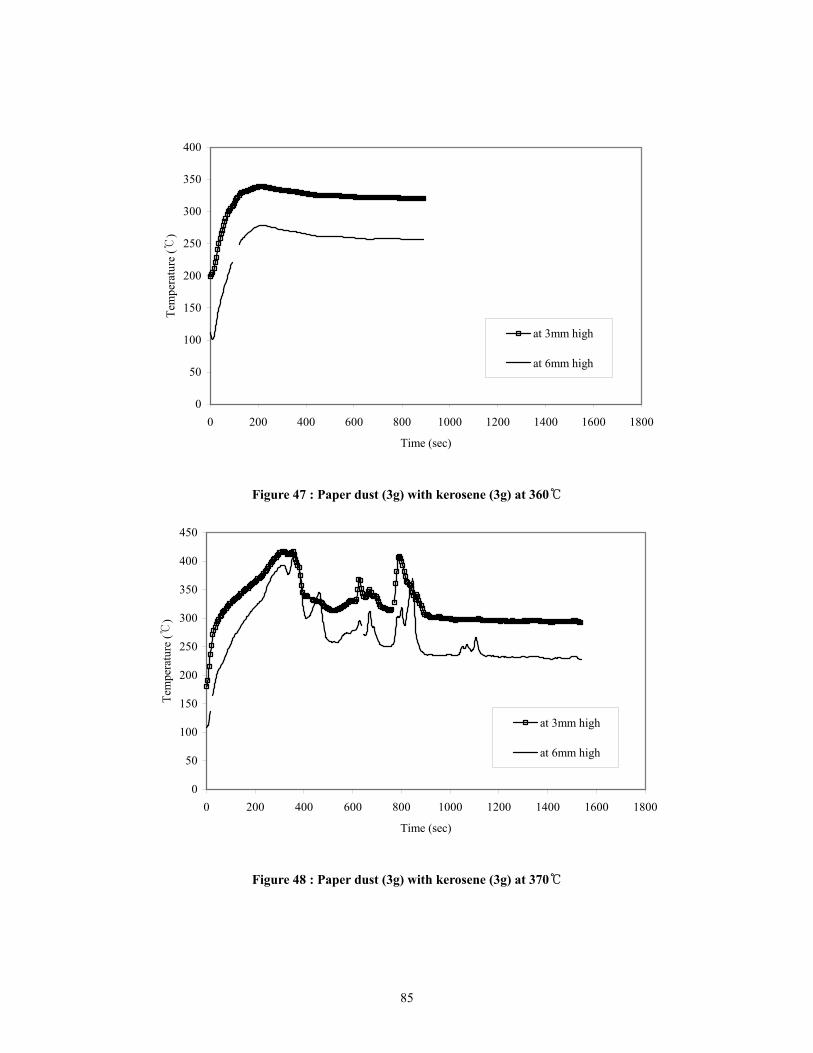
0
50
100
150
200
250
300
350
400
0 200 400 600 800 1000 1200 1400 1600 1800
Time (sec)
Tem
pera
ture
(℃)
at 3mm high
at 6mm high
Figure 47 : Paper dust (3g) with kerosene (3g) at 360℃
0
50
100
150
200
250
300
350
400
450
0 200 400 600 800 1000 1200 1400 1600 1800
Time (sec)
Tem
pera
ture
(℃)
at 3mm high
at 6mm high
Figure 48 : Paper dust (3g) with kerosene (3g) at 370℃
85

Figure 49 : Paper dust (3g) with kerosene (3g) at 370℃
86

4.7.2. Gum powder with ketone-based liquid solution
Ketone-based liquid solution was provided along the gum powder. The
flashpoint of ketone-based liquid solution was measured on-site with pilot
ignition source on the hot plate. 1 ml ketone-based liquid solution (11 cm
diameter on the hot plate) was ignited when hot plate was about 90 . ℃ The
thickness of gum powder on the hot plate was one quarter inch. Therefore, the
dust layer temperature at 3mm high was the criteria and main concern.
Different amounts of combustible liquid were mixed with gum powder
and tested. 1g, 2g, and 4g were respectively added to 20g of gum powder and
the ignition temperatures of them were 280 . The vapors ℃ generated above
the surface of the mixture with 4g of ketone-based liquid solution were ignited
by a pilot flame source when the dust layer temperature at 3mm high was
over 200℃, which was represented in figure 55. At 1000 sec, temperature
dropping was due to the water application to the dust layer to extinguish
flame which was ignited by pilot ignition source.
With 1g and 4g addition of ketone-based liquid solution to the gum
powder, the maximum temperatures were 215 and 168 for 1g of liqu℃ ℃ id
addition, and 221 and 181 for 4g of liquid addition at 3mm and 6mm ℃ ℃
high respectively. From the comparison of figure 50 and 51, with more
ketone-based liquid solution, the temperature had more fluctuation at 6mm
elevated thermocouple, although it was very small difference.
As figure 54 and 55 show, mixtures of gum powder with 2g and 4g of
87

ketone based liquid solution ignited at 280 . The ignition temperature of ℃
gum powder alone was 270 , 10 lower than the gum powder mixture. With ℃ ℃
2g addition, the maximum temperatures of dust layer were 463 at 3mm ℃
high and 473 at 6mm high℃ . Glowing was observed. Although ignition did
not occur at lower temperatures than 280℃, some chars were formed on the
rim and bottom of the dust layer where dust layer was contacted with hot
surface. After glowing has traveled, white ashes were left as gum powder
alone was tested.
0
50
100
150
200
250
0 500 1000 1500 2000 2500 3000
Time (sec)
Tem
pera
ture
(℃)
at 3mm high
at 6mm high
Figure 50 : Gum powder (20g) with ketone-based liquid solution (1g) at 270℃
88
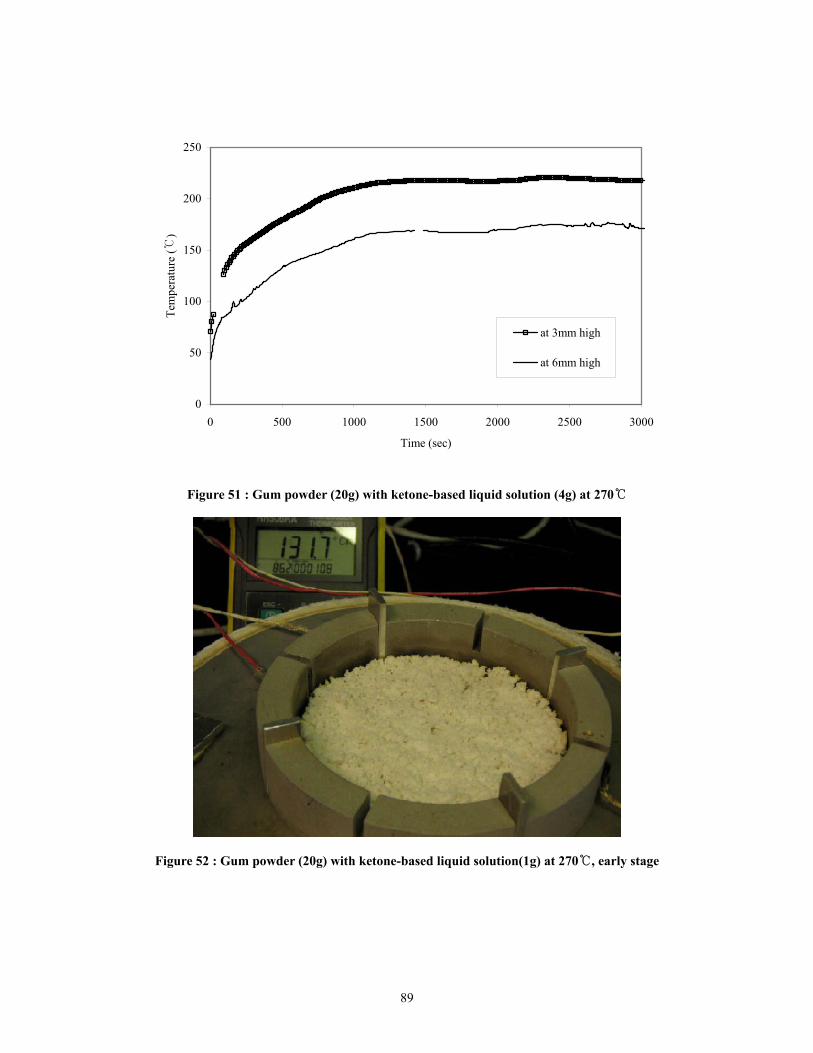
0
50
100
150
200
250
0 500 1000 1500 2000 2500 3000
Time (sec)
Tem
pera
ture
(℃)
at 3mm high
at 6mm high
Figure 51 : Gum powder (20g) with ketone-based liquid solution (4g) at 270℃
Figure 52 : Gum powder (20g) with ketone-based liquid solution(1g) at 270 , early stage℃
89

Figure 53 : Gum powder (20g) with ketone-based liquid solution (1g) at 270 , at the end of test℃
0
50
100
150
200
250
300
350
400
450
500
0 500 1000 1500 2000 2500 3000
Time (sec)
Tem
pera
ture
(℃)
at 3mm high
at 6mm high
Figure 54 : Gum powder (20g) with ketone-based liquid solution (2g) at 280℃
90
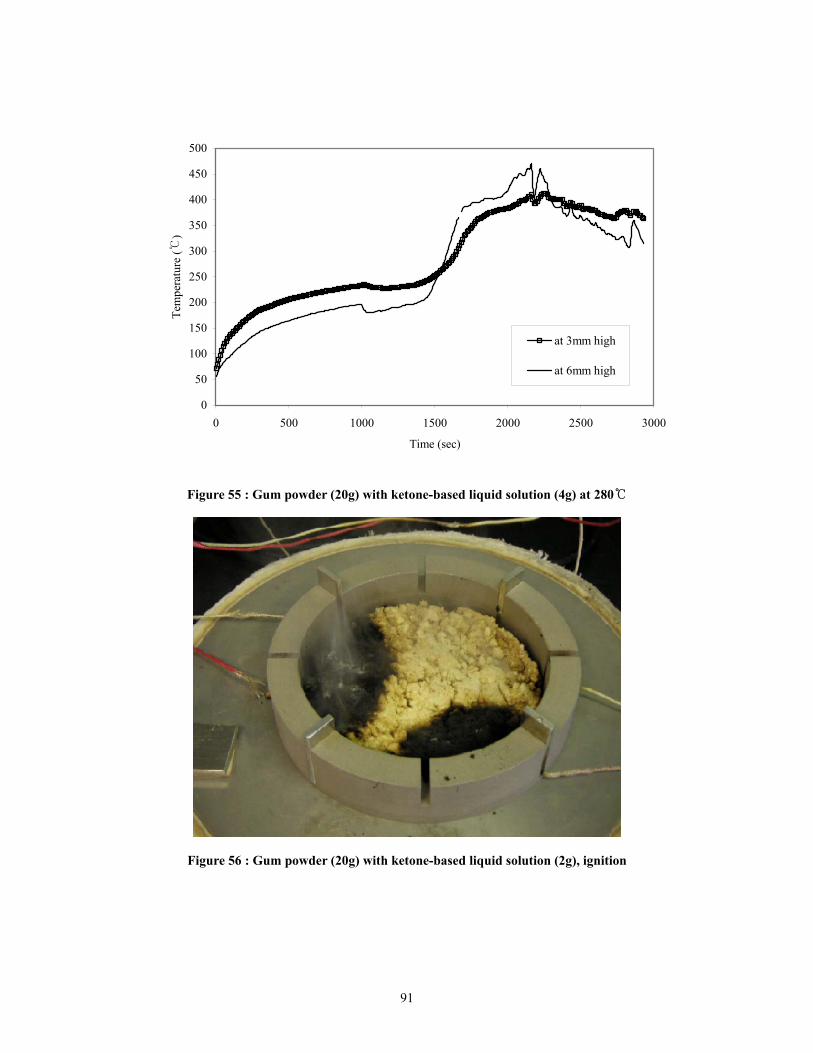
0
50
100
150
200
250
300
350
400
450
500
0 500 1000 1500 2000 2500 3000
Time (sec)
Tem
pera
ture
(℃)
at 3mm high
at 6mm high
Figure 55 : Gum powder (20g) with ketone-based liquid solution (4g) at 280℃
Figure 56 : Gum powder (20g) with ketone-based liquid solution (2g), ignition
91

Figure 57 : Gum powder (20g) with ketone-based liquid solution (2g), at the end of test
92
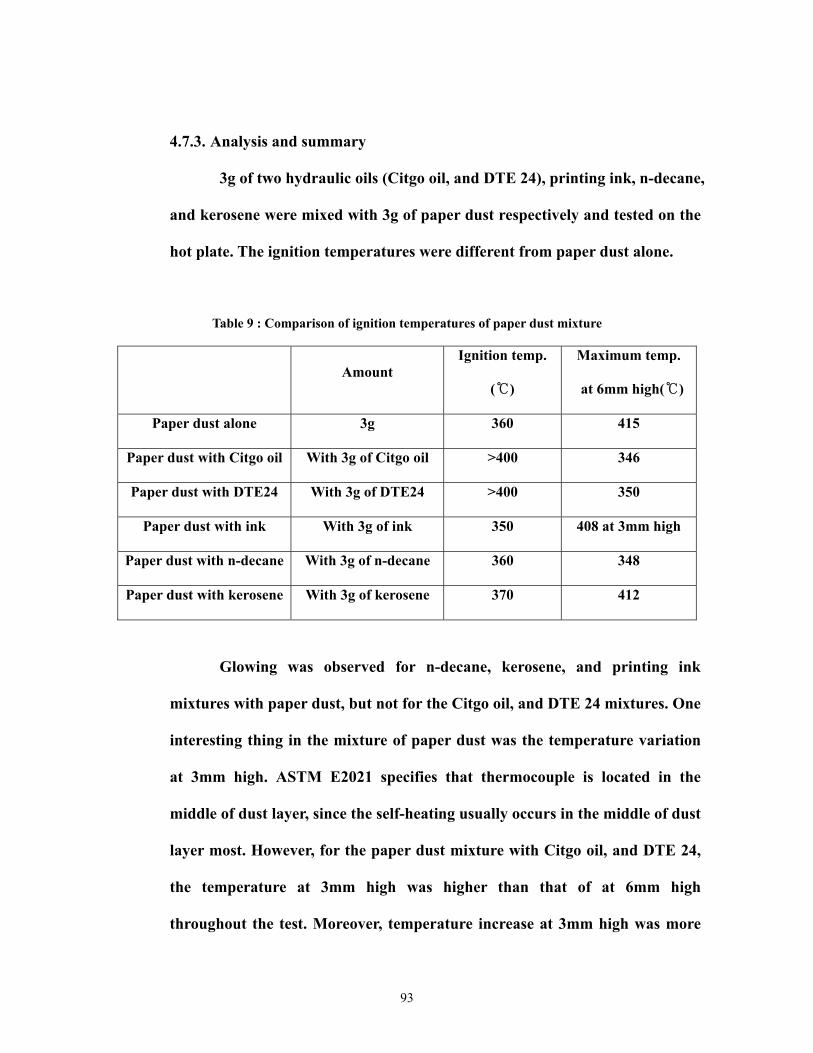
4.7.3. Analysis and summary
3g of two hydraulic oils (Citgo oil, and DTE 24), printing ink, n-decane,
and kerosene were mixed with 3g of paper dust respectively and tested on the
hot plate. The ignition temperatures were different from paper dust alone.
Table 9 : Comparison of ignition temperatures of paper dust mixture
Amount Ignition temp.
( )℃
Maximum temp.
at 6mm high( )℃
Paper dust alone 3g 360 415
Paper dust with Citgo oil With 3g of Citgo oil >400 346
Paper dust with DTE24 With 3g of DTE24 >400 350
Paper dust with ink With 3g of ink 350 408 at 3mm high
Paper dust with n-decane With 3g of n-decane 360 348
Paper dust with kerosene With 3g of kerosene 370 412
Glowing was observed for n-decane, kerosene, and printing ink
mixtures with paper dust, but not for the Citgo oil, and DTE 24 mixtures. One
interesting thing in the mixture of paper dust was the temperature variation
at 3mm high. ASTM E2021 specifies that thermocouple is located in the
middle of dust layer, since the self-heating usually occurs in the middle of dust
layer most. However, for the paper dust mixture with Citgo oil, and DTE 24,
the temperature at 3mm high was higher than that of at 6mm high
throughout the test. Moreover, temperature increase at 3mm high was more
93
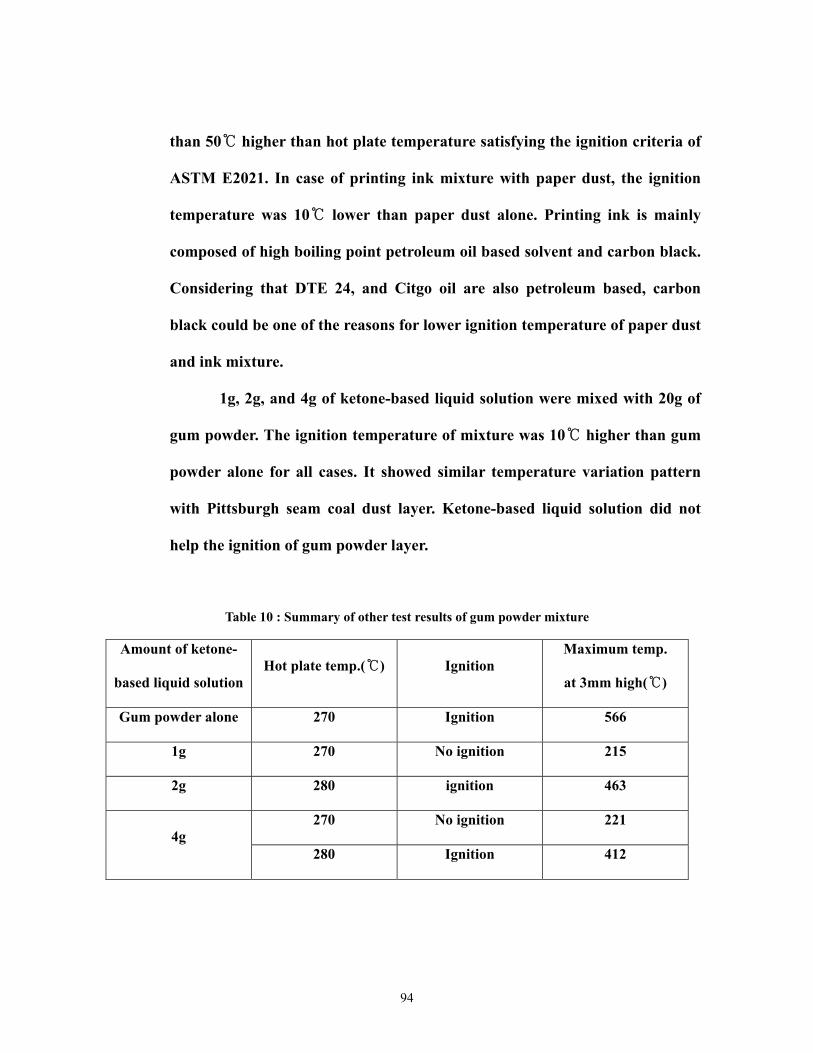
than 50 higher than hot plate temperature sa℃ tisfying the ignition criteria of
ASTM E2021. In case of printing ink mixture with paper dust, the ignition
temperature was 10 lower than paper dust alone. Printing ink is ℃ mainly
composed of high boiling point petroleum oil based solvent and carbon black.
Considering that DTE 24, and Citgo oil are also petroleum based, carbon
black could be one of the reasons for lower ignition temperature of paper dust
and ink mixture.
1g, 2g, and 4g of ketone-based liquid solution were mixed with 20g of
gum powder. The ignition temperature of mixture was 10 higher than gum ℃
powder alone for all cases. It showed similar temperature variation pattern
with Pittsburgh seam coal dust layer. Ketone-based liquid solution did not
help the ignition of gum powder layer.
Table 10 : Summary of other test results of gum powder mixture
Amount of ketone-
based liquid solution Hot plate temp.( )℃ Ignition
Maximum temp.
at 3mm high( )℃
Gum powder alone 270 Ignition 566
1g 270 No ignition 215
2g 280 ignition 463
270 No ignition 221 4g
280 Ignition 412
94
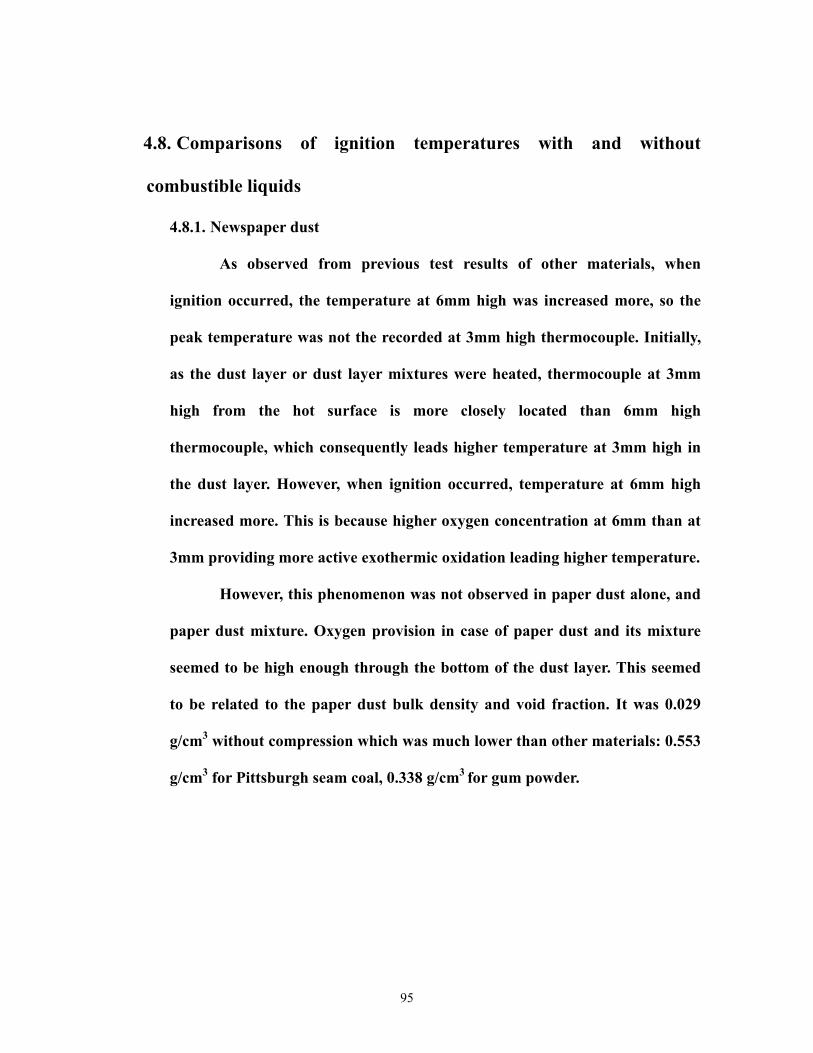
4.8. Comparisons of ignition temperatures with and without
combustible liquids
4.8.1. Newspaper dust
As observed from previous test results of other materials, when
ignition occurred, the temperature at 6mm high was increased more, so the
peak temperature was not the recorded at 3mm high thermocouple. Initially,
as the dust layer or dust layer mixtures were heated, thermocouple at 3mm
high from the hot surface is more closely located than 6mm high
thermocouple, which consequently leads higher temperature at 3mm high in
the dust layer. However, when ignition occurred, temperature at 6mm high
increased more. This is because higher oxygen concentration at 6mm than at
3mm providing more active exothermic oxidation leading higher temperature.
However, this phenomenon was not observed in paper dust alone, and
paper dust mixture. Oxygen provision in case of paper dust and its mixture
seemed to be high enough through the bottom of the dust layer. This seemed
to be related to the paper dust bulk density and void fraction. It was 0.029
g/cm3 without compression which was much lower than other materials: 0.553
g/cm3 for Pittsburgh seam coal, 0.338 g/cm3 for gum powder.
95
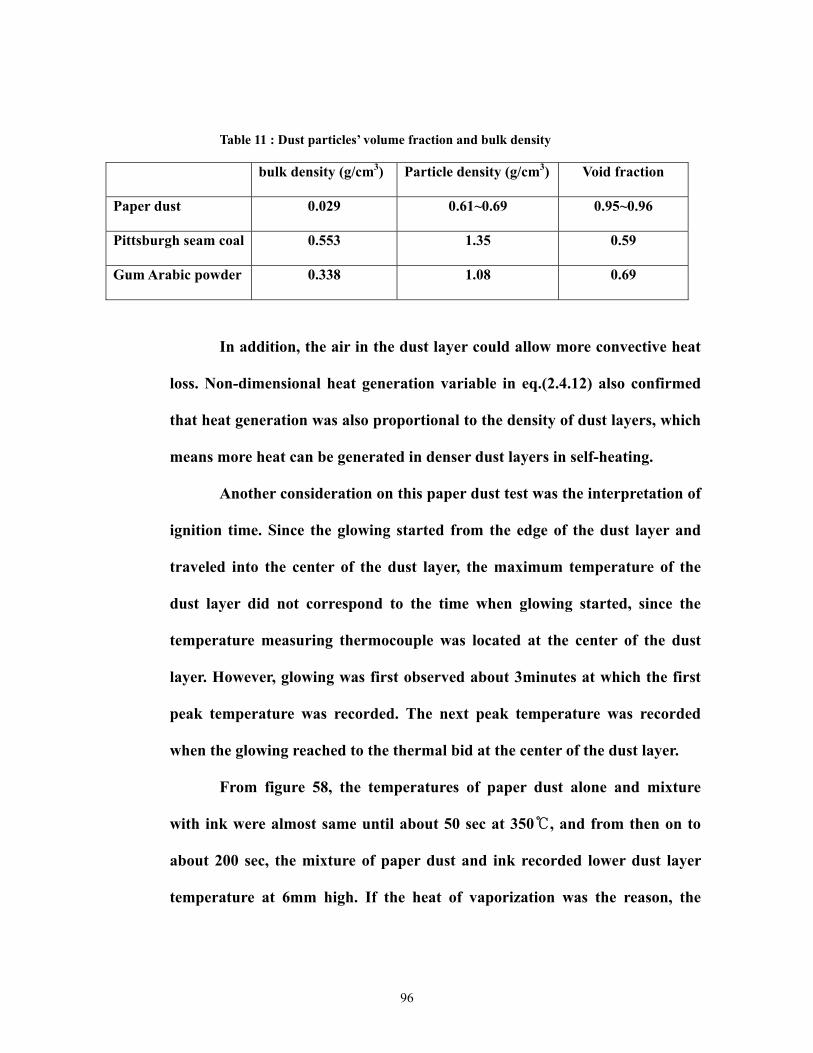
Table 11 : Dust particles’ volume fraction and bulk density
bulk density (g/cm3) Particle density (g/cm3) Void fraction
Paper dust 0.029 0.61~0.69 0.95~0.96
Pittsburgh seam coal 0.553 1.35 0.59
Gum Arabic powder 0.338 1.08 0.69
In addition, the air in the dust layer could allow more convective heat
loss. Non-dimensional heat generation variable in eq.(2.4.12) also confirmed
that heat generation was also proportional to the density of dust layers, which
means more heat can be generated in denser dust layers in self-heating.
Another consideration on this paper dust test was the interpretation of
ignition time. Since the glowing started from the edge of the dust layer and
traveled into the center of the dust layer, the maximum temperature of the
dust layer did not correspond to the time when glowing started, since the
temperature measuring thermocouple was located at the center of the dust
layer. However, glowing was first observed about 3minutes at which the first
peak temperature was recorded. The next peak temperature was recorded
when the glowing reached to the thermal bid at the center of the dust layer.
From figure 58, the temperatures of paper dust alone and mixture
with ink were almost same until about 50 sec at 350 , and from then on to ℃
about 200 sec, the mixture of paper dust and ink recorded lower dust layer
temperature at 6mm high. If the heat of vaporization was the reason, the
96
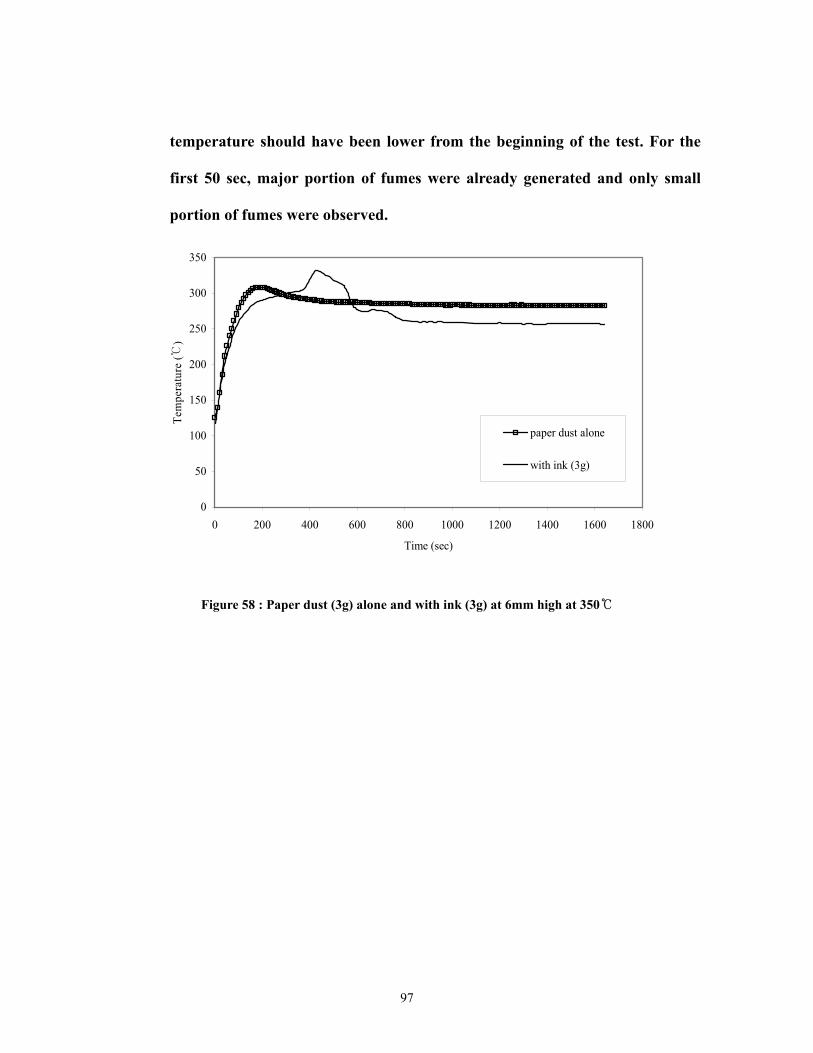
temperature should have been lower from the beginning of the test. For the
first 50 sec, major portion of fumes were already generated and only small
portion of fumes were observed.
0
50
100
150
200
250
300
350
0 200 400 600 800 1000 1200 1400 1600 1800
Time (sec)
Tem
pera
ture
(℃)
paper dust alone
with ink (3g)
Figure 58 : Paper dust (3g) alone and with ink (3g) at 6mm high at 350℃
97
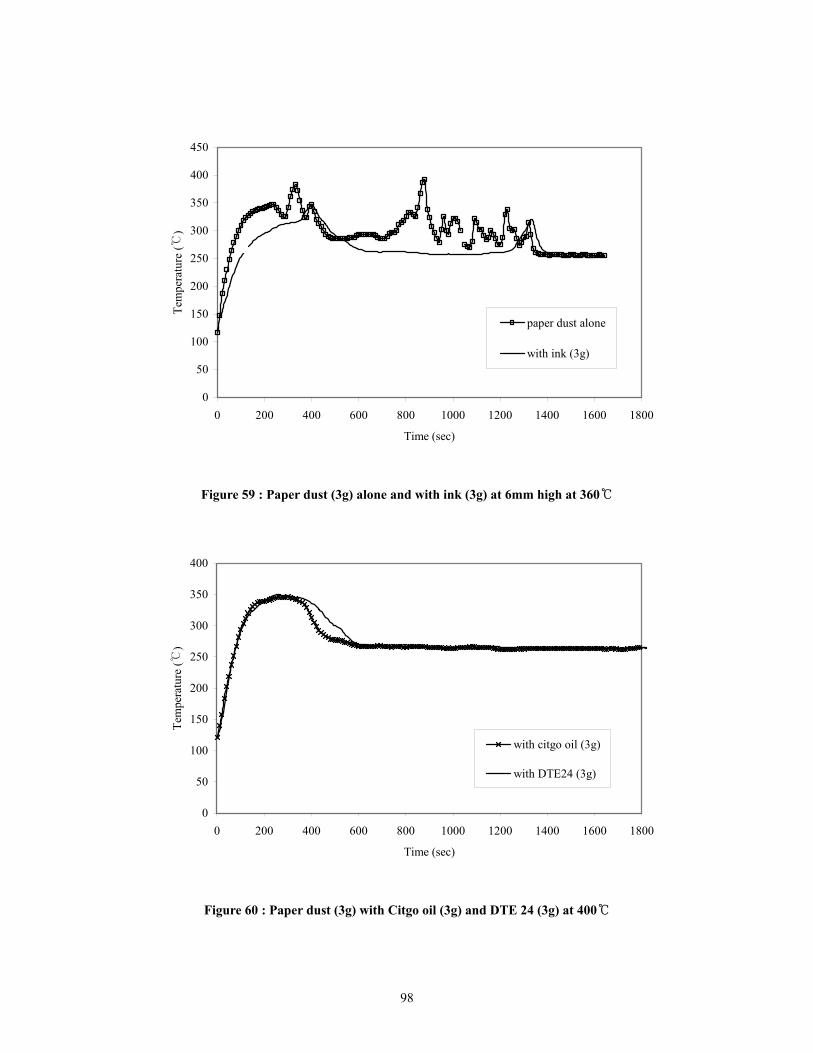
0
50
100
150
200
250
300
350
400
450
0 200 400 600 800 1000 1200 1400 1600 1800
Time (sec)
Tem
pera
ture
(℃)
paper dust alone
with ink (3g)
Figure 59 : Paper dust (3g) alone and with ink (3g) at 6mm high at 360℃
0
50
100
150
200
250
300
350
400
0 200 400 600 800 1000 1200 1400 1600 1800
Time (sec)
Tem
pera
ture
(℃)
with citgo oil (3g)
with DTE24 (3g)
Figure 60 : Paper dust (3g) with Citgo oil (3g) and DTE 24 (3g) at 400 ℃
98

The temperatures of paper dust mixture with Citgo oil and DTE 24 at
6mm high showed very similar temperature variation throughout the test
period. Those two combustible liquids have very similar flashpoints and AITs.
However, it was revealed that paper dust mixture with Citgo oil and DTE24
have higher ignition temperature than paper dust alone.
0
50
100
150
200
250
300
350
400
450
0 100 200 300 400 500 600
Time (sec)
Tem
pera
ture
(℃)
paper dust alone
with ink (3g)
with kerosene (3g)
Figure 61 : Paper dust (3g) alone, with ink (3g), and kerosene (3g) at 360 , ℃ first 600s
The temperatures at 6mm high of three different cases for the first 600
sec at 360 were compared in figure 6℃ 1. For the early 120 sec, the paper dust
mixture with ink and kerosene showed very similar temperature development
as different from the paper dust alone. At least early stage of hot plate test,
paper dust seemed to have higher temperature than other mixtures. This
99

indicates that the liquid saturated paper had a higher heat capacity than
paper dust alone.
100
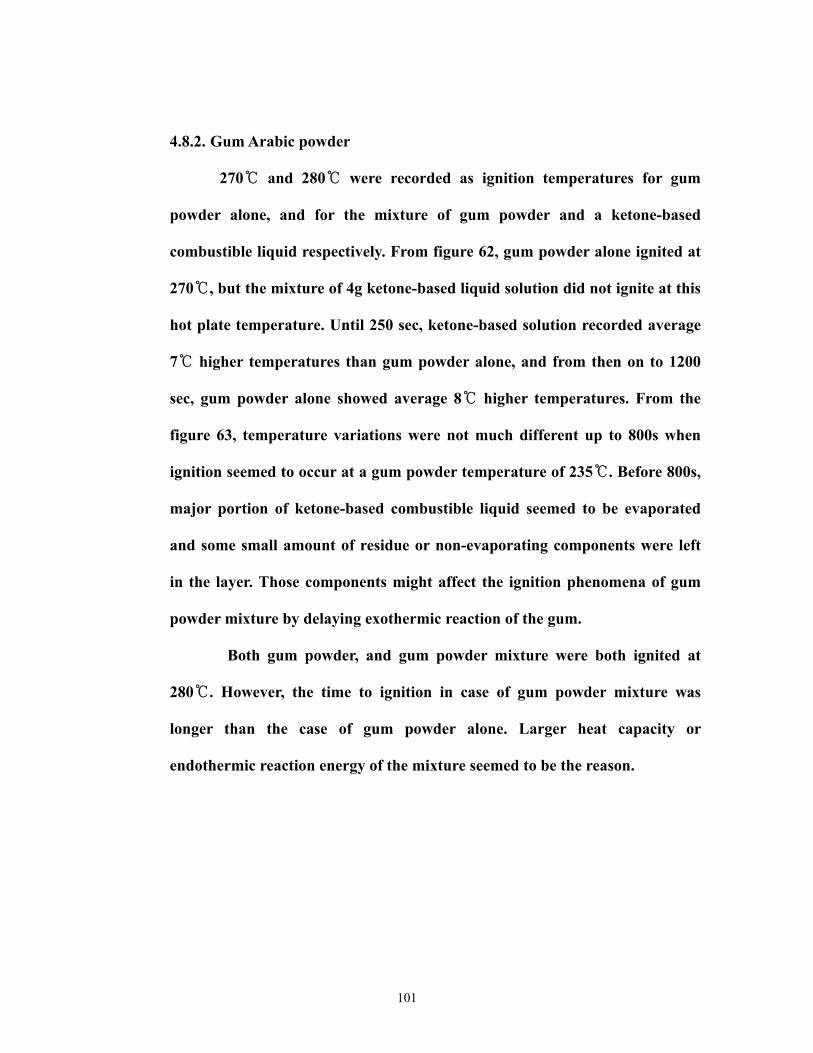
4.8.2. Gum Arabic powder
270 and℃ 280 were recorded as ignition temperatures for gum ℃
powder alone, and for the mixture of gum powder and a ketone-based
combustible liquid respectively. From figure 62, gum powder alone ignited at
270 , but the mixture of 4g ketone℃ -based liquid solution did not ignite at this
hot plate temperature. Until 250 sec, ketone-based solution recorded average
7 higher temperatures than gum powder alone, and from then on to 1200 ℃
sec, gum powder alone showed average 8 higher temperatures℃ . From the
figure 63, temperature variations were not much different up to 800s when
ignition seemed to occur at a gum powder temperature of 235℃. Before 800s,
major portion of ketone-based combustible liquid seemed to be evaporated
and some small amount of residue or non-evaporating components were left
in the layer. Those components might affect the ignition phenomena of gum
powder mixture by delaying exothermic reaction of the gum.
Both gum powder, and gum powder mixture were both ignited at
280 .℃ However, the time to ignition in case of gum powder mixture was
longer than the case of gum powder alone. Larger heat capacity or
endothermic reaction energy of the mixture seemed to be the reason.
101

0
50
100
150
200
250
300
350
400
450
500
550
600
0 500 1000 1500 2000 2500 3000 3500 4000
Time (sec)
Tem
pera
ture
(℃)
gum powder alone
with ketone-based solution(4g)
Figure 62 : Gum powder (20g) alone and with ketone-based liquid (4g) at 3mm high at 270℃
0
50
100
150
200
250
300
350
400
450
500
0 500 1000 1500 2000 2500 3000
Time (sec)
Tem
pera
ture
(℃)
gum powder alone
with ketone-based solution(2g)
Figure 63 : Gum powder (20g) alone and with ketone-based liquid (2g) at 3mm high at 280℃
102
4.9. Ignition temperature of Brass powder with stearic acid
With 10 wt % of stearic acid addition, the ignition temperature of brass
powder mixture was measured. In addition, 2, 4, 6, and 10 wt % of stearic acid
were tested with 30g of brass powder respectively. Stearic acid is usually used as a
brass powder coating material to prevent corrosion. It is not combustible. Its
meting point was 69.4 ℃ on the hot plate. Therefore, right after being put on the
hot plate, the brass powder mixture generated stearic acid vapors which was not
shown when brass powder alone was tested. Discoloration of brass powder layer
was also observed in the stearic acid mixture when it was heated which was not
observed in brass powder alone. As the mixture was heated, stearic acid was melt
and some of them seemed to be left in the dust layer having the particles get
together. At the end of test, brass powder was hardened and formed a semi –solid
chunks as shown in the figure 70 which was not observed in brass powder alone.
When the 3g (10 wt %) of stearic acid was mixed with 30g of brass powder, the
hot plate ignition temperature was 180 . When the ignition occurred, the period ℃
of peak temperature was very short compared to the Pittsburgh seam coal and
gum powder as shown in figure 65. The amount of brass powder involved to the
ignition seemed to be little or only part of brass powder where stearic acid left in
the dust layer seemed to be related to the ignition.
2, 4, 6, 10 wt % of stearic acid were mixed with 30g of brass powder to see the
effect of different amount of stearic acid on the ignition temperature. The more
amount of stearic acid were added, the lower ignition temperatures were recorded.
103
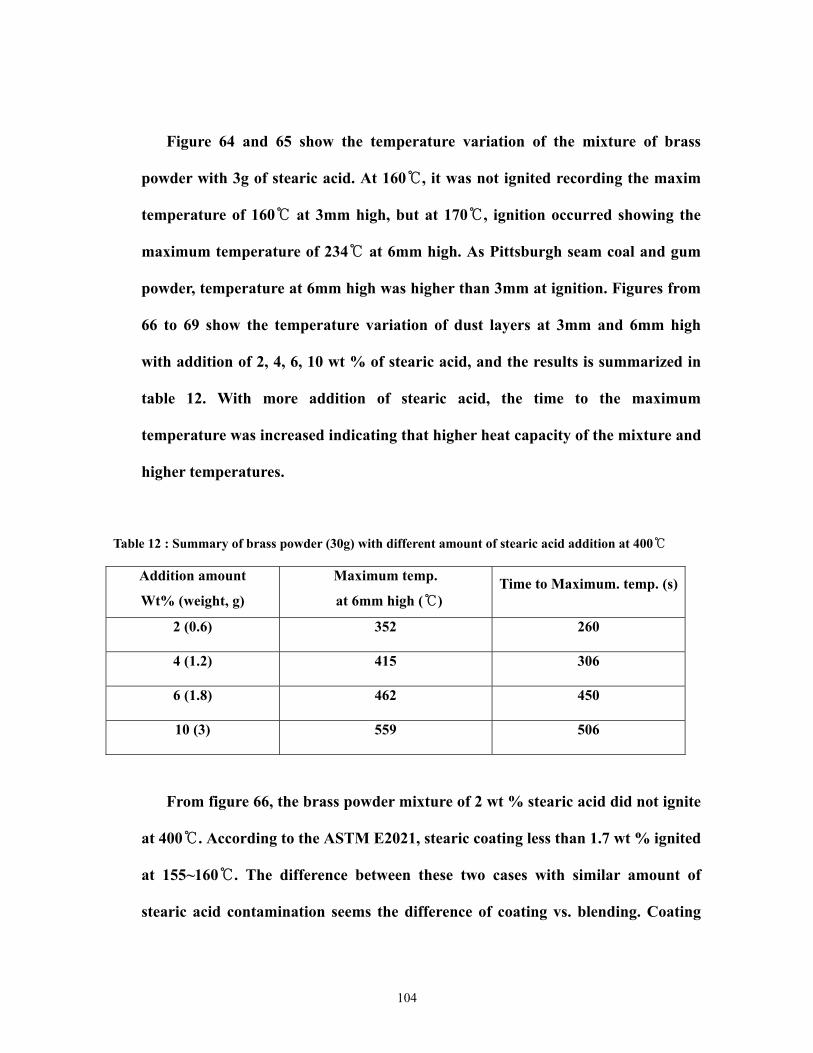
Figure 64 and 65 show the temperature variation of the mixture of brass
powder with 3g of stearic acid. At 160 , it was not ignited recording the maxim ℃
temperature of 160 at 3mm high, but at 170 , ignition occurred showing the ℃ ℃
maximum temperature of 234 at 6mm high. As Pitts℃ burgh seam coal and gum
powder, temperature at 6mm high was higher than 3mm at ignition. Figures from
66 to 69 show the temperature variation of dust layers at 3mm and 6mm high
with addition of 2, 4, 6, 10 wt % of stearic acid, and the results is summarized in
table 12. With more addition of stearic acid, the time to the maximum
temperature was increased indicating that higher heat capacity of the mixture and
higher temperatures.
Table 12 : Summary of brass powder (30g) with different amount of stearic acid addition at 400 ℃
Addition amount
Wt% (weight, g)
Maximum temp.
at 6mm high ( )℃ Time to Maximum. temp. (s)
2 (0.6) 352 260
4 (1.2) 415 306
6 (1.8) 462 450
10 (3) 559 506
From figure 66, the brass powder mixture of 2 wt % stearic acid did not ignite
at 400 . According to the ASTM E2021, stearic coating less than 1.7 wt % ignited ℃
at 155~160 . The difference between these two cases with similar amount of ℃
stearic acid contamination seems the difference of coating vs. blending. Coating
104

generates oxide layer on the surface of brass powder and it can decrease heat
conduction between particles holding higher temperature than simply mixed cases.
Another factor could be the vaporization of stearic acid being occurred right after
being located on the hot plate.
Brass powder is referred to a benchmarking test material in ASTM E2021.
However, the fact that the brass powder manufacturer mentioned in ASTM E2021
is not available any more, and that brass powders available in the market are
composed of various compositions having unknown coating level make it not
appropriate as a benchmarking test material.
0
20
40
60
80
100
120
140
160
180
0 200 400 600 800 1000 1200 1400 1600 1800 2000
Time (sec)
Tem
pera
ture
(℃)
at 3mm high
at 6mm high
Figure 64 : Brass powder (30g) with stearic acid (3g) at 170℃
105

0
50
100
150
200
250
0 200 400 600 800 1000 1200 1400 1600 1800 2000
Time (sec)
Tem
pera
ture
(℃)
at 3mm high
at 6mm high
Figure 65 : Brass powder (30g) with stearic acid (3g) at 180℃
0
50
100
150
200
250
300
350
400
0 200 400 600 800 1000 1200 1400 1600 1800 2000
Time (sec)
Tem
pera
ture
(℃)
at 3mm high
at 6mm high
Figure 66 : Brass powder (30g) with stearic acid (0.6g) at 400℃
106
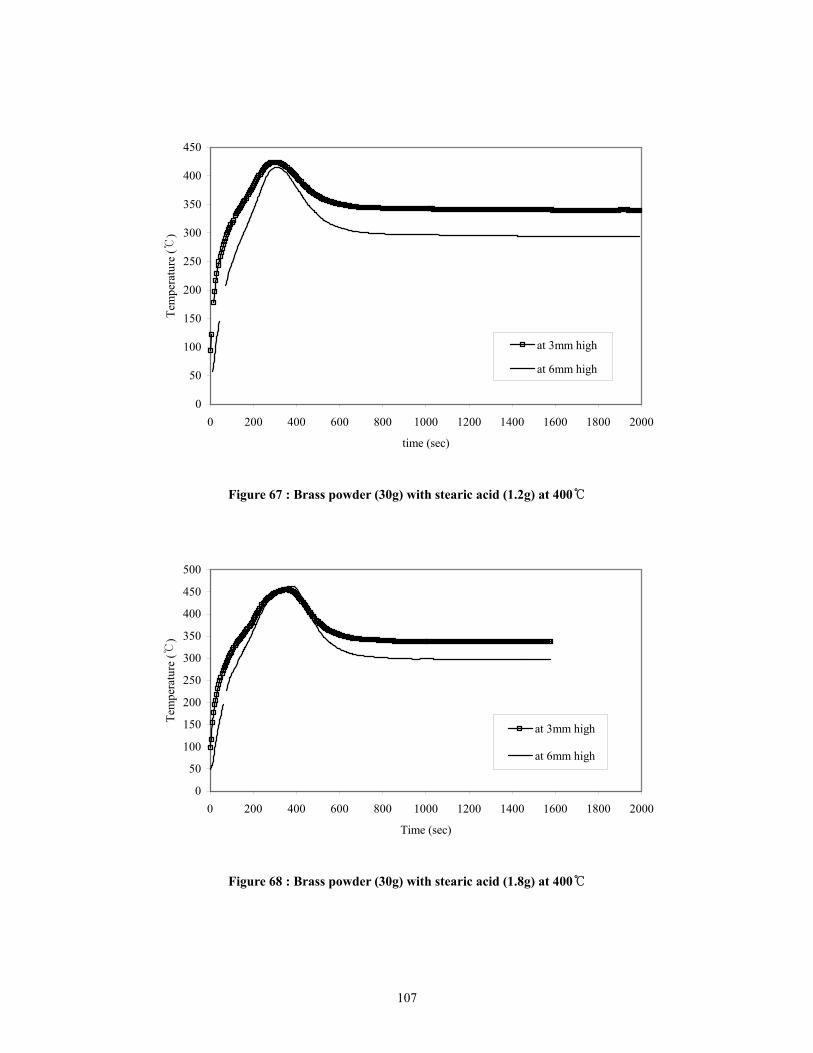
0
50
100
150
200
250
300
350
400
450
0 200 400 600 800 1000 1200 1400 1600 1800 2000
time (sec)
Tem
pera
ture
(℃)
at 3mm high
at 6mm high
Figure 67 : Brass powder (30g) with stearic acid (1.2g) at 400℃
0
50
100
150
200
250
300
350
400
450
500
0 200 400 600 800 1000 1200 1400 1600 1800 2000
Time (sec)
Tem
pera
ture
(℃)
at 3mm high
at 6mm high
Figure 68 : Brass powder (30g) with stearic acid (1.8g) at 400℃
107

0
100
200
300
400
500
600
0 200 400 600 800 1000 1200 1400 1600 1800 2000
Time (sec)
Tem
pera
ture
(℃)
at 3mm high
at 6mm high
Figure 69 : Brass powder (30g) with stearic acid (3g) at 400℃
Figure 70 : At the end of test of brass powder with 4% stearic acid at 400 ℃
108
4.10. Oxygen concentration in the Pittsburgh seam coal layer
How critical is oxygen concentration in the ignition of dust layers? Is ignition
controlled or limited by the oxygen concentration in the dust layer, or is the
limited oxygen concentration caused by ignition chemical reaction in dust layer?
Due to the distance from the layer surface, and particles’ oxidation as they are
heated, the oxygen concentration in the dust layer is not the same as in ambient
air condition. More oxidation would occur when dust particles heated more
resulting in less oxygen concentration level in the dust layer, and consequently,
less oxygen concentration can limit the oxidation possibly ending in not increasing
temperature any more.
By comparing the oxygen concentrations when ignition occurred and did not
occur, the relationship between oxygen concentration and temperature variation
can be explained to some extent. More oxidation of dust particles can increase
dust layer temperature and increased temperature will boost oxidation again at
over a critical temperature of hot plate.
Oxygen concentration was measured at 6mm above the hot plate in the
Pittsburgh seam coal dust layer using oxygen analyzer in a cone calorimeter. The
oxygen analyzer sampled air from the exhaust hood through a plastic tube and
analyzes it based on electric voltage difference corresponding to a certain oxygen
concentration difference. A small brass tube having some holes which was set in
the dust layer to sample air was connected to the plastic tube of cone calorimeter.
Ten small holes were made on the brass tube of 1/32 inch inner and 1/16 inch
109
outer diameter to sample enough amount of air to analyze. The number of holes
was decided based on several experiments. 24 gage thermocouple cover was used
to wrap the brass tube to prevent small Pittsburgh seam coal dust particle from
being sucked with sampled air to the oxygen analyzer. The rate of sampled air
maintained at 200ml per minute for more exact analysis. The sampled air passes
through all the filters, which are fiber glass heavy particulate filter, 10 ㎛ filter,
HEPA filter, acid filter, and then maintained at constant temperature and
moisture passing through the cold trap. Then, two drierite desiccants, and
sodalime remove remaining moisture and carbon monoxide in the sampled air. At
last, oxygen analyzer measures the oxygen concentration at the end of these filters.
The oxygen analyzer was calibrated first with 100 % nitrogen gas (0 %
oxygen) and ambient air (20.9% oxygen), and was spanned. 40sec of time lag was
observed between actual oxygen concentration in the dust layer and the values
calculated from the oxygen analyzer.
110

Figure 71 : Oxygen analyzer
Figure 72 : Brass tube coved by thermocouple cover at 6mm above the hot plate
111

4.10.1. When ignition occurred
Pittsburgh seam coal dust alone was ignited at 220 . ℃ However, some
of heat was taken out of the dust layer with hot sampled air. Therefore, at
220 , Pittsburgh seam coal dust with brass tube in it did not ignite at 220 , ℃ ℃
but 230 . ℃ As shown in figure 73, around 2000 sec, the rate of sampled air
from the brass tube in the dust layer dropped all of a sudden to the 10~20 ml
per minute which is one tenth of recommended air flow rate for the oxygen
analyzer. Therefore, after 2000 sec, the oxygen concentration does not seem to
be exact. At the end of test, the brass tube cover was blocked and stuck by the
oxidized Pittsburgh seam coal dust particles.
The minimum oxygen concentration recorded 6.2% at 2076 sec.
Oxygen concentration has changed from 19% to 6% within 1000 between ℃
about 1000s and 2000s while temperature has changed only about 50 . ℃ After
this oxygen concentration drop, dust layer temperature increased steeply. Rolf
K. Eckhoff(2003, p. 583) mentioned the fundamental aspect of dust cloud
explosion in his Dust Explosion in the Process Industries. In the process of
dust clouds ignited by hot surfaces, Oxygen concentration through the dust
clouds is one of the limiting factors in table 9.1. 6.2% oxygen concentration is
lower than the Limiting Oxygen Concentration for coal dust cloud flame
propagation, which is in the range of 12 ~ 15% from NFPA 69 table C.1(c),
Limiting Oxidant Concentrations for Combustible Dust Suspensions When
Using Nitrogen as a Diluent. This might not be directly analogous to the dust
112

layer on the hot surface, but the oxygen limitation in the dust layer seemed to
be one of the factors that prevented flaming ignition.
0
50
100
150
200
250
300
350
400
450
500
1000 2000 3000 4000 5000 6000
Time (sec)
Tem
pera
ture
(℃
)
5
7
9
11
13
15
17
19
21
O2(
vol%
)at 3mm highat 6mm highO2 vol %
Figure 73 : Oxygen concentration at 6mm high, Pittsburgh seam coal at 230℃
113

Figure 74 : Pittsburgh seam coal when ignition occurred
114

4.10.2. When ignition did not occur
Ignition did not occurred at 220℃ as shown in figure 75. At 220 , ℃
Pittsburgh seam coal dust was ignited without air sampling brass tube. With
brass tube in it, heat was taken away with air, and same amount of new cool
air filled the space in the dust layer. Oxygen concentration was dropped to
19.8% around 950 sec and maintained for about 300 sec until 1250 sec. At this
period, dust layer temperature did not changed much, only about 6 from ℃
199 to 205 . At early stage, until 500s, temperature has changed a lot more ℃ ℃
than other periods. Oxygen concentration change corresponded to the
temperature change to some extent, but it only showed general trends, not
proportional relationship.
0
50
100
150
200
250
500 1000 1500 2000 2500 3000 3500
Time (sec)
Tem
pera
ture
('c)
5
7
9
11
13
15
17
19
21
O2
vol %
at 3mm high
at 6mm high
O2 vol %
Figure 75 : Oxygen concentration at 6mm high, Pittsburgh seam coal at 220℃
115
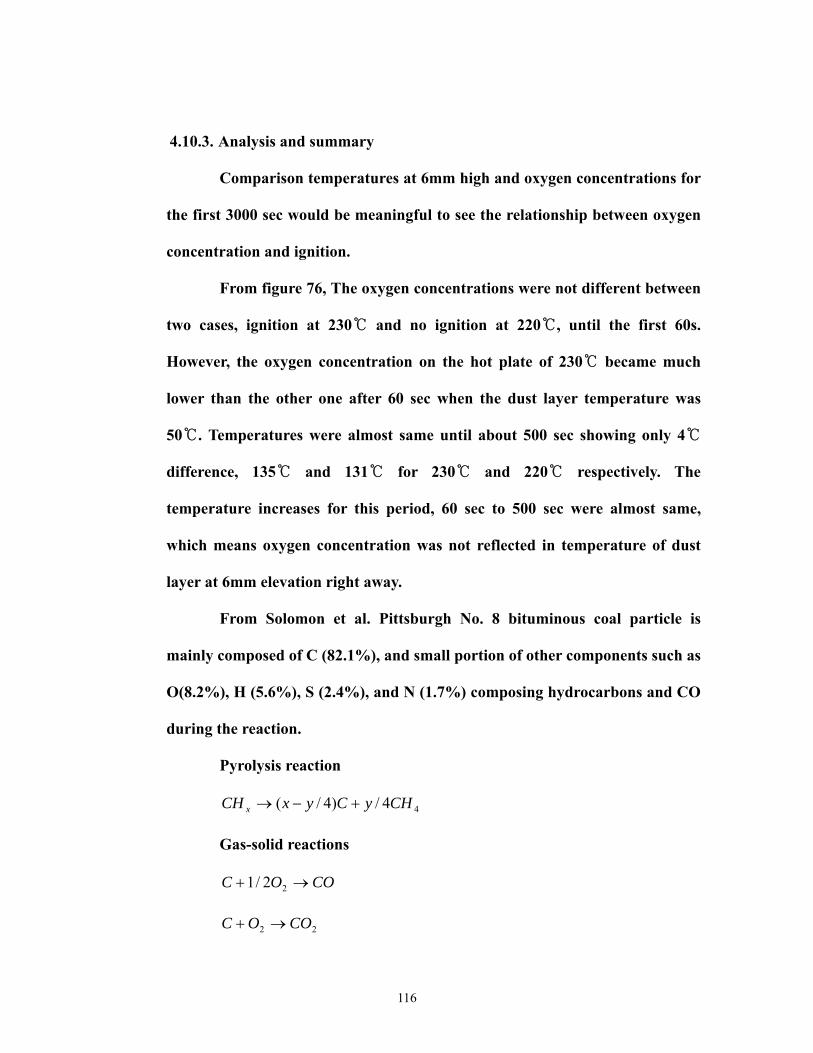
4.10.3. Analysis and summary
Comparison temperatures at 6mm high and oxygen concentrations for
the first 3000 sec would be meaningful to see the relationship between oxygen
concentration and ignition.
From figure 76, The oxygen concentrations were not different between
two cases, ignition at 230 and no ignition at 220℃ ℃, until the first 60s.
However, the oxygen concentration on the hot plate of 230 became much ℃
lower than the other one after 60 sec when the dust layer temperature was
50℃. Temperatures were almost same until about 500 sec showing only 4 ℃
difference, 135 and 131 for 230 and 220 respectively. ℃ ℃ ℃ ℃ The
temperature increases for this period, 60 sec to 500 sec were almost same,
which means oxygen concentration was not reflected in temperature of dust
layer at 6mm elevation right away.
From Solomon et al. Pittsburgh No. 8 bituminous coal particle is
mainly composed of C (82.1%), and small portion of other components such as
O(8.2%), H (5.6%), S (2.4%), and N (1.7%) composing hydrocarbons and CO
during the reaction.
Pyrolysis reaction
44/)4/( CHyCyxCH x +−→
Gas-solid reactions
COOC →+ 22/1
22 COOC →+
116

22 HCOOHC +→+
COCOC 22 →+
422 CHHC →+
Gas-gas reactions
222 COHOHCO +→+
OHCHHCO 2423 +→+
When the particle is heated, the first reaction is endothermic pyrolysis
reaction or devolatilization in which hydrocarbons are divided into carbon
and methane. And then exothermic gas-solid reactions producing carbon
monoxide, carbon dioxide, hydrogen, and methane are followed. In this period,
the major portion of exothermic reaction occurred in carbon monoxide and
dioxide production. As exothermic oxidation occurred generating more carbon
monoxide and dioxide, more heat was generated to increase the temperature
of dust layer, but not right away. There was some thermal lag time between
exothermic oxidation and the increase of dust layer temperature. This can be
explained by heat transfer lag time in the dust layer. Although oxygen
concentration was decreased which means exothermic reaction occurred in the
dust layer, most of the heat energy were stored as source heat energy to
increase oxidation more in the dust layer until when the dust layer
temperature reached 400 . ℃ In addition, the major portion of oxygen drop did
not occur in this period. Between 1000 sec and 1500 sec, oxygen dropped
117
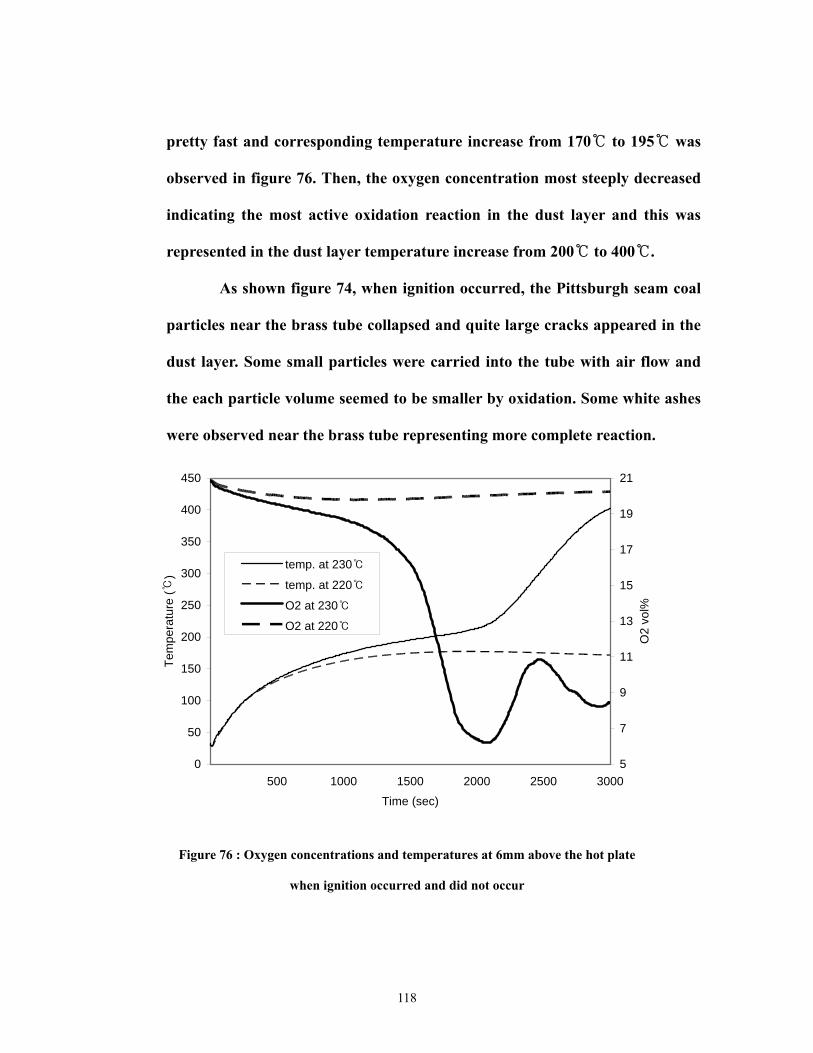
pretty fast and corresponding temperature increase from 170 to 195 ℃ ℃ was
observed in figure 76. Then, the oxygen concentration most steeply decreased
indicating the most active oxidation reaction in the dust layer and this was
represented in the dust layer temperature increase from 200 t℃ o 400 . ℃
As shown figure 74, when ignition occurred, the Pittsburgh seam coal
particles near the brass tube collapsed and quite large cracks appeared in the
dust layer. Some small particles were carried into the tube with air flow and
the each particle volume seemed to be smaller by oxidation. Some white ashes
were observed near the brass tube representing more complete reaction.
0
50
100
150
200
250
300
350
400
450
500 1000 1500 2000 2500 3000
Time (sec)
Tem
pera
ture
(℃)
5
7
9
11
13
15
17
19
21
O2
vol%
temp. at 230℃
temp. at 220℃
O2 at 230℃
O2 at 220℃
Figure 76 : Oxygen concentrations and temperatures at 6mm above the hot plate
when ignition occurred and did not occur
118
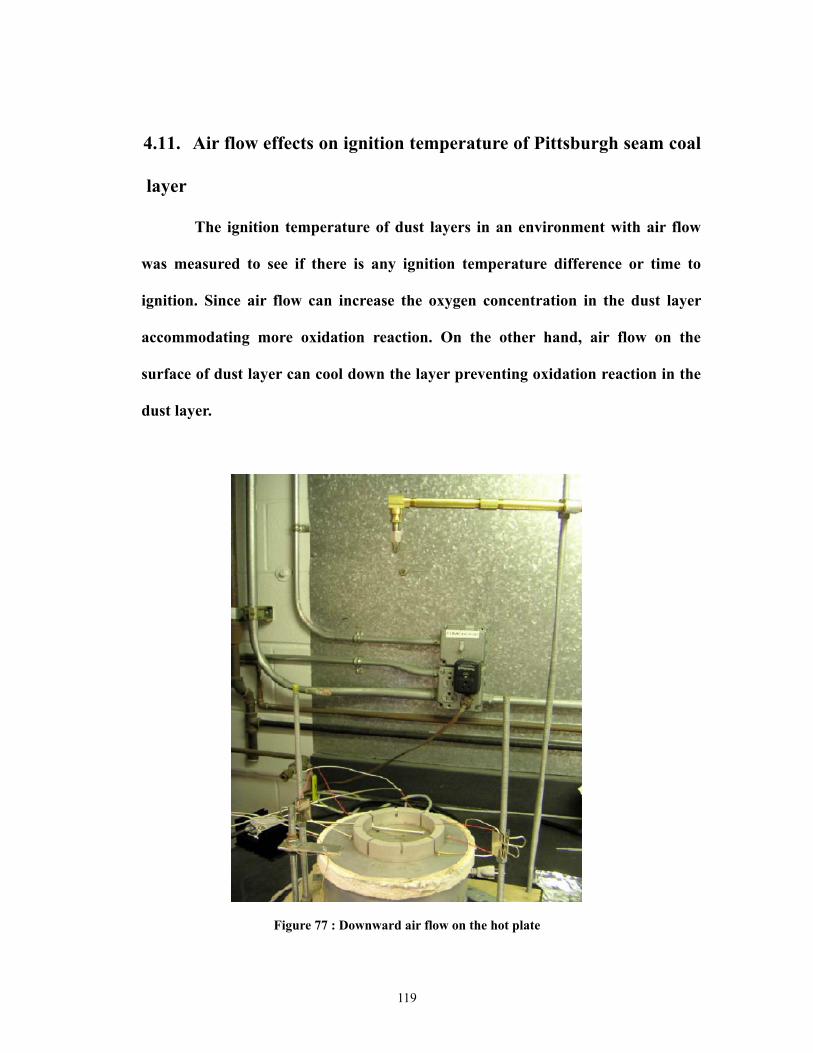
4.11. Air flow effects on ignition temperature of Pittsburgh seam coal
layer
The ignition temperature of dust layers in an environment with air flow
was measured to see if there is any ignition temperature difference or time to
ignition. Since air flow can increase the oxygen concentration in the dust layer
accommodating more oxidation reaction. On the other hand, air flow on the
surface of dust layer can cool down the layer preventing oxidation reaction in the
dust layer.
Figure 77 : Downward air flow on the hot plate
119
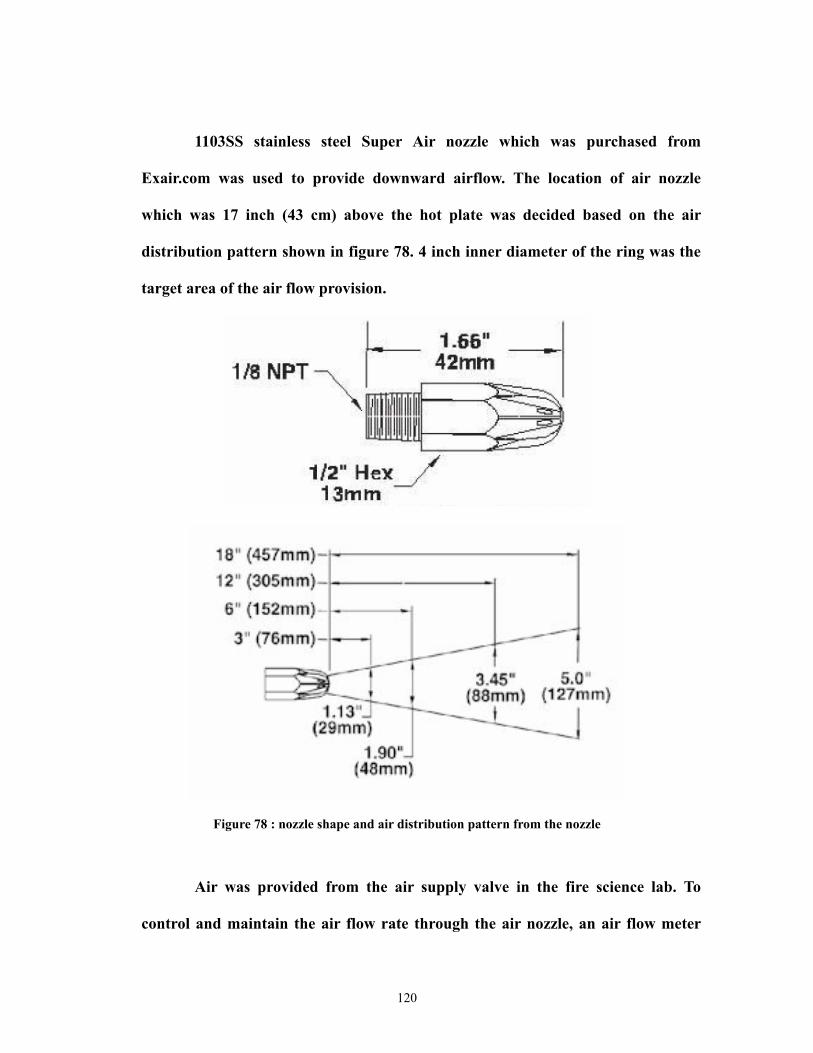
1103SS stainless steel Super Air nozzle which was purchased from
Exair.com was used to provide downward airflow. The location of air nozzle
which was 17 inch (43 cm) above the hot plate was decided based on the air
distribution pattern shown in figure 78. 4 inch inner diameter of the ring was the
target area of the air flow provision.
Figure 78 : nozzle shape and air distribution pattern from the nozzle
Air was provided from the air supply valve in the fire science lab. To
control and maintain the air flow rate through the air nozzle, an air flow meter
120

with 5~ 60 SLPM capacities was installed between the air nozzle and built-in air
supply in the fire lab. Air flow was provided throughout the test, from when hot
plate was turned on, to the end of test. Air flow (cm/s) was measured on the
surface of half inch elevation inside ring by air velocity measuring instrument,
which is “Velocical model 8355.” for two minutes and average values were
selected. It has 2.5% uncertainty range in terms of air velocity between 0.15m/s to
50m/s.
Figure 79 : Air flow velocity measurement
Dust layer temperature variations at 220 and 230 without air flow ℃ ℃
were used as references as exact test results. However, all tests were conducted on
the test bench in the fire laboratory where inherent air flow exists due to the fume
hood located above the test bench; temperature comparison should be conducted
121
to verify the test results. With fume hood turned on, the air velocity at the 6mm
elevation corresponding to the top surface of dust layer in the ring was average
0.5 cm/s, which did not seem to affect the test results, though.
In addition, to see the effect of downward air flow on the dust layer
temperature, 6 SLPM and 15 SLPM air flow with fume hood turned on was
provided to the Pittsburgh seam coal dust layer. Air flows at the rates of 6 SLPM
and 15 SLPM corresponded to 2.5 cm/s and 33 cm/s respectively with the fume
hood turned on.
122
4.11.1. Without air flow, and with inherent air flow on the bench
In the laboratory without any air flow (average 0 cm/s on the surface
of dust layer for two minutes at 220℃), dust layer temperatures of pittsburgh
seam coal measured at 220 and 230 . As the tests ℃ ℃ are conducted on the test
bench where 0.5 cm/s air flow was measured due to the fume hood, it ignited
at 220℃ as shown in figure 80 and not ignited at 210 a℃ s shown in figure 15.
The hot surface ignition temperatures were not different, but the time to
ignitions were different as shown in the figure 81. Ignition of Pittsburgh seam
coal tested without air flow occurred about 1000 sec earlier than the test with
0.5 cm/s downward air flow provision. This seemed to be due to cooling effect
of air flow caused by the fume hood. Dust particles were oxidized generating
heat energy and reached the critical temperature where thermal runaway
occurred. This referred to the moment of steep temperature increase. Air flow
on the bench promoted oxygen concentration increase in the dust layer, but
also decreased the dust layer temperature by promoting more convective and
conductive heat transfer in the dust layer. Between those, the latter were more
dominating and resulted in longer time for ignition.
123
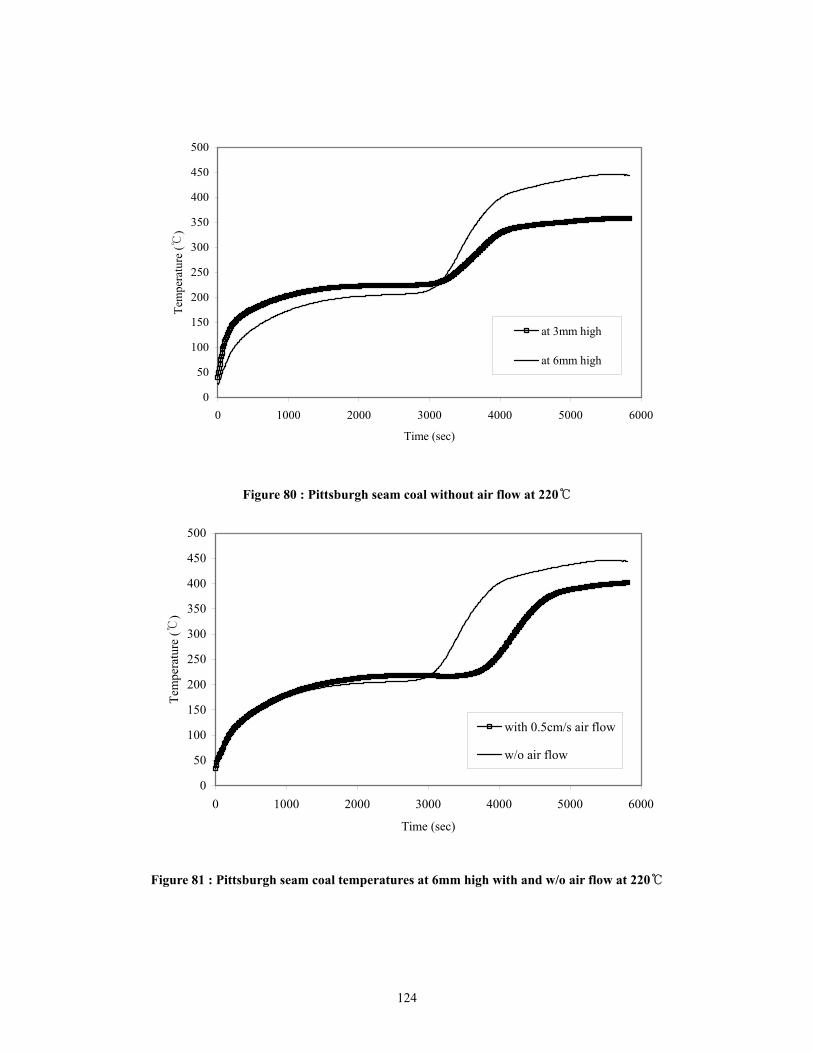
0
50
100
150
200
250
300
350
400
450
500
0 1000 2000 3000 4000 5000 6000
Time (sec)
Tem
pera
ture
(℃)
at 3mm high
at 6mm high
Figure 80 : Pittsburgh seam coal without air flow at 220℃
0
50
100
150
200
250
300
350
400
450
500
0 1000 2000 3000 4000 5000 6000
Time (sec)
Tem
pera
ture
(℃)
with 0.5cm/s air flow
w/o air flow
Figure 81 : Pittsburgh seam coal temperatures at 6mm high with and w/o air flow at 220 ℃
124
4.11.2. With downward air flow
6 SLPM (average 2.5 cm/s at the surface of dust layer) downward air
flow was provided to the Pittsburgh seam coal dust layer at 220℃, and the
temperature variation was compared with the result without air flow. Figure
82 shows different dust layer temperatures at 6mm high without air flow, and
with 6 SLPM (average 2.5 cm/s) downward air flow. Ignition time of the test
conducted with 2.5 cm/s downward air flow was longer than the test without
air flow due to the cooling effect. The maximum temperature was recorded
almost same as about 450 at 565℃ 0 sec.
Increased air flow rate (15 SLPM) was provided to the Pittsburgh
seam coal dust layer on the bench to see if there is ignition temperature
difference. Without extra downward air flow, the dust layer was ignited at
220 , but with 15 SLPM air flow, t℃ he ignition did not occur in the dust layer
at 230 , as is evident from the temperature data in figure ℃ 83. 15 SLPM
corresponded to the air velocity of about 33 cm/s at the elevation of the top
surface of the dust layer inside the ring.
125

0
50
100
150
200
250
300
350
400
450
500
0 1000 2000 3000 4000 5000 6000
Time (sec)
Tem
pera
ture
(℃)
w/o air flow
with 2.5cm/s air flow
Figure 82 : Comparison of dust layer at 6mm high with and without air flow at 220℃
0
50
100
150
200
250
0 500 1000 1500 2000 2500 3000 3500 4000
Time (sec)
Tem
pera
ture
(℃)
at 3mm high
a 6mm high
Figure 83 : Pittsburgh seam coal with 15SLPM downward air flow on the bench at 230℃
126

4.11.3. Analysis and summary
It was revealed that the cooling effect of 2.5 cm/s air flow on the
Pittsburgh seam coal dust layer increased the time to ignition Oxygen
diffusion into the Pittsburgh seam coal dust layer by the downward air flow is
manifest, but not as strong as cooling effect. With 33 cm/s downward airflow
on the bench, Pittsburgh seam coal was not ignited at 230 which is 10 ℃ ℃
higher than the ignition temperature without airflow.
In addition, considering the oxygen concentration level when ignition
did not occur from figure 75, the lowest oxygen concentration is about 19%
which seemed to more than enough to accommodate ignition of Pittsburgh
seam coal dust layer. The dust layer temperature seems more important
factor than oxygen concentration level, even by external airflow at least for
this test environment. For highly piled Pittsburgh seam coal dust layer, in the
middle of which oxygen level might be much lower than the test cases in this
thesis, oxygen concentration can be a critical issue for ignition.
127

5. Application of test results to ASTM E2021 Standard
ASTM E2021 provides a very good test procedure for the hot plate ignition
temperature of dust layers. However, the Standard should have at least consider
adding more specific information on benchmarking test materials, air flow
requirements, and contaminant effects, as explained below. It would also be advisable
to use two thermocouples in the dust layers to allow a more reliable indication of
ignition, as will also be explained below.
Two of the benchmark combustible dusts cited in the standard cannot easily
be obtained now. In particular, the stearic acid coated brass powder is no longer
commercially available, at least not from the original supplier. Test results in this
thesis show that a mixture of 10 weight percent stearic acid in uncoated brass flakes
has an ignition temperature of 170℃. If this temperature can be confirmed by tests at
another laboratory, it would make a good candidate benchmark material.
The air flow effects measured in this thesis demonstrate that fume hood air
velocities of about 0.5 cm/s and imposed air velocities of 2.5 cm/s at the elevation of the
dust layer surface do not affect test results, but an air velocity of 33 cm/s did cause an
increase in the minimum hot surface ignition temperature. Therefore, the Standard
should specifically prohibit air currents greater than about 4 or 5 cm/s during testing.
The contaminant effect testing in this thesis showed that addition of as little as
6 weight percent stearic acid can significantly reduce the hot surface ignition
temperature of brass powder. Therefore, the Standard might specify that the test
128

results only apply to materials that have no more than 1 or 2 wt% added components
to the nominal composition of the test material.
Whenever ignition occurred with the combustible powders alone, the
temperature measured at the 6 mm elevation in the dust layer eventually became
higher than the temperature at the 3 mm elevation. This inversion of temperatures
did not occur without any ignition. Therefore, a new criterion for ignition could be
the use of two thermocouples in the layer, with the higher thermocouple temperature
becoming greater than the temperature of the lower thermocouple. Since this
inversion did not always occur when combustible liquid added to paper dust resulted
in ignition, this temperature inversion criterion should not entirely replace some
minimum temperature rise criterion. Instead, it is offered as a second criterion to
produce clear evidence of oxidation at the mid elevation of the dust layer, and an
oxygen-limited combustion at the lower elevation. As one of the ignition criteria in the
hot plate ignition test condition for some dust, temperature inversion of at 3mm and
6mm high from the hot plate might be possible.
Another reason for the use of two thermocouples is that the highest
temperature was not always recorded in the middle of a dust layer. For example, as
shown in figure 40, ignition was observed from the thermocouple at 3mm high in the
mixture of paper dust with ink. This ignition criterion is based on the ASTM E2021
standard, which is the dust layer temperature increase more than 50C above the hot
plate temperature. Therefore, when ignition occurred, the highest temperature can be
recorded at different elevations, not always in the middle of the dust layers.
129

Although tests were not conducted with varying bulk densities of a particular
material, heat and oxygen mass transfer considerations suggest that the bulk density
can be an important factor in hot surface ignition temperature of dust layers. Thus,
the bulk density should be reported in ASTM E2021 tests.
130
6. Conclusions and Recommendations
The minimum hot plate ignition temperatures of various dust materials were
measured with and without addition of combustible liquids. A half inch thick layer of
paper dust alone in the 4 inch inner diameter ring on a hot plate was ignited when the
hot plate temperature was at or above 360℃ with addition of 50 weight percent of
two hydrocarbon base hydraulic oils commonly used on printing presses, the paper
dust mixtures did not ignite until the hot plate temperature reached 400℃. With the
same 3g addition of newspaper printing ink (50 weight %), the ignition temperature of
paper dust mixture with a newspaper printing ink was reduced to 350℃ which was
10℃ lower than news paper dust layer alone. Overall, paper dust test results
demonstrated that the addition of combustible liquids does not seem to lower the hot
surface ignition temperature by more than 10℃, and in most cases increase the hot
surface ignition temperatures.
Gum powder mixed with a ketone-based liquid solution, which is of the gum
powder processing, resulted in a slightly higher than hot surface ignition temperature.
The hot plate ignition temperatures were 270℃ for gum powder alone, and 280℃ for
the mixture of gum powder with 0.5 to 2 wt% ketone-based liquid solution.
Downward air flow was provided to see if there is any effect on the hot surface
ignition temperatures of dust layers. With 15 SLPM downward air flow (33 cm/s at
the top of dust layer), the Pittsburgh seam coal did not ignite at 230℃. Without air
131
flow, it was ignited at 220℃. When the ignition did not occur, the oxygen
concentration was above 19 vol% which is higher than the 17 vol% Limiting Oxygen
Concentration for combustion of coal dust clouds. Therefore, the slightly reduced
oxygen concentration in the Pittsburgh seam coal dust layer is not the critical factor
that can change the hot plate ignition temperature, for dust layer bulk densities from
about 0.03 to 0.55 g/cm3 of tested materials. Since there is sufficient oxygen to support
combustion in the absence of air flow, the reduced hot surface ignition temperatures
with air flow are probably due to the increased convective heat loss at the dust layer
free surface.
Stearic acid was added to the brass powder dust layer. Half inch brass powder did
not ignite until the hot plate temperature reached 400℃. However, small amount of
stearic acid addition resulted in large decrease of hot plate ignition temperature. 30g
of brass powder with 3g of stearic acid addition was ignited at 180. This is more than
200℃ different from the ignition temperature of brass powder alone. Since brass
powder is used as a benchmarking test material in ASTM E2021, it may be advisable
to change the current imprecise specification of a stearic acid coating which is <1.7
wt %, to a more precise mixture of uncoated brass powder with 10 wt % stearic acid
addition to produce a 180 hot surface ignition temperature.
Clearer criteria for ignition definition in the ASTM and IEC hot surface ignition
standards should be considered. Although ASTM E2021 stated 50℃ or more
difference between the hot plate temperature and the thermocouple in the middle of
132
dust layer, as observed in the case of paper dust mixture with ink, the temperature in
another location of dust layer, not in the middle of dust layers, can be higher than in
the middle of dust layer. In many other tests, the temperature at the lower elevation
was greater than the temperature at the mid elevation prior to ignition, but became
less than the mid elevation temperature after combustion occurred in the layer.
133

References
1Y. Miron and C. P. Lazzara, Hot-surface Ignition Temperatures of Dust Layers, Fire and
Materials, Vol. 12, p. 115~126, 1988
2P. C. Bowes and S. E. Townshend, Ignition of Combustible Dusts on Hot Surfaces, BRIT.
J. APPL. PHYS, Vol. 13, 1962
3G. A. Lunn, Testing Methods for Electrical Apparatus Installed in a Dusty Environment
with a Potential Risk of Explosion, SMT-CT98-2273, 2001
4B. J. Tyler and D. K. Henderson, Spontaneous Ignition in Dust Layers: Comparison of
Experimental and Calculated Values, IChemE Symposium Series No. 102, p.45~59, 1987
5ASTM E2021-01, Standard Test Method for Hot-Surface Ignition Temperature of Dust
Layers, 2001
6AIChE, Guidelines for Safe Handling of Powders and Bulk Solids, chapter 4, Assessing
particle hazards, 2004
7Robert G. Zalosh, Industrial Fire Protection, p. 132, 2002
8Rolf K. Eckhoff, Dust Explosions in the Process Industries, p.583, 2003
134
9Vytenis Babrauskas, Ignition Handbook, p.207-210, p.369~383, 2003
10Dougal Drysdale, An Introduction to Fire Dynamics, 2nd ed. p. 197~200, 2001
11SFPE Handbook, 3rd ed. p.2-211~2-227
12N. Jackson, Boston globe, personal communication to R. Zalosh, 2004
13Michael A. Nowack et al. Coal Conversion, Encyclopedia of Energy, Vol. 1, p. 425~434,
2004
14Kiddie-Fenwal, report No. CRC-2556, November 8, 2005
15 B. R. Bhandari et al. Flavor Encapsulation by Spray Drying: Application to Citral and
Linalyl Acetate, J of food sciences, Vol. 57, No.1, 1992
16http://www.paperonweb.com/density.htm#density
17http://www.mcelwee.net/html/densities_of_various_materials.html
135

Appendix A: AITs of hydraulic oils
Tests conducted Test Method
Auto ignition temperature of liquid chemicals (AIT) ASTM E 659
1. Results
The Reaction Threshold Temperature (RTT), Cool Flame Temperature (CFT), and Auto-Ignition
Temperature (AIT) were determined at atmospheric pressure in air. The results are tabulated below.
Test Material Reference Materials
CITGO Hydraulic/ Press
Oil 68
DTE 24 n-Heptane Ethyl Alcohol
RTT1 (
oC) 290 281 207 363
CFT1 (
oC) 293 284 N/A 380
AIT1 (
oC)
308 359 215 388
1. ASTM Definitions:
RTT: Reaction threshold temperature for nonluminous pre-flame reaction. Typically, this is
evidenced by a weak and gradual temperature rise, which then falls off to the base
temperature.
CFT: Cool-flame autoignition temperature. Cool flames may occur at lower flask temperature then
hot flames. It is typically evidenced by a temperature rise of less than 100oC.
AIT: Hot-flame autoignition temperature. It is usually evidenced in these tests by hot flames of
various colors, usually yellow, red, or blue. Normally hot-flames produce sharp temperature
rises of at least a few hundred degrees or more.
2. All tests were conducted at Barometric Pressure of 29.8 inHg ± 0.2.
136
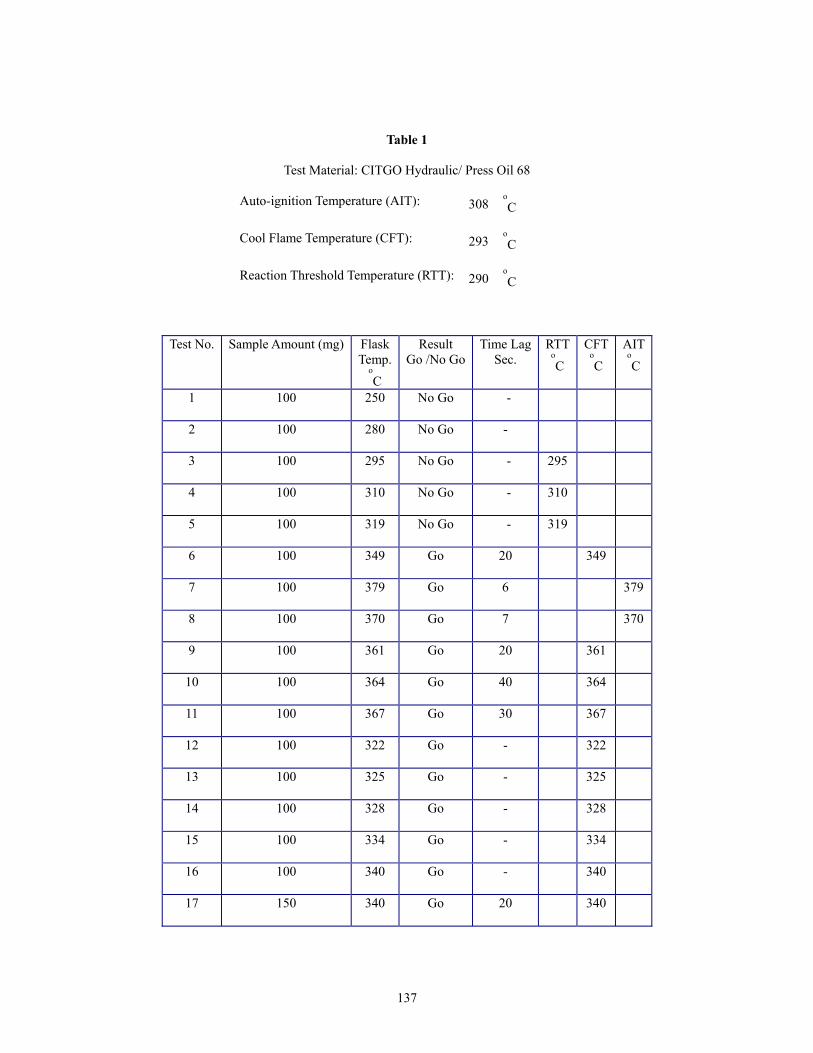
Table 1
Test Material: CITGO Hydraulic/ Press Oil 68
Auto-ignition Temperature (AIT): 308 oC
Cool Flame Temperature (CFT): 293 oC
Reaction Threshold Temperature (RTT): 290 oC
Test No. Sample Amount (mg) Flask Temp.
oC
Result Go /No Go
Time LagSec.
RTT oC
CFT oC
AIT oC
1 100 250 No Go -
2 100 280 No Go -
3 100 295 No Go - 295
4 100 310 No Go - 310
5 100 319 No Go - 319
6 100 349 Go 20 349
7 100 379 Go 6 379
8 100 370 Go 7 370
9 100 361 Go 20 361
10 100 364 Go 40 364
11 100 367 Go 30 367
12 100 322 Go - 322
13 100 325 Go - 325
14 100 328 Go - 328
15 100 334 Go - 334
16 100 340 Go - 340
17 150 340 Go 20 340
137
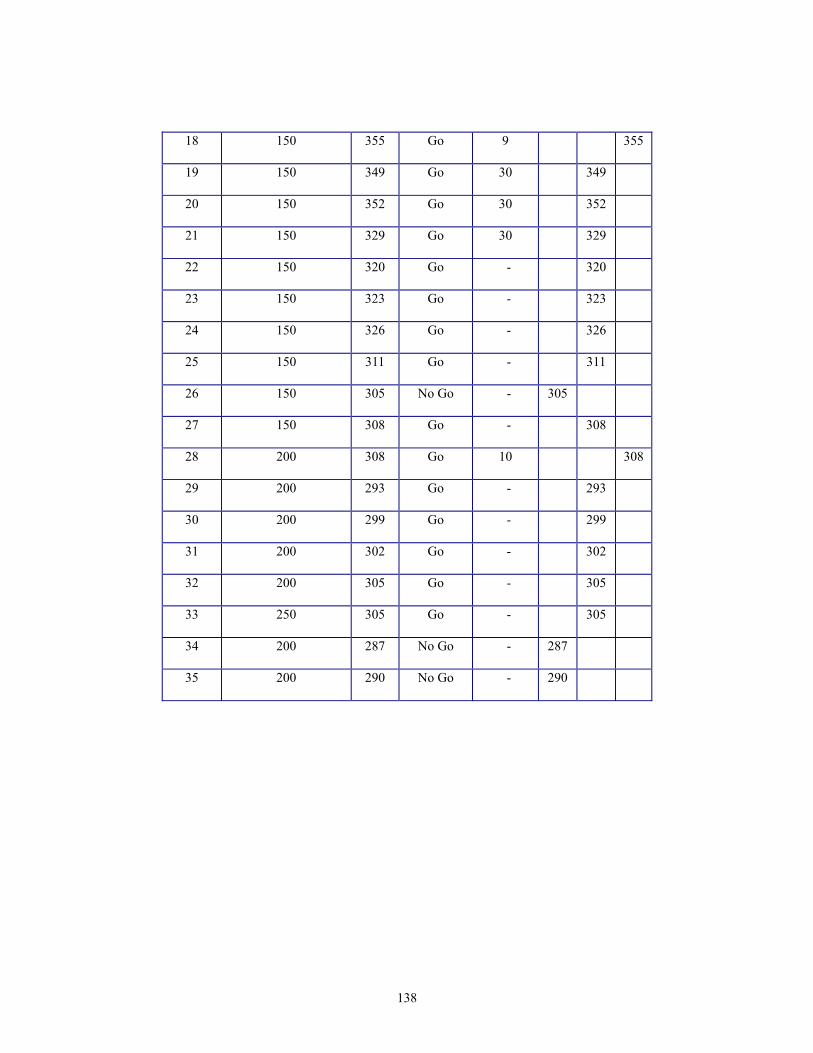
18 150 355 Go 9 355
19 150 349 Go 30 349
20 150 352 Go 30 352
21 150 329 Go 30 329
22 150 320 Go - 320
23 150 323 Go - 323
24 150 326 Go - 326
25 150 311 Go - 311
26 150 305 No Go - 305
27 150 308 Go - 308
28 200 308 Go 10 308
29 200 293 Go - 293
30 200 299 Go - 299
31 200 302 Go - 302
32 200 305 Go - 305
33 250 305 Go - 305
34 200 287 No Go - 287
35 200 290 No Go - 290
138
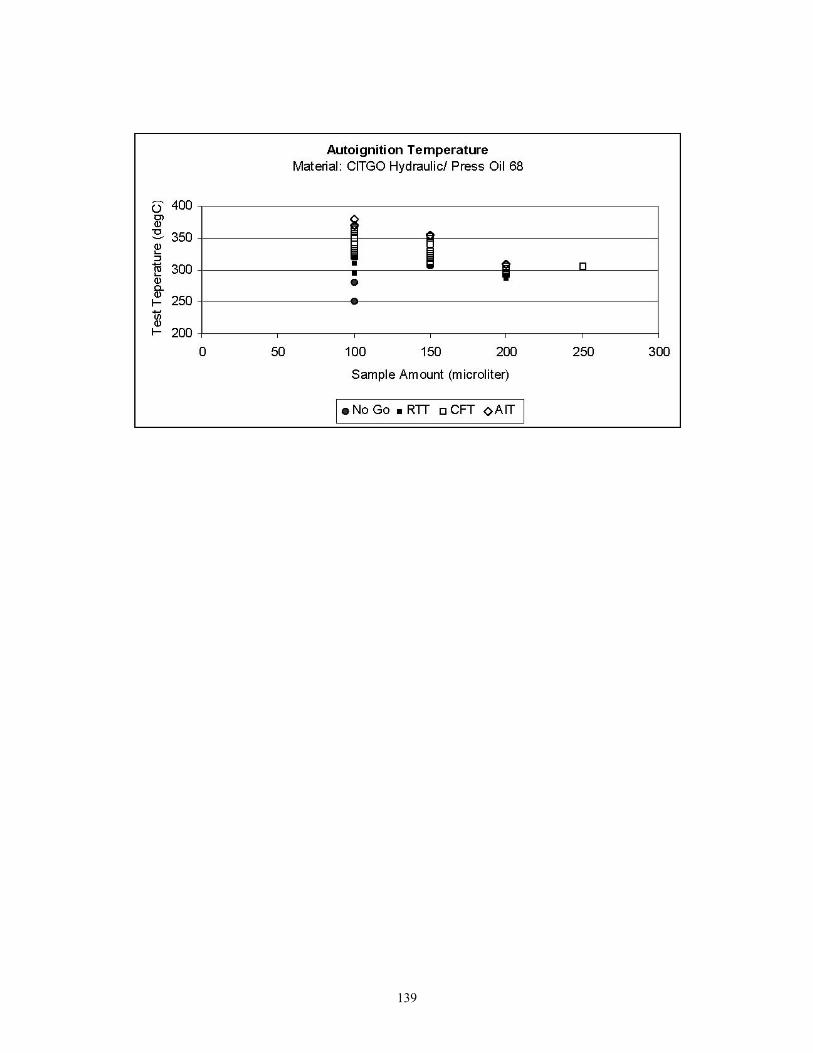
139

Table 2
Test Material: DTE 24
Auto-ignition Temperature (AIT): 359 oC
Cool Flame Temperature (CFT): 284 oC
Reaction Threshold Temperature (RTT): 281 oC
Test No. Sample Amount (mg) Flask Temp.
oC
Result Go /No Go
Time LagSec.
RTT oC
CFT oC
AIT oC
1 150 290 Go - 290
2 150 284 Go - 284
3 150 278 No Go - 278
4 150 320 Go - 320
5 150 335 Go - 335
6 150 350 Go - 350
7 150 380 Go 3 380
8 150 365 Go 7 365
9 150 356 Go - 356
10 150 359 Go 9 359
11 150 281 No Go - 281
12 200 281 No Go - 281
13 200 284 Go - 284
14 200 359 Go - 359
15 200 365 Go - 365
16 200 371 Go 4 371
17 200 368 Go - 368
140
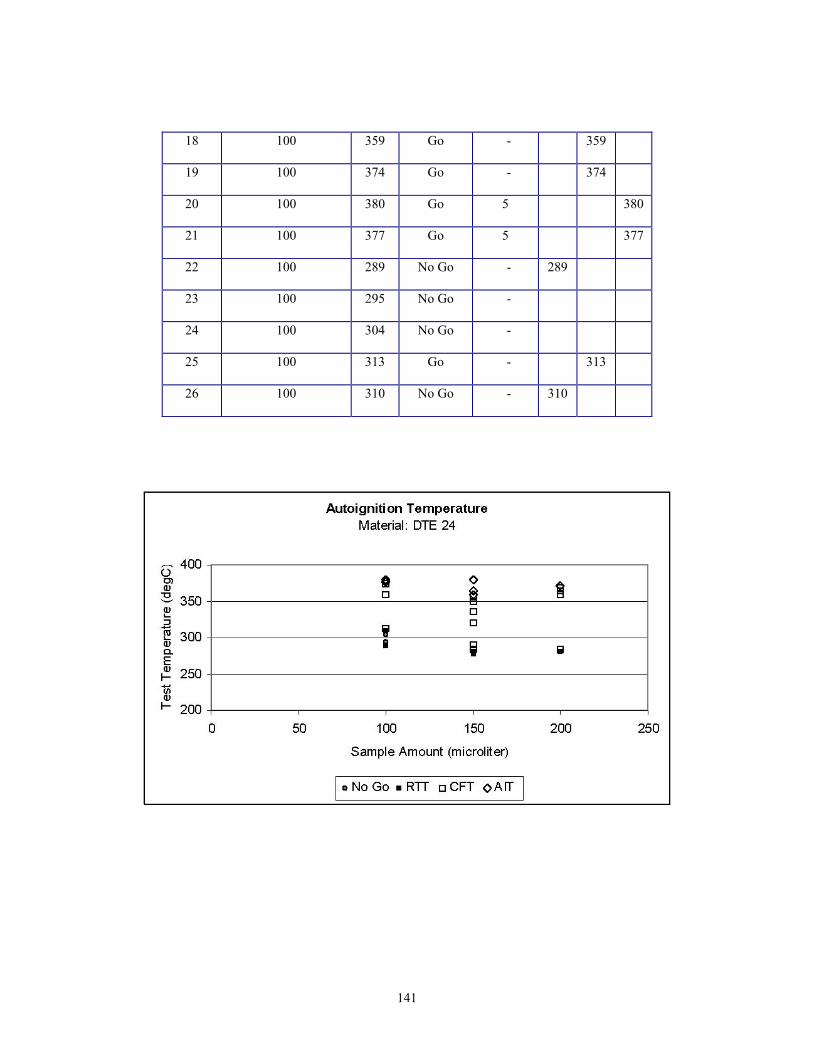
18 100 359 Go - 359
19 100 374 Go - 374
20 100 380 Go 5 380
21 100 377 Go 5 377
22 100 289 No Go - 289
23 100 295 No Go -
24 100 304 No Go -
25 100 313 Go - 313
26 100 310 No Go - 310
141

Appendix B: sieve size
Sieve number Theoretical opening size(㎛)
(US mesh) Sieve size opening ASTM 2(㎛)
18 1000 1000
20 841 850
25 707 710
30 595 600
35 500 500
40 420 425
45 354 355
50 297 300
60 250 250
70 210 212
80 177 180
100 149 150
120 125 125
140 105 106
170 88 90
200 74 75
230 63 63
270 53 53
325 44 45
400 37 38
500 32
600 25
142