hotspots, opportunities & initiatives canned meat meat v1.pdf · psf (2013) canned vegetables,...
TRANSCRIPT
Hotspots, opportunities & initiatives
Canned meat
Version 1 May 2013
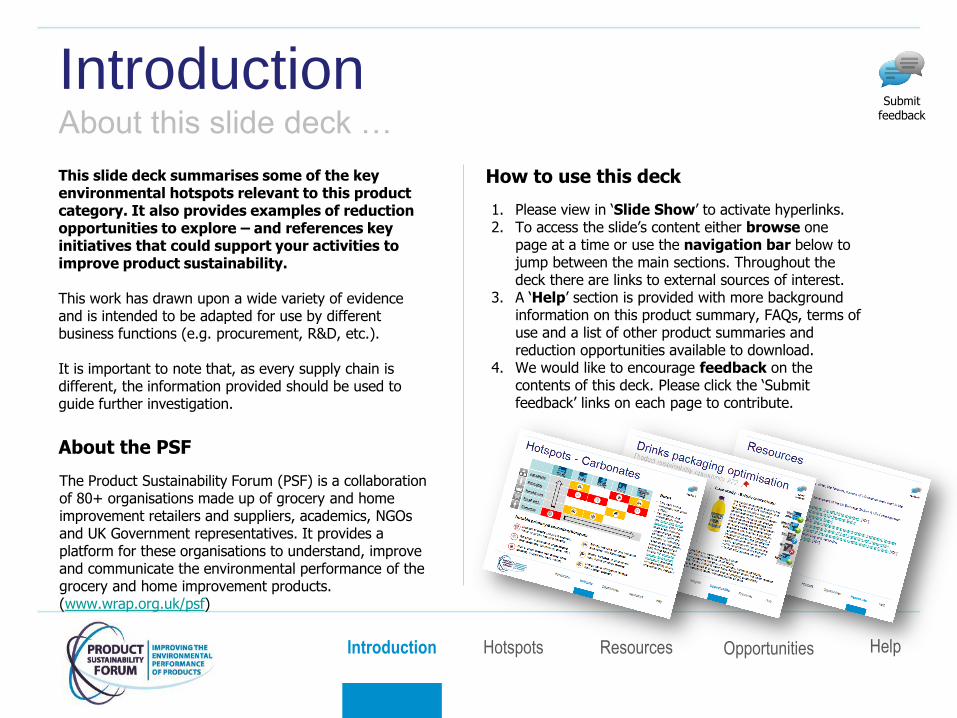
The Product Sustainability Forum (PSF) is a collaboration of 80+ organisations made up of grocery and home improvement retailers and suppliers, academics, NGOs and UK Government representatives. It provides a platform for these organisations to understand, improve and communicate the environmental performance of the grocery and home improvement products. (www.wrap.org.uk/psf)
About the PSF
How to use this deck
Introduction Opportunities Hotspots Resources Help
1. Please view in „Slide Show‟ to activate hyperlinks. 2. To access the slide‟s content either browse one
page at a time or use the navigation bar below to jump between the main sections. Throughout the deck there are links to external sources of interest.
3. A „Help‟ section is provided with more background information on this product summary, FAQs, terms of use and a list of other product summaries and reduction opportunities available to download.
4. We would like to encourage feedback on the contents of this deck. Please click the „Submit feedback‟ links on each page to contribute.
Introduction About this slide deck …
This slide deck summarises some of the key environmental hotspots relevant to this product category. It also provides examples of reduction opportunities to explore – and references key initiatives that could support your activities to improve product sustainability. This work has drawn upon a wide variety of evidence and is intended to be adapted for use by different business functions (e.g. procurement, R&D, etc.). It is important to note that, as every supply chain is different, the information provided should be used to guide further investigation.
Submit feedback
Notable primary & secondary hotspots
Notes
Introduction Opportunities Hotspots Resources Help
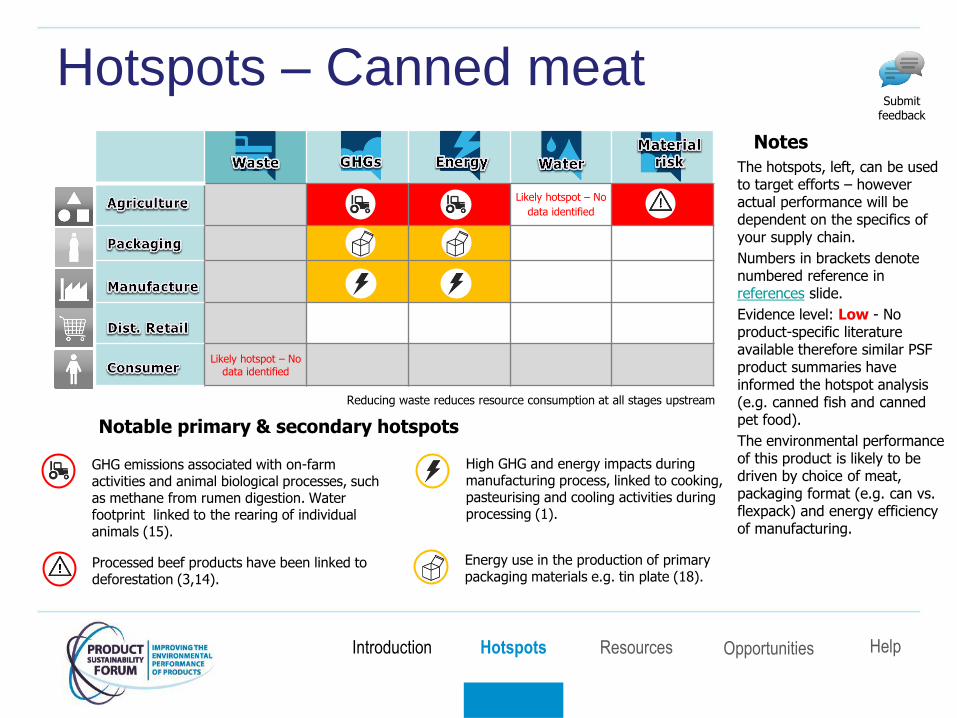
Hotspots – Canned meat
GHG emissions associated with on-farm activities and animal biological processes, such as methane from rumen digestion. Water footprint linked to the rearing of individual animals (15).
Processed beef products have been linked to deforestation (3,14).
High GHG and energy impacts during manufacturing process, linked to cooking, pasteurising and cooling activities during processing (1).
Energy use in the production of primary packaging materials e.g. tin plate (18).
The hotspots, left, can be used to target efforts – however actual performance will be dependent on the specifics of your supply chain.
Numbers in brackets denote numbered reference in references slide.
Evidence level: Low - No product-specific literature available therefore similar PSF product summaries have informed the hotspot analysis (e.g. canned fish and canned pet food).
The environmental performance of this product is likely to be driven by choice of meat, packaging format (e.g. can vs. flexpack) and energy efficiency of manufacturing.
Likely hotspot – No
data identified
Likely hotspot – No data identified
Reducing waste reduces resource consumption at all stages upstream
Submit feedback
Introduction Opportunities Hotspots Resources Help
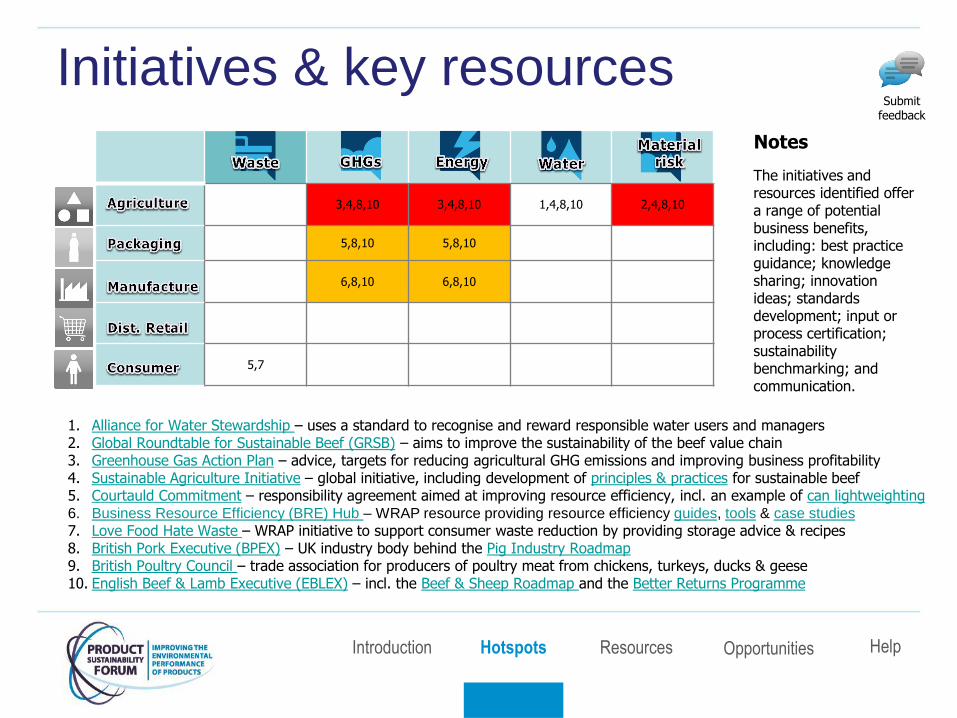
Initiatives & key resources
The initiatives and resources identified offer a range of potential business benefits, including: best practice guidance; knowledge sharing; innovation ideas; standards development; input or process certification; sustainability benchmarking; and communication.
Notes
1. Alliance for Water Stewardship – uses a standard to recognise and reward responsible water users and managers 2. Global Roundtable for Sustainable Beef (GRSB) – aims to improve the sustainability of the beef value chain 3. Greenhouse Gas Action Plan – advice, targets for reducing agricultural GHG emissions and improving business profitability 4. Sustainable Agriculture Initiative – global initiative, including development of principles & practices for sustainable beef 5. Courtauld Commitment – responsibility agreement aimed at improving resource efficiency, incl. an example of can lightweighting 6. Business Resource Efficiency (BRE) Hub – WRAP resource providing resource efficiency guides, tools & case studies 7. Love Food Hate Waste – WRAP initiative to support consumer waste reduction by providing storage advice & recipes 8. British Pork Executive (BPEX) – UK industry body behind the Pig Industry Roadmap 9. British Poultry Council – trade association for producers of poultry meat from chickens, turkeys, ducks & geese 10. English Beef & Lamb Executive (EBLEX) – incl. the Beef & Sheep Roadmap and the Better Returns Programme
3,4,8,10 3,4,8,10 1,4,8,10 2,4,8,10
5,8,10 5,8,10
6,8,10 6,8,10
5,7
Submit feedback
Submit feedback
The role of protein choice in product impact
Use of Meat The choice of protein ingredients in products can contribute significantly to their impacts, particularly with meat ingredients (10).
Growing meat has higher GHG and water impacts than growing vegetables, legumes or other staples in products, arising from:
• Methane emitted by the animals
• Methane emitted by manure and slurry
• Production of feed using nitrogen fertiliser, farm machinery, and large quantities of irrigated water (11)
• Housing of animals in cold climates.
Conditions in the source country are also important; for example, soya for animal feed or beef sourced from Brazil may be associated with land use change, which releases large amounts of previously stored CO2e from cleared forest.
According to the UN‟s Food and Agriculture Organisation (FAO), the livestock sector is responsible for 10-25% of global greenhouse gas emissions (12). The FAO estimates that 7% of global human water use is for growing feed crops for livestock (13).
Beef vs. other protein
Generally speaking, products containing beef have the highest carbon footprint, followed by lamb, then pork, then chicken and fish (14).
Conversion of grain or legume protein to meat is very inefficient. Grain-fed beef is one of the least efficient forms of animal protein, taking 7kg grain feed for 1 kg live weight gain in beef. Around 35% of the world grain harvest (760 million tons) is used to produce animal protein (15).
Farmed herbivorous fish such as tilapia achieve a much better conversion rate, producing 1 kg live weight for less than 2 kg of grain feed (15).
Eating the grains and legumes directly is the most efficient human consumption of food and carries health benefits as well. A study modelling consumption patterns in the United Kingdom estimates that a 50% reduction in meat and dairy consumption, if replaced by fruit, vegetable and cereals, could result in a 19% reduction in GHG emissions and up to nearly 43,600 fewer deaths per year in the UK (12).
Soya fed to livestock
Soya is increasingly used as animal feed in the UK, but its production can be implicated in deforestation, biodiversity loss and GHG impacts through land use change. Locally sourced animal feed carries less risk of habitat loss and land use change in its production, and requires less transport, so has lower GHG impacts (13). Soya sources should be checked – the Round Table on Responsible Soy (16) may offer some guidance about suppliers – but note that it has been criticised by some NGOs for its stance on GM, deforestation and pesticide use (17) which are further factors to be considered.
Introduction Opportunities Hotspots Resources Help
The documents below have been used to identify primary and secondary environmental impact hotspots
Introduction Opportunities Hotspots Resources Help
Hotspot references
1. Berlin, J., Sund, V., (2009). Environmental Life Cycle Assessment of Ready Meals [PDF] 2. Client Confidential (2010). Chilled and Frozen Ready Meals: Market Intelligence. 3. Corporate Europe Observatory (n.d.). Roundtable on Responsible Soy – the certification smokescreen 4. Earth Policy Institute (2011). Data highlights 5. FAO (2006). Livestock‟s Long Shadow, p272 6. Friends of the Earth (2008). What's feeding your food? The environmental and social impacts of the livestock sector [PDF] 7. PSF (2013) Beef (fresh & frozen) product summary 8. PSF (2013) Canned fish product summary 9. PSF (2013) Canned vegetables, soups, pasta & noodles product summary 10. PSF (2013) Cat & dog food product summary 11. PSF (2013) Lamb (fresh & frozen) product summary 12. PSF (2013) Pork (fresh & frozen) product summary 13. PSF (2013) Poultry (fresh & frozen) product summary 14. Round Table on Responsible Soy Association (n.d). Responsible Soy website 15. UNEP (2012). Growing greenhouse gas emissions due to meat production [PDF] 16. WRAP (2013). An initial assessment of the environmental impact of grocery products [PDF] 17. WRAP (n.d.). How to apply date labels to help prevent food waste [PDF] 18. WRAP (n.d.). Reducing weight, reducing cost: lightweight can ends [PDF]
Submit feedback
Reduction opportunities
• How to participate in the closed loop economy through waste
exchange
The PSF has researched a selection of „reduction opportunities‟, „action plans and topic guides‟ relevant to the grocery sector. Below are a selection relevant to canned meat. Follow the links to find out more about each opportunity. For a full list of resources available see the Help section. While many of the opportunities are not tailored specifically to canned meat – the principles and resources are transferable. Where they target a hotspot they are flagged red.
• Water efficiency in livestock farming • Closed-loop recycling
• Boiler energy efficiency in food & drink processing • Clean in place (CIP) best practice for resource
efficiency • Identifying the true cost of waste
• Water efficiency in meat processing • Food redistribution • Reducing consumer food waste
Hotspot
Reduction opportunities Action plans
Topic guides • Implementing a sustainable procurement process for raw
materials
• Lowering the impact of pig feed soya
• Demystifying land use change
• Best practice in embedding sustainability in product design
• Effective commissioning of LCAs/footprint studies
• Engaging suppliers on sustainability
Submit feedback
Introduction Opportunities Hotspots Resources Help
Introduction Opportunities Hotspots Resources Help
Water efficiency in livestock farming Product sustainability opportunity
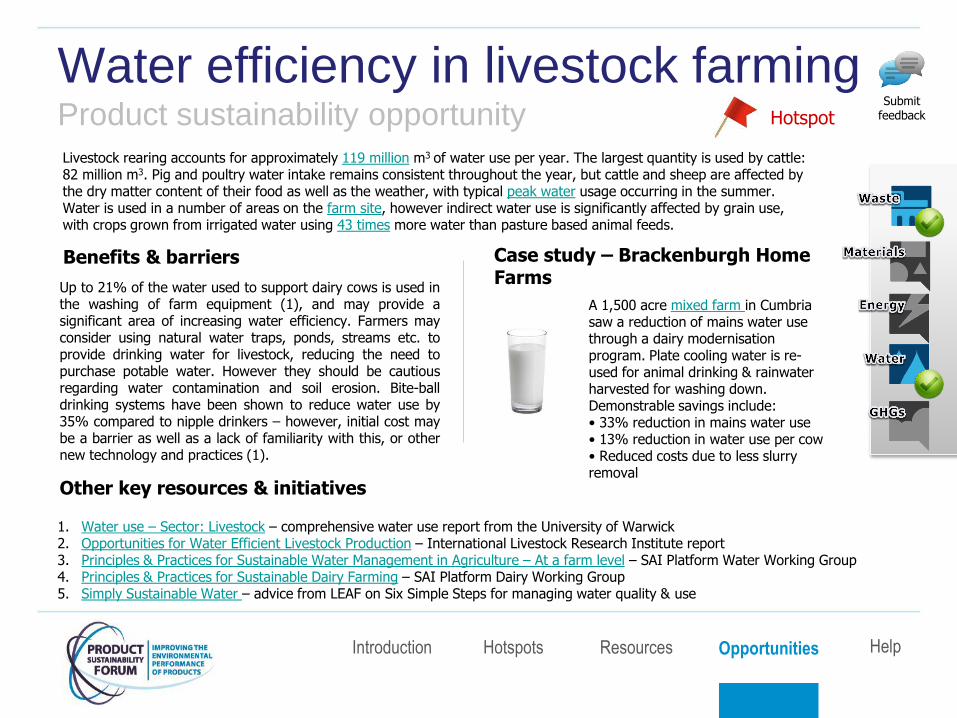
Livestock rearing accounts for approximately 119 million m3 of water use per year. The largest quantity is used by cattle: 82 million m3. Pig and poultry water intake remains consistent throughout the year, but cattle and sheep are affected by the dry matter content of their food as well as the weather, with typical peak water usage occurring in the summer. Water is used in a number of areas on the farm site, however indirect water use is significantly affected by grain use, with crops grown from irrigated water using 43 times more water than pasture based animal feeds.
Other key resources & initiatives
1. Water use – Sector: Livestock – comprehensive water use report from the University of Warwick 2. Opportunities for Water Efficient Livestock Production – International Livestock Research Institute report 3. Principles & Practices for Sustainable Water Management in Agriculture – At a farm level – SAI Platform Water Working Group 4. Principles & Practices for Sustainable Dairy Farming – SAI Platform Dairy Working Group 5. Simply Sustainable Water – advice from LEAF on Six Simple Steps for managing water quality & use
Up to 21% of the water used to support dairy cows is used in the washing of farm equipment (1), and may provide a significant area of increasing water efficiency. Farmers may consider using natural water traps, ponds, streams etc. to provide drinking water for livestock, reducing the need to purchase potable water. However they should be cautious regarding water contamination and soil erosion. Bite-ball drinking systems have been shown to reduce water use by 35% compared to nipple drinkers – however, initial cost may be a barrier as well as a lack of familiarity with this, or other new technology and practices (1).
Benefits & barriers Case study – Brackenburgh Home Farms
A 1,500 acre mixed farm in Cumbria saw a reduction of mains water use through a dairy modernisation program. Plate cooling water is re-used for animal drinking & rainwater harvested for washing down. Demonstrable savings include: • 33% reduction in mains water use • 13% reduction in water use per cow
• Reduced costs due to less slurry removal
Hotspot Submit
feedback
Introduction Opportunities Hotspots Resources Help
Closed-loop recycling Product sustainability opportunity The adoption of a circular economy offers considerable economic benefits (1). Strictly defined, „closed-loop recycling‟ is where recycled material from one product is wholly, or partially incorporated back into the same product. In contrast, „open-loop recycling‟ is where recycled material is used for another purpose (2). Certain materials are better suited to this process. Glass, aluminium, steel & plastic recycling can reduce energy, GHG emissions & water use without affecting performance, e.g. recycling ink cartridges – see case study below (3).
Other resources & initiatives
1. WRAP's vision for the UK circular economy to 2020 – outlines the benefits of pushing the UK economy towards circularity 2. Recycled Content Fact Sheet – Incpen guidance on recycled materials 3. Driving Sustainable Consumption: Closed Loop Systems – World Economic Forum report providing overview of closed loop systems 4. Closed Loop Recycling – Opening The Door To Cost Saving – WRAP case study of closed-loop recycling 5. Ellen MacArthur Foundation (EMF) – works with education & business to accelerate the transition to a circular economy 6. Environmental Benefits of Closed-Loop Glass Recycling – WRAP information supported by a glass collection directory
Closed-loop recycling ensures a long term relationship between customers and suppliers and provides a revenue from recovered material, whilst at the same time reducing the amount of waste sent to landfill (2). A closed-loop system operator will need to ensure the manufacturing process allows for the introduction of recycled material and that there are appropriate logistics and distribution networks to control the flow of recovered material (4). Additionally the cost of collection, and possible use of 3rd party collecting centres, may be an extra economic and organisational burden (3).
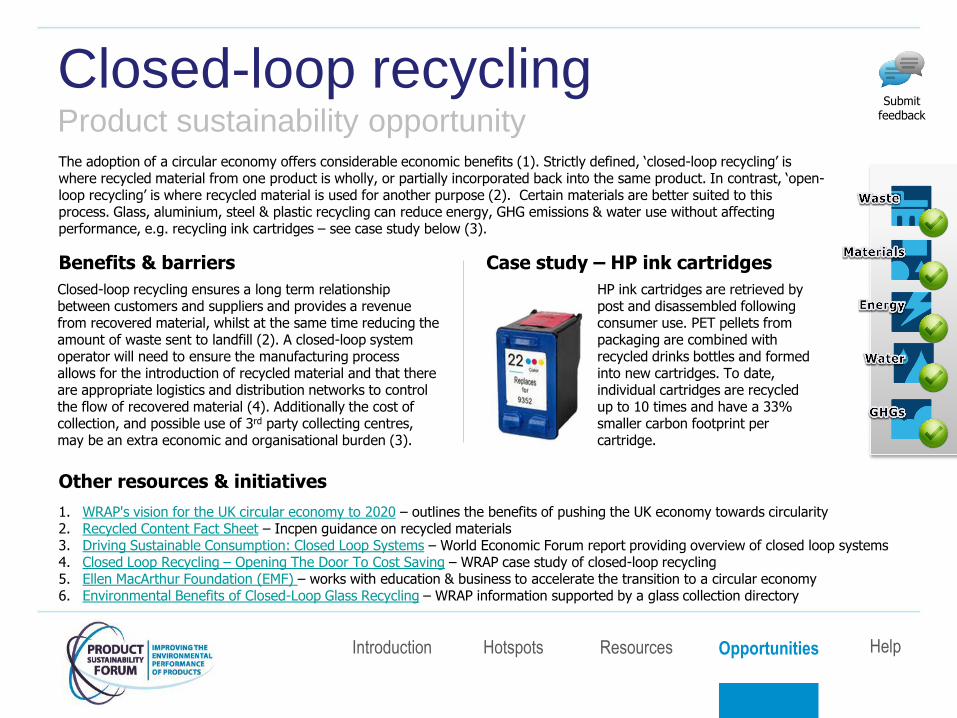
Benefits & barriers Case study – HP ink cartridges
HP ink cartridges are retrieved by post and disassembled following consumer use. PET pellets from packaging are combined with recycled drinks bottles and formed into new cartridges. To date, individual cartridges are recycled up to 10 times and have a 33% smaller carbon footprint per cartridge.
Submit feedback
Introduction Opportunities Hotspots Resources Help
Boiler energy efficiency in F&D Product sustainability opportunity
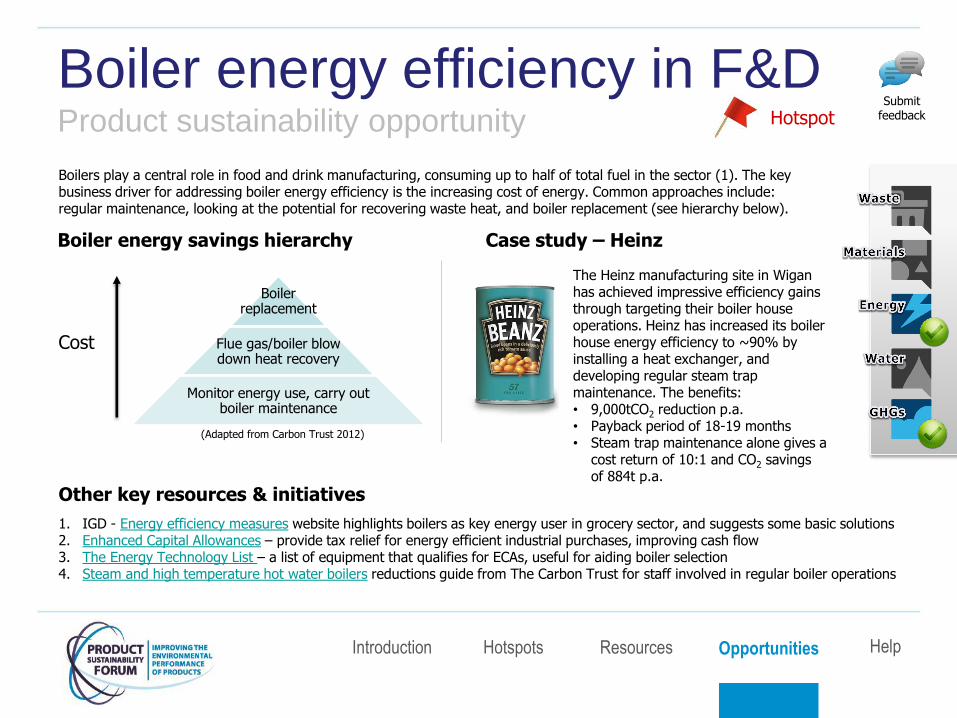
Boiler replacement
Flue gas/boiler blow down heat recovery
Monitor energy use, carry out boiler maintenance
Boilers play a central role in food and drink manufacturing, consuming up to half of total fuel in the sector (1). The key business driver for addressing boiler energy efficiency is the increasing cost of energy. Common approaches include: regular maintenance, looking at the potential for recovering waste heat, and boiler replacement (see hierarchy below).
Other key resources & initiatives
1. IGD - Energy efficiency measures website highlights boilers as key energy user in grocery sector, and suggests some basic solutions 2. Enhanced Capital Allowances – provide tax relief for energy efficient industrial purchases, improving cash flow 3. The Energy Technology List – a list of equipment that qualifies for ECAs, useful for aiding boiler selection 4. Steam and high temperature hot water boilers reductions guide from The Carbon Trust for staff involved in regular boiler operations
Case study – Heinz
The Heinz manufacturing site in Wigan has achieved impressive efficiency gains through targeting their boiler house operations. Heinz has increased its boiler house energy efficiency to ~90% by installing a heat exchanger, and developing regular steam trap maintenance. The benefits: • 9,000tCO2 reduction p.a. • Payback period of 18-19 months • Steam trap maintenance alone gives a
cost return of 10:1 and CO2 savings of 884t p.a.
Boiler energy savings hierarchy
(Adapted from Carbon Trust 2012)
Cost
Hotspot Submit
feedback
Introduction Opportunities Hotspots Resources Help
CIP for resource efficiency Product sustainability opportunity
Clean in place (CIP) is a hygiene technology applicable to the food and non-food grocery sectors that aims to efficiently remove solids and bacteria from vessels and pipework. In its simplest form, cleaning materials are passed along the production process, negating the need to disassemble equipment and clean individually. A CIP cycle may typically involve any combination of the following: detergent solution for cleaning, disinfectants & sterilants, other additives e.g. ozone (O3), or a „pig‟ - an object used to dislodge solid material, usually used for product recovery pre-CIP (1).
Other key resources & initiatives
1. Cleaning In Place – WRAP overview of the benefits of a CIP system with a drinks sector focus 2. A Closer Look At The Business Benefits Of Clean-In-Place (CIP) Systems – Q&A on how to reduce operating costs through CIP 3. Clean in Place Best Practice Guidelines – a practical handbook on how to optimise your CIP system 4. Reducing water use through cleaning-in-place (CIP) – Envirowise report providing guidance for optimising CIP systems
CIP has the potential to reduce water and detergent use during the cleaning process. In addition, CIP can reduce heat and energy use and promote chemical use with more desirable environmental characteristics. Production downtime is minimised and an automated system can reduce labour requirements. However, poorly maintained CIP can increase risk of contamination as failures are less obvious. Staff training is additional cost as the new system is put in place, but will serve to minimise this risk (2).
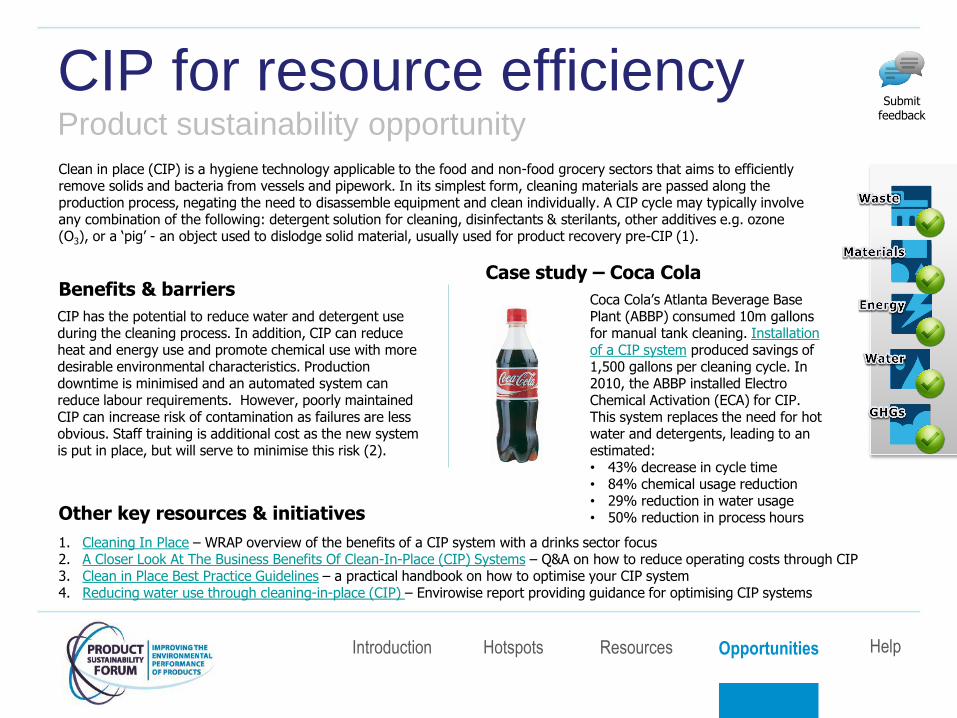
Benefits & barriers Case study – Coca Cola
Coca Cola‟s Atlanta Beverage Base Plant (ABBP) consumed 10m gallons for manual tank cleaning. Installation of a CIP system produced savings of 1,500 gallons per cleaning cycle. In 2010, the ABBP installed Electro Chemical Activation (ECA) for CIP. This system replaces the need for hot water and detergents, leading to an estimated: • 43% decrease in cycle time • 84% chemical usage reduction • 29% reduction in water usage • 50% reduction in process hours
Submit feedback
Introduction Opportunities Hotspots Resources Help
Identifying the true cost of waste Product sustainability opportunity
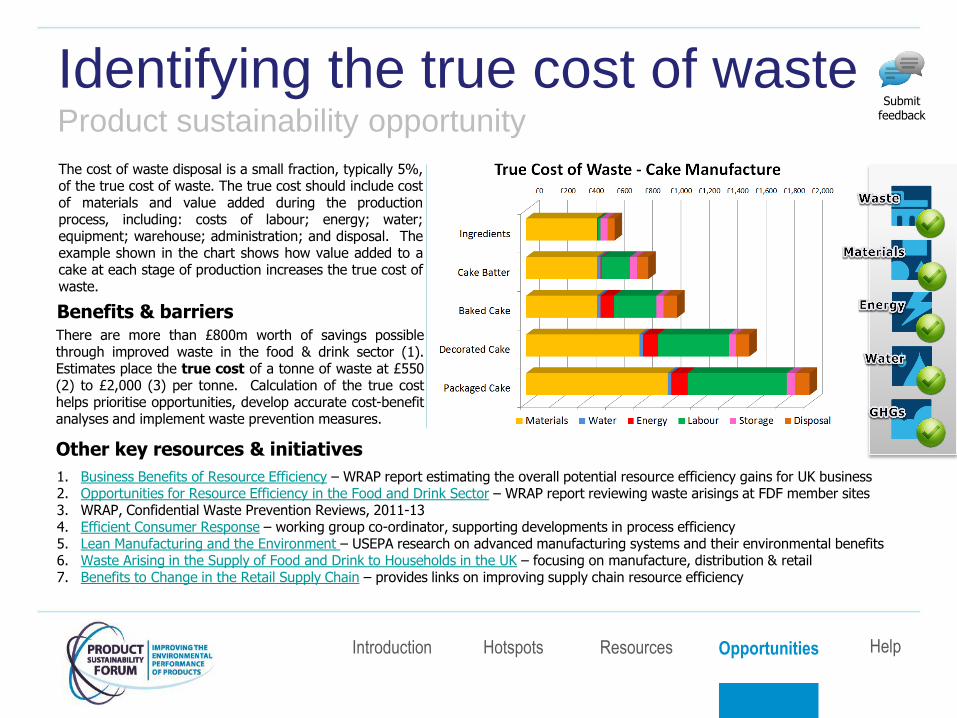
The cost of waste disposal is a small fraction, typically 5%, of the true cost of waste. The true cost should include cost of materials and value added during the production process, including: costs of labour; energy; water; equipment; warehouse; administration; and disposal. The example shown in the chart shows how value added to a cake at each stage of production increases the true cost of waste.
Other key resources & initiatives
1. Business Benefits of Resource Efficiency – WRAP report estimating the overall potential resource efficiency gains for UK business 2. Opportunities for Resource Efficiency in the Food and Drink Sector – WRAP report reviewing waste arisings at FDF member sites 3. WRAP, Confidential Waste Prevention Reviews, 2011-13 4. Efficient Consumer Response – working group co-ordinator, supporting developments in process efficiency 5. Lean Manufacturing and the Environment – USEPA research on advanced manufacturing systems and their environmental benefits 6. Waste Arising in the Supply of Food and Drink to Households in the UK – focusing on manufacture, distribution & retail 7. Benefits to Change in the Retail Supply Chain – provides links on improving supply chain resource efficiency
There are more than £800m worth of savings possible through improved waste in the food & drink sector (1). Estimates place the true cost of a tonne of waste at £550 (2) to £2,000 (3) per tonne. Calculation of the true cost helps prioritise opportunities, develop accurate cost-benefit analyses and implement waste prevention measures.
Benefits & barriers
Submit feedback
Introduction Opportunities Hotspots Resources Help
Water efficiency in meat processing Product sustainability opportunity
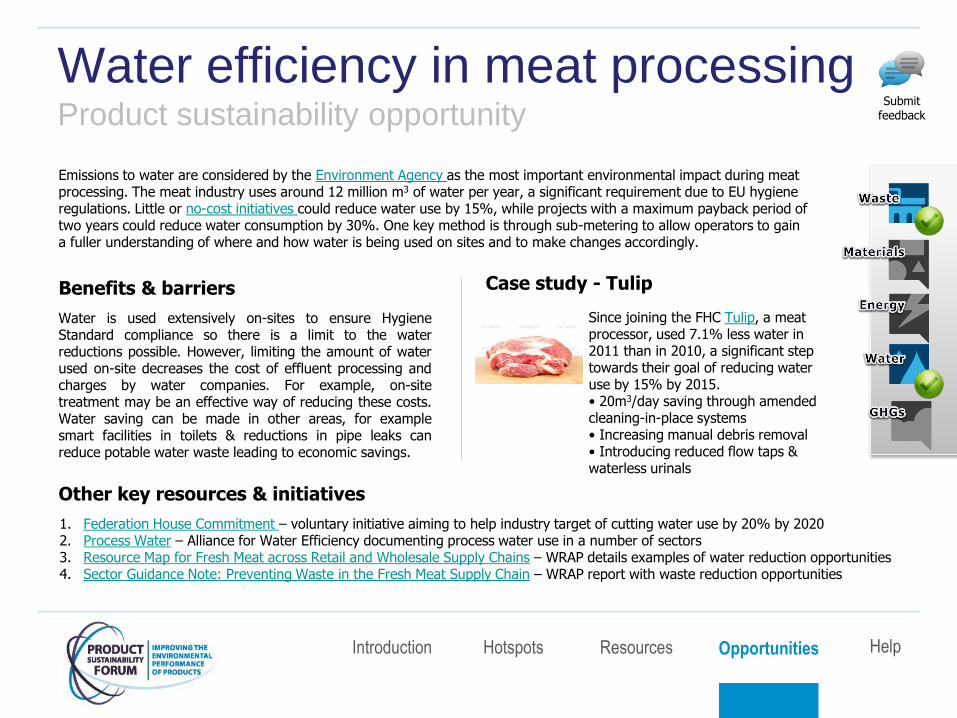
Emissions to water are considered by the Environment Agency as the most important environmental impact during meat processing. The meat industry uses around 12 million m3 of water per year, a significant requirement due to EU hygiene regulations. Little or no-cost initiatives could reduce water use by 15%, while projects with a maximum payback period of two years could reduce water consumption by 30%. One key method is through sub-metering to allow operators to gain a fuller understanding of where and how water is being used on sites and to make changes accordingly.
Other key resources & initiatives
1. Federation House Commitment – voluntary initiative aiming to help industry target of cutting water use by 20% by 2020 2. Process Water – Alliance for Water Efficiency documenting process water use in a number of sectors 3. Resource Map for Fresh Meat across Retail and Wholesale Supply Chains – WRAP details examples of water reduction opportunities 4. Sector Guidance Note: Preventing Waste in the Fresh Meat Supply Chain – WRAP report with waste reduction opportunities
Water is used extensively on-sites to ensure Hygiene Standard compliance so there is a limit to the water reductions possible. However, limiting the amount of water used on-site decreases the cost of effluent processing and charges by water companies. For example, on-site treatment may be an effective way of reducing these costs. Water saving can be made in other areas, for example smart facilities in toilets & reductions in pipe leaks can reduce potable water waste leading to economic savings.
Benefits & barriers Case study - Tulip
Since joining the FHC Tulip, a meat processor, used 7.1% less water in 2011 than in 2010, a significant step towards their goal of reducing water use by 15% by 2015. • 20m3/day saving through amended cleaning-in-place systems
• Increasing manual debris removal • Introducing reduced flow taps & waterless urinals
Submit feedback
Introduction Opportunities Hotspots Resources Help
Food redistribution Product sustainability opportunity In the UK, 3 million tonnes of food waste arises in the retail supply chain from factory gate to shelf. Currently, FareShare and FoodCycle redistribute a combined total of around 5,000 tonnes, and Company Shop accounts for a further 15,000 tonnes. A new working group has been coordinated by WRAP in order to tackle the issue of UK food waste and includes major players within this area (1). Waste food in the supply chain has been valued at £500 per tonne, and this is thought to be significantly less than its actual cost to business (see Identifying the true cost of waste reduction opportunity).
Other key resources & initiatives
Case study – FareShare
FareShare is a national UK charity addressing food poverty through: • Providing quality food • Providing training and education • Promoting the message that „No Good Food
Should Be Wasted‟ • Working with UK food retailers (e.g. Sainsbury‟s
„Million Meal Appeal‟) The redistribution of food by FareShare minimises surplus food going to landfill and helped business reduce their emissions by 1,800tCO2e in 2011/12.
1. WRAP food redistribution industry working group – due to report late 2013 2. Company Shop – business that sells surplus stock from supermarkets discreetly on a strict membership basis 3. FareShare – national UK charity that supports communities to relieve food poverty 4. WRAP Retail Survey 2011 – helping consumers reduce food waste; gives figures for UK food waste
Case study – Company Shop
Company Shop, a business that sells surplus stocks from leading UK supermarkets, recently opened a flagship „Zero Food to Landfill‟ store in Tankersley, South Yorkshire. It is predicted that 98% of the food handled at the 14,000sqft store will either be sold to members or donated to local food charities (incl. FareShare, opposite).
Submit feedback
Introduction Opportunities Hotspots Resources Help
Reducing consumer food waste Product sustainability opportunity
In the UK, 7.2 million tonnes of food and drink is wasted every year, 4.4 million of which is avoidable. The average UK household currently spends £480 on wasted food every year, totalling £12 billion overall. WRAP reported a significant reduction between 2006/7 and 2010 (13%) (1) but a range of opportunities exist for retailers and manufacturers to help further reduce this waste, and deliver significant financial (for customers) and environmental benefits.
Other key resources & initiatives
1. Household food waste resource listing – summary of WRAP partner resources to use to reduce household food and drink waste 2. Courtauld Commitments Phase Two Case Studies November 2012 – WRAP report providing a list of useful case studies 3. Love Food Hate Waste partners site – wide range of resources available for partners to use free of charge 4. New estimates for household food and drink waste in the UK – WRAP report providing food waste estimates for 2011 5. What retailers and brands are doing to help you reduce food waste – Love Food Hate Waste report
Raising awareness and enabling behaviour change
Case studies: Changes to products
Changes to products, packaging and labelling makes it easier for consumers to buy the right amount and use what they buy. • M&S were the first to introduce „freeze
before the date‟ labelling, replacing „freeze on day of purchase‟, giving consumers more flexibility to freeze what they may not eat in time.
• „Display until‟ dates are being removed by many retailers and brands, reducing confusion and giving prominence to the important dates.
• ASDA launched new packaging for their extra special Royal Jersey potatoes that increases shelf life and reduces waste
A combination of large-scale campaigns and local engagement is an effective way to help consumers realise the benefits of throwing away less food, and giving them the tools and confidence to make small changes to the way they shop, store and cook food. Morrisons Great Taste Less Waste had regular articles in their magazine and on-line tips and advice, whilst Sainsbury‟s Make your roast go further campaign provided its customers with leftover recipes designed to incorporate key ingredients from a roast. The Co-op regularly includes Love Food Hate Waste messages on till-screens, reaching millions of customers in store.
Submit feedback
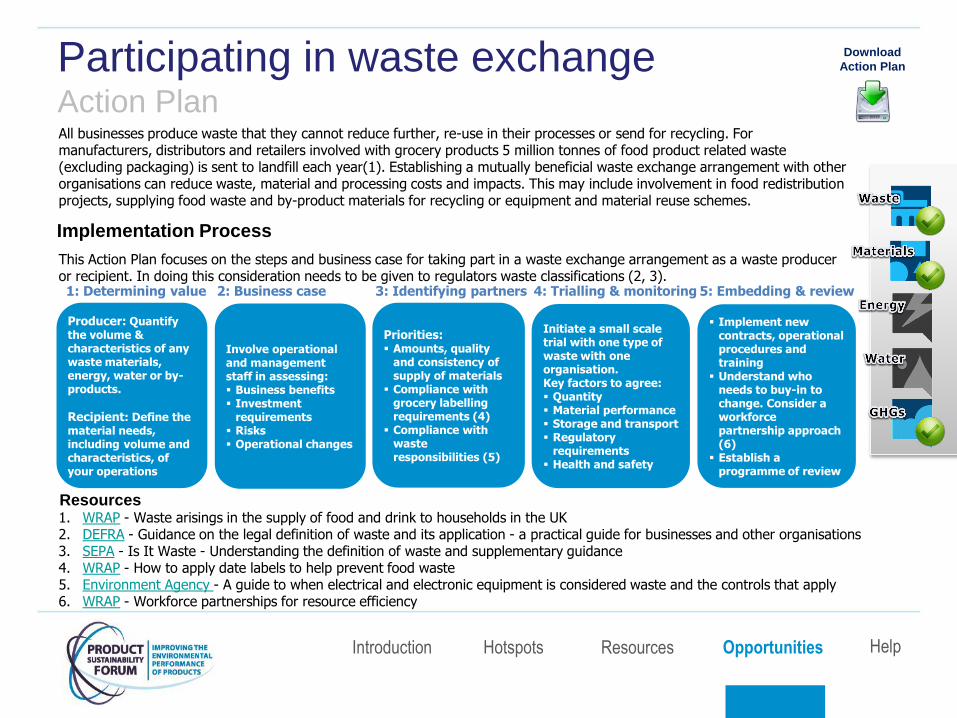
Participating in waste exchange Action Plan All businesses produce waste that they cannot reduce further, re-use in their processes or send for recycling. For manufacturers, distributors and retailers involved with grocery products 5 million tonnes of food product related waste (excluding packaging) is sent to landfill each year(1). Establishing a mutually beneficial waste exchange arrangement with other organisations can reduce waste, material and processing costs and impacts. This may include involvement in food redistribution projects, supplying food waste and by-product materials for recycling or equipment and material reuse schemes.
Resources 1. WRAP - Waste arisings in the supply of food and drink to households in the UK 2. DEFRA - Guidance on the legal definition of waste and its application - a practical guide for businesses and other organisations 3. SEPA - Is It Waste - Understanding the definition of waste and supplementary guidance 4. WRAP - How to apply date labels to help prevent food waste 5. Environment Agency - A guide to when electrical and electronic equipment is considered waste and the controls that apply 6. WRAP - Workforce partnerships for resource efficiency
Implementation Process
This Action Plan focuses on the steps and business case for taking part in a waste exchange arrangement as a waste producer or recipient. In doing this consideration needs to be given to regulators waste classifications (2, 3).
Introduction Opportunities Hotspots Resources Help
Download
Action Plan
2: Business case 3: Identifying partners 4: Trialling & monitoring 5: Embedding & review 1: Determining value
Initiate a small scale trial with one type of waste with one organisation. Key factors to agree: Quantity Material performance Storage and transport Regulatory
requirements Health and safety
Producer: Quantify the volume & characteristics of any waste materials, energy, water or by-products.
Recipient: Define the material needs, including volume and characteristics, of your operations
Involve operational and management staff in assessing: Business benefits Investment
requirements Risks Operational changes
Priorities: Amounts, quality
and consistency of supply of materials
Compliance with grocery labelling requirements (4)
Compliance with waste responsibilities (5)
Implement new contracts, operational procedures and training
Understand who needs to buy-in to change. Consider a workforce partnership approach (6)
Establish a programme of review
Sustainable Procurement of Raw Materials Topic Guide
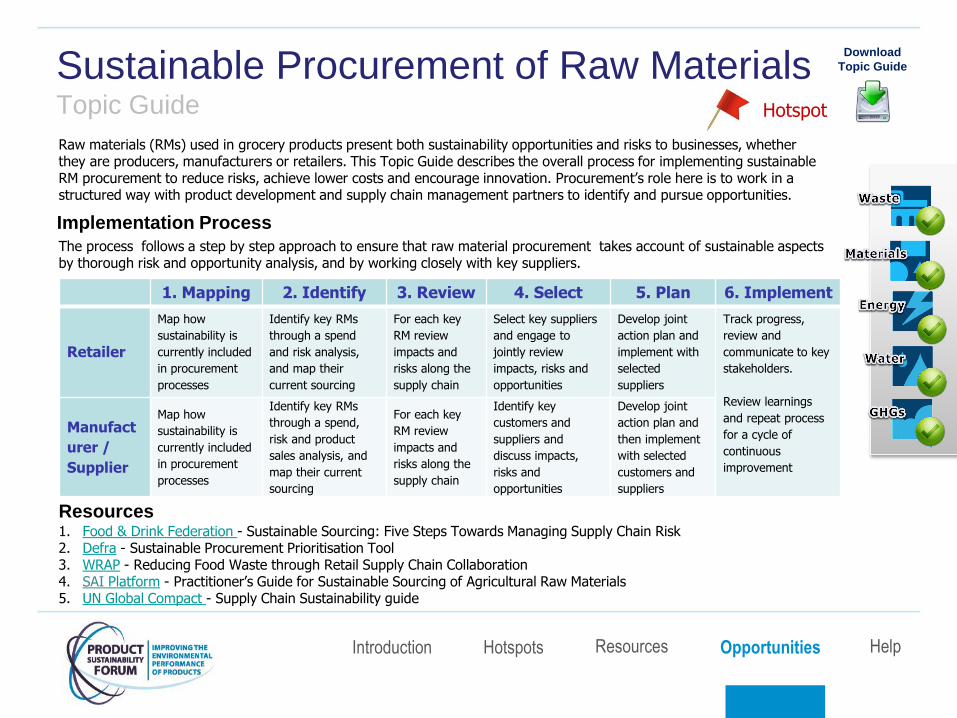
Raw materials (RMs) used in grocery products present both sustainability opportunities and risks to businesses, whether they are producers, manufacturers or retailers. This Topic Guide describes the overall process for implementing sustainable RM procurement to reduce risks, achieve lower costs and encourage innovation. Procurement‟s role here is to work in a structured way with product development and supply chain management partners to identify and pursue opportunities.
Resources 1. Food & Drink Federation - Sustainable Sourcing: Five Steps Towards Managing Supply Chain Risk 2. Defra - Sustainable Procurement Prioritisation Tool 3. WRAP - Reducing Food Waste through Retail Supply Chain Collaboration 4. SAI Platform - Practitioner‟s Guide for Sustainable Sourcing of Agricultural Raw Materials 5. UN Global Compact - Supply Chain Sustainability guide
Implementation Process
The process follows a step by step approach to ensure that raw material procurement takes account of sustainable aspects by thorough risk and opportunity analysis, and by working closely with key suppliers.
Introduction Opportunities Hotspots Resources Help
Download
Topic Guide
1. Mapping 2. Identify 3. Review 4. Select 5. Plan 6. Implement
Retailer
Map how
sustainability is
currently included
in procurement
processes
Identify key RMs
through a spend
and risk analysis,
and map their
current sourcing
For each key
RM review
impacts and
risks along the
supply chain
Select key suppliers
and engage to
jointly review
impacts, risks and
opportunities
Develop joint
action plan and
implement with
selected
suppliers
Track progress,
review and
communicate to key
stakeholders.
Review learnings
and repeat process
for a cycle of
continuous
improvement
Manufact
urer /
Supplier
Map how
sustainability is
currently included
in procurement
processes
Identify key RMs
through a spend,
risk and product
sales analysis, and
map their current
sourcing
For each key
RM review
impacts and
risks along the
supply chain
Identify key
customers and
suppliers and
discuss impacts,
risks and
opportunities
Develop joint
action plan and
then implement
with selected
customers and
suppliers
Hotspot
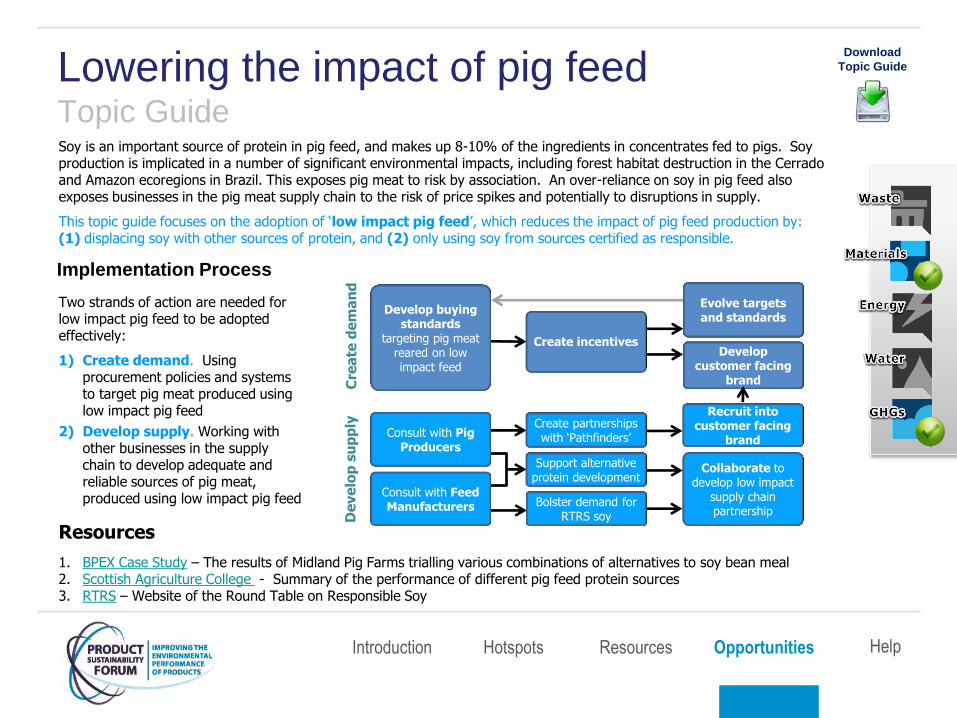
Lowering the impact of pig feed Topic Guide Soy is an important source of protein in pig feed, and makes up 8-10% of the ingredients in concentrates fed to pigs. Soy production is implicated in a number of significant environmental impacts, including forest habitat destruction in the Cerrado and Amazon ecoregions in Brazil. This exposes pig meat to risk by association. An over-reliance on soy in pig feed also exposes businesses in the pig meat supply chain to the risk of price spikes and potentially to disruptions in supply.
This topic guide focuses on the adoption of „low impact pig feed‟, which reduces the impact of pig feed production by: (1) displacing soy with other sources of protein, and (2) only using soy from sources certified as responsible.
Resources
1. BPEX Case Study – The results of Midland Pig Farms trialling various combinations of alternatives to soy bean meal 2. Scottish Agriculture College - Summary of the performance of different pig feed protein sources 3. RTRS – Website of the Round Table on Responsible Soy
Implementation Process
Two strands of action are needed for low impact pig feed to be adopted effectively:
1) Create demand. Using procurement policies and systems to target pig meat produced using low impact pig feed
2) Develop supply. Working with other businesses in the supply chain to develop adequate and reliable sources of pig meat, produced using low impact pig feed
Introduction Opportunities Hotspots Resources Help
Download
Topic Guide
Cre
ate
de
ma
nd
D
eve
lop
su
pp
ly
Create incentives
Evolve targets and standards
Develop customer facing
brand
Collaborate to develop low impact
supply chain partnership
Consult with Pig Producers
Consult with Feed Manufacturers
Develop buying standards
targeting pig meat reared on low impact feed
Support alternative protein development
Create partnerships with „Pathfinders‟
Bolster demand for RTRS soy
Recruit into customer facing
brand
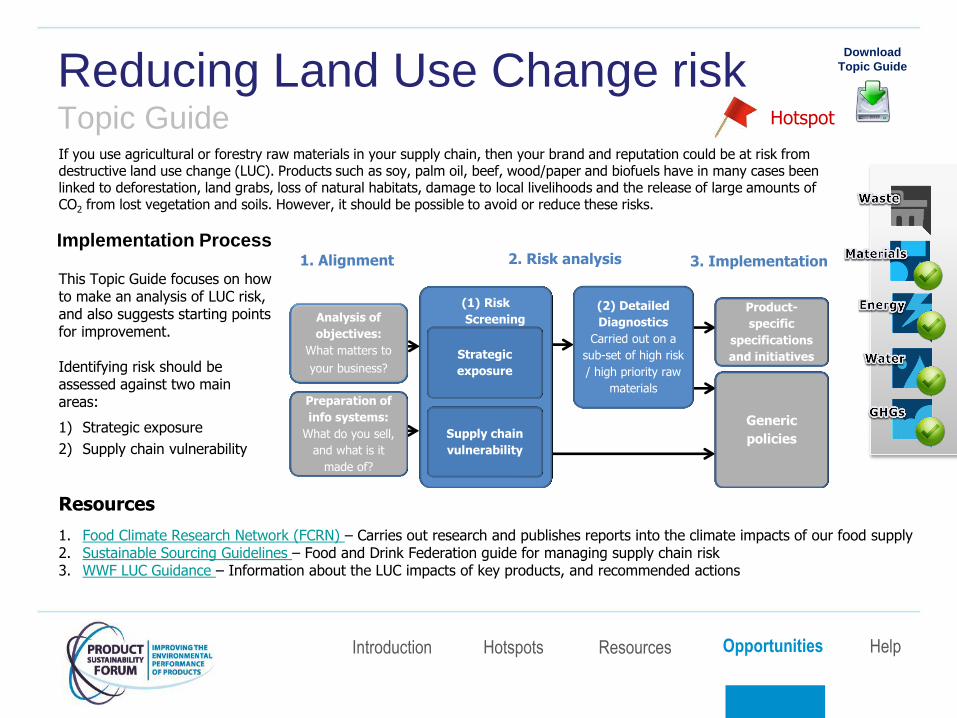
Reducing Land Use Change risk Topic Guide If you use agricultural or forestry raw materials in your supply chain, then your brand and reputation could be at risk from destructive land use change (LUC). Products such as soy, palm oil, beef, wood/paper and biofuels have in many cases been linked to deforestation, land grabs, loss of natural habitats, damage to local livelihoods and the release of large amounts of CO2 from lost vegetation and soils. However, it should be possible to avoid or reduce these risks.
Resources
1. Food Climate Research Network (FCRN) – Carries out research and publishes reports into the climate impacts of our food supply 2. Sustainable Sourcing Guidelines – Food and Drink Federation guide for managing supply chain risk 3. WWF LUC Guidance – Information about the LUC impacts of key products, and recommended actions
Implementation Process
This Topic Guide focuses on how to make an analysis of LUC risk, and also suggests starting points for improvement. Identifying risk should be assessed against two main areas:
1) Strategic exposure
2) Supply chain vulnerability
Introduction Opportunities Hotspots Resources Help
Download
Topic Guide
(1) Risk
Screening
All raw materials
Analysis of
objectives:
What matters to
your business? Strategic
exposure
Generic
policies
(2) Detailed
Diagnostics
Carried out on a
sub-set of high risk
/ high priority raw
materials
Product-
specific
specifications
and initiatives
Supply chain
vulnerability
Preparation of
info systems:
What do you sell,
and what is it
made of?
1. Alignment 2. Risk analysis 3. Implementation
Hotspot

Proposal/ briefing
Product design
Production Launch Post-
launch review
Embedding sustainability in product design Topic Guide Over 80% of all product-related environmental impacts can be influenced during the design phase, presenting an opportunity for designers to adopt more sustainable practices and in turn contribute towards lower impact products and services. The challenge is to incorporate sustainable design principles into R&D processes, and to embed Ecodesign principles within the business sustainability strategy and brand positioning considerations.
The business benefit include cost reductions, brand and reputation enhancement. This approach may also meet future customer demand for products and services with reduced environmental impacts.
Resources
1. Defra sustainable product roadmaps – life cycle assessments, research and initiatives to improve environmental impact of products 2. WRAP circular economy – research and information on the circular economy (recapture & reuse of resources) 3. Eco SME – resources on Ecodesign for small businesses 4. Centre for Sustainable Design Ecodesign Strategy Wheel – Ecodesign consultancy for business 5. Eco3 Design consultancy – integrating Ecodesign into R&D
Implementation Process
This Topic Guide focuses on how to adapt conventional design into Ecodesign, starting with R&D. Embedding Ecodesign encompasses five main stages:
1) Identify design improvements
2) Compare design alternatives
3) Set Ecodesign strategy
4) Develop communications plan
5) Pilot and review of programme
Introduction Opportunities Hotspots Resources Help
Download
Topic Guide
Identify
design
improvements
– review
products in
context of
sustainability
strategy
Comparison
of design
alternatives –
develop new
products or
make changes
to existing
products
Ecodesign
strategy
setting –
agree
principles
aligned to
strategy
Communicate
environmental
benefits of
products
Pilot and
embed
programme.
Review and
feedback on
process
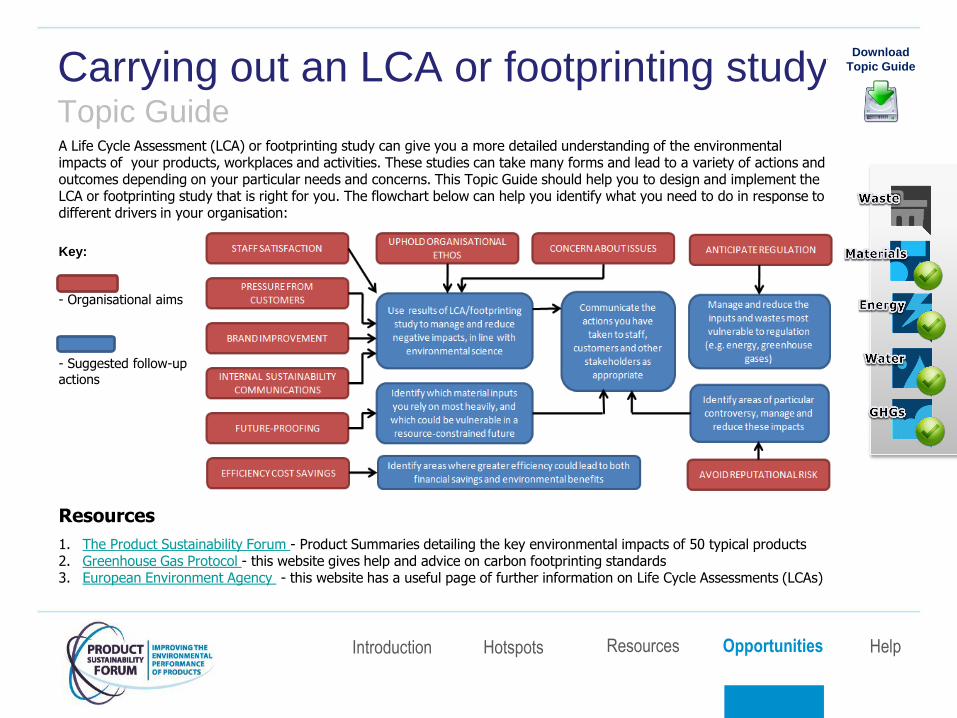
Key:
- Organisational aims
- Suggested follow-up actions
Carrying out an LCA or footprinting study Topic Guide A Life Cycle Assessment (LCA) or footprinting study can give you a more detailed understanding of the environmental impacts of your products, workplaces and activities. These studies can take many forms and lead to a variety of actions and outcomes depending on your particular needs and concerns. This Topic Guide should help you to design and implement the LCA or footprinting study that is right for you. The flowchart below can help you identify what you need to do in response to different drivers in your organisation:
Resources
1. The Product Sustainability Forum - Product Summaries detailing the key environmental impacts of 50 typical products 2. Greenhouse Gas Protocol - this website gives help and advice on carbon footprinting standards 3. European Environment Agency - this website has a useful page of further information on Life Cycle Assessments (LCAs)
Introduction Opportunities Hotspots Resources Help
Download
Topic Guide
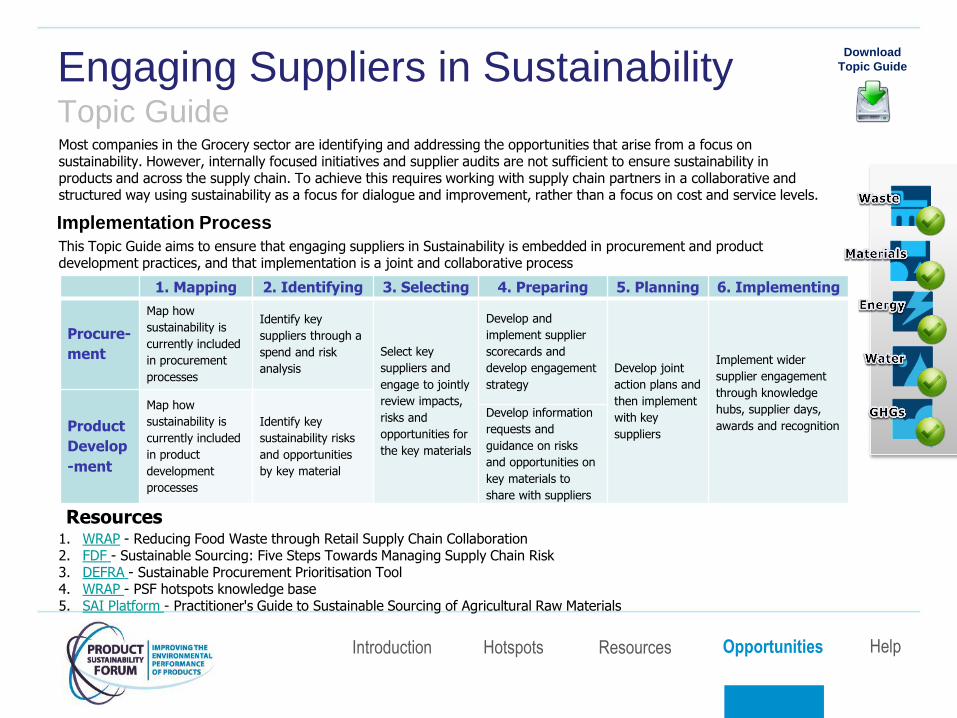
Engaging Suppliers in Sustainability Topic Guide Most companies in the Grocery sector are identifying and addressing the opportunities that arise from a focus on sustainability. However, internally focused initiatives and supplier audits are not sufficient to ensure sustainability in products and across the supply chain. To achieve this requires working with supply chain partners in a collaborative and structured way using sustainability as a focus for dialogue and improvement, rather than a focus on cost and service levels.
Resources 1. WRAP - Reducing Food Waste through Retail Supply Chain Collaboration 2. FDF - Sustainable Sourcing: Five Steps Towards Managing Supply Chain Risk 3. DEFRA - Sustainable Procurement Prioritisation Tool 4. WRAP - PSF hotspots knowledge base 5. SAI Platform - Practitioner's Guide to Sustainable Sourcing of Agricultural Raw Materials
Implementation Process
This Topic Guide aims to ensure that engaging suppliers in Sustainability is embedded in procurement and product development practices, and that implementation is a joint and collaborative process
Introduction Opportunities Hotspots Resources Help
Download
Topic Guide
1. Mapping 2. Identifying 3. Selecting 4. Preparing 5. Planning 6. Implementing
Procure-
ment
Map how
sustainability is
currently included
in procurement
processes
Identify key
suppliers through a
spend and risk
analysis
Select key
suppliers and
engage to jointly
review impacts,
risks and
opportunities for
the key materials
Develop and
implement supplier
scorecards and
develop engagement
strategy
Develop joint
action plans and
then implement
with key
suppliers
Implement wider
supplier engagement
through knowledge
hubs, supplier days,
awards and recognition
Product
Develop
-ment
Map how
sustainability is
currently included
in product
development
processes
Identify key
sustainability risks
and opportunities
by key material
Develop information
requests and
guidance on risks
and opportunities on
key materials to
share with suppliers

Help section
This section contains background information on the contents of this slide deck, including:
1. Frequently Asked Questions (FAQs)
2. Terms of use/Disclaimer
3. Product summary list – 50 product summaries are available covering food, drink, household and personal care categories
4. Reduction opportunities – a list of all those developed to date
5. Action plans & topic guides – a list of all those developed to date
Submit feedback
Introduction Opportunities Hotspots Resources Help
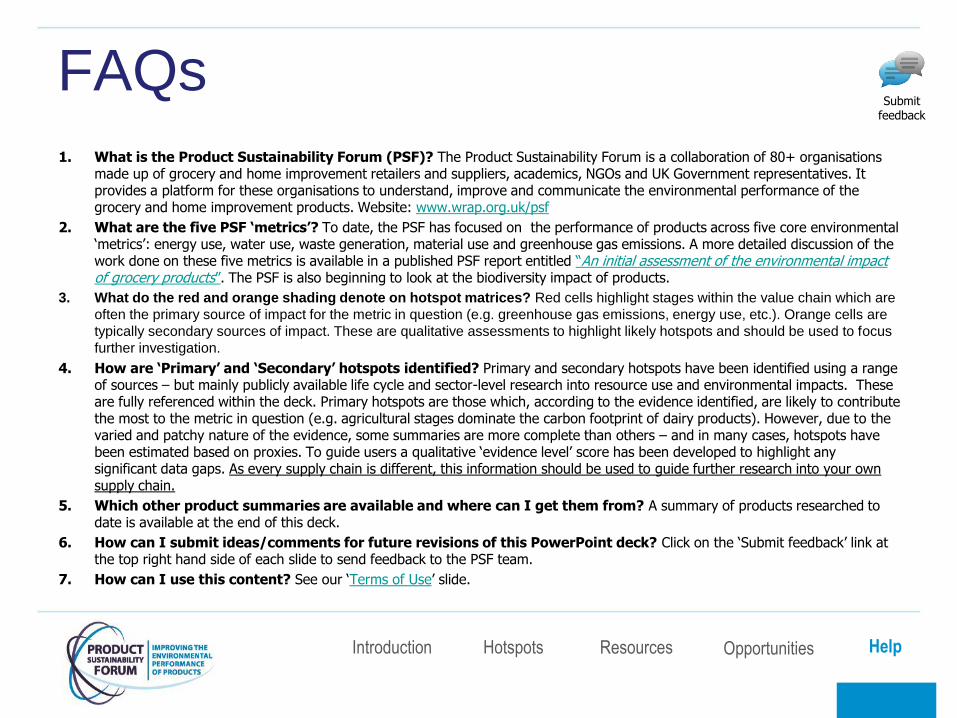
FAQs
1. What is the Product Sustainability Forum (PSF)? The Product Sustainability Forum is a collaboration of 80+ organisations made up of grocery and home improvement retailers and suppliers, academics, NGOs and UK Government representatives. It provides a platform for these organisations to understand, improve and communicate the environmental performance of the grocery and home improvement products. Website: www.wrap.org.uk/psf
2. What are the five PSF ‘metrics’? To date, the PSF has focused on the performance of products across five core environmental „metrics‟: energy use, water use, waste generation, material use and greenhouse gas emissions. A more detailed discussion of the work done on these five metrics is available in a published PSF report entitled “An initial assessment of the environmental impact of grocery products”. The PSF is also beginning to look at the biodiversity impact of products.
3. What do the red and orange shading denote on hotspot matrices? Red cells highlight stages within the value chain which are
often the primary source of impact for the metric in question (e.g. greenhouse gas emissions, energy use, etc.). Orange cells are
typically secondary sources of impact. These are qualitative assessments to highlight likely hotspots and should be used to focus
further investigation.
4. How are ‘Primary’ and ‘Secondary’ hotspots identified? Primary and secondary hotspots have been identified using a range of sources – but mainly publicly available life cycle and sector-level research into resource use and environmental impacts. These are fully referenced within the deck. Primary hotspots are those which, according to the evidence identified, are likely to contribute the most to the metric in question (e.g. agricultural stages dominate the carbon footprint of dairy products). However, due to the varied and patchy nature of the evidence, some summaries are more complete than others – and in many cases, hotspots have been estimated based on proxies. To guide users a qualitative „evidence level‟ score has been developed to highlight any significant data gaps. As every supply chain is different, this information should be used to guide further research into your own supply chain.
5. Which other product summaries are available and where can I get them from? A summary of products researched to date is available at the end of this deck.
6. How can I submit ideas/comments for future revisions of this PowerPoint deck? Click on the „Submit feedback‟ link at the top right hand side of each slide to send feedback to the PSF team.
7. How can I use this content? See our „Terms of Use‟ slide.
Submit feedback
Introduction Opportunities Hotspots Resources Help
Terms of use
• While we have tried to make sure this slide deck is accurate, we cannot accept responsibility or be held legally responsible for any loss or damage arising out of or in connection with this information being inaccurate, incomplete or misleading. This material is copyrighted. You can copy it free of charge as long as the material is accurate and not used in a misleading context. You must identify the source of the material and acknowledge our copyright. You must not use material to endorse or suggest we have endorsed a commercial product or service. For more details please see our terms and conditions on our website at www.wrap.org.uk.
Submit feedback
Introduction Opportunities Hotspots Resources Help
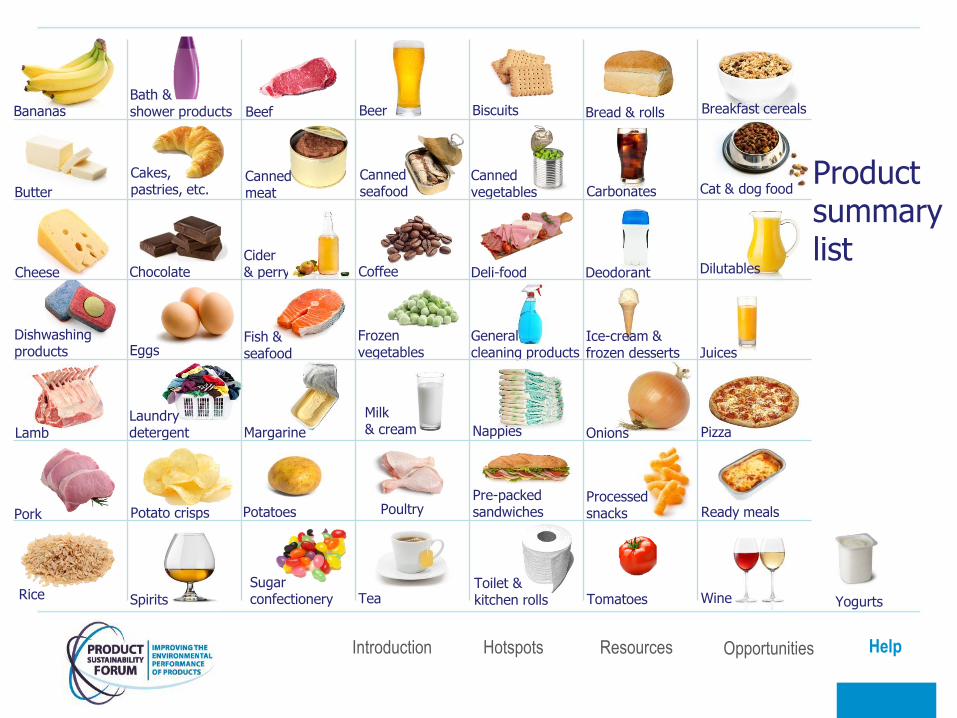
Product summary list
Bananas Bath & shower products Beef Biscuits Bread & rolls Breakfast cereals
Butter
Cakes, pastries, etc.
Canned meat
Coffee
Canned vegetables Carbonates Cat & dog food
Cheese Chocolate Cider & perry Deli-food Deodorant
Nappies
Dishwashing products
Fish & seafood
Frozen vegetables
General cleaning products
Ice-cream & frozen desserts
Lamb Margarine
Pork Potato crisps Potatoes Poultry Pre-packed sandwiches Ready meals
Rice Spirits
Sugar confectionery Tea
Toilet & kitchen rolls Tomatoes
Processed snacks
Yogurts
Dilutables
Beer
Laundry detergent
Eggs
Wine
Juices
Onions Pizza
Canned seafood
Milk & cream
Introduction Opportunities Hotspots Resources Help
Reduction opportunity list
• Addressing ‘green water’
• Benefits of soil management
• Crop irrigation best practice
• Precision agriculture
• Rolling out agricultural GHG tools
• Sourcing palm oil responsibly
• Sugar crop sustainability
• Sustainable fisheries & aquaculture
• Sustainable forestry products
• Water efficiency in livestock farming
• Closed-loop recycling
• Drinks packaging optimisation
• Renewable packaging materials
• Boiler energy efficiency in F&D
• CIP for resource efficiency
• Identifying the true cost of waste
• Increased efficiency of in-store bakeries
• Increasing motor drive efficiency
• Product re-formulation
• Water efficiency in drinks manufacture
• Water efficiency in meat processing
• Water re-use in F&D processing
• Extending product shelf life
• Food redistribution
• Shared logistics opportunities
• Improving consumer portioning
• Reducing kitchen energy use
• Reducing consumer food waste
• Water efficiency in the home
• Capital allowance for green tech
Submit feedback
Introduction Opportunities Hotspots Resources Help
Action plan & topic guide list Submit
feedback
Introduction Opportunities Hotspots Resources Help