house prices bubbles and their determinants in the czech republic and its regions luboš komárek...
TRANSCRIPT

House Prices Bubbles and their Determinants in the Czech Republic and its Regions
Luboš Komárek and Michal HlaváčekCzech National Bank
Prague
Based on CNB WP 12/2009The views expressed in this presentation are not
necessarily those of the Czech National Bank.

How we see our house….

... as seen by those interested in buying it, ...

... as seen by your bank, ...

... as seen by an appraiser ...

... and how the tax office sees it
7
O U T L I N E
• 1. Why to study house prices?• 2. Factors influencing house prices• 3. Sources of house price data in the Czech Republic• 4. Empirical analysis
4.1 Simple indicators
4.2 Time series analysis (the CR and Prague)
4.3 Panel Analysis (by districts)
• 5. Conclusion

8
1. Why study house prices? International comparision
• Until 2006- low price growth similar to GER or AT, 2007 renewed growth• In 2008- growth of prices in the CR despite price drops in the USA, Ireland, UK,
Spain, 2009 further price drops• House prices of our neighbors/ trade partners/ similar countries
Property prices - international comparisondeveloped countries (absolute index; 2006 Q1 = 100)
Source: BIS, CZSO, Case-Shiller (US), Nationwide (UK)
50
100
150
200
I/03 III I/04 III I/05 III I/06 III I/07 III I/08 III I/09 III I/10
CZ UK FR IE USAES AT GER
Property prices - international comparisonCEECs (absolute index; 2006Q1 = 100)
Source: BIS, CZSO, national central banks and statistical offices
50
100
150
200
I/03 III I/04 III I/05 III I/06 III I/07 III I/08 III I/09 III I/10
CZ HU SK PL LT LV BG

9
Why to study house prices? (II)
• Role of house price bubbles and mortgage loans in recent financial crisis- Could this happen in the CR?
• Macroeconomic impacts of bursting of such bubbles are higher than for bubbles for other asset classes (e.g. stocks) because these effects:
(i) last longer (4 Y compared 1.5 Y for stock market), (ii) present larger threat for the FS of giver country/region because
house pricesa) form the biggest part of HH wealthb) influence HH consumption via wealth effectb) function as collateral in balances of banking sector

10
1. Why study house prices? Impact to the Czech Republic
• High growth of house prices in 2H2006-2008• Growth of household loans for house purchases• Long horizon of those loans- increased probability of mis-pricing,
change of conditions of HH, …• House prices might influence PD and LGD• Record housing construction• Dynamics of loans to developers- again risk to banks• Potential mutual relationship between housing prices and housing
loans

11
1. Why study house prices? Complications for the analysis
• Complications for house price analysis • Standard problems: market heterogeneity (size, location,
depreciation…), lower quality of data• Transitive problems: converge character of the Czech
Economy (catching-up effect), development of the mortgage market, increases im housing quality, distortion effects arising from rent deregulation

12
2. Factors Determining Housing Prices
• Supply factors (conditional on profitability of construction industry; Supply inelastic in the short term):
• Saturation of housing needs and its dynamics (number of existing and newly finished apartments; (-)
• Cost factors (building plots prices; building construction costs); (+)
• Demand factors: • Disposable income of households (wage); (+)• Unemployment rate (-)• Ratio of economic activity, number of vacancies (+)• Demographic factors: Divorces (+), marriages (+), natural population
growth and migration (+)• Financial market development (+)• Interest rate (-)• Rents (+)

13
3. Sources of Housing Price Data in the CR
• Two basic types of data:• Transfer prices: CZSO- from 1998, but time lag• Supply prices: CZSO, IRI, Dolanský (Realit), King Sturge
• Tax evasion vs. Unrealistic advertisements, Completeness, Averages vs. Selected prices vs. Hedonic indexes
Apartment prices in Prague (2007 Q1=100)
Source: CZSO, IRI, Realit
70
80
90
100
110
120
130
140
150
I/04 III I/05 III I/06 III I/07 III I/08 III I/09 III I/10 III
CZSO transfer CZSO supply
IRI supply Dolanský supply
Apartment prices in the rest of the CR (2007 Q1=100)
Source: CZSO, IRI, Realit
70
80
90
100
110
120
130
140
150
I/04 III I/05 III I/06 III I/07 III I/08 III I/09 III I/10 IIICZSO transfer CZSO supply
IRI supply Dolanský supply

14
House Price variability and the variability of its possible determinants is often higher across regions than across time.
Descriptive statistics (figures for average region; annual data for 1998-2008)
Variable Unit Mean Median
Variability over time
(%) b)
Variability across regions
(%) b)
Apartment prices a) Kč/m213 000 12 128 27.4 37.6
Building plots prices a) Kč/m2 1 338 1 090 15.5 66.5
Apartment construction prices a) Kč/m2 23 369 22 756 4.5 10.3Completed apartments (without family houses)% of hous. stock 0.32 0.31 27.5 59.2No. of apartments per 1,000 inhabitants number 428.7 429.6 2.0 5.9
Marriages % of MYP 0.52 0.51 5.0 6.2Divorces % of MYP 0.30 0.30 9.3 14.3Natural population growth % of MYP -0.05 -0.08 238.0 166.9Net migration % of MYP 0.14 0.07 194.3 607.0Unemployment rate % 7.30 6.59 19.7 38.5Economic activity rate of population % 59.7 59.5 1.7 2.4Vacancies/labour force % 0.35 0.29 48.9 37.3
Average monthly wage a) CZK 13 458 13 385 13.0 11.0
Rent per month a) CZK/m2 75.0 72.6 14.2 27.5Loans a)
CZK millions 15 235 8 354 82.9 112.1
Source: CZSO, CNB, IRI
Notes: a) In 1998 pricesb) Variability computed as standard deviation in % of mean
MYP denotes mid-year population
Supp
ly
fact
ors
Dem
and
fact
ors
3. Sources of Housing Price Data in the CR

15
4.1 Empirical analysisSimple indicators of house price sustainability: Rental Return
• Rental return is inverse value to price-to-rent ratio
• 2007/08- Due to increase of prices decrease of the rent returns
• …despite increase of yields by alternative assets and interest of house purchase loans
• 2009/10- situation better
Rental returns (averages for period in %; comparison with yields on
10Y government bond and house purchase loan rates)
Source: IRI, CNB
3
5
7
9
11
2004 2006 II/07 IV II/08 IV II/09 IV II/10
Praha BrnoOstrava Liberec10Y yield Interest housing loansÚstí nad Labem

16
• Decrease of ratio in 2003-2006- due to wage growth
• 2007/8- Price growth higher than growth of wages
• Regions with lower wages have lower price-to-income ratio
• Prague as the most risky region.
4.1 Empirical analysisSimple indicators of house price sustainability: Price-to-Income
Price-to-income ratios
(ratio of price of 68 m2 apartment to wage for last 4 quarters)
Source: CZSO, CNB calculationNote: 2009 and 2010 data preliminary or calculated from supply prices
1
3
5
7
9
11
I/00 IV III II I/03 IV III II I/06 IV III II I/09 IV III
Czech Republic Prague Brno
Ústí n.L. Hradec Králové Ostrava

17
4. Empirical Analysis 4.2 Time series analysis:
overall regression statistics for the CR and for Prague
• Period of: 1998 Q1 – 2009 Q2, 46 Q observations, differences, real variablesVariable
Apartment prices a Coefficient Std. dev. b Coefficient Std. dev. b Coefficient Std. dev. b
Building plots prices a 0.481* 0.240 - - - -
Construction output price index a -0.576 0.504 0.764 0.492 0.263 0.685
Completed apartments a,c 0.000 0.000 0.000 0.000 0.000 0.000No. of apartments per 1,000 inhabitants 0.000 0.001 0.001 0.001 0.001 0.001
Marriages c 0.963 0.968 0.650 1.228 1.249 0.886Divorces 0.120 0.496 0.107 0.575 0.147 0.661Natural population growth c 0.665 0.528 0.703** 0.335 0.599* 0.320
Net migration 0.100* 0.057 0.068 0.095 0.011 0.019
Unemployment rate 0.004 0.006 0.001 0.006 -0.0385* 0.021
Economic activity -0.0055 0.006 -0.007 0.005 -0.0087* 0.005Vacancies/labour force 0.101** 0.049 0.132** 0.050 -0.016 0.042
Average monthly wage a,c 1.215*** 0.424 1.239* 0.641 0.398 1.393
Rent per month a 0.459** 0.195 - - - -
Loans a 0.048 0.061 0.006 0.080 0.099 0.2091Y Pribor 0.003 0.003 0.003 0.005 0.000 0.006Ratio of FDI to GDP 0.000 0.001 0.001 0.0010 0.001 0.0009
Adjusted R2 0.54 0.19 0.07Durbin-Watson statistic 1.78 1.22 1.23
CZ - Estimate A Prague - Estimate BCZ - Estimate B

18
4. Empirical Analysis 4.2 Time series analysis:
overall regression statistics for the CR and for Prague
• Period of: 1998 Q1 – 2009 Q2, 46 Q observations, differences, real variables
Apartment prices in the Czech Republic (CZK thousands per m2)
Source: CZSO, CNB calculation
5
10
15
20
1998 2000 2002 2004 2006 2008
Actual prices Regression estimate HP estimate
Gap in prices in the Czech Republic - deviation of actual prices from estimate in CZK thousands per m2(dashed lines indicate 10% confidence interval)
-2.5
-1.5
-0.5
0.5
1.5
2.5
1998 2000 2002 2004 2006 2008Regression gap HP filter gap

19
4. Empirical Analysis 4.3 Panel data analysis:
compared to OLS on differences (whole CR)
Variable
Apartment prices OLS PR OLS PR OLS PR
Apartment prices a x 0.938*** x 0.776*** x 0.859***Building plot prices b 0,633 1.223* x x x xApartment construction prices b 0,016 0,007 0,012 0,001 0,014 0,019Completed apartments -1,158 0,402 -16,161 -0,598 -11,456 5,813No. of apartments per 1,000 inhabitants -0.148*** -0,031 -0.297*** -0,155 -0.295*** -0,411Marriages -0,504 3,006 1,178 -66,890 -3,932 -49,907Divorces 50.739** 82.321** 76.245*** 75,974 68.843** 71,099
Natural population growth 38.941*** 70.323*** 16,269 56.733** 34.292** 78.167***Net migration 3,902 6,983 9.540* 15.395** 9,479 9,995
Unemployment rate -1.407*** -2.155*** -2.675*** -4.406*** -2.487*** -4.106***
Economic activity rate of population -1,005 0,880 -0,512 1,220 -0,636 1,342
Vacancies/labour force 11.958** 3,985 13.444* 7,303 8,127 2,086
Average monthly wage b 1.807*** 2.001*** 2.756*** 3.017*** 2.499*** 3.179***Rent per month b 102.285*** 95.205*** x x x xLoans b 0.048* -0,011 0.071** 0,013 0,095 0,0441Y Pribor 1,515 1,958 2,066 1,311 2,693 1,899
CZ - Estimate A CZ - Estimate B CZ excl. Prague - Estimate B

20
4. Empirical Analysis 4.3 Panel data analysis:
overall regression statistics for the CR and for Prague
• Panel regression across regions
-1500
-1000
-500
0
500
1000
1500
5 000 15 000 25 000 35 000 45 000
2007 apartment price (in CZK per m2)
Ave
rag
e r
esi
du
al (
in C
ZK
pe
r m
2)
U
A
Source: CZSO, IRI, CNB, CNB calculationNote: Region abbreviations given in abbreviations list.
T
C
J
L
E
P
K
O
Z
H
B
Apartment price overvaluation relative to apartment price(average residual for 1998-2008)
Apartment price gaps in the CR – devations of actual prices from estimates(CZK th. per m2; positive values overvaluation, negative undervaluation)
Source: CZSO, CNB calculation (WP 12/2009)
-2,5
-1,5
-0,5
0,5
1,5
2,5
I/98 IV III II I/01 IV III II I/04 IV III II I/07 IV III II/09
Gap time series HP filter gap Gap panel regression

21
5. Conclusion
• House Price determinants• Demographic factors: confirmation of positive influence of net
population growth and partly also migration and divorces. • Supply Factors: mixed evidence- significant building plots prices. • Demand Factors: significant influence of wage growth and rents,
partly unemployment.• Our estimate identified (in line with expectations) a bubble in house
prices for 2002/03 and for 2007/08. • However, in the second period the level of overvaluation much
lower despite similar house price dynamics in both periods. • Panel regression has shown that regions with higher prices are
more likely to be over-valued.• … with the exception of Prague. .

Thank you for your attention!
www.cnb.cz
Luboš KomárekCzech National Bank
Michal HlaváčekCzech National Bank
23
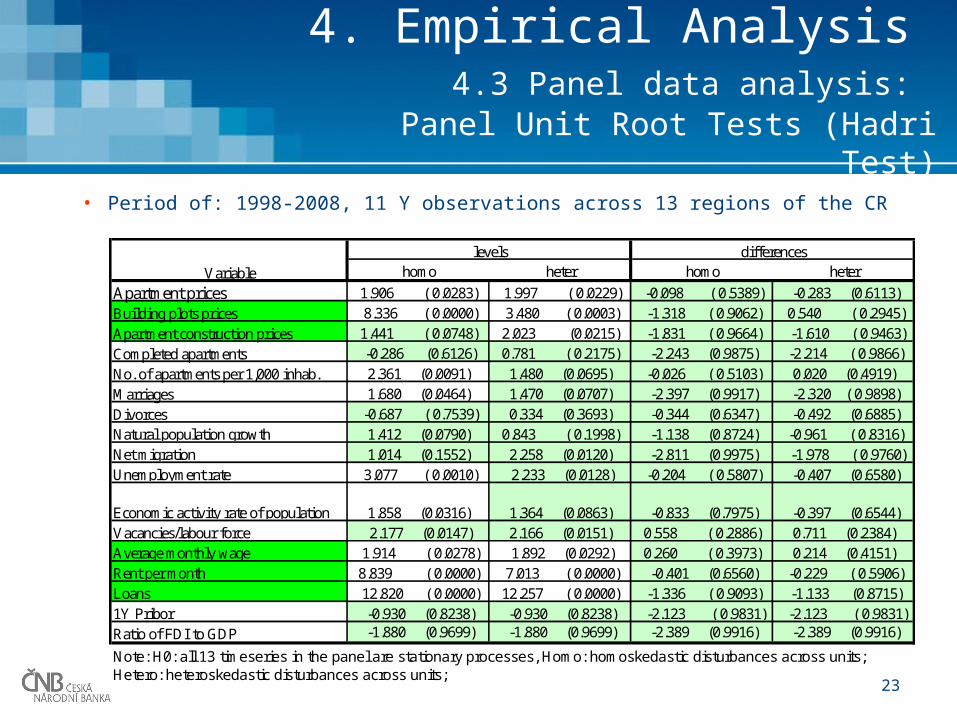
4. Empirical Analysis 4.3 Panel data analysis:
Panel Unit Root Tests (Hadri Test)
• Period of: 1998-2008, 11 Y observations across 13 regions of the CR
homo heter homo heter
Apartment prices 1.906 ( 0.0283) 1.997 ( 0.0229) -0.098 ( 0.5389) -0.283 (0.6113)
Building plots prices 8.336 ( 0.0000) 3.480 ( 0.0003) -1.318 ( 0.9062) 0.540 ( 0.2945)
Apartment construction prices 1.441 ( 0.0748) 2.023 (0.0215) -1.831 ( 0.9664) -1.610 ( 0.9463)
Completed apartments -0.286 (0.6126) 0.781 ( 0.2175) -2.243 (0.9875) -2.214 ( 0.9866)
No. of apartments per 1,000 inhab. 2.361 (0.0091) 1.480 (0.0695) -0.026 ( 0.5103) 0.020 (0.4919)
Marriages 1.680 (0.0464) 1.470 (0.0707) -2.397 (0.9917) -2.320 ( 0.9898)
Divorces -0.687 ( 0.7539) 0.334 (0.3693) -0.344 (0.6347) -0.492 (0.6885)Natural population growth 1.412 (0.0790) 0.843 ( 0.1998) -1.138 (0.8724) -0.961 ( 0.8316)Net migration 1.014 (0.1552) 2.258 (0.0120) -2.811 (0.9975) -1.978 ( 0.9760)Unemployment rate 3.077 ( 0.0010) 2.233 (0.0128) -0.204 ( 0.5807) -0.407 (0.6580)
Economic activity rate of population 1.858 (0.0316) 1.364 (0.0863) -0.833 (0.7975) -0.397 (0.6544)Vacancies/labour force 2.177 (0.0147) 2.166 (0.0151) 0.558 ( 0.2886) 0.711 (0.2384)Average monthly wage 1.914 ( 0.0278) 1.892 (0.0292) 0.260 ( 0.3973) 0.214 (0.4151)Rent per month 8.839 ( 0.0000) 7.013 ( 0.0000) -0.401 (0.6560) -0.229 ( 0.5906)Loans 12.820 ( 0.0000) 12.257 ( 0.0000) -1.336 ( 0.9093) -1.133 (0.8715)1Y Pribor -0.930 (0.8238) -0.930 (0.8238) -2.123 ( 0.9831) -2.123 ( 0.9831) Ratio of FDI to GDP -1.880 (0.9699) -1.880 (0.9699) -2.389 (0.9916) -2.389 (0.9916)
Note: H0: all 13 timeseries in the panel are stationary processes, Homo: homoskedastic disturbances across units; Hetero: heteroskedastic disturbances across units;
levels differences
Variable

Determining the equilibrium prices is tough task