household drinking water in developing countries: a · pdf filereview of microbiological...
TRANSCRIPT
Household drinking water in developing countries: a systematic
review of microbiological contamination between source and
point-of-use
Jim Wright1, Stephen Gundry1 and Ronan Conroy2
1 Water and Environmental Management Research Centre, University of Bristol, Bristol, UK2 Department of Epidemiology and Public Health Medicine, Royal College of Surgeons in Ireland, Dublin, Ireland
Summary objective To assess the extent and causes of microbiological contamination of household drinking
water between source and point-of-use in developing countries.
methods A systematic meta-analysis of 57 studies measuring bacteria counts for source water and
stored water in the home to assess how contamination varied between settings.
results The bacteriological quality of drinking water significantly declines after collection in many
settings. The extent of contamination after water collection varies considerably between settings, but is
proportionately greater where faecal and total coliform counts in source water are low.
conclusions Policies that aim to improve water quality through source improvements may be
compromised by post-collection contamination. Safer household water storage and treatment is
recommended to prevent this, together with point-of-use water quality monitoring.
keywords coliform bacilli, developing countries, meta-analysis, water microbiology, water purification,
household, recontamination, storage
Introduction
Water-related diseases continue to be one of the major
health problems globally. An estimated 4 billion cases of
diarrhoea annually represented 5.7% of the global disease
burden in the year 2000 (WHO 2002). One of the major
strategies for tackling this problem is the installation of
protected sources such as boreholes, standpipes or wells to
provide water of better quality. However, such communal
facilities are located some distance from the home, requi-
ring collection and transport from the source and subse-
quent storage of water within the household. It has
frequently been observed that the microbiological quality
of water in vessels in the home is lower than that at the
source, suggesting that contamination is widespread during
collection, transport, storage and drawing of water (Van
Zijl 1966; Lindskog & Lindskog 1988). This contamin-
ation may lessen the health benefits of water source
improvements.
This paper draws together the evidence from all studies
of household water contamination between source and
point-of-use and identifies how water contamination varies
between the different study settings. Reported changes in
water quality between source and point-of-use are sum-
marized through a literature review and water quality
changes investigated in relation to study design, quality
and setting characteristics.
Methods
Criteria for inclusion
The review considers only field-based studies in develop-
ing countries where water is transported from a source
outside the home and then stored within the household.
Findings about water quality in non-domestic or emer-
gency settings, such as hospitals, schools or refugee
camps, are excluded from the review. The review is
further restricted to microbiological measures of contam-
ination and excludes chemical aspects of water quality.
Studies using more unusual microbiological testing meas-
ures (e.g. somatic coliphages) are not included in the
review because there are too few studies to make
meaningful generalizations. The review is therefore lim-
ited to coliform bacteria (total coliforms, faecal coliforms
and Escherichia coli). The review is only concerned with
field-based studies and does not cover any laboratory-
based findings.
The included studies reported water quality results at
source and at point-of-use for the sampled households in
Tropical Medicine and International Health
volume 9 no 1 pp 106–117 january 2004
106 ª 2004 Blackwell Publishing Ltd

developing country communities. The results of these
studies are usually presented as an aggregate measure e.g.
mean E. coli per 100 ml, proportion of point-of-use
samples with faecal coliforms, etc. Sample sizes are
available for most studies.
Search strategy for identification of studies
The search for relevant literature was primarily through
on-line bibliographic databases (PubMed; Web of Science
and the African Index Medicus). Key words included
‘water + coliform + household’, ‘water + coliform + stor-
age’, ‘water + coliform + vessel’, ‘water + coliform +
stored’ and the same combination of search words using
‘coli’ instead of ‘coliform’. Abstracts highlighted by key
word searches were scanned for relevance and papers
photocopied as necessary. The so-called ‘ancestry appro-
ach’, in which references from key papers are systematic-
ally traced, was also used for two previous review papers
(Vanderslice & Briscoe 1993; Mintz et al. 1995). In
addition, the Journal of Diarrhoeal Diseases Research was
hand-searched for relevant articles. Non-peer reviewed
publications were also hand-searched, including the
‘WEDC’ conference series from 1994 onwards, ‘Water-
lines’ and ‘Dialogue on Diarrhoea’. In terms of language,
the search was restricted to papers published in English,
French or Spanish and in terms of publication date, to
papers published before 2003. In addition to findings from
the literature, unpublished results from our own fieldwork
in Venda district, South Africa are also included in the
analysis of contamination between source and point-
of-use.
Abstracts and other details of relevant studies were
collated in a bibliographic database. A spreadsheet was
also created for each of the three study types described
above. Each spreadsheet comprised a series of headings
against which the characteristics of each study could be
recorded. Study characteristics were in all cases recorded
by the lead author in these spreadsheets. Once the
spreadsheet had been compiled, it was exported to a
statistical package (Stata) for analysis.
In eight studies, results were published in too brief a
form to be usable for the review. In such cases, where work
had been published since 1980, an attempt was made to
contact the lead author of the publication to obtain more
detailed study results.
Statistical methods
We used a set of statistical techniques known as meta-
analysis to investigate the results of the observational
studies identified through the literature review. However,
the statistical combination of data from observational
studies is known to produce spurious results (Egger et al.
1998) and therefore no attempt was made to assess the
overall, typical contamination pattern across all these
studies. Rather, the meta-analysis used here investigated
how bacteriological contamination varied between the
studies and to what extent this variation was explained by
study characteristics. We used a five-stage approach to the
analysis.
(i) Identify study characteristics
The studies could be differentiated by their different
settings, their basic design and their perceived quality. Each
of the different characteristics within these three headings
has been suggested as an explanatory variable for observed
differences in contamination.
Setting
Source contamination: The percentage of samples testing
positive for indicator bacteria may decrease after collection
from highly contaminated sources because of die-off as
bacteria compete for limited oxygen and nutrients in the
water (Momba & Notshe 2003). Conversely, the percen-
tage of positive samples may increase after water is
collected and stored from safe sources because of
contamination through hands, unwashed containers and
dippers. The geometric mean indicator bacteria count and
percentage of samples positive for such bacteria were
therefore used to measure source contamination.
Use of protected water source: At least one study
(Lindskog & Lindskog 1988) has shown that households
may assume that water from protected sources is safe and
boil it less often.
Sanitation: Where basic sanitation is lacking, there is
more likelihood of indicator bacteria from faeces being
introduced into stored water (Ologe 1989).
Use of uncovered vessels: Using uncovered water
containers is likely to increase water contamination
between source and point-of-use as hands are dipped into
vessels to scoop a cupful of water (Chidavaenzi et al.
1998).
Storage vessel material: In one study, earthenware
vessels showed significantly higher levels of contamination
(Vanderslice & Briscoe 1993).
Urban vs. rural: The study location (urban or rural) was
also assessed, as the urban studies generally took place in
high density areas where poor environmental health might
increase post-collection contamination of water.
Our characterization of the different studies was limited
by the data collected in the original fieldwork. Variables
such as the time since water was collected (Roberts et al.
2001), the method of extracting water (Vanderslice &
Tropical Medicine and International Health volume 9 no 1 pp 106–117 january 2004
J. Wright et al. Review of drinking water contamination
ª 2004 Blackwell Publishing Ltd 107

Briscoe 1993), and the use of separate vessels for storage
and transport (Lindskog & Lindskog 1988) have also been
shown to affect water recontamination. However, such
characteristics were recorded only in a minority of the
studies we reviewed and so could not be adequately
analysed in this review.
Study design
Disease-oriented study: Studies were identified that con-
centrated sampling effort on households with cases of
disease such as diarrhoea (typically through a case control
design). By concentrating on households where water-
borne disease was present, such studies seemed more likely
to identify higher levels of water contamination between
source and point-of-use.
Intervention-related study: In some instances, we used
baseline data on water contamination from intervention
studies involving new water sources, sanitation or hygiene
education. Where no baseline data were collected, we
used control group data. This characteristic was also
recorded, so that we could test whether contamination
patterns were different in such study populations (e.g.
because villages with particularly unhygienic environ-
ments were more likely to be selected for intervention
studies).
Study quality
Whether or not the study was published in a refereed
journal was used as a measure of the quality of each of the
studies. These characteristics were subsequently used in a
meta-regression analysis as described in (v) below.
(ii) Indicator bacteria used
All of the studies analysed used one or more of the
following three indicator bacteria: (1) total coliforms
which are Gram-negative bacteria that ferment lactose at
35–37 �C within 24–48 h; (2) faecal thermo-tolerant
coliforms which are a subset of total coliform bacteria that
ferment lactose at 44–45 �C and (3) E. coli which are
exclusively faecal in origin, are a sub-group of the faecal
coliforms that produce the enzyme B-galactosidase and not
urease. WHO guidelines state that none of these bacteria
should be detectable in a 100-ml water sample (WHO
1997). Of these bacteria, E. coli are regarded as the most
reliable indicator of faecal contamination and total coli-
forms as the least reliable indicator.
(iii) A common basis for measuring contamination
Although it was possible to categorize studies by
characteristic and indicator bacteria, methods of reporting
indicator bacteria counts varied depending on the quality
of water under investigation. High bacteria count studies
were typically where over 90% of source samples tested
positive for the bacteria in question, in which case counts
were generally reported as geometric means. It was thus
decided to split the studies in each characteristic-indicator
pair according to whether bacteria counts were high or low
and use two different techniques to bring each to a
common basis of measurement. These techniques were: in
settings where bacterial counts were low, log odds ratios
were calculated using the Dersimonian and Laird random
effects method from the numbers of positive and negative
samples at source and point-of-use. Where most or all of
the water samples in a study were contaminated,
standardized mean differences (Egger et al. 1997b) were
calculated from the means and standard deviations of the
log-transformed bacteria counts using the Cohen method.
The standardized mean difference is the difference between
the mean bacteria count at source and point-of-use, divided
by the pooled standard deviation for both sets of water
samples. For most studies, log-transformed counts were
used because the distribution of bacteria counts in water is
generally positively skewed (exceptions are noted in
Table 1).
(iv) Testing for significant variation between studies
From stage (ii) to (iii), we grouped the available studies into
six categories according to the three types of indicator
bacteria and two levels of contamination. As there were no
‘high bacteria count’ studies of E. coli, one category was
effectively empty leaving a total of five categories of
studies. For each of these groups, we tested to see if there
were significant differences in contamination patterns
between studies using a heterogeneity test.
A separate analysis was performed for each of the three
indicator organisms because their abundance in water and
their origins may be different. For example, total coliforms
are known to originate from decaying vegetation whereas
E. coli are not and consequently patterns of contamination
may vary between the three types of organism. Further-
more, total coliforms are more numerous than faecal
coliforms, which are more numerous than E. coli and so
bacteria counts vary for each indicator. ‘High’ and ‘low’
bacteria count studies were analysed separately because the
method of assessing the change in water quality was
different for these two types of study.
(v) Explaining the variation in contamination between
studies
Where there were significant differences in contamination
between studies, we used a technique known as meta-
regression to see whether the study characteristics could
Tropical Medicine and International Health volume 9 no 1 pp 106–117 january 2004
J. Wright et al. Review of drinking water contamination
108 ª 2004 Blackwell Publishing Ltd
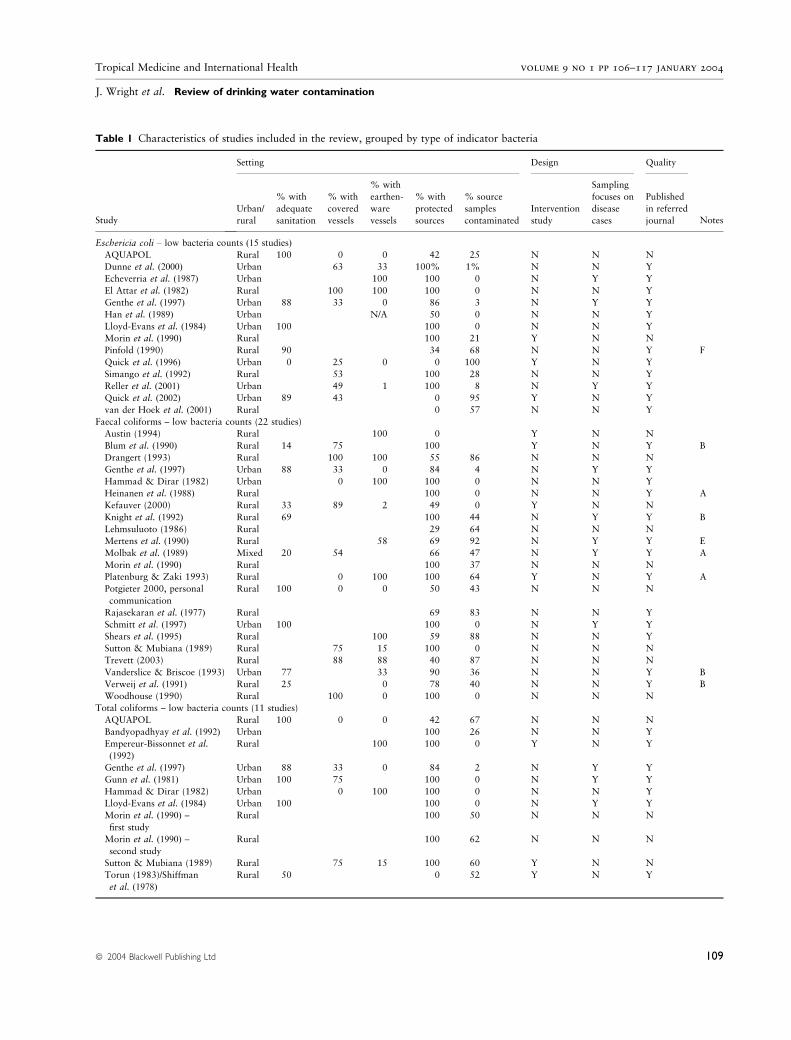
Table 1 Characteristics of studies included in the review, grouped by type of indicator bacteria
Study
Setting Design Quality
Notes
Urban/
rural
% with
adequate
sanitation
% with
covered
vessels
% with
earthen-
ware
vessels
% with
protected
sources
% source
samples
contaminated
Intervention
study
Sampling
focuses on
disease
cases
Published
in referred
journal
Eschericia coli – low bacteria counts (15 studies)
AQUAPOL Rural 100 0 0 42 25 N N N
Dunne et al. (2000) Urban 63 33 100% 1% N N Y
Echeverria et al. (1987) Urban 100 100 0 N Y Y
El Attar et al. (1982) Rural 100 100 100 0 N N Y
Genthe et al. (1997) Urban 88 33 0 86 3 N Y Y
Han et al. (1989) Urban N/A 50 0 N N Y
Lloyd-Evans et al. (1984) Urban 100 100 0 N N Y
Morin et al. (1990) Rural 100 21 Y N N
Pinfold (1990) Rural 90 34 68 N N Y F
Quick et al. (1996) Urban 0 25 0 0 100 Y N Y
Simango et al. (1992) Rural 53 100 28 N N Y
Reller et al. (2001) Urban 49 1 100 8 N Y Y
Quick et al. (2002) Urban 89 43 0 95 Y N Y
van der Hoek et al. (2001) Rural 0 57 N N Y
Faecal coliforms – low bacteria counts (22 studies)
Austin (1994) Rural 100 0 Y N N
Blum et al. (1990) Rural 14 75 100 Y N Y B
Drangert (1993) Rural 100 100 55 86 N N N
Genthe et al. (1997) Urban 88 33 0 84 4 N Y Y
Hammad & Dirar (1982) Urban 0 100 100 0 N N Y
Heinanen et al. (1988) Rural 100 0 N N Y A
Kefauver (2000) Rural 33 89 2 49 0 Y N N
Knight et al. (1992) Rural 69 100 44 N Y Y B
Lehmsuluoto (1986) Rural 29 64 N N N
Mertens et al. (1990) Rural 58 69 92 N Y Y E
Molbak et al. (1989) Mixed 20 54 66 47 N Y Y A
Morin et al. (1990) Rural 100 37 N N N
Platenburg & Zaki 1993) Rural 0 100 100 64 Y N Y A
Potgieter 2000, personal
communication
Rural 100 0 0 50 43 N N N
Rajasekaran et al. (1977) Rural 69 83 N N Y
Schmitt et al. (1997) Urban 100 100 0 N Y Y
Shears et al. (1995) Rural 100 59 88 N N Y
Sutton & Mubiana (1989) Rural 75 15 100 0 N N N
Trevett (2003) Rural 88 88 40 87 N N N
Vanderslice & Briscoe (1993) Urban 77 33 90 36 N N Y B
Verweij et al. (1991) Rural 25 0 78 40 N N Y B
Woodhouse (1990) Rural 100 0 100 0 N N N
Total coliforms – low bacteria counts (11 studies)
AQUAPOL Rural 100 0 0 42 67 N N N
Bandyopadhyay et al. (1992) Urban 100 26 N N Y
Empereur-Bissonnet et al.
(1992)
Rural 100 100 0 Y N Y
Genthe et al. (1997) Urban 88 33 0 84 2 N Y Y
Gunn et al. (1981) Urban 100 75 100 0 N Y Y
Hammad & Dirar (1982) Urban 0 100 100 0 N N Y
Lloyd-Evans et al. (1984) Urban 100 100 0 N Y Y
Morin et al. (1990) –
first study
Rural 100 50 N N N
Morin et al. (1990) –
second study
Rural 100 62 N N N
Sutton & Mubiana (1989) Rural 75 15 100 60 Y N N
Torun (1983)/Shiffman
et al. (1978)
Rural 50 0 52 Y N Y
Tropical Medicine and International Health volume 9 no 1 pp 106–117 january 2004
J. Wright et al. Review of drinking water contamination
ª 2004 Blackwell Publishing Ltd 109

account for such differences. For each of the five groups of
studies, we examined whether the study design, setting and
quality characteristics described in (i) above could account
for differences in contamination patterns. Meta-regression
based on the method of restricted maximum likelihood was
used to account for possible differences in the log odds
ratios and standardized mean differences between the
included studies (Thompson & Sharp 1999). Because
significant heterogeneity was identified in (iv) above, a
random effects regression model was used. This model
assumes that the studies are not drawn from the same
population.
We also tested for publication bias, which occurs where
smaller studies are more likely to be published if their
results are significant. In this context, studies based on
limited numbers of water samples might be more likely to
be published when they showed significant deterioration in
water quality from source to point-of-use. The resulting
data sets were therefore tested for publication bias using
Egger’s test (Egger et al. 1997a).
Study characteristics
We were unable to locate the original copies of three
reports that may potentially present relevant data (Mag-
nani et al. 1984; Mulugeta 1997; Handzel 1998). Table 1
shows the characteristics of the included studies, grouped
according to the type of indicator bacteria. Several papers
relating to faecal or total coliforms were not analysed
statistically and are also included in Table 1. These studies
were not analysed either because they did not report the
number of water samples taken (Tomkins et al. 1978;
Table 1 Continued
Study
Setting Design Quality
Notes
Urban/
rural
% with
adequate
sanitation
% with
covered
vessels
% with
earthen-
ware
vessels
% with
protected
sources
% source
samples
contaminated
Intervention
study
Sampling
focuses on
disease
cases
Published
in referred
journal
Faecal coliforms – high bacteria counts (11 studies)
Feachem (1978) Rural 100 1.1 N N N C
Jagals et al. (1997) Urban 100 32 0 100 1.0 N Y Y
Jagals et al. 1999 Urban 100 32 0 100 0.0 Y N Y
Kaltenthaler et al. (1996) Rural 75 4.0 N N Y C
Kirchhoff et al. (1985) Rural 0 100 0 9.2 Y N Y
Lindskog & Lindskog (1988) Rural 75 53 40 41 4.6 Y N Y
Mazengia et al. (2002) Rural 0 0 Y N Y C
Musa et al. (1999) Mixed 0 100 76 3.6 N N Y
Ologe (1989) Urban 100 0.2 Y N N
Quick et al. (1996) Urban 0 25 0 0 4.7 Y N Y
Swerdlow et al. (1992) Urban 100 1.4 N Y Y
Total coliforms – high bacteria counts (five studies)
Chidavaenzi et al. (1998) Rural 52 0 100 7.2 Y N Y C
Jagals et al. (1997) Urban 100 32 0 100 2.1 N Y Y
Jagals et al. 1999 Urban 100 32 0 100 1.8 Y N Y
Lindskog & Lindskog (1988) Rural 75 53 40 41 6.4 Y N Y
Swerdlow et al. (1992) Urban 100 2.2 N Y Y
Faecal coliforms – not analysed because of incomplete data (six studies)
Esrey et al. (1986) Rural 0 0 50 Y N N I
Han et al. (1989) Urban 50 N N Y D
Oluwande (1980)* 100 Y N N D
Sandiford et al. (1989) Rural 100 N N Y G
Tomkins et al. (1978) Rural 100 N N Y G
Young & Briscoe (1988) Rural 48 75 40 N Y Y H
A, lower limit of detection greater than one bacterium per 100 ml; B, sample size not specified at source, point-of-use or both. Lowest
possible sample size used that could account for percentage of contaminated samples; C, arithmetic mean used to describe bacteria counts,
so normal distribution assumed instead of log-normal distribution; D, no sample sizes or measures of dispersion provided for bacteria
counts; E, excludes households boiling water; F, bacteria tested per 50 ml, not per 100 ml; G, number of source and/or point-of-usesamples not specified; H, no measure of dispersion provided for bacteria counts; I, no measures of central tendency, means or samples sizes
(passing reference to water contamination only); N, no; Y, yes.
* Also included data on total coliforms.
Tropical Medicine and International Health volume 9 no 1 pp 106–117 january 2004
J. Wright et al. Review of drinking water contamination
110 ª 2004 Blackwell Publishing Ltd

Oluwande 1980), measures of dispersion for bacteria
counts (Young & Briscoe 1988; Han et al. 1989; Sandiford
et al. 1989), or measures of central tendency (Esrey et al.
1986). In all cases, we were unable to obtain more details
for these studies from the main authors.
Type of sanitation and type of water containers were
reported in only a sub-set of the published studies. The
identified studies took place in 30 different countries, as
shown in Figure 1. Of 57 studies reviewed, only four took
place in francophone Africa (Morin et al. 1990; Empereur-
Bissonnet et al. 1992; Angoran-Benie et al. 2000) Reller
et al. 2001) and none in Portuguese-speaking Africa
(although there may be studies published only in Portu-
guese from these countries).
Results
Variation in contamination between studies
Figure 2a shows the odds ratios derived from the propor-
tion of samples contaminated with E. coli at source and
point-of-use [the ‘low bacteria count’ studies in (iii) above].
Figure 2b,c show the odds ratios for faecal and total
coliforms. In Figure 2, odds ratios above 1 indicate that
water quality is worse at point-of-use, whilst values below
1 indicate that it is worse at source. Figure 3 shows the
standardised mean difference in faecal and total coliforms
between source and point-of-use [the ‘high bacteria count’
studies in (iii) above]. Standardized mean differences above
1 indicate that water quality is worse at point-of-use,
whilst values below 1 indicate that it is worse at source.
In both Figures 2 and 3, the change in water quality
Figure 1 Locations of studies of water contamination and
household water treatment/storage interventions that were
identified in the review.
Odds ratio(95% CI)
Odds ratio0.018 0.05 0.13 0.37 1 2.71 7.4 20 54 148
Study
105.00 (1.65, 6697.38)Hammad & Dirar, 1982: Sudan
781.00 (14.00, 43568.03)Gunn ., 1981: Bahrainet al
45.00 (1.43, 1413.50)Lloyd-Evans , 1984: Gambiaet al.
7.04 (0.32, 153.23)Empereur-Bissonet ., 1992: Burkina Fasoet al
127.22 (57.73, 280.34)Genthe ., 1997: S. Africaet al
7.52 (2.89, 19.54)Bandyopadhyay ., 1992: Indiaet al
8.07 (4.27, 15.27)Morin , 1990: Rwandaet al.
1.32 (1.06, 1.65)Torun, 1983: Guatemala
1.13 (0.31, 4.12)Sutton & Mubiana, 1989: Zambia
13.09 (8.59, 19.94)Morin ., 1990: Rwanda (2nd study)et al
13.00 (1.35, 125.52)S. Africa [*]
12%
5%
Odds ratio
0.018 0.05 0.13 0.37 1 2.71 7.4 20 54 148
StudyOdds ratio(95% CI)
105.00 (1.65, 6697.38)Hamand and Dirar, 1982: Sudan 15.00 (0.18,1236.18)Schmitt , 1997: Zambiaet al. 15.00 (0.39, 576.69)Kefauver, 2000: Nicaragua 1.63 (0.09, 30.67)Sutton & Mubiana, 1989: Zambia 37.80 (1.46, 980.75)Woodhouse, 1990: Kenya 5.22 (2.67, 10.20)Genthe ., 1997: S. Africaet al 1578.28 (92.18, 27023.61)Ologe, 1989: Nigeria 1.96 (1.40, 2.73)Vanderslice & Briscoe, 1993: Philippines 4.39 (2.62, 7.35)Morin ., 1990: Rwandaet al 0.75 (0.17, 3.23)Verweij .,1991: S. Africaet al 3.33 (0.36, 30.70)Potgieter, pers comm.: S. Africa 0.31 (0.07, 1.30)Knight .,1992: Malaysiaet al 2.63 (1.41, 4.92)Molbak .,1989: Liberiaet al 7.58 (3.98, 14.44)Lehlmusluoto, 1986: Kenya 20.01 (7.84, 51.07)Platenburg & Zaki, 1993: Egypt 657.89 (40.45,10698.85)Rajasekaran et al.,1977: India 0.35 (0.04, 3.45)Drangert, 1993: Tanzania 3.73 (0.48, 28.74)Shears et al.,1995: Bangladesh 1.20 (0.93, 1.55)Mertens et al.,1990: Sri Lanka 3.13 (0.12, 80.68)Blum .,1990: Nigeriaet al 0.09 (0.01, 1.78)Austin, 1994: Gambia 13.32 (0.65, 274.72)Heinanen .,1988: Zimbabweet al
20%
2%
(b)
Odds ratio
0.018 0.05 0.13 0.37 1 2.71 7.4 20 54 148
Study Odds ratio(95% CI)
4.15 (0.23, 73.85)El Attar ., 1982: Egyptet al
3.53 (0.19, 66.10)Han ., 1989: Myanmaret al
0.38 (0.01, 10.81)Lloyd-Evans ., 1984: Gambiaet al
0.63 (0.04, 10.12)Echeverria ., 1987: Thailandet al
75.53 (10.07, 566.41)Dunne ., 2000: Cote d'Ivoireet al
3.58 (1.61, 7.99)Genthe ., 1997: S. Africaet al
4.86 (2.69, 8.78)Morin ., 1990: Rwandaet al
9.00 (1.35, 59.78)S. Africa [*]
1.81 (0.88, 3.72)Simango ., 1992: Zimbabweet al
5.86 (3.24, 10.62)Pinfold, 1990: Thailand
0.19 (0.01, 4.09)Quick ., 1996: Boliviaet al
8%
2%
(a)
(c)
Figure 2 Odds ratios derived from the proportion of samples atsource and point-of-use testing positive for indicator bacteria: (a)
Escherichia coli, (b) faecal coliforms and (c) total coliforms. Values
<1 indicate better water quality at point-of-use; values >1 indicatebetter water quality at source. The box symbols indicate the weight
given to each study and studies have been sorted according to
the percentage of contaminated source samples. Numbers are
references for each study and * indicates our own unpublished data.
Tropical Medicine and International Health volume 9 no 1 pp 106–117 january 2004
J. Wright et al. Review of drinking water contamination
ª 2004 Blackwell Publishing Ltd 111

recorded in a study is significant if the error bars do not
pass through 1.
Figures 2 and 3 suggest that the proportion of contam-
inated samples and geometric mean bacteria count were
significantly greater at point-of-use in approximately half
of the studies reviewed. Regardless of the indicator
bacteria, there were no studies where the geometric mean
bacteria count or proportion of contaminated samples was
significantly lower at point-of-use.
Small-scale studies showing significant levels of con-
tamination between source and point-of-use were no
more likely to be published than those showing no
significant contamination. This was evident from Egger’s
test, which was not significant for any bacteriological
indicator.
The heterogeneity test suggested that there was signifi-
cant variability between different studies for all three types
of indicator bacteria and both statistical measures of
contamination between source and point-of-use.
Table 2 shows the meta-regression results for the three
types of indicator bacteria for ‘high’ and ‘low bacteria
count’ settings. In each case, the regression model that
explained the greatest amount of variation between studies
is presented. In a bivariate meta-regression analysis, study
quality, as measured by publication in a refereed journal,
was not significantly related to the change in water quality
for any of the indicator bacteria. Consequently, studies
published in refereed journals were pooled with 11 studies
published elsewhere in the meta-regression analysis shown
in Table 2.
For E. coli, the variation between study results was not
explained by any of the study setting, design or quality
characteristics. For ‘low bacteria count’ studies of faecal
coliforms, all of the variation between study results was
explained by the proportion of households using covered
water storage vessels.
For the ‘high bacteria count’ studies of both total and
faecal coliforms, contamination after collection was
significantly higher when the geometric mean bacteria
count for source water was low. The percentage of
contaminated source samples was also associated with
higher levels of contamination for ‘low bacteria count’
studies of total coliforms. This can be seen from
Figures 2c and 3 in which study results have been
ordered according to the level of source contamination.
Studies with safe water sources appear at the top of these
figures and poorer quality sources at the bottom. Water
quality deterioration from source to point-of-use, as
measured by the standardized mean difference or log
odds ratio, is greater for the studies of uncontaminated
water sources. The total coliform studies with good
quality source water were generally in urban settings and
most were designed to sample households with disease
cases more intensively. Consequently, both these variables
were also significantly related to higher levels of con-
tamination when entered into separate regression models
for total coliforms.
Discussion
Water contamination between source and point-of-use
Most observational studies of change in the microbiologi-
cal quality of water at source and point-of-use indicate a
decline after collection, although there is significant
Standardised mean diff.
–2 –1 0 1 2 3 4 5
Study Standardised mean diff.(95% CI)
4.56 (4.07, 5.06)Jagals ., 1999: S. Africaet al
7.97 (7.16, 8.79)Ologe, 1989: Nigeria
4.09 (3.60, 4.57)Jagals l., 1997: S. Africaet a
0.14 (–1.30, 1.57)Feachem et al., 1978: Lesotho
0.47 (–0.15, 1.08)Swerdlow ., 1992: Peruet al
1.27 (0.94, 1.60)Musa ., 1999: Sudanet al
0.11 (–0.30, 0.52)Kaltenthaler ., 1996: Botswanaet al
0.50 (0.31, 0.70)Lindskog & Lindskog, 1988: Malawi
–0.22 (–0.97, 0.52)Quick ., 1996: Boliviaet al
0.38 (–0.78, 1.54)Kirchhoff ., 1985: Brazilet al
Standardised mean diff.
–2 –1 0 1 2 3 4
Study Standardised mean diff.(95% CI)
3.52 (3.10, 3.94)Jagals ., 1999: S. Africaet al
3.37 (2.94, 3.80)Jagals ., 1997: S. Africaet al
1.03 (0.38, 1.67)Swerdlow ., 1992: Peruet al
0.67 (0.40, 0.95)Lindskog & Lindskog, 1988: Malawi
0.15 (–0.21, 0.52)Chidavaenzi ., 1998: Zimbabweet al
(a)
(b)
9%
20%
Figure 3 Standardized differences derived from the mean and
standard deviation of logged indicator bacteria counts at source
and point-of-use for (a) faecal coliforms and (b) total coliforms.
Values <0 indicate better water quality at point-of-use; values>0 indicate better water quality at source. Both graphs have
been sorted by the geometric mean bacteria counts at source.
Numbers are references for each study.
Tropical Medicine and International Health volume 9 no 1 pp 106–117 january 2004
J. Wright et al. Review of drinking water contamination
112 ª 2004 Blackwell Publishing Ltd

variation between settings. The results in Figures 2 and 3
suggest that approximately half of the included studies
identified significant contamination after collection. There
were no instances where microbiological water quality
improved significantly after collection. The decline in water
quality between source and point-of-use measured in terms
of faecal and total coliforms is proportionately greater
where source water is largely uncontaminated. These are
often ‘improved’ water sources, such as wells and
communal standpipes. For such sources, safer household
water storage (Chidavaenzi et al. 1998) may be an
appropriate additional intervention to prevent contamin-
ation of domestic water. If water testing is performed
only at sources in such settings, then results of monitoring
may not reflect the quality of water actually consumed in
the home.
The percentage of point-of-use samples contaminated
with faecal coliforms was also lower where households
generally covered their water containers. This reduction in
contamination by covering vessels implicates hands and
cups being dipped in water as a probable source of
contamination. This observation is supported by interven-
tion studies, which have found that covered vessels reduce
faecal and total coliform counts in stored water by 50%
(Chidavaenzi et al. 1998; Mazengia et al. 2002).
Our review assessed the aggregate, community-level
changes in water quality across multiple households and
not water quality changes at the individual household level.
It should be borne in mind that even where the typical
household experiences poorer water quality at point-of-
use, there are likely to be a minority of households that do
not conform to this general trend within a population. For
example, Vanderslice and Briscoe (1993) found that water
quality actually improved between source and point-of-use
for 16% of households in their study, although the
majority experienced the opposite trend.
Nearly all studies used total coliforms, faecal coliforms
or E. coli as an indicator of faecal contamination, reflecting
available water testing technology in most developing
countries. Of these indicator bacteria, E. coli are regarded
as the most reliable measure of public health risks in
drinking water (Edberg et al. 2000). Total coliforms can
originate from decaying vegetation in tropical areas and so
do not necessarily indicate the presence of pathogens in
water. Similarly, faecal coliforms are now often referred to
as ‘thermo-tolerant’ coliforms because many may be non-
faecal in origin. In our analysis, the most useful indicator of
faecal contamination in point-of-use water, E. coli, was
thus the least predictable.
Methodological problems
It is possible that the studies reviewed here may be subject
to two types of systematic bias. One possibility is that
subjects, on realising that water samples are being taken
from neighbouring homes, modify their behaviour
accordingly and become more careful in their handling and
storage of water. Such a change in behaviour would mean
that the studies here systematically underestimate the
extent of contamination after collection. Secondly, the
studies reviewed here are generally based on two sets of
samples, those taken in the home and those taken at
source. The source for each household is often identified by
asking a subject about the water sources used that day. Our
Table 2 Meta-regression results for studies of microbiological water quality at source and point-of-use
Indicator
bacteria
General level of
water quality
Study characteristic(s)
in best model
Number
of studies Co-efficient
% of
heterogeneity
explained
Residual
heterogeneity
(s2)
Escherichia coli Low bacteria counts – 14
Faecal coliforms Low bacteria counts Proportion using covered
water vessels
11 )2.08* 100 0
Total coliforms Low bacteria counts Percentage of contaminated
source samples
11 )4.548* 48 1.26
Faecal coliforms High bacteria counts Geometric mean bacteriacount at source
10 )0.581� 30 5.07
Total coliforms High bacteria counts Geometric mean bacteria
count at source
5 )0.491� 57 1.053
* Indicates co-efficient significant at the 99% level.
� Indicates a co-efficient significant at the 95% level.s2 is an estimate of the between-studies variance, having adjusted for the study characteristics shown in the table. This estimate assumes
that the residual errors are normally distributed. The percentage of heterogeneity explained indicates the reduction in between-studies
variance after adjusting for the study characteristics.
Tropical Medicine and International Health volume 9 no 1 pp 106–117 january 2004
J. Wright et al. Review of drinking water contamination
ª 2004 Blackwell Publishing Ltd 113

own recent fieldwork in Zimbabwe suggests that study
subjects may be reluctant to admit to using an unprotected
source, as they realise that such sources are regarded as
hazardous to health. In this event, where subjects claim to
use protected sources but are actually drawing water from
unprotected sources, the extent of post-collection
contamination is likely to be overestimated. Furthermore,
the recommended sterilization of taps and boreholes by
‘burning off’ can lead to an underestimate of source
contamination that may occur as water is pumped
(Mertens et al. 1990).
The number of study characteristics examined in this
review was limited by the findings reported in the litera-
ture. There may be other unreported, confounding factors
in communities using safer sources (e.g. higher population
densities and greater overcrowding) that could account for
greater contamination of stored water there. In some
studies, it was also unclear whether the number of samples
taken from different source types reflected the number of
households using each source type. This would also affect
estimates of water quality change between source and
point-of-use. Furthermore, sample sizes and measures of
dispersion (e.g. geometric standard deviations) for coliform
distributions need to be documented when reporting
results. Without such key information, omitted in several
papers reviewed here, comparison of findings between
studies is difficult.
Future research
It is clear that the microbiological processes occurring within
the transport and storage vessels are complex, given the
interaction of the biota in the collected water with biofilms in
the containers and/or recontamination through dipping
hands and cups into containers. Future research is required
to understand these processes in more detail and also to
assess how the storage period affects point-of-use water
quality. We also recommend that future studies record
turbidity as this may indicate the presence of organic matter,
a major influence on regrowth or die-off of micro-organ-
isms. Given that total and faecal coliforms are no longer
regarded as reliable indicators of faecal contamination, it is
also recommended that E. coli be assayed in future studies of
recontamination of domestic drinking water.
Conclusions
Microbiological contamination of water between source
and point-of-use is widespread and often significant.
Increased faecal and total coliform counts in stored
domestic water are especially found in urban areas with
uncontaminated supplies. The results imply that samples
taken from storage vessels may provide a better reflection
of the quality of water consumed than source samples,
particularly in urban areas with safe water sources.
Given these findings, future research is required into ways
to combat such contamination at point-of-use if the
health benefits of improved sources are not to be
compromised.
Acknowledgements
This research was funded by the European Union
INCO-DEV programme (contract no. ICA4-CT-2000-
30039). The authors wish to acknowledge the assistance of
Dr Prabhat Vaze of the Office for National Statistics for
technical guidance and Kevin Murray for comments on
chemical analysis of water samples. We also acknowledge
Misheck Kirimi of the Network for Water and Sanitation
International (Kenya), Kirsty Forbes and Hannah Bird
for their assistance in compiling literature. The authors
also wish to acknowledge the assistance of numerous
authors contacted, who provided further information for
the review here and comments by two anonymous
reviewers.
References
Angoran-Benie Y, Sibailly TS, Kamelan-Tano Y et al. (2000)
Implications of household water practices on replacement feed-
ing of children born to HIV-infected women, Abidjan, Cote
d’Ivoire. In: 13th International AIDS Conference, Durban,
South Africa, July 9th. Monitoring South Africa, Durban, 129–
131.
Austin CJ (1994) Chlorinating household water in the Gambia. In:
Proceedings of the 20th WEDC Conference, Colombo, Sri
Lanka (eds J Pickford, P Barker, A Coad, M Ince, R Shaw &
B Skinner) WEDC, Loughborough, pp. 151–153.
Bandyopadhyay S, Banerjee K, Khanna KK, Sharma RS &
Verghese T (1992) Drinking water quality and diarrhoea
in Delhi. The Journal of Communicable Diseases 24, 156–
158.
Blum D, Emeh RN, Huttly SR et al. (1990) The Imo state (Nigeria)
drinking water supply and sanitation project, 1. Description of
the project, evaluation methods, and impact on intervening
variables. Transactions of the Royal Society Tropical Medicine
and Hygiene 84, 309–315.
Chidavaenzi MT, Jere M, Nhandara C, Chingundury D & Bradley
M (1998) An evaluation of water urns to maintain domestic
water quality. 24th WEDC Conference, Islamabad, Pakistan.
(ed. J Pickford) WEDC, Loughborough, pp. 249–253.
Drangert J (1993) Who Cares About Water? Household Water
Development in Sukumaland, Tanzania. Linkoping University,
Linkoping.
Dunne E, Angoran Y, Kamelan-Tano K et al. (2000) Is drinking
water in Abidjan, Cote d’Ivoire safe for infant formula?
Tropical Medicine and International Health volume 9 no 1 pp 106–117 january 2004
J. Wright et al. Review of drinking water contamination
114 ª 2004 Blackwell Publishing Ltd
49th Annual EIS Conference, Atlanta, Georgia. Epidermic
Intelligence Service, Atlanta, Georgia, pp. 25–28.
Echeverria P, Taylor DN, Seriwatana J et al. (1987) Potential
sources of enterotoxigenic Escherichia coli in homes of children
with diarrhea in Thailand. Bulletin of the World Health
Organization 65, 207–215.
Edberg SC, Rice EW, Karlin RJ, & Allen MJ (2000) Escherichia
coli: the best biological drinking water indicator for public
health protection. Journal of Applied Microbiology 88, 106S–
116S.
Egger M, Smith GD, Schneider M & Minder C (1997a) Bias in
meta-analysis detected by a simple, graphical test. British
Medical Journal 315, 629–634.
Egger M, Smith GD & Phillips AN (1997b) Meta-analysis:
principles and procedures. British Medical Journal 315,
1533–1537.
Egger M, Schneider M & Smith GD (1998) Meta-analysis spurious
precision? Meta-analysis of observational studies. British
Medical Journal 316, 140–144.
El Attar L, Abdel GA, Khairy AE & El Sebaie O (1982) The
sanitary condition of rural drinking water in a Nile Delta village.
II. Bacterial contamination of drinking water in a Nile Delta
village. Journal of Hygiene (London) 88, 63–67.
Empereur-Bissonnet P, Salzman V & Monjour L (1992) Appli-
cation d’un nouveau materiel de transport et de stockage pour
l’amelioration de la qualite de l’eau de boisson en milieu
rural Africain. Bulletin du Societe Pathologie Exotique 85,
390–394.
Esrey S, Habicht JP, Casella G et al. (1986) Infection, diarrhoea,
and growth rates of young children following the installation
of village water supplies in Lesotho. In: Proceedings of the
International Symposium on Water-related Health Issues,
American Water Resources Association, Atlanta, GA,
pp. 11–16.
Feachem RG (1978) Water, Health and Development. Tri-med
Books, London.
Genthe B, Strauss N, Seager J, Vundule C, Maforah F & Kfir R
(1997) The effect of type of water supply on water quality in a
developing community in South Africa. Water Science and
Technology 35, 35–40.
Gunn RA, Kimball AM, Mathew PP, Dutta SR & Rifaat AH
(1981) Cholera in Bahrain: epidemiological characteristics
of an outbreak. Bulletin of the World Health Organization 59,
61–66.
Hammad ZH & Dirar HA (1982) Microbiological examination of
sebeel water. Applied and Environmental Microbiology 43,
1238–1243.
Han AM, Oo KN, Midorikawa Y & Shwe S (1989) Contamina-
tion of drinking water during collection and storage. Tropical
and Geographical Medicine 41, 138–140.
Handzel T (1998) The effect of improved drinking water quality
on the risk of diarrhoeal disease in an urban slum of Dhaka,
Bangladesh: a home chlorination intervention trial. PhD Thesis,
University of North Carolina.
Heinanen A, Chandiwana SK, Makura O, Chimbari M & Bradley
M (1988) Faecal contamination of rural drinking water in a
commercial farming area of Zimbabwe. The Central African
Journal of Medicine 34, 253–259.
der Hoek W, Konradsen F, Ensink JHJ, Mudasser M & Jensen
PK (2001) Irrigation water as a source of drinking water: is
safe use possible? Tropical Medicine & International Health 6,
46–54.
Jagals P, Grabow W & Williams E (1997) The effects of
supplied water quality on human health in an urban develop-
ment with limited basic subsistence facilities. Water SA 23,
373–378.
Jagals P, Bokako T & Grabow W (1999) Changing consumer
water-use patterns and their effect on microbiological water
quality as a result of an engineering intervention. Water SA 25,
297–300.
Kaltenthaler EC, Drasar BS & Potter CW (1996) The use of
microbiology in the study of hygiene behaviour. Microbios 88,
35–43.
Kefauver J (2000) Solar Water Disinfection Project: Matagalpa
Region, Nicaragua. Agency for Environmental Health, Green
Bay, WI.
Kirchhoff LV, McClelland KE, Do Carmo PM, Araujo JG,
de Sousa MA & Guerrant RL (1985) Feasibility and efficacy of
in-home water chlorination in rural North- eastern Brazil.
Journal of Hygiene (London) 94, 173–180.
Knight SM, Toodayan W, Caique WC, Kyi W, Barnes A &
Desmarchelier P (1992) Risk factors for the transmission of
diarrhoea in children: a case-control study in rural Malaysia.
International of Journal of Epidemiology 21, 812–818.
Lehmsuluoto M (1986) Contamination of potable water in rural
areas: should it be systematically monitored as part of impact
management of various interventions? In: Proceedings of World
Water ’86: Water Technology for the Developing World.
London, Thomas Telford, pp. 41–42.
Lindskog RU & Lindskog PA (1988) Bacteriological contamina-
tion of water in rural areas: an intervention study from Malawi.
Journal of Tropical Medicine and Hygiene 91, 1–7.
Lloyd-Evans N, Pickering HA, Goh SG & Rowland MG (1984)
Food and water hygiene and diarrhoea in young Gambian
children: a limited case control study. Transactions of the Royal
Society Tropical Medicine and Hygiene 78, 209–211.
Magnani R, Tourkin S & Hartz M (1984) Evaluation of the
Provincial Water Project in the Philippines. US Department of
Commerce, Washington, DC.
Mazengia MS, Chidavaenzi M, Bradley M et al. (2002) Effective
and culturally acceptable water storage in Zimbabwe: main-
taining the quality of water abstracted from upgraded family
wells. Journal of Environmental Health 64, 15–18.
Mertens TE, Fernando MA, Marshall TF, Kirkwood BR, Cairn-
cross S & Radalowicz A (1990) Determinants of water quality,
availability and use in Kurunegala, Sri Lanka. Tropical Medicine
and Parasitology 41, 89–97.
Mintz ED, Reiff FM & Tauxe RV (1995) Safe water treatment and
storage in the home. A practical new strategy to prevent
waterborne disease. JAMA 273, 948–953.
Molbak K, Hojlyng N, Jepsen S & Gaarslev K (1989) Bacterial
contamination of stored water and stored food: a potential
Tropical Medicine and International Health volume 9 no 1 pp 106–117 january 2004
J. Wright et al. Review of drinking water contamination
ª 2004 Blackwell Publishing Ltd 115

source of diarrhoeal disease in West Africa. Epidemiology and
Infection 102, 309–316.
Momba MNB & Notshe TL (2003) The microbiological quality of
groundwater-derived drinking water after long storage in
household containers in a rural community of South Africa.
Journal of Water Supply Research & Technology AQUA 52,
67–77.
Morin R, Jost P & Spruijt H (1990) Health benefits of water and
sanitation in Rwanda. Water Quality Bulletin 15, 29–35.
Mulugeta T (1997) Survey on practices of water handling and level
of contamination between the source and use in the homes.
BSc Thesis, Jimma Institute of Health Sciences.
Musa HA, Shears P, Kafi S & Elsabag SK (1999) Water quality
and public health in northern Sudan: a study of rural and
peri-urban communities. Journal of Applied Microbiology 87,
676–682.
Ologe JO (1989) Household water in rural Kwara. In: Water,
Engineering and Development in Africa: Proceedings of the
15th WEDC Conference. WEDC, Loughborough, pp. 96–99.
Oluwande PA (1980) Public health implications of chemical and
bacteriological characteristics of treated water in Western State
of Nigeria. Nigerian Medical Journal 7, 86–90.
Pinfold JV (1990) Faecal contamination of water and fingertip-
rinses as a method for evaluating the effect of low-cost water
supply and sanitation activities on faeco-oral disease transmis-
sion. I. A case study in rural north-east Thailand. Epidemiology
and Infection 105, 363–375.
Platenburg R & Zaki M (1993) Patterns of water quality in
rural areas of Assyut Governorate, Egypt. Water Science and
Technology 27, 55–65.
Quick RE, Venczel LV, Gonzalez O et al. (1996) Narrow-
mouthed water storage vessels and in situ chlorination in a
Bolivian community: a simple method to improve drinking
water quality. The American Journal of Tropical Medicine and
Hygiene 54, 511–516.
Quick RE, Kimura A, Thevos A et al. (2002) Diarrhea prevention
through household-level water disinfection and safe storage in
Zambia. American Journal of Tropical Medicine and Hygiene
66, 584–589.
Rajasekaran P, Dutt PR & Pisharoti KA (1977) Impact of water
supply on the incidence of diarrhoea and shigellosis among
children in rural communities in Madurai. The Indian Journal of
Medical Research 66, 189–199.
Reller ME, Mong YJM, Hoekstra RM & Quick RE (2001) Cholera
prevention with traditional and novel water treatment methods:
an outbreak investigation in Fort-Dauphin, Madagascar. Amer-
ican Journal Of Public Health 91, 1608–1610.
Roberts L, Chartier Y, Chartier O, Malenga G, Toole M & Rodka
H (2001) Keeping clean water clean in a Malawi refugee camp:
a randomized intervention trial. Bulletin of the World Health
Organisation 79, 280–287.
Sandiford P, Gorter AC, Smith GD & Pauw JP (1989) Determi-
nants of drinking water quality in rural Nicaragua. Epidemiol-
ogy and Infection 102, 429–438.
Schmitt R, Bryan FL, Jermini M et al. (1997) Hazards and critical
control points of food preparation in homes in which persons
had diarrhea in Zambia. Journal of Food Protection 60,
161–171.
Shears P, Hussein MA, Chowdhury AH & Mamun KZ (1995)
Water sources and environmental transmission of multiply
resistant enteric bacteria in rural Bangladesh. Annals of Tropical
Medicine and Parasitology 89, 297–303.
Shiffman M, Schneider R, Faigenblum J, Helms R & Turner A
(1978) Field studies on water, sanitation, and health education
in relation to health status in central America. Progress in Water
Technology 11, 143–150.
Simango C, Dindiwe J & Rukure G (1992) Bacterial contamina-
tion of food and household stored drinking water in a farm-
worker community in Zimbabwe. The Central African Journal
of Medicine 38, 143–149.
Sutton S & Mubiana D (1989) Household water quality in rural
Zambia. Waterlines 8, 20–21.
Swerdlow DL, Mintz ED, Rodriguez M et al. (1992) Waterborne
transmission of epidemic cholera in Trujillo, Peru: lessons for a
continent at risk. Lancet 340, 28–33.
Thompson SG & Sharp SJ (1999) Explaining heterogeneity in
meta-analysis: a comparison of methods. Statistics Medicine 18,
2693–2708.
Tomkins AM, Drasar BS, Bradley AK & Williamson WA (1978)
Water supply and nutritional status in rural northern Nigeria.
Transactions of the Royal Society Tropical Medicine and
Hygiene 72, 239–243.
Torun B (1983) Environmental and educational interventions
against diarrhoea in Guatemala. In: Diarrhoea and
Malnutrition: Interactions, Mechanisms and Interventions
(eds LC Chen & NS Scrimshaw) Plenum Press, New York,
pp. 235–266.
Trevett A (2003) The public health significance of drinking-
water quality deterioration in rural Honduran communities.
PhD Thesis, Silsoe College, Cranfield University.
Van Zijl WJ (1966) Studies on diarrhoeal diseases in seven coun-
tries by the WHO Diarrhoeal Diseases Advisory Team. Bulletin
of the World Health Organisation 35, 249–261.
Vanderslice J & Briscoe J (1993) All coliforms are not created
equal – a comparison of the effects of water source and in-house
water contamination on infantile diarrheal disease. Water
Resources Research 29, 1983–1995.
Verweij PE, van Egmond M, Bac DJ, van der Schroeff JG &
Mouton RP (1991) Hygiene, skin infections and types of water
supply in Venda, South Africa. Transactions of the Royal
Society Tropical Medicine and Hygiene 85, 681–684.
WHO (1997) Guidelines for Drinking Water Quality Vol. 3:
Surveillance and Control of Community Supplies. World Health
Organisation, Geneva.
WHO (2002) The World Health Report 2002. World Health
Organisation, Geneva.
Woodhouse M (1990) Consumer involvement in bacteriological
testing of well water in Kibwezi, Kenya. Waterlines 8, 3–5.
Young B & Briscoe J (1988) A case-control study of the effect
of environmental sanitation on diarrhoea morbidity in
Malawi. Journal of Epidemiology and Community Health
42, 83–88.
Tropical Medicine and International Health volume 9 no 1 pp 106–117 january 2004
J. Wright et al. Review of drinking water contamination
116 ª 2004 Blackwell Publishing Ltd

Authors
Dr Jim Wright (corresponding author) and Dr Stephen Gundry, Water and Environmental Management Research Centre, University of
Bristol, 83 Woodland Road, Bristol BS8 1US, UK. Tel.: +44 117 954 5289; Fax: +44 117 954 5389;
E-mail: [email protected], [email protected]
Mr Ronan Conroy, Department of Epidemiology and Public Health Medicine, Royal College of Surgeons in Ireland, Mercer Building,
Mercer Street Lower, Dublin 2, Ireland. E-mail: [email protected]
Tropical Medicine and International Health volume 9 no 1 pp 106–117 january 2004
J. Wright et al. Review of drinking water contamination
ª 2004 Blackwell Publishing Ltd 117