household energy use in selected areas in and around cape town
TRANSCRIPT

SAMSET – Supporting Sub-Saharan African Municipalities with Sustainable Energy Transitions
Household Energy Use in Selected Areas in and
around Cape Town
Sustainable Energy Africa
July 2015

Household Energy Use in Selected Areas in and around Cape Town Page 2 of 23
Contents Introduction ............................................................................................................................................ 3
Households and energy: a city overview ................................................................................................ 3
Household energy characterization ........................................................................................................ 3
Thermal efficiency of households ....................................................................................................... 4
Access to energy and household fuel sources .................................................................................... 5
Non-electrified households and multiple fuel use.............................................................................. 6
Alternative, renewable energy sources and energy efficiency ........................................................... 7
Household energy end usage .............................................................................................................. 8
Cooking ........................................................................................................................................... 8
Lighting ............................................................................................................................................ 8
Geysers and water heating ............................................................................................................. 9
........................................................................................................................................................ 9
Television, radio, computers and cell phones (“media”) ................................................................ 9
Space heating .................................................................................................................................. 9
Clothes washing ............................................................................................................................ 10
Transportation and mobility ................................................................................................................. 10
Transport expenditure .................................................................................................................. 11
Conclusion ............................................................................................................................................. 12
Appendix 1: Detailed survey methodology notes ............................................................................. 14
High income residential areas ....................................................................................................... 14
Middle Income Residential Areas ................................................................................................. 15
Low Income Residential Areas ...................................................................................................... 16
Appendix 2: Establishing the representivity of the sample .............................................................. 19
Appendix 3: Broad summary of household characterisation ........................................................... 20
Appendix 4: Electricity metering and disaggregation of consumers in terms of meter type and
income/residential area band ........................................................................................................... 21
Appendix 5: Appliance composition and the main uses for energy in households .......................... 22

Household Energy Use in Selected Areas in and around Cape Town Page 3 of 23
Introduction There is currently no easy method to disaggregate energy supply data down to final household
consumption. This report synthesises the results of a household energy use survey undertaken in
Cape Town1. The data provides a snapshot picture of key household energy consumption patterns
and related issues for decision makers and for urban energy modellers2.
Households and energy: a city overview The following data provides a snapshot overview of key household and energy consumption figures
for Cape Town in 2012:
Table 1: Key population and energy statistics for Cape Town households
Population 3 837 414
Households 1 000 000
Proportion of country by demographics 7.3%
Annual average population growth 2001 - 2011 2.6%
Household growth 2001 – 2011 (formal and informal) 4%
Informal or backyard households as portion of city households 20%
Energy consumed by city (all sectors) 151 854148 GJ
Portion of energy consumed by residential sector 13%
Portion of total electricity consumed by residential sector 37%
Portion of energy consumed by private passenger transport 67%
Level of household electrification 94%
Electricity as portion of residential fuel consumption 85%
Paraffin as portion of residential fuel consumption 9%
LPG as portion as residential fuel consumption
Household energy characterization Historical settlement patterns, based on apartheid, have a legacy impact on housing type and
resultant energy consumption. Many households in the survey’s “mid income” designated group in
fact fell into the low income bracket, however, there remained a distinction in housing type: houses
in this grouping are predominantly formal, with a free standing/semi-detached split; they have been
electrified for many years and are better built (more thermally efficient) than in the areas with
1 The survey was undertaken by Mthenthe Consulting Services in 2014. A copy of the survey results can be
obtained from Sustainable Energy Africa. The survey was thus undertaken across 180 households in the city,
across 7 residential areas spread across low, middle and high-income areas. Sample communities were also
selected across a reasonable geographic spread in the City, and housing typology. The idea was not to be
statistically accurate, but rather to provide quantifiable, indicative data of household energy consumption
amongst low, middle and high income areas. Energy use information sought included the thermal efficiency of
the house structure, appliance and related fuel usage, energy access and affordability, household mobility and
related costs.
2 The information forms part of a LEAP Energy Future Scenario modelling exercise being undertaken for the
City of Cape Town, with the support of the SAMSET: Supporting Sub Saharan African Municipalities Sustainable Energy Transition.

Household Energy Use in Selected Areas in and around Cape Town Page 4 of 23
newer housing programmes. In ‘black’ areas, there is a far higher degree of informality,
electrification is more recent and far less complete.
For Cape Town purposes, therefore, models should build up a household profile that takes into
account not just income, but location/housing type as well. In other words, a proportion of low
income households will display energy consumption characteristics of “mid income” households if
they are based in areas where houses have been electrified for a number of years, have ceilings and
are formal.
Household size was fairly consistent across income categories in the survey, and this is borne out in
the census. Income does not appear to be a strong driver of household size, save for a phenomenon
where the majority of very small households (1-2 persons) fall in the low income band.
Table 2: Survey area household characterisation summary
High Income “Middle” Income Low Income
Survey locations
Constantia, Durbanville
Woodstock, Mitchell’s Plain Joe Slovo Park, Khayelitsha, Masiphumelele
Location type ex White areas, wealthy, electrified
ex Coloured/White areas, more built up, electrified
ex Black areas, less built up, only recently electrified
Income levels Wealthy Poor and medium: some half have less than R3 200/month; others medium income
Poor: majority below R3 200 per month; those in medium income bracket still earning below R5 000/month.
Housing type Free standing houses 100% ceilings 100% electrified
Semi-detached and free standing; 12% backyard shacks 93% ceilings 99% electrified
Informal and backyard shacks form the majority (86%); 29% ceilings 90% electrified
Household size
Ave 3,77 persons Ave 4,4 persons Ave 3,68 persons
Meter type 57% credit; 43% prepaid
54% credit; 46% prepaid 3% credit; 97% prepaid
Estimated proportion of households in Cape Town
25% Actual households in 2012: 272 317
37% Actual households in 2012: 293 775 in terms of income, but indications are that some 100 000 low income households would fall within this housing/location characteristics = 393 775. Of this, 36 381 are informal dwellings (or 9%)
38% Actual households in 2012: 502 409 in terms of income, but likely 100 000 of this group in fact reside in areas with housing/energy characteristics typical of ‘mid income’ grouping = 402 409 Of this, 179 071, are informal dwellings (or 45%).
Thermal efficiency of households Thermal insulation provided through thicker walls and insulated ceilings ensure that houses are kept
cool in summer and warm in winter. Poor thermal insulation in a house results in poor health (from
cold, damp and the use of fuels with noxious gases indoors), and higher energy costs for the
household. The poor, living mostly in informal housing, have little thermal insulation: 70% of poor
households do not have a ceiling in their house.

Household Energy Use in Selected Areas in and around Cape Town Page 5 of 23
In contrast, high income and most mid income households in Cape Town are well insulated. Amongst
the survey areas, semi-detached housing, which can offer thermal benefits, was only found in the
older, central city architecture of the ‘mid income’ area of Woodstock.
Although middle income areas had ceilings, they also had a higher use of energy for heating and
cooling than the high income grouping, indicating that the housing stock here may well be less than
thermally adequate. However, this may also have a ‘cultural’ or ‘social’ root: high and low income
households both reported using blankets and warm clothing to provide warmth in winter (as an
alternative to a fuel-based energy service); this did not appear to be a norm amongst mid income
households.
Table 3: Breakdown of houses with ceiling by income group (%)
High Income Middle Income Low Income Total
Yes 100% 93.2% 28.6% 61.7%
No - 6.8% 71.4% 38.3%
TOTAL n = 30 n = 59 n = 91 n = 180
Access to energy and household fuel sources The majority of Cape Town households are electrified (94%) and use electricity to meet most of their
energy needs (90%). Access to electricity is good: vendors are close to residences and customers can
(and poor households do) buy in small amounts on a regular basis with few, if any, transaction costs
for multiple top ups3. This has had an enormously positive impact in terms of the reduction of
paraffin usage, and related health and safety risks, in households.
Formal connection, with an individual household meter is still a concern. Although most survey
respondents indicated having their own meter (94%), the Cape Town Metropolitan Area (CMA)
electricity SAP data indicates that only half of all households have meters4. Having a meter is
important as it facilitates a household’s ability to receive the national basic energy grant, which is
usually administered directly through the meter; it also means that the likelihood of additional costs
being charged through informal on-selling of electricity from a main-household is reduced.
Experience of technical problems seems to be predominantly amongst poorer residents. The
following contrasting responses are illustrative:
Table 4: Experience of technical problems by income group (respondents’ perceptions)
Sometimes/often Rarely/never
Low income 68% 32%
Mid income 46% 54%
High income 20% 80%
3 The data from Delft and Joe Slovo indicates that households spend an average of R15 – R20 per recharge and
recharges take place approximately every 5-8 days. The indication is that the meter system that allows for
frequent top ups when cash is available works fairly well for poor households. Although some recharge sites
do charge a small fee, this is not very visible in the data and does not appear to be a substantial burden for
poor households.
4 Cape Town SAP registry, 2014

Household Energy Use in Selected Areas in and around Cape Town Page 6 of 23
Technical problems related to electricity supply were most often explained as the result of over-
loading of plugs and over-use of appliances (51%), as well as wet wires and rain (14.3%). These
challenges relate to conditions of poverty. Relatively low amp connections are provided for low
income housing developments, whereas these households often supply multiple households with
electricity5. With few power sockets, a high usage of appliances off a single plug can result in
demand overload. Many connections may be informal – simply a wire running between houses –
and susceptible to rain and other interferences.
Electricity is considered by the majority of respondents to be “unaffordable”. High income
households spend, on average, well over R1 000/month; poor households spend just over
R100/month6. For poor households the free basic electricity grant forms as much as 25 – 30% of
total consumption. In rand value terms this amounts to a grant of approximately R50/month
towards meeting household energy needs.
Table 5: Average electricity consumption and spend of households in Delft and Joe Slovo (based on 5 households in each settlement).
Area Kwh/month Cost per month*
Ave Delft 156 R 92.16
Ave Joe Slovo 186 R 120.96
* Cost based on Lifeline Block 1 tariff (less than 350KWh/month), at 96c/Kwh plus first 60Kwh free
through Free Basic Electricity grant.
Source: SEA monitoring of household electricity consumption, 2013
Non-electrified households and multiple fuel use Despite impressive electrification levels, there are still 6% of city households that do not have access
to electricity (10% of low income survey households). These houses rely predominantly on paraffin.
Paraffin is also used in low income, electrified, houses on occasions when the household may run
out of electricity. Only poor, black households (a third of low income survey respondents) indicated
that they use paraffin. Gas was reportedly used in 16 households, both in mid and low income
groups. High income households in the survey rely solely on electricity. However, StatSA census 2011
figures indicate that use of gas amongst the high income households in the city has increased from
2001, presumably in response to rising electricity prices and electricity blackouts.
Of the 35 households using paraffin (non-electrified and electrified), 14% use less than R50/month –
likely as a ‘top up’ fuel when electricity has run out; and 14% use between R200 – 400/month – in
this instance it is likely that paraffin represents the primary fuel use of the household. The majority
of households use between R100 – R200.
5 9 low income households reported that they ‘on sell’ electricity to households, this ranged from on-sell to 8
other households (1 respondent) or from 1 – 3 households (likely in their own yards).
6 Data based on recording of consumption in households in Delft and Joe Slovo in Cape Town – two areas that
would align with “low income” within this study – indicated an average spend of just over R100 per month across 5 households in each settlement. These figures seem more reliable than those obtained in the Mthenthe survey, where there was some lack of clarity around what the figures refereed to. The figures for Delft are an average over a full 12 month period, for Joe Slovo, only a 3 month period (during autumn months).

Household Energy Use in Selected Areas in and around Cape Town Page 7 of 23
Expenditure on gas indicates that for most households it is a cooking fuel, or ‘top up’ fuel, but not a
primary fuel: 50% of the 16 households using gas spend less than R100/month on gas, the remaining
50% spend up to R400/month (but with the majority of this between R100 – R200).
The average energy expenditure recorded in the Mthente survey is displayed in the table below. The
low income electricity figure would be lower if the ‘on-sell’ households were included in the
calculation (an additional 9 households).
Figure 1: Average monthly energy expenditure by energy type and suburban income level (Mthente Survey)
Further work will be needed in order to present more accurate energy ‘burden’ figures, but the
indications are that amongst low income households income spent on meeting energy needs can
range from 8 – 20%7.
Alternative, renewable energy sources and energy efficiency Although research by the City indicates that penetration of solar water heating technology in the
high income category is about 8%, the survey results indicated no SWH penetration in high or mid
income areas. However, the community of Joe Slovo reported very high levels of SWH penetration.
Survey findings indicated that 3.3% of high income respondents (6=n) noted that they have a solar
electric PV system. This is a very high figure, again relating to a specific pilot programme, initiated by
the City, to test the impact of PV uptake and grid-feed in amongst households.
Awareness regarding energy efficiency amongst all households was good. Household energy savings
measures include the use of energy saving lightbulbs, fuel switching (to gas) and behaviour change,
such as switching off geyser, lights and other appliances when not in use. The use of solar geysers in
7 This figure is from calculations based on the Delft / Joe Slovo figures (ranging from R100 – R150/month) and
income from R800 – R3 200/month. If pursuing the Mthente survey figures, the energy burden per household in the low income category (assuming highest monthly household income – R3 200 – and average consumption of R364/month) would be around 15%. Of course many low income households would have an income lower than this upper end of the low income bracket, rendering that burden greater.
R 1 687.24
R 364.58 R 576.52
R 186.57 R 178.00 R 158.18
R -
R 500.00
R 1 000.00
R 1 500.00
R 2 000.00
High Income Middle Income Low Income
Monthly Energy Expenditure
Electricity
Paraffin
Gas

Household Energy Use in Selected Areas in and around Cape Town Page 8 of 23
some low income communities provides an incredible benefit. This is usually part of a government
rollout scheme, rather than a systematic city-delivered service, or private purchase of the
technology.
Eskom did an extensive rollout of energy efficient light bulbs from 2008-2010. The data indicates,
however, a significant level of “rebound”, where households have reverted to the old, cheap,
inefficient bulbs once the efficient bulb has died or broken.
Table 6: Most frequently used lighting/bulb type by suburban income level (%)
Normal Bulbs Energy Efficient CFL’s LED Downlighters
High Income 23% 70% 20%
Middle Income
64% 36% -
Low Income 72% 28% -
Household energy end usage Householders in Cape Town consider the main uses of energy to be, in order of priority: Cooking,
Lighting, Media (television, charging phones and radio), Bathing (warm water). Heating and washing
clothes using energy was minimally associated with energy use, indicating that many households
would not use energy, in the main, for these tasks.
Only 2,8% of Mthente survey respondents noted that they use electricity in their house for
supporting a small business (economic purposes). The majority (3 respondents) run spaza shops
from home, one has a hair salon and one (only mid income respondent) seems to use ‘spray
materials’ – presumably running a car spray painting business.
Cooking Electricity is reported as being used for cooking in all instances in high and mid income households
and in 97% of households amongst the low income respondents. Microwaves and electric stoves and
ovens are extensively owned amongst high and medium income households; only 47% of low
income households own such appliances.
Although gas and paraffin use for cooking was minimal, 10% of mid income and 3% of low income
survey households indicated that gas would be a preferred fuel.
Alternative options for cooking, when households run out of electricity (not reported as a frequent
incident), include buying food from a local store (spaza), cooking outside using fire, or buying gas or
paraffin, if not electricity.
Lighting Household lighting is electric (only 1% of respondents reported using paraffin for lighting). Most
respondents are currently using traditional tungsten (inefficient) light bulbs. These use much more
electricity, but are cheaper to buy. This presents an important efficiency opportunity.

Household Energy Use in Selected Areas in and around Cape Town Page 9 of 23
Geysers and water heating High and mid income households use electric geysers (100% and 86% respectively) for water heating
for bathing, low income households that are not serviced with solar water heating use kettles to
heat water for bathing and washing. Water is also heated through use of pots on stove tops or
hotplates. This represents an important area for greater efficiency, both in terms of total
consumption, but also in terms of peak demand.
Table 7: Most frequently used energy for heating water, by suburban income level (%)
High Income Middle Income Low Income
Electric geyser 100% 86%
Solar water heater 42%
Paraffin - - 3%
Pots on stove - 9% 13%
Kettle - 5% 42%
Figure 2: Informal households in Joe Slovo Park with solar geysers
Television, radio, computers and cell phones (“media”) Households, regardless of area or income band, use electricity to run “media-related” appliances,
such as television, cell phone and radios are fairly standard across most households regardless of
area or income band. These appliances use a very small amount of electricity in comparison with
cooking or water heating.
Space heating Most survey respondents (47%) indicated that they use an electric heater for keeping warm in cold
weather. It is interesting to note the high use of electric fans, as well as electric heaters, in mid
income households (56% of mid income households own electric fans, and 81% of mid income
respondents identified electric heaters as the most frequently used heat source). The implication is
that these households can afford this “luxury”, yet need it due to bad thermal performance of poor

Household Energy Use in Selected Areas in and around Cape Town Page 10 of 23
housing stock. High income households, who could also afford this, appear not to need it (in cold
weather blankets and warm clothing and, in some instances, under floor heating, can perform this
task adequately), presumably due to thermal comfort provided by better built stock.
19% of low income households use paraffin most frequently for heating, which has implications for
indoor air pollution. Low income households also use blankets and warm clothing for warmth in cold
times. As the income levels of these households rise, they may well use greater levels of energy in
order to achieve comfortable levels of warmth.
Clothes washing Only a quarter of low income households do machine powered washing. Both middle and high
income areas utilise electric washing machines, and clothes dryers are owned by 67% of high income
households, but not amongst mid-low income bands (just 2% in mid income).
Transportation and mobility Transportation and mobility amongst city households is strongly a factor of income. Private vehicle
transport dominates high income households’ travel both to work (97%) and school (86%). Mid
income travel to work is split fairly equally between private car (39%), taxi (31%) and bus (20%). Low
income travel to work is dominated by taxi (46%), with private car and busses both carrying an equal
19% of the remaining commuters. Train usage is specific to location of households. In this survey
only the low and mid income groups indicated train usage, and this was fairly limited at 10% and 2%
respectively.
Figure 3: Main sources of transportation used to travel to work

Household Energy Use in Selected Areas in and around Cape Town Page 11 of 23
In both mid and low income groups, walking dominates the travel to school (71% and 79%
respectively)8. This important fact needs recognition in urban planning and mobility infrastructure
projects.
Figure 4: Main sources of transportation used to travel to school
Transport expenditure9 Fifty-nine (59) percent of middle income and 78 percent of low income households indicated that
they use between R1 – R50 on a daily basis. Fifty-five (55) percent of high income households
indicated that they use between R300 – R500 a day on transportation, as show in Figure 5.
8 Noting however that the number of responses to this question was low.
9 Of the 180 households in the survey, only 61 (some 30%) reported transport related costs (despite 158
having provided household transport information).
14%
5%
1%
56%
24%
0% 10% 20% 30% 40% 50% 60%
Taxi
Bus
Train
Walk
Own car
Percent of Multiple responses (n=84)
Main sources of transportation used to travel to school

Household Energy Use in Selected Areas in and around Cape Town Page 12 of 23
Figure 5: Cost of transportation by income group
The indications10 are that poor households may be spending anything from R200 - R1 000/month on
transport (in the region of 20% - 50% of household income). For high income households this
averages around R300/day or R6 000/month, thus representing in the region of 10 – 20% (taking
income levels at R30 000 – R60 000 per month). Addressing affordable mobility will be key in
addressing poverty levels and household resilience in the city.
Conclusion ‘Scaling up’ household energy use characteristics must consider both income levels as well as historic
housing types of communities as these are both factors that influence energy consumption patterns
of households.
Grid-supplied electricity must now be considered the most dominant household fuel across the City.
Limited, and usually incidental (e.g. if running out of electricity) instances of paraffin and/or candles
was reported. Access to electricity is good: vendors are close to residences and customers can buy in
small amounts on regular basis without incurring costs or penalties for multiple top ups.
However, to buffer the poor from conditions of energy poverty, the City must address improving the
thermal performance of all households, formalising all connections and associated meters to ensure
that the free basic electricity subsidy reaches the target group, as well as improving connection
levels to mitigate against technical malfunctions. Programmes to improve the efficiency of
appliances (such as solar water heater and efficient light bulb rollout) would also assist. Kettles and,
to a lesser extent use of pots on stoves, to heat water may contribute sizeably to peak demand in
the City and this is worthy of attention.
10
Proportion of income spent on transport can only be considered in very broad ranges (in the absence of specific income and expenditure per household).
46%
55%59%
34%
6%
78%
17%
6%0%
0%
10%
20%
30%
40%
50%
60%
70%
80%
90%
R1-R50 R51-R100 R101-R300 R301-R500
Households' daily transportation expenditure (n=61)
High Income
Middle Income
Low Income

Household Energy Use in Selected Areas in and around Cape Town Page 13 of 23
In addressing high levels of household energy and electricity consumption amongst mid and high
income households, the promotion of solar geyser systems and improved thermal performance of
the housing stock offer important opportunities. Promotion of gas for cooking and space heating
amongst high income households may prove an important strategy, but is dependent on gas prices
relative to electricity.
Mobility is enormously costly for all households, but the poor in particular. The trend is to move
towards private car ownership, once it can be afforded. Improving mobility is key to addressing
poverty. This could include ‘in-fill’ development close to economic opportunity. A sizeable number of
people walk to work and school and this should be factored into urban development.

Household Energy Use in Selected Areas in and around Cape Town Page 14 of 23
Appendix 1: Detailed survey methodology notes Primary research on energy use amongst households in Cape Town was collected through face-to-
face interviews with 180 respondents in the Cape Metro Area using a questionnaire developed by
SEA. The survey was conducted in 7 residential areas with the household sample divided across low,
middle and high-income areas, in order to measure energy sources across respondents with varying
living standards and different dwelling types. Sample communities were also selected across a
reasonable geographic spread in the City. To reflect numerical proportions, a greater number of
interviews took place in the low (90 interviews) and middle (60 interviews) income communities.
The intentions was also to aim for an equal balance among male and female respondents.
High income residential areas Using data from the 2011 Census conducted by Statistics South Africa (StatsSA), two high income
residential suburbs were selected as fieldwork sites: Constantia and Durbanville.
Constantia is located in the Southern Suburbs of the CMA, with an approximate population of 12,454
residing in 4,110 households. According to Census 2011 results, the suburb’s population is
predominantly White (75.3%) and highly educated, with 84% of residents aged 20 and older having
completed Grade 12 or higher. Most residents (99%) live in formal dwellings, and 96% of those of
working age (ages 15 to 64) are employed. Fewer than one in five households (17%) subsist on a
monthly income of lower than R3, 200, and 99.6 % of households use electricity for lighting. (See
Figure 1)
Comparably, Durbanville is more populous, and is located in the Northern Suburbs of the CMA. Its
population numbers approximately 40,944 persons across 15,258 households, with an average of
only 2.68 residents per household. Durbanville residents are also predominantly White (81%) and
highly educated (84% of those aged 20 years and older have completed Grade 12 or higher). The
recorded employment rate among residents of working age is 96%. Almost all Durbanville residents
(99%) live in formal dwellings, and 99% of households report using electricity as their main source of
energy for lighting. (See Figure 2)
Figure 6: Census 2011 Suburb Map, Constantia

Household Energy Use in Selected Areas in and around Cape Town Page 15 of 23
Figure 7: Census 2011 Suburb Map, Durbanville
Middle Income Residential Areas Two middle income residential areas were also selected as fieldwork sites: Woodstock and Mitchell’s
Plain.
Woodstock is located in the central CMA. With a population of approximately 12,656 residents
across 4,110 households, there is a moderate population density of 3.46 persons per household. In
terms of historical racial categories, the majority of residents are Coloured (50%), Black (25%) and
White (14%). Educational achievement levels are lower than recorded in upper-income areas, with
just under two-thirds (62%) of residents aged 20 years and older having completed Grade 12 or
higher. Although most residents of working age are employed (86%), 28% report a monthly
household income of R3, 200 or less. Most residents (98%) reside in formal dwellings and 98% use
electricity as their primary energy source for lighting. (See Figure 3)
Mitchell’s Plain is a large, densely populated former Coloured township area with a population of
310,485 residents across 67,995 households (4.57 persons per household). The population of the
suburb remains predominantly Coloured (91%), and only just over a third of residents (35%) have
completed Grade 12 or a higher level of education. The majority of the labour force (76%) is
employed, but 38% of households report a monthly income of R3, 200 or less. Most (95%) live in
formal housing, and 99% use electricity as their main source of energy for lighting. (See Figure 4)

Household Energy Use in Selected Areas in and around Cape Town Page 16 of 23
Figure 8: Census 2011 Suburb Map, Woodstock
Figure 9: Census 2011 Suburb Map, Mitchell’s Plain
Low Income Residential Areas Three low income residential areas were also selected as fieldwork sites: Joe Slovo Park,
Masipumelele and Khayelitsha.
Joe Slovo Park borders on the areas of Milnerton, Marconi Beam and Phoenix. The population of the
suburb is 12,629, with an average of 2.49 persons across 5,073 households. Most residents (95%) are
Black African, and 73% are employed. Educational achievement levels are low, with only a third
(33%) of residents age 20 or older having completed Matric or higher education. About three in
every four households (73%) earn a monthly income of less than R3, 200 and only 36% reside in
formal dwellings. Electricity use for lighting is lower than in other sampled areas, at 90%. (See Figure
5)
Masiphumelele is a predominantly informal settlement, bounded by Kommetjie, Noordhoek, Capri
and Sun Valley. Its population numbers 21,904 persons across approximately 7,413 households with
2.94 persons per household. Most residents are Black African (91%), and although 69% of the labour
force is employed, most households (82%) earn less than R3, 200 per month. Only 27% of residents
live in formal dwellings, but nonetheless 95% of households use electricity as a main energy source
for lighting. (See Figure 6)

Household Energy Use in Selected Areas in and around Cape Town Page 17 of 23
Figure 10: Census 2011 Suburb Map, Joe Slovo Park
Figure 11: Census 2011 Suburb Map, Masiphumelele
Khayelitsha is a large and densely populated suburb: 391,749 residents live in 118,809 households in
the area, with an average of 3.30 persons per household. The population is predominantly Black
African (99%) and only just over a third of area residents (36%) aged 20 years or older have
completed Grade 12 or higher. Census 2011 data shows that 62% of residents of working age are
employed, but 74% of households earn less than R3, 200 per month. Less than half (45%) of all
households reside in formal dwellings, and only 81% use electricity for lighting. (See Figure 7)

Household Energy Use in Selected Areas in and around Cape Town Page 18 of 23
Figure 12: Census 2011 Suburb Map, Khayelitsha

Household Energy Use in Selected Areas in and around Cape Town Page 19 of 23
Appendix 2: Establishing the representivity of the sample An immediate issue to establish is whether the survey findings relating to energy consumption
patterns represent typical patterns for similar areas and the key characterisation of ‘similar’ groups,
notably whether this is applicable on an income, or settlement pattern basis.
Only half of the respondents were happy to divulge their income band, but the synthesis of those
that did indicated that:
“High income” areas: respondents in the “High Income” areas did reflect an income above R12 801
(save for one outlier). Most residents have high education levels and are employed. Residents are
predominantly White. All high income houses were free standing and had ceilings. The implication is
that “high income” areas correlate in terms of income band and housing type (both of which are
drivers of energy demand).
“Mid income” areas: of those that provided income bands, 14 respondents in Mitchell’s Plain fell
into a ‘low income’ categorisation and 11 fell within the mid or medium income bands, but notably
towards the lower end – below R5 000/month (save for one). In terms of census data, 38% of
residents reported income levels below R3 200 (i.e. ‘low income). In other words, although
considered a “medium income” area, the data indicates that this area, on an income basis, is split
between mid and low income.
No income responses were provided by respondents in Woodstock. In terms of the census, 28%
report income levels below R3 200/month (i.e. ‘low income’). So, again a split between low and mid
income.
Housing types in this “mid income” category (Mitchell’s Plain and Woodstock) included
approximately 40% free standing, 50% semi-detached and 12% backyard shacks. The majority (93%)
of houses have ceilings. Electricity is the primary energy source for lighting (98-99%).
Residents in both areas are predominantly Coloured (90% in Mitchell’s Plain; 50% in Woodstock) and
education levels are lower than the high income areas. The indication is that this these areas
represent both low and mid income households, but that, due to historical housing settlement
patterns (old ‘white’ and ‘coloured areas’) these areas have a particular housing and related energy
characterisation different from ‘black Africa’ settlements.
“Low income” areas: all 27 respondents that provided income bands in Khayelitsha fell into the low
income category (below R3 200/month); in Masiphumelele, 19 respondents fell within the low
income band, and the other 7 that provided income bands, fell into the medium income band
(R3 200 – R12 800), however all of these 7 fell below an income of R5 000/month.
85% of housing types here were informal or backyard shack (in terms of census data, noted above,
this figure is more like 70%); less than 30% of these houses have ceilings. The majority of residents in
these areas are Black. Education levels are similar to Mitchell’s Plain. Electricity still predominates as
the major household energy source for lighting, but there is a marked difference here with only 90%
in Joe Slovo Park; 95% in Masiphumelele and 85% in Khayelitsha using electricity as the major source
of energy for lighting.
Household Energy Use in Selected Areas in and around Cape Town Page 20 of 23
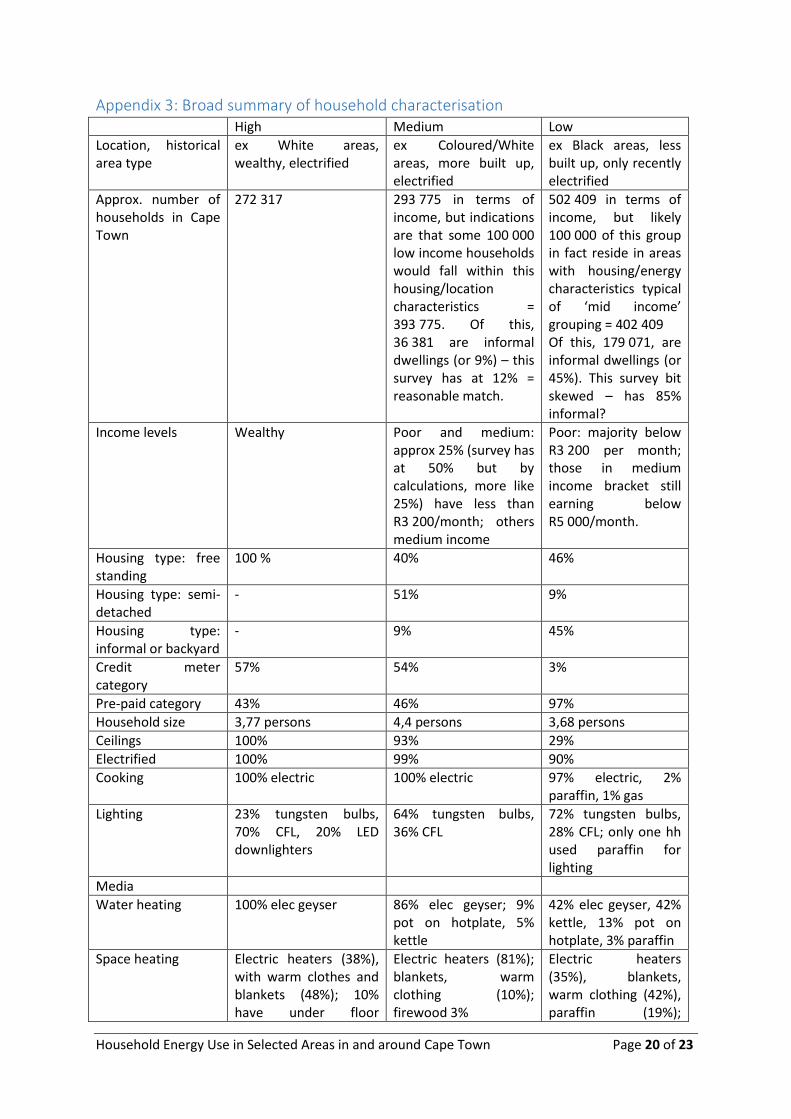
Appendix 3: Broad summary of household characterisation High Medium Low
Location, historical area type
ex White areas, wealthy, electrified
ex Coloured/White areas, more built up, electrified
ex Black areas, less built up, only recently electrified
Approx. number of households in Cape Town
272 317 293 775 in terms of income, but indications are that some 100 000 low income households would fall within this housing/location characteristics = 393 775. Of this, 36 381 are informal dwellings (or 9%) – this survey has at 12% = reasonable match.
502 409 in terms of income, but likely 100 000 of this group in fact reside in areas with housing/energy characteristics typical of ‘mid income’ grouping = 402 409 Of this, 179 071, are informal dwellings (or 45%). This survey bit skewed – has 85% informal?
Income levels Wealthy Poor and medium: approx 25% (survey has at 50% but by calculations, more like 25%) have less than R3 200/month; others medium income
Poor: majority below R3 200 per month; those in medium income bracket still earning below R5 000/month.
Housing type: free standing
100 %
40%
46%
Housing type: semi-detached
- 51% 9%
Housing type: informal or backyard
- 9% 45%
Credit meter category
57% 54% 3%
Pre-paid category 43% 46% 97%
Household size 3,77 persons 4,4 persons 3,68 persons
Ceilings 100% 93% 29%
Electrified 100% 99% 90%
Cooking 100% electric 100% electric 97% electric, 2% paraffin, 1% gas
Lighting 23% tungsten bulbs, 70% CFL, 20% LED downlighters
64% tungsten bulbs, 36% CFL
72% tungsten bulbs, 28% CFL; only one hh used paraffin for lighting
Media
Water heating 100% elec geyser 86% elec geyser; 9% pot on hotplate, 5% kettle
42% elec geyser, 42% kettle, 13% pot on hotplate, 3% paraffin
Space heating Electric heaters (38%), with warm clothes and blankets (48%); 10% have under floor
Electric heaters (81%); blankets, warm clothing (10%); firewood 3%
Electric heaters (35%), blankets, warm clothing (42%), paraffin (19%);

Household Energy Use in Selected Areas in and around Cape Town Page 21 of 23
heating; firewood only 1%
firewood 2%, gas (1%)
Clothes washing
Appliance ownership
Television 100% 100% 96%
Cell-phone 100% 100% 99%
Microwave 100% 97% 58%
Electric hob/stove 83% 61% 46%
Washing machine 97% 85% 26%
Radio 77% 70% 65%
Fan 7% 56% 32%
Swimming pool pump
40% 15% -
Electric oven 30% 25% 1%
Air conditioner 3% - -
Under floor heating 23% - -
Clothes dryer 67% 2% -
Dishwasher 100% 97% 58%
Household statistics at a glance
Table 8: Households by income band and housing type, for Cape Town, census 2011
Monthly household income
2011 Percentage
Total Formal Informal Formal Informal
Low: R0 – R3 200 502 409 316 117 179 071 63% 36%
Medium: R3 201 – R12 800 293 775 253 855 36 381 86% 12%
High: R12 801 - 272 317 267 490 3 327 98% 1%
Total 1 068 574 837 533 218 780
Source: StatsSA 2011
Appendix 4: Electricity metering and disaggregation of consumers in terms of meter
type and income/residential area band
Table 9: Residential meters and households, City of Cape Town, 2012-13
Meter type number
credit 118 958
prepaid 452 556
Total meters 571 514
Total households 1 068 574
City electricity data is recorded by meter type – credit or pre-paid - within the domestic tariff
category. The indications from the survey were that 57% high and 54% mid and only 3% low income
residential areas comprise the credit meter customers; and 43% of high, 46% of mid and 97% of low
income bands/areas comprise the pre-paid customers. The broad proportional indications are that

Household Energy Use in Selected Areas in and around Cape Town Page 22 of 23
credit meter data would represent high and mid income households only; and prepaid meter data
would represent ALL low income households (bar 3%), and a lesser proportion of mid and high
income households. However, the specific figures don’t line up well with the number of connections,
so would need further work. The table below shows the kinds of adjustments that need to be made
in order to establish a proportion of connections per group type that will match figures with actual
connections.
Table 10: Workings to explore possible proportions of household type to meter type, Cape Town
Appendix 5: Appliance composition and the main uses for energy in households
Figure 13: Respondent’s indication of the main uses for energy in their homes
Based on the survey, a typical set of appliances per residential grouping is provided in Table xx
below
Table 11: Ownership of electric appliances by residential income group
High Income Middle Income Low Income
Television 100% 100% 96%
Cell-phone 100% 100% 99%
Microwave 100% 97% 58%
Electric hob/stove 83% 61% 46%
Washing machine 97% 85% 26%
Income/house
type
Households by
income (n.)
Households by
survey
characterisation
(n.)
% Credit
meters ito
survey
Credit meters
ito survey (n.)
% Prepaid
ito survey
Pre paid ito
survey (n.)
Adjusted
credit to
match
connections
Adjusted
credit (n.)
Adjusted
pre paid to
match
connections
Adjusted pre
paid (n.)
Low 502 409 402 409 3 12072 97 390337 0 0 40 160964
Mid 293 775 393 775 54 212639 46 181137 8 31502 55 216576
High 272 317 272 317 57 155221 43 117096 35 95311 30 81695
Total 1 068 574 379931 688570 126813 459235
Actual
connections
(n.) 118958 452556 118958 452556

Household Energy Use in Selected Areas in and around Cape Town Page 23 of 23
Radio 77% 70% 65%
Fan 7% 56% 32%
Swimming pool pump 40% 15% -
Electric oven 30% 25% 1%
Air conditioner 3% - -
Under floor heating 23% - -
Clothes dryer 67% 2% -
Dishwasher 17% 2% -