household financial comfort report - me bank
TRANSCRIPT

HOUSEHOLD FINANCIAL COMFORT REPORT. THIRD SURVEY - DECEMBER 2012.
THE CHANGING FINANCIAL PSYCHOLOGY OF AUSTRALIAN HOUSEHOLDS. INSIGHTS FROM NATIONAL RESEARCH.

3 Household Financial Comfort Report January 2013
ABOUT ME BANK: ME Bank is 100 percent owned by Australia’s leading industry super funds. It provides members of eligible super funds, unions and employer associations with a genuinely fairer banking alternative.
SPECIAL THANKS: ME Bank would like to thank three organisations involved in the design and development of the ME Bank Household Financial Comfort Report – Baker Group, DBM Consultants and Economics & Beyond.
CONTACT US: Matthew Read, Media and Communication Manager ME Bank
P (03) 9708 3334 E [email protected] Level 28, 360 Elizabeth Street Melbourne VIC 3000 Australia, mebank.com.au

CONTENTS.1. FOREWORD 1
2. KEY FINDINGS 2
3. ECONOMIC CONTEXT 3
4. HOUSEHOLD FINANCIAL COMFORT INDEX 5
5. HOUSEHOLD COMFORT REMAINS LOWEST WITH SAVINGS AND INVESTMENTS 11
6. A MAJORITY OF AUSTRALIANS ARE STILL STRUGGLING TO SAVE 16
7. BEHAVIOURS UNDERTAKEN TO INFLUENCE COMFORT WITH FINANCIAL SITUATION 21
8. APPENDIX A: HOUSEHOLD STATISTICS 24
9. APPENDIX B: METHODOLOGY 25

1 Household Financial Comfort Report January 2013
ONE: FOREWORD.
The ME Bank Household Financial Comfort Report provides in-depth and critical insights into the financial situation of Australians based on a survey of about 1,500 households.
This Report presents the key findings from the third survey conducted in December 2012, following previous surveys in October 2011 and June 2012.
The Report includes but is not limited to, the Household Financial Comfort Index, which measures ongoing changes to households’ perceptions of their own financial comfort, providing important insights into the changing financial and economic psychology of Australian households.
The Household Financial Comfort Index specifically measures: overall household financial comfort by asking respondents to estimate their financial comfort as well as their expectations and confidence across 11 measures.
THE ROAD FROM HERE.The Household Financial Comfort Report reflects ME Bank’s mission to understand the financial mindset of Australian households in order to deliver a fairer banking alternative. Over time, the Report will track changes in comfort and in doing so, highlight the ongoing – and potentially shifting – differences between household types, in terms of financial comfort and behaviours in managing finances.
The Household Financial Comfort Report will be a source of ongoing information to public policy makers, financial institutions and social welfare organisations and will hopefully assist in decisions regarding taxation, superannuation, banking, financial regulation, welfare reform, financial education and other related matters.
THE ME BANK HOUSEHOLD FINANCIAL COMFORT REPORT.
This Household Financial Comfort Report is the third in a series to be released using data from an ongoing survey of approximately 1,500 Australian households. Our goal is that over time the research will prove useful for policy makers, governments and civil society as a tool to inform decisions regarding taxation, superannuation, banking, financial regulation, welfare reform, financial education and other related matters.

Household Financial Comfort Report January 2013 2
TWO: KEY FINDINGS.
• Australian households report they are experiencing medium comfort with their overall financial situation (5.29 out of 10). Current comfort levels are similar to those reported when they feel ‘occasional stress or worry’.
• Australians overall were feeling slightly less comfortable in December 2012 than in June 2012 when the last survey was conducted.
• Variation exists across household segments with ‘Retirees’ showing the highest level of household financial comfort and ‘Single Parents’ having the lowest household financial comfort.
• The slight decrease in financial comfort from June 2012 was driven by decreases in how comfortable households with children (‘Couples with young children’, ‘Couples with older children’ and ‘Single parents’) were feeling about their financial situation. This downshift in comfort for households with children may reflect a return to ‘normal levels’ after a temporary positive effect of increased government payments that came through in the June quarter 2012.
• In terms of state variation, household financial comfort deteriorated in most regions, partly offset by some recovery in South Australia and to a lesser extent continued modest gains in New South Wales. Western Australia and the Australian Capital Territory have recorded the highest levels of comfort in December 2012, while Tasmania recorded the lowest level of comfort.
• There was significant variation in financial comfort based on workforce status, with relatively high comfort levels for households with people in ‘Full-time paid employment’, but significantly lower comfort levels in all other parts of the labour force. ‘Casuals’ and ‘Part-time self-employed’ had the lowest levels of comfort for people with jobs, while ‘Unemployed’ had the lowest levels of comfort overall.
• Comfort levels with savings and investments decreased slightly since June 2012 and remained the areas about which households felt least comfortable. In particular, comfort with savings and investments had decreased most dramatically for ‘Single parents’, while comfort levels with investments increased for ‘Empty Nesters’ and ‘Retirees’, with the latter largely benefitting from the recent rebound in global and local share markets.
• The greatest financial worries of households with low comfort levels relate to their lack of a savings buffer and living costs. Despite concern with living costs however, Australians are coping with 63% somewhat or very comfortable with ‘monthly expenses’. Comments from respondents suggested that there was greater concern about how rising prices would influence their ability to save or have money left over for discretionary spending, rather than their ability to manage their expenses per se. Households with high comfort are much more likely to be worried about the global economy.
• A majority of Australian households are still struggling to save, with an unchanged 52% of households not having any cash left over at the end of a typical month. Moreover, about a quarter of households could not maintain their lifestyle for a month if they lost their job or could not raise $3000 in the case of an unexpected emergency.
• In terms of household debt stress, the gap appears to be widening between households with higher and lower comfort. Of Households that have accumulated debt, 6% aren’t meeting the minimum payment requirements (up 1% in the past six months) and a further 30% were just managing to pay the minimum payments in December (down from 35% in June). In contrast there has been a significant increase (by 4% to 64%) in the proportion of indebted households that can pay a ‘little and/or a lot more’ than the minimum payments reflecting the sizeable falls in borrowing rates over the past year or so.
• Compared to the first survey in October 2011, there have been subtle overall increases in the proportion of Australian households setting a budget, making larger than minimum loan repayments and contributing additional payments to super.

3 Household Financial Comfort Report January 2013
• Households continued to deleverage. Growth in household debt has remained subdued. Both housing loans for owner-occupied and investment purposes have increased slowly, while both credit card and other personal loans have declined – especially to fund investments in listed equities and managed funds.
• Household assets, on average, have increased significantly recently. This mainly reflects a rebound in local and global share prices, and to a much lesser extent, a small rise in residential property prices in most capital cities. Long-term retirement savings in superannuation have also recorded a significant rise largely due a pickup in asset returns and continued contributions.
• Households have remained conservative in their investment preferences directing a larger share of their discretionary savings to deposits, while reducing direct equity and other managed fund investments. New housing investment has also remained subdued.
• As a result, overall household net wealth (assets less debt) increased strongly in the second half of 2012, following a significant fall during 2011/12.
THREE: ECONOMIC CONTEXT.
• Softening labour market conditions in the second half of 2012 with subdued forward indicators. Household labour income has slowed – reflecting slower growth in full-time and part-time job gains as well as average wages. Hours worked has also declined across Australia and there has been a significant fall in employment relative to both the workforce and the population, partly due to discouraged workers. The national unemployment rate has risen to 5.4% in December 2012, albeit labour market conditions continue to vary significantly across Australia.
• Household consumption spending has kept broadly in line with slower income growth and there has been a continued shift from spending on discretionary to essential items. As result, household savings have remained relatively high – as measured by official data, the household saving rate from current household disposable income was estimated at about 10.5% in the second half of 2012, largely unchanged over the past couple of years and well above the average of the past two decades.
Overall Australian households have continued a more prudent approach to finances during the second half of 2012. Recent trends in the latest official estimates and other private sector reports have shown:
WHEN ASKED ABOUT THEIR HOUSEHOLD FINANCIAL SITUATION OVER THE LAST YEAR, AUSTRALIANS SAID:
...has gotten better
...is about the same
...has worsened
37%
29%
33% The proportion of Australians saying their household financial situation has improved in the last year, increased 7% to 37% since October 2011 when the inaugural ME Bank Household Financial Comfort Report was conducted.

Household Financial Comfort Report January 2013 4
• Financial stress indicators continue to show that households as a whole are coping reasonably well with debt servicing burdens due to continued employment, disposable income gains and relatively low interest rates, despite cost of living pressures. A small majority of Australians (older and higher incomes in owner-occupied housing) are well ahead of scheduled mortgage repayments since borrowers have not lowered payment amounts as interest rates have fallen. This of course masks a great deal of variation amongst Australians.
“ I LOST MY JOB IN JULY AND HAVE NOW RUN OUT OF SAVINGS.” SHARON – MARRIED WITH NO CHILDREN, NEW SOUTH WALES
“ I’M SPENDING LESS MONEY AND SAVING MORE…” YOUNG COUPLE WITH NO CHILDREN, QUEENSLAND.

5 Household Financial Comfort Report January 2013
FOUR: HOUSEHOLD FINANCIAL COMFORT INDEX.
Australian households have a medium level of comfort with their overall financial situation. Current financial comfort levels are similar to those reported when they feel occasional stress or worry. Australians overall were feeling slightly less comfortable in December 2012 (when this survey was conducted), than when the previous survey was conducted in June 2012.
As measured by the Household Financial Comfort Index, household financial comfort was 5.29 (out of 10) in December 2012 - a slight decline on the corresponding figure of 5.39 in June 2012 and dropping about halfway towards the level observed during the first survey in October 2011 (Fig 1). Australians continued to report current financial comfort scores consistent with those reported when they felt ‘occasional stress or worry’, rather than when ‘financial problems require significant lifestyle change’.
Jun-12 Dec-12Oct-11
5.205.295.39
0
2
4
6
8
10
High comfort
Medium comfort
Low comfort
Figure 1: Financial comfort levels of Australian households.
HOUSEHOLD FINANCIAL COMFORT INDEX.
Looking forward, the findings also indicated that only 11% of Australian households overall anticipate a significant improvement in their financial situation during the next year while 33% expect things to stay the same.

Household Financial Comfort Report January 2013 6
HOW IS THE INDEX CALCULATED?
The Household Financial Comfort Index quantifies how comfortable Australians feel about their household financial situation as well as their expectations and confidence with respect to their finances. Respondents rate their household financial comfort, expectations, and confidence on a scale from 0 to 10 for eleven measures and the Index is derived from their responses. The eleven measures are:
• Comfort level with the overall financial situation of the household (1); • Changes in household financial situation over the past year (2) and anticipated in the next year (3); • Confidence in the household’s ability to handle a financial emergency (4); and • Comfort levels with (5) household income, (6) living expenses, (7) short-term ‘cash’ savings and
(8) long-term investments (including superannuation), (9) debt, (10) overall net wealth, and (11) the household’s anticipated standard of living in retirement.
VARIATION ACROSS HOUSEHOLD SEGMENTS.Variation in financial comfort exists across household segments with ‘Retirees’ showing the highest level of household financial comfort (mean score of 6.08) and ‘Single Parents’ (mean score of 4.52) having the lowest household financial comfort (Fig 2).
HOUSEHOLD FINANCIAL COMFORT INDEX BY HOUSEHOLD TYPE.
Figure 2: Household Financial Comfort Index by Household Type, showing variation in comfort across different household types compared to the overall comfort score of 5.29 in December 2012. The percentage change is relative to June 2012 results.
HOUSEHOLD TYPE
Single parents
Couples with young children
Couples with older children
Young singles /couples (<35yo) no children
Mid-aged singles /couples no children
Empty nesters (50+yo)
Retirees All households
COMFORT SCORE AS AT DEC 2012 (OUT OF 10)
4.52 5.15 5.50 5.51 5.26 5.31 6.08 5.29
CHANGE SINCE JUNE 2012 -5% -6% -2% +2% +4% +2% +4% -2%

7 Household Financial Comfort Report January 2013
The slight decrease in the Household Financial Comfort Index (Index of 5.39 in June 2012 down to 5.29 in December 2012) was largely due to a decline in how comfortable households with children (in particular with young children or single parents) were feeling about their financial situation only partly offset by comfort gains for households of ’Middle-aged households without children’ and ‘Retirees’.
The result reverses a trend in the June 2012 Household Financial Comfort Index where household financial comfort for these younger groups had significantly increased (e.g. ‘Couples with young children’ had an Index of 5.06 in October 2011, 5.49 in June 2012 and 5.15 in December 2012). Declines were seen in most components of the comfort index for ‘Couples with young children’, particularly their household income (-7%), debts (-7%) and investments (-8%).
Similarly, households comprised of ‘Single Parents’ (Index of 4.45 in October 2011 up to 4.75 in June 2012 and down in December 2012 to 4.52), and to a lesser degree ‘Couples with older children’ (Index of 5.29 in October 2011 up to 5.62 in June 2012 and down to 5.50 in December 2012), showed a significant decline in financial comfort in this survey.
This downshift in comfort for households with children may reflect a return to ‘normal levels’ after a temporary positive effect of increased government payments that came through in the June quarter 2012. These payments were announced in the May 2012 Federal Budget as a part of the Government’s ‘Benefits from the Boom’ package and focused on increases to family payments, a School kids Bonus and additional support through Parenting Payments. There was also some tightening of government unemployment payments associated with Newstart announced and due to take effect from 1 January 2013.
Slight increases were recorded among ‘Middle-aged singles/couples no children’ (Index of 5.07 in June 2012 and 5.26 in December 2012) and ‘Retirees’ (Index of 5.82 in June 2012, increasing to 6.08 in December 2012) with the latter household type continuing to record the highest comfort levels. Gains were reported in most components of the comfort indexes for ‘Middle-aged singles/couples’ (notably their household income [6%] and debt levels [8%]) and for ‘Retirees’ (notably their investments [7%] and net wealth [9%]).
Financial comfort levels as measured by the Index remained similar to the previous survey for ‘Young singles/couples (<35yo) no children’ (from 5.40 in June 2012 to an Index of 5.51 in December 2012) and ‘Empty nesters (50+yo)’ (from an Index of 5.22 in June 2012 to 5.31 in December 2012).
BIGGEST WORRY-“ DECREASE IN PARENTING PAYMENT FROM THE 1 JANUARY 2013 AND NO EXPECTATION OF FINDING A SUITABLE JOB.”
KIM, SINGLE PARENT PRIMARY SCHOOL-AGED CHILDREN, QUEENSLAND.

Household Financial Comfort Report January 2013 8
VARIATION ACROSS THE LABOUR FORCE.
There is also a great deal of variation in financial comfort reported by different parts of the workforce.
According to the Index, ‘Casuals’ (up only 2% to an Index of 5.16 compared with 5.07 in June) had the lowest levels of comfort for people with jobs, while relatively high comfort levels were reported by ‘Full-time paid employment’ (down 3% to an Index of 5.46 in December 2012). Conversely there was a significant increase of 9% in the financial comfort of ‘Self-employed’ (index of 5.63 in December 2012 compared to 5.15 in June 2012). (Fig 3).
After a significant deterioration of 7% in the past six months, ‘Unemployed’ continued to record the lowest levels of comfort with an Index of 4.08 in December 2012, compared with 4.4 in June 2012.
HOUSEHOLD FINANCIAL COMFORT INDEX BY WORKFORCE STATUS.
Figure 3: Household Financial Comfort Index across the workforce, showing variation in comfort across parts of the labour force compared to the overall comfort score of 5.29 in December 2012. The percentage change is noted relative to June 2012 figures.
WORKFORCE STATUS
Full-time paid employment
Part-time paid employment
Self-employed Casual Unemployed Overall
COMFORT SCORE AS AT DEC 2012 (OUT OF 10)
5.46 5.35 5.63 5.16 4.08 5.29
CHANGE SINCE JUNE 2012 -3% THE SAME +9% +2% -7% -2%
“ MY BIGGEST WORRY IS THAT WE WILL KEEP HAVING GOOD JOBS TO FUND OUR NEEDS TODAY …” ANITHA – IN A COUPLE WITH PRESCHOOL CHILDREN, NEW SOUTH WALES

9 Household Financial Comfort Report January 2013
“ BIGGEST FINANCIAL WORRY – “THE COST OF LIVING” PAUL – IN A COUPLE WITH CHILDREN, TASMANIA.
VARIATION ACROSS STATES AND TERRITORIES.
During the six months to December 2012, there was a significant deterioration in the Household Financial Comfort Index in most regions partly offset by some recovery in South Australia and to a lesser extent continued modest gains in New South Wales.
Western Australia and the Australian Capital Territory have recorded the highest levels of comfort in December 2012, while Tasmania recorded the lowest levels of comfort.
Although results for the less populous States and Territories should be treated with caution due to smaller samples, the survey found decreases in the Household Financial Comfort Index for Tasmania (Index down from 5.60 in June 2012 to 4.75 in December 2012) – Tasmania is the least comfortable region across Australia.
Tasmanian households had the lowest comfort levels nationally with respect to ability to pay their regular monthly living expenses, with their cash savings, and in relation to having enough money on hand to last for three months if they lost their job. While Tasmanians reported similar attitudes to job security compared to the national result, they showed greater negativity regarding prospects if they had to find another job (84% said it would be difficult to find a job within two months of becoming unemployed).
Of the mainland states, both Queensland and Victoria reported significant falls of 5% in their comfort indexes to 5.11 and 5.33, respectively. Most key drivers – comfort with incomes, cash savings and investments – fell in both Queensland and Victoria during the six months to December. That said, comfort in Queensland remained significantly higher than after the widespread flooding and cyclones in the previous summer. Over the last half of 2012, the ME Bank Financial Comfort Index for Western Australia eased by 2% to an index of 5.52 largely due to small falls in household comfort with incomes, monthly expenses and investments.
In contrast, there was a significant rebound in the South Australia Index (up 6% to an index of 5.14) since June 2012 when South Australia had recorded the lowest level of comfort across Australia. However, South Australians were most likely to say that it would be difficult to find another job (58% compared to the 52% nationally in June 2012); a turnaround in the past six months has led to current attitudes with respect to difficulty in finding a job being on par with the latest national result.
Finally, the ME Bank Financial Comfort Index for New South Wales continued to steadily improve – up 2% to an Index of 5.35 over the six months to December 2012 (this is the same change experienced between the inaugural survey in October 2011 and June 2012) and slightly higher than across Australia as a whole.

Household Financial Comfort Report January 2013 10
HOUSEHOLD FINANCIAL COMFORT INDEX BY STATE AND TERRITORY.
Figure 4: The Household Financial Comfort Index by State and Territory compared to the overall household comfort score of 5.29 in December 2012. The percentage change is noted relative to June 2012 figures. Asterisks indicate segments with small sample sizes (30 or fewer respondents).
STATE OR TERRITORY COMFORT SCORE AS AT DEC 2012 (OUT OF 10)
CHANGE SINCE JUNE 2012
NEW SOUTH WALES 5.35 +2%
QUEENSLAND 5.11 -5%
VICTORIA 5.33 -5%
SOUTH AUSTRALIA 5.14 +6%
TASMANIA* 4.75 -15%
WESTERN AUSTRALIA 5.52 -2%
NORTHERN TERRITORY* 5.03 -5%
AUSTRALIAN CAPITAL TERRITORY* 5.65 -9%
OVERALL 5.29 -2%
“ AS FARMERS WE CANNOT SEE A CHANGE IN OUR INCOME TO GIVE US ANY POSITIVE OUTCOMES IN THE NEAR FUTURE... AT THE MOMENT THERE IS ABSOLUTE NO POSITIVE PROSPECT IN OUR FINANCIAL SITUATION.”
COUPLE WITH TEENAGE CHILDREN, REGIONAL QUEENSLAND.

11 Household Financial Comfort Report January 2013
Figure 5: Shows seven of the 11 individual measures that make up the index, including how people rated their level of comfort with each measure and the average comfort score of each measure.
Wealth Household Income
Monthly Expenses
Cash Savings Investments Debt from all sources
Anticipated standard of
living in retirement
Very uncomfortable
Somewhat uncomfortable
Neither Somewhat comfortable
Verycomfortable
Averagecomfort(Out of 10)
24%
5.51 5.574.83
4.56
5.93
4.78
26%
19%
18%
13%
21%
33%
18%
19%
10%
30%
15%
15%
7%
17%
26%
15%
20%
22%
14%
23%
21%
18%
24%
34%
21%
16%
17%
13%
16%
27%
17%
17%
23%
33%6.26
Figure 5: Seven of the 11 individual measures that make up the Household Financial Comfort Index, including level of comfort with each measure and the average comfort score for each measure.
COMFORT LEVELS ACROSS-KEY ASPECTS OF HOUSEHOLD FINANCES.
FIVE: HOUSEHOLD COMFORT REMAINS LOWEST WITH SAVINGS AND INVESTMENTS.
Comfort levels with savings and investments decreased slightly since June 2012 and remained the areas that households felt least comfortable with.
If we focus on seven of the 11 measures of the Household Financial Comfort Index most relevant to the household balance sheet (Fig 5), we see that comfort levels remained highest in December 2012 with respect to:
• Managing and paying ‘monthly expenses’ (63% of Australian households were somewhat or very comfortable). Comments from respondents suggested that there was greater concern about how rising prices would influence their ability to save or have money left over for discretionary spending, rather than their ability to manage their expenses per se; and
• Their current level of ‘debt from all sources’ (55% of Australian households were somewhat or very comfortable). As with previous waves of the survey, the findings also showed that debts were thought to be manageable when savings buffers were not eroded.
As in June 2012, comfort levels remained lowest in December 2012 for:
• Current cash savings (overall, 22% of respondents were very uncomfortable with their household’s level of cash savings); and
• Current level of investments (including investment property, superannuation, shares, bonds and managed funds) – 24% of respondents reported being very uncomfortable.

Household Financial Comfort Report January 2013 12
COMFORT LEVELS ACROSS-KEY ASPECTS OF HOUSEHOLD FINANCES.
Comfort with most aspects of household finances mentioned in Figure 5 above had decreased from June 2012 to December 2012, with comfort across households deteriorating by:
• 1% to 2% for comfort with cash savings and anticipated standard of living in retirement; and• 3% or more for comfort with household income, investments and net wealth (Fig.6).
“ BIGGEST WORRY - LOWERING INTEREST RATES ON INVESTMENTS.”
RETIRED COUPLE WITH NO CHILDREN, NEW SOUTH WALES.
Figure 6: Percentage change in household comfort levels for seven of the eleven individual measures that make up the overall comfort index, since June 2012.
MEASURE Wealth (net) Household Income
Monthly expenses
Cash Savings Investments Debt from all sources
Anticipated standard of living in retirement
COMFORT SCORE AS AT DEC 2012 (OUT OF 10)
5.51 5.57 6.26 4.83 4.56 5.93 4.78
CHANGE SINCE JUNE 2012 -4% -3% THE
SAME -1% -4% THE SAME -2%

13 Household Financial Comfort Report January 2013
“ WE HAVE GOOD RESERVES OF CASH, STOCKS, AND INVESTMENTS AND ARE IN A FORTUNATE POSITION OF BEING DEBT FREE ONLY THROUGH PRUDENT SAVING AND INVESTMENT STRATEGIES FROM MANY YEARS AGO …”
COUPLE WITH TEENAGE CHILDREN, VICTORIA
PERCENTAGE CHANGE IN HOUSEHOLD COMFORT WITH CASH SAVINGS AND INVESTMENTS
Along with larger percentage decreases in overall household comfort with cash savings and level of investments, these aspects of the household financial position were also the areas with which Australian households had the lowest levels of comfort.
An examination of these aspects of household comfort indicated that the decreases in comfort with cash savings and investments were mainly driven by ‘Single parent’ and ‘Couples with young children’ households. Conversely, ‘Retiree’ and ‘Empty nester’ households were most likely to report an increase in their comfort level with investments (Fig 7).
Clearly, the rebound in local and global share markets has had a significantly positive impact on the financial comfort of ‘Retirees’ and ‘Empty nesters’ given these households typically have larger holdings of equities directly and indirectly in superannuation. In contrast, younger households have more modest investments as well as less equity in their homes. Younger households are more likely to be in debt for education and home ownership and tend to have modest cash savings/deposits mainly to facilitate transactions and as a buffer for an emergency, and relatively small interest-bearing deposits.
HOUSEHOLD TYPE
Single parents
Couples with young children
Couples with older children
Young singles/couples (<35yo) no children
Mid-aged singles/couples no children
Empty nesters (50+yo)
Retirees
CHANGE IN COMFORT WITH CASH SAVINGS SINCE JUNE 2012
-9% -3% +1% +3% THE SAME -2% +3%
CHANGE IN COMFORT WITH INVESTMENTS SINCE JUNE 2012
-15% -8% -4% +1% -3% +6% +7%
Figure 7: Percentage change between June and December 2012 in household comfort with cash savings and investments by household type.

Household Financial Comfort Report January 2013 14
BIGGEST WORRY – “THAT OUR HOUSE HAS GONE DOWN IN VALUE SINCE RECENTLY PURCHASING IT.”
COURTNEY – MARRIED WITH NO CHILDREN.
From the perspective of workforce status, households with ‘Part-time’, ‘Casual’ workers and ‘Unemployed’ had a lower Household Financial Comfort Index (see Fig 3). Of employees, ‘Casuals’ had the lowest comfort with respect to household income, ability to manage monthly expenses, level of cash savings and ability to fund their own retirement.
Comfort levels with respect to investments were similarly low for both ‘Casual’ and ‘Part-time employed’ workers while comfort levels with respect to debt were lowest for both ‘Casual’ and ‘Self-employed’ workers.

15 Household Financial Comfort Report January 2013
Figure 8: The top three financial worries of all Australian households compared to those with low financial comfort and those with high financial comfort. Shows the percentage of households who rated the items as a ‘worry’.
TOP THREE FINANCIAL WORRIES AMONG AUSTRALIAN HOUSEHOLDS.
HOUSEHOLDS OVERALL
(INDEX =5.29)
52%Cost of necessities (e.g. fuel, utilities, groceries)
36%Level of savings/ cash on hand
34%Being able to make ends meet
LOW FINANCIAL COMFORT HOUSEHOLDS.(INDEX 0-4)
70%Cost of necessities (e.g. fuel, utilities, groceries)
63%Being able to make ends meet
54%Level of savings/ cash on hand
HIGH FINANCIAL COMFORT HOUSEHOLDS(INDEX >8)
41%How the global economy will affect Australia
28%Cost of necessities (e.g. fuel, utilities, groceries)
25%Ability to maintain lifestyle in retirement/ standard of living in retirement
“ …WE ARE NOT MATERIALISTIC, OUR NEEDS ARE SIMPLE AND WE HAVE NEVER BEEN BIG SPENDERS, SO WE WILL BE ABLE TO MANAGE OUR FINANCES QUITE WELL.” LYN – IN A COUPLE WITH NO CHILDREN, VICTORIA.
The greatest financial worries of households with low comfort levels relate to their lack of a savings buffer and living costs, while households with high comfort are more likely to be worried about the global economy.
Low comfort levels with cash savings and investments were likely driven by (Fig 8):
• Concerns with rising costs for necessities especially among households with low levels of financial comfort. Job security was also a worry for 28% of low financial comfort households.
• Uncertainty about how the global economy would affect Australia especially among households with high financial comfort.

Household Financial Comfort Report January 2013 16
“ TRYING TO SAVE MONEY BUT CAN’T BECAUSE OF EVERYTHING GOING UP IN PRICE AND TRYING TO PAY OFF OUR DEBTS.”
ANDREA, IN A COUPLE WITH PRESCHOOL CHILDREN.
SIX: A MAJORITY OF AUSTRALIANS ARE STILL STRUGGLING TO SAVE.
A majority of Australian households are still struggling to save with 53% of households not having any cash left over at the end of a typical month – unchanged over the past six months. Of households that have accumulated debt just over one third are struggling to meet repayments with 6% not meeting their minimum payments (up from 5% in June 2012) and 30% just meeting minimum payments (down from 35%).
Across all Australian households:
• 52% of households are not saving with 41% of survey respondents breaking even each month, spending all of their income and no more, and the remaining 11% spending more than they earned by drawing on savings, loans, credit or equity in their home.
− While the percentage of households spending more than they earned each month remained relatively consistent with previous surveys for the Household Financial Comfort Index, the amount spent each month above income has been increasing from an average of $541 per month in October 2011 (almost $6,500 per annum) to $665 per month (almost $8,000 per annum) in June 2012 and $701 per month in December 2012 (almost $8,500 per annum). − Spending more than they earned in a typical month was most common among ‘Single parents’ (15%) and ‘Couples with young children’ (15%).
• 48% of survey respondents spent less than they earned each month with an average of $847 per month saved (or approximately $10,200 per annum). This was similar to the results noted in the previous surveys for the Household Financial Comfort Index.
− Cash left over at the end of the month was most common among households comprised of ‘Retirees’ (61%), ‘Couples with older children ‘56%) and ‘Middle-aged singles/couples no children’ (51%).
Potential debt stress appears mixed in the latest survey. Of households that have accumulated debt, over one-third are struggling to make their repayments with 6% failing to meet minimum repayments and 30% just managing to pay the minimum payments, compared to 5% and 35% in June 2012. In contrast, currently 64% can pay a little and/or a lot more than the minimum payments compared with 60% in June, reflecting the significant falls in borrowing rates over the past year or so (Fig 9).

17 Household Financial Comfort Report January 2013
The ability of households to save was also affected by employment status of those in the workforce. ‘Casual’ workers (52%) were most likely to spend all their income on essential household expenses with nothing left over and 11% of ‘Casual’ workers overspent above their income in a typical month.
Conversely ‘Full-time’ and ‘Self-employed’ workers were most likely to have money left over in a typical month. With respect to having money left over at the end of a typical month, fewer ‘Casual’ workers (38%) were able to save any money after paying for essentials, compared to 54% of ‘Full-time’ employees.
A savings buffer is critical if households are faced with a financial emergency. It is those households that have low comfort with regards to savings and typically overspend each month that also report they would not be able to raise $3,000 in an emergency and many would not be able to maintain their lifestyle for long if they lost their income.
Figure 9: Management of debt repayments for those households that have accumulated debt.
MEETING MINIMUM DEBT REPAYMENTS.
Can pay a lot more than the minimum repayments
26% Can just manage to make the minimum repayments
30%Can pay a little bit more the minimum repayments
30%
Cannot meet required minimum repayments
6%

Household Financial Comfort Report January 2013 18
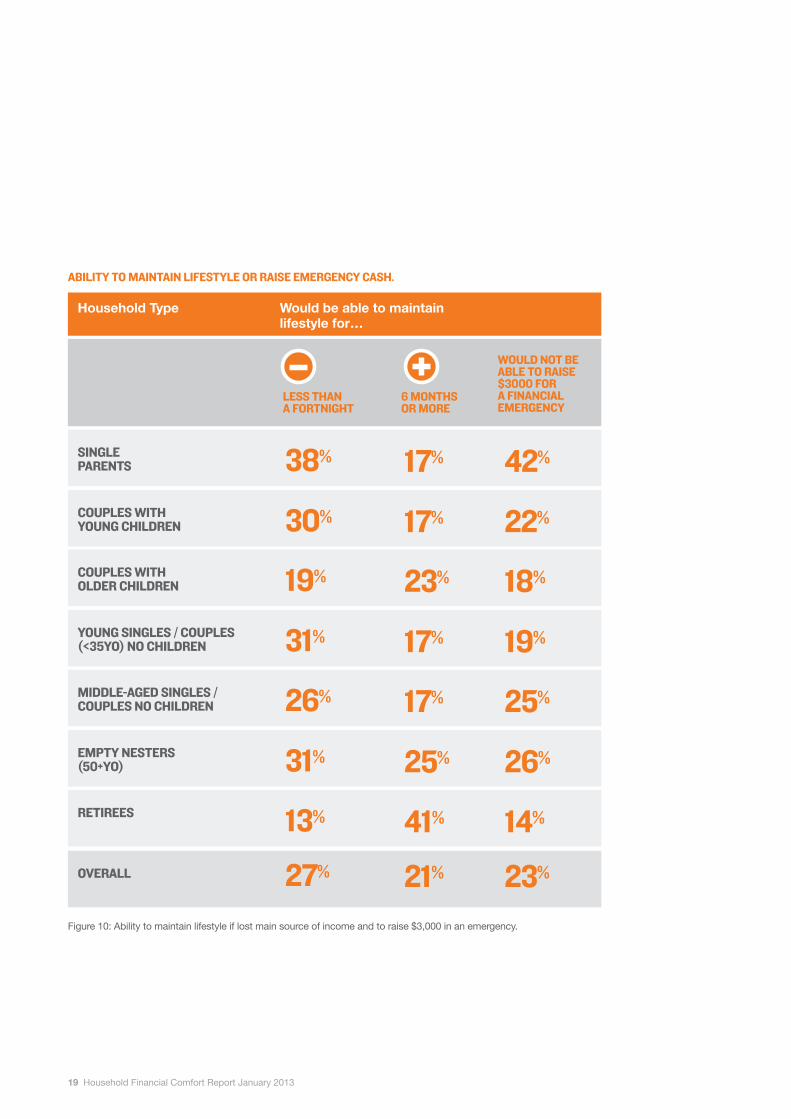
For example:
• 42% of ‘Single parents’ would not be able to raise $3,000 for an emergency and this segment was more likely than other household types to say that they would only be able to maintain their lifestyle for less than a month if they lost their job (38%). ‘Couples with young children’ were in a slightly better situation compared to ‘Single parent’ households, yet 30% reported only being able to maintain their lifestyle for less than a month if they lost their job and 22% could not raise $3,000 emergency cash.
• ‘Empty nesters (50+yo)’ and ‘Retirees’ reported the highest likelihood of being able to maintain their lifestyle for six months or more (25% and 41%, respectively). However ‘Empty nesters’ also reported among the lowest comfort levels with their cash savings and a relatively high percentage (26%) who could not raise $3,000 in an emergency – perhaps reflective of a focus on saving for retirement without easy access to cash.
“ HUGE CREDIT CARD DEBTS THAT I’M TRYING TO PAY DOWN. IT’S MY FAULT OF COURSE, BUT IT’S MOST DISTRESSING.”
FEMALE EMPTY NESTER, VICTORIA.
19 Household Financial Comfort Report January 2013
ABILITY TO MAINTAIN LIFESTYLE OR RAISE EMERGENCY CASH.
Household Type Would be able to maintain lifestyle for…
SINGLE PARENTS
COUPLES WITH OLDER CHILDREN
MIDDLE-AGED SINGLES / COUPLES NO CHILDREN
COUPLES WITH YOUNG CHILDREN
YOUNG SINGLES / COUPLES (<35YO) NO CHILDREN
EMPTY NESTERS (50+YO)
RETIREES
OVERALL
38%
19%
26%
30%
31%
31%
13%
27%
17% 42%
23% 18%
17% 25%
17% 22%
17% 19%
25% 26%
41% 14%
21% 23%
LESS THAN A FORTNIGHT
6 MONTHS OR MORE
Figure 10: Ability to maintain lifestyle if lost main source of income and to raise $3,000 in an emergency.
WOULD NOT BE ABLE TO RAISE $3000 FOR A FINANCIAL EMERGENCY

Household Financial Comfort Report January 2013 20
“ AM ONLY WORKING CASUAL, TOO LITTLE HOURS TO PROPERLY PAY THE BILLS, AM LIVING OFF MY SAVINGS AND WILL BE LOSING JOB SOON AS BOSS IS SELLING THE BUSINESS. NEED A STABLE JOB!”
FEMALE EMPTY NESTER, VICTORIA.
In terms of the workforce status (employed persons):
• More than a quarter of ‘Casual’ workers felt insure in their jobs with 16% feeling very insecure in their jobs and 10% feeling uncertain about the security of their job. This contrasts with only 8% of ‘Full time’ workers feeling very insecure about their job (6%) or uncertain (2%) about their job security.
• However among both segments, a similar percentage reported that they would only last less than a month if they lost their job (25% for both ‘Full time’ and ‘Casual’ workers). ‘Part time’ employees were most likely to report lasting less than a month if they lost their job (29%).
• ‘Casual’ workers were most likely to report that they would be unable to raise $3,000 in an emergency (28% compared to 20% of ‘Full time’ employees).

21 Household Financial Comfort Report January 2013
SEVEN: BEHAVIOURS UNDERTAKEN TO INFLUENCE HOUSEHOLD COMFORT.
Compared to the first Household Financial Health Index survey in October 2011, there have been subtle overall increases in the proportion of Australian households setting a budget and contributing additional payments on bank loans and into super.
Among household types, changes in budgeting behaviour is most evident among ‘Single parents’ with 52% reporting that they always or often set a budget – this is an increase of 19% compared to the inaugural survey in October 2011. Similarly, there has been a significant increase in the proportion of ‘Young singles/couples without children’ who report that they always or often set a budget. Younger householders are most likely to report that they make larger payments on bank loans than the minimum required amount, e.g. 33% and 32%, respectively, of ‘Young singles/couples without children’ and ‘Couples with young children’ report doing this always or often in the six months preceding the December 2012 survey.
Australian households as a whole have chosen to remain conservative with their investment preferences during the past year or so – always or often making larger debt repayments and to a lesser extent additional superannuation payments. Since the first survey in October 2011, there has been a small increase in the propensity to always or often make larger loan payments (up 1% of households to 27% of households) as well as additional superannuation payments (up 2% to 15%). In contrast, only 7% of households have often bought stocks, bonds or managed funds during the six months to December 2012
About 30% or a bit more of ‘Couples with children’ and young singles as well as ‘Young singles/couples without children’ tend to always or often make larger than minimum payments on loans – significantly more than other types of households – and a slightly higher proportion than in the six months to October 2011,
Amongst all households, ‘Couples with older children/younger children as well as ‘Mid-aged singles/couples without children have increased their propensity to often or always make additional super payments to be amongst the relatively highest of households at 16%, 20% and 18%, respectively, during the six months to December 2012. In contrast, ‘Young singles/couples without children’ and ‘Single Parents’ have tended to have a lower propensity to always or often make additional super payments. Finally, the propensity of both ‘Empty nesters’ and ‘Retirees’ has fallen slightly since October 2011 and these older aged households have recorded propensities of 16% and 10%, respectively, during the past six months.

Household Financial Comfort Report January 2013 22
SELECTED HOUSEHOLD FINANCIAL BEHAVIOUR IN DECEMBER 2012.
Household Type In the last six months, has your household often or always…
SINGLE PARENTS
COUPLES WITH OLDER CHILDREN
MIDDLE-AGED SINGLES / COUPLES NO CHILDREN
COUPLES WITH YOUNG CHILDREN
YOUNG SINGLES / COUPLES (<35YO) NO CHILDREN
EMPTY NESTERS (50+YO)
RETIREES
OVERALL
52% (+19%)
38% (-5%)
39% (+1%)
43% (+9%)
37% (-2%)
42% (+2%)
49% (same)
42% (+2%)
15% (+4%)
32% (+2%)
30% (+4%)
33% (+2%)
26% (-12%)
25% (-1%)
19% (+1%)
27% (+1%)
14% (+3%)
16% (+6%)
20% (+4%)
12% (+1%)
18% (+6%)
16% (-4%)
10% (-2%)
15% (+2%)
Figure 11: Proportion of households that have made a budget, a larger bank loan or additional superannuation contribution in the six months to December 2012. Result in brackets is the change between the latest survey and the inaugural survey in October 2011.
MADE ADDITONAL PAYMENTS INTO SUPER
MADE LARGER PAYMENTS ON A BANK LOAN THAN THE MINIMUM REQUIRED
SET A WEEKLY OR MONTHLY BUDGET

23 Household Financial Comfort Report January 2013
“ OUR SITUATION IS HIGHLY LIKELY TO IMPROVE IN THE NEXT TWELVE MONTHS. WORRY IS THAT I’LL HAVE TO WORK FOR A NUMBER OF YEARS PAYING MOST OF MY WAGE INTO SUPER.”
DUNCAN, MIDDLE AGED AND IN A COUPLE. WITH NO CHILDREN .
“ DECREASING INCOME FROM CASH INVESTMENTS CAUSED BY LOWER INTEREST RATES THIS IS FORCING ME TO INVEST IN SHARES TO MAINTAIN A SUITABLE INCOME.”
RETIRED COUPLE WITH NO CHILDREN .

Household Financial Comfort Report January 2013 24
EIGHT: APPENDIX A: HOUSEHOLD STATISTICS.
HOUSEHOLD TYPE STATISTICS.
HOUSEHOLD FINANCIAL COMFORT INDEX
AVERAGE NET WEALTH
AVERAGE HOUSEHOLD YEARLY INCOME
Young singles/couples (<35yo) no children 5.51 $184,122 $75,506
Single parents 4.52 $229,436 $53,336
Couples with young children 5.15 $323,140 $83,778
Couples with older children 5.50 $674,370 $86,883
Middle-aged singles/couples no children 5.26 $325,450 $83,060
Empty nesters (50+yo) 5.31 $537,272 $61,740
Retirees 6.08 $601,115 $42,972

25 Household Financial Comfort Report January 2013
NINE: APPENDIX B: METHODOLOGY.
ME Bank commissioned DBM Consultants to develop the Household Financial Comfort Index with Economics & Beyond and Baker Group. The research includes an online survey of approximately 1,500 Australians aged 18 years and older who do not work in the market research or public relations industries. Waves of research have been conducted in October 2011, June 2012 and this third wave of research was conducted in mid-December 2012 with 1,534 respondent). For analysis, the population sample was weighted according to ABS statistics on household composition, age, state and employment status to ensure that the results reflected Australian households.
An extensive review of other financial health /comfort indices and the academic literature suggested that a number of factors contribute to self assessment of financial wellbeing and comfort. As such the ME Bank Household Financial Comfort Index incorporates eleven measures of how households feel about their financial situation – these include:
• Comfort level with (1) the overall financial situation of the household;
• Changes in household financial situation (2) over the past year and (3) anticipated in the next year;
• (4) Confidence in the household’s ability to handle a financial emergency; and
• Comfort levels with (5) household income, (6) living expenses, (7) short-term ‘cash’ savings and (8) long-term investments, (9) debt, (10) overall net wealth, and (11) the household’s anticipated standard of living in retirement.
To provide contextual insight for the Comfort Index, respondents were asked to rate how comfortable they would be with their current overall household situation if they were feeling ‘occasional stress or worry’, and also if they were experiencing ‘financial problems which require significant lifestyle change’.
To collect data on how households felt about their financial situation via household financial comfort, confidence with finances and anticipated change in finances, we used 0-10 scales anchored by descriptive terms ‘not at all comfortable’ to ‘extremely comfortable’ (comfort), ‘not at all confident’ to ‘extremely confident’ (confidence) and ‘worsen a lot to improve a lot, with a mid-point of ‘stayed the same’ (anticipated change). Questions to collect household actual financial data included those that asked for dollar amounts or dollar range as well as actual behaviour (e.g., whether or not their household was able to save money during a typical month).

Household Financial Comfort Report January 2013 26
FURTHER INFORMATION.The ME Bank Household Financial Comfort Report also examined:• Financial management behaviours;• Home ownership and the use of home equity;• Household ability to manage debt over the next 12 months; and• Risk vs. financial comfort profiling; and• The ‘gap’ between the expected financial comfort of individual
households based on their financial situation to the actual financial comfort scores that they report.
For additional information, contact Matthew Read ([email protected]) at ME Bank.
DISCLAIMER.Members Equity Bank Pty Ltd ABN 56 070 887 679 (‘ME Bank’ has prepared the attached ME Bank Household Financial Comfort Report. Information in the report is current as at September 2012 and is subject to change. The Report has been prepared in good faith however we make no representation and give no warranty as to the accuracy, reliability, or completeness of the information contained in the Report. ME Bank does not accept any responsibility in any way for the report or for your use of the Report for any purpose.
