household income activity
DESCRIPTION
Household Income Activity. 1. Rank the household incomes from the lowest to the highest. 2. Determine the aggregate (total) income for the country. 3. Determine the median and the mean income for the country. 4. Divide the households into five equal groups. - PowerPoint PPT PresentationTRANSCRIPT
LESSON 14 INCOME DISTRIBUTION
14-1
HIGH SCHOOL ECONOMICS 3RD EDITION © COUNCIL FOR ECONOMIC EDUCATION, NEW YORK, NY
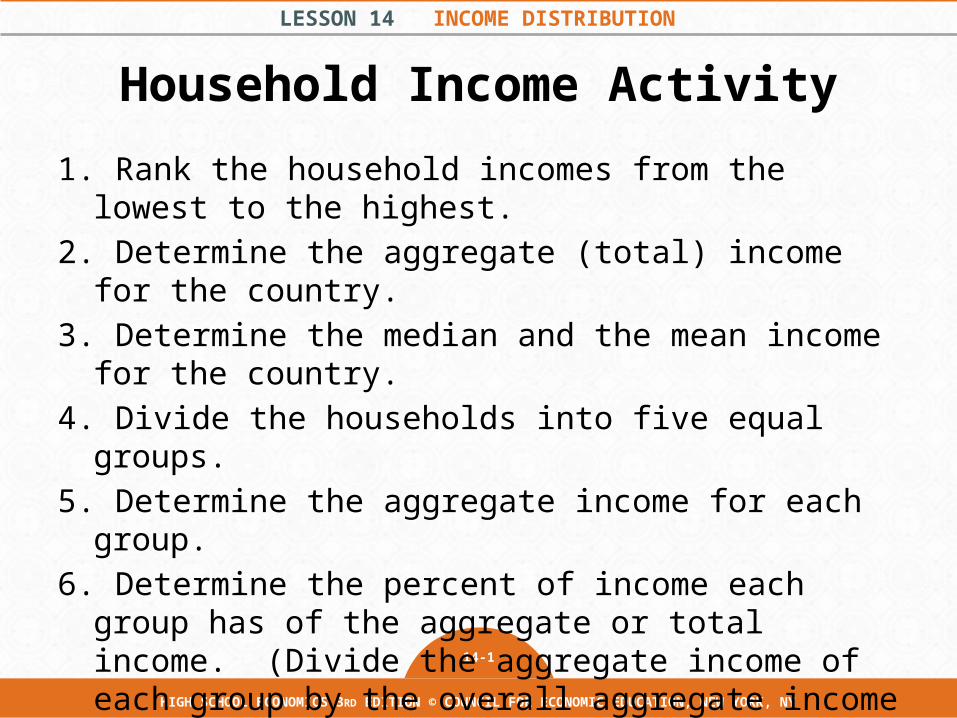
Household Income Activity1. Rank the household incomes from the lowest to
the highest. 2. Determine the aggregate (total) income for the
country.3. Determine the median and the mean income for
the country.4. Divide the households into five equal groups.5. Determine the aggregate income for each group.6. Determine the percent of income each group has
of the aggregate or total income. (Divide the aggregate income of each group by the overall aggregate income of all households.)
LESSON 14 INCOME DISTRIBUTION
14-2
HIGH SCHOOL ECONOMICS 3RD EDITION © COUNCIL FOR ECONOMIC EDUCATION, NEW YORK, NY
Household Distribution of Income
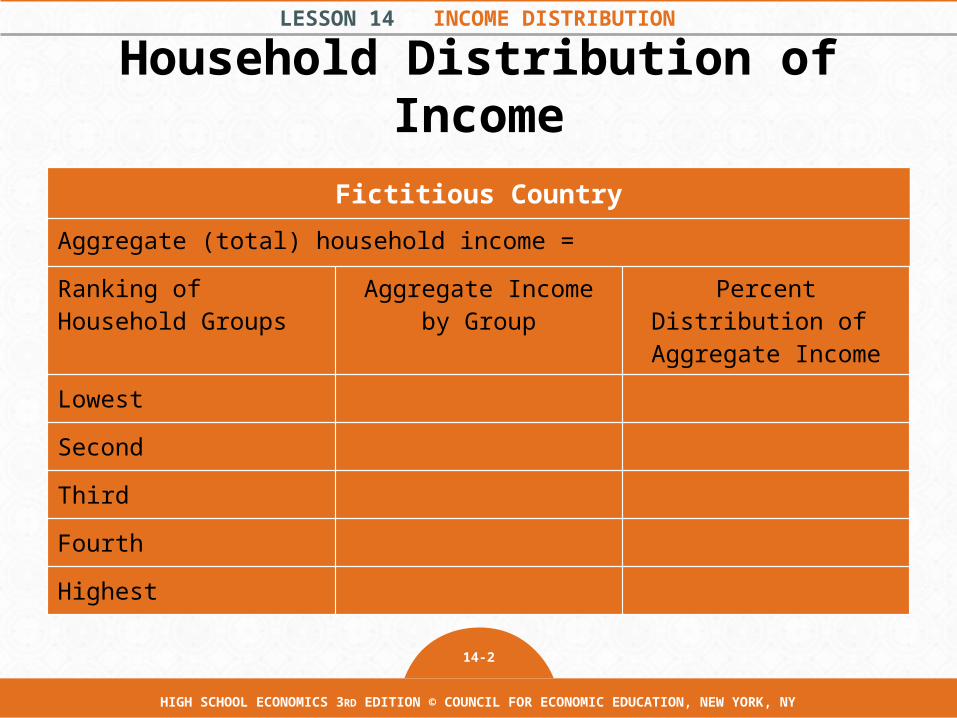
Fictitious CountryAggregate (total) household income =Ranking of Household Groups
Aggregate Income by Group
Percent Distribution of
Aggregate IncomeLowestSecondThirdFourthHighest
LESSON 14 INCOME DISTRIBUTION
14-3
HIGH SCHOOL ECONOMICS 3RD EDITION © COUNCIL FOR ECONOMIC EDUCATION, NEW YORK, NY
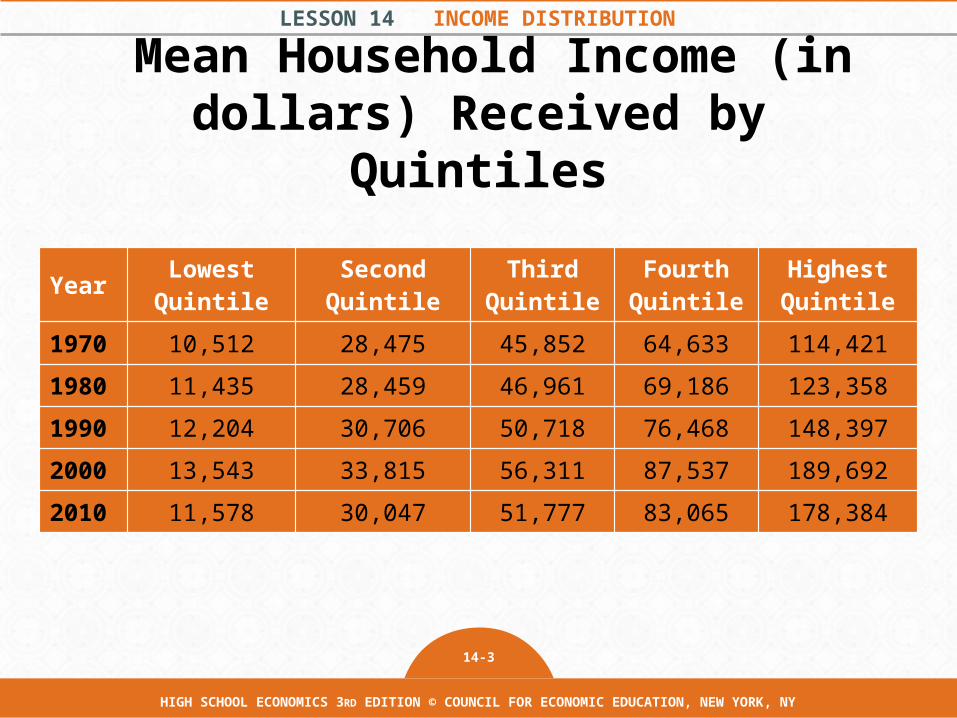
Mean Household Income (in dollars) Received by Quintiles
Year Lowest Quintile
Second Quintile
Third Quintile
Fourth Quintile
Highest Quintile
1970 10,512 28,475 45,852 64,633 114,4211980 11,435 28,459 46,961 69,186 123,3581990 12,204 30,706 50,718 76,468 148,3972000 13,543 33,815 56,311 87,537 189,6922010 11,578 30,047 51,777 83,065 178,384
LESSON 14 INCOME DISTRIBUTION
14-4
HIGH SCHOOL ECONOMICS 3RD EDITION © COUNCIL FOR ECONOMIC EDUCATION, NEW YORK, NY
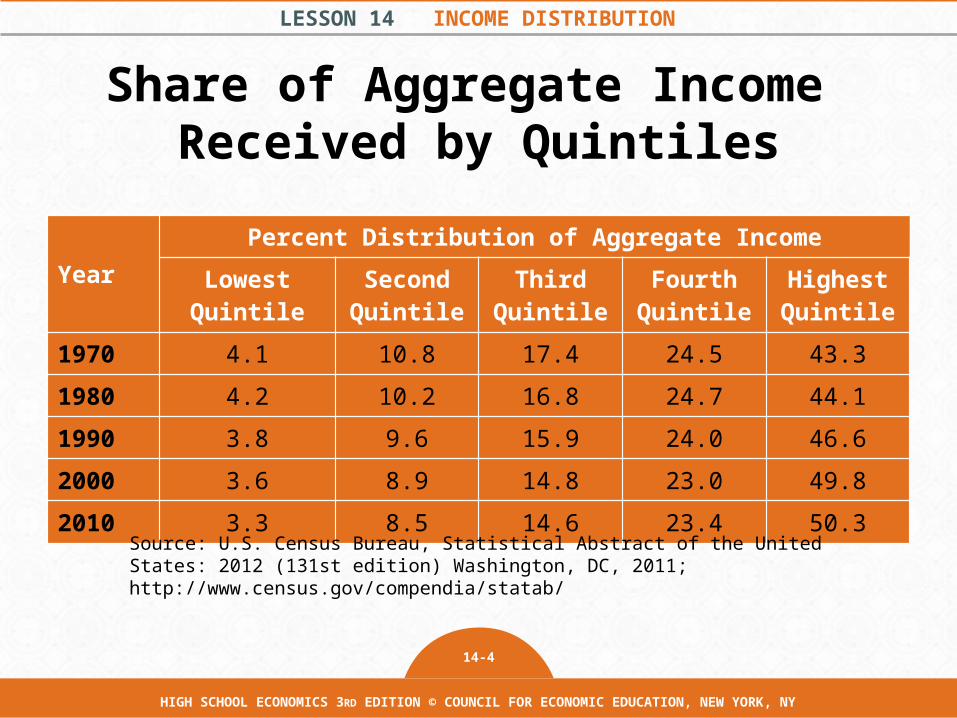
Share of Aggregate Income Received by Quintiles
YearPercent Distribution of Aggregate Income
Lowest Quintile
Second Quintile
Third Quintile
Fourth Quintile
Highest Quintile
1970 4.1 10.8 17.4 24.5 43.31980 4.2 10.2 16.8 24.7 44.11990 3.8 9.6 15.9 24.0 46.62000 3.6 8.9 14.8 23.0 49.82010 3.3 8.5 14.6 23.4 50.3
Source: U.S. Census Bureau, Statistical Abstract of the United States: 2012 (131st edition) Washington, DC, 2011; http://www.census.gov/compendia/statab/
LESSON 14 INCOME DISTRIBUTION
14-5
HIGH SCHOOL ECONOMICS 3RD EDITION © COUNCIL FOR ECONOMIC EDUCATION, NEW YORK, NY
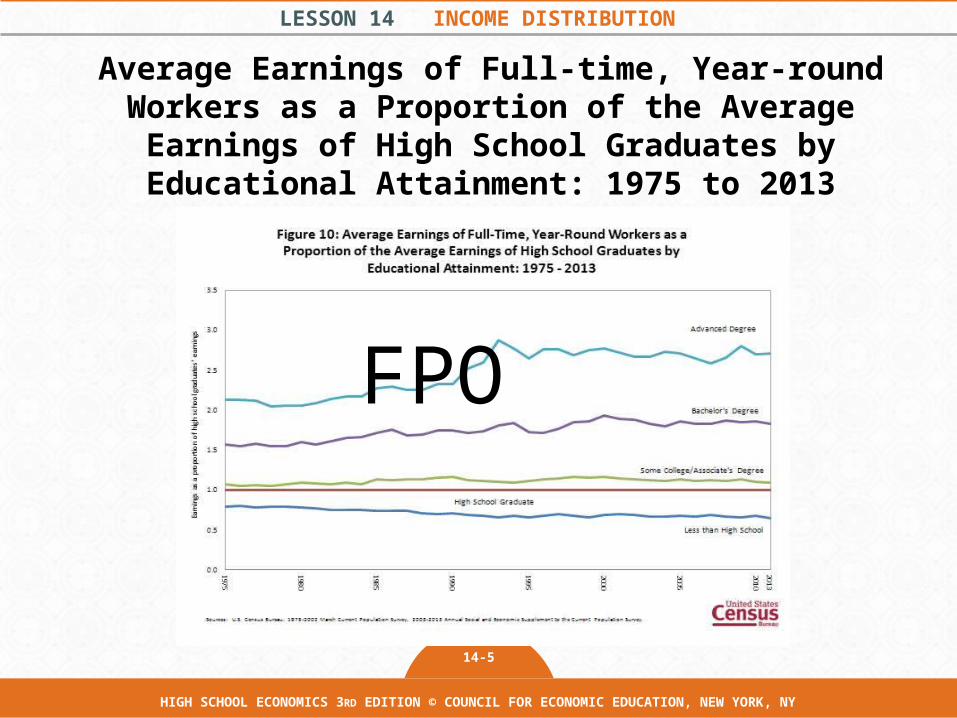
Average Earnings of Full-time, Year-round Workers as a Proportion of the Average Earnings of High School Graduates by Educational Attainment: 1975 to 2013
FPO