household livelihood strategies in semi-arid tanzania ... · understanding household coping...
TRANSCRIPT

UNDERSTANDING HOUSEHOLD COPING STRATEGIES
IN SEMI-ARID TANZANIA
ANNEX 1
Household Livelihood Strategies in Semi-Arid Tanzania:
Synthesis of Findings
Mike Morris, John Butterworth, Richard Lamboll, Evelyn Lazaro, Faustin Maganga, and Neil Marsland
NATURAL RESOURCES INSTITUTE in collaboration with
DEPARTMENT OF AGRICULTURAL ECONOMICS & AGRIBUSINESS SOKOINE UNIVERSITY OF AGRICULTURE
and the INSTITUTE OF RESOURCE ASSESSMENT
UNIVERSITY OF DAR ES SALAAM
This report is an annex to the Natural Resources Systems Programme Final Technical Report for research project R7805 funded by the UK Department for International Development (DFID).

i
TABLE OF CONTENTS
1. INTRODUCTION ........................................................................................................................................ 1
1.1 THE NRSP, POVERTY, SUSTAINABLE LIVELIHOODS AND NATURAL RESOURCE MANAGEMENT ................ 1 1.2 OBJECTIVES AND STRUCTURE OF THE PAPER ............................................................................................. 1
2. LIVELIHOOD APPROACHES AND POVERTY ISSUES ................................................................... 4
2.1 HOUSEHOLD LIVELIHOOD DEFINITIONS...................................................................................................... 4 2.2 BASIC LIVELIHOOD MODELS ....................................................................................................................... 4 2.2 A FRAMEWORK FOR LIVELIHOODS ANALYSIS............................................................................................. 6
2.2.1 Livelihood assets .............................................................................................................................. 6 2.2.2 The mediating environment ............................................................................................................. 7 2.2.3 Vulnerability..................................................................................................................................... 7 2.2.4 Resilience ......................................................................................................................................... 8 2.2.5 Activities and livelihood strategies.................................................................................................. 9 2.2.6 Livelihood outcomes and sustainability ........................................................................................ 13
2.3 LIVELIHOOD APPROACHES TO RURAL POVERTY....................................................................................... 14 2.4 CONCEPTIONS OF POVERTY ...................................................................................................................... 15
2.4.1 Poverty and livelihoods.................................................................................................................. 17 2.4.2 Gender and other intra-household concerns................................................................................. 17
3. CHARACTERISTICS OF SEMI-ARID AREAS OF TANZANIA ..................................................... 21
3.1 INTRODUCTION ......................................................................................................................................... 21 3.2 WHERE ARE THE SEMI-ARID LANDS IN TANZANIA? ................................................................................. 21
3.2.1 Central semi-arid zone................................................................................................................... 24 3.2.2 South-eastern semi-arid zone......................................................................................................... 24 3.2.3 Secondary data used in this study.................................................................................................. 24
3.3 PEOPLE AND POVERTY.............................................................................................................................. 25 3.3.1 Demography................................................................................................................................... 25 3.3.2 Poverty indicators .......................................................................................................................... 26
3.4 AGRICULTURE IN SEMI-ARID AREAS......................................................................................................... 31 3.4.1 Farming systems............................................................................................................................. 33 3.4.2 Markets and infrastructure ............................................................................................................ 36 3.4.3 Institutions in rural Tanzania ........................................................................................................ 36
3.5 NATURAL RESOURCES IN SEMI-ARID AREAS............................................................................................. 37
4. LIVELIHOOD STRATEGIES IN SEMI-ARID TANZANIA.............................................................. 43
4.1 LIVELIHOOD STRATEGIES AND COPING BEHAVIOUR IN SEMI-ARID TANZANIA ....................................... 43 4.2 DIVERSIFICATION STRATEGIES ................................................................................................................. 44
4.2.1 Occupation and income generation............................................................................................... 47 4.2.2 Social identity, gender, age............................................................................................................ 48 4.2.3 Livelihood diversification and poverty .......................................................................................... 49
4.3 MIGRATION............................................................................................................................................... 50 4.4 AGRICULTURAL INTENSIFICATION AND EXTENSIFICATION ...................................................................... 52
4.4.1 Agricultural intensification in Sub-Saharan Africa ...................................................................... 53 4.4.2 Extensification................................................................................................................................ 55
4.5 NR VERSUS NON-NR CONTRIBUTIONS TO LIVELIHOODS ......................................................................... 55 4.6 LIVELIHOODS AND COPING BEHAVIOUR ................................................................................................... 56
4.6.1 Coping with seasonality................................................................................................................. 56 4.6.2 Coping strategies in Shinyanga ..................................................................................................... 56
ii
4.6.3 Coping strategies in Singida.......................................................................................................... 59 4.7 GENDER AND LIVELIHOOD STRATEGIES ................................................................................................... 60 4.8 FACTORS SHAPING LIVELIHOOD STRATEGIES ........................................................................................... 62
4.8.1 Policies, institutions and processes ............................................................................................... 63 4.8.2 Trends, 'true' and seasonal shocks ................................................................................................ 65
5. CASE STUDIES.......................................................................................................................................... 68
Case Study 1: Agriculture, non-farm activities and the resurgence of out-migration in Njombe District, Iringa............................................................................................................................................................. 68 Case Study 2: Changing livelihood patterns in Ikuwala sub-village, Mazombe Division, Iringa District70 Case Study 3. The livestock/sorghum-millet system: Kwimba District. ..................................................... 73 Case Study 4: Income portfolios in Shinyanga District, Shinyanga Region.............................................. 76 Case Study 5: Trends in livelihood strategies for households in close proximity to Miombo woodlands 79 Case Study 6: The agro-pastoralist production system: Dodoma Rural District...................................... 81 Case Study 7: Cropping, livestock practices and land degradation in Kondoa District........................... 84
6. SUMMARY OF FINDINGS AND FUTURE OPTIONS....................................................................... 88
6.1 LIVELIHOOD SYSTEMS IN THE CENTRAL SEMI-ARID LANDS ..................................................................... 88 6.1.1 Agricultural intensification and extensification:........................................................................... 89 6.1.2 Diversification and migration........................................................................................................ 90
6.2 THE NATURE AND DISTRIBUTION OF POVERTY......................................................................................... 92 6.2.1 Household poverty and vulnerability ............................................................................................ 92 6.2.2 Gender and intra-household poverty............................................................................................. 94
6.3 KEY KNOWLEDGE GAPS AND RESEARCHABLE CONSTRAINTS................................................................... 95 6.4 LIVELIHOOD OPTIONS AND EMERGING POINTERS FOR FUTURE STRATEGIES ............................................ 97
REFERENCES ..................................................................................................................................................... 99

iii
Acronyms and Abbreviations AEZ Agro-ecological zones AIDS Acquired Immune Deficiency Syndrome AMREF African Medical Research Foundation ASC Afrika-Studiecentrum, Leiden CS Case Study DFID Department for International Development DONET Dodoma Environmental Network ESRF Economic and Social Research Foundation FAO Food and Agricultural Organisation FARMESA Farm Level Applied Research Methods for East and Southern Africa FHH Female-headed household FSG Food Studies Group FTPP-TZ Forest, Trees and People Programme - Tanzania GAD Gender and Development ha hectare HADO Hifadhi Ardhi Dodoma HFE Household Food Economy HIMA Hifadhi Mazingira HTS Huntings Technical Services HIV Human Immuno-deficiency Virus IDRC International Development Research Council IFAD International Fund for Agricultural Development INADES-FTz Institut Africain pour le Developpement Economique et Social Formation Tanzania IRA Institute of Resource Assessment ITK Indigenous technical knowledge JFM Joint Forest Management KEA Kondoa Eroded Area LRDC Land Resources Development Centre MBOMIPA Matumizi Bora ya Maliasili Idodi na Pawaga NAEP National Agricultural Extension Programme NEMC National Environment Management Council NGO Non-Governmental Organisation NR Natural Resources NRI Natural Resources Institute NRSP Natural Resources Systems Programme ODI Overseas Development Institute PA Protected Area REPOA Research on Poverty Alleviation ROSCAs Rotating Savings and Credit Associations RNRRS Renewable Natural Resources Research Strategy RWH Rain water harvesting SAP Structural Adjustment Programme SASA Sustainable Agriculture in Semi-Arid Areas of Tanzania SCF(UK) Save the Children Fund (United Kingdom) SCPS Social Capital and Poverty Survey SL Sustainable Livelihoods

iv
SUA Sokoine University of Agriculture TSh Tanzanian Shilling UDSM University of Dar-es-Salaam UNDP United Nations Development Programme URT United Republic of Tanzania WHO World Health Organisation
1
1. INTRODUCTION
1.1 The NRSP, poverty, sustainable livelihoods and natural resource management
A recent draft review of the relationship between the NRSP and poverty (NRSP 2000) highlights two “baselines” for an NRSP approach to the poverty focus of DFID, these are: “The systems approach in the Natural Resources Systems Programme” and the sustainable livelihoods (SL) approach. According to DFID/NRSP 1999, a systems approach to research means:
“identifying researchable issues in their developmental context, by undertaking analysis of all the technical, economic, social and institutional inter-relationships that are involved in a given situation”.
How does a systems approach relate to a poverty focus within the mandate of the NRSP? The following quote sums up the logic:
"As one means of assisting the improvement of the livelihoods of the poor, research undertaken in the Natural Resources Systems Programme (NRSP) focuses on interventions that encompass social, economic, institutional and biophysical factors that can enable changes in the management of the natural resource (NR) base that will benefit the poor and at the same time at least maintain the productive potential of the NR-base." NRSP, Annual Report, 1999-2000. I-1 (emphasis added).
Thus the logic is that research should benefit the poor through enabling changes (improvements) in natural resource management, and that interventions that enable improvements may take a social, economic, institutional and/or biophysical entry point(s) within the livelihood system. Note also that an objective of the systems approach is to increase the production, productive potential or sustainability of the production system (DFID/NRSP 1999: 2).
How can this objective be operationalised? The “systems” approach is not in itself a methodology for conducting research or addressing poverty, rather it is a normative call for what research should be doing. The “approach” sets out what should be done (vis. the first quote above) but does not give a methodology for doing this. In order to operationalise the aims of a systems approach with respect to poverty, it is necessary to have (a) an understanding of poverty and (b) a framework which helps identify the relationship between the rural poor – as defined by the understanding of poverty - and the production, productive potential or sustainability of the production system and NR management.
This paper attempts to do both (a) and (b) with respect to people living in rural semi-arid Tanzania. It does this by exploring the meaning, measurement and location of poverty, and then explains the nature of and changes in livelihood strategies of the poor using a SL approach to investigate the role of various external factors in determining livelihood options.
The concept of livelihoods however, moves the analysis beyond the coordinates of production, employment and income alone, embracing a more holistic view and recognising the diverse portfolio of activities that not only enhance household income but also food security, health, social networks and savings. It admits balanced consideration of the rural non-farm economy, and that for example, many households in southern Africa draw on a range of activities and income sources that bridge the rural-urban divide (Shackleton et al., 2000: 1). The approach emphasises the social and environmental as well as economic dimensions of rural life (see Bryceson, 1999: 46).
1.2 Objectives and structure of the paper The overall aim of this paper is to contribute to the identification of best-bet options for NR research aiming to improve livelihoods of the poor by improving their livelihood options, with a focus on NR

2
management options. (Note: Improving the livelihoods of the poor is different from developing livelihood strategies that benefit the poor, as these might be undertaken by the non-poor). In reaching this objective, the paper does the following things:
1. Sets out a framework for understanding livelihoods.
2. Locates and describes poverty in relation to people living in semi-arid Tanzania.
3. Relates the framework to the livelihoods of the poor in semi-arid areas in order to identify entry points for NR related research aiming to improve livelihoods by improving livelihood options, with a focus on NR management options.
In so doing, the paper tries to fulfil the central project objective that is to
“..establish a clear description of current livelihood strategies in the semi-arid areas of the country, together with an effective analysis of the factors that determine those strategies”.
Source: HTS (1999:2) Section 2 of the report focuses on conceptual issues which have helped shape the study. It defines household livelihoods, introduces the basic livelihood model and DFID's framework for livelihood analysis, and explores their key components. Strategic considerations about the use of livelihood approaches to effect rural poverty reduction are briefly discussed. Different concepts - dimensions - of poverty are introduced and the difficulties associated with identifying suitable indicators and measuring poverty, flagged. The causes of impoverishment from a livelihood perspective are delineated. Finally, while the household is the prevailing unit of analysis, reference is made to the implications of gender at the household level (i.e. female-headed households), and of gender and other identity categories (e.g. ill-health, disability, age) at the intra-household level.
Section 3 selects a definition for the semi-arid areas in Tanzania, and identifies the two distinct semi-arid resource zones that follow from this definition. Difficulties associated with the non-alignment of the semi-arid areas and the administrative areas are flagged. A demographic sketch is provided based predominantly on data from the last national census in 1988, and the most recent countrywide surveys of poverty - both quantitative and qualitative - are reviewed. The nature of poverty at district level, and for household groups at different locations throughout the central semi-arid zone, is presented. The farming systems found in this zone are described, together with reference to other natural resources of relevance to people's livelihoods.
Section 4 presents an analysis of livelihood patterns found throughout the study area, and of the factors influencing household strategies. Using the SL approach as the overarching framework, the existing literature on livelihood in Tanzania and various case studies (section 5, plus case study material from fieldwork undertaken by the Sokoine University of Agriculture team) are brought together. The livelihoods of different wealth groups at several locations throughout the central semi-arid zone are depicted, with analysis of the factors influencing their respective livelihood patterns. The coping strategies of the poor - responses to seasonal downturns or unusual shocks to the farming system - are detailed for some areas. Gender implications at the household and intra-household level are reviewed.
Section 5 presents 7 village-level case studies. As far as possible the case study material is re-presented with emphasis on a SL approach. All the case studies identify different groups according to their asset holdings or activities. However whereas most provide an opportunity to compare and contrast these findings at specific locations, case study 5 compares the changing livelihood patterns between households, all in proximity to miombo woodlands, in remote, intermediate and peri-urban locations. With one exception, the case studies are located throughout the central semi-arid region.

3
Section 6, drawing heavily on the analysis in section 4, summarises the findings on livelihoods in the central semi-arid areas in general, and on the nature and distribution of poverty at the household level for different locations. The linkage between impoverishment and the depleted livelihood resources of vulnerable households is illustrated from the case studies, and wider arguments extrapolated. Key constraints and opportunities across the agricultural and rural development sectors, as identified throughout the study and its wider processes, are briefly set out. The section concludes with a brief assessment of the overall situation and some indicators of the areas and means appropriate to future programme strategies.
4
2. LIVELIHOOD APPROACHES AND POVERTY ISSUES
2.1 Household livelihood definitions The livelihood definition provided by Chambers and Conway (1992: 7) has been widely cited in the development literature, and with minor modifications has been used by a number of researchers e.g. Carswell (1997), Hussein and Nelson (1998), Scoones (1998), Carney (1998).
“A livelihood comprises the capabilities, assets (stores, resources, claims and access) and activities required for a means of living.” Chambers and Conway (1992: 7)
Ellis (2000: 9) seeks to build on this definition by bringing in a more explicit consideration of the claims and access issues, and in particular the impact of social relations and institutions that mediate an individual or family's capacity to secure a means of living:
“A livelihood comprises the assets (natural, physical, human, financial and social capital), the activities, and the access to these (mediated by institutions and social relations) that together determine the living gained by the individual or household.” Ellis (2000: 10)
In addition to assets and activities, and the factors that mediate access, livelihood considerations must take account of the outcomes of the interaction of these components. Livelihood outcomes would ideally be what people seek and strategize to achieve through their activities, albeit in practice the means or the choice of activities may be restricted or absent and the ends will not always be realised. Desired outcomes might include increases in income (monetary), food and water security, health, physical security, independence, knowledge, status, or time – the inverse of various poverty dimensions. The outcomes in turn will usually have a direct effect on the asset base and activities (and possibly on the access regimes), so in this sense there is a cyclical relationship between assets, activities and consumption outcomes (see Figure 2.1).
Most livelihood models focus on the household as the most appropriate social group for the investigation of livelihoods, albeit external measures to manage risk may be social or public in nature. Household livelihoods are however founded on the aggregation and dynamics of its individual members, which suggests that to develop understanding of the pervasive features of rural households some account of the intra-household dynamics (e.g. by gender, age or status) will be necessary.
Definitions of households have conventionally emphasised co-residence, sharing the same meals - “cooking from one pot” - and undertaking joint or co-ordinated decision-making; and rural households have been regarded as the centre of rural social systems. Recent concepts of the household broaden the definition to allow for overlapping social groupings, including family or other members who may be physically dispersed but socially interdependent. Seasonal (and permanent) migration of individuals and households has been and is presently a significant feature of Tanzanian life. This broader definition which includes migrants who contribute to or call upon household resources, would thus seem more appropriate1.
2.2 Basic livelihood models Several types of livelihood models have been put forward over the years. This project endeavours to make critical use of the existing literature on livelihoods issue, and in order to do this we require some guiding concepts and a general framework to organise thoughts.
1 In Kondoa District Mung’ong’o (1997: 66) describes secondary or ‘satellite’ households which are formed in a recently settled village (Soya) by individuals who are incumbent members of an established household in the area of origin (Haubi). See Case Study 7.

5
As noted by ODI (2000), the core of livelihoods models going back to Sen (1981), Chambers (1988), Swift (1989), Kabeer (1991), Scoones (1998), Davies (1996), Carney (1998), and others such as Barratt and Reardon (2000), has been the relationship between assets (also capitals, factors), activities (also strategies, production, exchange etc) and outcomes (also entitlements, consumption bundles, well-being, utility, income) within a mediating environment. These aspects are represented in Figure 2.1 below.
The ‘external’ mediating environment (the block arrows in Figure 2.1) directly influences the internal workings of the assets-activities-outcomes relationship. It provides the context within which household decision-making processes unfold, mediating access to household assets and the use to which they can be put, influencing the strategies - sets of activities - households adopt and their potential outcomes. The nature of the diverse constituent factors will be elaborated later. Their influence however might affect the following: • Quality and quantity of assets (e.g. disease reduces human capital, education increases human
capital, soil degradation reduces natural capital, devaluation reduces financial capital2). • Activities and the terms on which they transform assets (e.g. drought leads to coping activities
which may transform productive assets into liquid assets and thus denude the asset base).
2 These are all “first round” effects i.e. the initial impact of the change will be felt on these assets. There will, however, be subsequent effects on other assets.
Outcomes enhance, or erode, assets
Strategies result in Outcomes
Assets are transformed by
ASSETS: NR capital, human and social capital, physical capital, financial capital etc.
ACTIVITIES
combine to make Strategies
LIVELIHOOD
OUTCOMES Food security, well-
being, income, conservation etc.
modifying and contextual factors (e.g. land tenure, user
rights, village council)
modifying and contextual factors (e.g. input prices,
market proximity)
modifying and contextual factors (e.g output prices, food aid)
Figure 2.1 A generic livelihood model
6
• The relationship between activities and consumption outcomes (e.g. the influence of different types of prices, such as minimum wage rates, income taxes, which may set a type of floor for the impact of labour on consumption; price stabilisation policy which may affect the rate at which agricultural output increases are related to consumption outcomes).
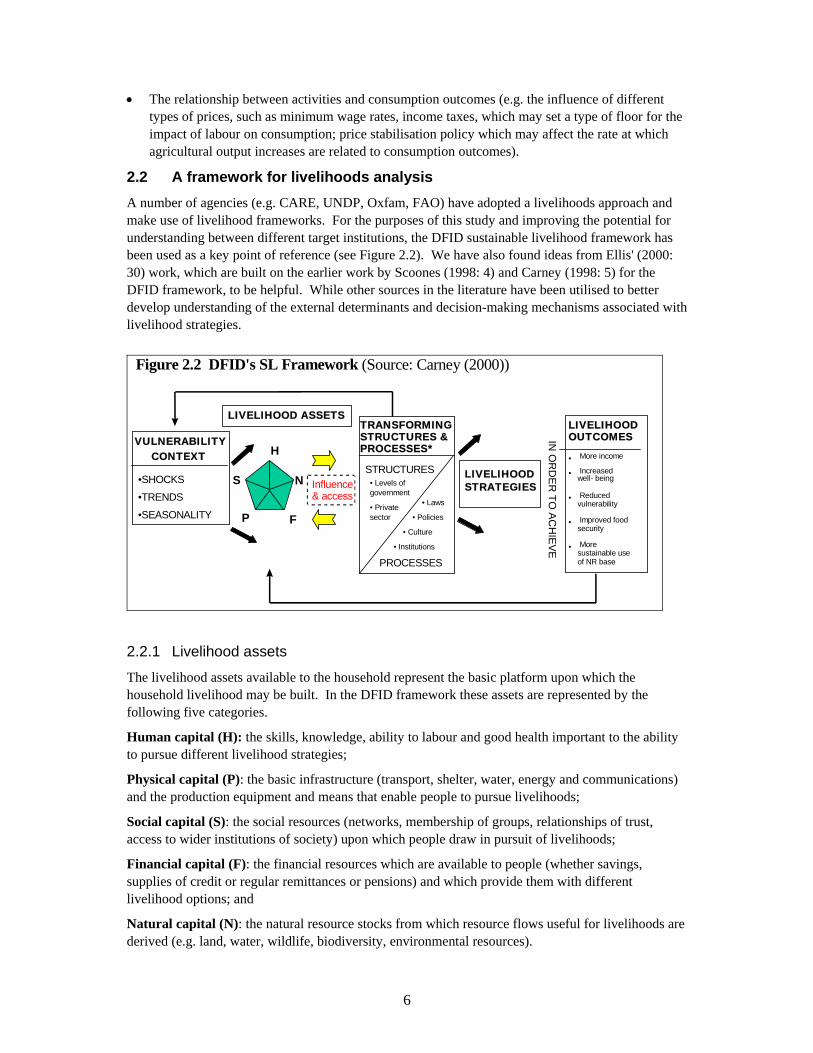
2.2 A framework for livelihoods analysis A number of agencies (e.g. CARE, UNDP, Oxfam, FAO) have adopted a livelihoods approach and make use of livelihood frameworks. For the purposes of this study and improving the potential for understanding between different target institutions, the DFID sustainable livelihood framework has been used as a key point of reference (see Figure 2.2). We have also found ideas from Ellis' (2000: 30) work, which are built on the earlier work by Scoones (1998: 4) and Carney (1998: 5) for the DFID framework, to be helpful. While other sources in the literature have been utilised to better develop understanding of the external determinants and decision-making mechanisms associated with livelihood strategies. Figure 2.2 DFID's SL Framework (Source: Carney (2000))
LIVELIHOODSTRATEGIESInfluence
& access
VULNERABILITYCONTEXT
•SHOCKS
•TRENDS
•SEASONALITY
TRANSFORMINGSTRUCTURES &PROCESSES*
STRUCTURES
PROCESSES
• Levels ofgovernment
• Privatesector
• Laws
• Policies
• Culture
• Institutions
LIVELIHOODOUTCOMES
• More income
• Increasedwell- being
• Reducedvulnerability
• Improved foodsecurity
• Moresustainable useof NR base
H
S
Ph
F
N
LIVELIHOOD ASSETS
IN O
RD
ER
TO AC
HIE
VE
2.2.1 Livelihood assets
The livelihood assets available to the household represent the basic platform upon which the household livelihood may be built. In the DFID framework these assets are represented by the following five categories.
Human capital (H): the skills, knowledge, ability to labour and good health important to the ability to pursue different livelihood strategies;
Physical capital (P): the basic infrastructure (transport, shelter, water, energy and communications) and the production equipment and means that enable people to pursue livelihoods;
Social capital (S): the social resources (networks, membership of groups, relationships of trust, access to wider institutions of society) upon which people draw in pursuit of livelihoods;
Financial capital (F): the financial resources which are available to people (whether savings, supplies of credit or regular remittances or pensions) and which provide them with different livelihood options; and
Natural capital (N): the natural resource stocks from which resource flows useful for livelihoods are derived (e.g. land, water, wildlife, biodiversity, environmental resources).

7
These assets combine both the tangible productive assets associated with economic analyses (e.g. land, labour, capital, and stocks) and the intangible assets more familiar to sociological and anthropological enquiry (e.g. social capital, health and educational status).
While most of these assets are considered in terms of the household or its membership, some assets may be held in common with a broader user group. This does not invalidate the focus on individual household livelihood strategies, but it serves to remind us that resource management solutions may be collective as well as aggregated. Given the characteristics of many resources, the spatial and temporal diversity of user groups, and the covariance associated with climatic risk, collective solutions may be particularly pertinent in the case of some resources in semi-arid areas.
2.2.2 The mediating environment
All livelihood models acknowledge the role and importance of the mediating environment - the 'modifying and contextual forces' of Figure 2.1 - in translating individual or household assets into livelihood strategies and outcomes.
The DFID model divides these external forces into 'transforming structures and processes' - or ‘policies, institutions and processes’ - (e.g. levels of government, private sector, laws, policies, culture, institutions), and the 'vulnerability context', described in terms of shocks (e.g. civil and climatic), trends (e.g resource stocks, population, technology, politics and economics) and seasonality (Carney, 1998). We return to the concept of vulnerability later in this section.
Ellis similarly distinguishes between the modifying influence of 'social relations, institutions and organisations', and the contextual 'trends and shocks'. In making this distinction however, he suggests that the nature of social relations (e.g. gender, class, age, ethnicity), institutions (e.g. rules and customs, land tenure, markets in practice) and organisations (e.g. associations, NGOs, local administration and state agencies), will be predominantly endogenous to the society within which the household operates. While the category of trends (e.g. population, migration, technological change, relative prices, macro policy, national and global economic trends) and shocks (e.g. drought, floods, pests, disease, civil war) would principally cover exogenous factors (Ellis, 2000: 37).
While the distinction between exogenous and endogenous factors may not be as clear cut in practice, it does however provide a useful axis for identifying and differentiating those factors that fall within the remit of governments and the potential of pro-poor policies to influence.
2.2.3 Vulnerability
For poor households the interaction between internal livelihood components and the external influences typically reveals a pattern of vulnerability. The concept of vulnerability in the African rural setting has been the subject of a great deal of attention over the last 10 years. The most commonly used definition of vulnerability is that of Chambers:
“Vulnerability here refers to exposure to contingencies and stress, and difficulty in coping with them. Vulnerability thus has two sides: an external side of risks, shocks and stress to which an individual is subject; and an internal side which is defencelessness, meaning a lack of means to cope without damaging loss.” (Chambers 1989:1)
The external side of vulnerability has dimensions of shock, trend or cycle (e.g. seasonality). Shocks are associated with the ability of livelihoods to cope while trends are associated with the adaptability of livelihoods (ODI, 2000). In Tanzania some of these shocks and trends are general in the sense that they affect large areas or populations. Recent droughts in Southern Africa and an associated climatic

8
trend would be an example of this. Others are more localised e.g. a flood that affects one watershed, or at a lower level, an illness that affects a particular household3.
The internal side of vulnerability is linked with net assets, and the rates at which these can be converted into consumption outcomes through activities. As Moser (1998) notes:
“Vulnerability is therefore closely linked to asset ownership.. ..The means of resistance are the assets and entitlements that individuals, households, or communities can mobilise and manage in the face of hardship.. ..The more assets people have, the less vulnerable they are, and the greater the erosion of people’s assets, the greater their insecurity.”
Households and individuals will have different and varying degrees of access to and thus different portfolios of assets. However not only do fewer assets equate to greater vulnerability, but also lower potential for substitution between assets and activities makes livelihoods more vulnerable, especially to shocks. Assets that can readily be liquidated and used to purchase more appropriate assets provide for greater livelihood flexibility (Ellis, 2000: 42). Substitution within asset categories can also occur. One notable example relates to the re-allocation of labour between domestic and outside earning opportunities in response to changing circumstance. With access to different portfolios of diverse assets, individuals and households will consequently respond in different ways to given livelihood shocks or trends.
Table 2.1 Examples of Trends, Shocks and Seasonality (After Devereux, 1999)
Trends 'True' shocks Regular or seasonal shocks
• Population trends • Resource trends • Environmental
degradation • National/international
economic trends • Trends in governance • Technological change • Human health trends
• Human health shocks • Droughts, floods • Economic shocks • Conflict, civil upheaval • Pestilence, crop diseases • Livestock health shocks
• Of prices • Of production • Of health • Of employment
opportunities
Key differences at the intra-household level would include those between the responses of women and men, between the elderly and youth or others, between persons in good health compared to those who may be ailing. Resource and entitlement issues and the household division of labour, amongst other themes, feature prominently for example, in the literature on gender and food security (Laier et al, 1996).
2.2.4 Resilience
The concept of resilience, imported from the ecological literature, has received much less attention in the livelihoods' literature, yet this represents a critical part of the story. Resilience can be understood in a similar way to vulnerability, in that it consists of an internal and an external side. The internal side relates to the capabilities of social units to capitalise on beneficial shocks (e.g. windfalls), trends (e.g. generalised economic growth) and cycles (e.g. of increased labour availability), while the external side relates to the opportunities provided by those shocks, trends and cycles. As for
3 The World Bank refers to these as different types and sources of risk. Types of risk are divided into idiosyncratic risks affecting an individual or household (micro) and co-variant risks affecting groups of households or communities (meso) or regions or nations (macro). Sources of risk can be divided into natural, health, social, economic, political and environmental (World Bank: 2000: 136).

9
vulnerability, the capacity to take advantage of opportunity is linked to the assets and activities that are available to a given household. Ultimately we need to understand not only the types of livelihood strategy deployed but also the underlying determinants and motivations. Poorer households are typically deemed to be risk averse engaging in various insurance strategies to cope with high levels of uncertainty. Were however the vulnerability context replaced by that of resilience - with the implied changes in perception and expectations - then risk taking strategies favouring investment and spending, might be more apposite (Siegel and Alwang, 1999; ODI, 2000).
2.2.5 Activities and livelihood strategies
The pattern of vulnerability (or opportunity) of individuals or households is reflected in the portfolio of assets and the activities which are undertaken to derive a livelihood. The resilience of a given social unit will depend on the success of these activities.
Livelihood strategies are composed of the various activities undertaken by the household to generate a living. They are the patterns of behaviour adopted by the household as a result of the mediation processes on the household assets. As an intrinsic part of the assets-activities-outcomes cycle, livelihood strategies are generally adaptive over time, responding to both opportunities and changing constraints.
Livelihood strategies have been classified according to different criteria. Scoones (1998) and Swift (1998) divide rural livelihood strategies into three broad types according to the nature of activities undertaken: agricultural intensification and extensification, livelihood diversification, and migration (see Box 2.1). They are not necessarily mutually exclusive and trade-offs between option types and the possibility to combine elements of different options will exist.
Box 2.1 Agricultural intensification or extensification, livelihood diversification, and migration (source: Scoones (1998) and Swift (1998)).
• Agricultural intensification/extensification: These strategies mainline continued or increasing dependence on agriculture, either by intensifying resource use through the application of greater quantities of labour or capital for a given land area, or by bringing more land into cultivation or grazing. Whether households pursue this strategy will depend on agro-ecological potential and the implications for labour and capital. Technical developments in agriculture may also operate as a key determinant. The availability or not of this option, and the extent to which it is undertaken by the household, will determine in major part the need for, and the household resources available to, off-farm livelihood diversification.
• Livelihood diversification: Diversification here may be to broaden the range of on-farm activities (e.g. adding value to primary products by processing or semi-processing them), or to diversify off-farm activities by taking up new jobs. It may be undertaken by choice for accumulation or reinvestment purposes, or of necessity either to cope with temporary adversity or as a more permanent adaptation to the failure of other livelihood options. The former motivation might be associated with a wide income-earning portfolio to offset all future types of shocks or stress, whereas the latter would more likely be a narrower, rehearsed response to a particular type of common shock or stress.
• Migration: Migration may be voluntary or involuntary. As a critical strategy to secure off-farm employment (i.e. needs driven), it may rely on and/or stimulate economic and social links between areas of origin and destination. Kinship structures, social and cultural norms may strongly influence who migrates. Migration will have implications for the asset status of those left behind, for the role of women and for on-farm investments in productivity.

10
Ellis' classification of livelihood strategies is premised on the observation that for the majority of rural households in SSA, farming alone does not provide a sufficient means of survival. Most rural households he suggests increasingly rely on constructing a diverse portfolio of activities and income sources in order to survive and to improve their standard of living. This includes both on- and off-farm activities undertaken to generate income (i.e. monetary and non-monetary contributions to household consumption) additional to that from the main household agricultural activities. Ellis divides these activities into natural resource and non-natural resource based activities (see Box 2.2). He identifies seasonality, risk, labour markets, credit substitution, and asset strategies (investment to enhance future livelihood prospects e.g. developing networks, education) as factors which might induce voluntary motives for the adoption of diverse livelihoods. The benefits would take the form of consumption smoothing, labour smoothing, risk spreading, and the generation of resources for investment in assets as well as for consumption. Involuntary reasons for diversification would be associated with coping strategies (Ellis, 2000).
The dynamics associated with the pursuance of specific strategy types have also been identified with the characteristics of choice and necessity, or the motivational aspects of decision-making within the external context of constraints and opportunities. Positive strategy adaptations will typically be associated with choice. While they will usually (but not invariably) lead to increased security and consumption outcomes, this may be reversed if circumstances change. Negative strategy adaptations, or adaptations born of necessity, occur when households are subject for example, to personal misfortunes or natural catastrophe, and no longer able to cope or subsist (Davies and Hossain, 1997). From the literature on diversification Barrett and Reardon (2000) refer to the ‘push’ and ‘pull’ factors that determine people’s decision-making with regard to income and asset diversification.
Box 2.2 Household-level diversification strategies: NR-based and non NR-based (source: Ellis, 2000)
Natural resource based activities include: • collection or gathering (e.g. from woodlands and forest) • food cultivation • non-food cultivation • livestock keeping and pastoralism, and • non-farm activities (e.g. brick making, weaving, thatching) Non-natural resource based activities include: • rural trade (e.g. marketing of farm outputs, inputs, and consumer goods) • other rural services (e.g. vehicle repair) • rural manufacture • remittances (urban and international) • other transfers (e.g. pensions deriving from past formal sector employment).
Devereaux (1993) and Davies (1996) amongst others have made the distinction between survival, coping, adaptive and accumulative strategies. Accumulative strategies are those which increase consumption outcomes and stocks of assets in response to opportunity. Adaptive strategies are those that seek to spread risk of consumption failure in response to anticipated adverse trends. This may be through the intensification of existing livelihood strategies or by diversification into new activities. Coping strategies are those that absorb the impact of an adverse shock by drawing down assets and reducing consumption. When there is no respite coping may lead to survival strategies. With

11
survival strategies not only is consumption drastically reduced, but household assets are extensively, most often irreversibly eroded, in an attempt to ward off destitution and death.
Table 2.2 Typology and examples of different livelihood strategies
Internal livelihood system component Type of livelihood strategy
Change to Assets Strategies/activities Consumption outcomes
Accumulative Increased stock of assets. Increased flexibility across asset base.
As for adaptive. More income. Improved nutrition. Increased security.
Adaptive Change in mix of assets. Precautionary saving of financial & other assets.
Extensification (cultivation of more land). On-farm & off-farm diversification (e.g. change in cropping mix, wage labour). Intensification of cash cropping. Investments in social capital. Migration.
Income and consumption smoothing. Risk reduction. Risk spreading. Labour smoothing.
Coping Intensified sale of livestock. Calling down informal claims (e.g. through kin networks).
Piecework, agricultural labour. Temporary migration. Withdrawing children from school.
Reduced frequency, quantity and quality of meals. Use where available of relief food. Social and ceremonial obligations reduced.
Survival Sale of productive assets (e.g. bicycle, land). Sale of household effects (e.g. bed).
Illegal activities. Begging. Permanent out-migration.
Starvation and destitution.
(After Devereaux and Davies)
Siegel and Alwang (1999) classify household livelihood strategies on the basis of how they manage risk, differentiating between ex-ante strategies which seek to reduce or mitigate risks, and ex-post strategies which are ad-hoc responses to unforeseen events and outcomes. Such strategies they suggest are typically part of a sequential planning process, in which a combination of risk prevention, risk mitigation and coping are practised in anticipation of, and in response to, risky events and outcomes (see Table 2.3).
Table 2.3 Ex-ante and ex-post risk management strategies: a sequential process*
Risk Management Strategy
Ex-Ante Action Ex-post Action
Risk reduction:
Actions that reduce household susceptibility to risk.
Invest in measures that lower probability or impact of risky event:
• Childhood immunisation
• Adoption of drought resistant varieties
• Conservation tillage that protects soil & moisture
If risk prevented ™ no action
If risk reduced and event does not occur ™ no action
If risk reduced and event occurs ™ depending on mitigation activities, possible coping to smooth consumption
If risk not reduced and event

12
• Spatial/temporal scattering of crops & livestock
occurs ™ coping to smooth consumption
Risk mitigation:
Actions that moderate or offset welfare losses following actualisation of event.
• Adjust asset portfolio and income-generating activities
• Invest in formal/informal insurance arrangements (including social capital)
• Invest in formal or precautionary savings
If risky event does not occur ™ no action
If risky event occurs ™ receive payoff, call upon social capital or sell liquid assets. Possible coping to smooth consumption.
Risk coping:
Ad-hoc risk management
No specific actions undertaken Coping to smooth consumption
(Source: Siegel & Alwang, 1999) Of risk mitigation, formal insurance markets in developing countries are notably incomplete and imperfect, while the frequent covariant nature of agricultural risks both limits the scope for risk trading and diminishes the effectiveness of informal insurance schemes based on social capital. Socially similar households are likely to be enduring the same trials, with limited leeway to bail out neighbouring households in the actualisation of risky events.
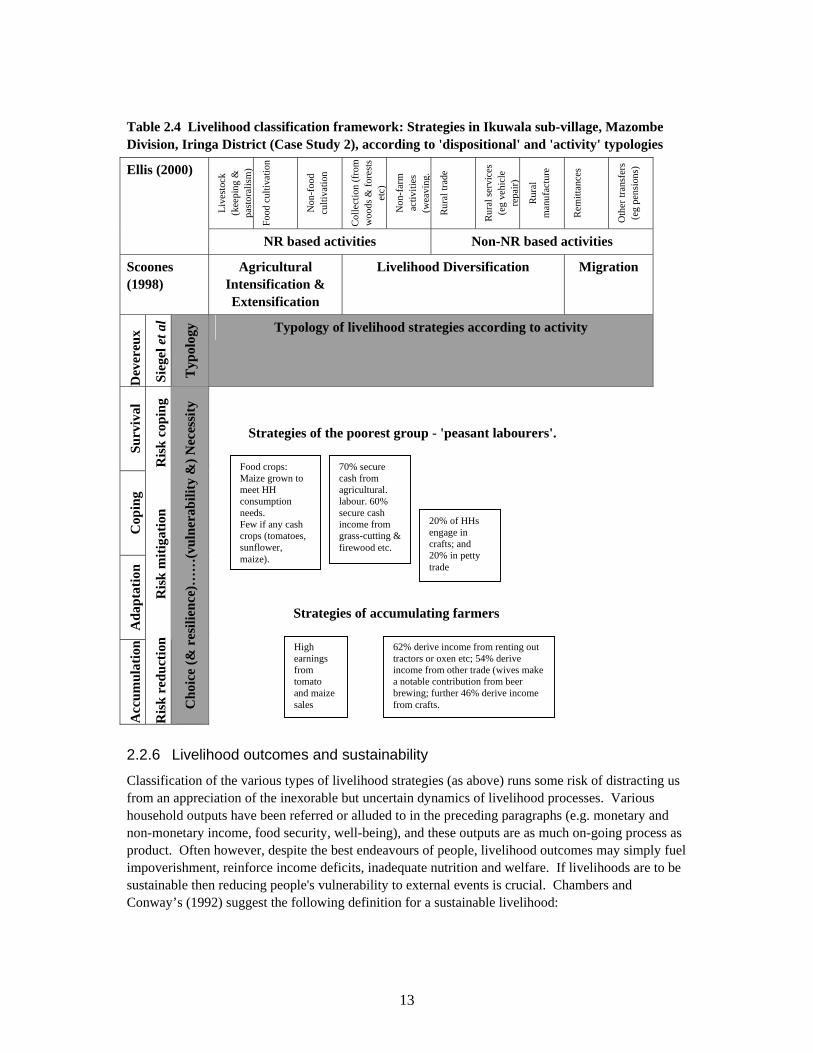
The classifications suggested by Scoones and Swift, and Ellis, reflect the characteristics of the activities undertaken (e.g. intensification, use of off-field NRs, migration). Those offered by Devereaux and Davis, Siegel and Alwang, are based on the perceived rationale or motivation of households and individuals together with reference to potential outcomes (e.g. risk management, accumulation, survival). They are not mutually exclusive, and either type of classification may lend insight into the multiple and changing livelihood strategies undertaken by particular households (or groups of HHs.) over a given season or period. Understanding of the portfolio of livelihood strategies of similar households can be developed and 'depicted' by juxtaposing these two general typologies as in Table 2.4, in which the strategies of the poorest and wealthiest groups in Ikuwala sub-village, Iringa are displayed.
13
Table 2.4 Livelihood classification framework: Strategies in Ikuwala sub-village, Mazombe Division, Iringa District (Case Study 2), according to 'dispositional' and 'activity' typologies
Live
stoc
k (k
eepi
ng &
pa
stor
alis
m)
Food
cul
tivat
ion
Non
-foo
d cu
ltiva
tion
Col
lect
ion
(fro
m
woo
ds &
fore
sts
etc )
Non
-far
m
activ
ities
(w
eavi
ng.
Rur
al tr
ade
Rur
al se
rvic
es
(eg
vehi
cle
repa
ir)
Rur
al
man
ufac
ture
Rem
ittan
ces
Oth
er tr
ansf
ers
(eg
pens
ions
) Ellis (2000)
NR based activities Non-NR based activities
Scoones (1998)
Agricultural Intensification & Extensification
Livelihood Diversification Migration
Dev
ereu
x
Sie
gel e
t al
Typ
olog
y Typology of livelihood strategies according to activity
Surv
ival
C
opin
g A
dapt
atio
n A
ccum
ulat
ion
Ris
k re
duct
ion
R
isk m
itiga
tion
R
isk
copi
ng
Cho
ice
(& r
esili
ence
)……
(vul
nera
bilit
y &
) Nec
essi
ty
2.2.6 Livelihood outcomes and sustainability
Classification of the various types of livelihood strategies (as above) runs some risk of distracting us from an appreciation of the inexorable but uncertain dynamics of livelihood processes. Various household outputs have been referred or alluded to in the preceding paragraphs (e.g. monetary and non-monetary income, food security, well-being), and these outputs are as much on-going process as product. Often however, despite the best endeavours of people, livelihood outcomes may simply fuel impoverishment, reinforce income deficits, inadequate nutrition and welfare. If livelihoods are to be sustainable then reducing people's vulnerability to external events is crucial. Chambers and Conway’s (1992) suggest the following definition for a sustainable livelihood:
Food crops: Maize grown to meet HH consumption needs. Few if any cash crops (tomatoes, sunflower, maize).
70% secure cash from agricultural. labour. 60% secure cash income from grass-cutting & firewood etc.
Strategies of the poorest group - 'peasant labourers'.
20% of HHs engage in crafts; and 20% in petty trade
High earnings from tomato and maize sales
62% derive income from renting out tractors or oxen etc; 54% derive income from other trade (wives make a notable contribution from beer brewing; further 46% derive income from crafts.
Strategies of accumulating farmers

14
“A livelihood is sustainable when it can cope with and recover from stresses and shocks and can maintain or enhance its capabilities and assets both now and in the future, while not undermining the natural resource base.” (Chambers and Conway, 1992)
This concept of sustainability, embracing both livelihood and natural resources, is however complex and problematic. There are a number of studies on linkage and the incentives compatibility of the sustainable use of natural resources and biodiversity conservation (e.g. Salafsky and Wollenberg (2000), Murphree (1999), Lamboll et al. (2001)), however the interface remains contentious both in theory and practice. These issues have particular resonance in the case of Tanzania’s semi-arid areas where multiple livelihood interests and the drive for increasing productivity have continued to extend the agriculture frontier, often at the expense of the environment. At the same time an increasing proportion of the aid budget has been channelled into conserving yet more of the countries extensive, often unique, natural heritage. At twenty-eight percent of the mainland area, Tanzania’s protected areas (PAs) already amount to nearly three times the ten percent recommended by the IUCN, and are more than twice that set aside in Kenya.
Writing of farming and livestock systems in Sub-Saharan Africa, Goldman (1995), notes that ‘household strategies to increase resilience [via diversifying income sources] may conflict with achievement of an optimal level of resource management’. In his opinion extreme perturbations (e.g. pests, disease, sharp changes in relative market prices) are of greater importance in terms of undermining sustainability than the literature allows, while adverse trends (i.e. stress factors such as soil erosion) are much less important.
Moreover, he offers an interesting explanation to marry concepts of sustainability at different levels. He concludes that the objective of sustainability, whether crop, livestock or larger socio-economic system, 'comprise a hierarchy of attributes, components, and systems at increasing scales', and that sustainability of higher order systems are not reliant on sustainability within sub-systems, providing their scale or complexity allows for substitutions. This argument might be used to underpin trade-offs between agricultural conversion and the maintenance of sufficiently large protected areas.
For livelihoods or livelihood outcomes to be meaningfully sustainable in the context of larger socio-economic systems, then account must also be taken of the wider distributional issues (e.g. within and between households, and across generations). This follows on from notions of sustainability that were first counselled by the World Commission on Environment and Development (Brundtland, 1987) and subsequently endorsed and elaborated at the 1992 Earth Summit. Together with its environmental component sustainability is gauged in terms of its social, economic and institutional dimensions, and with subsequent generations in mind. While livelihood approaches invite consideration of both macro and micro influences at the household or individual level, they have however little to say about distributional issues. Furthermore the widespread emphasis on the poorest is implicit rather than explicit, deriving in the main from the agenda of respective donors.
2.3 Livelihood approaches to rural poverty Rural poverty reduction approaches for the last three decades of the twentieth century were largely premised on increasing productivity for small-farm agriculture4. By the late 1980s reform - structural adjustment - of the agricultural sector, which had first sought to rectify earlier inefficiencies associated with top-down approaches and state bureaucracies, was emphasising economic liberalisation and privatisation. Farming systems approaches, which attempted to develop a better 4 Ellis (2000: 98) cites criticism of the ‘agriculture first’ strategy - as coined by Saith (1992) - in terms of (1) pervasive public policy bias in favour of urban and industrial interests (Lipton, 1977), (2) capture of the benefits of subsidies and other supports by richer rather than poorer farmers, (3) incompetence, corruption and waste by state agencies resulting in deteriorating institutional environment for small-farm growth, and (4) price and exchange rate policies resulting in artificially low returns to agricultural production (Krueger, 1992).

15
understanding of the economic, social and institutional and interactions at the farm level, were introduced to complement existing top-down approaches that predominantly focussed on technological solutions (Carney, 1999; Ellis, 2000).
Livelihood approaches take account of the diverse context and complex options that confront rural (and urban) households in their quest for increasing livelihood security. As such they shift the focus of analysis from the sector to the household (or individual) level, which in turn suggests a broader or more integrated response than earlier ‘agricultural-first’ prescriptions. This re-location of the fulcrum of the analysis intrinsically challenges the asymmetry of earlier conventional poverty reduction models (e.g. rural growth linkages models), which see rising small-farm productivity as driving labour-intensive non-farm activities in the rural areas. Moreover, as Mung’ong’o (1998:29) observes in one of the case studies, there is much empirical evidence to indicate that these two rural economic sectors have been complementary: ‘surplus capital from agriculture is often invested in the development of non-agricultural activities and vice versa’. He further suggests that at the present time in Tanzania, while agriculture remains in crisis, the non-agricultural sector has taken the upper hand.
Besides de-coupling the concepts of ‘rural’ and ‘agricultural’, livelihood approaches centre-stage the capabilities and resourcefulness of rural people, rather than focusing on the resources themselves (e.g. forests, fisheries, land) or the service providers (e.g. extension services, research) as previous approaches have done. The achievement of sustainable poverty reduction will however require that external mediating forces (i.e. policies, institutions and processes) falling within the remit of the state and civil society to influence, ‘work with people in a way that is congruent with their existing livelihood strategies and ability to adapt’ (Carney, 1999: 3). Whether governments and donors are able to marshal the degree of cross-sectoral activity envisaged in such approaches remains to be seen.
In developing the narrative on the social and economic dimensions of rural development, livelihood approaches allow the broader tapestry of rural lives and rural poverty to be captured, without losing sight of the predicaments of different groups of households or individuals. Much rural poverty for example, is increasingly linked to phenomenal and irreversible changes taking place within and around small-scale farming communities, while its profile is deemed to be undergoing geographic and demographic changes. Before measures can be identified to remedy the impact of poverty however, definitions, dimensions and causes of poverty need clarification.
2.4 Conceptions of poverty Both the Natural Resources Systems Programme (NRSP) and SL approaches are articulated in terms of poverty. NRSP’s goal is unambiguously stated in terms of improving the livelihoods of poor people largely dependent on the natural resource base. DFID’s SL approach is premised on a set of core principles – people-centred, responsive and participatory, multi-level, conducted in partnership, sustainable, and dynamic – which are said to be key to poverty-focused development activities. While the approach itself is equally applicable to developing understanding of the livelihoods of better off communities and households, the literature confirms that DFID's deployment of this approach is underpinned by a commitment to poverty eradication (Ashley and Carney, 1999: 7).
Poverty however has been conceptualised in many different ways, and is associated with a diverse terminology - income or consumption poverty, human under-development, social exclusion, ill-being, lack of capability and functioning, vulnerability, unsustainable livelihoods, lack of basic needs, relative deprivation. The different concepts of poverty derive from its multiple dimensions and diverse contexts. They imply different sets of indicators, with varying levels of difficulty associated both with measurement, and where composite models of poverty are used, with their aggregation. Moreover, different concepts of poverty imply different interventions. The success or

16
failure of the latter however, hinges on understanding the causes of poverty (Maxwell, 1999; UNDP, 1997).
There is a basic divide between income, consumption or expenditure definitions which emphasise physiological deprivation and definitions which emphasise social deprivation (e.g. entitlements theory, social exclusion approach). The latter views (indicators of) poverty as going beyond income levels to include access to health care and education, respect, status, isolation within a community, and feelings of powerlessness and hopelessness. Empirically, it is normally easier to quantify poverty using physiological measures than social deprivation measures. An important empirical question is the degree of correlation between physiological and social measures. What is clear from various participatory poverty assessments in Africa and elsewhere is that the relationship between physiological and social measures of poverty varies widely, both “objectively” and in the minds of people themselves. In some cases, there is a strong positive correlation between income poverty and social poverty, in other cases the relationship is more complex (NRSP, 2000). Quantitative measures can be blind to aspects of poverty uncovered by qualitative participatory methods. In Tanzania for example, Greeley (2000) cites problems of alcoholism and of domestic violence captured in qualitative analyses but omitted from quantitative poverty methods.
Box 2.3 Defining poverty and its immediate causes
Physiological deprivation:
(1) Income/consumption approach. A person is considered to be poor if, in a given period, her or his access to economic resources is insufficient to acquire enough commodities to meet material needs. The poverty line may be calculated in a variety of ways, usually emphasising income and/or consumption, or dietary energy supply, and those who fall below this line are at risk of a shortened lifespan, ill health, working impairment or discomfort.
(2) Basic needs approach. Basic needs are the minimal specified quantities of such things as food, clothing, shelter, water and sanitation that are necessary to prevent ill health, malnourishment, early mortality, etc. This approach usually specifies a basket of goods and services that meet these needs and sets adequacy levels for each, rather than relying on indirect measures of non-food needs such as income.
Social deprivation:
(3) Entitlement approach. Poverty can involve not only the lack of necessities for material well-being but also the denial of opportunities for living a tolerable life. This draws on the theoretical work of Amartya Sen who conceptualises it in terms of the absence of certain capabilities to function. Analysis should include both what people can or cannot do (capabilities) and what people are or are not doing (functions). The UNDP characterises such capabilities as those leading to a long, healthy, creative life and to a decent standard of living, freedom, dignity, self-respect and respect for others (Human development report, 1997, p 15). Non-physiological well-being is important to the poor themselves.
(4) Social exclusion approach. This refers to the relative lack of resources experienced by a specific social group which are required to participate fully in activities and enjoy living standards that are accepted widely in the society in question. It may result from social discrimination rather than being an artefact of poverty itself.
Source: NRSP, 2000

17
2.4.1 Poverty and livelihoods
Livelihood approaches lay emphasis on the capabilities of people, and associate poverty with the inability of people to develop their potential. Livelihood strategies are deemed successful when the quantity, quality and mix of assets available to a household (or individual) are sufficient to withstand adverse events without compromising future survival.
As discussed under vulnerability (section 2.2.3) the causes of poverty are thus linked to limited or limiting asset bases. At the household level this might include deficits in: human capital (e.g. ill health; insufficient labour, skills, education or training); physical capital (e.g. poor tools or equipment for production or processing; inadequate household goods and utensils; stocks - food, livestock, jewellry); financial capital (e.g lack of cash or savings; poor access to credit or insurance markets); natural capital (e.g. lack of access to productive land and other resources); and social capital. It is widely held that social capital in the form of networks, horizontal and vertical (patron/client) connections and groups, provides the trust, reciprocity and associated morality that enable people both to work collectively and access wider political and civic institutions. Lack of social capital might thus impede, access to and/or the sanctioned use of, a number of other resources (e.g. healthcare, officialdom, credit, land, CPRs, draught oxen).
Not only are livelihood strategies and options circumscribed by the availability and mix of household assets, but as suggested above they are also dependent upon resources associated with the community or supra-community level. These might include common pool resources (e.g. pasture, forest, water resources), general agro-ecological conditions, rural and rural-urban infrastructure including roads, schools, hospitals, clinics, marketplaces, communication and energy facilities). Furthermore access to these resources and involvement in the decision-making associated with securing such community level resources, are mediated by the wider set of policies, institutions and processes. Inadequacies or anomalies in prevailing social relations, institutions and governance at local levels may thus too play a contributory role in the causes of poverty.
2.4.2 Gender and other intra-household concerns
While the objectives of the project are framed in terms of understanding livelihood strategies at the household level, the overarching emphasis on poverty and the principled SL approach, require that some consideration also be given to exchanges within the household. Central to the critique of the use of the household as the unit for economic analysis, is its failure to take into account either the division of labour between men and women, both in productive and reproductive tasks, or the unequal access to and allocation of resources generally. Adequate food provision at the household level for example, does not necessarily amount to adequate food intake by all family members.
Alongside gender other identity or life-experience categories are often associated with discrimination and/or impoverishment. These may include sub-sections of the elderly, youth and children, disabled people, HIV/AIDS sufferers and others afflicted with poor health, alienated individuals such as ex-combatants. Ethnicity, which is often an influential factor at the household or supra-household level (e.g. displaced people, refugees, 'dissipated' clans or tribes), may also reflect negatively on alien individuals in otherwise homogenous households. Furthermore aspects of poverty such as discrimination which reflect sociological deprivation, tend to be overlooked by standard physiological poverty measures.
Laier et al (1996) identify several key themes linking gender to household food security and coping strategies. The most relevant they suggest relate to: conceptual issues about intra-household relations; resource and entitlement distribution; agricultural production, processing and exchange, social networks, nutritional status of women and children, policy impact and failure. Whether as
18
heads of household or members of households headed by men, many studies reveal that women are subject to institutionalised gendered inequalities. Access to land and other natural resources, to credit, extension information and inputs, marketing structures, labour saving technologies, to off-farm employment, and their inability to command labour, amongst other things, expose women to far greater risk of poverty (Laier et al, 1996: 4; Mbughuni, 1993: iv).
The bargaining model of the HH is used in much current day gender and development (GAD) thinking. Women however are weaker partners in bargaining over these resources, which in times of scarcity compromises their capacity to cope. They may pursue the same strategies as men, (e.g. income diversification, migration, borrowing) but they have different starting points. Limited access to resources, lower rates of pay and their reproductive duties tend to make women more vulnerable than men in normal times and in emergencies.
When the household is threatened with food insecurity, women usually assume (or are assigned) responsibility for securing additional resources. Recognition of the capacity of poor people in risk prone environments to cope with shocks and long-term vulnerability is not itself new. However far less has been recorded about the range of strategies open to and undertaken by women to ensure household survival in times of stress. Coping strategies may include: liquidating their own resources to increase overall household resources; access to, and calling upon kinship and other social networks; increased use of common pool resources; particular types of migration; and, a range of gender specific forms of off-farm and non-farm employment. Social networks are particularly important for women, as they provide assistance in juggling productive and reproductive roles, and/or access to seed resources necessary to diversify income sources.
The sequencing of coping is also gendered: women, who are usually responsible for children, adopt coping measures early on in a crisis, with men joining in only if initial attempts to cope prove insufficient and/or if the crisis intensifies. Children too are affected early on in the cycle, with girls often taking on women’s roles.
Policy impact and failure.
Much of the literature implicitly assumes that reinforcing indigenous coping strategies, in gender sensitive ways, is an inherently good thing. Yet in places where gender biases are particularly acute, tried and tested options for reinforcing coping may fail. “There is little specific analysis of how to reinforce coping strategies, especially regarding trade-offs between men and women” (Laier et al., 1996;12). This is partly because concrete examples of policy implementation are rare. Laier et al identify the following gaps in the literature: • Insufficient coverage of gender biases in non-agricultural livelihood systems. Bulk of the
literature is geared towards agricultural systems. Gender in dual livelihood systems is particularly important gap (e.g. how gendered are agro-pastoral systems with respect to the HH division of labour and resource entitlement?).
• Need for more longitudinal studies showing how gendered coping strategies change over time, including during periods of economic crisis and rehabilitation; and how gendered relations within the HH are renegotiated after periods of transition and crisis. Social networks in particular often undergo changes at such times.
• More detailed empirical studies of particular episodes of coping are required to be clear about the gender differences experienced.

19
Summary This section introduced the general framework and components - assets, strategies, outcomes and the modifying and contextual factors - associated with sustainable livelihood approaches. Various livelihood classification typologies were presented, with a distinction being drawn between those typologies based on the nature of activities undertaken, and those reflecting motivational factors or the disposition of the decision-maker. Sustainability in the context of livelihoods was defined, and attention drawn to the difficulties in linking this with concerns for the sustainability of the wider natural resource base. Strategic considerations about the use of livelihood approaches to effect rural poverty reduction were discussed. Different concepts - dimensions - of poverty were introduced and the difficulties associated with identifying suitable indicators and measuring poverty, flagged. The causes of impoverishment from a livelihood perspective were delineated. These included both deficits associated with the quantity, quality and mix of household or individual assets and their impact on capabilities, and those constraints resulting from the mediating environment. Finally, while the household is the prevailing unit of analysis, reference was made to the implications of gender at the household level (i.e. female-headed households), and of gender and other identity categories (e.g. ill-health, disability, age) at the intra-household level.


21
3. CHARACTERISTICS OF SEMI-ARID AREAS OF TANZANIA
3.1 Introduction This section identifies Tanzania's semi-arid lands, the focus area for this study, and discusses some of the factors that distinguish semi-arid Tanzania from other parts of the country. The most recent countrywide surveys of poverty - both quantitative and qualitative - are reviewed, and the nature of poverty at district level, and for household groups at different locations throughout the central semi-arid zone, presented. Clearly semi-arid areas are drier than most of the rest of Tanzania, but there are many other important differences. These factors are likely to be just as important in shaping livelihood strategies or natural resource management practices; this section provides some of the background for subsequent discussion of these issues.
3.2 Where are the semi-arid lands in Tanzania? The definition of arid and semi-arid areas in Tanzania is acknowledged to be problematic (Boesen et al., 1996; Mascarenhas, 1995). Several different definitions are in use (see Box 3.1 for further details). This study has utilised the agro-ecological classification published by ODA/NRI (LRDC 1987; NRI 1991; NRI 1996). This classification identified two distinct semi-arid resource zones in Tanzania, one in the central part of the country and one in the south-east (see Map 3.1). Rainfall throughout both areas is uni-modal5, most usually falling within the December to March period. Importantly, rainfall in the central zone (500 to 800 mm per year) is less reliable that that in the south eastern zone (600 to 800 mm).
Box 3.1 Definitions of semi-arid lands in Tanzania • Tanzania’s mainland has been characterised variously between seven and nine major
physiographic regions. These include: I. coast; II. arid lands; III. semi-arid lands; IV. plateaux; V. southern and western highlands; VI. northern highlands and; VII. alluvial plains.
• Mascarenhas (1995) remarks that depending on the criteria used, one estimate shows the Tanzanian drylands as covering between 25% and 75% of the country and another between 45% and 75%.
• The Renewable Natural Resources Research Strategy (RNRRS), published in 1994 by ODA, defines a semi-arid production system as being found in: “regions where the mean monthly temperature is above 18 degrees centigrade and where there is one or more season during which evapotranspiration exceeds precipitation. Although the mean annual rainfall is in the range 400 – 1,200 mm, lack of water is a major constraint to production”. Under this very broad definition, it is suggested that 80-90 percent of Tanzania would be considered semi-arid (Bourn and Blench, 1999: 7).
• HTS (1999) notes that overall, semi-arid lands occupy a third of the country and are used by 20 – 30% of the population. The World Bank gives a lower figure in terms of area, giving an estimate of 21.1 million hectares for both semi-arid and arid land taken together (World Bank: 1994: 14), equating to about 22% of the total land area.
5 With the exception of the northern periphery of the central zone, which may experience a bimodal distribution pattern.
22
• The semi-arid lands were delineated by ODA / NRI in relation to Tanzania’s administrative regions (LRDC 1987; NRI 1991; NRI 1996). This classification has been used widely by the World Bank amongst others (World Bank 1994: II).

23
Map 3.1 (PAR-Annex1-Map3.1)
24
Areas with rainfall less than about 500 mm or greater than 800 mm have been excluded from this study. Consequently the adjacent arid areas in the north of Tanzania (that might be termed semi-arid in some other classifications), predominantly Arusha Region, are not considered. This precludes consideration of those overlapping livelihood configurations that have evolved in these drier areas. Notable these include important aspects associated with the seasonal migration of the Maasai, and the changing balance between cattle keeping and cropping along the semi-arid/arid continuum.
3.2.1 Central semi-arid zone
The central semi-arid zone overlaps eight regions including much of Shinyanga, Singida and Dodoma, and less of Mwanza, Arusha, Tabora, Iringa and Mbeya. The zone is a plateau between 1000 and 1500m in altitude consisting of gently undulating plains with some rocky hills and low scarps associated with the formation of the rift valleys. The soils include well-drained sands of low fertility on the uplands and alluvial hardpan and salt affected soils in shallow internal drainage areas of the eastern and Lake Eyasi rift valleys. Extensive flat plains in the north, around Shinyanga, are covered by black cracking clays formed in an old lakebed.
The main rainy season is from December to March with between 70 and 90 days of rain per year (500 to 800 mm total). The bimodal rainfall mode associated with the north-eastern highlands and the Lake Victoria basin only touches northern areas of the central zone. Rainfall tends to be unreliable with almost all areas being drought prone (see box 3.2 and 3.8).
Soil erosion and bush encroachment in parts of this zone have been a growing concern since the late 1920s. Cultivation practices, deforestation and overgrazing have been identified as the major causes of soil degradation (Dejene et al, 1997).
3.2.2 South-eastern semi-arid zone
The south-eastern zone includes much of Morogoro region, except for the Kilombero and Wami baisins and the Uluguru mountains, the central half of Lindi, western quarter of Mtwara, and eastern tip of Ruvuma and a small part of Coast region. It is low lying at between 200 and 600m above sea level. Topography is characterised by flat or gently undulating plains with some rocky hills and strongly dissected areas. The soils in the south and around Morogoro are moderately fertile loams and clays, whilst those in the centre are infertile sands. Rainfall for this zone is lowest in the centre of the zone (around 600 mm per year) rising towards the north and south (to around 800 mm per year).
3.2.3 Secondary data used in this study
Most statistical data for Tanzania are available for administrative regions, usually at regional level and less often at district level. As may be expected there is little correlation between regional boundaries and agro-ecological zones. The region of Arusha for example, includes the high-potential lands on the slopes of Mount Meru as well as semi-arid and arid lands on the Maasai steppe. Regional level data are consequently of little value in describing the characteristics of semi-arid Tanzania. Wherever possible therefore this study has attempted to utilise district level data. Unfortunately regional data have sometimes been all that was available, to the predictable detriment of ascertaining both baseline information and trends.
Box 3.2 Erratic rainfall Responses to a livelihood security assessment in Shinyanga in 1995 suggested the rainfall had been erratic for at least a decade, and identified the years 1984, 1992 and 1994 as being particularly bad.
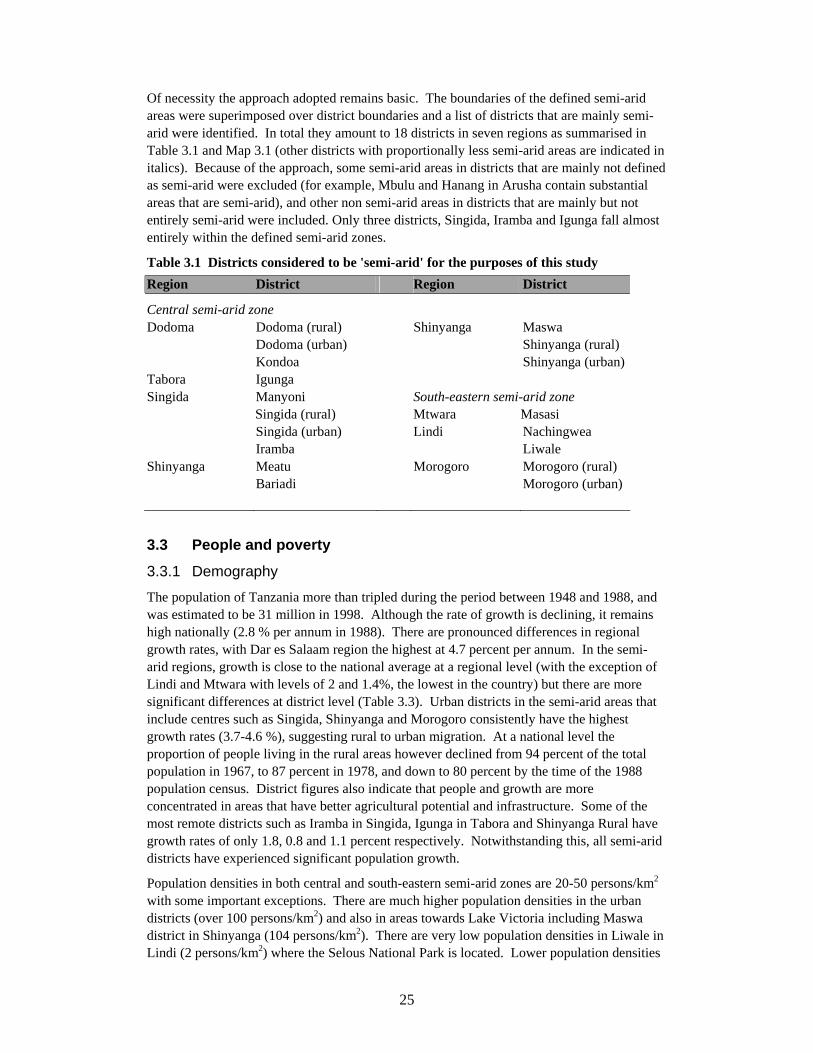
25
Of necessity the approach adopted remains basic. The boundaries of the defined semi-arid areas were superimposed over district boundaries and a list of districts that are mainly semi-arid were identified. In total they amount to 18 districts in seven regions as summarised in Table 3.1 and Map 3.1 (other districts with proportionally less semi-arid areas are indicated in italics). Because of the approach, some semi-arid areas in districts that are mainly not defined as semi-arid were excluded (for example, Mbulu and Hanang in Arusha contain substantial areas that are semi-arid), and other non semi-arid areas in districts that are mainly but not entirely semi-arid were included. Only three districts, Singida, Iramba and Igunga fall almost entirely within the defined semi-arid zones.
Table 3.1 Districts considered to be 'semi-arid' for the purposes of this study Region District Region District
Central semi-arid zone Dodoma Dodoma (rural) Shinyanga Maswa Dodoma (urban) Shinyanga (rural) Kondoa Shinyanga (urban) Tabora Igunga Singida Manyoni South-eastern semi-arid zone Singida (rural) Mtwara Masasi Singida (urban) Lindi Nachingwea Iramba Liwale Shinyanga Meatu Morogoro Morogoro (rural) Bariadi Morogoro (urban)
3.3 People and poverty
3.3.1 Demography
The population of Tanzania more than tripled during the period between 1948 and 1988, and was estimated to be 31 million in 1998. Although the rate of growth is declining, it remains high nationally (2.8 % per annum in 1988). There are pronounced differences in regional growth rates, with Dar es Salaam region the highest at 4.7 percent per annum. In the semi-arid regions, growth is close to the national average at a regional level (with the exception of Lindi and Mtwara with levels of 2 and 1.4%, the lowest in the country) but there are more significant differences at district level (Table 3.3). Urban districts in the semi-arid areas that include centres such as Singida, Shinyanga and Morogoro consistently have the highest growth rates (3.7-4.6 %), suggesting rural to urban migration. At a national level the proportion of people living in the rural areas however declined from 94 percent of the total population in 1967, to 87 percent in 1978, and down to 80 percent by the time of the 1988 population census. District figures also indicate that people and growth are more concentrated in areas that have better agricultural potential and infrastructure. Some of the most remote districts such as Iramba in Singida, Igunga in Tabora and Shinyanga Rural have growth rates of only 1.8, 0.8 and 1.1 percent respectively. Notwithstanding this, all semi-arid districts have experienced significant population growth.
Population densities in both central and south-eastern semi-arid zones are 20-50 persons/km2 with some important exceptions. There are much higher population densities in the urban districts (over 100 persons/km2) and also in areas towards Lake Victoria including Maswa district in Shinyanga (104 persons/km2). There are very low population densities in Liwale in Lindi (2 persons/km2) where the Selous National Park is located. Lower population densities

26
are associated with tsetse infested areas, and with protected areas where residence is technically not permitted (NRI, 1996; LRDC, 1987; World Bank, 2000). The populations in both zones also embrace a great deal of ethnic and cultural diversity (Box 3.3).
3.3.2 Poverty indicators
Several large-scale sample surveys have been conducted in Tanzania over the years. Reviewing poverty research in 1994 however, Cooksley observes that apart from general agreement that it is widespread, and particularly in the rural areas, the information on poverty in Tanzania is patchy and inconsistent. On the incidence and trends in poverty, most of the studies covered in his survey fall into "diametrically opposed conclusions on major issues such as the depth and spatial distribution of poverty, its inter- or intra-community nature, and the impact of economic crisis and adjustment policies on various income and occupational groups" (Cooksley, 1994).
Box 3.3 Ethnicity and semi-arid lands Ethnicity has strong implications for the culture and livelihoods of people living in Tanzania's semi-arid lands. However there are intermarriages between people of different ethnic group. Intermarriage to some extent reduces the strength of some cultural issues but extends the boundaries of social networks. Major ethnic groups living in central semi-arid areas, include, Wagogo, Wamasai, Wafyomi, Wamangati Wabarbaig, and Wasukuma, which are traditionally pastoralists or agro-pastoralists. Other ethinic groups which are traditionally agriculturalists include Wanyamwezi, Warangi, Wanguu, Wazigua, Wakaguru, Wambulu Watatoga, Wasandawe, Wanyiramba, Wanyaturu, Wakimbu, Waisanzu, Wataturu, and Wadzebe. In the South-eastern semi arid areas the main ethnic groups are the Wamwera, Wangindo, Wamakonde, and Wamatumbi.
Source: URT (1997)
During the 1990’s a number of further assessments have been made, of both a quantitative and qualitative nature. In 1995 the Government of Tanzania, the University of Dar es Salaam, and the World Bank conducted a Participatory Poverty Assessment (PPA) amongst 6,000 people in 87 villages across Tanzania (see Narayan, D., 1997, Voices of the Poor). The World Bank has also re-analysed data from the 1993 Human Resource Development (HRD) survey (World Bank, 2000). Two recent studies funded by DFID, were tasked with developing and updating a poverty baseline in Tanzania from existing data (URT, 2000a&b). They conclude that in 1992 27 percent of the population lived below the food poverty line and 48 percent below the basic needs poverty line - this figure was revised upwards in the second study to 56 percent; poverty is inherently a rural phenomenon; Tanzania is essentially an unequal society with the best-off 20 percent having expenditure levels nearly 10 times that of the poorest; and, that the economy will need to grow by 7.5 percent for 23 years and by 9.7 percent for 15 years if poverty reduction targets are to be met. Growth throughout the 1990s was 3.5 percent per annum.
The distinguishing characteristics of rural poverty as identified by the PPA were location-specific with clear regional (agro-ecological) differences (Narayan, 1997; 9). Both economic/consumption indicators associate with physiological deprivation, and people's subjective experience of oppressive social realities, were represented. They included: minimal agricultural inputs; inadequate or infrequent food for the household; lack of productive land close to village centres; insufficient access to health and education; lack of power over decisions; dependency; disability; and discrimination against women-headed households. Despite the fact that it is seemingly plentiful in Tanzania, land (though mostly in

27
the sense of area cultivated) was most often the first characteristic mentioned in defining wealth categories. Furthermore the incidence of landlessness amongst poorer groups was increasing in high potential areas; noticeably in villages adjacent urban centres, in the vicinity of large estates (e.g. sisal estates in Tanga), or with good road access to markets (Narayan, 1997). Interestingly, Narayan reports that:
“Despite the local and regional differences in poverty descriptions, the overall estimate for rural poverty in Tanzania was strikingly similar between the PPA data (50.3%) and a poverty line (based on the headcount index with the poverty line set at 114,187 shillings) derived from the HRD survey (49.7%)”.
The conclusions of the World Bank's re-analysis of the HRD survey were that the highest incidence of poverty is found in the regions of Rukwa, Kigoma, Dodoma, Mtwara and Singida. These regions are either remote (Rukwa, Kigoma and Mtwara) or semi-arid (Dodoma and Singida), or of course, both. The Bank also concludes that the highest levels of rural poverty are found in Dodoma, Singida, Mtwara, Lindi and Ruvuma. (WorldBank: 2000: 99). Table 3.2 below presents the rural figures.
Using these admittedly broad aggregates then, it appears that the semi-arid focus taken by this paper roughly coincides with those areas where rural poverty seems to be greatest (at least in 1993 – the most recent year for which figures are available). This position is reiterated by Bagachwa (1997: 138) who observes that poverty is severe in regions with unreliable rainfall, poor infrastructural development and poor access to markets, citing in particular Dodoma, Lindi, Kigoma, Singida, Rukwa and Ruvuma.
Table 3.2 The extent of rural poverty in Tanzania (1993 figures) Zone Incidence of poverty* Northern highlands 39 Coastal zone 40 Lake zone 43 Southern highlands 48 Southern zone (Lindi, Mtwara, and Ruvuma) 65 Central zone (Dodoma and Singida) 72 Total 49
* % of households below the 40th percentile expenditure point; Source: WorldBank: 2000: Table 6.7 In 1999 however, an attempt was made by the Vice President’s Office (URT, 2000) to calculate a composite deprivation index for regions in Tanzania. The constituent indicators included food security, income and production, education, and health and nutrition services. The results suggest that Dodoma, Kagera, Lindi, Kigoma and Coast are the most deprived regions, with Dar es Salaam, Ruvuma, Kilimanjaro, Singida and Tabora the least deprived. The position of both Singida and Ruvuma by this analysis has now been reversed. Whether this is down to the incorporation of Ruvuma with two other regions in the first case, or limitations with the weighting in the second study, is unfortunately unclear. This serves to reinforce the reservation expressed by Cooksley and quoted above.
District-level indicators
Selected indicators of poverty at district level, taken from published government statistics, are summarised in Table 3.3. Some of the key findings are:

28
• estimated food consumption in the 'semi-arid districts' is below the national average, 293.5 kgs (cereal equivalent) compared to 323 kgs. The lowest estimates are for Liwale in Lindi Region (126kgs), Dodoma rural (156kgs) and Singida rural (193 kgs).
• primary school enrolement in 'semi-arid districts' is just below the national average (75% compared to 77%). Enrolment is at or below 70% in Liwale (Lindi), Dodoma rural (only 57%), Manyoni (Singida), Igunga (Tabora) and Shinyanga rural.
• under-five mortality rates in 'semi-arid districts' are just below the national average (180 deaths/ 1000 persons compared to 191). Most of the worst rates are for the urban districts in semi-arid areas (Morogoro, Singida and Shinyanga urban districts) where rates are around 140-50 persons/1000. Singida (rural) has the highest under-five mortality rate at 140 deaths/1000).
• nutrition indicators are poor where data are available. The numbers of severely and moderately underweight children exceed 30% in most of the semi-arid districts where data are available.
• infrastructure provision is severely limiting. Road densities are often below 0.10 (km/ km2) with the least developed networks in Morogoro rural, Manyoni (Singida), Igunga (Tabora) and Shinyanga urban districts.
Box 3.4 No land or cattle: findings from a PRA study in Shinyanga In 1995 nine villages in the drought-prone districts of Meatu, Maswa and Bariadi, Shinyanga region, and six villages in the Mwanza districts of Magu and Kwimba were visited as part of a rapid rural livelihood security assessment. The major criteria community focus groups used to identify relatively rich, middle and poor households revolved around ownership of and access to agricultural land and livestock, specifically cattle. A typical household in Shinyanga region cultivates less than five acres (2 ha.) and owns fewer than ten cattle. In Mwagimagi village, Bariadi district, 100 out of 160 households (62.5%) were functionally landless - owning less than an acre of homestead land. Similarly in Mwamalole village in Meatu district, 25 out of 63 households interviewed (~40%) had access to less than an acre of land, while almost 60 percent of all households (191 of 325) had no cattle. Other stratification criteria identified by villagers included employment, possession of farming equipment, the nature of house owned, agricultural education, shop ownership, and ownership of milling machines. Poorer households are perceived as being denied the trading opportunities undertaken by the wealthy.
(Source: CARE, 1995)
Findings from participatory rural appraisal studies
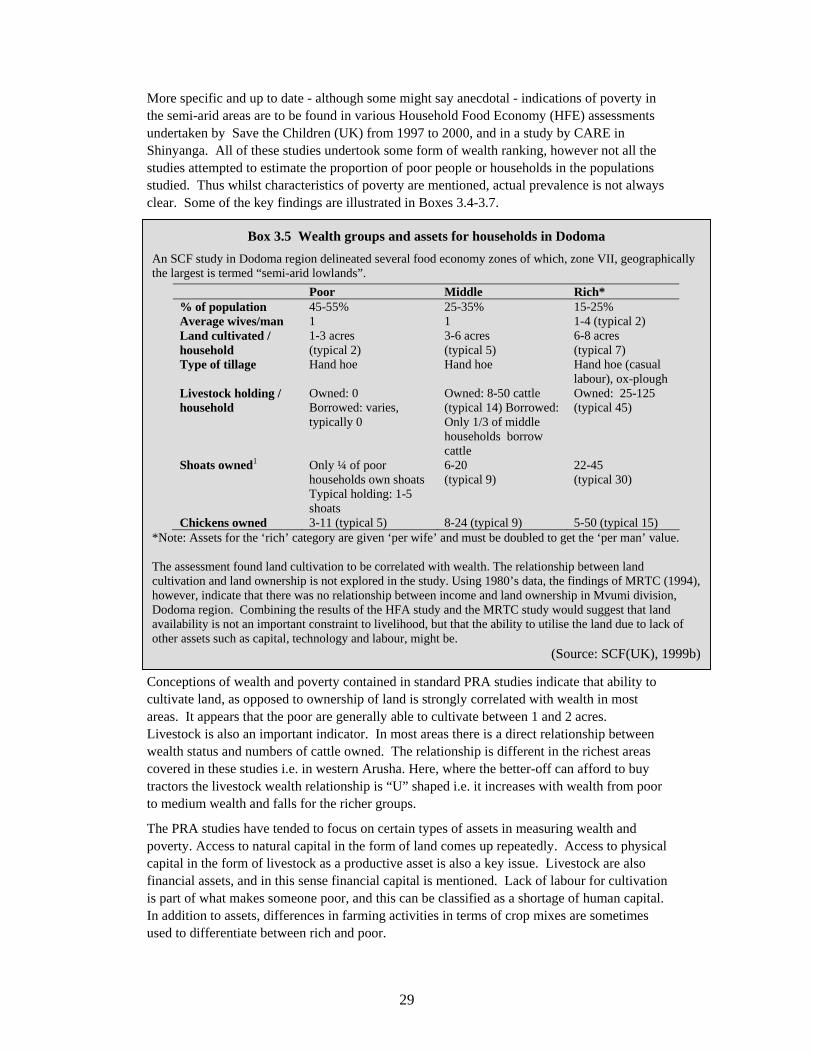
29
More specific and up to date - although some might say anecdotal - indications of poverty in the semi-arid areas are to be found in various Household Food Economy (HFE) assessments undertaken by Save the Children (UK) from 1997 to 2000, and in a study by CARE in Shinyanga. All of these studies undertook some form of wealth ranking, however not all the studies attempted to estimate the proportion of poor people or households in the populations studied. Thus whilst characteristics of poverty are mentioned, actual prevalence is not always clear. Some of the key findings are illustrated in Boxes 3.4-3.7.
Conceptions of wealth and poverty contained in standard PRA studies indicate that ability to cultivate land, as opposed to ownership of land is strongly correlated with wealth in most areas. It appears that the poor are generally able to cultivate between 1 and 2 acres. Livestock is also an important indicator. In most areas there is a direct relationship between wealth status and numbers of cattle owned. The relationship is different in the richest areas covered in these studies i.e. in western Arusha. Here, where the better-off can afford to buy tractors the livestock wealth relationship is “U” shaped i.e. it increases with wealth from poor to medium wealth and falls for the richer groups.
The PRA studies have tended to focus on certain types of assets in measuring wealth and poverty. Access to natural capital in the form of land comes up repeatedly. Access to physical capital in the form of livestock as a productive asset is also a key issue. Livestock are also financial assets, and in this sense financial capital is mentioned. Lack of labour for cultivation is part of what makes someone poor, and this can be classified as a shortage of human capital. In addition to assets, differences in farming activities in terms of crop mixes are sometimes used to differentiate between rich and poor.
Box 3.5 Wealth groups and assets for households in Dodoma An SCF study in Dodoma region delineated several food economy zones of which, zone VII, geographically the largest is termed “semi-arid lowlands”.
Poor Middle Rich* % of population 45-55% 25-35% 15-25% Average wives/man 1 1 1-4 (typical 2) Land cultivated / household
1-3 acres (typical 2)
3-6 acres (typical 5)
6-8 acres (typical 7)
Type of tillage Hand hoe Hand hoe Hand hoe (casual labour), ox-plough
Livestock holding / household
Owned: 0 Borrowed: varies, typically 0
Owned: 8-50 cattle (typical 14) Borrowed: Only 1/3 of middle households borrow cattle
Owned: 25-125 (typical 45)
Shoats owned1 Only ¼ of poor households own shoats Typical holding: 1-5 shoats
6-20 (typical 9)
22-45 (typical 30)
Chickens owned 3-11 (typical 5) 8-24 (typical 9) 5-50 (typical 15) *Note: Assets for the ‘rich’ category are given ‘per wife’ and must be doubled to get the ‘per man’ value. The assessment found land cultivation to be correlated with wealth. The relationship between land cultivation and land ownership is not explored in the study. Using 1980’s data, the findings of MRTC (1994), however, indicate that there was no relationship between income and land ownership in Mvumi division, Dodoma region. Combining the results of the HFA study and the MRTC study would suggest that land availability is not an important constraint to livelihood, but that the ability to utilise the land due to lack of other assets such as capital, technology and labour, might be.
(Source: SCF(UK), 1999b)

30
Whilst these studies illuminate certain aspects of poverty, it is clear that many issues remain under or unexplored. Important questions relate to power structures, political voice, the role of social capital, feelings of insecurity and the differences that ethnicity, lineage, gender and age make to poverty status and dynamics. These factors have important implications for livelihood options and strategies and are explored to some extent in later sections of this report.
Poverty and less favoured areas classification
As above, from a bio-physical perspective, the central semi-arid areas are associated with low and uncertain rainfall, and in many parts with poor soils, limited potential or degraded environments. On the socio-economic front, large tracts of these areas have minimal infrastructural development, offering only poor access for people to markets, health and educational facilities, safe water resources etc. We have used a variation of the matrix proposed by IFPRI in which favoured and less favoured areas are classified according to levels of bio-physical and socio-economic constraint, to group the case studies used in this project. While this does not represent poverty per se, in those locations where both natural and man-made resources are minimal, already impoverished groups will become even more vulnerable. Table 3.4 maps out some of the case study areas against high, medium and low ratings for bio-physical and socio-economic factors.
Box 3.6 Rich and poor: wealth ranking in Singida Wealth grouping criteria were based on group interviews undertaken in 49 villages in 1998. The region was divided into 12 food economy zones1, of which 4 are described in the HFE report. Together these 4 represent about 75% of the region’s population outside the urban or peri-urban areas and 237 out of 346 villages1. The largest of the zones is the so-called Zone VII: Singida central sandy plains. This zone is described in the report as semi-arid, and falls within the central semi-arid zone depicted in Map 3.1. Wealth ranking in this zone produced the following outcomes:
Wealth group Livestock Land cultivated Very poor Might have chickens, don’t own or borrow
any other 2 acres
Poor Borrow 5 cattle, might have 1 lactating cow 2-3 acres Lower middle Both own and borrow cattle (about 5-7 in
total) own 5-7 shoats; 1 lactating cow 3-4 acres
Middle Own 10 cattle, own 10 shoats; 2 lactating cows
4 acres
Rich Own 30 cattle (15 of which are loaned to other groups); 3 lactating cows
7 acres
This classification excludes a few very rich individuals “who can own more than 1000 cattle”.
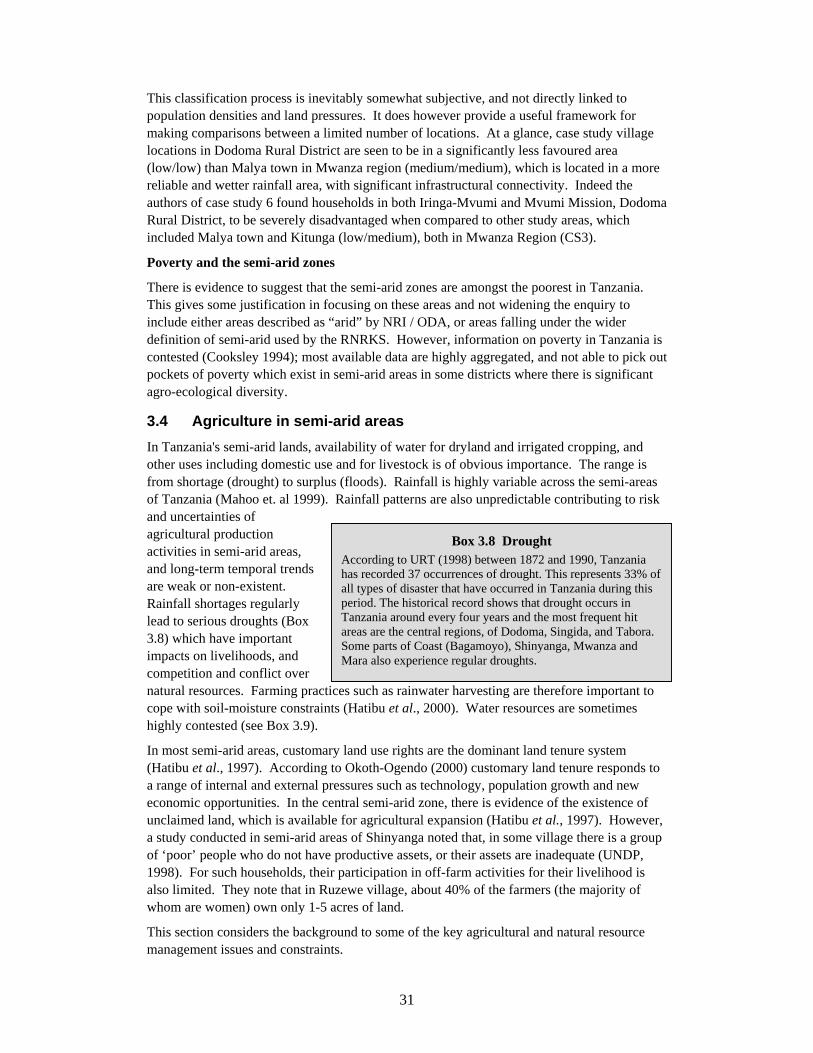
31
This classification process is inevitably somewhat subjective, and not directly linked to population densities and land pressures. It does however provide a useful framework for making comparisons between a limited number of locations. At a glance, case study village locations in Dodoma Rural District are seen to be in a significantly less favoured area (low/low) than Malya town in Mwanza region (medium/medium), which is located in a more reliable and wetter rainfall area, with significant infrastructural connectivity. Indeed the authors of case study 6 found households in both Iringa-Mvumi and Mvumi Mission, Dodoma Rural District, to be severely disadvantaged when compared to other study areas, which included Malya town and Kitunga (low/medium), both in Mwanza Region (CS3).
Poverty and the semi-arid zones
There is evidence to suggest that the semi-arid zones are amongst the poorest in Tanzania. This gives some justification in focusing on these areas and not widening the enquiry to include either areas described as “arid” by NRI / ODA, or areas falling under the wider definition of semi-arid used by the RNRKS. However, information on poverty in Tanzania is contested (Cooksley 1994); most available data are highly aggregated, and not able to pick out pockets of poverty which exist in semi-arid areas in some districts where there is significant agro-ecological diversity.
3.4 Agriculture in semi-arid areas In Tanzania's semi-arid lands, availability of water for dryland and irrigated cropping, and other uses including domestic use and for livestock is of obvious importance. The range is from shortage (drought) to surplus (floods). Rainfall is highly variable across the semi-areas of Tanzania (Mahoo et. al 1999). Rainfall patterns are also unpredictable contributing to risk and uncertainties of agricultural production activities in semi-arid areas, and long-term temporal trends are weak or non-existent. Rainfall shortages regularly lead to serious droughts (Box 3.8) which have important impacts on livelihoods, and competition and conflict over natural resources. Farming practices such as rainwater harvesting are therefore important to cope with soil-moisture constraints (Hatibu et al., 2000). Water resources are sometimes highly contested (see Box 3.9).
In most semi-arid areas, customary land use rights are the dominant land tenure system (Hatibu et al., 1997). According to Okoth-Ogendo (2000) customary land tenure responds to a range of internal and external pressures such as technology, population growth and new economic opportunities. In the central semi-arid zone, there is evidence of the existence of unclaimed land, which is available for agricultural expansion (Hatibu et al., 1997). However, a study conducted in semi-arid areas of Shinyanga noted that, in some village there is a group of ‘poor’ people who do not have productive assets, or their assets are inadequate (UNDP, 1998). For such households, their participation in off-farm activities for their livelihood is also limited. They note that in Ruzewe village, about 40% of the farmers (the majority of whom are women) own only 1-5 acres of land.
This section considers the background to some of the key agricultural and natural resource management issues and constraints.
Box 3.8 Drought According to URT (1998) between 1872 and 1990, Tanzania has recorded 37 occurrences of drought. This represents 33% of all types of disaster that have occurred in Tanzania during this period. The historical record shows that drought occurs in Tanzania around every four years and the most frequent hit areas are the central regions, of Dodoma, Singida, and Tabora. Some parts of Coast (Bagamoyo), Shinyanga, Mwanza and Mara also experience regular droughts.

32
Box 3.7 Wealth groups in Arusha In Arusha the separate agricultural economy zones identified were: • Karatu wheat belt • Mid-altitude Hanang-Babati • Central-South Mbulu • Eastern Mbulu The new settlements (Karatu wheat belt and part of mid-altitude Hanang-Babati), are experiencing less land pressure, lower population densities, and higher fertility than the old settlements. As in Dodoma, the amount of land cultivated appears to be a fairly reliable indicator of wealth classification, however, the role of livestock is less consistently related to wealth in the better off food economy zones. In the Arusha report, the land cultivation is seen to be so central to wealth, that the terms “poor” “medium” and “rich” are dispensed with altogether, and replaced with variations on “2 acre households”, “5 acre households”, “20 acre households”, for each zone.
The better-off areas are the Karatu wheat belt and mid-altitude Hanang-Babati. Here livestock tends to increase in proportion to land cultivated up to the point when tractors are rented, after which it starts reducing to just a few milk cows for the rich. The report states that most of the poorest households are young families recently in receipt of small pieces of land, or old people not able to cultivate so much. Female-headed households are said to exist throughout the wealth spectrum.
Wealth ranking for Karatu wheat belt Land cultivated Crops Labour Group 1 1 – 2 acres Maize and beans (some pumpkins
perhaps) Exchange labour for use of ox-plough
Group 2 3 acres Maize, beans, pumpkins and wheat Use their own oxen / Exchange labour for use of ox-plough
Group 3: 4 – 10 Maize, beans, finger millet, wheat, barley
Use their own oxen
Group 4: 10 plus Maize – to totally cover household needs, beans, pigeon peas, barley, finger millet and wheat
Rent tractors and those above 30 acres own tractors.
Derived from SCF(UK) (1999c: 49-50). In the eastern parts of these agricultural zones, as wealth increases the numbers of livestock increase. This reflects the fact that these areas are poorer and thus even the richer village households are unable to afford to rent or purchase tractors. This is illustrated with the following table showing wealth rankings from Mbulu south-central. Wealth categorisation for central-south Mbulu Household Cattle Small ruminants Crops Demographics 1 – 2 acre A few (if any)
owned. Access to milk and manure through loaning
Own 5 –10 shoats – a bank account, drawn down when cash is required.
Maize and beans Tend to be young couples who have yet to establish themselves*.
3 – 6 acres Own 5 – 10 cows Own 10 – 20 shoats
M&B plus sorghum, finger millet sunflower
10 – 20 acres Own 30 – 60 cows Own 30 – 60 shoats
As above
Eastern Mbulu is poorer than the central-south Mbulu zone. Here, the richest households own 3-4 acres and cultivate additional land in the lower central-south zone also. A positive correlation exists between land cultivation and livestock ownership, but even the richest households generally own no more than 5 cattle.

33
3.4.1 Farming systems
Tanzania possesses the most varied ecology of any country in Africa (Coulson 1982: 6). Unsurprisingly there are many classifications of farming systems in Tanzania6. Farming systems are based on a complex combination of factors that include agro-ecology, cultivation intensity, levels of technology and linkages to the cash economy. The zones themselves are also subject to change over time, which may account for some of the difference of opinion over their relationship to agro-ecology. Recent studies agree that there the smallholder farming systems can be grouped into six main categories7: • Coffee/cashew/cotton system; • Pastoralist and agro-pastoralist systems; • Livestock-sorghum-millet-cotton-rice system; • Maize-legumes system; • Coffee-banana-horticulture system, and; • Wetland rice-sugar cane system. The farming systems of the central and south-eastern semi-arid zones are significantly different and are best considered separately.
Central semi-arid zone
Only two of these major systems overlap with the central semi-arid lands. The livestock-sorghum-millet-cotton-rice system occurs predominantly in Sukumuland (Shinyanga and Mwanza) in the north. Food production is based on the drought resistant cereals – sorghum and millet – while farmers also produce cotton, oilseeds, maize and rice for the market. Rice is a major cash crop of growing importance. Other crops include groundnuts and bambara nuts. Cattle are the most important livestock, and help to maintain soil fertility on farm plots close to homesteads. Traditionally no fertiliser was applied to cotton, but pesticides were used. In recent years the removal of input subsidies has substantially increased the prices of farm inputs. While this system is prevalent in those areas where bimodal rainfall patterns are found – only in the far northern parts of the central zone – there is evidence that a variation of this system is found throughout the central zone8.
The pastoral and agro-pastoral production system is also associated with the central semi-arid area and adjacent drylands. Generally the economic importance of livestock to household
6 The National Coordinating Unit of the Department of Research and Development of the Ministry of Agriculture and Cooperatives identified 66 Farming Systems. 7 Food Studies Group (1992), Agricultural Diversification and Intensification Study, which in turn draws on material from URT and FAO (World Bank, 1994). 8 NRI (1996) regards the livestock / sorghum/ millet / cotton / rice zone as “corresponding to the larger part of the semi-arid zone” (Op. Cit.: 18), whereas the World Bank argues that “this system is prevalent in Shinyanga and Mwanza regions at the north of the Plateaux and the Northern Highlands (zones IV [central plateux] and V [Ufipa Plateau])”(World Bank 1994:16).
Box 3.9 Increasing competition for water resources In recent years, competition for water and water resources management as a response has become increasingly an important issue in Tanzania. Major water users like irrigated agriculture and hydropower generation have implemented development programmes independently resulting in competition and conflict. Development of small-scale 'run-of-river' irrigation is important to rural livelihoods and has considerable potential to increase dramatically. In the Pangani and Rufiji catchments, demand for water for irrigation, livestock, domestic use and industry has led to conflict between upstream irrigators and downstream hydro-power generation.

34
incomes rises as rainfall declines. This continuum is typified in practice by dependence being near total in the most arid regions, through to agro-pastoralists – or agriculturalists – primarily dependent on drought resistant staples, and for whom livestock are valued but play a minor economic role. Swift (1988) gives the following definitions of pastoralism and agro-pastoralism:
“pastoral production systems are those in which 50% or more of household gross revenue (i.e. the total value of marketed production plus the estimated value of subsistence production consumed within the household) comes from livestock or livestock-related activities (for example caravan trading), or where more than 15% of household food energy consumption consists of milk or milk products produced by the household. An “agro-pastoral” production system is one in which more than 50% of household gross revenue comes from farming, and 10 – 50% from pastoralism9”.
Box 3.10 Pastoral groups in Tanzania Estimates of the number of pastoralists in Tanzania vary between 0.3 and 0.5 million. The main pastoral groups are the Maa speaking groups e.g. the Maasai and the Ilparakuyo (Baraguyu, Wakwavi or Kwavi), numbering about 200,000 people in the North; and the Dagota (Barabaig) numbering up to 100,000 in the North West. Maasai inhabit large tracts of savannah grassland in the Rift Valley, an area of about 100,000 sq. km on both sides of the Kenya and Tanzania border. From the colonial period onwards, very large parts of their traditional lands have been taken by agriculture and the tourist industry, with establishment of national reserves and game parks. Total Maasai population has been estimated at 300,000 - 200,000 of whom are in Tanzania (Bonfiglioni: 1992). Maasailand and its inhabitants are divided into some twenty territorial sections (“olosho”) with more or less defined borders. Within the section, people are free to exploit pasture and water resources. The main sections in Tanzania are Kisongo, Siringet and Salei. Maasai reside in large scattered settlements of neighbouring units (called “enkang”) comprising several families. These settlements are temporary. The majority of Maasai are pastoralists and depend on their animals for existence. They herd mainly cattle (Zebu), and small ruminants. Some of the Maasai cultivate small plots of land for food crops. The Barabaig are the largest section within a larger grouping of Highland Nilotes called Datoga (or Tagota). Many of the Tagota groups are now scattered over central and northern Tanzania, and have been assimilated by Bantu groups. History of the Iraqw and the Barabaig has been inseparable since 1890’s. Competition over land led to clashes between the 2 groups in 1988 for example. Stock raiding led to tensions in the 1980s. Barabaig now consider the Hanang plains to be their territory divided north / south by the rift valley escarpment. Pressure on land has led to migration to Singida, Dodoma, Shinyanga, Tabora, Mara and other districts of Arusha region. They could number as many as 100,000 with 30 – 50,000 in Hanang district. The economy is based on cattle production, but only the wealthiest cattle owners can survive on a purely pastoral diet. Agricultural activities (maize cultivation) make a big contribution to nutrition. Grain is obtained through exchange or sale of livestock and from shifting cultivation by households with the help of communal labour provided by relatives and neighbours. A seasonal grazing rotational system is practised, which includes migration up and down the rift valley wall and congregation near permanent water in the dry season. There are various institutions in Barabaig society to regulate and control access and use of
9 Nomadism should be viewed as but one among many of the major productive techniques employed by most pastoral societies.
35
land. Adult males constitute a public assembly that through common decisions has authority on common property rights. At clan level, a clan council controls all clan property and wells; at neighbourhood level, a neighbourhood council allows individuals to come and live in a neighbourhood. A set of sanctions, fines and punishment serves to support regulations. (Annex 3: 48-49). Opinions differ as to the precise relationship between the livelihoods spectrum of pastoralist, agro-pastoralist and agriculturalist (Bourn and Blench, 1999). Tsetse infestation means that significant areas are ungrazed.
For a discussion of the main pastoral groups see Box 10. Ndagala (1998) and Bonfiglioli (1992) agree that in the mid-80’s Tanzania had 13 – 14 million head of cattle, the second largest national cattle herd in Africa, with goats and sheep around 11 million. In the mid – late 1980’s, pastoral areas were subjected to a wave of stock raiding which left hundreds of people dead and thousands of cattle and small-stock unaccounted for (Ndagala 1998). During the country’s economic crisis in the same period, many animals died of disease because of the lack of cattle dipping facilities. The main concern though is the decrease in available pastures due to growing pressure on pastoral land. The shrinkage of pastoral land in East Africa is connected with the issue of “tenure” (Ndagala, 1998). The most recent (1997/98) estimates indicate a total of 15.8 million cattle, 350,000 grade dairy cattle, 11 million goats and 3.5 million sheep, indicating that livestock numbers have fully recovered from the crisis period. (World Bank: 2000a).
In 1992, Bonfiglioli made the point that most of the domestic animals were kept by sedentary mixed farmers in northern and central Tanzania: “the Sukuma keep 25% of the national cattle herd. Only 10% or less of cattle are kept by pastoralists” (Op.cit.). More recent figures indicate that even less of the total herd is kept by pastoralists. The 1994/95 sample census estimated that about 95% of the national livestock herd is owned by non-pure pastoralists.
The heartland of agro-pastoralism is represented by the Sukuma tribe (Mwanza, Shinyanga); the Gogo tribe (Dodoma) and the Kurya tribe (Mara). There appears to have been a shift in cattle ownership. As of 1995, the cattle population was concentrated in just 4 regions, Mwanza, Shinyanga, Singida and Dodoma with more than half the total cattle herd in the country. This represents a marked shift westward from Arusha and Singida. It should be noted that Lindi and Mtwara are among the regions with low numbers of cattle (World Bank, 2000).
Agro-pastoralism is the key livestock production system (and arguably key livelihood system) in the country. The 1994/95 sample census estimated that about 40% of the 3.9 million agricultural households were combining the production of crops and livestock for sustenance, income and savings (World Bank: 2000: 214). It is unclear as to whether this definition includes those of the Barabaig and the Maasai who practice crop cultivation. Agro-pastoralism is practiced by a number of ethnic groups, including the Kuria, Digo, Sukuma, Iraqw, Nyamwezi and Koragine. The agro-pastoral system predominates where rainfall and soils permit limited (but risky) cropping. Livestock and cropping (millets and sorghum) benefit from each other, clearance of bush reduces tetse fly which improves animal health, crop residues improve animal nutrition whilst animal manure is used to improve soil fertility. Agro-pastoralists are generally seen as having livestock as the main livelihood activity, which is enhanced (in terms of diet and incomes) by cropping. Arguably, cultivation of marginal soils is accelerating soil erosion and prompts migration into new under-utilised areas of
36
higher potential. Hence the movement out of Dodoma, Singida and Mara into Tabora, Mbeya, Rukwa, Ruvuma and Morogoro (World Bank 1994: 16).
The distinction between an agriculturalist who keeps livestock and an agro-pastoralist who farms is not clear-cut. Within the semi-arid lands of northern and western Tanzania, livestock cropping ratios are neither static nor distributed evenly across wealth groups (more details on this below). NRI (1996) and the WorldBank (1994) seek to make a distinction between predominantly cropping and agro-pastoral systems. The Bank makes the point that cropping is the major economic activity in the livestock / sorghum / millet / cotton / rice farming system as conditions for crop production are marginally better than those under the agro-pastoralist system, and the need for constant migration and shifting cultivation less. The Bank states that food production is based on the drought tolerant cereals (sorghum and millet) whilst cotton, oilseed and rice are produced for the market.
“Rice production from this system has increased markedly in recent years. Livestock are important, not only for milk and meat production, but as a source of drought power for cultivation and transport. Drought power is used for bunding (for rice, in the valley bottoms), ploughing and ridging. Animal manure helps to maintain soil fertility.” (Op. Cit: 16)
South-eastern semi-arid zone
There are no pastoralists nor agro-pastoralism in the south-eastern zone, where the predominant production system is small-holder cultivation. Most of the land is sparsely populated by farmers with 2-4 ha. under cultivation. Infertile areas at the centre however fall within the Selous game reserve and are unoccupied. For Lindi as a whole less than 5 percent of the regional area is cultivated, representing approximately 40 percent of the suitable land. The main crops are sorghum, sesame and cassava. Groundnuts and cashew are important in the more densely populated south. Maize becomes important towards Morogoro. Most of the zone is subject to tsetse-infestation, and livestock populations are very low.
3.4.2 Markets and infrastructure
In semi-arid areas there are crop, livestock and general merchandise markets. Most common are livestock auction markets and local markets that are organised regularly (weekly, biweekly or monthly). Such markets serve not only as a venue for selling and buying but also provide important social functions. Accessibility to such markets through proper infrastructure contributes a great deal in building social relations. These include roads, and other forms of transport. Prices, which exist for various commodities in the markets, strongly influence people’s livelihoods. Through markets people can generate money and access other assets (UNDP, 1998). The exchange of goods and services generates money that can be used for health, education and/or other livelihood requirements. Information about markets is also important, such as the prevailing market prices for crops and livestock and agricultural inputs.
3.4.3 Institutions in rural Tanzania
Two of the important sets of institutions in relation of agriculture in semi-arid areas are the research and extension services. Importantly, research in Tanzania rarely focuses comprehensively on semi-arid zones as other management units are recognised. Research activities in Tanzania is organized into 6 zones, (i) Eastern (ii) Southern Highlands (iii) Central zone (iv) Southern (v) Northern zone and (vi) Lake zone. Based on research programmes at government research institutes and institutions such as Sokoine University of Agriculture a number of technologies have been developed and disseminated in semi-arid areas. These include: improved varieties of drought tolerant crops (e.g. sorghum and millet), tillage practices to reduce the high surface runoff, rainwater-harvesting techniques, and

37
improved cattle breeds. Uptake has often been low, and across most of the semi-arid area, the under-resourced extension service is ineffective. The presence of NGOs is important in partly filling this gap.
Since 1988 the government extension service was provided through the National Agricultural Extension Programme (NAEP) using the Training and Visit Approach (T&V). Extension messages for semi-arid areas have largely been focusing on drought tolerant crops and their management practices. A lack of extension activities directed at soil and water management for crop and livestock production has been noted in studies conducted in semi-arid areas the (Hatibu et al 1997, Hatibu et al 2000).
There are various kinds of traditional institutions in semi-arid areas, which arguably have a much greater reach than formal institutions. A study in semi-arid areas of Shinyanga identified traditional security guards and community assembly as the most important (UNDP, 1998). Other institutions include traditional dance groups (Ngoma) mutual support and extended family groups, (Kaya), work groups, which have different local names, and to a lesser extent traditional savings and credit groups (fogong’ho). Mutual support and extended family groups are based on kinship relations, extended family and age. These provide a dependable source of assistance and security for their members when livelihoods fail. Work groups facilitate access to an important asset, labour. A study in the central semi arid areas noted that work groups are important during labour peak periods and for labour-intensive farm activities (Hatibu et al., 1997) and livestock production through trusteeship arrangement. Traditional savings and credit groups also provide access to financial capital. As well as facilitating procurement of agricultural inputs, households use such facilities for paying children’s school fees and also for paying health bills. Traditional dance groups share messages, provide entertainment and are a means of building up social networks. For example, in Shinyanga a traditional dancing competition led to the development of traditional saving and credit group (UNDP, 1998).
3.5 Natural resources in semi-arid areas Together with crop production and livestock keeping, a range of other natural resource-based activities are important to the livelihoods of people in semi-arid areas. Activities include mining, fishing, and the utilisation of diverse forest products (e.g. bee-keeping, lumbering, firewood selling, charcoal making and selling). Some semi-arid areas including parts of Shinyanga are also well endowed with minerals (UNDP 1998) and mining is increasingly important. This is either through employment in large mining companies or as small-scale artisan miners. Mining affects the natural resource base of a given area and can cause significant damage to forests and the vegetation cover. Few if any miners replace the vegetation or rehabilitate their pits.
There are also significant large water bodies (rivers and lakes) throughout the semi-arid areas, and the sale of fish from Lake Mtera for example, provides about 12% of the income for people in the adjacent remote areas (Monela et al., 2000).
The central semi-arid zone overlaps with the two ecological zones, the acacia-savanna and grasslands zone and the 'miombo' savanna woodlands. The south-eastern semi-arid zone overlaps almost exclusively with the 'miombo' savanna woodlands (URT, 1998a). The study by Monela et al. (2000), case study 5 in section 5, of communities living within or adjacent to miombo woodlands in Dodoma and Morogoro region found that forest products contributed between 50-70% to annual household incomes. Monela notes that products such as firewood, wild fruits and herbal medicines are increasingly becoming tradable goods and sources of household income, and that short-term gains are negatively impacting on the natural resource
38
base: “forests on public land continue to be freely exploited and in some places they have been depleted to the extent the forest reserves are now standing as islands in a degraded landscape.”
Summary This section provided an overview of the semi-arid environment in Tanzania. For the purpose of this study we have been guided by the agro-ecological classification published by ODA/NRI which identifies two distinct semi-arid resource zones, the central and south-eastern. Difficulties associated with the non-alignment of the semi-arid areas and the administrative areas are flagged. A demographic sketch was provided based predominantly on data from the last national census in 1988. The findings of the most recent countrywide surveys of poverty - both quantitative and qualitative - were introduced, and qualifications about the divergence and difficulties associated with measuring the incidence and trends in poverty in the rural areas were articulated. The nature of poverty at district level, and for household groups at different locations throughout the central semi-arid zone, was presented, together with a matrix that provides a classification tool for different locations according to agricultural potential and access to infrastructure. The farming systems found in this zone were described, together with brief reference to other natural resources of relevance to people's livelihoods.
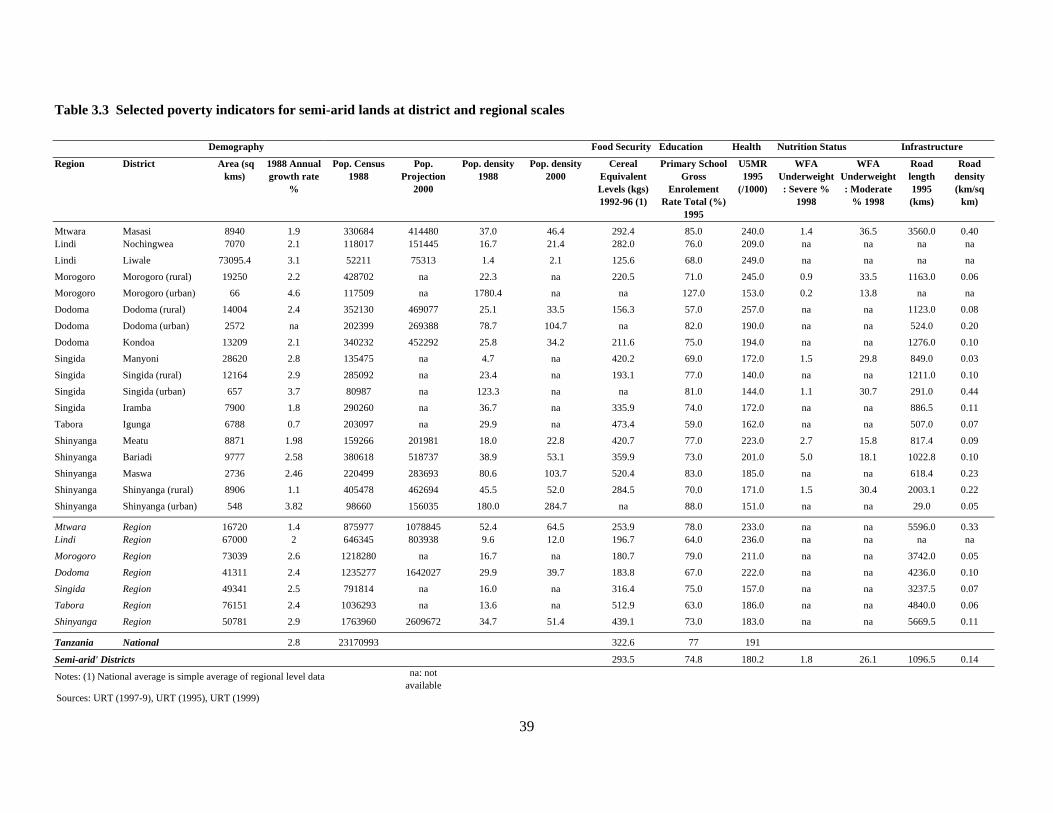
39
Table 3.3 Selected poverty indicators for semi-arid lands at district and regional scales Demography Food Security Education Health Nutrition Status Infrastructure
Region District Area (sq kms)
1988 Annual growth rate
%
Pop. Census 1988
Pop. Projection
2000
Pop. density 1988
Pop. density 2000
Cereal Equivalent Levels (kgs) 1992-96 (1)
Primary School Gross
Enrolement Rate Total (%)
1995
U5MR 1995
(/1000)
WFA Underweight: Severe %
1998
WFA Underweight: Moderate
% 1998
Road length 1995 (kms)
Road density (km/sq
km)
Mtwara Masasi 8940 1.9 330684 414480 37.0 46.4 292.4 85.0 240.0 1.4 36.5 3560.0 0.40 Lindi Nochingwea 7070 2.1 118017 151445 16.7 21.4 282.0 76.0 209.0 na na na na Lindi Liwale 73095.4 3.1 52211 75313 1.4 2.1 125.6 68.0 249.0 na na na na
Morogoro Morogoro (rural) 19250 2.2 428702 na 22.3 na 220.5 71.0 245.0 0.9 33.5 1163.0 0.06 Morogoro Morogoro (urban) 66 4.6 117509 na 1780.4 na na 127.0 153.0 0.2 13.8 na na Dodoma Dodoma (rural) 14004 2.4 352130 469077 25.1 33.5 156.3 57.0 257.0 na na 1123.0 0.08
Dodoma Dodoma (urban) 2572 na 202399 269388 78.7 104.7 na 82.0 190.0 na na 524.0 0.20 Dodoma Kondoa 13209 2.1 340232 452292 25.8 34.2 211.6 75.0 194.0 na na 1276.0 0.10 Singida Manyoni 28620 2.8 135475 na 4.7 na 420.2 69.0 172.0 1.5 29.8 849.0 0.03
Singida Singida (rural) 12164 2.9 285092 na 23.4 na 193.1 77.0 140.0 na na 1211.0 0.10 Singida Singida (urban) 657 3.7 80987 na 123.3 na na 81.0 144.0 1.1 30.7 291.0 0.44 Singida Iramba 7900 1.8 290260 na 36.7 na 335.9 74.0 172.0 na na 886.5 0.11
Tabora Igunga 6788 0.7 203097 na 29.9 na 473.4 59.0 162.0 na na 507.0 0.07
Shinyanga Meatu 8871 1.98 159266 201981 18.0 22.8 420.7 77.0 223.0 2.7 15.8 817.4 0.09 Shinyanga Bariadi 9777 2.58 380618 518737 38.9 53.1 359.9 73.0 201.0 5.0 18.1 1022.8 0.10
Shinyanga Maswa 2736 2.46 220499 283693 80.6 103.7 520.4 83.0 185.0 na na 618.4 0.23 Shinyanga Shinyanga (rural) 8906 1.1 405478 462694 45.5 52.0 284.5 70.0 171.0 1.5 30.4 2003.1 0.22 Shinyanga Shinyanga (urban) 548 3.82 98660 156035 180.0 284.7 na 88.0 151.0 na na 29.0 0.05
Mtwara Region 16720 1.4 875977 1078845 52.4 64.5 253.9 78.0 233.0 na na 5596.0 0.33 Lindi Region 67000 2 646345 803938 9.6 12.0 196.7 64.0 236.0 na na na na
Morogoro Region 73039 2.6 1218280 na 16.7 na 180.7 79.0 211.0 na na 3742.0 0.05 Dodoma Region 41311 2.4 1235277 1642027 29.9 39.7 183.8 67.0 222.0 na na 4236.0 0.10
Singida Region 49341 2.5 791814 na 16.0 na 316.4 75.0 157.0 na na 3237.5 0.07 Tabora Region 76151 2.4 1036293 na 13.6 na 512.9 63.0 186.0 na na 4840.0 0.06 Shinyanga Region 50781 2.9 1763960 2609672 34.7 51.4 439.1 73.0 183.0 na na 5669.5 0.11
Tanzania National 2.8 23170993 322.6 77 191
Semi-arid' Districts 293.5 74.8 180.2 1.8 26.1 1096.5 0.14
Notes: (1) National average is simple average of regional level data na: not available
Sources: URT (1997-9), URT (1995), URT (1999)

40
Table 3.4 Classification of case study locations in terms of moderately favoured & less favoured areas (after Pender and Hazell, 2000)
Agricultural potential - biophysical environment (climate, water availability, soils)
High Medium Low
Hig
h
Ruaha Mbuyuni, Iringa R.D. (along DSM-Ruaha road, availability of irrigation / Ruaha river) (SUA CS).
Bahi Sokoni, Dodoma R.D. (along Dodma-Singida road, railway station, availability of irrigation) (SUA CS).
Mtandike, Mahenge Division, Irina R.D. (along DSM-Iringa road, availability of irrigation) (SUA CS).
Ilula, Pawaga Division, Irnga R.D. (along DSM-Iringa road, no irrigation) (SUA CS).
Acc
ess
to in
fras
truc
ture
and
m
arke
tsM
ediu
m
Malya, Kwimba District, Mwanza Region (former district town, railway & roads junction) (CS3)
Msingisi, Gairo Division, Kilosa District, Morogoro (agro-pastoral, GALUP project, road & village infrastructure / drought prone, sandy & clay loams, SA but between the two zones) (Misana et al, 1997).
Lusilile, Kintuku Division, Singida R. & adjacent Uhelela, Dodoma Rural District (proximity to Dodoma/Singida road and railway, availability of irrigation) (SUA CS).
Msosa, Mahenge Division, Iringa R.D. (rough 15km feeder road to DSM-Iringa road, irrigation facilities / fertile soils, Ruaha river, Udzungwa game reserve) (SUA CS).
Mtwango-Lunguya (located on major road between urban centres), Njombe District, Iringa (CS1).
Ikuwala sub-village (proximity to DSM-Iringa-SHs road) Mazombe Division, Iringa District (CS2).
Haubi (KEA), Kondoa District (CS7)

41
Low
Kitunga, Kwimba District, Mwanza (20 km from Malya but more isolated) (CS3).
Mtera, Dodoma (proximity to dam) (CS5).
Nyanzwa, Mahenge Division, Iringa R.D. (remote, 34 km from DSM-Iringa road, no good road) (SUA CS).
Soya, Kondoa District District (CS7).
Rural Shinyanga District (cotton, sorghum, millet, maize & sweet potatoes) Shinyanga Region (CS4).
Iringa-Mvumi, Dodoma Rural District (CS6).
Mvumi Mission, Dodoma Rural District (CS6).
Kiduhi (infertile soils, remote, pastoralism), Masanze Division, Kilosa District, Morogoro (Misana et al, 1997).

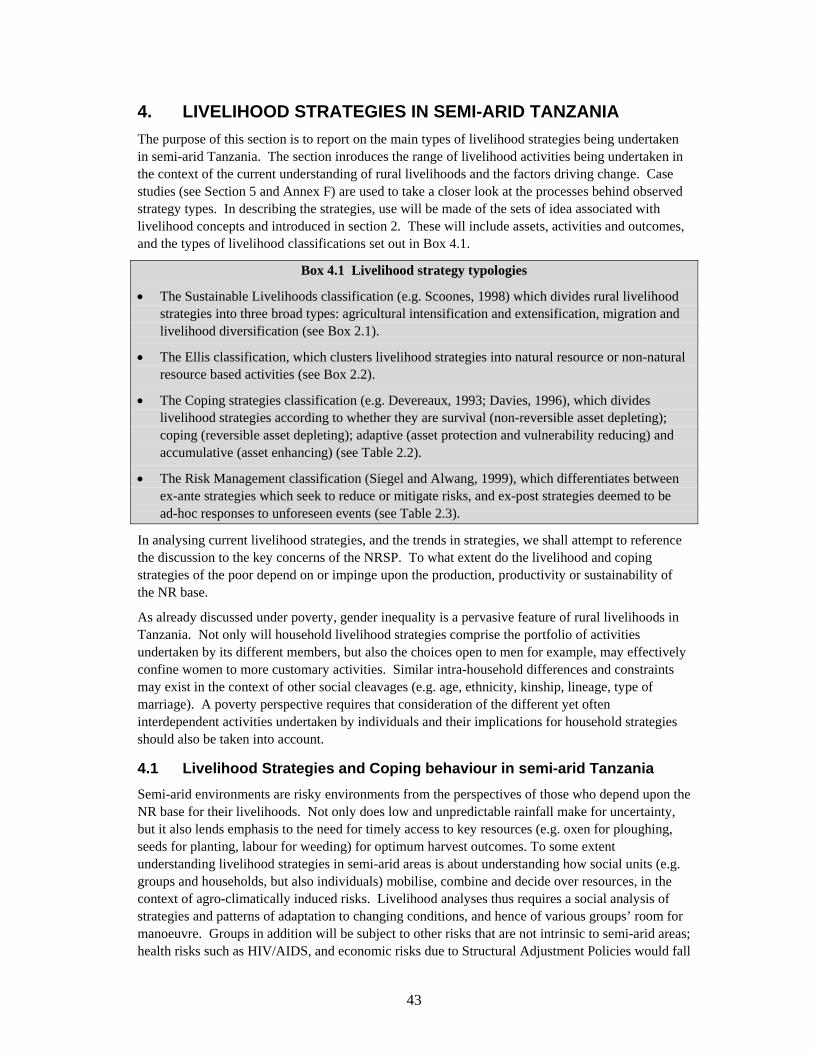
43
4. LIVELIHOOD STRATEGIES IN SEMI-ARID TANZANIA The purpose of this section is to report on the main types of livelihood strategies being undertaken in semi-arid Tanzania. The section inroduces the range of livelihood activities being undertaken in the context of the current understanding of rural livelihoods and the factors driving change. Case studies (see Section 5 and Annex F) are used to take a closer look at the processes behind observed strategy types. In describing the strategies, use will be made of the sets of idea associated with livelihood concepts and introduced in section 2. These will include assets, activities and outcomes, and the types of livelihood classifications set out in Box 4.1.
Box 4.1 Livelihood strategy typologies
• The Sustainable Livelihoods classification (e.g. Scoones, 1998) which divides rural livelihood strategies into three broad types: agricultural intensification and extensification, migration and livelihood diversification (see Box 2.1).
• The Ellis classification, which clusters livelihood strategies into natural resource or non-natural resource based activities (see Box 2.2).
• The Coping strategies classification (e.g. Devereaux, 1993; Davies, 1996), which divides livelihood strategies according to whether they are survival (non-reversible asset depleting); coping (reversible asset depleting); adaptive (asset protection and vulnerability reducing) and accumulative (asset enhancing) (see Table 2.2).
• The Risk Management classification (Siegel and Alwang, 1999), which differentiates between ex-ante strategies which seek to reduce or mitigate risks, and ex-post strategies deemed to be ad-hoc responses to unforeseen events (see Table 2.3).
In analysing current livelihood strategies, and the trends in strategies, we shall attempt to reference the discussion to the key concerns of the NRSP. To what extent do the livelihood and coping strategies of the poor depend on or impinge upon the production, productivity or sustainability of the NR base.
As already discussed under poverty, gender inequality is a pervasive feature of rural livelihoods in Tanzania. Not only will household livelihood strategies comprise the portfolio of activities undertaken by its different members, but also the choices open to men for example, may effectively confine women to more customary activities. Similar intra-household differences and constraints may exist in the context of other social cleavages (e.g. age, ethnicity, kinship, lineage, type of marriage). A poverty perspective requires that consideration of the different yet often interdependent activities undertaken by individuals and their implications for household strategies should also be taken into account.
4.1 Livelihood Strategies and Coping behaviour in semi-arid Tanzania Semi-arid environments are risky environments from the perspectives of those who depend upon the NR base for their livelihoods. Not only does low and unpredictable rainfall make for uncertainty, but it also lends emphasis to the need for timely access to key resources (e.g. oxen for ploughing, seeds for planting, labour for weeding) for optimum harvest outcomes. To some extent understanding livelihood strategies in semi-arid areas is about understanding how social units (e.g. groups and households, but also individuals) mobilise, combine and decide over resources, in the context of agro-climatically induced risks. Livelihood analyses thus requires a social analysis of strategies and patterns of adaptation to changing conditions, and hence of various groups’ room for manoeuvre. Groups in addition will be subject to other risks that are not intrinsic to semi-arid areas; health risks such as HIV/AIDS, and economic risks due to Structural Adjustment Policies would fall
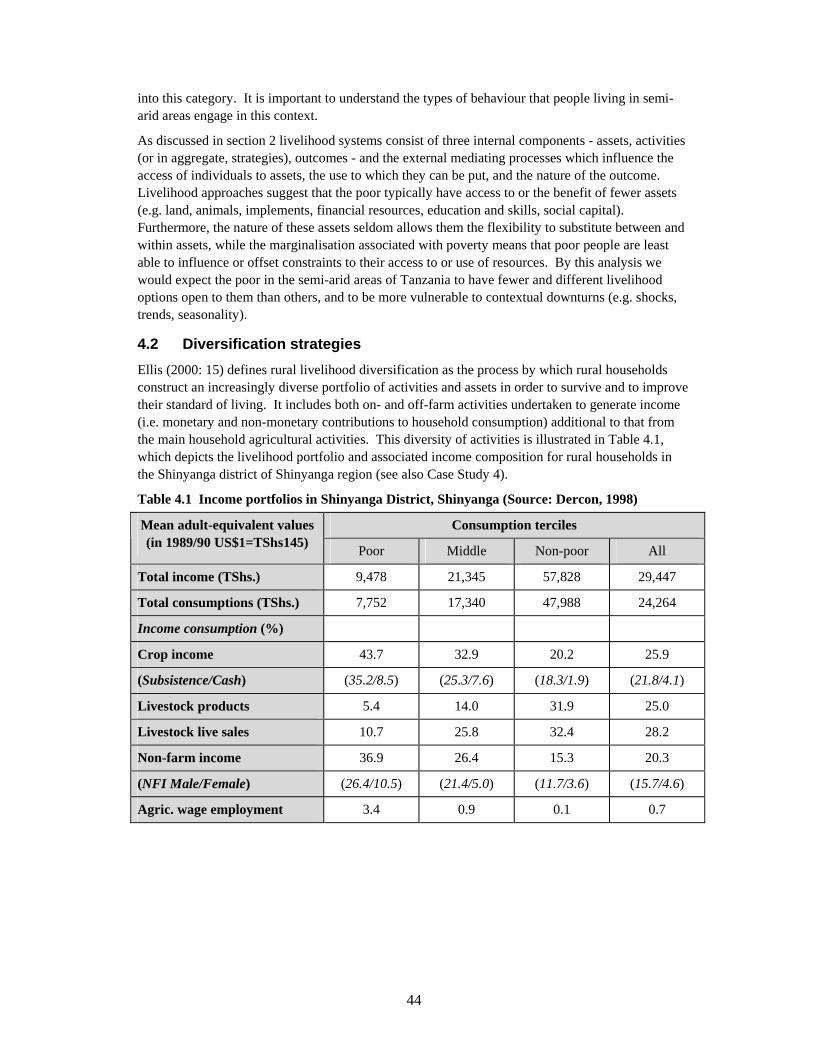
44
into this category. It is important to understand the types of behaviour that people living in semi-arid areas engage in this context.
As discussed in section 2 livelihood systems consist of three internal components - assets, activities (or in aggregate, strategies), outcomes - and the external mediating processes which influence the access of individuals to assets, the use to which they can be put, and the nature of the outcome. Livelihood approaches suggest that the poor typically have access to or the benefit of fewer assets (e.g. land, animals, implements, financial resources, education and skills, social capital). Furthermore, the nature of these assets seldom allows them the flexibility to substitute between and within assets, while the marginalisation associated with poverty means that poor people are least able to influence or offset constraints to their access to or use of resources. By this analysis we would expect the poor in the semi-arid areas of Tanzania to have fewer and different livelihood options open to them than others, and to be more vulnerable to contextual downturns (e.g. shocks, trends, seasonality).
4.2 Diversification strategies Ellis (2000: 15) defines rural livelihood diversification as the process by which rural households construct an increasingly diverse portfolio of activities and assets in order to survive and to improve their standard of living. It includes both on- and off-farm activities undertaken to generate income (i.e. monetary and non-monetary contributions to household consumption) additional to that from the main household agricultural activities. This diversity of activities is illustrated in Table 4.1, which depicts the livelihood portfolio and associated income composition for rural households in the Shinyanga district of Shinyanga region (see also Case Study 4).
Table 4.1 Income portfolios in Shinyanga District, Shinyanga (Source: Dercon, 1998)
Consumption terciles Mean adult-equivalent values (in 1989/90 US$1=TShs145) Poor Middle Non-poor All
Total income (TShs.) 9,478 21,345 57,828 29,447
Total consumptions (TShs.) 7,752 17,340 47,988 24,264
Income consumption (%)
Crop income 43.7 32.9 20.2 25.9
(Subsistence/Cash) (35.2/8.5) (25.3/7.6) (18.3/1.9) (21.8/4.1)
Livestock products 5.4 14.0 31.9 25.0
Livestock live sales 10.7 25.8 32.4 28.2
Non-farm income 36.9 26.4 15.3 20.3
(NFI Male/Female) (26.4/10.5) (21.4/5.0) (11.7/3.6) (15.7/4.6)
Agric. wage employment 3.4 0.9 0.1 0.7
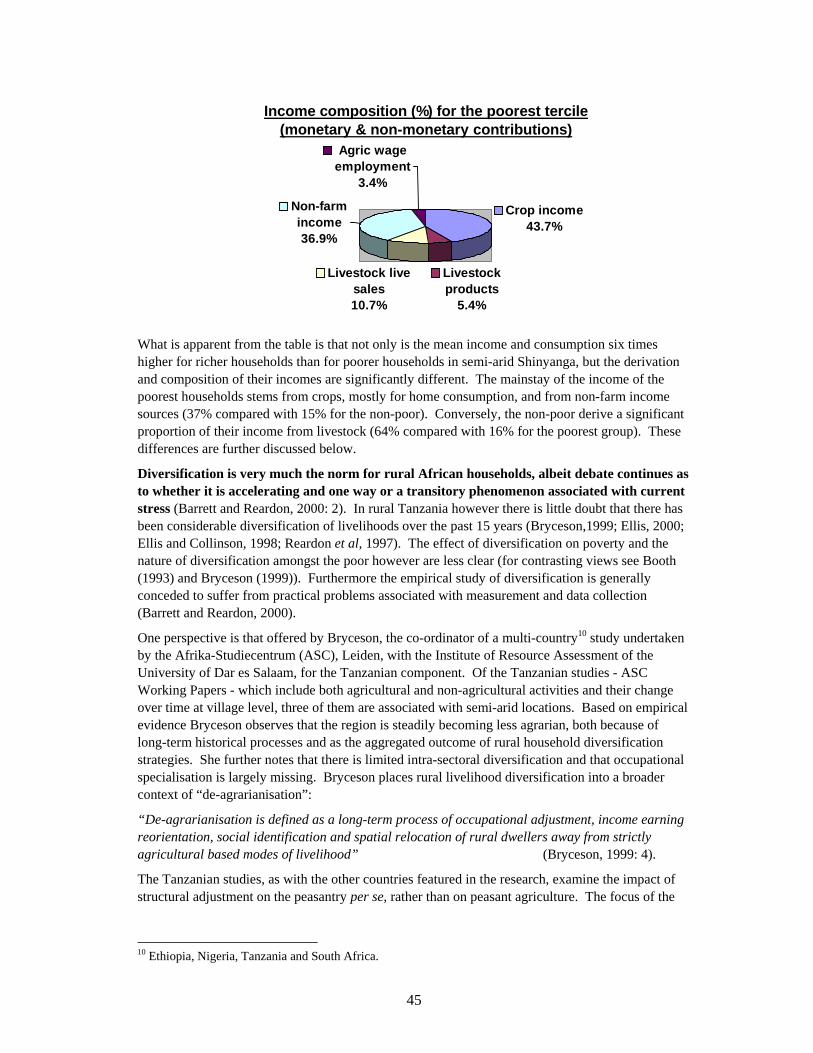
45
Income composition (%) for the poorest tercile(monetary & non-monetary contributions)
Crop income43.7%
Livestock products
5.4%
Livestock live sales10.7%
Non-farm income36.9%
Agric wage employment
3.4%
What is apparent from the table is that not only is the mean income and consumption six times higher for richer households than for poorer households in semi-arid Shinyanga, but the derivation and composition of their incomes are significantly different. The mainstay of the income of the poorest households stems from crops, mostly for home consumption, and from non-farm income sources (37% compared with 15% for the non-poor). Conversely, the non-poor derive a significant proportion of their income from livestock (64% compared with 16% for the poorest group). These differences are further discussed below.
Diversification is very much the norm for rural African households, albeit debate continues as to whether it is accelerating and one way or a transitory phenomenon associated with current stress (Barrett and Reardon, 2000: 2). In rural Tanzania however there is little doubt that there has been considerable diversification of livelihoods over the past 15 years (Bryceson,1999; Ellis, 2000; Ellis and Collinson, 1998; Reardon et al, 1997). The effect of diversification on poverty and the nature of diversification amongst the poor however are less clear (for contrasting views see Booth (1993) and Bryceson (1999)). Furthermore the empirical study of diversification is generally conceded to suffer from practical problems associated with measurement and data collection (Barrett and Reardon, 2000).
One perspective is that offered by Bryceson, the co-ordinator of a multi-country10 study undertaken by the Afrika-Studiecentrum (ASC), Leiden, with the Institute of Resource Assessment of the University of Dar es Salaam, for the Tanzanian component. Of the Tanzanian studies - ASC Working Papers - which include both agricultural and non-agricultural activities and their change over time at village level, three of them are associated with semi-arid locations. Based on empirical evidence Bryceson observes that the region is steadily becoming less agrarian, both because of long-term historical processes and as the aggregated outcome of rural household diversification strategies. She further notes that there is limited intra-sectoral diversification and that occupational specialisation is largely missing. Bryceson places rural livelihood diversification into a broader context of “de-agrarianisation”:
“De-agrarianisation is defined as a long-term process of occupational adjustment, income earning reorientation, social identification and spatial relocation of rural dwellers away from strictly agricultural based modes of livelihood” (Bryceson, 1999: 4).
The Tanzanian studies, as with the other countries featured in the research, examine the impact of structural adjustment on the peasantry per se, rather than on peasant agriculture. The focus of the
10 Ethiopia, Nigeria, Tanzania and South Africa.

46
studies was on what Bryceson describes as the key indicators of de-agrarianisation: occupational adjustment; income generation; residence - spatial relocation of rural dwellers; and social identity.
The changes in behaviour also reflect other changes within African societies. The role of population increase and consequent land pressure is also cited as a contributory factor. The ASC studies suggest that as rural populations expand and land availability contracts in SSA, non-agricultural activities will become increasingly important in rural poverty alleviation. In the Nigeria and South Africa case studies, the availability of land for agriculture is no longer decisive in class stratification, and landlessness is not necessarily synonymous with poverty (Op. Cit: 27).
For Bryceson, SAP policies have triggered a huge, unplanned income diversification response in African rural areas. Presently, peasants are poised between an active search for viable income sources, while retaining the security of their peasant subsistence fallback – however meagre that may be. Tanzanian farmers have been faced with a more uncertain market environment, producer prices subject to wide fluctuations, input prices sky rocketed and supply became tenuous as most traders did not have the rural outreach of the parastatals they replaced. Reduced access to agrarian capital with the removal of subsidies has led to an increase in traditional varieties of staple foods rather than high-yielding improved varieties requiring expensive inputs. For Njombe district11 in Iringa region (see Case Study 1), Mung’ong’o (1998: 5) suggests that SAP policies have “unilaterally led to a drop in productivity and increased food insecurity”, especially amongst the poorer section of society. He cites a decline of 71 percent in the annual mean household income between 1979 and 1992.
Mung’ong’o (1998: 28) suggests that the on-going debate as to whether agriculture or non- agricultural economic activities provide the stimulant for the other is misplaced. Both activities would usually complement each other, with agriculture perceived as the primary activity. Presently while agriculture remains in crisis, he suggests that the development of non-agricultural economic activities in Njombe District must be intertwined with the development of the agricultural sector. The link between agriculture and non-farm activities is articulated through labour, capital and markets, and has typically been translated in terms of the seasonality of the two enterprises. In Kwimba District, Mwanza Region, for example, most people engage in farming during the wet season and in non-farm activities during the dry season (Madulu, 1998: 34); but this sequencing may be changing.
Responses to seasonality and climatic risk need distinguishing from market risk management. Bryceson argues that “The surge in African rural households’ income-diversification tendencies over the last 15 years cannot be explained by a flush of bad weather”. Of Kwimba District, Madulu (1998) also cites the collapse of public services at village level associated with SAP cutbacks - the Civil Service Reform Programme - as many people’s motivation for entering non-farm activities. Climatic factors, particularly shocks (e.g. drought and floods) have nonetheless played a significant role in influencing household livelihood choices and strategies over the 1990’s, and more details on this follow later in this report.
The ASC studies present a delicate balancing act of people succeeding to varying extents to cobble together their livelihoods somewhere in the spectrum between farm and non-farm, family and individual, and rural and urban contexts. "African peasantries are currently involved in a dual strategy to experiment with non-agricultural income while retaining the security of an agricultural subsistence fall-back” (Op. Cit.: 28). The study by Birch-Thompsen et al. (1999) of changing
11 Only the north and north-west of Njombe district is described as semi-arid. In the 1980s, following villagisation, subsidised farm inputs made permanent and intense cultivation possible. Njombe district was producing almost one third of all Tanzanian tea, two-thirds of the country’s pyrethrum, and a considerable amount of wheat.

47
livelihood patterns in Mazombe Division, Iringa District, (see Case Study 2) similarly identifies a middle village income group who underpin a modest income from crop sales with piecework (45% of such households), crafts (45%) and business (27%). For richer farmers there is no sense of hedging of risks; sizeable crop incomes and farming are mutually complemented by incomes from craft (46% of households), business (54%) and rental (62%) enterprises. With only meagre returns from their more marginal land holdings, the poorest households - designated 'peasant labourers' by the authors - are most constrained, increasingly deriving their income from piecework and off-field natural resources (e.g. grass cutting, firewood collection). In most places however, farming values run very deep. Older people in particular view farming as very important to identity. Subsistence production for the poor is a vital safety net in the short run, albeit their necessary preoccupation with food crops, which are generally lower risk but low value, may well increase their vulnerability over time.
4.2.1 Occupation and income generation
This mosaic of farm and non-agricultural income sources is pervasive. Madula (1998) found that in survey villages in Mwanza, over 50% of existing non-agricultural activity started in 1990 or thereafter and another 33% in 1980s with only 16% of respondents involved in non-agricultural activity in the past. In Jambiya’s (1998) study of Tanga region, “the urge for starting up” non-agricultural activities is also linked to the 1980’s.
Bryceson highlights three “non-agricultural income-source complexes”: local services, trade, and transfer payments. The trade complex is picked out as being the most important in Tanzania. The rise in trade is deemed to have been dramatic, and, it is argued, is the main vent for non-agricultural activities, encouraged by local governments and local leaders. Prior to SAP, socialist ideology and parastatal marketing ruled out most forms of private trading. For many of the rural poor however, as cited above for Mazombe Division, Iringa (Case Study 2), the trade in question is likely to relate to the exploitation of off-field natural resources; entry costs to other enterprises are typically beyond their resources. Bryceson makes the somewhat controversial claim that pursuit of non-agricultural activities is a year round phenomenon, subject primarily to fluctuations in local purchasing power rather than seasonal lulls in the agricultural work calendar. Mung’ong’o confirms this in the case of Mtwango-Lunguya village, Njombe District, Iringa (Case Study 1).
Open cast mining is quite common in parts of semi-arid Tanzania. In Mwanza Region, Kwimba District is “being environmentally ravaged” by diamond diggers (Madula, 1998). Small-scale mining is taking place in other parts of Tanzania. It is estimated that over 500,000 people are engaged in mining (Chachage, Ericsson and Gibbon, 1993). Case study work undertaken amongst communities in adjacent districts of Dodoma and Singida in the Bubu river catchment, records that a significant number of respondents noted increases in the contribution of fishing (78%) and mining (57%) to incomes (Annex F).
Mwamfupe (1998) observes that in Mbeya, traditional services such as midwifery and medical treatments previously offered as unpaid community services are now being commoditised by their practitioners.
The level of remittances and other transfer payments where information is available from the various case studies may not appear greatly significant (e.g. less than 4 percent of income in Case Studies 4 and 5). However, as David (1997) points out for the Sahel and McDowell and de Haan (1997) amplify, even small remittances can be vital to food security. Furthermore remittances are part of a broader exchange in which the maintenance or extension of social capital may play a part. Van Vuuren’s study of female-headed households in Ndala Ward, Nzega District, Tabora reveals that while 3.4 percent of income for male-headed households comes from kin gifts, the figure is 21.8 percent for female headed households.
48
4.2.2 Social identity, gender, age
Bryceson reports that more and more household members are entering non-agricultural production and that the male household head’s dominant role as family cash earner – “an ideologically ingrained feature of African peasant commodity production - is eroding” (Bryceson, 1999). Colonial and post-colonial policies shaped agrarian systems that integrated family subsistence production and commodity production. The formation of patriarchal family structures in which senior males as heads of households were accorded the role of liaising with government and co-opted into cash crop production was encouraged. The male cash crop / female subsistence spheres date from this period.
Studies in the Kondoa Irangi Hills suggest that social differentiation nowadays amongst the Rangi has considerably less to do with kinship relationships, age or gender, and more to do with financial wealth. The breakdown of traditional relations and institutions, besides being supplanted by the rooting of Islam and Christianity, is also linked to the coming of the cash economy. The latter is believed to have been notably advanced by the de-stocking exercise imposed by the HADO project in 1979, which saw greater private use made of land resources, and money replacing cattle as a store of wealth (Madulu and Mung’ong’o, 1990; Mung’ong’o, 1996 – Case Study 7).
Declining African agricultural commodity production of the last 20 years has differentially impacted upon men and women. “The individualisation of economic activity and the increasing tendency to engage in non-agricultural income earning have had a dissolving effect on long-standing agrarian divisions of labour as well as economic rights and responsibilities within peasant households” (Bryceson, 1999). Many authors (e.g. Mung’ong’o, 1998; Monela et al., 2000; FSG/Sua, 1995) report that women’s roles continue to expanded beyond the traditional domestic activities associated with the farm and family, into the realm of income generation activities such as natural resource collection and sale, casual labour and petty business. Generally however this will be at a less remunerative rate than for men. For Monela et al, (2000: 10) this change of role, which they identify with the changing socio-economic climate particularly during the SAP period, now involves 40% of women in petty business compared to almost nil in the pre-SAP period. In this study however, women's involvement in both petty business and trade in forest products declined significantly as one moved from peri-urban to remote sites.
Men too are reported by a number of authors to be taking up activities that have traditionally been in the domain of women. This would seem likely to have a detrimental effect on the income opportunities available to women12.
With increasing value being assigned to land, unaffordable inputs and fluctuating markets many of the youth see no future in agriculture, a view endorsed by a growing number of their elders (Mung’ong’o, 1998). Such views have inevitably led to a lack of interest of youth in farming, and the ASC studies describe the migration of the young from the villages in terms of the “greying of the countryside”. The rush of youth - teenagers and young unmarried adults - in seeking non-farm activity involvement and especially trade is remarked upon by several authors (Madulu, 1998 - Mwanza; Mwamfupe, 1998 - Mbeya).
In Mazombe Division, Iringa, and offering a different perspective on relatively youthful individuals, Birch-Thompsen et al. (1999) discovered that the average age (34) of household heads amongst the wealthiest 'accumulating' families was about 8-9 years lower than that for less successful households. These farmers are described in terms of being vigorous and enterprising, with reference being made to receiving support from their fathers. Elsewhere in the literature it is argued that the children of wealthier families are least likely to have their education disrupted to cope with
12 See also Silberschmidt (2001) paper on the 'disempowerment of men in rural and urban East Africa'.
49
household income deficits; and it is tentatively advanced that this maintenance of human assets is likely to reinforce dynastic advantages.
Bryceson points out that peasants’ relations within the family and in the rural community dominate their social life. Land, labour and capital tend to be mobilised within these units. Income sources are shifting away from agricultural production under control of patriarchs. In Mbeya and Iringa (Mung’ong’o 1998), peasant family units are being restructured and the nature of internal exchange relations are being transformed, producing ambiguity and tension about individual members’ rights and responsibilities within the household. The boundaries between household solidarity and individual autonomy are being blurred. Within the older generation, farming is important in terms of identity, as evidenced by this quote from an old woman in Mwanza:
“Farming is the backbone of everything. We managed to buy seven cows from farming. I can’t allow any of my children to live without farming. What will they eat? I have to be strict. They are going to be married. If they are lazy, nobody will propose marriage and that will bring shame to me.” (quoted in Madulu 1998:21).
Mung’ong’o (1998) reports that village leaders are concerned to try and keep urban influences out of village life. Rising numbers of youth are however no longer willing to conform to traditional social norms. Young men are evading bride-price payments as they feel they can access land outside family channels. Theft of public property has become common.
Mung’ong’o picks out four trends that are evident in current social restructuring:
• resort to “incomplete” family units i.e. locational separation of the reproductive couple for the sake of income-earning.
• reduction in the size of large extended families in the direction of nuclearisation
• weakening of dependency ties on gender and age lines within family units
• women’s efforts to use matrilineal ties to further their material security. Through gift giving, women are cementing exchange relations with their natal kin as security against extreme adversity. Gifts are insurance premium payments.
Madulu (1998) argues that there has been a continuing process of disintegration of the Sukuma’s three generational family structure which began during the villagisation campaign in the 1970’s. Increasing numbers of family members work alone in non-agricultural activities compared with the past. This includes school children whose school attendance and contribution to families’ agricultural effort has been squeezed: “…school children used to assist in farm work after school hours but today they dislike agriculture and are increasingly drawn into trading activities” Mwamfupe (1998:14). As family labour inputs decline, family reciprocation in form of basic needs provisioning and household asset transmission declines also.
4.2.3 Livelihood diversification and poverty
A number of household livelihood reports using PRA techniques and focusing on Shinyanga, Mara and Mwanza (CARE 1995), Singida, Dodoma and Arusha (SCF 1999a, b, c), report that poorer groups are engaging in diverse livelihood strategies. Despite diversified activity portfolios the poor face important constraints to the more remunerative forms of diversification. Furthermore, the activities they undertake seldom reflect any forms of specialisation that might be associated with added value.
In the semi-arid section of the SCF report for Dodoma for example, a number of important points emerge. The poor, who constitute 45 to 55 percent of the population are engaged in a much greater degree of off-farm livelihood diversification than other groups. Whereas in a 'normal' year the rich

50
(15-25%) and middle (25-35%) wealth groups are able to subsist from their crops and livestock holdings, the poor are obliged to diversify to make ends meet. The rich (15-25%) appear to rely purely on agriculture, deriving an annual income of the order of 510,000-540,000 TSh. per year (in 1999) from crops and livestock. The income of the middle wealth group (190,000-210,000 TSh./year) also predominantly derives from crop and livestock (e.g. animal sales and milk), with additional contributions from honey or sorghum brewing (15-25%) and petty trade ((0-15%). The poor however, who typically lack resources or capital to undertake petty trading or brewing, derive their income from the sale of wild foods (0-10%) and firewood (5-15%), construction activities (e.g. pole and brick production and house building - 25-35%), migration (0-5%), and agricultural labour (5-15%), with crop and animal product sales (e.g. chickens and eggs) contributing 25-35% and 5-10% respectively. With a total income of only 40,000-60,000 TSh. per year, it is estimated that mobilising all their resources would only provide for about 110% of their consumption needs (cf. 330% and 990% for middle and wealthy groups). Having virtually no leeway even in a normal year the poor are thus particularly vulnerable to shocks (SCF(UK), 1999b). Finally, only the better off can meaningfully be considered to be agro-pastoralists, a position confirmed by Case Study 6, in which the authors question whether the production system for the area can continue to be described as an agro-pastoralist system.
The Singida Household Food Economy study reports that petty trading tends to be an activity pursued by the ‘middle’ and ‘rich’ groups as they have the capital and bicycles. Some households transport crops in one direction (to town) and household items such as kerosene, sugar, and salt in the other, while others engage in small-scale livestock trading. This is not a major activity, but it is more common in this zone than in others because of a noticeable lack of small shops in most villages. In other zones most villages have a small shop which tends to monopolise this type of trading activity (SCF(UK) 1999a).
In Mazombe Division, Iringa District, richer farmers with both the capital and social connections have a monopolistic hold (rental and/or ownership) on the better land. Poorer farmers have been forced to crop on the more marginal hillsides and increasingly rely on piecework for food security (Case Study 2). Diversification for the rich serves to extend their accumulation strategies, whereas for poorer households diversification is borne of necessity.
In Shinyanga District (Case Study 4) livestock provides an insurance against risks for the better off. With the absence of insurance markets cattle represent a mobile, liquid asset that can be drawn on in the case of emergency, and households owning cattle are able to allocate their resources to higher risk but more remunerative crops. Poorer villagers mitigate risks by cultivating larger areas of low-risk, but low return crops (e.g. sweet potatoes), at the expense of sorghum, maize or cotton, for which better returns are possible. As for Mazombe Division, Iringa, such strategies expose the poor to the risk of increasing poverty when circumstances in successive years are not favourable. Furthermore, such processes already appear to be consolidating social stratification within communities and extending existing inequalities.
4.3 Migration Migration can be an extreme response to livelihood failure. In his study of household behaviour in the aftermath of climate shocks such as drought, Swift (1989) found migration – exit from the livelihood system - to be the last resort in a sequence of strategies designed to absorb the impact of the shock. Migration however is not only for the purposes of pure survival. For some population groups, migration is an important component of a livelihood system. Swidden agriculture and pastoralism would fall into this category. Migration then, as Mcdowell and de Haan (1997) point out, needs to be considered in terms of the context within which it is occurring.

51
In rural Tanzania migration has long been an important livelihood strategy. The authors of the ASC studies (Madulu,1998; Mung’ong’o, 1998; Jambiya, 1998; Mwamfupe, 1998; and van Vuuren, 2000), as for most of the case studies in Section 5, make reference to the role of migration in the livelihood strategies of the household and the family. These studies identify both historical and current migration patterns, and explore them in the context of economic diversification.
Commenting on these studies, Bryceson (1999) argues that “economic liberalisation has encouraged spatial concentration of production to those areas that afford higher yields due to favourable agro-climatic conditions or low transport costs. Within these areas, it is the better off farmers producing with economies of scale who can purchase the input packages and maintain their yield levels”.
She further makes the point that there is a strong generational aspect to migration: “Disillusioned with poor returns from maize, youth reverted to the labour migration practices that had ceased 40 years ago at the time of national independence. Young men went to large privately owned tea estates for wage labour or produce rice on a sharecropping basis 100 kms from village, women went to urban areas in search of jobs as domestic servants. Parents encouraging sons and daughters to migrate to urban areas. The attitude of parents had changed from that of the 1980’s when parents didn’t encourage.” (Op. Cit., 1999). Decreasing rural isolation encourages increased off-farm activity. Peasants, particularly mobile unmarried youth have sought productive activities that take them outside their villages.
The van Vuuren and Madulu study sites are within the central semi-arid zone, and are thus of particular interest. Van Vuuren undertook her fieldwork (1993-94) in Ndala village about 100 kilometres north east of Tabora town in Tabora region. She reported that “67% of all households…have children who live and/or work in another village or city in Tanzania” (Van Vuuren, 2000: 12)
The single most important reason relates to females moving out of the village after marriage, however labour migration of both sexes to urban centres is given as the next most important reason. Education – the attendance of secondary schools by children up to 20 years of age – is the third main reason.
Several PRA reports covering semi-arid areas note the role of migration in livelihoods. Of Singida’s central sandy plains, it is reported that although “migration in search of agricultural labour or other work is not common from most areas of this zone in ‘normal’ years”, for the bad year of 1998/99 it was observed that migration was “very important for the poor”. (SCF, 1999a).
In the SCF Household Food Economy report for the “semi-arid lands zone” of Dodoma, seasonal migration was seen as being minor in a year in which there was an unexceptional level of food availability - “perhaps 10%” of poor households migrate in such periods. Migration is to plantations in Arusha, Morogoro and Iringa mainly, although a few migrants go to urban centres, and is generally undertaken by adult males. In years when food availability is significantly below usual levels however, labour migration is “the only coping strategy that can meet a significant percentage of… [the food]… gap”. The report suggests however that migration as a common short-term strategy, undermines long-term food self-sufficiency among poor households, reducing people’s cultivation of their own farms. (SCF 1999b: 35)
In the SCF Household Food Economy report for Arusha, it was noted that in-coming migrant labour was drawn every year from Dodoma and Singida regions. Seasonal and non-seasonal migration also occurred from within rural Arusha to district headquarters. For example within the ‘Mid-altitude Hanang/Babati’ zone, labour migrated to Babati town, Katesh and Dareda. These centres provided a steady source of demand for firewood and charcoal and for building supplies such as bricks and poles. Men find petty trade and construction opportunities in the dry season. In the less-
52
food secure Mbulu central area, the report noted that due to growing land scarcity the current temporary income opportunities, "which include local agricultural employment, or migrant work in areas like Mang’ola Chini on the onion plantations or the Bashuto wheat complex, may soon become permanently entrenched as the only options available” (SCF, 1999c: 83).
Many of these movements are short-term, seasonal coping strategies. They mostly involve individual family members rather than whole households. Under certain conditions migration may have a greater sense of permanency, and/or involve whole households.
Commenting on migration patterns in Sukumaland – now Mwanza and Shinyanga - Madulu (1998) cites URT (1997) in arguing that migration is an economically significant activity. The major reasons behind continued migration are the search for new farming land, better pasture and water for livestock, and employment opportunities. “During the 1988 population census, Mwanza region recorded a net out-migration trend probably due to land pressure for both farming and livestock keeping” (Madulu, 1998: 9).
The Usangu plains in the north east of Mbeya region mostly fall within the southern tip of the central semi-arid zone. While these areas experience erratic and unreliable rainfall ranging between 400-600 mm, the presence of the Great Ruaha river system enables irrigated agriculture in the southern zone of the plains. The mid zone, which is dominated by seasonally-flooded grasslands is suitable for livestock keeping; the northern zone is dry and infested by tsetse flies.
Since the 1960s the Usangu plains have witnessed more pronounced, long-distance and permanent in-migrations of both pastoralists and crop cultivators. Shortage of land elsewhere in Mbeya (Makete district) and Iringa region has driven the cultivators to Usangu. New crops have been introduced and small-scale cultivation intensified in response to urban growth, albeit pressures on the availability and fertility of land have increased. While the pastoral groups, including groups of Maasai, Sukuma, Nyaturu, Barabaig and Gogo are driven by drought and environmental conditions in the north. The effect of these pastoral migrants is viewed as profound. Existing grazing management regimes have been overwhelmed, and land is reported to have been degraded through trampling, soil compaction and sheet erosion. Increasing land and water use conflicts between the many user groups, has been sparked by the in-migrations (Mbonile et al, 1997).
In Mvumi Division, Dodoma Rural District, which in 1988 had out-migration rates of 38 percent, most of the migrants are young men bound for Dar es Salaam, often to work in butcheries there owned by people from Mvumi. Others go to work, for example in restaurants or grain mills, in bigger towns like Dodoma, Arusha, Iringa or Moshe. Mvumi’s population density is about double that of the surrounding area and cited as driving the out-migration, with runs at about 50 percent more than adjacent areas. While income from seasonal migration is of more direct importance to Mvumi households, permanent migration establishes useful rural-urban linkages (Holtland, 1994: 5).
4.4 Agricultural intensification and extensification Agricultural intensification has been defined as:
“increased average inputs of labour or capital on a smallholding, either cultivated land alone, or on cultivated grazing land, for the purposes of increasing the value of output per hectare” (Tiffen et al., 1994:29 quoted in Carswell: 1997:3).
Boserup (1965) argues that intensification is an induced response to population growth. She argues that increasing population pressure provides the primary stimulus for innovation and intensification. Boserup’s argument focuses on a number of stages in the frequency of cropping, from less to more intensive cultivation. Binswanger and Ruttan (1978) take a different view, arguing that agricultural intensification is not driven by population growth alone, and successful innovation may be induced

53
by policy. In the induced innovation model, technical and institutional changes required to develop agriculture are endogenously derived as a result of change in resource endowments and demand (Carswell, 1997: 10). More recent theories of intensification have focussed more squarely on the role of institutions in shaping the extent and type of intensification. Turner et al (1993), cited by Carswell, emphasise the role of supportive socio-economic organisations and structures in ensuring sustainable agricultural intensification. Of particular importance are the rules governing customary resource allocation. The existence and quality of input and output markets are further important factors for intensification.
4.4.1 Agricultural intensification in Sub-Saharan Africa
Pingali, Bigot and Binswanger (1987) studied mechanisation in SSA and concluded that population growth and access to markets were the main determinants of intensification. Turner et al (1993) support this induced intensification model in their comparative study of agricultural intensification in SSA. They found that levels of cropping frequency had been achieved “everywhere primarily by major increases in labour (amount per hectare) and by modest increases in capital inputs (monetary investment)” (Turner et al, 1993, quoted in Carswell: 1997: 11). In a follow up study to that of Tiffen et al (1994) in Machakos, Kenya, Murton (1997: 5) questioned whether the “sustainable transformation of the Machakos agricultural environment has been translated into sustainable livelihoods for all those living in the area”. Whilst many people have enjoyed rising living standards, those farmers without access to non-farm incomes and urban remittances, have not enjoyed enhanced livelihoods. The benefits of intensification may not be evenly distributed or experienced.
Carswell reports that the majority of agricultural production systems in SSA remain low input and only minimally intensified (Carswell, 1997: 6).
Is agricultural intensification a major livelihood strategy within semi-arid Tanzania, particularly amongst the poor? The evidence suggests that productivity increasing intensification has not been a significant livelihood strategy for the poor, rather, agricultural productivity has if anything fallen for the less well-off.
“Ten years ago we harvested ten sacks of cassava and eight sacks of maize per acre. Today….some of us get three or four sacks of maize while others harvest nothing.” (A farmer from Hingawali, Lindi, quoted in Narayan, 1997: 40 ).
There is considerable evidence to suggest that farmers are unable to increase output through intensified production due to lack of access to key inputs. Table 4.2 indicates what farmers consider to be the key constraints to agricultural productivity.
Table 4.2 What villagers in Tanzania perceive as constraints in agriculture: The five most frequently mentioned constraints (Source: Narayan 1997: 41).
Constraint Number of villages highlighting the constraint
Percentage of villages highlighting the constraint
Credit 65 89
Pests and diseases 64 88
Availability of implements 63 86
Price of inputs 62 85
Availability of inputs 60 82

54
Narayan’s study highlights the point that within villages, it is the poor who are far more likely to experience poor access to productivity enhancing inputs, land, and difficulties in transporting crops to market (Op. Cit: 41). Wealthier farmers engaged in high value crop production, often with access to irrigation and with the means to market their produce, do engage in intensification but are also drawn to exploiting the relative abundance of land for those with liquid assets and connections. Whilst intensification in the use of agricultural inputs has been problematic, there is plenty of evidence to suggest changes in livelihood strategies along the itinerant pastoral/sedentary cultivator axis, with increases in sedentary practices. Also, there is plenty of evidence of population pressures, particularly through displacement or migration, leading to increased conflicts over land.
Wolmer reports, somewhat disapprovingly that:
“Much of the literature on agricultural intensification talks of the inevitability of rising population density driving the intensification of agriculture towards the greater articulation of crops and livestock. As increases in population occur, the premium on land grows as does the availability of labour. The result, it is held, is an “evolutionary” process of intensification, resulting in a move from extensive pastoralism to intensive mixed farming, which is seen as the most efficient and sustainable means of increasing food production.” (Wolmer: 1997: 3)
Wolmer argues that research supports the view that integration of crops and livestock (and agricultural intensification generally) can be driven as much by market forces and policy developments as by population growth. Whichever view one takes, it is clear that changes in the mix of livelihood strategies by pastoralists and agro-pastoralists have been taking place in semi-arid Tanzania. As an example of this, a study conducted by Bertelsen and Jorgensen13 (1996) shows that Maasai pastoralists and agro-pastoralists are changing their production activities towards irrigated agriculture in Arusha. The authors argue that conditions for production have changed for the Maasai over the course of the last century as access to land and water has been restricted. This, “combined with an increased interest in village politics” has “empowered” the Maasai to change land demarcation and intervene into “non-Maasai” irrigation systems. The 'agriculturalisation' of pastoralists is now taking place much further south, into Morogoro and Iringa14. There is also evidence of a polarisation of livestock ownership and access in at least some agro-pastoral areas. This process is reported by CARE (1995), in a study that investigated food and livelihood security in Shinyanga region. Farming systems in the region are characterised by a mixture of agricultural production and livestock keeping. CARE reports a general decline in the ability of households to produce food over the previous fifteen years, and observes that distress cattle sales have led to increased livestock ownership polarisation.
In Kwimba District, Mwanza (which with Shinyanga forms Sukumaland), the benefits from the interactions between crops and livestock are similarly only available to minorities in the community who own cattle (30%) or smallstock. Cropping is the dominant activity accounting for 93% of sales, with the sale of livestock and livestock products making up the remaining 7%. Cattle in addition provide manure to sustain crop yields, while draught power can alleviate labour costs and shortages, improve the quality and timeliness of farming operations, and increase farm productivity. Furthermore, cattle may be used to mitigate risk: in the event of an unforeseen shock they may be sold to provide for consumption smoothing. Cattle owning however, which typically results in significantly higher income and consumption outcomes, is beyond the reach of the poor who (in the absence of credit markets) lack the required capital. Dercon and Krishnan (1996) also found that a
13 The area covered by this study – between Lake Natron and Lake Manyara in the Rift Valley – is outside the central semi-arid zone. The authors however refer to the climate as being semi-arid (Bertelsen and Jorgensen, 1996: 8). 14 Pers. Com with Dr. Semboja, Sokoine University of Agriculture November 2000.
55
higher income-earning capacity due to more male labour and a larger farm size, were linked to cattle ownership.
In the southern zone of Usangu plains, Mbonile et al (1997: 73) report that in-migration has led to new crops being introduced, and that the “production of vegetables for example is increasingly becoming intensive (..prompted by the increased market demand, due to growth in urban centres)”. With the presence of the Great Ruaha river system and irrigated agriculture this must be considered a relatively favoured environment.
4.4.2 Extensification
Throughout the semi-arid areas as elsewhere in Tanzania, the bringing of more land into cultivation or grazing is ubiquitous, and almost all case studies refer to reduced areas and periods of fallow. Reduced fallow, over-grazing and deforestation are most frequently cited as the direct causes of declining soil fertility and land degradation.
In the case of Ikuwala village, Mazombe District (Case Study 2), richer farmers have expanded the agricultural frontier using their financial and social assets to rent and monopolise land. Poorer households have in turn been forced to exploit more marginal areas, which together with changes in farming practice have seriously accelerated erosion. Falling yields are in turn off set by further extensification. Richer farmers have however made some investments to drain swampy ground.
In a study of land degradation in the semi-arid areas of Kondoa District by Dejene et al. (1997: 23), the two study villages on the Masai plains represent expansion areas either for livestock holders displaced from the destocked area of Kondoa (KEA), or for seasonal migration influxes from further afield (e.g. Singida, Arusha), or for extensive cultivation by large-scale farmers. Here too, but notably in the older settlements in the land squeezed Kondoa hills, the authors suggest that the practice of fallowing is virtually absent. A similar situation is described for Dodoma Rural District where more than a third of smallholders in Mvumi Mission cited a reduction in fallow periods as the prime agricultural practice likely to degrade the physical environment FSR/SUA (1995; 132). Also writing of the Masai plains, Mung’ong’o (Case Study 7) describes the more resourceful households in Soya village, where land availability is not a constraint, as having succumbed to "a sense of recklessness" in the way they have embarked on extensive monocropping.
4.5 NR versus non-NR contributions to livelihoods Ellis emphasises the key role of diversification as a survival strategy for rural households. Within this context he has proposed a useful livelihoods classification that identifies strategies according to their dependence on NR and non-NR based activities (see box 2.2).
Despite the extent of diversification amongst all wealth groups, alternative livelihood options for poorer households typically involve increased reliance on natural resources (e.g. grass cutting, brick making, firewood collection). This reliance is further reinforced at times of stress when wild foods may be collected for consumption as well as for trade (see Table 4.6). In the recent study undertaken by Monela et al. (2000), the reliance on adjacent miombo woodland resources is even greater for peri-urban communities - 69% of income - than for remote villages (52%). Income for the former is heavily skewed in favour of charcoal production and sale, with honey production the salient NR feature of remote household incomes (Case Study 5). The case studies in section 5 suggest that wealthier households are seldom directly engaged in the collection or use of non-farm natural resources.

56
Several studies (Madula, 1998; Mbilinyi et al., 1999; Annex F) note the draw of labour to mining15 (and to tourism16), larger commercial enterprises and small-scale mining endeavours, both of which have expanded since liberalisation.
Private trade, which has significantly increased since its earlier prohibition, is undertaken by all wealth groups, but the nature and scale of enterprises typically reflects the wealth status of households. Youth in particularly are drawn to trade seeing it as providing better opportunities than agriculture (Mung'ong'o, 1998; Madula, 1998). In peri-urban areas, single mothers appear to be drawn to trade (Monela et al., 2000). Formal sector employment is usually beyond the reach of the poor.
4.6 Livelihoods and coping behaviour This sub-section reviews some of the empirical evidence on coping behaviour in Tanzania, most of which is at the household level. Unlike the previous sections which have viewed livelihood strategies against an unspecified, generally longer period, the coping strategies reviewed below relate either to seasonal strategies undertaken every year, or to strategies undertaken in response to unusual shocks to the farming system.
4.6.1 Coping with seasonality
A good deal has been written on how households cope with seasonal food shortages, both for the region and in Tanzania. Narayan (1997) lists six basic strategies: piece work, petty business, changes in diet, fewer meals, loans from traders, and selling cattle. Research indicates that these strategies are undertaken in a predictable and logical sequence, starting with easily reversible strategies which do not erode the asset base of the household (e.g. reduced meal frequency) to less easily reversible and more erosive strategies (e.g. sale of cattle or land, and in extremis forced migration). Seasonal water problems are also of great concern in semi-arid Tanzania, and Narayan (op. cit.) indicates that coping strategies almost invariably involve resorting to unprotected water sources such as ponds, rivers and uncovered dug wells, with consequent knock-on effects in terms of waterborne diseases such as diarrhoea and cholera.
4.6.2 Coping strategies in Shinyanga
The 1995 CARE study of food and livelihood security in semi-arid parts of Shinyanga region - Meatu, Maswa and Bariadi districts - reports a number of activities which households adopt in response to “food shortages or [to] meet competing livelihood crises”. There is wide local consensus that households in Shinyanga villages are typified by three main strata based on access to critical resources and the means of agricultural production (see Table 4.3). Generally it appears that the poorest constitute the largest group in any setting and typically are in a majority. Cropping is the main farming system, with food staples including maize and sorghum supplemented by sweet potatoes and millet, and cotton representing the major cash crop. Most families will have experienced severe and prolonged food security in the past five years and transitory food insecurity is a yearly phenomenon (CARE, 1995).
15 Export earnings from minerals (gold, diamonds, gemstones and minerals) have risen from US$ 15.1 million in 1995 to US$ 80.4 million in 1999 (Trade Point, UNCTAD). 16 Total earnings from tourism have risen from US$ 65 million in 1990 to US$ 733 million in 1999 (Trade Point, UNCTAD).

57
Table 4.3 Criteria for social stratification as reported by villagers (CARE, 1995: 20)
Strata Land criteria Livestock criteria
Rich Own 10-45 acres, able to produce large quantities of food
Own from 30-300 cattle
Middle Class Own 3-10 acres Own 10-20 head of cattle
Poor No land or 1-2 acres No livestock
Respondents mentioned the years 1984, 1992, 1993 and 1994 as difficult times when food coping strategies were necessary to ensure livelihoods. During these years poorer households will have both intensified seasonal coping strategies (e.g. seeking wage labour) and undertaken new less easily reversible strategies (e.g. the sale of productive assets).
It is noticeable that even where poor and middle strata adopt similar coping mechanism, the reduced asset base of the poor effects qualitatively different outcomes. When for example asset sales are undertaken, the poor are forced to sell their limited and most basic belongings (e.g. beds, buckets and chicken) while less poor households are cushioned by their assets and able to sell items such as bicycles, iron sheeting and especially cattle. Similarly it appears the poor here are more constricted in what they can borrow from friends and kin. It is not clear whether this is reflecting the covariant nature of chronic food insecurity across the community, the limited ability or social capital of the poor to bridge the social strata, or concerns amongst other strata with repayment issues.
Table 4.3 Coping mechanisms for lower and middle strata in Shinyanga
Livelihood system component adjustments Type of livelihood strategy
Asset adjustments Strategies/activities Consumption adjustments
Seasonal coping - or coping with transitory food insecurity:
- Borrowing food from friends & kin: middle strata able to borrow more & without interest; poor more restricted. - Sale of productive and non-productive assets: beds, buckets, chickens for poor; bicycles, tin sheets, cattle for middle strata. - Redistribution of livestock.
- Wage labour 'kibarua': weeding, cotton harvesting, land preparation for food crops, water collection, house construction - generally in surrounding area. - Out-migration of individuals in search labour.
- Reduced frequency & quantity of meals - Substitution of sweet potatoes & sorghum for preferred maize and rice. - Increased use of wild foods. - Sending children away to relatives.
Sustaining livelihoods in bad years also includes:
- Calling down formal claims (Food Aid)
- Out-migration of household
(source CARE, 1995: 38-41) Individual adjustments to the livelihood components do not necessarily represent coping behaviour induced by food or livelihood insecurity, but may be a household's response to meet non-recurrent
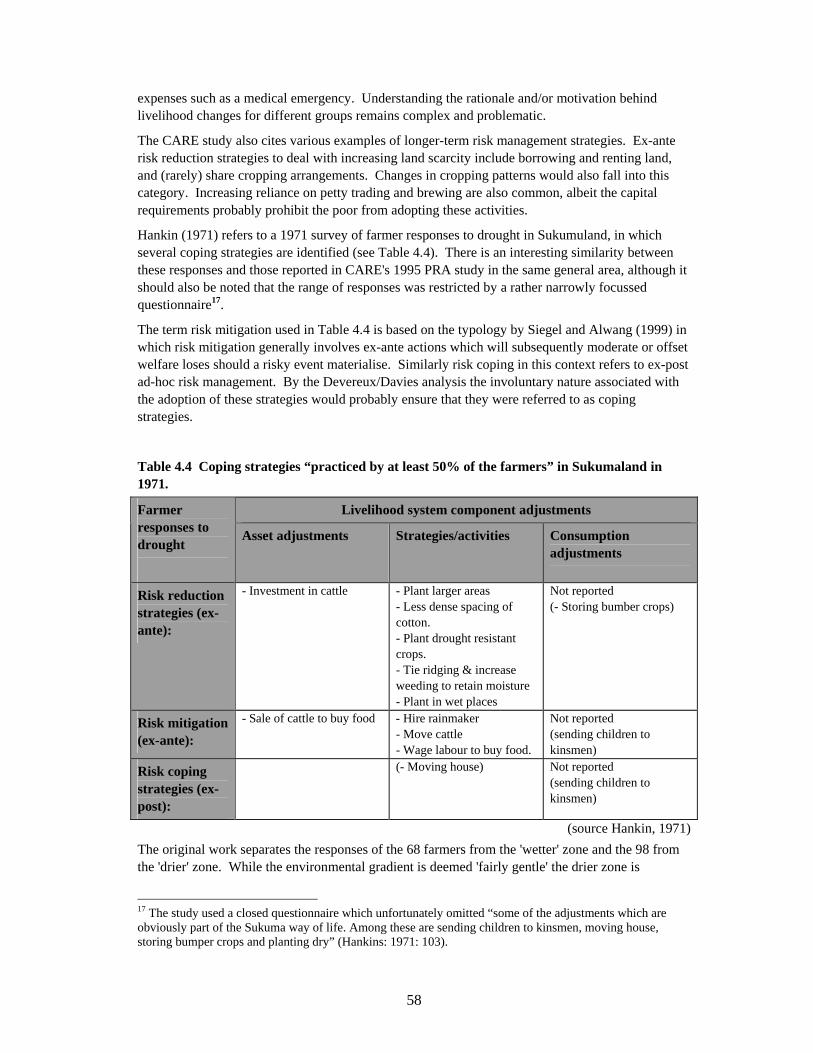
58
expenses such as a medical emergency. Understanding the rationale and/or motivation behind livelihood changes for different groups remains complex and problematic.
The CARE study also cites various examples of longer-term risk management strategies. Ex-ante risk reduction strategies to deal with increasing land scarcity include borrowing and renting land, and (rarely) share cropping arrangements. Changes in cropping patterns would also fall into this category. Increasing reliance on petty trading and brewing are also common, albeit the capital requirements probably prohibit the poor from adopting these activities.
Hankin (1971) refers to a 1971 survey of farmer responses to drought in Sukumuland, in which several coping strategies are identified (see Table 4.4). There is an interesting similarity between these responses and those reported in CARE's 1995 PRA study in the same general area, although it should also be noted that the range of responses was restricted by a rather narrowly focussed questionnaire17.
The term risk mitigation used in Table 4.4 is based on the typology by Siegel and Alwang (1999) in which risk mitigation generally involves ex-ante actions which will subsequently moderate or offset welfare loses should a risky event materialise. Similarly risk coping in this context refers to ex-post ad-hoc risk management. By the Devereux/Davies analysis the involuntary nature associated with the adoption of these strategies would probably ensure that they were referred to as coping strategies.
Table 4.4 Coping strategies “practiced by at least 50% of the farmers” in Sukumaland in 1971.
Livelihood system component adjustments Farmer responses to drought
Asset adjustments Strategies/activities Consumption adjustments
Risk reduction strategies (ex-ante):
- Investment in cattle - Plant larger areas - Less dense spacing of cotton. - Plant drought resistant crops. - Tie ridging & increase weeding to retain moisture - Plant in wet places
Not reported (- Storing bumber crops)
Risk mitigation (ex-ante):
- Sale of cattle to buy food - Hire rainmaker - Move cattle - Wage labour to buy food.
Not reported (sending children to kinsmen)
Risk coping strategies (ex-post):
(- Moving house) Not reported (sending children to kinsmen)
(source Hankin, 1971) The original work separates the responses of the 68 farmers from the 'wetter' zone and the 98 from the 'drier' zone. While the environmental gradient is deemed 'fairly gentle' the drier zone is
17 The study used a closed questionnaire which unfortunately omitted “some of the adjustments which are obviously part of the Sukuma way of life. Among these are sending children to kinsmen, moving house, storing bumper crops and planting dry” (Hankins: 1971: 103).

59
considered to engender a greater drought hazard with associated risks. Hankin suggests that "there is a distinct difference in the adaptive capacities of the respective farms (with) those in drier areas appearing to be more capable of sustaining drought effects. Sukuma farmers have responded to the difference in environmental conditions by making permanent alterations in their farming methods, but not by changes in their use of short term adjustments to the drought hazard." (Hankin, 1971: 104).
4.6.3 Coping strategies in Singida
In the SCF Household Food Economy report for Singida, PRA respondents throughout the central sandy plains confirmed that 1997-98 was a 'bad' year. There were heavy rains and pests in 1997-98. Villagers reported a “green stink bug” infestation plus the devastation of bulrush millet and sorghum just before harvest by quelea quelea birds.
Table 4.5 Wealth groups in Singida's central sandy plains (SCF, 1999a: 16)
Strata Land criteria Livestock criteria
Rich Cultivate about 7 acres. Own from 30 cattle (15 of which are loaned to other groups).
Middle Cultivate 4 acres. Own 10 cattle and similar number of sheep or goats.
Lower middle Cultivate 3-4 acres. Own & borrow cattle; about 5-7. Own similar number of sheep or goats.
Poor Cultivate 2-3 acres. Borrow about 5 cattle; own no other livestock.
Very poor Cultivate about 2 acres. Neither own nor borrow livestock (apart from chickens).
The maize crop was less damaged but reduced by water-logging in the early stages of cultivation. However, “once farmers observed that their grains had performed badly they planted large areas of sweet potatoes” which resulted in high yields, albeit insufficient production to fully counter the failure of other crops (SCF, 1999a: 29). The planting of the sweet potatoes was thus a strategy to mitigate or cope with the expected shortfall in maize production.
From November 1998 to the time of green maize availability in 1999 (i.e. March), maize prices were very high (more than 3 times higher than at the same time in 1996-97). Livestock prices were much lower than normal, resulting in purchasing power being much lower. Those classified in wealth rankings as very poor, poor, and lower middle, flooded onto the labour market where “payment rates for agricultural work declined steadily during the year both in terms of food and the purchasing power of cash paid” (Op.cit: 30). Lack of grain reduced brewing to one third of normal outputs, but prices were half as much again. Some relief food was made available between Nov. 98 and April 99.
Following the series of shocks (i.e. weather and economic) the limited productive resources, food stocks or other forms of liquid capital, belonging to poorer groups, and their lack of specialised skills to undertake anything other than basic wage labour, leave them significantly exposed. The SCF report anticipates that without assistance both 'very poor' and 'poor' groups will be reduced to expenditure/ consumption patterns beneath the 'minimum acceptable'. For the 1999-2000 season it

60
identifies deficits in annual food needs between 25-35% and 15-25% for the 'very poor' and 'poor' groups respectively, who together represent 31% of the population, or more than 80,000 people. Picking up on the vulnerability associated with the erosion of household assets at times of stress, the SCF analysis further suggests that some of the 'lower middle' group should now be considered as 'poor'. For the semi-arid areas of Dodoma, where similarly two to three years of poor harvests have had cumulative effects, 58% of the population are expected to suffer food deficits in the 1999-2000 season (SCF, 1999b).
Table 4.6 Coping strategies employed in the central sandy plains of Singida, 1997-98.
Livelihood system component adjustments Household responses to 'bad' year Asset adjustments Strategies/activities Consumption
adjustments
Risk reduction strategies (ex-ante):
- [All?] Planting of drought resistant crops (eg sweet potatoes).
- [M & R] Food stocks carried over. - [LM] Some may have carried over food stocks.
Risk mitigation (ex-ante):
- [VP,P] Gifts in form of food received. - [M & R] Increased livestock sales. - [M & R] Increased crop sales.
- [All?] Planting of drought resistant crops (eg sweet potatoes). - [VP, P] Entreated support of richer relatives & neighbours. - [VP, P] Expanded agricultural and casual labour. - [VP, P, LM] Gathered wild foods
- [All] Reduce spending on non-essentials.
Risk coping strategies (ex-post):
- [VP] Secure food aid - [VP,P] Gifts in form of food received - [VP, P, LM] Gathered wild foods. - [M & R] Increased livestock sales.
- [All] Reduce spending on non-essentials. - [VP] Reduce expenditure on essentials (eg soap, kerosine, grinding), school fees, taxes. .
[VP - very poor; P - poor; LM - lower middle; M - middle; R - rich] (source SCF, 1999a: 36-37)
4.7 Gender and livelihood strategies Household level analyses fail to take account of the division of labour between men and women, or of the unequal access to and allocation of resources. As briefly discussed in section 2.4.2, the literature identifies a number of themes that link gender to household food security and coping strategies. These include conceptual issues about intra-household relations; resource and entitlement distribution; agricultural production, processing and exchange; social networks; nutritional status of women and children; policy impact and failure.
Whether as heads of households or members of households headed by men, many studies reveal that women (and girls) are subject to institutionalised gendered inequalities, and that they are exposed to far greater risk of poverty (Laier et al, 1996: 4; Mbughuni, 1993: iv; Mbilinyi et al., 1999: 93). While further work is required to understand the livelihood options and shorter-term coping strategies undertaken by women in Tanzania, initial indicators confirm that women's behaviour differs according to several variables including the household poverty/social status (e.g. see Kerner and Cook, 1991).
61
In many sub-Saharan countries households headed by women are extremely vulnerable to poverty (David et al, 1995). In mainland Tanzania 12.2 percent of all households are headed by women according to the results of the 1993 HRD survey, with the respective rural and urban (excluding Dar es Salaam) percentages being 10 percent and nearly 18 percent. This has since been generally corroborated by the 1995 PPA Survey, which identified 12 percent of rural households as being headed by women. The PPA study however also found that female-headed households were less well off than their male counterparts, as measured by subjective wealth ranking methods. Based on measurements of consumption and expenditure however, the HRD survey failed to recognise this distinction.
Female-headed households (FHHs) were determined by both studies to have access to fewer assets – less land, less livestock, fewer personal possessions (watches, bicycles, radios) – as above, and to have more dependants. The case study of two communities in Kwimba District (CS 3) indicates that while FHHs had fewer household possessions (deemed a proxy for income) the construction of their houses was no worse than for male-headed households. In the Dodoma Rural District case study however (CS 6), FHHs generally lived in poorer houses. A study of four villages in Dodoma by Hella et al. (2001), comparing agricultural production and the ability of FH and MH households to cope with stochastic climate conditions, concludes that FHHs are inherently disadvantaged by socio-economic (e.g. ownership of factors of production) and socio-cultural factors (e.g. land tenure). The PPA data revealed that female-headed households appeared to do more with fewer assets through a range of coping strategies, notably petty trading. Households headed by women typically operate with fewer resources and thus within finer margins. While their consumption patterns may be the same as male-headed households, they are nonetheless more vulnerable (Narayan, 1997: 34).
In the case study of Ikuwala sub-village, Mazombe Division, Iringa District (CS 2), four out of ten sample households in the poorest group are female-headed, compared with two out of eleven in the middle group. In the Dodoma Rural District case study (CS 6), female-headed households account for almost one quarter of all households in two villages, however the area has been subject to high levels of out-migration, both permanent and seasonal, and the de-stocking of Mvumi Mission may also have had an influence. Higher dependency ratios for FHHs are remarked in both studies.
In her study of female-headed households in a relatively isolated village in Nzega District, Tabora, van Vuuren (2000) noted that in general FHHs harvested smaller amounts of maize, had lower values of subsistence crops, had lower incomes from employment and income-generating activities, and received more kin gifts than male-headed households. Male-headed households were on average however larger than their female counterparts (5.40 members - adults and children - cf. 4.08 for FHHs) in the study, and the author notes that household size might be a more relevant variable for economic analysis.
Sub-section 4.2.2 has already explored changing social identities, including the expanded roles played by women beyond those traditionally assigned to them. The changing pattern of labour allocation within rural households and across generations may impact on women in at least two ways. With the increasing commoditisation of food - and as Mwamfume (1998) references for Mbeya, health services - and the individualisation of economic activity, men and particularly younger men are taking up activities such as prepared food sales which have been traditionally associated with women (see for example case study 1). More directly, the increasing engagement of men in distant employment, notably mining in Shinyanga (Madulu, 1998) and Dodoma (SUA, 2001, Annex 1F), which may ultimately provide additional income, obliges many women to spend more time in market activities irrespective of their other roles. Together with increasing their workloads, women have less time to cultivate and provide food (Mbilinyi et al., 1999).

62
The research undertaken by Mbilinyi et al.(1999) in Shinyanga and Ngorongoro, both confirmed that men usually had control over higher value resources (e.g. cattle, cotton and maize) compared with those managed by women (e.g. goats, milk and hides), and revealed and raised other concerns that were deemed (by the authors or feedback workshop participants) to have an impact on food security. These included demoralising aspects of bridewealth, the precarious position of polygamous wives and widows, violence against women and children, child marriages, and specifically in Shinyanga the beating and murder of old women identified with witchcraft.
From the case studies, and supported by the secondary data, a further disturbing issue relates to the skew associated with educational resource. In rural Shinyanga Districts (CS 4), while adult educational attainment is not found to be greatly dissimilar across consumption terciles, the children of non-poor households have completed nearly 50% more than those of the poorest tercile (Dercon, 1997). In Kwimba District (CS 3), skews in adult educational attainment are noted, both between the accessible town location and the more remote village, and between men and women. Thirty eight percent of women (upwards of ten years) however, compared with 21% of men in both locations, have had no formal education. For the same district, Madula (1998) cites 48% and 38% of women and 27% and 22% of men for two other locations. In Dodoma Rural (CS 6) 51% of women are cited as having had no formal education, compared with 37% of men. The Tanzania Demographic and Health Survey 1996 (URT, 1997) confirms that the highest proportions of women with no education (above 40%) and men (above 35%) are concentrated in the Dodoma, Arusha, Lindi, Mtwara, Iringa, Singida, Kigoma, Shinyanga and Mwanza regions. As per the stakeholder seminar (Annex 1B), human capital, and specifically education and training for girls and women, must be considered a significant entry point for development interventions.
4.8 Factors shaping livelihood strategies Section 2 describes how livelihood strategies comprise the range and combination of activities undertaken by the household to generate a living. For a given household they are circumscribed by the platform of assets available to that household, and then shaped by the policies, institutions and processes operating at all levels (i.e. from the household to the international), which are deemed to mediate the transformation within and between assets, strategies and outcomes. The vulnerability context - shocks, trends and seasonality - also represents a further level of influence, which either through the anticipation of potentially dire events may play a role in determining risk management strategies, or in response to the impact of unforeseen events may contribute to rehearsed or ad-hoc, ex-post strategies.
The significance of assets - their levels and combinations - in influencing people's livelihood choices, elaborated earlier in this section, is corroborated by the case studies in section 5. Poorer household groups invariably have access to or possess fewer assets while the mix and nature of these assets typically allow for less flexibility. This impoverishment in turn prohibits them from undertaking certain strategies including those that specifically benefit the resource-rich - points that will be elaborated later.
Together with the tangible factors of production (e.g. land, labour) and capital, assets include those impalpable components associated with human and social capital (e.g knowledge, experience, relations of trust, common rules, norms and sanctions). These latter characteristics are closely aligned with those identified in the literature on farmer decision-making18, an avenue beyond the resources of this project to explore but awaiting clearer linkages to be made with livelihood approaches. In the stakeholder seminar, human capital was described as the 'skeleton (backbone) of
18 Robinson et al. (2000) quote Tait (1982) in identifying the underlying component of decision-making as "thought processes, value systems, and motivations", and cite Nazarea-Sandoval's (1995) cognitised models which consider experiences and perceptions, images and meanings, amongst others.

63
livelihood strategies', and both social and human capital were acknowledged as potential entry points for interventions (Annex 1B). They are the subject of the parallel project (R7806). Table 2.4 offers a format whereby the two main strands of livelihood classifications - those based on the nature of actual livelihood activities and those reflecting the perceived rationale or motivation - can be simultaneously considered in developing understanding of groups' livelihood strategies.
4.8.1 Policies, institutions and processes
From the case studies and the work undertaken by participants at the stakeholder seminar, various factors have emerged, either as issues inviting further consideration, or as key to shaping people's livelihood strategies. While some of these factors have already been flagged or discussed in the context of specific strategy types earlier in this section (e.g. the role of long-term social processes on diversification), further elaboration of key factors follows.
Structural adjustment programmes: SAPs policy packages introduced since the early 1980s have been characterised by Bagachwa et al. (1997) as comprising: (a) Policies that seek to restrain demand in the economy by reducing expenditure on imports and
releasing resources for exports (e.g. government spending cuts, control of money supply, wage cuts).
(b) Supply switching measures to provide incentives for shifting resources from non-tradeables to tradeables (e.g. de-controlling domestic prices, encouraging market-determined exchange rates and removal of wage controls).
(c) Long-term supply policies (e.g. trade liberalisation, interest rate liberalisation, institutional restructuring - parastatals, civil service).
Aimed essentially at restoring macro-economic stability and restructuring Tanzania’s economy, SAPs have inevitably had an effect on people's livelihoods, and the environment. These are suggested to include (Barachwa et al., 1997): • Increased cost of agricultural inputs and reduced availability of credit with which to buy them,
has promoted agricultural extensification and hence encroachment onto marginal lands, erosion and deforestation.
• Cuts in government spending have led to cuts in social services, NRM activities and on afforestation. This has exacerbated poverty and unemployment, and increased pressure on open access resources by the poor to survive.
• Export promotion and trade liberalisation have increased the profitability of resource-based exports, leading to excessive extraction or harvesting of such resources.
• Longer term effects through changes in employment and income distribution: generally poorer and small producers, who work less fertile land and cannot afford fertilisers, have been hardest hit.
While some counsel that the social and environmental impacts of SAPs are 'complex, ill-defined and difficult to bound' (Mearns, 1991) the view that SAPs have undermined productivity, particularly amongst the poor, and contributed to the collapse of public services, both of which have promoted off-farm diversification, is forcibly articulated by Bryceson and colleagues (see Madulu, 1998; Mung'ong'o, 1998).
Barachwa et al. (1997) in addition point to the limitations and clash of sectoral level policies, and their effects on livelihoods. These include: diminished government support for the agricultural sector and weak agricultural extension; lack of enforcement by the Forestry Department; ambiguous land tenure (providing no incentives to conserve natural resources), inappropriate energy pricing and insufficient research and development of energy options (resulting in a very high demand for fuelwood and charcoal).

64
Hitherto, policies relating to natural resource management and rural development were drawn-up and generally implemented along sectoral lines by separate ministries and other agencies. There are however signs that policy development is becoming more consultative and that the decentralization process is creating the opportunity for natural resource management and rural development concerns to be addressed in a more integrated way at the local level. In the late 1990s a number of new policies have emerged relating to natural resources including: Land policy (together with the Land Act and Village Land Act 1999), Forestry policy, Wildlife policy and Environmental policy. An important theme running through these policies is a commitment to the devolution of rights and responsibilities to local people as a means of achieving sustainable use of natural resources.
Uncertain market environments (e.g. fluctuations in producer prices, high input prices, and poor input supply) are also deemed to have undermined farming activities and investments (Narayan, 1997). While the number of private traders providing competitive outlets and incentives for agricultural production may have increased with market liberalisation, away from reasonable all-weather roads and consumption centres, their distribution is thin or lacking (Mdadila, 1996). Moreover, private traders representing agribusiness corporations may purchase cash crops on a credit basis. In Shinyanga almost 40% of respondent households in three villages identified selling crops on credit and delayed payment as a major problem (Mbilinyi et al., 1999), and Madulu (1998) cites this as a catalyst for starting non-farm activities to secure alternative sources of income.
In the countrywide World Bank PPA the major constraints on agricultural productivity identified by more than eighty percent of villagers were credit, pests and diseases, lack of availability of implements, and price and availability of inputs crop. While the poor are constrained by their lack of access to land, the primary constraints relate to their inability to make productive use of the land. These include lack of access to credit, the inability to afford the high cost of agricultural inputs, and difficulties in transporting their crops to market (Narayan, 1997). Non-poor farmers however, with the resources to secure and cultivate increasing areas of land, and transportation and access to better market information, are better placed to engage in and benefit from commercialisation. Case studies 2, 3, 4 and 7, offer relevant perspectives on this scenario.
Faced with food deficits even in 'normal' years, livelihood strategies of many poorer household have long embraced seasonal migration by household members to labour markets elsewhere. As noted above in section 4.7 while this may ultimately increase overall household income, it has a significant impact on the undertakings of remaining household labour - notably women - and may tend to further undermine the subsistence capability of the household. Despite the labour requirements of those wealthier farmers able to commandeer more land and engaging in commercial farming, the case studies suggests that casual labour and poor wages tend to prevail outside of market centres in the semi-arid areas. The pull of better employment elsewhere and push of poor local conditions are clearly influencing movement patterns amongst many poorer households. In Kwimba District (CS 3) however, where land itself is a limiting constraints, high returns from cotton and rice sales provide for higher wages. Commercial farmers here employ a large proportion of women, while labour constraints are cited as driving interest in labour saving technologies.
Corruption: Attention was drawn at the stakeholder seminar to the impact of corruption and misallocation of resources at different levels of government (Annex 1B), and anecdotal information suggests increasing concern with - if not levels of - corruption. At the local government level, the impact of corruption on livelihoods may stem from its identification with the allocation of resources (e.g. land adjacent to irrigation canals; Annex 1B) and the securing of agricultural advice from extension services (Narayan, 1997). Prior to the limited success of the Civil Service Reform Programme to establish a smaller, efficient and effective civil service, and its successor the current Public Service Reform Programme, securing political influence or self-enrichment was often more important than service delivery amongst civil servants (Teskey and Hooper, 1999). Most recently,
65
despite nominal decentralisation processes, central government has failed to enable or adequately resource district councils, inhibiting effective devolution. This situation has been further exacerbated and skewed by the introduction of relatively short-term donor projects in certain localities, with disproportionately large resources (Seppala, 1998).
With the waning of traditional relations and institutions, household decision-making and livelihood strategies are increasingly being influenced by new forms of social relations, the individualisation of economic activity and commoditisation. While SAPs, it is argued in sections 4.2 and above, are responsible for the broader processes of social change, the latter in turn give shape to livelihood diversification. Even in Kwimba District, Sukumuland, where agriculture remains by far the most important economic activity and the most preferred occupation with over three-quarters of respondents seeing a promising future in agriculture, the younger generation are investing in non-farm activities like petty trading and mining, and better housing. This is despite a legacy of long-distance travel and trading in which earlier peregrinations had an agricultural focus (e.g. sale or exchange of agricultural products, purchase of tools). Low participation and the lack of diversity in non-farm activity at that time has been linked to the pervasiveness and persistence of cultural values associated with an agricultural identity. Current non-farm activities in Kwimba District have all emerged in the past 5 or 10 years (Madulu, 1998).
4.8.2 Trends, 'true' and seasonal shocks
Environmental trends: From the literature (e.g. Dejene et al., 1997; Christiansson et al.1996; Boesen et al., 1996) and the case studies the picture that emerges for large tracts of the semi-arid zones is that of increasing land degradation and declining soil fertility, and for a majority of poor households, declining yields. In Njombe District, Iringa (CS 1) soil mining is deemed pronounced and concern expressed about increasing environmental stress imposed by non-farm economic activity (e.g sale of building sand, firewood and/or charcoal). In Iringa District (CS 2) most marginal areas have been totally cleared and farming practices are said to have seriously accelerating erosion. Locations in Dodoma Rural (CS 6) are reported to have low and declining levels of soil fertility; and in Kwimba District, Mwanza (CS 3), declining soil fertility on the hill sands is reported by 50% of small holders and linked to over grazing, deforestation and reduced fallow.
Where land availability is a constraint and further agricultural conversion is no longer an option, such as in Kwimba and Kondoa (CS 7) districts, there are pointers that degradation and declining soil fertility may be checked. High levels of out-migration are associated with such areas, both of the poorest, and in Kondoa, of wealthier individuals who have set up 'satellite' households in adjacent areas where land remains available. The increased value assigned to land in these areas, appears over time to check any increase in poorer households, who would be unable to afford inputs to offset declining fertility, together with providing the momentum for resourceful farmers to diversify their agricultural interest through relocation. In those areas where degradation has been tackled through de-stocking (CSs 6 & 7), outstanding issues include enforcement (e.g. sanctions, compensation, cost) and the implications for livelihood, while as with out-migration, the problem may simply have been exported.
Population trends: Section 3.3 indicates that all semi-arid districts have experienced significant population growth, but that this will be greatest in those areas with better infrastructural facilities and higher agricultural potential. Increasing rural population densities are inevitably linked to reduced land availability, which with decreasing fallow reported throughout the semi-arid areas and limited use of inputs, have led to reduced yields and production amongst subsistence farmers. Confronted with declining food security, not a new phenomenon, poorer households have little choice but to diversify their income sources, including off-farm activities (including individual seasonal migration), or to migrate. Elsewhere (e.g. in the southern zone of the Usangu plains), in-

66
migration and market related demand due to growth in urban centres, are linked - as cited in the broader literature - to increased intensification (Mbonile et al., 1997). Questions remain as to whether agricultural intensification, undertaken presently by a resourceful minority, can translate into sustainable livelihoods for the majority.
Access to and use of common pool resources (CPRs) continue to provide a focus for dispute both between different communities and with the state. In either case, increased population pressures (of humans and/or stock) are seen to exacerbate the situation. Furthermore, the state appropriation of land for conservation as protected areas, itself responsible for displacement and increased population pressures, continues to be associated with changes to people's livelihoods including an increase in illegal activities (e.g. poaching). Land has also been alienated by the state for government related projects (e.g. the establishment of wheat farms in Hanang District, Arusha), and since the introduction from the mid 1980s of liberalisation and privatisation policies, by or for private investors. The latter has involved hunting and game ranching, and increasingly mining (Shivji, 2001; Lane and Moorehead, 1996). The loss of land and its associated resources may be an on-going process - a trend - or a rude and immediate shock. Implications for livelihoods have typically been far-reaching over time.
A further area for potential conflict exacerbated by population pressures is that between communities, notably between agrarian and pastoral communities in which access and use of key resources may set the scene. In semi-arid environments in which water is usually a linchpin resource, securing access and maintaining or establishing user rights is typically complex and contested (see Annex 1F; URT, 1998).
Shocks referred to section 3 and identified during the stakeholder workshop included climatic events (e.g. El Nino), drought, and associated death or migration of livestock, and the impact of HIV/AIDS (Annex 1B). Villagers in the Bubu catchment (Dodoma and Singida regions) and in Iringa Rural District, identified famine, drought and floods as the unforeseen events which concerned them most - famine being seen as the outcome of shocks in semi-arid areas. For each eventuality respondents were able to indicate coping strategies that household would deploy to mitigate and/or address its impact. Primary responses to drought in the Bubu catchment related to changes in crop varieties, engaging in casual labour and petty trade, and securing relief aid. In Iringa, water management was cited as the primary response; changing crops, casual labour and relief aid also feature prominently. In the event of floods migration featured prominently in both locations, but was ranked second to changing crops amongst villagers in Iringa; water management was second in the Bubu catchment (Annex 1F).
Livestock, and cattle in particular, represent a flexible asset with which to offset household vulnerability. In Shinyanga, where cattle traditionally occupy important social and economic roles in Sukuma culture, distress sales of livestock, disease and theft, appear to have contributed to the polarisation and commercialisation of livestock ownership (CARE, 1995).
In 1997 the prevalence rates for HIV/AIDS amongst adults (15-49 years) in Tanzania was given as 9.42 percent (World Bank, 2000b). The impact of HIV/AIDS on the rural sector includes: loss of labour and income affecting all productive activities; health problems; intergenerational loss of indigenous practice and specialised farming skills; increase in women- and youth- headed households, and accompanying switch in roles; loss of agricultural assets e.g. widows may lose land, sale of assets to meet medical and funeral costs; absenteeism amongst and demise of extension staff; wider social impacts e.g. withdrawal of children from school, increase in orphans (SAfAIDS, 1998). Malaria, diarrhoea and respiratory diseases may also be epidemic in the semi-arid areas.
67
Summary Using the SL approach as the overarching framework, this section has presented an analysis of livelihood patterns found throughout the study area, and of the factors influencing household strategies. From the literature it was seen that widespread processes of social change are defining the rural development context, and that people's livelihoods reflect these changes. Diversification and migration, agricultural intensification and extensification were discussed with reference both to the literature on livelihoods in Tanzania and selected case studies. The livelihoods of different wealth groups at several locations throughout the central semi-arid zone were depicted, with analysis of the factors influencing their respective livelihood patterns. The coping strategies of the poor - responses to seasonal downturns or unusual shocks to the farming system - were detailed for Shinyanga and Singida. The implications of gender at the household and intra-household levels were reviewed. Finally some of the key livelihood determinants in semi-arid Tanzania were set out.

68
5. CASE STUDIES Case Study 1: Agriculture, non-farm activities and the resurgence of out-migration in Njombe District, Iringa
Njombe District is one of five districts in Iringa Region. While population growth for the inter-census period (1978 - 1988) generally decreased by about one fifth, the urban population increased by almost three-quarters. The overall negative growth rate and the significant urban growth rate are both attributed in the main to migration of adults from the rural areas. This process is linked to the economic difficulties of the 1970s, and even more so the liberalisation policies of the late 1980s.
Mtwango-Lunguya village is located in the semi-arid zone of Njombe District19. Limited land resources are deemed to have inhibited in-migration, and the ethnic composition of the village is almost exclusively Bena. Richer households, comprising about 12 percent of the total, are better-off farmers with considerable entitlements to labour (through extended families, polygyny or hiring), land and livestock. A middle group of medium sized households, about 45 percent of the whole, have medium-sized farm plots and modest numbers of livestock. The least well-endowed group, comprising 43 percent of the total, have very small amounts of land, the smallest household sizes and no livestock.
Agriculture - crop production and the keeping of livestock - remains the most important economic activity. The vast majority of households (96%) cultivate food crops including groundnuts, maize, potatoes and beans. While little or no cash crops are grown, most households sell their limited surpluses for cash. Some experimentation with new crops (e.g. wheat, Irish potatoes, vegetables) is taking place. The removal of subsidies has put inputs beyond the reach of most farmers, and soil mining is becoming pronounced, especially amongst the majority who have no livestock. A fifth of households keep some livestock, most of which own less than 5 head of cattle and some small stock. The integration of livestock keeping and crop production has mostly been confined to the use of oxen for ploughing, albeit middle wealth groups have started experimenting with manure and compost. A majority of the village’s youth however see no future for them in agriculture, a view endorsed by a sizeable minority (42%) of the older generation. As above their lack of motivation was identified with a shortage of land, unaffordable inputs and fluctuating markets for crops such as maize.
Table 5.1.1 Household Livestock Distribution (%) in Mtwango-Lunguya Village 1995 Number
N = 721 households Cattle Sheep Goats
None 81 95 98
1 - 5 15 4 2
6 - 10 4 1 -
> 11 1 - -
Non-agricultural economic activities most commonly include brewing and selling beer, trading, running kiosks and restaurants, handicrafts, butchery, carpentry and masonry. Whereas traditionally these have represented part-time activities undertaken during the slack period in the agricultural season, today they are undertaken by all economic groups to produce an income to meet living costs
19 Despite its localised semi-arid nature Njombe District lies south of the main central semi-arid zone highlighted in this study.

69
and needs not satisfied by agriculture alone. Within the broader commercialisation of rural life, many items produced by these activities have effectively undergone commoditisation. Food resources in particular have become commodities - notably maize through beer brewing - suggesting more households may become vulnerable to food insecurity. The sale of building sand, firewood and/or charcoal - by women now as well as men - and the increase in handicrafts (e.g pottery and weaving) suggest that the environment is coming under more stress from economic activity.
Labour migration to sisal plantations on the coast, maize and tobacco farms in Iringa and tea estates in Mufindi, was common before the 1970s. Throughout the 1980s and 1990s most of the population movements were rural-urban. Mtwango-Lunguya's location on a major road between two booming urban centres will have facilitated migration for those with resources or relatives in town. The Kibena Wattle Company in Njombe and various tea estates in Mufindi District within Iringa Region have together absorbed 16 percent of the young people for tea picking and other wage labour. The declining and generally poor quality of primary education (59% received primary education, but less than 4% advanced to secondary level) however does not point to significant occupational mobility, and remittances from labour migration are low. The scale of out-migration is similar for men and women, albeit the existence of patrilocal marriages suggests that women may be following their husbands to their villages or work places.
More and more men have adopted income-earning activities formerly considered the preserve of women, aggravating the unequal burden already faced by women. Social and kinship networks are in decline, and there is a general feeling of generational discontinuity. Changing economic fortunes have incapacitated the elders. The youth look to non-agricultural occupations, albeit these are not as yet sufficiently developed to sustain the growing number of rural youth. Many are leaving the villages as independent individuals, a proportion have succumbed to alcohol.
Source: Mung’ong’o (1998)
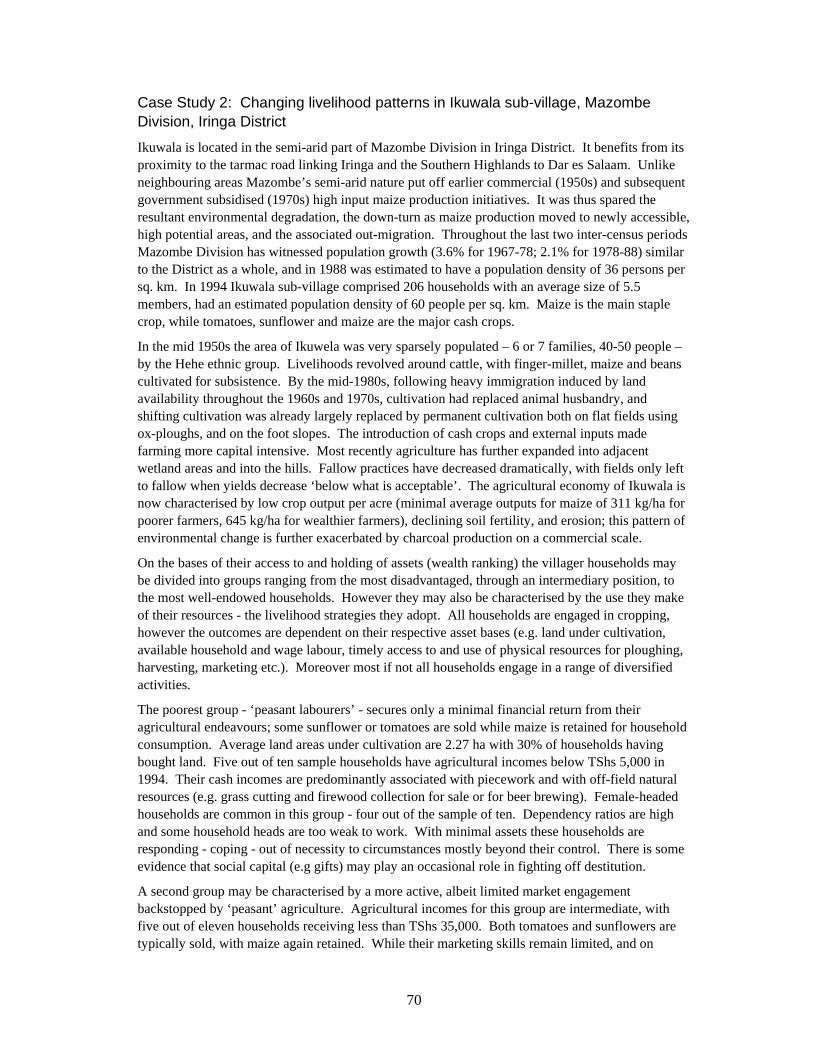
70
Case Study 2: Changing livelihood patterns in Ikuwala sub-village, Mazombe Division, Iringa District
Ikuwala is located in the semi-arid part of Mazombe Division in Iringa District. It benefits from its proximity to the tarmac road linking Iringa and the Southern Highlands to Dar es Salaam. Unlike neighbouring areas Mazombe’s semi-arid nature put off earlier commercial (1950s) and subsequent government subsidised (1970s) high input maize production initiatives. It was thus spared the resultant environmental degradation, the down-turn as maize production moved to newly accessible, high potential areas, and the associated out-migration. Throughout the last two inter-census periods Mazombe Division has witnessed population growth (3.6% for 1967-78; 2.1% for 1978-88) similar to the District as a whole, and in 1988 was estimated to have a population density of 36 persons per sq. km. In 1994 Ikuwala sub-village comprised 206 households with an average size of 5.5 members, had an estimated population density of 60 people per sq. km. Maize is the main staple crop, while tomatoes, sunflower and maize are the major cash crops.
In the mid 1950s the area of Ikuwela was very sparsely populated – 6 or 7 families, 40-50 people – by the Hehe ethnic group. Livelihoods revolved around cattle, with finger-millet, maize and beans cultivated for subsistence. By the mid-1980s, following heavy immigration induced by land availability throughout the 1960s and 1970s, cultivation had replaced animal husbandry, and shifting cultivation was already largely replaced by permanent cultivation both on flat fields using ox-ploughs, and on the foot slopes. The introduction of cash crops and external inputs made farming more capital intensive. Most recently agriculture has further expanded into adjacent wetland areas and into the hills. Fallow practices have decreased dramatically, with fields only left to fallow when yields decrease ‘below what is acceptable’. The agricultural economy of Ikuwala is now characterised by low crop output per acre (minimal average outputs for maize of 311 kg/ha for poorer farmers, 645 kg/ha for wealthier farmers), declining soil fertility, and erosion; this pattern of environmental change is further exacerbated by charcoal production on a commercial scale.
On the bases of their access to and holding of assets (wealth ranking) the villager households may be divided into groups ranging from the most disadvantaged, through an intermediary position, to the most well-endowed households. However they may also be characterised by the use they make of their resources - the livelihood strategies they adopt. All households are engaged in cropping, however the outcomes are dependent on their respective asset bases (e.g. land under cultivation, available household and wage labour, timely access to and use of physical resources for ploughing, harvesting, marketing etc.). Moreover most if not all households engage in a range of diversified activities.
The poorest group - ‘peasant labourers’ - secures only a minimal financial return from their agricultural endeavours; some sunflower or tomatoes are sold while maize is retained for household consumption. Average land areas under cultivation are 2.27 ha with 30% of households having bought land. Five out of ten sample households have agricultural incomes below TShs 5,000 in 1994. Their cash incomes are predominantly associated with piecework and with off-field natural resources (e.g. grass cutting and firewood collection for sale or for beer brewing). Female-headed households are common in this group - four out of the sample of ten. Dependency ratios are high and some household heads are too weak to work. With minimal assets these households are responding - coping - out of necessity to circumstances mostly beyond their control. There is some evidence that social capital (e.g gifts) may play an occasional role in fighting off destitution.
A second group may be characterised by a more active, albeit limited market engagement backstopped by ‘peasant’ agriculture. Agricultural incomes for this group are intermediate, with five out of eleven households receiving less than TShs 35,000. Both tomatoes and sunflowers are typically sold, with maize again retained. While their marketing skills remain limited, and on
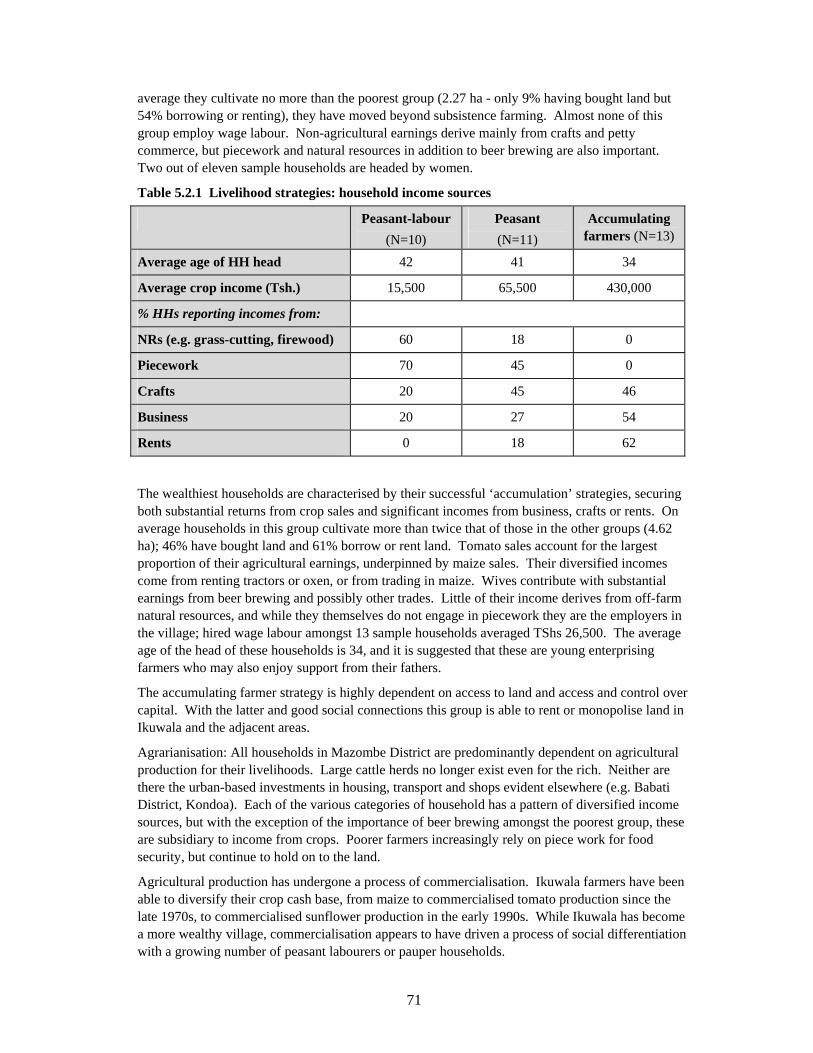
71
average they cultivate no more than the poorest group (2.27 ha - only 9% having bought land but 54% borrowing or renting), they have moved beyond subsistence farming. Almost none of this group employ wage labour. Non-agricultural earnings derive mainly from crafts and petty commerce, but piecework and natural resources in addition to beer brewing are also important. Two out of eleven sample households are headed by women.
Table 5.2.1 Livelihood strategies: household income sources
Peasant-labour (N=10)
Peasant (N=11)
Accumulating farmers (N=13)
Average age of HH head 42 41 34
Average crop income (Tsh.) 15,500 65,500 430,000
% HHs reporting incomes from:
NRs (e.g. grass-cutting, firewood) 60 18 0
Piecework 70 45 0
Crafts 20 45 46
Business 20 27 54
Rents 0 18 62
The wealthiest households are characterised by their successful ‘accumulation’ strategies, securing both substantial returns from crop sales and significant incomes from business, crafts or rents. On average households in this group cultivate more than twice that of those in the other groups (4.62 ha); 46% have bought land and 61% borrow or rent land. Tomato sales account for the largest proportion of their agricultural earnings, underpinned by maize sales. Their diversified incomes come from renting tractors or oxen, or from trading in maize. Wives contribute with substantial earnings from beer brewing and possibly other trades. Little of their income derives from off-farm natural resources, and while they themselves do not engage in piecework they are the employers in the village; hired wage labour amongst 13 sample households averaged TShs 26,500. The average age of the head of these households is 34, and it is suggested that these are young enterprising farmers who may also enjoy support from their fathers.
The accumulating farmer strategy is highly dependent on access to land and access and control over capital. With the latter and good social connections this group is able to rent or monopolise land in Ikuwala and the adjacent areas.
Agrarianisation: All households in Mazombe District are predominantly dependent on agricultural production for their livelihoods. Large cattle herds no longer exist even for the rich. Neither are there the urban-based investments in housing, transport and shops evident elsewhere (e.g. Babati District, Kondoa). Each of the various categories of household has a pattern of diversified income sources, but with the exception of the importance of beer brewing amongst the poorest group, these are subsidiary to income from crops. Poorer farmers increasingly rely on piece work for food security, but continue to hold on to the land.
Agricultural production has undergone a process of commercialisation. Ikuwala farmers have been able to diversify their crop cash base, from maize to commercialised tomato production since the late 1970s, to commercialised sunflower production in the early 1990s. While Ikuwala has become a more wealthy village, commercialisation appears to have driven a process of social differentiation with a growing number of peasant labourers or pauper households.

72
Environmental change: Hitherto wealth creation has been through the expansion of the agriculture frontier rather than through intensification and conservation of the village lands. Most marginal areas have been totally cleared, and changes in farming practice have added to a process of seriously accelerated erosion. Degradation has so far however had little impact on farming practices as far as soil conservation and soil fertility maintenance is concerned, despite falling yields.
Source: Birch-Thompsen et al. (1999)

73
Case Study 3. The livestock/sorghum-millet system: Kwimba District.
Location: Kwimba District is located in the east of Mwanza region, which together with Shinyanga region make up the area known as Sukumuland. Malya, the former district town, is served by the central railway line and lies at the junction of two major roads. Kitunga village lies only some 20 km distant but in a more isolated location. Malya with 392 households is more than twice the size of Kitunga with its 167 households.
Population/Household details: The population density in Mwanza region is 96 inhabitants per sq. km., almost four times the mainland average of 26. Access to land has been a major constraint in Kwimba district for the last fifty years and presently new land is only available through purchase or rental. Historically there has been considerable out-migration, and recent district-level data suggests some out-migration of young men. For the two villages recent out- or in-migration has been negligible, but as many as 14% of households were living in a different region some twenty years ago. Opportunities for employment may have drawn some to Malya.
Assets & distribution: While levels of education in Kwimba are not untypical, there is a marked difference between the two villages. In Kitunga 37 percent of 10 year olds and upward have no formal education and only 1 percent has attended secondary school. While in Malya, reflecting the presence of government employees, only 25 percent have no schooling and 9 percent have secondary or post-secondary education. Even more marked however, are the differences between men and women: only 21 percent of males have had no formal education compared to 38 percent of females.
The assessment of household wealth, based on scoring household possessions (e.g. means of transport, radio, household utensils and furniture) which the authors suggest is a proxy for household income, locates Kwimba district near the study average. Again however there are significant differences between the two villages, with the mean score for Malya (65.7) being nearly two thirds higher than for Kitunga (39.6). An even more pronounced distinction obtains for the quality of housing between the two villages. The distribution of these wealth indicators is less pronounced than in five other farming systems covered by the study. Female-headed households had a lower mean possession score (by 10%) but higher housing index. The distribution of land holdings, which typically comprise a number of different plots with differing soil types, is fairly unequal. Twenty five percent of holders operate less than one hectare; the top quintile of landholders control 50 percent of the total area, and the bottom quintile just 5 percent (see Table 5.3.1) Just over half the households in both villages were unable to produce enough food to last 12 months; the mean duration for staples in 1990-91 was 9.8 months.
Table 5.3.1 Distribution of Holdings by Size (percentage of holdings)
Village Less than 1 ha. 1 to 2 ha. 2 to 5 ha. More than 5 ha.
Malya 29 31 31 9
Kitunga 20 30 40 10
Activities/outcomes: The two villages are located in the wetter area of this system where rainfall (800-900 mm pa) is relatively adequate and reliable. Farmers here produce a narrower range of crops than in the drier areas, where a diversification strategy gives emphasis to the production of multiple food crops. In Malya rice is the most important food and cash crop and is cultivated by almost all households. Maize is produced by two thirds of households and cotton by a fifth. In Kitunga, maize and rice are grown in equal proportions, but cotton is the most important cash crop. While most crops are grown in pure stands about a third of maize plots were intercropped with

74
pulses or legumes. Neither village attaches much importance to the production of drought staples such as cassava, sorghum or sweet potatoes.
Unlike in agro-pastoral farming systems livestock keeping in Kwimba district is not the dominant activity, but rather an important complement to cropping. Cattle are used for draught power and household milk production, while traditionally brideprice is paid in cattle. While crops account for 93 percent of agricultural sales, the sale of livestock and livestock products account for the remaining 7 percent. Only a minority of households own cattle, and average herd sizes are quite low for Sukumuland reflecting the scarcity of available grazing land. Small stock, which as an asset offer less flexibility than cattle, are usually kept for household consumption (see Table 5.3.2). Ownership of all livestock types is more common in Kitunga than Malya.
Table 5.3.2 Livestock Ownership
Malya Kitunga Type of Livestock Percent of holders Average herd size Percent of holders Average herd size
Cattle 30 12 48 14
Goats 19 6 34 7
Sheep 9 4 10 5
Poultry 26 14 40 14
The sale of food crops is the main source of income for 67 percent of households in Malya and 43 percent in Kitunga. The sale of other crops - predominantly cotton - is the main source of income for a further 33 percent of households in Kitunga. Some 19 percent from both villages obtain their main source of income from employment or self-employment outside agriculture.
Trends: Increases in productivity obtained by commercial farmers have relied on a growing wage labour force, of which a large proportion is women. During the 1990/91 season additional labour was hired by 52 percent of householders in Malya, where the commercialisation of rice predominates. As much as a third of all households rely on hired labour for land clearing/preparation and weeding, and about a fifth for planting and harvesting. The high average wage rates for Kwimba (827 TShs. Per day in 1990-91) reflect the high returns from cotton and rice production and the relative scarcity of labour.
The liberalisation of food markets, the increased availability of consumer goods and producer price rises are deemed to have enabled or induced increased production of cotton and rice (between 1988/89 and 1990/91). Rainfall was also adequate during this period. The corresponding decline in maize production reflected both the better relative returns from rice and cotton, and the increased availability of maize in local markets. Purchased input use has not declined in Kwimba district, while use of cotton pesticides (essential for improved yields) has increased in both villages. A few farmers have been producing significant quantities of tomatoes, bananas and oranges.

75
Table 5.3.3 Mean Holding Size, Sales of Main Crop and Use of Inputs by Quintiles of Possession Score
Quintile of possession score for
both villages
Mean holding size (ha)
Percent of quintile hiring labour
Percent of quintile using
fertiliser
Percent of quintile
using agro-
chemicals
Proportion of rice
sales by qauintile
Proportion of cotton sales by quintile
1 1.8 37 21 39 7 14
2 2.0 37 20 24 17 20
3 2.3 53 21 37 17 29
4 2.5 54 24 35 33 19
5 2.7 42 34 31 26 19
The top two quintiles of the grouped possession scores (see Table 5.3.3) account for 59 percent of marketed rice. These commercial rice farmers who are predominantly associated with Malya, also obtain income from a variety of non-agricultural sources.
While a few richer farmers control large areas of land and market a large proportion of produce, further accumulation is held in check by labour constraints. This in turn has sustained farmers' interests in labour saving technologies (e.g. ox-ploughs).
Some 50 percent of holders report declining soil fertility on the hill sands in Kwimba district, associating it with over-grazing, deforestation and reduced fallow. Land pressures and increased cultivation has been at the expense of fallow and a reduction in the fallow period. Poorer farmers operating smaller holdings where plots need to be continually cropped, are least likely to have access to kraal manure or capital for inorganic fertilisers.
Source: FSG/SUA (1995)

76
Case Study 4: Income portfolios in Shinyanga District, Shinyanga Region
For rural Shinyanga District the transport infrastructure is quite poor, restricting trade and other business activities. Households are typically engaged in cropping (cotton, sorghum, millet, maize, sweet potatoes and paddy), but cattle too are traditionally important in the farming system. Off-farm employment has long been quite common. In recent decades, people have participated in the cotton harvest within the region and worked as casual labour in the cotton ginneries in adjacent Mwanza region. Declining returns and lower farm-gate prices for cotton have led to many farmers selling maize, sorghum or paddy. Variable rainfall has a significant impact on crop production, and localised drought is not uncommon.
Assets and distribution: In the study area household labour characteristics (e.g. numbers of adults, dependency ratios, adult education years) are surprisingly similar across all terciles. The children of the non-poor household heads however, have completed almost half as much again (59% compared with 40%) of the full 12 years schooling (i.e. 100%). Mean land holdings per adult equivalent are about 75 percent larger for the non-poor tercile than for the poorest tercile, with mean areas under cultivation 67 percent larger. Cattle ownership is significantly more skewed, being eight times larger for the non-poor. Small stock (e.g. sheep and goats) by contrast, are far less unequally distributed. Although physical assets, as represented by house values and annual investment in tools are on an ascending scale across the wealth terciles, the amounts involved are relatively modest. The mean adult investment in tools for non-poor households for example, amounting to 113 TSh (compared with 25 TSh for poor households), or less than 1½ percent of the total annual income or consumption estimates for poor households. Of social capital, it is noted that there is little evidence at the village level of the continued existence of once traditional mutual support networks. On informal credit markets, fewer than 40 percent of households were aware of possible private sources of credit within their villages, and only 6 percent knew of private sources outside the village. This suggests that only a minority of households may be able to rely on informal networks to obtain credit, and given the greater likelihood that the source would be local, that credit would be available only for idiosyncratic risk.
Table 5.4.1 Livestock, land and other characteristics across per capita income terciles
Consumption terciles (N =79)
Poor Middle Non-poor All
Percentage owning cattle % 35 56 58 49
Livestock owners % 66 58 67 66
Cattle value per adult equiv. (TSh) 8,362 18,041 64,929 30,287
Livestock value p.a.e. (TSh.) 9,320 19,924 66,666 31,287
Cultivated land p.a.e. (ha) 0.6 0.8 1.0 0.8
Return from crops per ha (TSh.) 8,170 14, 270 13,430 11,967
House/building materials value (TSh.) 87 262 435 261
Investment in tools in last year (TSh.) 25 96 113 78
Activities and outcomes: What is apparent from Table 5.4.2 is that not only is the mean income and consumption six times higher for richer households than for poorer households, but the composition of their incomes is significantly different. The mainstay of the income of the poorest
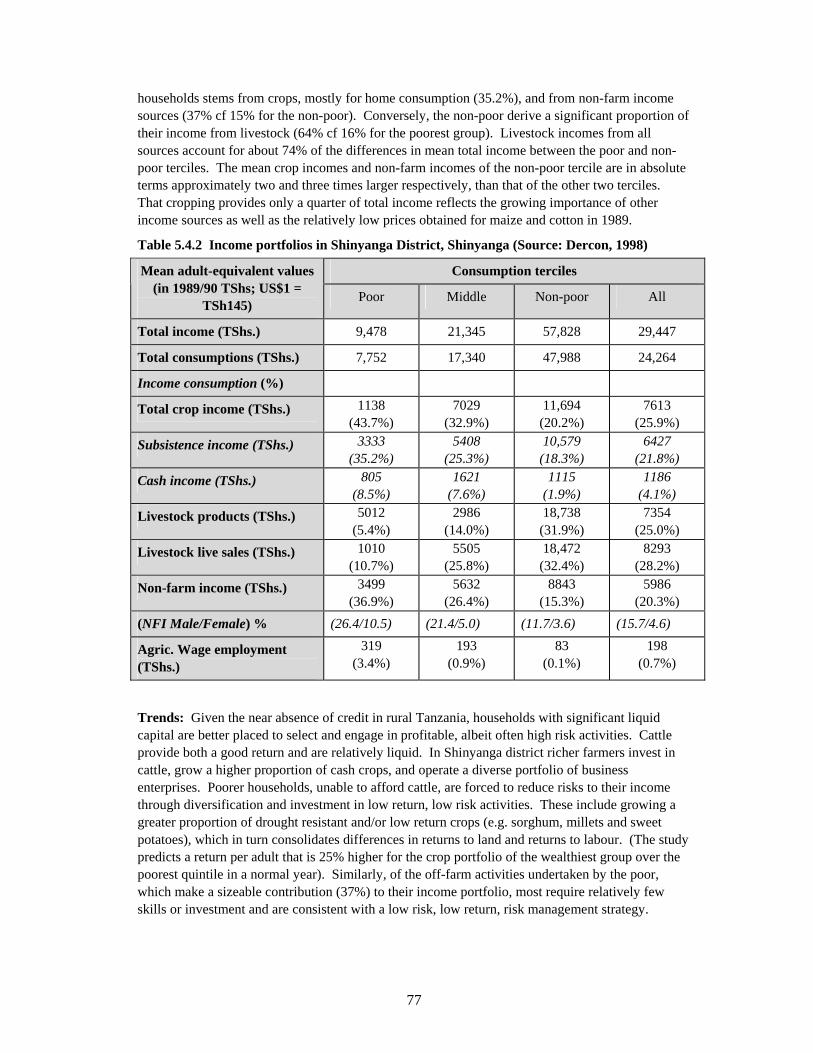
77
households stems from crops, mostly for home consumption (35.2%), and from non-farm income sources (37% cf 15% for the non-poor). Conversely, the non-poor derive a significant proportion of their income from livestock (64% cf 16% for the poorest group). Livestock incomes from all sources account for about 74% of the differences in mean total income between the poor and non-poor terciles. The mean crop incomes and non-farm incomes of the non-poor tercile are in absolute terms approximately two and three times larger respectively, than that of the other two terciles. That cropping provides only a quarter of total income reflects the growing importance of other income sources as well as the relatively low prices obtained for maize and cotton in 1989.
Table 5.4.2 Income portfolios in Shinyanga District, Shinyanga (Source: Dercon, 1998)
Consumption terciles Mean adult-equivalent values (in 1989/90 TShs; US$1 =
TSh145) Poor Middle Non-poor All
Total income (TShs.) 9,478 21,345 57,828 29,447
Total consumptions (TShs.) 7,752 17,340 47,988 24,264
Income consumption (%)
Total crop income (TShs.) 1138 (43.7%)
7029 (32.9%)
11,694 (20.2%)
7613 (25.9%)
Subsistence income (TShs.) 3333 (35.2%)
5408 (25.3%)
10,579 (18.3%)
6427 (21.8%)
Cash income (TShs.) 805 (8.5%)
1621 (7.6%)
1115 (1.9%)
1186 (4.1%)
Livestock products (TShs.) 5012 (5.4%)
2986 (14.0%)
18,738 (31.9%)
7354 (25.0%)
Livestock live sales (TShs.) 1010 (10.7%)
5505 (25.8%)
18,472 (32.4%)
8293 (28.2%)
Non-farm income (TShs.) 3499 (36.9%)
5632 (26.4%)
8843 (15.3%)
5986 (20.3%)
(NFI Male/Female) % (26.4/10.5) (21.4/5.0) (11.7/3.6) (15.7/4.6)
Agric. Wage employment (TShs.)
319 (3.4%)
193 (0.9%)
83 (0.1%)
198 (0.7%)
Trends: Given the near absence of credit in rural Tanzania, households with significant liquid capital are better placed to select and engage in profitable, albeit often high risk activities. Cattle provide both a good return and are relatively liquid. In Shinyanga district richer farmers invest in cattle, grow a higher proportion of cash crops, and operate a diverse portfolio of business enterprises. Poorer households, unable to afford cattle, are forced to reduce risks to their income through diversification and investment in low return, low risk activities. These include growing a greater proportion of drought resistant and/or low return crops (e.g. sorghum, millets and sweet potatoes), which in turn consolidates differences in returns to land and returns to labour. (The study predicts a return per adult that is 25% higher for the crop portfolio of the wealthiest group over the poorest quintile in a normal year). Similarly, of the off-farm activities undertaken by the poor, which make a sizeable contribution (37%) to their income portfolio, most require relatively few skills or investment and are consistent with a low risk, low return, risk management strategy.

78
Wealthier households end up with higher average returns, allowing further accumulation. Poorer households engaged in low risk activities securing lower returns to their endowments, which over time suggests the development of a poverty trap for such households.
Sources: Dercon (1998); Dercon (1996); Dercon and Krishnan (1996)

79
Case Study 5: Trends in livelihood strategies for households in close proximity to Miombo woodlands
Miombo woodlands provide a variety of forest products and services for rural communities. In areas within close proximity to major cities and roads forest products are key sources of income. This study examines changes in household livelihood strategies in three locations adjacent to miombo woodlands, in response to changes in macroeconomic policies. The remote site, Mtera in Dodoma Region falls within the central semi-arid zone, the peri-urban site, Kitulangalo in Morogoro Rural District, lies within the south-eastern semi-arid zone, while the intermediate site, Gairo in Kilosa District, is between the two zones on the Morogoro-Dodoma highway.
Table 5.5.1 Household income sources (% of total income)
Source Peri-Urban Intermediate Remote Total
Charcoal 38 10 2 17
Firewood 5 8 8 7
Wild fruits 4 - - 4
Forest-based
Honey 22 36 42 33
Agric-based Crops 8 11 13* 11
Petty business 11 18 20 16 Others
Casual employ 9 13 11 11
Remittances 3 4 4 4
* Made up of 12% income from fish sales and 1% from crops.
Increased production costs combined with reduced crop revenues in the wake of SAPs and liberalisation, are deemed to have precipitated high expenditures for rural communities. Woodland based activities are undertaken to compensate for declines in agricultural income, the main traditional income source. In the peri-urban area these contributions amount to 69% of household incomes, at the intermediate and remote sites the contribution was 54% and 52% respectively. The commercialisation of traditionally non-traded goods (e.g. firewood, wild fruits and herbal medicines), has been brought about by the scarcity of natural resources, urban-rural migration, and difficult socio-economic conditions generally. The sale of honey makes a significant contribution at all sites, but declines closer to the urban centre, where charcoal production and agricultural expansion have had the biggest impact on forests. Charcoal production or sale is undertaken by as many as 25% of peri-urban households.
Mixed cropping was undertaken by about 50%, 65% and 73% of households at the peri-urban, intermediate and remote locations respectively, with the other households practising monoculture and traditional agroforestry. For the three study years however, cash crop harvests (cotton, simsim, castor seed and sunflower) had declined due to market uncertainties, but farmers were thought to have increased trade in surplus food crops (sorghum, maize, sweet potatoes). Petty business and casual labour, together with trade in forest products, are undertaken to offset agricultural deficits.

80
Table 5.5.2 Women’s income generating activities (% of respondents involved)
Activity Peri-urban Intermediate Remote Meam
Petty business 60.1 51.0 8.9 40.0
Agriculture 52.3 70.0 82.0 68.0
Forest product extraction
39.0 23.4 2.6 21.6
Trade in firewood at the intermediate and remote sites is remarked upon as a measure of the scarcity of fuelwood resources.
Economic hardship has led to changes in gender roles, most notably in the peri-urban areas. During the pre-SAPs period very few women were reported to have been involved in casual employment or trade. Forty percent of women respondents are now involved in petty business (e.g. sale of locally brewed beer, handcrafts) and more than 21% are involved in forest product extraction. The authors suggest that women left alone with their children constituted a significant proportion of those engaged in petty business. For both categories however, the least involvement (8.9% and 2.6% respectively) was undertaken by women at the remoter location. These women had the least diversified livelihoods, with 82% of them engaged in agriculture.
Encroachment of the miombo woodlands has been hastened by the erosion of traditional institutions and beliefs that valued trees for spiritual and ritualistic purposes. Local communities would prefer more involvement in the management of forest resources.
Source: Monela et al. (2000)
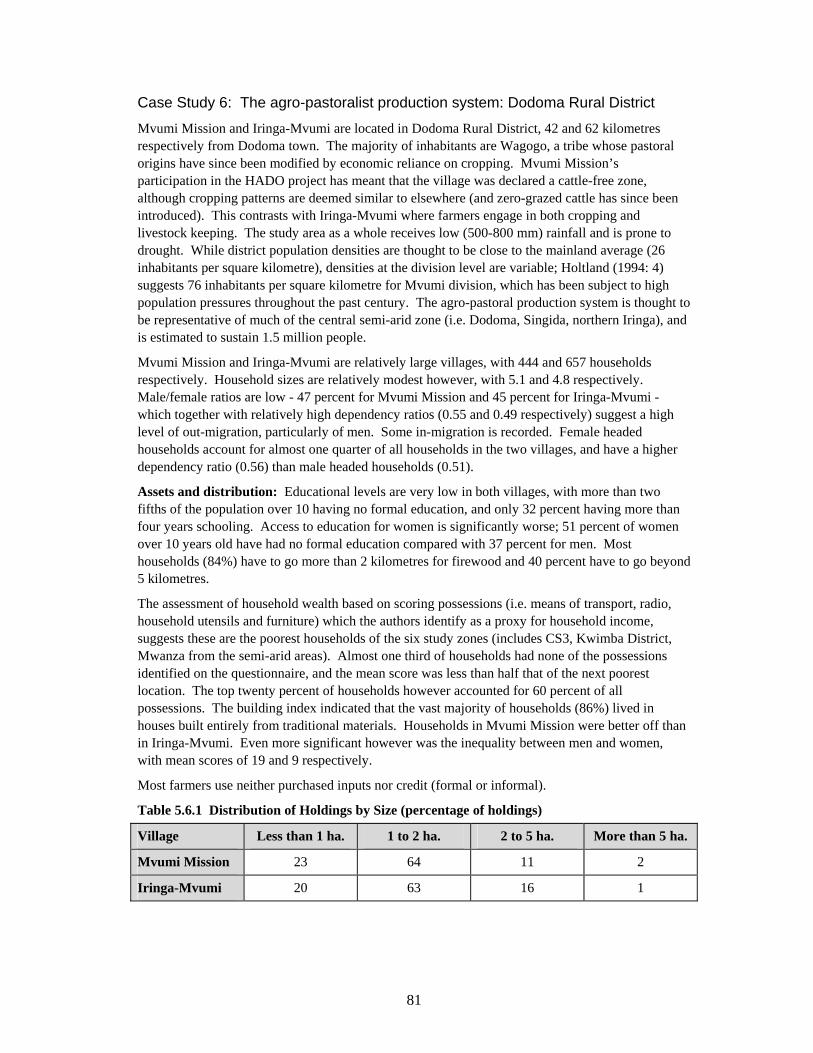
81
Case Study 6: The agro-pastoralist production system: Dodoma Rural District
Mvumi Mission and Iringa-Mvumi are located in Dodoma Rural District, 42 and 62 kilometres respectively from Dodoma town. The majority of inhabitants are Wagogo, a tribe whose pastoral origins have since been modified by economic reliance on cropping. Mvumi Mission’s participation in the HADO project has meant that the village was declared a cattle-free zone, although cropping patterns are deemed similar to elsewhere (and zero-grazed cattle has since been introduced). This contrasts with Iringa-Mvumi where farmers engage in both cropping and livestock keeping. The study area as a whole receives low (500-800 mm) rainfall and is prone to drought. While district population densities are thought to be close to the mainland average (26 inhabitants per square kilometre), densities at the division level are variable; Holtland (1994: 4) suggests 76 inhabitants per square kilometre for Mvumi division, which has been subject to high population pressures throughout the past century. The agro-pastoral production system is thought to be representative of much of the central semi-arid zone (i.e. Dodoma, Singida, northern Iringa), and is estimated to sustain 1.5 million people.
Mvumi Mission and Iringa-Mvumi are relatively large villages, with 444 and 657 households respectively. Household sizes are relatively modest however, with 5.1 and 4.8 respectively. Male/female ratios are low - 47 percent for Mvumi Mission and 45 percent for Iringa-Mvumi - which together with relatively high dependency ratios (0.55 and 0.49 respectively) suggest a high level of out-migration, particularly of men. Some in-migration is recorded. Female headed households account for almost one quarter of all households in the two villages, and have a higher dependency ratio (0.56) than male headed households (0.51).
Assets and distribution: Educational levels are very low in both villages, with more than two fifths of the population over 10 having no formal education, and only 32 percent having more than four years schooling. Access to education for women is significantly worse; 51 percent of women over 10 years old have had no formal education compared with 37 percent for men. Most households (84%) have to go more than 2 kilometres for firewood and 40 percent have to go beyond 5 kilometres.
The assessment of household wealth based on scoring possessions (i.e. means of transport, radio, household utensils and furniture) which the authors identify as a proxy for household income, suggests these are the poorest households of the six study zones (includes CS3, Kwimba District, Mwanza from the semi-arid areas). Almost one third of households had none of the possessions identified on the questionnaire, and the mean score was less than half that of the next poorest location. The top twenty percent of households however accounted for 60 percent of all possessions. The building index indicated that the vast majority of households (86%) lived in houses built entirely from traditional materials. Households in Mvumi Mission were better off than in Iringa-Mvumi. Even more significant however was the inequality between men and women, with mean scores of 19 and 9 respectively.
Most farmers use neither purchased inputs nor credit (formal or informal).
Table 5.6.1 Distribution of Holdings by Size (percentage of holdings)
Village Less than 1 ha. 1 to 2 ha. 2 to 5 ha. More than 5 ha.
Mvumi Mission 23 64 11 2
Iringa-Mvumi 20 63 16 1

82
The average holding size was 1.83 hectares, of which on average 89 percent would be planted to temporary crops, 3 percent to permanent crops (guavas, vines), and 8 percent left to fallow or unusable. Land in Mvumi Mission is deemed by a majority (73%) to be scarce, a situation possibly exacerbated by the absence of an effective land market (sale and rental). In Iringa-Mvumi a larger majority (83%) deemed land, as for the past five years, to be readily available. Earlier studies in the area point to there being no relationship between land ownership and income (Hotland, 1994: 20).
Patterns of livestock ownership in both villages were limited (see Table 5.6.2), with the declining numbers reported in Iringa-Mvumi linked to extension messages to reduce over-grazing, better husbandry practises, and possibly livestock taxes for cattle.
Table 5.6.2 Livestock Ownership in Iringa-Mvumi
Type of Livestock Percentage of holders with livestock
Average herd size Main reasons for keeping livestock
Cattle 13 22.4 Meat, milk, manure
Pigs 3 3.7 Meat, manure
Sheep 7 3.0 Meat and savings
Goats 10 5.6 Meat and savings
Poultry 14 11.5 Meat and eggs for home consumption
Activities and outcomes: The main crops produced in the two villages are sorghum (cultivated by 79 percent), maize (78%), millet (19% in Mvumi Mission, 52% in Iringa-Mvumi) and groundnuts (58% and 76% respectively). Bambara nuts and cassava are also grown and the latter used as a food source in the pre-harvest period when other foods are scarce. In Iringa-Mvumi sorghum is more typically consumed both pre- and post harvest. Most households in both villages produce insufficient food to last the whole year. Shortfalls are made up through purchases, often in exchange for labour with other farmers. A system of local borrowing with repayment in kind plus interest also obtains. Grapes and guavas are the main cash crops, but these are grown by 8 and 7 percent respectively in Mvumi Mission, and 1 and 2 percent respectively in Iringa-Mvumi.
Most plots are cultivated by hand, with minimal ox cultivation in Iringa-Mvumi, and no more than one in eight plots using organic manure.
The sale of food crops is the most important source of income for about half the households interviewed. Only in Mvumi Mission is the sale of non-food crops relevant, but that for only 8 percent of households. While two fifths of households (38 percent in Mvumi Mission and 45 percent in Iringa-Mvumi) report no second income source beyond food crops, more than one household in four reports that self-employment outside agriculture was the most important income source. Those households in Mvumi Mission reporting self-employment as their main income source were more likely to have had an increase in income than those exclusively dependent on food crop production. One in five households in both villages, typically those with larger holdings, reported hiring labour, mostly for land clearance and/or weeding. While one in three holders had undertaken some paid work on other holdings, amounting to a little more than 15 percent of their time on average.
Off-farm income sources referred to in earlier studies include beer brewing, bee-keeping, charcoal making, remittances and formal sector employment (Holtland, 1994).

83
Trends: Farming systems in these two villages in Dodoma Rural district are predominantly low input, low output, with hand tools alone accounting for the only major expenditure. This approach is deemed a rationale response for farmers living in an area with low and declining levels of soil fertility and who are frequently exposed to the risk of drought. Despite being an area of out-migration, the number of smallholders and total area under cultivation both grew over the three year recall period (1988/89; 89/90; 90/91).
Despite strong cultural links with pastoralism, perceived problems of over-stocking in a fragile environment, reinforced by economic reform measures, have continued to reduce the pattern of livestock ownership. Even in Iringa-Mvumi less than one sixth of households have cattle. Livestock ownership appears increasingly to be viewed as a commercial enterprise, so much so that the authors of this study question whether the production system is correctly described as an agro-pastoralist system.
The majority of households in the study villages are deemed severely disadvantaged when compared with other areas of the country, with inequality growing.
Sources: FSG/SUA (1995)

84
Case Study 7: Cropping, livestock practices and land degradation in Kondoa District.
This case study draws on studies that consider villages in both the Kondoa Eroded Area (KEA) of the Kondoa Hills and in the adjacent Masai Plains to the east. While only the latter area fits the narrower definition of semi-arid as set out in Section 3, this juxtaposition of study villages derives from the fact that the Masai Plains have represented an expansion area for people from the more heavily populated and more seriously degraded highland areas. These settlement patterns were further consolidated by the villagization programme of 1974-76, and again by the de-stocking exercises conducted throughout the KEA by the HADO project in 1979.
Haubi village in the Kondoa Hills is referred to in a number of studies (e.g. Dejene et al., 1997; Mohamed, 1996; Mung'ong'o, 1996). Average annual rainfall here is between 750-900 mm per year and some areas are described as sub-humid. The soils are generally described as less fertile; and intensive cultivation and highly erosive convection storms have led to a state of acute land degradation. Haubi however is a long established location and is fairly well developed. It enjoys several primary social services, including three schools, a missionary-run dispensary, water supplies with hand pumps, a court, and Catholic mission. Migrant Rangi first settled here 250 years ago and they remain the dominant ethnic group. Historically kinship relations based on clan underpinned most economic and cultural relations. Since the coming and taking root of Islam and Christianity and the cash economy, traditional relationships have however broken down. These changes in Rangi society were consolidated by the 1979 de-stocking programme, and by the subsequent and associated farming opportunities that promoted money over cattle as a store of wealth.
Soya village is a comparatively new settlement lying 63 kilometres east of Kondoa town on the dry Masai Plains. Roman Catholic missionaries established the single primary school in 1956, and the village also has a dispensary, a hand water pump, a church and eight mosques. Rangi settlers from the eroded Kondoa Hills - including from Haubi - first moved here in search of outpost farms at the time of ujamaa and the villagization programmes (late 1960s - early 1970s), displacing the indigenous Burunge people. While the brownish loam soils are deemed to be relatively fertile (for maize, finger millet, beans, a variety of sorghum, bulrush millet and sunflowers), production is constrained by low and unreliable rainfall, and drought is not uncommon.
Table 5.7.1 Household distribution (percentage) and mean sizes by Wealth Group Haubi Village
(N = 990) Soya Village (N = 1259)
Household Category
% distribution
mean HH size
% distribution
mean HH size
Musungati/Nkabaku group (wealthy/enterprising/respected)
2
9.3 7 5.4
Watu wa Wastani group (average people - not so rich not so poor)
81 7.4 43 4.3
Watu wa Hali Duni group (the poor - without wealth & lacking enterprise)
17 2.5 50 3.0
Total / Village means 100 6.2 100 3.6
The Rangi use the term Musungati to describe a wealthy man rich in cattle or other assets, who commands respect and exhibits leadership qualities. Similarly a Nkabaku - literally a ‘bull’ -

85
suggests enterprise, wisdom and hard work. Together the terms are used to indicate the uppermost wealth group. Conversely the term for households lacking such qualities or assets, Watu wa Hali Duni, signifies poor people. The Watu wa Wastani group is made up of those households deemed neither so rich nor so poor, but rather, average.
Explanations for the differences in the distribution of these wealth groups (e.g. the relatively large percentage of wealthier households in Soya; the greater number of poor households in Soya, and correspondingly higher proportion of average households in Haubi), have been articulated around the opportunities afforded by Soya as an expansion area. Both wealthier households from further afield, and younger, poorer households responding to labour demands, have been drawn to Soya.
Assets and distribution: These wealth strata are deemed applicable to either village, albeit there are quantitative differences between sites for the same groups. As per Table 5.7.1 the mean sizes of the wealthiest households - Musungati/Nkabaku group - are one and a half times the mean size of all households, and almost four times and two times the mean size of the poorest households in Haubi and Soya respectively. While their respective mean household sizes are different (9.3 compared with 5.4), reflecting the younger nature of the population in the expansion area, the wealthier households in either village command significantly larger household labour forces than other households.
Of landholdings the wealthiest group in Haubi own or operate moderate areas (2.4 - 4.0 ha) of land amounting to one eighth of the total farmland, while in Soya this group's holdings are much larger (10 - 80 ha), and their control extends to almost one-third of the best arable land. Similar differentiation exists for the middle group between the two villages. In Haubi land scarcity may drive this group to lease (or even buy) parcels of land from resource-poor households, in sharecropping arrangements. In Soya however, the lack of other key resources (e.g. credit, inputs, tractors, transport), rather than land, means that the majority of this group are only able to cultivate up to a third of their holdings (2.8 - 9.7 ha), with the greater part cultivated through sharecropping arrangements with wealthy households. While the modest landholdings of the poorest groups differ between the villages (<0.8 ha compared with <2.4 ha), these households in both locations are typically constrained to cultivating on average 0.4 ha. The remainder may be left fallow or leased to better-off households in exchange for ploughing services, inputs or credit; and in times of crisis, parcels of land may be sold. The incidence of wealthier households exploiting ambiguities in land tenure arrangements to 'wrest' leased out, productive land, from poorer groups, particularly resourceless female headed households, is noted to be on the increase.
Table 5.7.2 Distribution of various assets according to wealth group
Wealth group Poor 'Average' Wealthy
Village Haubi Soya Haubi Soya Haubi Soya
Landholding: owned (and operated) (ha)
0.2 - 0.8 (0.4)
0.2 - 2.4 (0.4 )
1.2 - 2.0 + 0.2
gardens
2.8 - 9.7 (up to 1/3rd)
2.4 - 3.4 (3.6-4.0)
10 - 80
Cattle ownership 6 6 5-10
kept else-where
Draught animals
only
many -but kept
else-where
many - max 2000 only few in village
Sheep, goats, chicken Some Some 4 4 4 4
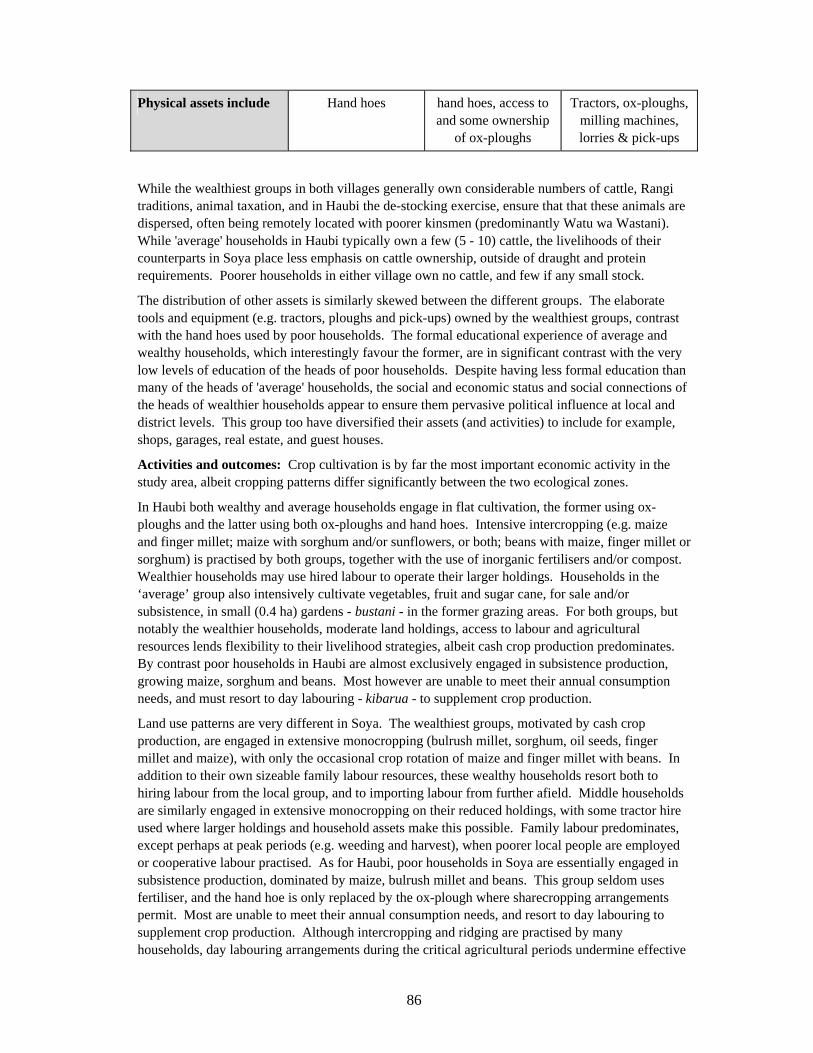
86
Physical assets include Hand hoes hand hoes, access to and some ownership
of ox-ploughs
Tractors, ox-ploughs, milling machines, lorries & pick-ups
While the wealthiest groups in both villages generally own considerable numbers of cattle, Rangi traditions, animal taxation, and in Haubi the de-stocking exercise, ensure that that these animals are dispersed, often being remotely located with poorer kinsmen (predominantly Watu wa Wastani). While 'average' households in Haubi typically own a few (5 - 10) cattle, the livelihoods of their counterparts in Soya place less emphasis on cattle ownership, outside of draught and protein requirements. Poorer households in either village own no cattle, and few if any small stock.
The distribution of other assets is similarly skewed between the different groups. The elaborate tools and equipment (e.g. tractors, ploughs and pick-ups) owned by the wealthiest groups, contrast with the hand hoes used by poor households. The formal educational experience of average and wealthy households, which interestingly favour the former, are in significant contrast with the very low levels of education of the heads of poor households. Despite having less formal education than many of the heads of 'average' households, the social and economic status and social connections of the heads of wealthier households appear to ensure them pervasive political influence at local and district levels. This group too have diversified their assets (and activities) to include for example, shops, garages, real estate, and guest houses.
Activities and outcomes: Crop cultivation is by far the most important economic activity in the study area, albeit cropping patterns differ significantly between the two ecological zones.
In Haubi both wealthy and average households engage in flat cultivation, the former using ox-ploughs and the latter using both ox-ploughs and hand hoes. Intensive intercropping (e.g. maize and finger millet; maize with sorghum and/or sunflowers, or both; beans with maize, finger millet or sorghum) is practised by both groups, together with the use of inorganic fertilisers and/or compost. Wealthier households may use hired labour to operate their larger holdings. Households in the ‘average’ group also intensively cultivate vegetables, fruit and sugar cane, for sale and/or subsistence, in small (0.4 ha) gardens - bustani - in the former grazing areas. For both groups, but notably the wealthier households, moderate land holdings, access to labour and agricultural resources lends flexibility to their livelihood strategies, albeit cash crop production predominates. By contrast poor households in Haubi are almost exclusively engaged in subsistence production, growing maize, sorghum and beans. Most however are unable to meet their annual consumption needs, and must resort to day labouring - kibarua - to supplement crop production.
Land use patterns are very different in Soya. The wealthiest groups, motivated by cash crop production, are engaged in extensive monocropping (bulrush millet, sorghum, oil seeds, finger millet and maize), with only the occasional crop rotation of maize and finger millet with beans. In addition to their own sizeable family labour resources, these wealthy households resort both to hiring labour from the local group, and to importing labour from further afield. Middle households are similarly engaged in extensive monocropping on their reduced holdings, with some tractor hire used where larger holdings and household assets make this possible. Family labour predominates, except perhaps at peak periods (e.g. weeding and harvest), when poorer local people are employed or cooperative labour practised. As for Haubi, poor households in Soya are essentially engaged in subsistence production, dominated by maize, bulrush millet and beans. This group seldom uses fertiliser, and the hand hoe is only replaced by the ox-plough where sharecropping arrangements permit. Most are unable to meet their annual consumption needs, and resort to day labouring to supplement crop production. Although intercropping and ridging are practised by many households, day labouring arrangements during the critical agricultural periods undermine effective

87
management of their own holdings. The Watu wa Hali Duni wealth group are increasingly dependent on wage labour, while their holdings deteriorate.
Trends: In Soya where land availability is not a constraint, resourceful households, most notably the Msungati/Nkabaku, appear to have succumbed to "a sense of recklessness" in the way they have embarked on extensive monocropping. Concomitantly, resource poor households, who constitute half of the community, have been progressively marginalised. Increasingly reliant on wage labour, they are engaged in the clearance of more bushland to meet the accumulation strategies of richer households, at the expense of maintaining their own marginal holdings. With the increased production of food and cash crops, the market value of local arable land has increased. Access, control and ownership of land continue to skew in favour of the wealthy. There is no indication that those benefiting from the current exploitative land use practices are investing in maintaining the environment.
In Haubi, where wealth differentiation is less stark (the 'poor' wealth group constituting only 17 percent), traditional patron-client relationships between the well off and those less well endowed have largely remained intact. Moreover, rather than engage in the expensive rehabilitation and/or maintenance of local eroded lands, economics have induced well off households to exploit the expansion areas of the Lower Irangi such as Soya. Traditional land holding systems in Haubi, which have provided for the less well-endowed households, have too remained intact.
Source: Mung'ong'o (1996)

88
6. SUMMARY OF FINDINGS AND FUTURE OPTIONS The purpose of this project is to gain a comprehensive understanding of the assets and livelihood strategies available to and undertaken by the poor in semi-arid Tanzania, together with the factors that have shaped those strategies including social and economic change and the transforming structures and processes. This understanding is viewed by NRSP as the first of a two-stage process, in which new knowledge and established local partnerships would provide the platform from which to develop and enable poor people to adopt a range of livelihood enhancing options.
For the realisation of this purpose and its alignment with the second phase, the project identified the three following outputs: 1. Current state of knowledge on livelihood systems in semi-arid Tanzania comprehensively
explored, factors shaping livelihood and coping strategies analysed, and key knowledge gaps identified.
2. New knowledge relating to poverty and poorly understood livelihood strategies developed. 3. Demand for new livelihood options confirmed, and emerging pointers for future strategies
assessed. Outputs 1 and 2 were conceived both to expound the underlying concepts associated with livelihoods and poverty, and to respectively develop the understanding necessary for the realisation of the purpose. The pursuit of outputs 1 and 2 involved parallel and overlapping activities. Given both the purpose level focus on poor people in semi-arid Tanzania, and the use of a livelihoods analysis, there is a degree of merger associated with the findings for these two outputs. The objective of output 3 related to ensuring that the link between understanding and subsequent interventions integral to the two-stage approach was shared and grounded at the local level.
6.1 Livelihood systems in the central semi-arid lands Section 3.4 outlines the two farming systems deemed to predominate in the central semi-arid zone: the livestock-sorghum-millet-cotton-rice system, which occurs in Sukumuland (Shinyanga and Mwanza); and the pastoral and agro-pastoral system, which is associated with much of the rest of the zone and adjacent drylands.
Notional descriptions of households as smallholders, agro-pastoralists, pastoralists or commercial farmers, however, fail to take account of the nature and extent of the widespread processes of social change, which increasingly define the rural development context. Livelihood approaches offer the means to move the analysis beyond the classification of agricultural production systems. They recognise that for any given farming system, not only will the nature and level of engagement in agriculture of diverse wealth groups be significantly different, but also that the livelihood portfolio of households in different groups will typically include diversified activities (beyond the aggregately predominant production systems). This broader livelihood perspective is a recurring theme in all the case studies, and the subject of the analysis in section 4.
The findings may be expressed in terms of two main themes. Firstly that agriculture, directly or indirectly, remains important to the wellbeing and livelihoods of all in the semi-arid rural areas (and beyond), a situation that will persist for some time to come. And secondly, that the changing social context and continuing off-farm diversification by the poor, suggest the need for parallel development of the non-farm economy, if poverty reduction is to be effected.
Households throughout central semi-arid Tanzania are engaged in different and often multiple livelihood strategies. These include agricultural intensification and extensification, livelihood diversification, and migration; or combinations of component activities. Livelihood strategies or their pattern of activities are not static, but rather are frequently subject to review, adapted to take

89
advantage of opportunities or mitigate risks, or substituted to cope with contingencies. The dynamics of such behaviour are dependent not only on changes in the external context but also on the wealth status of the household (see Table 6.1).
6.1.1 Agricultural intensification and extensification:
Section 4.4 articulates the arguments variously linking agricultural intensification to population growth, infrastructure, market forces and policy developments. As above, the most relevant finding from a SL perspective flows from the observation that the nature and level of engagement in agriculture of diverse wealth groups differ significantly. Whatever determinant or combination of determinants may induce agricultural intensification in Tanzania's semi-arid areas, the effect is not uniform across different wealth groups or the agro-ecological potential gradient.
The poor in particular continue to experience limited access to productivity enhancing inputs (see Table 4.2), to land, and difficulties in transporting crops to market. They are thus generally unable to increase outputs through capital intensive production.
In those areas however, with better access to markets and where irrigation is an option, wealthier farmers with the means and connections to exploit market opportunities, have engaged in intensification. In Dodoma Rural District for example, a small minority of farmers has previously introduced viticulture (CS 6), and presently resource-rich farmers engage in the intensive production of tomatoes and vegetables, which realise good prices at local markets20. A similar picture emerges in Iringa and Mbeya districts, the latter just south of the central semi-arid zone, where proximity to inter-regional roads and the potential for irrigation has prompted some farmers to intensify. An overview of the performance of a number of irrigation projects funded by the government and IFAD in drought-prone areas identifies intensification (e.g. increased rice yields per hectare) as a measurable impact. However, although originally aimed at poverty alleviation, this programme has failed to accommodate or benefit poorer households (URT, 1998).
Since 1995 more than half of the total cattle herd of the country is concentrated in Mwanza, Shinyanga, Singida and Dodoma. Changes in cattle ownership include a decline in the number of households only engaged in livestock keeping but an increase in the number of household keeping cattle - a change which has been referred to as the 'agriculturalisation' of pastoralism. Evidence from Shinyanga suggests that repeated distress cattle sales have led to the increased polarisation of cattle ownership amongst smaller groups of wealthy people (CARE, 1995).
The bringing of more land into cultivation is ubiquitous throughout the semi-arid areas, and most case studies refer to reduced areas and periods of fallow. Wealthier farmers, whose liquid and social assets enable them to adopt accumulation strategies, are taking over the more fertile and tractable holdings together with extending the agricultural frontier (e.g. case studies 2 and 7, Section 5, Annex 1). The case studies provide examples of poorer households, displaced by the enterprise of more resourceful farmers, being effectively forced into cultivating increasingly marginalised and fragile soils - or exploiting off-farm natural resources - to meet their consumption needs, often with negative environmental impacts. The picture portrayed in the literature (e.g. Dejene et al., 1997; Christiansson et al.1996; Boesen et al., 1996) and the case studies, is that of continuing land degradation and declining soil fertility, and for a majority of poor households, declining yields, for large tracts of the semi-arid areas.
Neither do conservation measures feature prominently in the farming practices of wealthier groups. In the Masai Plains, where land availability is not an overriding constraint, resourceful farmers are described by one commentator as having embarked on extensification with "a sense of recklessness" (CS 7). Similarly in Mazombe Division, Iringa, where the commercialisation of agriculture
20 Personal communication from J. P. Hella, SUA.

90
together with the continued expansion of the agricultural frontier obtain, farming practices (and commercial charcoal production) are deemed to have added to the process of erosion. It is argued that given the availability of land there is insufficient pressure for "innovative measures to counter the present degradation of land" (CS 2, Birch-Thompsen et al., 1999).
6.1.2 Diversification and migration
While diversification and migration strategies are not new to rural Tanzanian households, the past fifteen years have witnessed an increase in the diversification of people’s livelihoods. The increasing prevalence of non-agricultural income generation and the associated individualisation of economic activities occur in parallel with the continued erosion of community and household traditions, including long-standing agrarian divisions of labour. Private trade in particular has significantly increased since the implementation of SAPs and the demise of parastatal marketing which prohibited forms of private trading. Most if not all households exhibit diversified livelihoods. However the nature and composition of these activities varies between both locations and wealth groups (see Table 6.1).
Poorer rural households are increasingly dependent on non-specialist wage labour (on- and off-farm) and the use of off-farm natural resources, to offset deficits in food production. With less time and resources available to them to cultivate their own farms, their adoption of on-farm risk-averse strategies (e.g. drought resistant, low value food crops) does little or nothing to reduce their longer-term vulnerability. In many places (e.g Mazombe Division, Iringa, CS 2) the poorest households are just surviving and struggle to retain control of their holdings. When such struggles are lost, as has happened more frequently in Kwimba District (CS 3) and Dodoma Rural District (CS 6), then out-migration by a proportion of poorer households results. Seasonal (or longer term) movements by individuals undertaken within the locality, to adjacent districts or outside the region, for the purpose of employment, may too be part of the diversification strategies of poorer households (e.g. Shinyanga District, CS 4; Dodoma Rural, Annex 1F). At times of stress, when for example confronted with drought or transitory food insecurity, a greater proportion of households will rely on individual migration strategies to cope (see Table 4.3).
While poorer rural households are driven into off-farm activities in order to survive, minorities of wealthier rural households engage in non-farm activities to complement successful agrarian accumulation strategies. As above, the wealthiest households typically have access to the more fertile and tractable holdings, and are well able to extend the agricultural frontier. They engage in commercial agriculture, and usually have the resources to employ labour as and when required. In Kwimba District (CS 3) however, labour availability is cited as a constraint and linked to the promotion of interest in ox-ploughs. At new settlements in the Masai plains wealthy farmers import their own labour (CS 7). In Shinyanga and Dodoma Rural districts, where a direct relationship between cattle ownership and wealth persists, incomes derived from livestock or livestock product sales may predominate (see CS 4). The wealthiest households are able to complement farming activities with a variety of business and trade initiatives.
Most studies identify a middle or average wealth group existing between the minority of wealthiest households and the bulk of impoverished households, however the latter is differentiated. Incomes from agriculture for households in this group are predictably more than the subsistence levels associated with the poorest households, and typically combine higher value/risk crops (and in Shinyanga, some livestock) with food crop components. While they cultivate less land than the wealthier households, and are more likely to rely on family or cooperative labour rather than hired labour, their agricultural holdings are relatively secure. Better connected than the poorest and with modest resources, their off-farm activities may include petty business, formal sector employment, services, crafts and rentals. In terms of decision-making, the indications are that this group will generally (i.e. in good years) have choice as to the strategies undertaken and how these are adapted

91
to circumstance, but will not necessarily have the depth of resources to cushion the household from severer shocks to the farming system. The dynamics of households in this group are perhaps the least clear while their position and general circumstances suggest the greatest potential for change - either favourable or inauspicious.
One further group highlighted in the literature in the context of diversification and migration is that of youth, predominantly but not exclusively male (see Van Vuuren, 1999). The lack of perceived opportunities in agriculture and disenchantment with village life and mores is identified in a number of studies (e.g. Mung'ong'o, 1998 [CS 1]; Mwamfupe, 1998; Jambiya, 1998). Many are migrating to urban centres in search of alternative employment, particularly trade, giving rise to a ‘greying of the countryside’.
Table 6.1 Examples of diverse livelihood portfolios across semi-arid Tanzania
Location (& source)
HH case study strata
Strategies undertaken by wealth groups
Accumulating farmers
Substantial returns from crop sales (tomatoes, maize, sunflower), and use of hired labour; significant incomes from business, crafts or rents (e.g. tractors, oxen, beer brewing).
‘Peasants’= Modest incomes from agriculture (tomatoes, sunflower), using little hired labour; diversified income sources include piecework, crafts, petty commerce, rents, and off-farm NRs.
Ikuwala sub-village, Mazombe Division, Iringa District
(Case Study 2)
‘Peasant labourers’=
Subsistence cropping underpinned by cash income predominantly associated with piecework and with off-field NRs (e.g. grass cutting, firewood collection).
Wealthier minority
Top quintile control 50% of land, and market larger proportion of produce (rice, maize, cotton); further accumulation held in check by labour constraints. Complementary livestock keeping: draught power, HH milk production, brideprice.
Kitunga village, Kwimba District, Mwanza Region (CS3)
Sign. historical out-migration, presently limited.
Poorest half Cash (cotton), and food crops (rice, maize) for consumption - insufficient for year in question - and sale; main source of income for circa 40% from wage labour or off-farm employment.
Non-poor tercile (by consumption)
Cash income from livestock (live & products) sales (64%)*, diverse portfolio of business enterprises (15%)*. Crop income (20%)*; majority however consumed.
Middle tercile Cash income split between livestock (live & products) sales (40%)* and non-farm incomes (26%)*. Crop income (33%)* based on higher proportion of higher value/risk crops (i.e maize, paddy).
Shinyanga District, Shinyanga Region (CS4)
Poorest tercile
Subsistence cropping of low return, drought resistant crops (sorghum, millet, sweet potatoes) (44%)*; underpinned by off-farm activities (cotton harvesting, migration to cotton ginneries) (37%)*, and some livestock related sales (16%)*.
Wealthy minority
Own large herds of cattle (tajiri ng'ombe), cultivate relatively large fields, access to better quality land (irrigated), hire labour, involved in non-farm activities (eg milling machines, petty trade).
Dodoma Rural District, Dodoma Region (SUA Field work) Poor Own no or few cattle, less access to quality land, own fewer material
assets; work as labourers, migrate to seek employment
Haubi Village, Kondoa District
Wealthiest Intensive intercropping for cash & consumption using hired labour; plus incomes from businesses

92
Average Intensive intercropping plus gardens (vegetables, fruit, sugar cane) for sale & subsistence; sharecropping arrangements with poorest group; formal sector employment and petty business.
(CS7)
Out-migration by all groups to expansion areas; wealthier groups may effect satellite HHs.
Poorest Subsistence production (maize, sorghum, beans) underpinned by day labouring - kibarua; sharecropping arrangements with middle group.
Wealthiest Extensive/commercial crop production (bulrush millet, sorghum, oil seeds, finger millet maize) using hired even imported labour.
Average Extensive crop production; hired or cooperative labour at peak periods only.
Soya Village, Lower Irangi, Masai plains (CS7)
Expansion area: In-migration from Kondoa District
Poorest Subsistence production (maize, bulrush millet, beans) underpinned by day labouring; leasing and sale of land to secure ploughing services, inputs or credit.
= terminology used by case study authors, Birch-Thompsen et al. (1999). * percentage of total income (i.e. including cash and subsistence contributions to consumption). Diversification is very much the norm for rural African households, but as Barrett and Reardon (2000) observe, debate continues as to whether it is accelerating and one way or a transitory phenomenon associated with current stresses (e.g. the on-going turbulence of SAPs).
6.2 The nature and distribution of poverty
6.2.1 Household poverty and vulnerability
The distinguishing characteristics of rural poverty as identified through a major participatory poverty analysis included minimal agricultural inputs undermining quality and quantity of food, lack of productive land close to village centres, insufficient access to health and education, lack of power over decisions, dependency, disability, and discrimination against women-headed households (Narayan, 1997).
PRA studies undertaken in various semi-arid regions by NGOs (i.e. SCF(UK) & CARE) have focused on access to and/or possession of certain types of resources to assess wealth or poverty. The SCF(UK) studies, which identify 'food economy zones' as differentiated by agro-ecological and economic factors, delineate wealth groups according to land cultivated, means of cultivation, and livestock owned. Boxes 3.5 and 3.6 (Section 3) depict the situation for the 'semi-arid lowlands' of Dodoma and Singida's semi-arid 'central sandy plains'. Poverty would appear to be rife throughout the central semi-arid zone, albeit in those areas with higher agricultural potential and/or better access to infrastructure and markets the proportion of impoverished households appears to be less (see 3.3.3).
As for the participatory poverty assessments, livelihood approaches link the assets and entitlements that households can mobilise in the face of hardship, to their wealth or security status. The more assets people have access to, the wealthier they are perceived to be and the less vulnerable they are to future downturns. In addition to quantity, the mix and relative flexibility of assets and their timely access are also important. Some assets are more readily liquidated (e.g. livestock), or substitutable (e.g. labour), providing for greater livelihood flexibility, others require timely access to enhance returns (e.g. oxen, ploughs). Cattle in particular - small-stock to a lesser extent - may be viewed as natural capital (from which milk, meat, hides, draught power and cash may flow), or financial capital (as brideprice, or investment)(see CS 3), while amongst pastoralists they may engender social capital.

93
All the studies link states of impoverishment with reduced holdings of certain assets (see Table 6.2). Poorer people typically have access to less, often more infertile, land; but more crucially they have fewer or none of the key resources - labour, ‘manpower' for opening land, oxen, ploughs, time or finance - to cultivate their minimal holdings. In terms of human capital poorer households are more vulnerable to ill health, have less available labour and generally higher dependency ratios. Levels of formal educational attainment amongst adults, and particularly women, are very low. Case study 4, in Shinyanga District, confirms the view in the literature that the children of the poor receive significantly less education than those of non-poor households (in this case their school attendance is two thirds that of children from better-off households). This suggests the likelihood that they may be predisposed to vulnerability in their adult lives - a vicious circle of impoverishment.
Poor households in the central semi-arid areas are unable to produce sufficient food for 12 months in 'normal' (cf. bad) seasons. In Dodoma's semi-arid lowlands it is estimated that poor households, approximately half the population (45-55%), derive just below two-thirds of their food needs from their own fields during a normal year (SCF(UK), 1999b). In the sandy central plains of Singida, where 'poor' and 'very poor' groups constitute between 35% and 40% of the population, only about half of household food needs are met, with these poorest groups reliant on gifts from wealthier relatives even in normal years (SCF(UK), 1999a).
Poorer households (as per 6.1.2) are increasingly dependent on non-specialist wage labour (on- and off-farm) and the use of off-farm natural resources, to offset these deficits in food production. However with less time and resources available to them to cultivate their own farms, they adopt risk averse strategies (e.g. drought resistant, low value food crops), with relatively poor returns. Dercon's (1996; CS 4) study in Shinyanga District demonstrates how such strategies may lead to the development of poverty traps, with households facing permanently low incomes and increasing vulnerability. Poorer households typically secure poorer returns (e.g. yields, product prices, wages) against their investments in agriculture. The cumulative effects of poor harvests as for Dodoma and Singida through 1997-1999, increase vulnerability significantly. In Dodoma it was predicted that 58% of the population would suffer food deficits in the 1999-2000 season.
Returns from predominantly casual employment do not enable the poor to strategically enhance their asset base or develop accumulation strategies. Their reliance on non-specialist employment may follow on from poor educational attainment levels and/or limited educational opportunities impacting human capital, but may also reflect the absence of wider opportunities including the underdevelopment of community-level infrastructure. The poor are also frequently excluded from many diversification strategies because of their inability to meet threshold requirements in the form of physical and liquid capital (e.g. tools, machinery, transport, savings) or social capital. In Dodoma Rural District (CS 6) households in the poorest group are most unlikely to own a bike, while all cultivation, for example, is undertaken by hand hoe.
Poor households are typically at a disadvantage when measured against the entrepreneurial skills and resources of wealthier households and/or the external factors that favour them (e.g. access to credit and markets). Moreover, the rural poor are less well organised and have less social clout to be able to influence external events. It is precisely to remedy these deficiencies that has given rise to non-governmental organisations such as INADES ('helping farmers' organise themselves and have a voice in society), DONET, and the Forest, Trees and People Programme (FTPP-TZ) (see Annex 1E).
Agencies - the target organisations in the context of this work - hold a range of positions on the causes of poverty and on the international poverty targets. Many are familiar with some of the complexities and dynamics associated with poverty, and ideologically and actively engaged in poverty reduction measures. Scepticism also exists ("people are just lazy"), and amongst those

94
familiar with the rhetoric of poverty eradication expediency may serve as reason enough to adopt it (Annex 1E).
6.2.2 Gender and intra-household poverty
Whether as heads of household or members of households headed by men, many studies reveal that women (and girls) are subject to institutionalised gendered inequalities and are exposed to far greater risk of poverty (Laier et al, 1996: 4; Mbughuni, 1993: iv; Mbilinyi et al., 1999: 93) (see Section 4.7).
The research undertaken by Mbilinyi et al. (1999) in Shinyanga and Ngorongoro, both confirmed that men usually had control over higher value resources (e.g. cattle, cotton and maize) compared with those managed by women (e.g. goats, milk and hides), and revealed and raised other concerns that were deemed (by the authors or feedback workshop participants) to have an impact on food security. These included demoralising aspects of bridewealth, the precarious position of polygamous wives and widows, violence against women and children, child marriages, and specifically in Shinyanga the beating and murder of old women identified with witchcraft.
The increasing engagement of men in distant employment, notably mining in Shinyanga (Madulu, 1998) and Dodoma (SUA, 2001, Annex 1F), which may ultimately provide additional income, obliges many women to spend more time in market activities irrespective of their other roles. Together with increasing their workloads, women have less time to cultivate and provide food (Mbilinyi et al., 1999).
Perhaps the most disturbing issue associated with livelihood assets was the lack of formal education amongst many women (upwards of ten years), but predominantly from poorer households. Case study (CS 3 & 6) suggest that upwards of a third (38%) and a half (51%) of all women may have had no formal education, compared with a fifth (21%) and a third (37%) respectively for men. Table 6.2 Assets, strategies and outcomes associated with the poorest groups
Group & Case study locations
Assets: Financial, Human, Social, Natural, & Physical
Activities/Strategies Outcomes
'Peasant labourers'= Ikuwala sub-village, Mazombe Division, Iringa District (CS2)
Average cultivated area per HH is 2.27 ha.; low agricultural incomes; high dependency ratios and physical weakness; <4% with secondary education.
Subsistence cropping; income predominantly from piece work & off-farm NR; unable to hire wage labour.
Low crop output per acre; declining soil fertility and erosion.
Poorest half (50%) Kitunga village, Kwimba District, Mwanza Region (CS3)
37% without formal education; cultivating less than 2 ha.; no cattle, few or no smallstock; least possessions.
Subsistence cropping; agricultural wage labour; limited use of inputs.
Insufficient food produced for 12 months (less than 10 months in 1990-91). Declining soil fertility, overgrazing, deforestation
Poorest tercile (33%) Shinyanga District, Shinyanga Region (CS4)
Minority own cattle, half own smallstock; per capita land area 0.6 ha.; limited or no access to credit;
Subsistent cropping; underpinned by agric. wage labour & seasonal migration
Low return from crops per ha. (cf. other HHs.) Children's school attendance only 2/3rds that of non-poor households. Minimal investment in tools.

95
Poor HHs. Dodoma Rural District, Dodoma Region (SUA CS)
No or few cattle; less or no access to quality land, and irrigation; hand tools; reliant on fewer material assets.
Subsistent cropping; work as labourers; migrate to seek employment.
Hungry months - SCF (1999) suggest less than 2/3rds of food met by HH in 'normal' year.
Decreasing soil fertility
Poor HHs (17%). Haubi Village, Kondoa District (CS7)
Less HH labour (than other groups); own less than 0.8 ha, cultivate on average 0.4 ha. with hand hoes; no cattle, few if any smallstock; very low levels of formal education.
Subsistence production with little or no use of fertiliser; underpinned by day labouring; some sharecropping (gains access to ploughs).
Crop production not meeting annual consumption needs.
Land degradation
Poor HHs (50%). Soya Village, Lower Irangi, Masai plains (CS7)
Less HH labour; own less than 2.4 ha, cultivate 0.4 ha. with hand hoes; no cattle, few if any smallstock; very low levels of formal education.
Subsistence production with little or no use of fertiliser; underpinned by day labouring; leasing and sale of land.
Crop production not meeting annual consumption needs. Holdings deteriorating.
= terminology used by case study authors, Birch-Thompsen et al. (1999).
6.3 Key knowledge gaps and researchable constraints Preceding sub-sections 6.1 and 6.2 indicate how most households in the semi-arid areas pursue multi-functional and often multi-spatial livelihoods, reliant on-farm and off-farm natural resources, and increasingly it appears on non-NR activities such as rural trade and services. We see too how livelihood strategies are linked to wealth groups (e.g as determined by the quantity, quality and mix of assets). Using their returns from commercial agriculture non-poor households in different locations have been able both to extend their agricultural interests (e.g. securing more land, employing more labour) and to diversify into trade and service enterprises. The poorest groups by contrast, continue to eke out an existence from agricultural holdings, but diversify into casual unskilled wage labour and other off-farm activities (e.g. agricultural labour, mining, fodder and firewood collection, charcoal and brick making) to offset subsistence food deficits. The wealthy constructively manage and blend their livelihood portfolios to consolidate accumulation. The poor have considerably less flexibility in their response to the 'push' and 'pull' factors that determine diversification. The pervasiveness of diversification strategies amongst the rural poor determines that consideration of the constraints to the development of both agriculture and the non-farm economy is essential.
Constraints to agricultural production include the lack of subsidies, minimal agricultural inputs, poor extension services, absence of clear pro-poor credit policy, and the lack or poor economic infrastructure (e.g. markets, roads, electricity). Furthermore, markets (i.e. produce, land, labour) and technical developments (e.g. irrigation projects) often appear to favour resource-rich farmers.
Increasing agricultural productivity and value through pro-poor technologies that build upon farmers' knowledge and practices: In many households the absence of men (due to migration or bereavement) compels an expansion in the work and roles undertaken by women and youth in agriculture. Labour or capital intensive technologies for example, have only limited application to the extensive and non-commercialised systems in Tanzania's semi-arid areas (Meertens et al. 1995). The identification and development of pro-poor technologies (e.g. improved soil fertility management, soil and water management, small-scale irrigation, lighter tools for women, potential for tree crops) to increase agricultural productivity and value is essential, and should be built on farmers' knowledge and practices. The role of local agencies engaged in promoting farmer

96
involvement in the decision-making processes and farmer innovations (e.g. INADES in Dodoma - see Annex 1E and Critchley et al. (1999)), show signs of success. Larger imposed projects have demonstrated a tendency to overwhelm local processes, and raise questions of sustainability (see Rondinelli, 1993; Korten, 1980).
Improvements in the access to information, knowledge and technologies, and their alignment with the needs of the rural poor: The public extension services have been referred to both in terms of their failure to deliver relevant or targeted material (see sub-section 3.4.3), and in the local government context with corruption (see sub-section 4.8.1). Under the reform programmes there has been a substantial reduction in resources, and accompanying decline in the morale of the service. Decentralisation has led to increasing accountability to district government, which is intended to improve client-oriented service delivery. There is an opportunity to explore the implications of recent changes and their effectiveness in meeting the needs of the poor (e.g. how it takes account of the agricultural knowledge information systems of poor women, illiterate people, remoter households).
Impact of the draw of labour to mining (and tourism), on household production and the lives of women and children: While some work has been initiated (e.g. Mbilinyi et al., 1999; FAO, 1995), a fuller understanding of the impact of the draw of male labour away from holdings (e.g. to mining, tourism), or of HIV/AIDS, on household production and the lives of women and children, is yet required.
Water development and watershed management options: Although larger scale irrigation schemes have only failed to benefit poorer people, small-scale irrigation and especially small multi-purpose groundwater-based projects to meet domestic and irrigation needs, have considerable potential to benefit the poorest groups. However, rural water supply and irrigation sector interventions continue to be pursued in isolation, and there is need to integrate approaches for the development of appropriate groundwater sources, community management of multi-purpose schemes and efficient irrigation methods. Management options are also required to address the impact of increasing traditional, small-scale irrigation on down stream water users, especially hydropower and the environment. These need to be linked to changes in policy at the national level, and institutional development at the basin level, but it is clear that there is a massive gap between the demands upon basin-level agencies and their capacity. Support for local-level community initiatives and intermediate level institutions to improve water management could start to address this deficit.
Links between cultural practices, ethnicity, and rural poverty: The literature and case studies include references to the relative livelihood successes of certain ethnic groups over others. Soya village on the Masai Plains was established by Rangi settlers, who are reported to have displaced the indigenous Burunge people (CS 7). In Arusha, the more politically adept Masai have managed to change land demarcation and intervene in 'non-Masai' irrigation systems (Bertelsen and Jorgensen, 1996). In a comparative study of female- and male-headed households in Dodoma however, while Hella et al. (2001) conclude that socio-culturally influenced factors such as land entitlement (together with socio-economic factors) disadvantage FHHs, gendered inequalities appear more significant than those stemming from the ethnicity of different households. Comparative enquiry could throw more light on those particular factors (e.g. social and political capital) which facilitate the development of or enhance livelihood options for particular ethnic groups.
Longitudinal livelihood studies: The characterisation of current livelihoods, which depicts accumulation by the wealthy and coping behaviour by the poor, does not adequately explain the relationship between these groups or the degree of mutuality or exploitation between the two strategy types. The latter raises the familiar question as to whether emphasis should be placed on

97
the development of improved strategies for poor groups, or on indirectly improving their livelihoods through stimulating further enterprise amongst an elite. In either case, more knowledge is required on labour markets, and how they might be improved to meet the needs of the poor. Although widely acknowledged that fortunes change, and some measure of understanding exists as to the factors that favour or deter livelihood improvements (see sub-section 4.8), the characteristics associated with individuals or households who have successfully moved beyond coping to having more choice in their strategizing, remain unclear. Selective longitudinal studies could address this.
Implications of increased legal and illegal use of wild natural resources/common pool resources for the environment: The increasing use of and trade in natural resources (e.g. firewood, timber for charcoal, fish, bushmeat - see CS 5) clearly has implications for the environment and biodiversity. Can existing best practice (e.g. MPOMIPA) be better shared, and is there room to further develop niche markets for wild products (e.g. honey, hunting, ecotourism)?
How might the existence of recent progressive policies be made more effective at the local level? There is some consensus amongst experts that Tanzania has recently established a number of progressive policies (e.g. wildlife policy, land acts), which by their nature will take time to implement. How might these policies be made effective soonest at the local level? What new institutional arrangements are emerging in response to this changing policy context? Pro-poor credit policy and mechanisms: Poorer households throughout the semi-arid areas typically have minimal savings and are usually unable to access timely credit. In Shinyanga, belated planting often flows from an inability to secure credit, increasing the likelihood of subsequent food insecurity. Poorer households and poor women seem to experience the familiar litany of constraints associated with their circumstances (e.g. lack of village-based credit facilities, emphasis on modern technology, unrealistic requirements of lending agencies). In Iringa, where cash and credit in kind exists, social capital in the form of trust between groups was found to be crucial (Annex 1F). What are the institutional constraints to developing pro-poor credit policies and mechanisms?
6.4 Livelihood options and emerging pointers for future strategies Public sector support for agriculture has declined in recent years, and policy reforms intended to advance agricultural productivity, non-farm activities and rural transformation generally, have proven less than adequate. Small-scale subsistence farming remains a key component of the livelihoods of the rural poor in semi-arid Tanzania, a situation that will persist for some time to come. Off-farm diversification by the poor however and the changing social context suggest a parallel need for development of the non-farm economy. If the poor are to be able to raise themselves above poverty, and not simply to have their heads held above water (i.e. the causes of sociological as much as physiological deprivation are to be addressed), then potential livelihood options will derive from consideration of the wider rural (rural-rural and rural-urban) picture. Reinvigorated support for the agricultural sector, and natural resources, should be linked and operationalised within a wider pro-poor framework.
The project processes have included rolling contact and focused engagement with a number of target organisations including researchers, advisers and policy makers, planners, trainers and implementers. While these agents/agencies have diverse agendas and different responsibilities with respect to the rural poor, on-going project enquiry and discourse have stimulated or corroborated interest in the livelihoods approach and confirm active demand for the emergence and facilitation of new livelihood options.
Assessing pointers for future strategies has been bound up with the identification and analysis of constraints and opportunities associated with developing understanding of the livelihoods of the poor (sub-section 6.3 above). Other pointers, perhaps deemed outside the remit of this study, have
98
also emerged (e.g. social service provision [education, health], infrastructural development, biotechnology). Contributions from target organisations have also included more focused workshop inputs on what they consider works (e.g. consulting the wider community, prior to targeting poorer households; 'right attitude' required by researchers, politicians etc.), or is not working (e.g. irrigation schemes for the poor; resource management by user groups [cf. community-wide organisations]), for poorer households and communities (Annex 1G).
The overarching focus of the project is that of the livelihoods of poor people in the semi-arid parts of Tanzania. Understanding has been developed through the use and sharing of a 'sustainable livelihoods' approach, for which there are strengths and weaknesses. Specific strengths included that it invited consideration of the fuller picture, and that several target agencies in Tanzania were already using SL approaches (e.g. SCF(UK), CARE, FAO). Furthermore the SL approach has proven a useful tool with which to facilitate debate and enquiry amongst certain players. However weaknesses included that the SL concept and terminology were found by some to be off-putting, and inevitably, given a relatively short study period, the approach precluded the development of more focused work. Issues of sustainability across systems, as flagged in sub-section 2.2.6, remain outstanding. On balance however, we believe that the SL approach provides a useful way for moving forward.
Similarly, and building on NRSP's commitment to engagement with 'target institutions', linkages between civil society and government organisations, and the blend of practitioners and researchers, policy makers and implementers, have provided useful triangulation. Developments associated with the SL approach raise the issue of the nature of future donor interventions and strategies. From the SL perspective an increase in cross-sectoral activities is envisaged, for which improved connections between players would be essential. The appropriateness of project interventions, picking up from earlier critiques by Korten (1980), Lecomte (1987), Rondinelli (1993) and others, is again being challenged21.
21 See Bradford Centre for International Development (2001), 'Goodbye to Projects? The Institutional Impacts of a Livelihood Approach on Projects and Project Cycle Management', a collaborative research 'project' funded by DFID: <http://www.livelihoods.org/post/logframe2-postit.html>.

99
REFERENCES Ashley, C. and D. Carney (1999), Sustainable Livelihoods: Lessons From Early Experience,
Department For International Development, London.
Bagachwa M. (1997), The Rural Informal Sector in Tanzania. In Deborah Bryceson and Vali Jamal (editors), Farewell to Farms: De-agrarianisation and Employment in Africa, African Studies Centre, Leiden.
Bagachwa M, Shechambo F, Sosovele H, Kulindwa K, Naho A. with Cromwell E. (1997), Case study for Tanzania, in Reed (1997), Structural adjustment, the environment and sustainable development. Earthscan Publications/WWF.
Barrett, C. and T. Reardon (2000), Asset, Activity and Income Diversification among African Agriculturists: Some Practical Issues, (unpublished mimeo).
Bertelson, Pernille and Marianne Joergensen (1996), When Pastoralists become Irrigators: Maasai people combining irrigation and transhumant livestock keeping in northern Tanzania, Working Paper, Institute of Development and Planning, Aalborg University.
Biamah, Elijah, Jojan Rockstrom and George Okwach (2000), Conservation Tillage for Dryland Farming: Technological options and experiences in Eastern and Southern Africa, RELMA Workshop Report No. 3, RELMA/Sida, Nairobi.
Binswanger, H.P. and V. Ruttan (1978), Induced Innovation: Technoogy, Institutions and Development, Baltimore, John Hopkins University Press.
Birch-Thomsen, Torben, Pia Frederiksen and Hans-Otto Sano (1999), A Livelihood Perception on Natural Resource Management and Environmental Change: A case analysis from a semi-arid village in Tanzania. Paper presented to the SASA Conference held in Copenhagen, November 17-18, 1999.
Boesen, Jannik, Idris Kikula and Faustin Maganga (editors) (1996), Sustainable Agriculture in Semi-Arid Tanzania, DUP (1996) Ltd, Dar es Salaam.
Booth, David et al (1993), Social, Cultural and Economic Change in Contemporary Tanzania: A People-Oriented Focus, Stockholm: Swedish International Development Authority.
Boserup, E. (1995), The Conditions of Agricultural Growth: The Economics of Agrarian Change Under Population Pressure, Chicago, Aldine.
Bourn, David and Roger Blench (editors)(1999), Can Livestock and Wildlife Co-exist? An interdisciplinary Approach, Overseas Development Institute, London.
Brundtland, G.H. (1987), Our Common Future, Oxford, Oxford University Press.
Bryceson, D (1999), Sub-Saharan Africa Betwixt and Between: Rural Livelihood Practices and Policies, ASC Working Paper 43.
CARE (1995), Rapid Food and Livelihood Security Assessment in Shinyanga, Mara & Mwanza Regions, CARE International in Tanzania, September 1995.
Carney, D (1999), Approaches to Sustainable Livelihoods for the Rural Poor, ODI Poverty Briefing, 2 January 1999.
Carney, D (1998), Sustainable Rural Livelihoods: What Contribution Can We Make? Department for International Development, London.

100
Carswell, G (1997), Agricultural Intensification and Rural Sustainable Livelihoods: A “Think Piece”, IDS Working Paper, No 64; Brighton, Institute of Development Studies.
Chambers, R (1989), Editorial Introduction: Vulnerability, Coping and Policy. IDS Discussion Paper No. 311; Brighton, Institute of Development Studies.
Chambers, R and R Conway (1992), Sustainable Rural Livelihoods: Practical Concepts for the 21st Century, IDS Discussion Paper No. 296; Brighton, Institute of Development Studies.
Christiansson, Carl and Idris S. Kikula (1996), Changing Environments: Research on Man-Land Interrelations in Semi-Arid Tanzania. Regional Soil Conservation Report No. 13, SIDA, Nairobi.
Cooksley, B (1994), Who’s poor in Tanzania? A Review of Recent Poverty Research, in M S D Bagachwa (ed), Poverty Allieviation in Tanzania: Recent Research Issues, Dar-es-Salaam University Press.
Coulson (1982), Tanzania: A Political Economy, Clarendon Press Oxford, 1982.
Critchley, Will (editor), Roshan Cooke, Tijan Jallow, Sophie Lafleur, Mineke Laman, Janet Njoroge, Verity Nyagah and Emmanuelle Saint-Firmin (1999), Promoting Farmer Innovation: Harnessing local environmental knowledge in East Africa, RELMA Workshop Report No. 2, RELMA/Sida, Nairobi.
David, Rosalind, Oumoul Khayri Niang, Mary Myers, Orlanda Ruthven and Pauline Yabré (1995), Changing Places? Women, Resource Management and Migration in the Sahel, SOS Sahel International (UK).
Davies, S (1996), Adaptable Livelihoods: Coping with Food Insecurity in the Malian Sahel, Macmillan Press, London.
Davies, Susanna and Naomi Hossain (1997), Livelihood Adaptation, Public Action and Civil Society: A Review of the Literature, IDS Working Paper 57, Brighton, Institute of Development Studies.
Dejene, Alemneh, Elieho K. Shishira, Pius Z. Yanda and Fred H. Johnsen (1997), Land Degradation in Tanzania: Perception from the Village. World Bank Technical Paper No. 370, The World Bank, Washington D.C.
Dercon, S. (1998), Wealth Risk and Activity Choice: Cattle in Western Tanzania, Journal of Development Economics, Vol. 55, No. 1, pp 1-42.
Dercon, S. (1996), Risk, Crop Choice, and Savings: Evidence from Tanzania. Economic Development and Cultural Change, Volume 44, No. 3, pp 485-513.
Dercon, S. and P. Krishnan (1996), Income Portfolios in Rural Ethiopia and Tanzania: Choices and Constraints, Journal of Development Studies, Vol. 32, No. 6, pp 850-875.
Devereux, S (1999), 'Making less last longer': Informal Safety Nets in Malawi, IDS Discussion Paper 373, Brighton, Institute of Development Studies.
Devereaux, S (1993), Goats before Ploughs: Dilemmas of Household Response Sequencing During Food Shortages, IDS Bulletin, Vol. 24, No. 4, pp52-59.
DFID (1999), Natural Resources Systems Programme: Annual Report 1998/99, RNRKS, DFID, London.
Dreze, J and A Sen (1989), Hunger and Public Action, WIDER Studies in Development Economics Series, Oxford: Clarendon Press.

101
Ellis, Frank (2000), Rural Livelihoods and Diversity in Developing Countries, Oxford University Press.
Ellis Frank, and Chris Collinson (1998), Non-farm rural employment: Tanzania - partial case study, paper commissioned by DFID, June 1998.
FAO (1998), The State of Food and Agriculture: Rural Non-Farm Income in Developing Countries, Part III, pp 283-356.
FAO (1995), The effects of HIV/AIDS on farming systems in eastern Africa, FAO Farm Management and Production Economics Service, FAO, Rome 1995.
Food Studies Group (1992), Agricultural Diversification and Intensification Study, Final Report - Volume II, Farming Systems: Characteristics and Trends, FSG, International Development Centre, University of Oxford.
Greeley, Martin (2000), Creating a framework for reducing poverty: Institutional and process issues in national poverty policy in selected African Countries - A Tanzanian Case Study for the SPA. Paper commissioned by DFID and SIDA on behalf of the SPA, February 2000.
Goldman, A (1995), Threats to Sustainability in African Agriculture: Searching for Appropriate Paradigms, Human Ecology, Vol 23, No. 3. Cited in Ellis (2000).
Hankin, Thomas D. (1971), Response to drought in Sukumuland, Tanzania. Mimeograph.
Hatibu N, E.Lazaro and H.F Mahoo (1997) Farming systems Assessment of Rain water Harvesting for Crop Production in Tanzania: Case of Bahi Sokoni and Uhelela Villages in Dodoma District SWMRG/FAO.
Hatibu N., H.F.Mahoo and G.J. Kajiru (2000) The role of RWH in Agriculture and Natural Resource Management: from mitigating drought to preventing floods. In Hatibu N. and H.F Mahoo (Eds) Rain water Harvesting for Natural Resources Management. A Planning Guide for Tanzania. Technical Hand Book No. 22 RELMA/sida
Hatibu, N.H, H.F. Mahoo, E. Lazaro and F. B Rwehumbiza (2000) Rethinking Natural Resouces Degradation in Semi- Arid Africa: Implications for Policy. Tanzania Case Study.SWMRG/ODI
Hella, J. P., G. Van Huylenbroeck, L. D'Haese and E.A. Lazaro (2001), Gender and Agricultural Production in Semi-arid Tanzania: An overview of coping strategies (unpublished).
Holtland, G (1994), A farming System Analysis of Mvumi Division, Dodoma Region, Tanzania: A case study on intensifying agriculture in semi-arid Africa. Mvumi Rural Training Centre, Communication Bulletin No 1, 1994.
HTS (1999), Re-Issue of Calls for Concept Notes (CNC99/01A) NRSP, Huntings Technical Services Ltd.
Hussein, K and J Nelson (1998), Sustainable Livelihoods and Livelihood Diversification, IDS Working Paper No. 69; Brighton, Institute of Development Studies.
ICRA (1991), An Analysis of Agricultural and Livestock Production Systems in Misungwi Division Lake Zone, Tanzania ICRA Working Document Series 16.
Igoe, James (1999), National Parks and human ecosystems: the challenge to community conservation. A case study from Simanjiro, Tanzania, paper presented at the Conference on Displacement, Forced Settlement and Conservation, St Anne's College, Oxford, September 1999.
102
Jambiya, G (1998), The Dynamics of Population, Land Scarcity, Agricultural and Non-Agricultural Activities: West Usmbaras Mountains, Lushoto District, Tanzania, ASC Working Paper 28, Afrika-Studiecentrum, Leiden.
Kabeer, N (1991), Gender, Production and Well-being: Rethinking the Household Economy, IDS Discussion Paper No. 288; Brighton, Institute of Development Studies.
Korten, David (1980), Community organisation and rural development: a learning process approach, Public Administration Review 40, 5: 480-511.
Kauzeni, A S, FC Shechambo, and Ibrahim Juma (1998), Private and communal property ownership regimes in Tanzania, Land Reform 1998, No 1.
Kerner, D O and K Cook (1991), Gender, hunger, and crisis in Tanzania. In RE Downs, DO Kerner and SP Reyna (eds.), The Political Economy of African Famine, Philadelphia, Pennsylvania, pp 257-272. Cited by Laier, Julie Koch, Susanna Davies, Kirsty Milward and Jane Kennan (1996), Gender, Household Food Security and Coping Strategies: an Annotated Bibliography, Development Bibliography 14, Institute of Development Studies, Brighton.
Krueger, A.O. (1992), The Political Economy of Agricultural Pricing Policy: Vol 5: A Synthesis of the Economics in Developing Countries: A World Bank Comparative Study, Baltimore and London: John Hopkins University Press. As cited by Ellis (2000), Rural Livelihoods and Diversity in Developing Countries, Oxford University Press.
Laier, Julie Koch, Susanna Davies, Kirsty Milward and Jane Kennan (1996), Gender, Household Food Security and Coping Strategies: an Annotated Bibliography, Development Bibliography 14, Institute of Development Studies, Brighton.
Lamboll Richard, Mike Morris and Liai van Broeckhaven (2001), Biodiversity Conservation and Rural Development in Tanzania: Experience, examples and issues, Natural Resources Institute, Chatham (forthcoming).
Land Resources Development Centre (1987), Tanzania, Profile of Agricultural Potential, LRDC, Overseas Development Administration, Surbiton, UK.
Lane, Charles, and Richard Moorehead (1996), New directions in rangeland resource tenure and policy, in Living with Uncertainty: New directions in pastoral development in Africa, edited by Ian Scoones, Intermediate Technology Publications Ltd, London
Leach, Melissa, Robin Mearns and Ian Scoones (1999), Environmental Entitlements: Dynamics and Institutions in Community-Based Natural Resource Management, World Development, Volume 27, Number 2.
Lecomte, B. (1987), Project Aid: Limitations and Alternatives, OECD.
Limbu Festus (1999), The Future of the Reform Process: The Agricultural Sector and Poverty in Tanzania. Paper commissioned by Martin Greeley of the Institute of Development Studies, University of Sussex.
Lipton, M (1977), Why Poor People Stay Poor: Urban Bias in World Development, London: Temple Smith. As cited by Ellis (2000), Rural Livelihoods and Diversity in Developing Countries, Oxford University Press.
Liwenga, E. T. (1996), Household Food Security in a Soil and Water Conservation Project Area: The Case of Kondoa Eroded Area, Tanzania. In Boesen, Jannik, Idris Kikula and Faustin Maganga (editors) (1996), Sustainable Agriculture in Semi-Arid Tanzania, DUP (1996) Ltd, Dar es Salaam.
103
LRDC (1987), Tanzania: Profile of agricultural potential, report to ODA UK by the Land Resources Development Centre.
Madulu, Ndalahwa F (1998), Changing Lifestyles in Farming Societies of Sukumuland: Kwimba District, Tanzania. ASC Working Paper 27, Afrika-Studiecentrum, Leiden.
Madulu, N.F. and C.G. Mung’ong’o (1990), Socio-demographic studies in the HADO areas of Kondoa District, Tanzania. Final report to SIDA, Stockholm. Cited in Christiansson, Carl and Idris S. Kikula (1996), Changing Environments: Research on Man-Land Interrelations in Semi-Arid Tanzania. Regional Soil Conservation Report No. 13, SIDA, Nairobi.
Mahoo, H.F, M.D.B. Young and O.B. Mziray (1999), Rainfall Variability and its implications for transferability of Experimental Results in The Semi Arid Areas of Tanzania. Tanzania Journal of Agricultural Sciences Vol.2 No.2.
Mascarenhas, A. (1995), The Environment Under Structural Adjustment in Tanzania with Specific Reference to the Semi-arid areas. In Bagachwa, M.S.D and F Limbu (eds).Policy Reform and the Environment in Tanzania.
Mascarenhas, A. (1994), Environmental Issues and Poverty Alleviation in Tanzania, Repoa Special Paper 5, Network for Research on Poverty Alleviation (REPOA), Dar es Salaam.
Marsland, N., Long, S. A., and A. Sutherland (1999), Poverty Coping Strategies in Malawi: Final Report. NRI 1999.
Maxwell, Simon (1999), The meaning and measurement of Poverty, ODI Poverty briefing, 3 February 1999.
Maxwell, Simon, Ian Urey and Caroline Ashley (2001), Emerging issues in rural development: An issues paper, Overseas Development Institute, London.
Mbilinyi, Marjorie, Bertha Koda, Claude Mung'ong'o and Timothy Nyoni (1999), Rural Food Security in Tanzania: The challenge for human rights, democracy and development. A report presented at the launching workshop on rural food security policy and development, 23 July 1999.
Mbonile, Dr M J, Dr D G Mwamfupe and Mr R Kangalawe (1997), Migration and its Impact on Land Management in the Usangu Plains, Mbeya Region, Tanzania. Draft report submitted to ENRECA, May 1997.
Mbughuni, Patricia (1993), Country Gender Analysis for Tanzania, SIDA, Dar es Salaam.
McDowell, Christopher and Arjan de Hahn (1997), Migration and Sustainable Livelihoods: A Critical Review of the Literature, IDS Working Paper 65; Brighton, Institute of Development Studies.
Mearns, R. (1991), Environmental Implications of Structural Adjustment: Reflections on Scientific Method, IDS Discussion Paper No 284; Brighton, Institute of Development Studies.
Meertens, H.C.C., L.J.Ndege and H.J.Enserink (1995), Dynamics in Farming Systems: Changes in time and space in Sukumaland, Tanzania, Royal Tropical Institute, Amsterdam.
Messkoub, Mahmood (1994), The Social Impact of Adjustment in Tanzania in the 1980s: Economic crisis and household survival strategies, Population and Development Programme, Institute of Social Studies, Holland.
Minde, I. J. and T. O. Nakhumwa, (March 1997), Informal Cross-Border Trade Between Malawi and Her Neighbouring Countries, Report for TechnoServe, Inc., Nairobi, Kenya March 1997, USAID, Regional Economic Development Support Office for East and Southern

104
Africa (REDSO/ESA), Agriculutral Policy Research Unit, (ARPU) Bunda College of Agriculture, University of Malawi.
Misana, S.B., C.J. Sawio, F. Shechambo and S. Mchome (1997), Strategies for Village Land Management for Resource Conservation in selected Villages in Tanzania, Final Report, University of Dar es Salaam.
Mohamed, S.A. (1996), Farming Sustems and Land Tenure in Haubi Village of the Kondoa Eroded Area. In Christiansson, Carl and Idris S. Kikula (1996), Changing Environments: Research on Man-Land Interrelations in Semi-Arid Tanzania. Regional Soil Conservation Report No. 13, SIDA, Nairobi.
Monela, G.C., G.C. Kajembe, A.R.S. Kaonneka and G. Kowero (2000), Household Livelihood Strategies in the Miombo Woodlands of Tanzania: Emerging Trends. Paper subsequently published in the Tanzania Journal of Forestry and Nature Conservation Vol 73.
Moser, C.O.N. (1998), The Asset Vulnerability Framework: Reassessing Urban Poverty Reduction Strategies, World Development, Volume 26, No (1), pp 1-19.
Mwamfupe, Davis (1998), Changing Village Land, Labour and Livelihoods: Rungwe and Kyela Districts, Tanzania. ASC Working Paper 29, Afrika-Studiecentrum, Leiden.
Mung’ong’o, C.G. (1998), Coming Full Circle: Agriculture, Non-Farm Activities and the Resurgence of Out-Migration in Njombe District, Tanzania. ASC Working Paper 26, Afrika-Studiecentrum, Leiden.
Mung’ong’o, C.G. (1996), Ecological Interdependencies, Wealth Differentiation and Land Degradation in a Stressed Semi-Arid Area. A Study of One Core and One Expansion Village in Kondoa District, Central Tanzania. In Christiansson, Carl and Idris S. Kikula (1996), Changing Environments: Research on Man-Land Interrelations in Semi-Arid Tanzania. Regional Soil Conservation Report No. 13, SIDA, Nairobi.
Murphree, Marshal (1999), Synergizing Conservation Incentives: From local global conflict to compatibility. Community Conservation in Africa: Principles and Comparative Practice, Paper No. 7. Institute for Development Policy and Management, University of Manchester.
Murton, J. (1997), Sustainable livelihoods in marginal African environments: the social and economic impacts of agricultural intensification in Makueni District, Kenya, Conference Proceedings, Sustainable Livelihoods in Marginal African Environments, Sheffield University, April 1997. Cited by Carswell, G (1997), Agricultural Intensification and Rural Sustainable Livelihoods: A “Think Piece”, IDS Working Paper, No 64.
Narayan, Deepa (1997), Voices of the Poor: Poverty and Social Capital in Tanzania, Environmentally and Socially Sustainable Development Studies and Monograph Series 20, World Bank, Washington DC.
Ndagala, D K (1999), Conservation, privatisation of land and displacement in Tanzania, paper presented at the Conference on Displacement, Forced Settlement and Conservation, St Anne's College, Oxford, September 1999.
Ndagala, D.K. (1998), “Tanzania”, in Lane C.R. (ed), Custodians of the Commons: pastoral Land Tenure in East and West Africa, Earthscan, 1998.
NRI (1996), Tanzania Renewable Natural Resources Profile, ODA/NRI, Chatham, UK.
NRI (1991), Tanzania: Profile of Agricultural Potential, Natural Resources Institute, Chatham, UK.

105
NRSP (2000), Improving the poverty focus of NRSP's research on the management of natural resources. A draft poverty focus paper presented at NRSP Workshop, 29-30 November 2000.
NRSP (1999), The Systems Approach in the Natural Resources Systems Programme, DFID/NRSP, March 1999.
ODI & Partners (2000), Livelihood Diversification and the Rural Poor in Asia: Concepts and Methods Paper (Draft mimeo).
Okoth-Ogendo HWO (2000), Legislative Approaches to Customary Tenure and Tenure Reform in East Africa. In Toulmin C and Quan J.F. (Eds) Evolving Land Rights, Policy and Tenure in Africa, DFID/IIED/NRI, London.
Pender, John and Peter Hazell (2000), Promoting Sustainable Development in Less-Favoured Areas. IFPRI, Focus 4.
Pingali P, Y Bigot, H P Binswanger (1988), Population density and farming systems: the changing locus of innovations and technical change. In Lee et al (eds), Population, Food and Rural Development, Oxford: Oxford University Press.
Reardon, T (1997), Using Evidence of Household Income Diversification to Inform Study of the Rural Nonfarm Labor Market in Africa, World Development, 25 (5), 735-748.
Robinson, E.J.Z. et al (2000), Analysis of farmers' decision making in pest management. A component report for DFID's Crop Protection Programme, Project R7500.
Rondinelli, Dennis A. (1993), Development Projects as Policy Experiments: An adaptive approach to development administration, Routledge, London.
SAfAIDS (1998), Responding to HIV/AIDS: Technology Develoment Needs of African Smallholder Agriculture - Report of the Regional Conference foe Eastern and Southern Africa.
Saith, A. (1992), The Rural Non-Farm Economy: Processes and Policies, Geneva: ILO, World Employment Programme. As cited by Ellis (2000), Rural Livelihoods and Diversity in Developing Countries, Oxford University Press.
Salafsky and Wollenberg (2000), Linking Livelihoos and Conservation: A Conceptual Framework and Scale for Assessing the Integration of Human Needs and Biodiversity, World Development Volume 28, No.8, pp 1421-1438.
Sano, Hans Otto (1996), Enabling Strategies and State Intervention: Major Livelihood Problems in Semi-Arid Villages in Iringa District, Tanzania. In Boesen, Jannik, Idris Kikula and Faustin Maganga (editors) (1996), Sustainable Agriculture in Semi-Arid Tanzania, DUP (1996) Ltd, Dar es Salaam.
SCF(UK)/Alexandra King (1999a), Household Food Economy Assessment: Singida Region, Central Tanzania.
SCF(UK)/Ellen Mathys (1999b), Household Food Economy Assessment: Dodoma Region, Central Tanzania.
SCF(UK)/T Boudreau (1999c), Household Food Economy Assessment: Arusha Region.
Scherr, Sara J (1999), Dryland Degradation and Poverty. In Enos Esikuri, Hassan Hassan and Gunter Riethmacher (editors), Drylads, Poverty, and Development: Proceedings of the June 15 and 16, 1999 World Bank Round Table.
106
Scoones, Ian (1998), Sustainable Rural Livelihoods: A Framework for Analysis. IDS Working Paper No. 72; Brighton, Institute of Development Studies.
Seppala, P. (1998), Tanzanian Local Administration: A vehicle for democratic development? FAD Working Paper 3/98. http://www.valt.helsinki.fi/kmi/fad/fad-wp-3-98.htm
Sen, A (1981), Poverty and famines: An Essay on Entitlements and Deprivation, Clarendon Press, Oxford.
Shackleton, Sheona, Charlie Shackleton and Ben Cousins (2000), Re-valuing the Communal Lands of Southern Africa: New understandings of rural livelihoods. ODI Natural Resource Perspectives, Number 62, November 2000.
Shivji, I.G. (2001), A review of CPRs: A country Report on Tanzania; Paper presented at Cambridge Workshop, 9-14th July, 2001.
Siegel, Paul B. and Jeffrey Alwang (1999), An Asset-Based Appreoach to Social Risk Management: A Conceptual Framework. SP Discussion Paper, Human Development Network, Social Protection Unit, The World Bank, Washington.
Silberachmidt, Margrethe (2001), Deisempowerment of Men in Rural and Urban East Africa: Implications for Male Identity and Sexual Behaviour', World Development Vol. 29, No. 4, pp 657-671.
Sokoine University of Agriculture, and Ministry of Agriculture and Cooperatives (1999), Analysis of the Comparative Economic Advantage of Alternative Agricultural Production Options in Tanzania, Technical Paper No 102, September 1999, AMEX International, Inc.
Swift, J (1998), Factors influencing the dynamics of livelihood diversification and rural non-farm employment in space and time, Institute of Development Studies.
Swift, J (1989), Why are Rural People Vulnerable to famine? IDS Bulletin Vol 20 No.2 pp8 – 15.
Teskey, G. and R. Hooper (1999), Tanzania Civil Service Reform Programme: Case Study. Prepared for the joint DAC Informal Network / ACBF Workshop on Institutional Capacity Development, Harare, Zimbabwe, October 1999.
Thin, Neil, Mary Underwood and Jim Gilling (2001), Aub-Saharan Africa's Poverty Reduction Stragegy Papers from Social Policy and Sustainable Livelihoods Perspectives, Oxford Policy Management, A report for the Department for International Development, March 2001.
Tiffen, M., M. Mortimore and F. Gichuki (1994), More People, Less Erosion: Environmental Recovery in Kenya, Chichester, Wiley.
Toulmin, Camilla (1999), Prices, Institutions, and Partnerships: Challenges for Drylands Development. In Enos Esikuri, Hassan Hassan and Gunter Riethmacher (editors), Drylads, Poverty, and Development: Proceedings of the June 15 and 16, 1999 World Bank Round Table.
Turner, B L, G Hyden and R W Kates (editors) (1993), Population Growth and Agricultural Change in Africa, Gainsville: University Press of Florida.
UNDP (1998), Shinyanga Human Development Report Shinyanga Region , Tanzania UNDP/Regional Government of Shinyanga.
UNDP (1997), Human Development Report 1997, Oxford University Press.
107
URT (2000a), Developing a Poverty Baseline in Tanzania. Prepared by National Bureau of Statistics Tanzania and Oxford Policy Management Ltd., Dar es Salaam, May 2000.
URT (2000b), Updating the Poverty Baseline in Tanzania. Prepared by National Bureau of Statistics Tanzania and Oxford Policy Management Ltd., Dar es Salaam, July 2000.
URT (1998), Smallholder Development Project for Marginal Areas (SDPMA): General overview of performance of irrigation component. Ministry of Agriculture and Cooperatives, Irrigation Department, May 1998.
URT (1997), Tanzania Demograhic and Health Survey 1996. Prepared by Bureau of Statistics and Macro International Inc, Calverton, Maryland, August 1997.
Van Vuuren, Anke (2000), Female-headed Households: Their Survival Strategies in Tanzania. ASC Working Paper 44, Afrika-Studiecentrum, Leiden.
Wiley, Liz (1998), The legal and the political in modern common property management: Re-making communal property in Sub-Saharan Africa with special reference to forest commons in Tanzania. Paper presented to 7th annual conference of the International Association for the Study of Common Property, June 1998, Vancouver, Canada.
Williams Tomothy O., Pierre Hiernaux and Salvador Fernandez-Rivera (2000), Crop-Livestock Systems in Sub-Saharan Africa: Determinants and Intensification Pathways. In McCarthy Nancy, Brent Swallow, Michael Kirk and Peter Hazel (eds.) (2000), Property Rights, Risks, & Livestock Development, ILRI/IFPRI, pp 132-151.
Wolmer, W (1997), Crop-Livestock Integration. The Dynamics of Intensification in Contrasting Agroecological Zones: A Review, IDS Working Paper 63; Brighton, Institute of Development Studies.
World Bank (2000a), World Development Report 2000 / 2001, Oxford University Press.
World Bank (2000b), Intensifying Action against HIV/AIDS in Africa: Responding to a Development Crisis, The World Bank, Washington D.C.
World Bank (1994: II), Tanzania Agricultural Sector Memorandum Volume II: Main Report, July 29 1994.
Wobst Peter (2001), Structural Adjustment and Intersectoral Shifts in Tanzania: A computable general equilibrium analysis. International Food Policy Research Institute, Research Report 117.